Free signup for more
- Track your favorite companies
- Receive email alerts for new filings
- Personalized dashboard of news and more
- Access all data and search results
Filing tables
Filing exhibits
ADUS similar filings
- 10 Feb 12 Regulation FD Disclosure
- 23 Nov 11 Amendment No. 2 to Employment and Non-competition Agreement
- 3 Nov 11 Addus HomeCare Reports Third Quarter 2011 Results
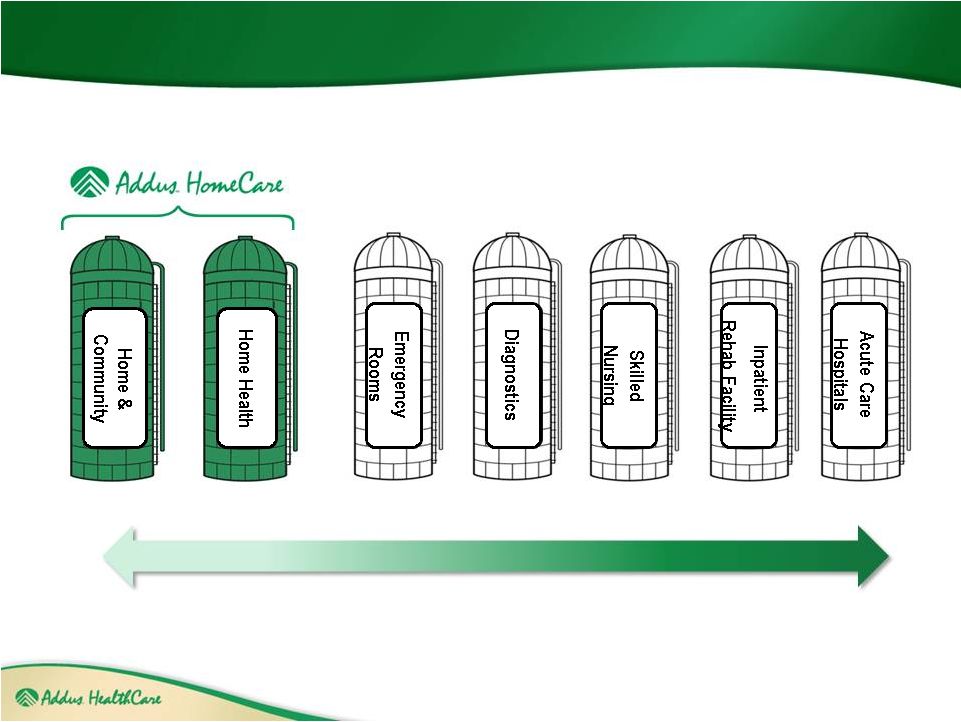
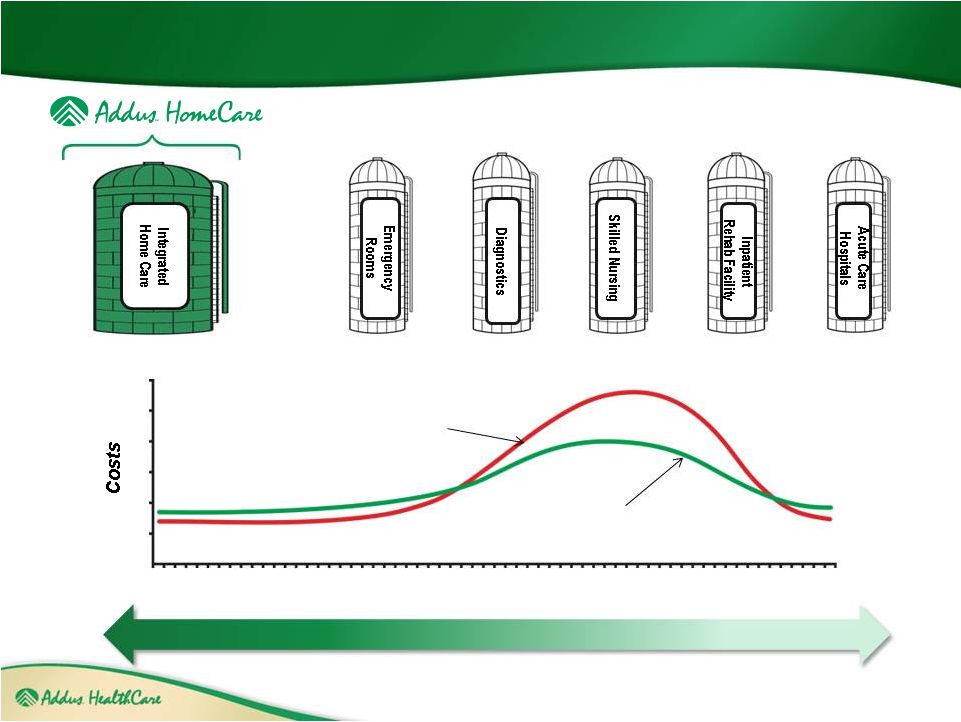
- 27 Sep 11 It is the primary mission of Addus HealthCare to improve the health and well
- 4 Aug 11 Addus HomeCare Reports Second Quarter 2011 Results
- 29 Jul 11 Loan and Security Agreement
- 20 Jul 11 Amendment No. 1 to Employment and Non-competition Agreement
Filing view
External links