Free signup for more
- Track your favorite companies
- Receive email alerts for new filings
- Personalized dashboard of news and more
- Access all data and search results
Filing tables
Filing exhibits
ADUS similar filings
- 2 Aug 12 Addus HomeCare Reports Second Quarter 2012 Results
- 26 Jun 12 Submission of Matters to a Vote of Security Holders
- 20 Jun 12 Employment and Non-competition Agreement
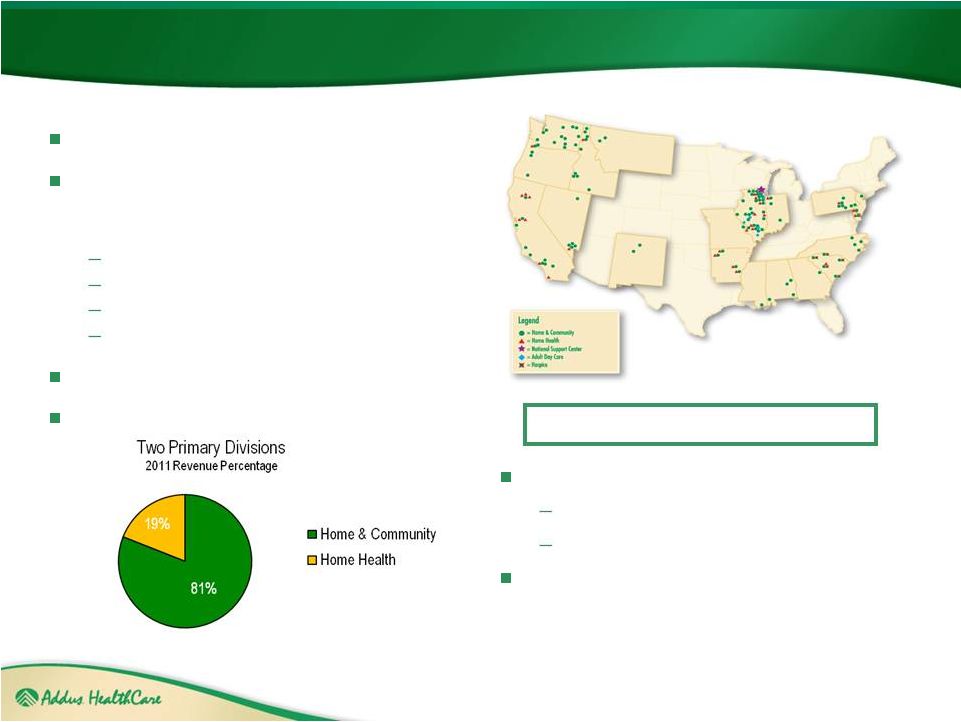
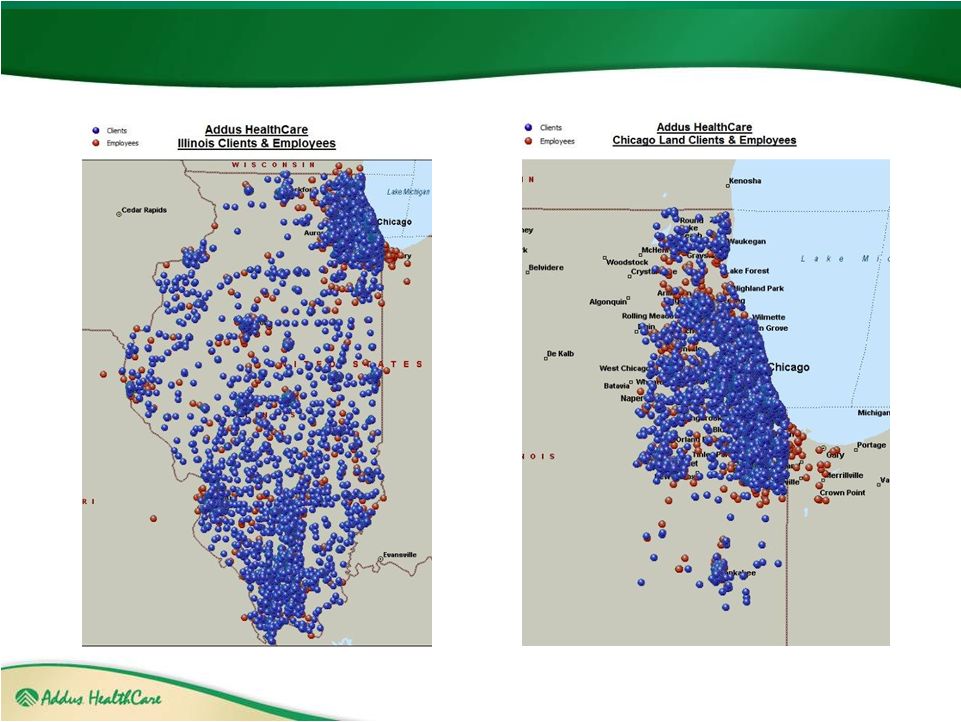
- 13 Jun 12 It is the primary mission of Addus HealthCare to improve the health and well
- 3 May 12 Addus HomeCare Reports First Quarter 2012 Results
- 5 Apr 12 Entry into a Material Definitive Agreement
- 1 Mar 12 Addus HomeCare Reports Fourth Quarter 2011 Results
Filing view
External links