UNITED STATES
SECURITIES AND EXCHANGE COMMISSION
Washington, D.C. 20549
Form N-CSR
CERTIFIED SHAREHOLDER REPORT OF REGISTERED MANAGEMENT
INVESTMENT COMPANIES
Investment Company Act File Number 811-22321
MAINSTAY FUNDS TRUST
(Exact name of Registrant as specified in charter)
51 Madison Avenue, New York, NY 10010
(Address of principal executive offices) (Zip code)
J. Kevin Gao, Esq.
30 Hudson Street
Jersey City, New Jersey 07302
(Name and address of agent for service)
Registrant’s telephone number, including area code: (212) 576-7000
Date of fiscal year end: November 30
(MainStay Cushing MLP Premier Fund, MainStay Cushing Renaissance Advantage Fund and MainStay Cushing Energy Income Fund only)
Date of reporting period: November 30, 2017
FORM N-CSR
The information presented in this Form N-CSR relates solely to the
MainStay Cushing MLP Premier Fund, MainStay Cushing Renaissance Advantage Fund and MainStay Cushing Energy Income Fund, each a series of the Registrant.
| Item 1. | Reports to Stockholders. |
MainStay Cushing® Funds
Message from the President and Annual Report
November 30, 2017

MainStay Cushing® MLP Premier Fund
MainStay Cushing® Renaissance Advantage Fund
MainStay Cushing® Energy Income Fund

This page intentionally left blank
Message from the President
The 12 months ended November 30, 2017, brought strong performance to equity markets in the United States and abroad.
According to FTSE-Russell data for the U.S. market, stocks at all capitalization levels earned solid double-digit overall returns during the reporting period, and growth stocks were particularly strong. These results reflected raised hopes that the new U.S. administration might provide business tax incentives and possible tax cuts for consumers that could stimulate economic growth.
Energy stocks, on the other hand, were affected by volatile oil prices and uncertainty over the future of a previous OPEC Agreement to cut oil production. As a result, energy was the weakest stock-market sector during the reporting period. Domestic large-cap energy stocks in general and energy limited partnerships tended to provide negative returns for the 12 months ended November 30, 2017.
Developed international markets and emerging markets provided strong positive total returns, boosted by positive macroeconomic data and growing confidence that Europe was well on its way to financial recovery. Despite wide variations among emerging markets, many saw solid appreciation in local-currency terms and benefited from a weaker U.S. dollar.
During the reporting period, the Federal Open Market Committee raised the federal funds target range three times—in December of 2016 and in March and June of 2017. These incremental increases raised the federal funds target range to 1.00% to 1.25% by the end of the reporting period. These tightening moves were followed by higher yields for U.S. Treasury securities with maturities of seven years or less, and lower yields for U.S. Treasury securities with longer maturities.
Despite shifting yields, all major bond asset classes provided positive total returns during the reporting period, with convertible bonds showing particularly strong performance.
At MainStay, we have always encouraged investors to diversify their investments and maintain a long-term perspective, even when markets are strong. Asset classes that perform well in one environment may perform differently in another; and in today’s ever-changing world, wide market swings are not unknown.
MainStay offers Funds with a wide array of investment objectives to help our shareholders pursue appropriate diversification for their long-range financial goals. We also offer several investment boutiques, allowing our shareholders to choose the style—or mix of styles—that’s best suited their investment needs. We believe that relatively few individual investors can match the level of professional experience and market insight that our portfolio managers provide.
The report that follows provides more detailed information on the specific markets, investment strategies and portfolio decisions that affected your MainStay Fund(s) during the 12 months ended November 30, 2017. We encourage you to read the report carefully and use it to help you evaluate your progress toward your financial goals.
Sincerely,

Kirk C. Lehneis
President
The opinions expressed are as of the date of this report and are subject to change. There is no guarantee that any forecast made will come to pass. This material does not constitute investment advice and is not intended as an endorsement of any specific investment. Past performance is no guarantee of future results.
Not part of the Annual Report
Investors should refer to each Fund’s Summary Prospectus and/or Prospectus and consider each Fund’s investment objectives, strategies, risks, charges and expenses carefully before investing. The Summary Prospectus and/or Prospectus contain this and other information about each Fund. You may obtain copies of each Fund’s Summary Prospectus, Prospectus and Statement of Additional Information free of charge, upon request, by calling toll-free 800-MAINSTAY (624-6782), by writing to NYLIFE Distributors LLC, Attn: MainStay Marketing Department, 30 Hudson Street, Jersey City, New Jersey 07302 or by sending an e-mail to MainStayShareholderServices@nylim.com. These documents are also available via the MainStay Funds’ website at mainstayinvestments.com/documents. Please read each Summary Prospectus and/or Prospectus carefully before investing.
MainStay Cushing MLP Premier Fund
Investment and Performance Comparison1 (Unaudited)
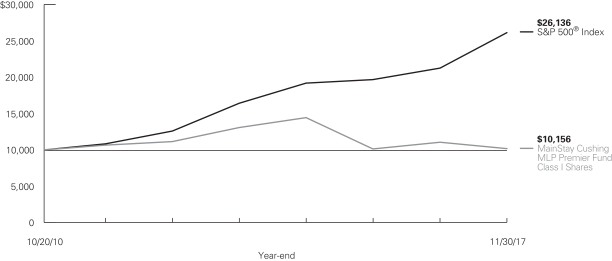
Performance data quoted represents past performance. Past performance is no guarantee of future results. Because of market volatility and other factors, current performance may be lower or higher than the figures shown. Investment return and principal value will fluctuate, and as a result, when shares are redeemed, they may be worth more or less than their original cost. The graph below depicts the historical performance of Class I shares of the Fund. Performance will vary from class to class based on differences in class-specific expenses and sales charges. For performance information current to the most recent month-end, please call 800-MAINSTAY (624-6782) or visit mainstayinvestments.com.
Average Annual Total Returns for the Year Ended November 30, 2017
| Class | Sales Charge | Inception Date | One Year | Five Years or Since Inception | Since Inception | Gross Expense Ratio2 | ||||||||||||||||||
| Class A Shares3 | Maximum 5.5% Initial Sales Charge | With sales charge Excluding sales charge | | 10/20/2010 | | | –13.24 –8.19 | %
| | –3.19 –2.09 | %
| | –0.82 –0.03 | %
| | 1.53 1.53 | %
| |||||||
| Investor Class Shares | Maximum 5.5% Initial Sales Charge | With sales charge Excluding sales charge | | 7/11/2014 | | | –13.24 –8.19 |
| | –12.84 –11.38 |
| | N/A N/A |
| | 1.55 1.55 |
| |||||||
| Class C Shares3 | Maximum 1% CDSC if Redeemed Within One Year of Purchase | With sales charge Excluding sales charge | | 10/20/2010 | | | –9.70 –8.88 |
| | –2.82 –2.82 |
| | –0.79 –0.79 |
| | 2.30 2.30 |
| |||||||
| Class I Shares3 | No Sales Charge | 10/20/2010 | –7.95 | –1.82 | 0.22 | 1.28 | ||||||||||||||||||
| 1. | The performance table and graph do not reflect the deduction of taxes that a shareholder would pay on distributions or Fund share redemptions. Total returns reflect maximum applicable sales charges as indicated in the table above, if any, changes in share price, and reinvestment of dividend and capital gain distributions. The graph assumes the initial investment amount shown above and reflects the deduction of all sales charges that would have applied for the period of investment. Performance figures may reflect certain fee waivers and/or expense limitations, without which total returns may have been lower. For more information on share classes and current fee waivers and/or expense limitations (if any), please refer to the Notes to Financial Statements. |
| 2. | The gross expense ratios presented reflect the Fund’s “Total Annual Fund Operating Expenses” from the most recent Prospectus and may differ from other expense ratios disclosed in this report. |
| 3. | Performance figures for Class A shares, Class C shares and Class I shares reflect the historical performance of the then–existing Class A shares, Class C shares and Class I shares, respectively, of the Cushing® MLP Premier Fund (the predecessor to the Fund, which was subject to a different fee structure) for periods prior to July 12, 2014. The Cushing® MLP Premier Fund commenced operations on October 20, 2010. |
The footnotes on the next page are an integral part of the table and graph and should be carefully read in conjunction with them.
| 5 |
| Benchmark Performance | One Year | Five Years | Since Inception | |||||||||
S&P 500® Index4 | 22.87 | % | 15.74 | % | 14.46 | % | ||||||
Morningstar Energy Limited Partnership Category Average5 | –6.78 | –0.98 | 1.96 | |||||||||
| 4. | The S&P 500® Index is the Fund’s primary benchmark. “S&P 500®” is a trademark of The McGraw-Hill Companies, Inc. The S&P 500® Index is widely regarded as the standard index for measuring large-cap U.S. stock market performance. Results assume reinvestment of all dividends and capital gains. An investment cannot be made directly in an index. |
| 5. | The Morningstar Energy Limited Partnership Category Average is representative of funds that invest primarily a significant amount of their |
| portfolio in energy master limited partnerships. These include but are not limited to limited partnerships specializing in midstream operations in the energy industry. Results are based on average total returns of similar funds with all dividends and capital gain distributions reinvested. |
The footnotes on the preceding page are an integral part of the table and graph and should be carefully read in conjunction with them.
| 6 | MainStay Cushing MLP Premier Fund |
Cost in Dollars of a $1,000 Investment in MainStay Cushing MLP Premier Fund (Unaudited)
The example below is intended to describe the fees and expenses borne by shareholders during the six-month period from June 1, 2017, to November 30, 2017, and the impact of those costs on your investment.
Example
As a shareholder of the Fund, you incur two types of costs: (1) transaction costs, including exchange fees and sales charges (loads) on purchases (as applicable), and (2) ongoing costs, including management fees, distribution and/or service (12b-1) fees, and other Fund expenses (as applicable). This example is intended to help you understand your ongoing costs (in dollars) of investing in the Fund and to compare these costs with the ongoing costs of investing in other mutual funds. The example is based on an investment of $1,000 made at the beginning of the six-month period and held for the entire period from June 1, 2017, to November 30, 2017.
This example illustrates your Fund’s ongoing costs in two ways:
Actual Expenses
The second and third data columns in the table below provide information about actual account values and actual expenses. You may use the information in these columns, together with the amount you invested, to estimate the expenses that you paid during the six months ended November 30, 2017. Simply divide your account value by $1,000 (for example, an $8,600 account value divided by $1,000 = 8.6), then
multiply the result by the number under the heading entitled “Expenses Paid During Period” to estimate the expenses you paid on your account during this period.
Hypothetical Example for Comparison Purposes
The fourth and fifth data columns in the table below provide information about hypothetical account values and hypothetical expenses based on the Fund’s actual expense ratio and an assumed rate of return of 5% per year before expenses, which is not the Fund’s actual return. The hypothetical account values and expenses may not be used to estimate the actual ending account balances or expenses you paid for the six-month period shown. You may use this information to compare the ongoing costs of investing in the Fund with the ongoing costs of investing in other mutual funds. To do so, compare this 5% hypothetical example with the 5% hypothetical examples that appear in the shareholder reports of the other Funds.
Please note that the expenses shown in the table are meant to highlight your ongoing costs only and do not reflect any transactional costs, such as exchange fees or sales charges (loads). Therefore, the fourth and fifth data columns of the table are useful in comparing ongoing costs only and will not help you determine the relative total costs of owning different funds. In addition, if these transactional costs were included, your costs would have been higher.
| Share Class | Beginning Value | Ending Account Value (Based | Expenses During | Ending Account 11/30/17 | Expenses During | Net Expense Ratio During Period2 | ||||||||||||||||||
| Class A Shares | $ | 1,000.00 | $ | 936.00 | $ | 7.33 | $ | 1,017.50 | $ | 7.64 | 1.51 | % | ||||||||||||
| Investor Class Shares | $ | 1,000.00 | $ | 936.00 | $ | 7.43 | $ | 1,017.40 | $ | 7.74 | 1.53 | % | ||||||||||||
| Class C Shares | $ | 1,000.00 | $ | 933.10 | $ | 11.05 | $ | 1,013.64 | $ | 11.51 | 2.28 | % | ||||||||||||
| Class I Shares | $ | 1,000.00 | $ | 937.40 | $ | 6.12 | $ | 1,018.75 | $ | 6.38 | 1.26 | % | ||||||||||||
| 1. | Expenses are equal to the Fund’s annualized expense ratio of each class multiplied by the average account value over the period, divided by 365 and multiplied by 183 (to reflect the six-month period). Expenses for the six-month period ended November 30, 2017 excluded a franchise tax expense to the Fund that equaled 0.01% for Class A, 0.01% for Investor Class, 0.01% for Class C, and 0.01% for Class I. The table above represents the actual expenses incurred during the six-month period. |
| 2. | Expenses are equal to the Fund’s annualized expense ratio to reflect the six-month period. |
| 7 |
Portfolio Composition as of November 30, 2017(1) (Unaudited)
(Expressed as a Percentage of Total Investments)

See Portfolio of Investments beginning on page 11 for specific holdings within these categories.
Top Ten Holdings as of November 30, 2017 (excluding short-term investments) (Unaudited)
| 1. | Energy Transfer Partners, L.P. |
| 2. | Williams Partners, L.P. |
| 3. | Enterprise Products Partners, L.P. |
| 4. | Targa Resources Corporation |
| 5. | MPLX, L.P. |
| 6. | Andeavor Logistics, L.P. |
| 7. | EnLink Midstream Partners, L.P. |
| 8. | Energy Transfer Equity, L.P. |
| 9. | DCP Midstream Partners, L.P. |
| 10. | ONEOK, Inc. |
| (1) | Fund holdings and sector allocations are subject to change, and there is no assurance that the Fund will continue to hold any particular security. |
| (2) | MLPs and Related Companies |
| (3) | Preferred Stocks |
| (4) | Common Stocks |
| 8 | MainStay Cushing MLP Premier Fund |
Portfolio Management Discussion and Analysis (Unaudited)
Questions answered by portfolio managers Jerry V. Swank and Kevin P. Gallagher, CFA, of Cushing Asset Management, LP, the Fund’s Subadvisor.
How did MainStay Cushing MLP Premier Fund perform relative to its primary benchmark and peers during the 12 months ended November 30, 2017?
Excluding all sales charges, MainStay Cushing MLP Premier Fund returned –8.19% for Class A and Investor Class shares and –8.88% for Class C shares for the 12 months ended November 30, 2017. Over the same period, Class I shares returned –7.95%. For the 12 months ended November 30, 2017, all share classes underperformed the 22.87% return of the S&P 500® Index,1 which is the Fund’s broad-based securities-market index. Over the same period, all share classes underperformed the –6.78% return of the Morningstar Energy Limited Partnership Category Average.2 See page 5 for Fund returns with applicable sales charges.
What factors affected the Fund’s performance relative to the S&P 500® Index during the reporting period?
The Fund’s performance lagged that of the S&P 500® Index because the Fund focuses on companies in the energy, industrial and manufacturing sectors. By comparison, the S&P 500® Index tracks the performance of stocks in a wide variety of sectors. The Fund’s holdings are primarily related to midstream energy infrastructure master limited partnerships (“MLPs”), and fundamentals for the industry generally improved for these businesses during the reporting period. This includes higher commodity prices and wider basis differentials (supportive of additional infrastructure), increased systems volumes, key projects successfully placed in service, and restructuring/simplification steps taken to help balance sheets, distribution coverage and cost of capital. There were, however, numerous factors that weighed on performance relative to the S&P 500® Index, many of them related to technical factors and investor sentiment. Among these factors were (1) crude oil price volatility and outlook uncertainty (of note, the OPEC Agreement was extended at the November 2017 meeting); (2) broader energy sector equity weakness; (3) investor concern related to increasing midstream competitive forces (particularly in the Permian Basin) driven in part by several significant new project proposals; (4) a new focus by energy investors on returns on capital, equity performance, and corporate governance; (5) investor concern/confusion with the numerous distribution cuts announced by MLPs; (6) higher-than-expected capital-spending plans and MLP equity issuance in the face of anemic MLP product fund flows; (7) ongoing regulatory and environmental pressure; (8) tax reform uncertainty; and (9) apparent tax-loss selling by MLP investors. Nonetheless, MLPs and the Fund outperformed the broader energy group during the
reporting period, which includes oilfield services and exploration and production (“E&P”) equities.
Which subsectors were the strongest contributors to the Fund’s relative performance, and which subsectors were particularly weak?
The top contributor to the Fund’s relative performance during the reporting period was the MLP general partners subsector, followed by the marine and yieldco3 subsectors. (Contributions take weightings and total returns into account.) Contributions from the MLP general partners and marine subsectors were only slightly positive, while the contribution from the yieldco subsector was slightly negative. The weakest contributors to the Fund’s relative performance all had negative returns. The crude oil & refined products subsector was the weakest contributor, followed by the large-cap diversified and the natural gas gatherers & processors subsectors.
During the reporting period, which individual holdings made the strongest contributions to the Fund’s absolute performance and which holdings detracted the most?
The top contributor was ONEOK Partners, L.P., followed by MPLX, L.P., and Williams Partners, L.P. The performance of ONEOK Partners benefited in large part from the announced merger with its parent, ONEOK Inc. MPLX benefited from its announced strategic plan to accelerate the pace of drop-down acquisitions from its parent company at attractive EBITDA (earnings before interest, taxes, depreciation and amortization) multiples as well as to exchange the incentive distribution rights (“IDRs”) for MPLX units, which some believe may improve the partnership’s longer-term cost of capital. Additionally, the market favorably viewed the hiring of Mike Hennigan, a respected industry veteran, as president of the MLP. Williams Partners’ performance benefited from restructuring steps taken with its parent, The Williams Companies, Inc.
The greatest detractor from the Fund’s absolute performance during the reporting period was MLP Energy Transfer Partners, L.P., followed by crude oil & refined products MLP NGL Energy Partners, L.P., and large-cap diversified MLP Plains All American Pipeline, L.P. Each of these partnerships had negative absolute returns during the reporting period. Energy Transfer Partners was hurt by several factors, including project delays, regulatory issues and investor concerns with leverage and the L.P./G.P. structure. NGL Energy Partners and Plains All American Pipeline both provided weaker-than-expected earnings and lowered forward guidance. (Plains All American Pipeline also reduced its distribution for the second time in about a
| 1. | See footnote on page 6 for more information on the S&P 500® Index. |
| 2. | See footnote on page 6 for more information on the Morningstar Energy Limited Partnership Category Average. |
| 3. | The yieldco subsector consists of companies or partnerships with operating assets that seek predictable cash flows, often through long-term contracts. Companies and partnerships in the yieldco subsector typically seek to provide regular dividend income. |
| 9 |
year.) In light of these developments, the Fund sold units of Plains All American and NGL Energy Partners during the reporting period.
Did the Fund make any significant purchases or sales during the reporting period?
In early 2017, the Fund made a significant purchase of crude oil & refined products MLP Phillips 66 Partners, L.P., because we believed that the market would reward higher-growth partnerships after they had dramatically underperformed in 2016. The Fund also purchased natural gas gatherers & processors MLP DCP Midstream Partners, L.P., in early 2017. Among the reasons for the purchase were the partnership’s favorable basin exposure (e.g., in the Permian Basin), commodity-related upside potential and attractive yield. Significant sales during the reporting period included units of Plains All American Pipeline, L.P., because of previously discussed difficulties. The Fund also sold units of MLP general partner ONEOK Inc. The sale helped manage the combined effective position with the company’s underlying MLP, ONEOK Partners, L.P., following the announced
simplification merger transaction. The sale also allowed the Fund take some profits.
How did the Fund’s subsector weightings change during the reporting period?
During the reporting period, the Fund increased exposure to the natural gas gatherers & processors subsector in light of the ongoing energy cycle recovery and the natural gas transportation & storage subsector because the Fund established a position in Boardwalk Pipeline Partners, L.P. The Fund reduced exposure to the crude oil & refined products subsector (partly because of the sale of NGL Energy Partners, L.P.) and the MLP general partners subsector (in light of the sale of ONEOK Inc.)
How was the Fund positioned at the end of the reporting period?
As of November 30, 2017, the two largest subsector positions in the Fund were large-cap diversified and natural gas gatherers & processors. As of the same date, these positions represented over half of the Fund’s net assets.
The opinions expressed are those of the portfolio managers as of the date of this report and are subject to change. There is no guarantee that any forecasts made will come to pass. This material does not constitute investment advice and is not intended as an endorsement of any specific investment.
| 10 | MainStay Cushing MLP Premier Fund |
Portfolio of Investments November 30, 2017
| Shares | Value | |||||||
| Common Stocks 9.8%† | ||||||||
Diversified General Partners 4.4% |
| |||||||
United States 4.4% | ||||||||
¨ONEOK, Inc. | 966,876 | $ | 50,180,864 | |||||
SemGroup Corporation | 214,755 | 5,154,120 | ||||||
|
| |||||||
| 55,334,984 | ||||||||
|
| |||||||
Natural Gas Gatherers & Processors 5.4% |
| |||||||
United States 5.4% | ||||||||
¨Targa Resources Corporation | 1,544,975 | 67,051,915 | ||||||
|
| |||||||
Total Common Stocks | 122,386,899 | |||||||
|
| |||||||
| MLP Investments and Related Companies 85.8% | ||||||||
Crude Oil & Refined Products 18.6% |
| |||||||
United States 18.6% | ||||||||
¨Andeavor Logistics, L.P. | 1,218,600 | 54,544,536 | ||||||
Blueknight Energy Partners, L.P. (a) | 2,161,200 | 11,346,300 | ||||||
Enbridge Energy Partners, L.P. | 2,350,000 | 34,357,000 | ||||||
Genesis Energy, L.P. | 61,000 | 1,309,670 | ||||||
¨MPLX, L.P. | 1,791,126 | 64,229,778 | ||||||
NuStar Energy, L.P. | 576,000 | 16,738,560 | ||||||
Shell Midstream Partners, L.P. | 1,828,434 | 49,459,140 | ||||||
|
| |||||||
| 231,984,984 | ||||||||
|
| |||||||
General Partners 7.8% | ||||||||
United States 7.8% | ||||||||
Crestwood Equity Partners, L.P. | 1,905,000 | 45,624,750 | ||||||
¨Energy Transfer Equity, L.P. | 3,212,200 | 52,037,640 | ||||||
|
| |||||||
| 97,662,390 | ||||||||
|
| |||||||
Large Cap Diversified 23.6% | ||||||||
United States 23.6% | ||||||||
¨Energy Transfer Partners, L.P. | 6,316,368 | 104,914,872 | ||||||
¨Enterprise Products Partners, L.P. | 2,964,750 | 73,021,793 | ||||||
Magellan Midstream Partners, L.P. | 381,615 | 25,568,205 | ||||||
Plains All American Pipeline, L.P. | 875,905 | 17,080,148 | ||||||
¨Williams Partners, L.P. | 2,021,000 | 74,170,700 | ||||||
|
| |||||||
| 294,755,718 | ||||||||
|
| |||||||
Natural Gas Gatherers & Processors 16.8% |
| |||||||
United States 16.8% | ||||||||
American Midstream Partners, L.P. | 2,000,000 | 23,900,000 | ||||||
¨DCP Midstream Partners, L.P. | 1,471,000 | 51,690,940 | ||||||
Enable Midstream Partners, L.P. | 1,800,000 | 26,964,000 | ||||||
¨EnLink Midstream Partners, L.P. | 3,301,700 | 52,794,183 | ||||||
Summit Midstream Partners, L.P. | 1,130,000 | 21,413,500 | ||||||
Western Gas Partners, L.P. | 733,600 | 32,879,952 | ||||||
|
| |||||||
| 209,642,575 | ||||||||
|
| |||||||
| Shares | Value | |||||||
Natural Gas Transportation & Storage 9.4% |
| |||||||
United States 9.4% | ||||||||
Boardwalk Pipeline Partners, L.P. | 1,760,000 | $ | 23,654,400 | |||||
EQT Midstream Partners, L.P. | 705,000 | 48,377,100 | ||||||
Spectra Energy Partners, L.P. | 525,000 | 21,483,000 | ||||||
Tallgrass Energy Partners, L.P. | 550,000 | 24,156,000 | ||||||
|
| |||||||
| 117,670,500 | ||||||||
|
| |||||||
Oil & Gas Storage & Transportation 2.8% |
| |||||||
United States 2.8% | ||||||||
Phillips 66 Partners, L.P. | 747,000 | 35,004,420 | ||||||
|
| |||||||
Propane 3.3% | ||||||||
United States 3.3% | ||||||||
NGL Energy Partners, L.P. | 3,308,652 | 41,358,150 | ||||||
|
| |||||||
Shipping 2.5% | ||||||||
Republic of the Marshall Islands 2.5% |
| |||||||
GasLog Partners, L.P. | 27,223 | 601,628 | ||||||
Golar LNG Partners, L.P. | 1,550,000 | 30,984,500 | ||||||
|
| |||||||
| 31,586,128 | ||||||||
|
| |||||||
Utilities 1.0% | ||||||||
United States 1.0% |
| |||||||
NextEra Energy Partners, L.P. | 325,000 | 12,684,750 | ||||||
|
| |||||||
Total MLP Investments and Related Companies | 1,072,349,615 | |||||||
|
| |||||||
| Preferred Stocks 1.2% | ||||||||
Crude Oil & Refined Products 1.2% |
| |||||||
United States 1.2% | ||||||||
Blueknight Energy Partners, L.P. (a) | 1,902,541 | 14,649,565 | ||||||
|
| |||||||
Total Preferred Stocks | 14,649,565 | |||||||
|
| |||||||
| Short-Term Investments—Investment Companies 4.3% | ||||||||
United States 4.3% | ||||||||
Fidelity Government Portfolio Fund—Institutional Class, 0.97% (b) | 13,473,419 | 13,473,419 | ||||||
First American Prime Obligations Fund—Class Z, 0.95% (b) | 13,473,419 | 13,473,419 | ||||||
Invesco Short-Term Government & Agency Portfolio—Institutional Class, 0.98% (b) | 13,473,419 | 13,473,419 | ||||||
Morgan Stanley Institutional Liquidity Funds—Government Portfolio—Institutional Class, 0.97% (b) | 13,473,419 | 13,473,419 | ||||||
|
| |||||||
Total Short-Term Investments—Investment Companies |
| 53,893,676 | ||||||
|
| |||||||
Total Investments | 101.1 | % | 1,263,279,755 | |||||
Other Assets, Less Liabilities | (1.1 | ) | (13,941,338 | ) | ||||
Net Assets | 100.0 | % | $ | 1,249,338,417 | ||||
| † | Calculated as a percentage of net assets applicable to common shareholders. |
| ¨ | Among the Portfolio’s 10 largest holdings or issuers held, as of November 30, 2017, excluding short-term investments. May be subject to change daily. (Unaudited) |
| The notes to the financial statements are an integral part of, and should be read in conjunction with, the financial statements. | 11 |
Portfolio of Investments November 30, 2017 (continued)
| (a) | Illiquid security—As of November 30, 2017, the total market value of securities deemed illiquid under procedures approved by the Board of Trustees was $25,995,865, which represented 2.08% of the Fund’s net assets. (Unaudited) |
| (b) | Rate reported is the current yield as of November 30, 2017. |
The following is a summary of the fair valuations according to the inputs used as of November 30, 2017, for valuing the Fund’s assets and liabilities.
Asset Valuation Inputs
Description | Quoted Prices in Active Markets for Identical Assets (Level 1) | Significant Other Observable Inputs (Level 2) | Significant Unobservable Inputs (Level 3) | Total | ||||||||||||
| Investments in Securities (a) | ||||||||||||||||
Common Stocks | $ | 122,386,899 | $ | — | $ | — | $ | 122,386,899 | ||||||||
MLP Investments and Related Companies | 1,072,349,615 | — | — | 1,072,349,615 | ||||||||||||
Preferred Stocks | 14,649,565 | — | — | 14,649,565 | ||||||||||||
Short-Term Investments—Investment Companies | 53,893,676 | — | — | 53,893,676 | ||||||||||||
|
|
|
|
|
|
|
| |||||||||
| Total Investments in Securities | $ | 1,263,279,755 | $ | — | $ | — | $ | 1,263,279,755 | ||||||||
|
|
|
|
|
|
|
| |||||||||
| (a) | For a complete listing of investments and their industries, see the Portfolio of Investments. |
The Fund recognizes transfers between the levels as of the beginning of the period.
For the year ended November 30, 2017, the Fund did not have any transfers between Level 1 and Level 2 fair value measurements (See Note 2).
As of November 30, 2017, the Fund did not hold any investments with significant unobservable inputs (Level 3) (See Note 2).
| 12 | MainStay Cushing MLP Premier Fund | The notes to the financial statements are an integral part of, and should be read in conjunction with, the financial statements. |
Statement of Assets and Liabilities as of November 30, 2017
| Assets | ||||
Investments, at value | $ | 1,263,279,755 | ||
Receivables: | ||||
Fund shares sold | 5,537,013 | |||
Investments sold | 17,399,362 | |||
Dividends and interest | 113,642 | |||
Prepaid expenses | 58,528 | |||
|
| |||
Total assets | 1,286,388,300 | |||
|
| |||
| Liabilities | ||||
Payables: | ||||
Investments purchased | 25,456,015 | |||
Fund shares redeemed | 9,314,801 | |||
Advisory fees (See Note 3) | 1,120,235 | |||
Distributions payable | 133,257 | |||
NYLIFE Distributors (See Note 3) | 426,246 | |||
Transfer agent (See Note 3) | 251,357 | |||
Shareholder communication | 84,242 | |||
Professional fees | 75,166 | |||
Trustees | 4,969 | |||
Custodian | 4,559 | |||
Franchise taxes | 174,931 | |||
Accrued expenses | 4,105 | |||
|
| |||
Total liabilities | 37,049,883 | |||
|
| |||
Net assets | $ | 1,249,338,417 | ||
|
| |||
| Composition of Net Assets | ||||
Shares of beneficial interest outstanding (par value of $.001 per share) unlimited number of shares authorized | $ | 108,584 | ||
Additional paid-in capital | 1,631,311,861 | |||
|
| |||
| 1,631,420,445 | ||||
Accumulated net investment loss, net of income taxes | (106,663,012 | ) | ||
Accumulated net realized gain (loss) on investments, net of income taxes | (368,700,196 | ) | ||
Net unrealized appreciation (depreciation) on investments, net of income taxes | 93,281,180 | |||
|
| |||
Net assets | $ | 1,249,338,417 | ||
|
| |||
Class A | ||||
Net assets applicable to outstanding shares | $ | 264,448,908 | ||
|
| |||
Shares of beneficial interest outstanding | 22,578,454 | |||
|
| |||
Net asset value per share outstanding | $ | 11.71 | ||
Maximum sales charge (5.50% of offering price) | 0.68 | |||
|
| |||
Maximum offering price per share outstanding | $ | 12.39 | ||
|
| |||
Investor Class | ||||
Net assets applicable to outstanding shares | $ | 2,616,368 | ||
|
| |||
Shares of beneficial interest outstanding | 223,367 | |||
|
| |||
Net asset value per share outstanding | $ | 11.71 | ||
Maximum sales charge (5.50% of offering price) | 0.68 | |||
|
| |||
Maximum offering price per share outstanding | $ | 12.39 | ||
|
| |||
Class C | ||||
Net assets applicable to outstanding shares | $ | 445,523,873 | ||
|
| |||
Shares of beneficial interest outstanding | 41,025,362 | |||
|
| |||
Net asset value per share outstanding | $ | 10.86 | ||
|
| |||
Class I | ||||
Net assets applicable to outstanding shares | $ | 536,749,268 | ||
|
| |||
Shares of beneficial interest outstanding | 44,756,485 | |||
|
| |||
Net asset value per share outstanding | $ | 11.99 | ||
|
|
| The notes to the financial statements are an integral part of, and should be read in conjunction with, the financial statements. | 13 |
Statement of Operations for the year ended November 30, 2017
| Investment Income (Loss) | ||||
Income | ||||
Dividends and distributions | $ | 3,625,403 | ||
Interest | 247,601 | |||
|
| |||
Total income | 3,873,004 | |||
|
| |||
Expenses | ||||
Manager (See Note 3) | 15,510,492 | |||
Distribution/Service—Class A (See Note 3) | 787,198 | |||
Distribution/Service—Investor Class (See Note 3) | 8,182 | |||
Distribution/Service—Class C (See Note 3) | 5,290,178 | |||
Transfer agent (See Note 3) | 1,327,794 | |||
Shareholder communication | 347,024 | |||
Professional fees | 286,023 | |||
Franchise tax | 131,121 | |||
Registration | 124,383 | |||
Trustees | 39,470 | |||
Custodian | 16,968 | |||
Insurance | 13,953 | |||
Miscellaneous | 44,941 | |||
|
| |||
Net expenses | 23,927,727 | |||
|
| |||
Net investment income (loss) | (20,054,723 | ) | ||
|
| |||
| Realized and Unrealized Gain (Loss) on Investments | ||||
Net realized gain (loss) on investments | 18,375,748 | |||
Net change in unrealized appreciation (depreciation) on investments | (118,294,339 | ) | ||
|
| |||
Net realized and unrealized gain (loss) on investments | (99,918,591 | ) | ||
|
| |||
Net increase (decrease) in net assets resulting from operations | $ | (119,973,314 | ) | |
|
| |||
| 14 | MainStay Cushing MLP Premier Fund | The notes to the financial statements are an integral part of, and should be read in conjunction with, the financial statements. |
Statements of Changes in Net Assets
| Year ended November 30, 2017 | Year ended November 30, 2016 | |||||||
| Increase (Decrease) in Net Assets | ||||||||
Operations: | ||||||||
Net investment income (loss) | $ | (20,054,723 | ) | $ | (16,842,938 | ) | ||
Net realized gain (loss) on investments | 18,375,748 | (330,857,127 | ) | |||||
Net change in unrealized appreciation (depreciation) on investments | (118,294,339 | ) | 438,170,675 | |||||
|
| |||||||
Net increase (decrease) in net assets resulting from operations | (119,973,314 | ) | 90,470,610 | |||||
|
| |||||||
Dividends and distributions to shareholders: | ||||||||
From return of capital: | ||||||||
Class A | (30,785,026 | ) | (32,834,263 | ) | ||||
Investor Class | (319,920 | ) | (322,772 | ) | ||||
Class C | (55,669,593 | ) | (56,214,748 | ) | ||||
Class I | (55,093,925 | ) | (45,625,207 | ) | ||||
|
| |||||||
Total dividends and distributions to shareholders | (141,868,464 | ) | (134,996,990 | ) | ||||
|
| |||||||
Capital share transactions: | ||||||||
Net proceeds from sale of shares | 524,757,498 | 547,017,899 | ||||||
Net asset value of shares issued to shareholders in reinvestment of dividends and distributions | 136,247,825 | 127,556,186 | ||||||
Cost of shares redeemed | (533,610,593 | ) | (570,443,205 | ) | ||||
|
| |||||||
Increase (decrease) in net assets derived from capital share transactions | 127,394,730 | 104,130,880 | ||||||
|
| |||||||
Net increase (decrease) in net assets | (134,447,048 | ) | 59,604,500 | |||||
| Net Assets | ||||||||
Beginning of year | 1,383,785,465 | 1,324,180,965 | ||||||
|
| |||||||
End of year | $ | 1,249,338,417 | $ | 1,383,785,465 | ||||
|
| |||||||
Accumulated net investment loss, net of income taxes | $ | (106,663,012 | ) | $ | (86,608,289 | ) | ||
|
| |||||||
| The notes to the financial statements are an integral part of, and should be read in conjunction with, the financial statements. | 15 |
Financial Highlights selected per share data and ratios
| Year ended November 30, | ||||||||||||||||||||
| Class A | 2017 | 2016 | 2015 | 2014 | 2013*** | |||||||||||||||
Net asset value at beginning of year | $ | 14.09 | $ | 14.47 | $ | 22.15 | $ | 21.36 | $ | 19.48 | ||||||||||
|
|
|
|
|
|
|
|
|
| |||||||||||
Net investment income (loss) (a) | (0.17 | ) | (0.16 | ) | 0.03 | (0.09 | ) | (0.12 | ) | |||||||||||
Net realized and unrealized gain (loss) on investments | (0.87 | ) | 1.23 | (6.37 | ) | 2.21 | 3.34 | |||||||||||||
|
|
|
|
|
|
|
|
|
| |||||||||||
Total from investment operations | (1.04 | ) | 1.07 | (6.34 | ) | 2.12 | 3.22 | |||||||||||||
|
|
|
|
|
|
|
|
|
| |||||||||||
| Less dividends and distributions: | ||||||||||||||||||||
From net investment income | — | — | — | (0.59 | ) | — | ||||||||||||||
From return of capital | (1.34 | ) | (1.45 | ) | (1.34 | ) | (0.75 | ) | (1.34 | ) | ||||||||||
|
|
|
|
|
|
|
|
|
| |||||||||||
Total dividends and distributions | (1.34 | ) | (1.45 | ) | (1.34 | ) | (1.34 | ) | (1.34 | ) | ||||||||||
|
|
|
|
|
|
|
|
|
| |||||||||||
Redemption fees retained (a)(b) | — | — | — | 0.01 | 0.00 | ‡ | ||||||||||||||
|
|
|
|
|
|
|
|
|
| |||||||||||
Net asset value at end of year | $ | 11.71 | $ | 14.09 | $ | 14.47 | $ | 22.15 | $ | 21.36 | ||||||||||
|
|
|
|
|
|
|
|
|
| |||||||||||
Total investment return (c) | (8.19 | %) | 8.75 | % | (29.92 | %) | 10.00 | % | 16.91 | % | ||||||||||
| Ratios (to average net assets)/Supplemental Data: | ||||||||||||||||||||
Net investment income (loss) (including net deferred income tax benefit (expense)) | (1.21 | %)(d) | (1.21 | %)(d) | 8.32 | % (d)(e) | (6.46 | %)(e) | (9.12 | %)(e) | ||||||||||
Net investment income (loss) (excluding net deferred income tax benefit (expense)) | (1.20 | %)(d) | (1.22 | %)(d) | (0.24 | %)(d)(e) | (0.97 | %)(e) | (1.18 | %)(e) | ||||||||||
Net expenses (including net deferred income tax (benefit) expense) (f) | 1.51 | % (d) | 1.52 | % (d) | (7.07 | %)(d)(e) | 7.08 | % (e) | 9.59 | % (e) | ||||||||||
Expenses (before waiver/recoupment, including net deferred income tax (benefit) expense) (f) | 1.51 | % (d) | 1.52 | % (d) | (7.07 | %)(d)(e) | 7.03 | % (e) | 9.57 | % (e) | ||||||||||
Portfolio turnover rate | 29 | % | 52 | % | 32 | % | 21 | % | 27 | % | ||||||||||
Net assets at end of year (in 000’s) | $ | 264,449 | $ | 360,473 | $ | 317,903 | $ | 531,607 | $ | 487,318 | ||||||||||
| *** | This year was audited by a predecessor audit firm whose opinion was unqualified. |
| ‡ | Less than one cent per share. |
| (a) | Per share data based on average shares outstanding during the period. |
| (b) | Redemption fees were only applicable prior to reorganization. (See Note 1) |
| (c) | Total investment return is calculated exclusive of sales charges and assumes the reinvestment of dividends and distributions. |
| For periods of less than one year, total return is not anualized. |
| (d) | Ratios including/excluding net deferred income tax benefit (expense) includes applicable franchise tax expense for the period. |
| For the year ended November 30, 2017, the Fund accrued $131,121 in franchise tax expense, of which $29,083 is attributable to Class A. |
| For the year ended November 30, 2016, the Fund accrued $(43,881) in franchise tax expense, of which $(14,819) is attributable to Class A. |
| For the year ended November 30, 2015, the Fund accrued $517,762 in franchise tax expense, of which $128,449 is attributable to Class A. |
| (e) | For the year ended November 30, 2015, the Fund accrued $154,807,419 in net deferred income tax benefit, of which $39,834,200 is attributable to Class A. |
| For the year ended November 30, 2014, the Fund accrued $70,224,241 in net deferred income tax expense, of which $30,305,000 is attributable to Class A. |
| For the year ended November 30, 2013, the Fund accrued $77,002,011 in net deferred income tax expense, of which $31,765,943 is attributable to Class A. |
| (f) | The ratio of expenses excluding net deferred income tax expense to average net assets before waiver and recoupment was 1.50%, 1.53%, 1.49%, 1.54% and 1.63% for the fiscal years ended November 30, 2017, 2016, 2015, 2014 and 2013, respectively. The ratio of expenses excluding net deferred income tax expense to average net assets after waiver and recoupment was 1.50%, 1.53%, 1.49%, 1.59% and 1.65% for the fiscal years ended November 30, 2017, 2016, 2015, 2014 and 2013, respectively. The Predecessor Fund recouped waived expenses for the period from December 1, 2013 through July 11, 2014. |
| 16 | MainStay Cushing MLP Premier Fund | The notes to the financial statements are an integral part of, and should be read in conjunction with, the financial statements. |
Financial Highlights selected per share data and ratios
| Year ended November 30, | July 12, 2014** through November 30, | |||||||||||||||||||
| Investor Class | 2017 | 2016 | 2015 | 2014 | ||||||||||||||||
Net asset value at beginning of period | $ | 14.09 | $ | 14.47 | $ | 22.15 | $ | 24.02 | ||||||||||||
|
|
|
|
|
|
|
| |||||||||||||
Net investment income (loss) (a) | (0.17 | ) | (0.15 | ) | (0.00 | )‡ | (0.03 | ) | ||||||||||||
Net realized and unrealized gain (loss) on investments | (0.87 | ) | 1.22 | (6.34 | ) | (1.17 | ) | |||||||||||||
|
|
|
|
|
|
|
| |||||||||||||
Total from investment operations | (1.04 | ) | 1.07 | (6.34 | ) | (1.20 | ) | |||||||||||||
|
|
|
|
|
|
|
| |||||||||||||
| Less dividends and distributions: | ||||||||||||||||||||
From net investment income | — | — | — | (0.29 | ) | |||||||||||||||
From return of capital | (1.34 | ) | (1.45 | ) | (1.34 | ) | (0.38 | ) | ||||||||||||
|
|
|
|
|
|
|
| |||||||||||||
Total dividends and distributions | (1.34 | ) | (1.45 | ) | (1.34 | ) | (0.67 | ) | ||||||||||||
|
|
|
|
|
|
|
| |||||||||||||
Net asset value at end of period | $ | 11.71 | $ | 14.09 | $ | 14.47 | $ | 22.15 | ||||||||||||
|
|
|
|
|
|
|
| |||||||||||||
Total investment return (b) | (8.19 | %) | 8.75 | % | (29.91 | %)(c) | (5.12 | %)(c) | ||||||||||||
| Ratios (to average net assets)/Supplemental Data: | ||||||||||||||||||||
Net investment income (loss) (including net deferred income tax benefit (expense)) | (1.22 | %)(d) | (1.16 | %)(d) | 8.17 | % (d)(e) | 2.79 | % (e)†† | ||||||||||||
Net investment income (loss) (excluding net deferred income tax benefit (expense)) | (1.21 | %)(d) | (1.16 | %)(d) | (0.38 | %)(d)(e) | (0.52 | %)(e)†† | ||||||||||||
Net expenses (including net deferred income tax (benefit) expense) (f) | 1.53 | % (d) | 1.55 | % (d) | (7.05 | %)(d)(e) | (1.80 | %)(e)†† | ||||||||||||
Expenses (before waiver, including net deferred income tax (benefit) expense) (f) | 1.53 | % (d) | 1.55 | % (d) | (7.05 | %)(d)(e) | (1.80 | %)(e)†† | ||||||||||||
Portfolio turnover rate | 29 | % | 52 | % | 32 | % | 21 | % | ||||||||||||
Net assets at end of period (in 000’s) | $ | 2,616 | $ | 3,157 | $ | 2,631 | $ | 1,310 | ||||||||||||
| ** | Inception date. |
| ‡ | Less than one cent per share. |
| †† | Annualized. |
| (a) | Per share data based on average shares outstanding during the period. |
| (b) | Total investment return is calculated exclusive of sales charges and assumes the reinvestment of dividends and distributions. |
| For periods of less than one year, total return is not annualized. |
| (c) | Total investment return may reflect adjustments to conform to generally accepted accounting principles. |
| (d) | Ratios including/excluding net deferred income tax benefit (expense) includes applicable franchise tax expense for the period. |
| For the year ended November 30, 2017, the Fund accrued $131,121 in franchise tax expense, of which $333 is attributable to Investor Class. |
| For the year ended November 30, 2016, the Fund accrued $(43,881) in franchise tax expense, of which $(50) is attributable to Investor Class. |
| For the year ended November 30, 2015, the Fund accrued $517,762 in franchise tax expense, of which $830 is attributable to Investor Class. |
| (e) | For the year ended November 30, 2015, the Fund accrued $154,807,419 in net deferred income tax benefit, of which $202,049 is attributable to Investor Class. For the period from July 12, 2014 to November 30, 2014, the Fund accrued $70,224,241 in net deferred income tax expense, of which $17,830 of deferred income tax benefit is attributable to Investor Class. |
| (f) | The ratio of expenses excluding net deferred income tax expense to average net assets before waiver was 1.52%, 1.55%, 1.50% and 1.51%, for the fiscal years ended November 30, 2017, 2016, 2015 and the period from July 12, 2014 to November 30, 2014, respectively. The ratio of expenses excluding net deferred income tax expense to average net assets after waiver was 1.52%, 1.55%, 1.50% and 1.51% for the fiscal years ended November 30, 2017, 2016, 2015 and the period from July 12, 2014 to November 30, 2014, respectively. |
| The notes to the financial statements are an integral part of, and should be read in conjunction with, the financial statements. | 17 |
Financial Highlights selected per share data and ratios
| Year ended November 30, | ||||||||||||||||||||
| Class C | 2017 | 2016 | 2015 | 2014 | 2013*** | |||||||||||||||
Net asset value at beginning of year | $ | 13.26 | $ | 13.81 | $ | 21.36 | $ | 20.79 | $ | 19.14 | ||||||||||
|
|
|
|
|
|
|
|
|
| |||||||||||
Net investment income (loss) (a) | (0.25 | ) | (0.24 | ) | (0.12 | ) | (0.25 | ) | (0.27 | ) | ||||||||||
Net realized and unrealized gain (loss) on investments | (0.81 | ) | 1.14 | (6.09 | ) | 2.16 | 3.26 | |||||||||||||
|
|
|
|
|
|
|
|
|
| |||||||||||
Total from investment operations | (1.06 | ) | 0.90 | (6.21 | ) | 1.91 | 2.99 | |||||||||||||
|
|
|
|
|
|
|
|
|
| |||||||||||
| Less dividends and distributions: | ||||||||||||||||||||
From net investment income | — | — | — | (0.59 | ) | — | ||||||||||||||
From return of capital | (1.34 | ) | (1.45 | ) | (1.34 | ) | (0.75 | ) | (1.34 | ) | ||||||||||
|
|
|
|
|
|
|
|
|
| |||||||||||
Total dividends and distributions | (1.34 | ) | (1.45 | ) | (1.34 | ) | (1.34 | ) | (1.34 | ) | ||||||||||
|
|
|
|
|
|
|
|
|
| |||||||||||
Redemption fees retained (a)(b) | — | — | — | 0.00 | ‡ | 0.00 | ‡ | |||||||||||||
|
|
|
|
|
|
|
|
|
| |||||||||||
Net asset value at end of year | $ | 10.86 | $ | 13.26 | $ | 13.81 | $ | 21.36 | $ | 20.79 | ||||||||||
|
|
|
|
|
|
|
|
|
| |||||||||||
Total investment return (c) | (8.88 | %) | 7.89 | % | (30.43 | %) | 9.19 | % | 16.05 | % | ||||||||||
| Ratios (to average net assets)/Supplemental Data: | ||||||||||||||||||||
Net investment income (loss) (including net deferred income tax benefit (expense)) | (1.99 | %)(d) | (1.95 | %)(d) | 7.56 | % (d)(e) | (5.80 | %)(e) | (9.87 | %)(e) | ||||||||||
Net investment income (loss) (excluding net deferred income tax benefit (expense)) | (1.98 | %)(d) | (1.95 | %)(d) | (1.00 | %)(d)(e) | (1.68 | %)(e) | (1.93 | %)(e) | ||||||||||
Net expenses (including net deferred income tax (benefit) expense) (f) | 2.28 | % (d) | 2.30 | % (d) | (6.32 | %)(d)(e) | 6.46 | % (e) | 10.34 | % (e) | ||||||||||
Expenses (before waiver/recoupment, including net deferred income tax (benefit) expense) (f) | 2.28 | % (d) | 2.30 | % (d) | (6.32 | %)(d)(e) | 6.41 | % (e) | 10.32 | % (e) | ||||||||||
Portfolio turnover rate | 29 | % | 52 | % | 32 | % | 21 | % | 27 | % | ||||||||||
Net assets at end of year (in 000’s) | $ | 445,524 | $ | 538,336 | $ | 553,892 | $ | 859,193 | $ | 568,837 | ||||||||||
| *** | This year was audited by a predecessor audit firm whose opinion was unqualified. |
| ‡ | Less than one cent per share. |
| (a) | Per share data based on average shares outstanding during the period. |
| (b) | Redemption fees were only applicable prior to reorganization. (See Note 1) |
| (c) | Total investment return is calculated exclusive of sales charges and assumes the reinvestment of dividends and distributions. |
| For periods of less than one year, total return is not annualized. |
| (d) | Ratios including/excluding net deferred income tax benefit (expense) includes applicable franchise tax expense for the period. |
| For the year ended November 30, 2017, the Fund accrued $131,121 in franchise tax expense, of which $50,302 is attributable to Class C. |
| For the year ended November 30, 2016, the Fund accrued $(43,881) in franchise tax expense, of which $(14,231) is attributable to Class C. |
| For the year ended November 30, 2015, the Fund accrued $517,762 in franchise tax expense, of which $220,745 is attributable to Class C. |
| (e) | For the year ended November 30, 2015, the Fund accrued $154,807,419 in net deferred income tax benefit, of which $66,219,265 is attributable to Class C. |
| For the year ended November 30, 2014, the Fund accrued $70,224,241 in net deferred income tax expense, of which $31,069,447 is attributable to Class C. |
| For the year ended November 30, 2013, the Fund accrued $77,002,011 in net deferred income tax expense, of which $33,095,235 is attributable to Class C. |
| (f) | The ratio of expenses excluding net deferred income tax expense to average net assets before waiver and recoupment was 2.27%, 2.30%, 2.24% 2.29% and 2.38% for the fiscal years ended November 30, 2017, 2016, 2015, 2014 and 2013, respectively. The ratio of expenses excluding net deferred income tax expense to average net assets after waiver and recoupment was 2.27%, 2.30%, 2.24%, 2.34% and 2.40% for the fiscal years ended November 30, 2017, 2016, 2015, 2014 and 2013, respectively. The Predecessor Fund recouped waived expenses for the period from December 1, 2013 through July 11, 2014. |
| 18 | MainStay Cushing MLP Premier Fund | The notes to the financial statements are an integral part of, and should be read in conjunction with, the financial statements. |
Financial Highlights selected per share data and ratios
| Year ended November 30, | ||||||||||||||||||||
| Class I | 2017 | 2016 | 2015 | 2014 | 2013*** | |||||||||||||||
Net asset value at beginning of year | $ | 14.36 | $ | 14.69 | $ | 22.40 | $ | 21.54 | $ | 19.57 | ||||||||||
|
|
|
|
|
|
|
|
|
| |||||||||||
Net investment income (loss) (a) | (0.14 | ) | (0.12 | ) | 0.07 | (0.03 | ) | (0.07 | ) | |||||||||||
Net realized and unrealized gain (loss) on investments | (0.89 | ) | 1.24 | (6.44 | ) | 2.22 | 3.36 | |||||||||||||
|
|
|
|
|
|
|
|
|
| |||||||||||
Total from investment operations | (1.03 | ) | 1.12 | (6.37 | ) | 2.19 | 3.29 | |||||||||||||
|
|
|
|
|
|
|
|
|
| |||||||||||
| Less dividends and distributions: | ||||||||||||||||||||
From net investment income | — | — | — | (0.59 | ) | — | ||||||||||||||
From return of capital | (1.34 | ) | (1.45 | ) | (1.34 | ) | (0.75 | ) | (1.34 | ) | ||||||||||
|
|
|
|
|
|
|
|
|
| |||||||||||
Total dividends and distributions | (1.34 | ) | (1.45 | ) | (1.34 | ) | (1.34 | ) | (1.34 | ) | ||||||||||
|
|
|
|
|
|
|
|
|
| |||||||||||
Redemption fees retained (a)(b) | — | — | — | 0.01 | 0.02 | |||||||||||||||
|
|
|
|
|
|
|
|
|
| |||||||||||
Net asset value at end of year | $ | 11.99 | $ | 14.36 | $ | 14.69 | $ | 22.40 | $ | 21.54 | ||||||||||
|
|
|
|
|
|
|
|
|
| |||||||||||
Total investment return (c) | (7.95 | %) | 8.97 | % | (29.71 | %) | 10.25 | % | 17.37 | % | ||||||||||
| Ratios (to average net assets)/Supplemental Data: | ||||||||||||||||||||
Net investment income (loss) (including net deferred income tax benefit (expense)) | (1.01 | %)(d) | (0.93 | %)(d) | 8.53 | % (d)(e) | (2.90 | %)(e) | (8.87 | %)(e) | ||||||||||
Net investment income (loss) (excluding net deferred income tax benefit (expense)) | (1.00 | %)(d) | (0.93 | %)(d) | (0.02 | %)(d)(e) | (0.62 | %)(e) | (0.93 | %)(e) | ||||||||||
Net expenses (including net deferred income tax (benefit) expense) (f) | 1.26 | % (d) | 1.28 | % (d) | (7.31 | %)(d)(e) | 3.61 | % (e) | 9.34 | % (e) | ||||||||||
Expenses (before waiver/recoupment, including net deferred income tax (benefit) expense) (f) | 1.26 | % (d) | 1.28 | % (d) | (7.31 | %)(d)(e) | 3.57 | % (e) | 9.32 | % (e) | ||||||||||
Portfolio turnover rate | 29 | % | 52 | % | 32 | % | 21 | % | 27 | % | ||||||||||
Net assets at end of year (in 000’s) | $ | 536,749 | $ | 481,819 | $ | 449,755 | $ | 579,546 | $ | 221,196 | ||||||||||
| *** | This year was audited by a predecessor audit firm whose opinion was unqualified. |
| (a) | Per share data based on average shares outstanding during the period. |
| (b) | Redemption fees were only applicable prior to reorganization. (See Note 1) |
| (c) | Total investment return is calculated exclusive of sales charges and assumes the reinvestment of dividends and distributions. Class I shares are not subject to sales charges. |
| For periods of less than one year, total return is not annualized. |
| (d) | Ratios including/excluding net deferred income tax benefit (expense) includes applicable franchise tax expense for the period. |
| For the year ended November 30, 2017, the Fund accrued $131,121 in franchise tax expense, of which $51,403 is attributable to Class I. |
| For the year ended November 30, 2016, the Fund accrued $(43,881) in franchise tax expense, of which $(14,781) is attributable to Class I. |
| For the year ended November 30, 2015, the Fund accrued $517,762 in franchise tax expense, of which $167,738 is attributable to Class I. |
| (e) | For the year ended November 30, 2015, the Fund accrued $154,807,419 in net deferred income tax benefit, of which $48,551,905 is attributable to Class I. |
| For the year ended November 30, 2014, the Fund accrued $70,224,241 in net deferred income tax expense, of which $8,867,624 is attributable to Class I. |
| For the year ended November 30, 2013, the Fund accrued $77,002,011 in net deferred income tax expense, of which $12,140,833 is attributable to Class I. |
| (f) | The ratio of expenses excluding net deferred income tax expense to average net assets before waiver and recoupment was 1.25%, 1.28%, 1.24%, 1.29% and 1.38% for the fiscal years ended November 30, 2017, 2016, 2015, 2014 and 2013, respectively. The ratio of expenses excluding net deferred income tax expense to average net assets after waiver and recoupment was 1.25%, 1.28%, 1.24%, 1.33% and 1.40% for the fiscal years ended November 30, 2017, 2016, 2015, 2014 and 2013, respectively. The Predecessor Fund recouped waived expenses for the period from December 1, 2013 through July 11, 2014. |
| The notes to the financial statements are an integral part of, and should be read in conjunction with, the financial statements. | 19 |
MainStay Cushing Renaissance Advantage Fund
Investment and Performance Comparison1 (Unaudited)
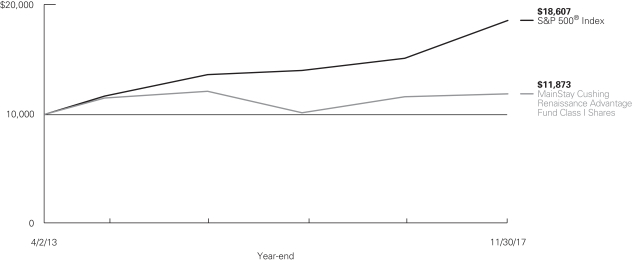
Performance data quoted represents past performance. Past performance is no guarantee of future results. Because of market volatility and other factors, current performance may be lower or higher than the figures shown. Investment return and principal value will fluctuate, and as a result, when shares are redeemed, they may be worth more or less than their original cost. The graph below depicts the historical performance of Class I shares of the Fund. Performance will vary from class to class based on differences in class-specific expenses and sales charges. For performance information current to the most recent month-end, please call 800-MAINSTAY (624-6782) or visit mainstayinvestments.com.
Average Annual Total Returns for the Year Ended November 30, 2017
| Class | Sales Charge | Inception Date | One Year | Since Inception | Gross Expense Ratio2 | |||||||||||||||
| Class A Shares3 | Maximum 5.5% Initial Sales Charge | With sales charge Excluding sales charge | | 4/2/2013 | | | –3.73 1.87 | %
| | 2.26 3.51 | %
| | 1.63 1.63 | %
| ||||||
| Investor Class Shares | Maximum 5.5% Initial Sales Charge | With sales charge Excluding sales charge | | 7/11/2014 | | | –3.87 1.73 |
| | –6.24 –4.67 | | | 1.78 1.78 | | ||||||
| Class C Shares3 | Maximum 1% CDSC if Redeemed Within One Year of Purchase | With sales charge Excluding sales charge | | 4/2/2013 | | | 0.00 0.98 |
| | 2.67 2.67 | | | 2.53 2.53 | | ||||||
| Class I Shares3 | No Sales Charge | 4/2/2013 | 2.14 | 3.75 | 1.38 | |||||||||||||||
| 1. | The performance table and graph do not reflect the deduction of taxes that a shareholder would pay on distributions or Fund share redemptions. Total returns reflect maximum applicable sales charges as indicated in the table above, if any, changes in share price, and reinvestment of dividend and capital gain distributions. The graph assumes the initial investment amount shown above and reflects the deduction of all sales charges that would have applied for the period of investment. Performance figures may reflect certain fee waivers and/or expense limitations, without which total returns may have been lower. For more information on share classes and current fee waivers and/or expense limitations (if any), please refer to the Notes to Financial Statements. |
| 2. | The gross expense ratios presented reflect the Fund’s “Total Annual Fund Operating Expenses” from the most recent Prospectus and may differ from other expense ratios disclosed in this report. |
| 3. | Performance figures for Class A shares, Class C shares and Class I shares reflect the historical performance of the then-existing Class A shares, Class C shares and Class I shares, respectively, of the Cushing® Renaissance Advantage Fund (the predecessor to the Fund, which was subject to a different fee structure) for periods prior to July 12, 2014. The Cushing® Renaissance Advantage Fund commenced operations on April 2, 2013. |
The footnotes on the next page are an integral part of the table and graph and should be carefully read in conjunction with them.
| 20 | MainStay Cushing Renaissance Advantage Fund |
| Benchmark Performance | One Year | Since Inception | ||||||||||
S&P 500® Index4 | 22.87 | % | 14.23 | % | ||||||||
Morningstar Natural Resources Category Average5 | 13.05 | –0.32 | ||||||||||
| 4. | The S&P 500® Index is the Fund’s primary benchmark. “S&P 500®” is a trademark of The McGraw-Hill Companies, Inc. The S&P 500® Index is widely regarded as the standard index for measuring large-cap U.S. stock market performance. Results assume reinvestment of all dividends and capital gains. An investment cannot be made directly in an index. |
| 5. | The Morningstar Natural Resources Category Average is representative of funds that invest primarily on Commodity-based industries such as energy, |
| chemicals, minerals, and forest products in the United States or outside of the United States. Some portfolios invest across this spectrum to offer broad natural-resources exposure. Others concentrate heavily or even exclusively in specific industries. Portfolios that concentrate primarily in energy-related industries are part of the equity energy category. Results are based on average total returns of similar funds with all dividends and capital gain distributions reinvested. |
The footnotes on the preceding page are an integral part of the table and graph and should be carefully read in conjunction with them.
| 21 |
Cost in Dollars of a $1,000 Investment in MainStay Cushing Renaissance Advantage Fund (Unaudited)
The example below is intended to describe the fees and expenses borne by shareholders during the six-month period from June 1, 2017, to November 30, 2017, and the impact of those costs on your investment.
Example
As a shareholder of the Fund, you incur two types of costs: (1) transaction costs, including exchange fees and sales charges (loads) on purchases (as applicable), and (2) ongoing costs, including management fees, distribution and/or service (12b-1) fees, and other Fund expenses (as applicable). This example is intended to help you understand your ongoing costs (in dollars) of investing in the Fund and to compare these costs with the ongoing costs of investing in other mutual funds. The example is based on an investment of $1,000 made at the beginning of the six-month period and held for the entire period from June 1, 2017, to November 30, 2017.
This example illustrates your Fund’s ongoing costs in two ways:
Actual Expenses
The second and third data columns in the table below provide information about actual account values and actual expenses. You may use the information in these columns, together with the amount you invested, to estimate the expenses that you paid during the six months ended November 30, 2017. Simply divide your account value by $1,000 (for example, an $8,600 account value divided by $1,000 = 8.6), then
multiply the result by the number under the heading entitled “Expenses Paid During Period” to estimate the expenses you paid on your account during this period.
Hypothetical Example for Comparison Purposes
The fourth and fifth data columns in the table below provide information about hypothetical account values and hypothetical expenses based on the Fund’s actual expense ratio and an assumed rate of return of 5% per year before expenses, which is not the Fund’s actual return. The hypothetical account values and expenses may not be used to estimate the actual ending account balances or expenses you paid for the six-month period shown. You may use this information to compare the ongoing costs of investing in the Fund with the ongoing costs of investing in other mutual funds. To do so, compare this 5% hypothetical example with the 5% hypothetical examples that appear in the shareholder reports of the other Funds.
Please note that the expenses shown in the table are meant to highlight your ongoing costs only and do not reflect any transactional costs, such as exchange fees or sales charges (loads). Therefore, the fourth and fifth data columns of the table are useful in comparing ongoing costs only and will not help you determine the relative total costs of owning different funds. In addition, if these transactional costs were included, your costs would have been higher.
| Share Class | Beginning Value | Ending Account Value (Based | Expenses During | Ending Account Value (Based on Hypothetical 5% Annualized Return and Actual Expenses) 11/30/17 | Expenses During | Net Expense Ratio During Period2 | ||||||||||||||||
| Class A Shares | $ | 1,000.00 | $ | 1,115.20 | $ | 8.38 | $ | 1,017.15 | $ | 7.99 | 1.58% | |||||||||||
| Investor Class Shares | $ | 1,000.00 | $ | 1,113.90 | $ | 9.11 | $ | 1,016.44 | $ | 8.69 | 1.72% | |||||||||||
| Class C Shares | $ | 1,000.00 | $ | 1,109.90 | $ | 13.06 | $ | 1,012.68 | $ | 12.46 | 2.47% | |||||||||||
| Class I Shares | $ | 1,000.00 | $ | 1,116.70 | $ | 7.06 | $ | 1,018.40 | $ | 6.73 | 1.33% | |||||||||||
| 1. | Expenses are equal to the Fund’s annualized expense ratio of each class multiplied by the average account value over the period, divided by 365 and multiplied by 183 (to reflect the six-month period). The table above represents the actual expenses incurred during the six-month period. |
| 2. | Expenses are equal to the Fund’s annualized expense ratio to reflect the six-month period. |
| 22 | MainStay Cushing Renaissance Advantage Fund |
Portfolio Composition as of November 30, 2017(1) (Unaudited)
(Expressed as a Percentage of Total Investments)
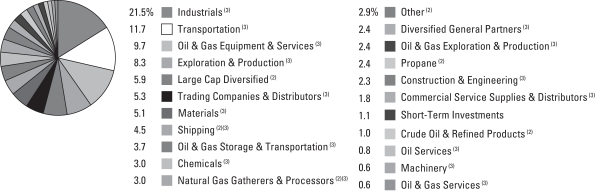
See Portfolio of Investments beginning on page 26 for specific holdings within these categories.
Top Ten Holdings as of November 30, 2017 (excluding short-term investments) (Unaudited)
| 1. | XPO Logistics, Inc. |
| 2. | Energy Transfer Partners, L.P. |
| 3. | Jacobs Engineering Group, Inc. |
| 4. | United Rentals, Inc. |
| 5. | Cheniere Energy, Inc. |
| 6. | Golar LNG Ltd. |
| 7. | Knight-Swift Transportation Holdings, Inc. |
| 8. | C&J Energy Services, Inc. |
| 9. | Hi-Crush Partners, L.P. |
| 10. | Hub Group, Inc. |
| (1) | Fund holdings and sector allocations are subject to change, and there is no assurance that the Fund will continue to hold any particular security. |
| (2) | MLPs and Related Companies |
| (3) | Common Stocks |
| 23 |
Portfolio Management Discussion and Analysis (Unaudited)
Questions answered by portfolio managers Jerry V. Swank, Matthew A. Lemme, CFA, and Saket Kumar of Cushing Asset Management, LP, the Fund’s Subadvisor.
How did MainStay Cushing Renaissance Advantage Fund perform relative to its primary benchmark and peers during the 12 months ended November 30, 2017?
Excluding all sales charges, MainStay Cushing Renaissance Advantage Fund returned 1.87% for Class A shares, 1.73% for Investor Class shares and 0.98% for Class C shares for the 12 months ended November 30, 2017. Over the same period, Class I shares returned 2.14%. For the 12 months ended November 30, 2017, all share classes underperformed the 22.87% return of the S&P 500® Index,1 which is the Fund’s broad-based securities-market index. Over the same period, all share classes underperformed the 13.05% return of the Morningstar Natural Resources Category Average.2 See page 20 for Fund returns with applicable sales charges.
What factors affected the Fund’s performance relative to the S&P 500® Index during the reporting period?
The Fund’s performance lagged that of the S&P 500® Index because the Fund focuses on companies in the energy, industrials and manufacturing sectors. By comparison, the S&P 500® Index tracks the performance of stocks in a wide variety of sectors. As measured by the S&P 500® Energy Index,3 the energy companies of the S&P 500® Index collectively returned –3.80% for the reporting period, compared to the 22.87% return of the entire S&P 500® Index over the same period.
Which subsectors were the strongest contributors to the Fund’s relative performance, and which subsectors were particularly weak?
The subsectors that made the most substantial contributions the Fund’s performance relative to the S&P 500® Index were transportation, industrials, and engineering & construction. (Contributions take weightings and total returns into account.) The most substantial laggards were subsectors of the Fund with greater commodity exposure: oil & gas exploration & production, oil services, and midstream energy.
During the reporting period, which individual holdings made the strongest contributions to the Fund’s absolute performance and which holdings detracted the most?
The Fund’s best-performing stock during the reporting period was transportation and logistics company XPO Logistics. The stock advanced because of strengthening shipment volumes, solid pricing and continued cost-reduction initiatives. Another strong performer was railroad company CSX, which benefited from investors’ favorable opinion of the company’s new CEO
and his plans to improve profitability. Construction equipment rental company United Rentals was also a strong contributor to the Fund’s absolute performance. The company’s stock rallied on improved equipment utilization and pricing from nonresidential construction markets.
The most substantial detractors from the Fund’s absolute performance were energy companies with high sensitivity to commodity prices. They included oil & gas exploration & production companies SM Energy Company and Extraction Oil & Gas and oil & gas equipment & services company Weatherford International PLC. SM Energy and Extraction Oil & Gas are companies with ambitious growth plans predicated on a continued energy commodity price recovery. Weatherford International was trying to lower its debt burden during the reporting period.
Did the Fund make any significant purchases or sales during the reporting period?
The Fund’s largest individual purchase during the reporting period was in transportation and logistics company XPO Logistics, Inc., which benefited from margin enhancement and improving shipment volumes. The Fund’s second-largest individual purchase was a new position in technical, professional and construction services company Jacobs Engineering Group. The Fund established this position because we had a favorable view of the company’s design work on petrochemical and infrastructure projects.
The Fund’s largest sales during the reporting period included a reduction of positions in frac sand miner U.S. Silica Holdings and liquid natural gas (LNG) shipper GasLog Partners, L.P. The U.S. Silica Holdings position was reduced because of concerns regarding increased competition from new mines located in Texas. The Fund’s GasLog Partners position was reduced as the shares approached our near-term price target.
How did the Fund’s subsector weightings change during the reporting period?
The Fund’s most substantial increase in subsector weighting during the reporting period was in engineering & construction, including the addition of a new position in the previously mentioned Jacobs Engineering and in some smaller companies that we believed could benefit from downstream energy and infrastructure spending. The Fund increased its weighting in the transportation subsector because of growing shipment demand and impending trucking regulatory changes, which we anticipated could tighten the market.
| 1. | See footnote on page 21 for more information on the S&P 500® Index. |
| 2. | See footnote on page 21 for more information on the Morningstar Natural Resources Category Average. |
| 3. | The S&P 500® Energy Index comprises those companies in the S&P 500® Index that are classified as members of the energy sector by the Global Industry Classification Standard (GICS®). GICS® is an equity classification standard jointly developed by Morgan Stanley Capital International and Standard & Poor’s. |
| 24 | MainStay Cushing Renaissance Advantage Fund |
The Fund’s largest subsector decreases during the reporting period were in oil & gas exploration & production and refiners. These changes reflected our efforts to reduce the Fund’s overall energy commodity exposure.
How was the Fund positioned at the end of the reporting period?
As of November 30, 2017, the Fund was positioned to take advantage of an improving U.S. economy, which we believe
could be enhanced by corporate tax reform and infrastructure bills. As of the same date, the Fund’s direct energy exposure had decreased since November 30, 2016, and was positioned to benefit from increased production activity rather than rising commodity prices.
The opinions expressed are those of the portfolio managers as of the date of this report and are subject to change. There is no guarantee that any forecasts made will come to pass. This material does not constitute investment advice and is not intended as an endorsement of any specific investment.
| 25 |
Portfolio of Investments November 30, 2017
Shares | Value | |||||||
| Common Stocks 84.7%† | ||||||||
| Chemicals 3.0% | ||||||||
Bermuda 1.1% |
| |||||||
Axalta Coating Systems Ltd. (a) | 54,278 | $ | 1,718,441 | |||||
United States 1.9% | ||||||||
Albemarle Corporation | 23,452 | 3,150,073 | ||||||
|
| |||||||
| 4,868,514 | ||||||||
|
| |||||||
Commercial Service Supplies & Distributors 1.8% |
| |||||||
United States 1.8% | ||||||||
MRC Global, Inc. (a) | 191,533 | 3,008,983 | ||||||
|
| |||||||
Construction & Engineering 2.3% |
| |||||||
United States 2.3% | ||||||||
Quanta Services, Inc. (a) | 98,291 | 3,725,229 | ||||||
|
| |||||||
Diversified General Partners 2.4% |
| |||||||
United States 2.4% | ||||||||
Marathon Petroleum Corporation | 19,229 | 1,204,312 | ||||||
SemGroup Corporation | 112,013 | 2,688,312 | ||||||
|
| |||||||
| 3,892,624 | ||||||||
|
| |||||||
Exploration & Production 8.3% |
| |||||||
United States 8.3% |
| |||||||
Callon Petroleum Company (a) | 238,595 | 2,634,089 | ||||||
Centennial Resource Development, Inc. (a) | 80,176 | 1,626,771 | ||||||
Devon Energy Corporation | 41,262 | 1,589,825 | ||||||
Extraction Oil & Gas, Inc. (a) | 140,118 | 2,110,177 | ||||||
Newfield Exploration Company (a) | 90,532 | 2,800,155 | ||||||
Parsley Energy, Inc (a) | 104,927 | 2,818,339 | ||||||
|
| |||||||
| 13,579,356 | ||||||||
|
| |||||||
Industrials 21.6% |
| |||||||
Ireland 0.7% |
| |||||||
Eaton Corporation PLC | 14,015 | 1,090,087 | ||||||
Republic of the Marshall Islands 0.0% |
| |||||||
Aegean Marine Petroleum Network, Inc. | 19,364 | 77,456 | ||||||
United States 20.9% |
| |||||||
AECOM (a) | 83,175 | 3,119,062 | ||||||
Covenant Transportation Group, Inc. (a) | 83,241 | 2,493,900 | ||||||
Daseke, Inc. (a) | 262,350 | 3,329,221 | ||||||
Emerson Electric Company | 53,775 | 3,485,696 | ||||||
Granite Construction, Inc. | 17,227 | 1,143,356 | ||||||
¨Hub Group, Inc. (a) | 97,840 | 4,676,752 | ||||||
¨Jacobs Engineering Group, Inc. | 95,472 | 6,265,827 | ||||||
¨Knight-Swift Transportation Holdings, Inc. | 122,548 | 5,230,349 | ||||||
Rockwell Automation, Inc. | 13,847 | 2,673,579 | ||||||
Trinity Industrials, Inc. | 46,861 | 1,670,595 | ||||||
|
| |||||||
| 35,255,880 | ||||||||
|
| |||||||
Shares | Value | |||||||
Machinery 0.6% |
| |||||||
United States 0.6% |
| |||||||
Flowserve Corporation | 24,808 | $ | 1,056,325 | |||||
|
| |||||||
Materials 5.1% |
| |||||||
United States 5.1% |
| |||||||
AK Steel Holding Corporation (a) | 265,872 | 1,294,797 | ||||||
Fairmount Santrol Holdings, Inc. (a) | 442,827 | 2,134,426 | ||||||
Martin Marietta Materials, Inc. | 8,552 | 1,782,151 | ||||||
United States Steel Corporation | 44,244 | 1,279,536 | ||||||
Vulcan Materials Company | 14,663 | 1,842,406 | ||||||
|
| |||||||
| 8,333,316 | ||||||||
|
| |||||||
Natural Gas Gatherers & Processors 1.7% |
| |||||||
United States 1.7% |
| |||||||
Targa Resources Corporation | 63,214 | 2,743,488 | ||||||
|
| |||||||
Oil & Gas Equipment & Services 9.7% |
| |||||||
Ireland 1.5% |
| |||||||
Weatherford International PLC (a) | 733,827 | 2,421,629 | ||||||
United Kingdom 1.2% | ||||||||
TechnipFMC PLC | 70,691 | 2,024,590 | ||||||
United States 7.0% |
| |||||||
¨C&J Energy Services, Inc. (a) | 157,682 | 4,929,140 | ||||||
Keane Group, Inc. (a) | 190,529 | 2,850,314 | ||||||
NCS Multistage Holdings, Inc. (a) | 58,184 | 977,491 | ||||||
Select Energy Services, Inc. (a) | 167,142 | 2,754,500 | ||||||
|
| |||||||
| 15,957,664 | ||||||||
|
| |||||||
Oil & Gas Exploration & Production 2.4% |
| |||||||
United States 2.4% |
| |||||||
RSP Permian, Inc. (a) | 105,956 | 3,891,764 | ||||||
|
| |||||||
Oil & Gas Services 0.6% |
| |||||||
Bermuda 0.6% |
| |||||||
Nabors Industries Ltd. | 154,027 | 930,323 | ||||||
|
| |||||||
Oil & Gas Storage & Transportation 3.7% |
| |||||||
United States 3.7% |
| |||||||
¨Cheniere Energy, Inc. (a) | 125,931 | 6,084,986 | ||||||
|
| |||||||
Oil Services 0.8% |
| |||||||
United States 0.8% |
| |||||||
Halliburton Company | 32,243 | 1,347,112 | ||||||
|
| |||||||
Shipping 3.7% |
| |||||||
Bermuda 3.7% |
| |||||||
¨Golar LNG Ltd. | 243,156 | 6,008,385 | ||||||
|
| |||||||
| † | Calculated as a percentage of net assets applicable to common shareholders. |
| ¨ | Among the Portfolio’s 10 largest holdings or issuers held, as of November 30, 2017, excluding short-term investments. May be subject to change daily. (Unaudited) |
| 26 | MainStay Cushing Renaissance Advantage Fund | The notes to the financial statements are an integral part of, and should be read in conjunction with, the financial statements. |
Shares | Value | |||||||
| Common Stocks (continued) | ||||||||
Trading Companies & Distributors 5.3% |
| |||||||
United States 5.3% |
| |||||||
¨United Rentals, Inc. (a) | 38,884 | $ | 6,201,220 | |||||
Univar, Inc. (a) | 81,827 | 2,410,624 | ||||||
|
| |||||||
| 8,611,844 | ||||||||
|
| |||||||
Transportation 11.7% |
| |||||||
United States 11.7% |
| |||||||
American Airlines Group, Inc. | 34,948 | 1,764,524 | ||||||
CSX Corporation | 34,084 | 1,900,183 | ||||||
Genesee & Wyoming, Inc. (a) | 21,467 | 1,692,029 | ||||||
Southwest Airlines Company | 53,085 | 3,220,667 | ||||||
Spirit Airlines, Inc. (a) | 74,812 | 3,189,236 | ||||||
¨XPO Logistics, Inc. (a) | 92,750 | 7,330,032 | ||||||
|
| |||||||
| 19,096,671 | ||||||||
|
| |||||||
Total Common Stocks | 138,392,464 | |||||||
|
| |||||||
| MLP Investments and Related Companies 14.5% | ||||||||
Crude Oil & Refined Products 1.0% |
| |||||||
United States 1.0% |
| |||||||
MPLX, L.P. | 45,823 | 1,643,213 | ||||||
|
| |||||||
Large Cap Diversified 5.9% |
| |||||||
United States 5.9% |
| |||||||
¨Energy Transfer Partners, L.P. | 418,397 | 6,949,566 | ||||||
Enterprise Products Partners, L.P. | 112,429 | 2,769,126 | ||||||
|
| |||||||
| 9,718,692 | ||||||||
|
| |||||||
Natural Gas Gatherers & Processors 1.4% |
| |||||||
United States 1.4% |
| |||||||
American Midstream Partners, L.P. | 117,264 | 1,401,305 | ||||||
EnLink Midstream Partners, L.P. | 51,801 | 828,298 | ||||||
|
| |||||||
| 2,229,603 | ||||||||
|
| |||||||
Other 2.9% |
| |||||||
United States 2.9% |
| |||||||
¨Hi-Crush Partners, L.P. | 453,863 | 4,765,561 | ||||||
|
| |||||||
Propane 2.4% |
| |||||||
United States 2.4% |
| |||||||
NGL Energy Partners, L.P. | 308,402 | 3,855,025 | ||||||
|
| |||||||
Shipping 0.9% |
| |||||||
Republic of the Marshall Islands 0.9% |
| |||||||
GasLog Partners, L.P. | 63,609 | 1,405,759 | ||||||
|
| |||||||
Total MLP Investments and Related Companies (Cost $23,900,329) | 23,617,853 | |||||||
|
| |||||||
Shares | Value | |||||||
| Short-Term Investments—Investment Companies 1.1% | ||||||||
United States 1.1% |
| |||||||
Fidelity Government Portfolio Fund— Institutional Class, 0.97% (b) | 440,754 | $ | 440,754 | |||||
First American Prime Obligations Fund— Class Z, 0.95% (b) | 440,754 | 440,754 | ||||||
Invesco Short-Term Government & Agency Portfolio—Institutional Class, 0.98% (b) | 440,754 | 440,754 | ||||||
Morgan Stanley Institutional Liquidity Funds—Government Portfolio—Institutional Class, 0.97% (b) | 440,754 | 440,754 | ||||||
|
| |||||||
Total Short-Term Investments—Investment Companies |
| 1,763,016 | ||||||
|
| |||||||
Total Investments | 100.3 | % | 163,773,333 | |||||
Other Assets, Less Liabilities | (0.3 | ) | (427,803 | ) | ||||
Net Assets | 100.0 | % | $ | 163,345,530 | ||||
| (a) | No distribution or dividend was made during the period ended November 30, 2017. As such, it is classified as a non-income producing security as of November 30, 2017. |
| (b) | Rate reported is the current yield as of November 30, 2017. |
| The notes to the financial statements are an integral part of, and should be read in conjunction with, the financial statements. | 27 |
Portfolio of Investments November 30, 2017 (continued)
The following is a summary of the fair valuations according to the inputs used as of November 30, 2017, for valuing the Fund’s assets and liabilities.
Asset Valuation Inputs
Description | Quoted Prices in Active Markets for Identical Assets (Level 1) | Significant Other Observable Inputs (Level 2) | Significant Unobservable Inputs (Level 3) | Total | ||||||||||||
| Investments in Securities (a) | ||||||||||||||||
Common Stocks | $ | 138,392,464 | $ | — | $ | — | $ | 138,392,464 | ||||||||
MLP Investments and Related Companies | 23,617,853 | — | — | 23,617,853 | ||||||||||||
Short-Term Investments—Investment Companies | 1,763,016 | — | — | 1,763,016 | ||||||||||||
|
|
|
|
|
|
|
| |||||||||
| Total Investments in Securities | $ | 163,773,333 | $ | — | $ | — | $ | 163,773,333 | ||||||||
|
|
|
|
|
|
|
| |||||||||
| (a) | For a complete listing of investments and their industries, see the Portfolio of Investments. |
The Fund recognizes transfers between the levels as of the beginning of the period.
For the year ended November 30, 2017, the Fund did not have any transfers between Level 1 and Level 2 fair value measurements (See Note 2).
As of November 30, 2017, the Fund did not hold any investments with significant unobservable inputs (Level 3) (See Note 2).
| 28 | MainStay Cushing Renaissance Advantage Fund | The notes to the financial statements are an integral part of, and should be read in conjunction with, the financial statements. |
Statement of Assets and Liabilities as of November 30, 2017
| Assets | ||||
Investments, at value | $ | 163,773,333 | ||
Receivables: | ||||
Investments sold | 502,069 | |||
Dividends and interest | 96,125 | |||
Fund shares sold | 80,890 | |||
Prepaid expenses | 31,218 | |||
|
| |||
Total assets | 164,483,635 | |||
|
| |||
| Liabilities | ||||
Payables: | ||||
Investments purchased | 607,767 | |||
Fund shares redeemed | 295,901 | |||
Manager fees (See Note 3) | 162,154 | |||
Transfer agent (See Note 3) | 28,057 | |||
NYLIFE Distributors (See Note 3) | 20,288 | |||
Professional fees | 8,334 | |||
Shareholder communication | 8,110 | |||
Custodian | 3,457 | |||
Trustees | 911 | |||
Accrued expenses | 3,126 | |||
|
| |||
Total liabilities | 1,138,105 | |||
|
| |||
Net assets | $ | 163,345,530 | ||
|
| |||
| Composition of Net Assets | ||||
Shares of beneficial interest outstanding (par value of $.001 per share) unlimited number of shares authorized | $ | 7,845 | ||
Additional paid-in capital | 220,667,265 | |||
|
| |||
| 220,675,110 | ||||
Accumulated net investment loss | (4,351,838 | ) | ||
Accumulated net realized gain (loss) on investments | (68,179,192 | ) | ||
Net unrealized appreciation (depreciation) on investments | 15,201,450 | |||
|
| |||
Net assets | $ | 163,345,530 | ||
|
| |||
Class A | ||||
Net assets applicable to outstanding shares | $ | 27,303,048 | ||
|
| |||
Shares of beneficial interest outstanding | 1,316,006 | |||
|
| |||
Net asset value per share outstanding | $ | 20.75 | ||
Maximum sales charge (5.50% of offering price) | 1.21 | |||
|
| |||
Maximum offering price per share outstanding | $ | 21.96 | ||
|
| |||
Investor Class | ||||
Net assets applicable to outstanding shares | $ | 3,382,401 | ||
|
| |||
Shares of beneficial interest outstanding | 163,612 | |||
|
| |||
Net asset value per share outstanding | $ | 20.67 | ||
Maximum sales charge (5.50% of offering price) | 1.20 | |||
|
| |||
Maximum offering price per share outstanding | $ | 21.87 | ||
|
| |||
Class C | ||||
Net assets applicable to outstanding shares | $ | 17,215,523 | ||
|
| |||
Shares of beneficial interest outstanding | 863,898 | |||
|
| |||
Net asset value per share outstanding | $ | 19.93 | ||
|
| |||
Class I | ||||
Net assets applicable to outstanding shares | $ | 115,444,558 | ||
|
| |||
Shares of beneficial interest outstanding | 5,501,300 | |||
|
| |||
Net asset value per share outstanding | $ | 20.98 | ||
|
| |||
| The notes to the financial statements are an integral part of, and should be read in conjunction with, the financial statements. | 29 |
Statement of Operations for the year ended November 30, 2017
| Investment Income (Loss) | ||||
Income | ||||
Dividends and distributions | ||||
(Net of return of capital of $2,967,225) (a) | $ | 1,100,853 | ||
Interest | 21,027 | |||
|
| |||
Total income | 1,121,880 | |||
|
| |||
Expenses | ||||
Manager (See Note 3) | 2,501,879 | |||
Distribution/Service—Class A (See Note 3) | 77,874 | |||
Distribution/Service—Investor Class (See Note 3) | 9,514 | |||
Distribution/Service—Class C (See Note 3) | 216,669 | |||
Transfer agent (See Note 3) | 166,915 | |||
Registration | 64,982 | |||
Professional fees | 20,559 | |||
Shareholder communication | 28,943 | |||
Trustees | 6,033 | |||
Custodian | 7,738 | |||
Insurance | 2,140 | |||
Miscellaneous | 8,275 | |||
|
| |||
Net total expenses | 3,111,521 | |||
|
| |||
Net investment income (loss) | (1,989,641 | ) | ||
|
| |||
| Realized and Unrealized Gain (Loss) on Investments | ||||
Net realized gain (loss) on investments | 7,245,782 | |||
Net change in unrealized appreciation (depreciation) | (7,332,069 | ) | ||
|
| |||
Net realized and unrealized gain (loss) on investments | (86,287 | ) | ||
|
| |||
Net increase (decrease) in net assets resulting from operations | $ | (2,075,928 | ) | |
|
| |||
| (a) | Dividends and distributions recorded net of foreign withholding taxes in the amount of $628. |
| 30 | MainStay Cushing Renaissance Advantage Fund | The notes to the financial statements are an integral part of, and should be read in conjunction with, the financial statements. |
Statements of Changes in Net Assets
| Year ended November 30, 2017 | Year ended November 30, 2016 | |||||||
| Increase (Decrease) in Net Assets | ||||||||
Operations: | ||||||||
Net investment income (loss) | $ | (1,989,641 | ) | $ | (123,827 | ) | ||
Net realized gain (loss) on investments | 7,245,782 | (7,909,689 | ) | |||||
Net change in unrealized appreciation (depreciation) on investments | (7,332,069 | ) | 32,693,684 | |||||
|
| |||||||
Net increase (decrease) in net assets resulting from operations | (2,075,928 | ) | 24,660,168 | |||||
|
| |||||||
Dividends and distributions to shareholders: | ||||||||
From return of capital: | ||||||||
Class A | (872,216 | ) | (1,118,745 | ) | ||||
Investor Class | (105,809 | ) | (99,135 | ) | ||||
Class C | (621,133 | ) | (823,522 | ) | ||||
Class I | (4,131,024 | ) | (3,698,162 | ) | ||||
|
| |||||||
Total dividends and distributions to shareholders | (5,730,182 | ) | (5,739,564 | ) | ||||
|
| |||||||
Capital share transactions: | ||||||||
Net proceeds from sale of shares | 53,573,938 | 59,436,755 | ||||||
Net asset value of shares issued to shareholders in reinvestment of dividends and distributions | 5,366,928 | 5,293,709 | ||||||
Cost of shares redeemed | (104,933,025 | ) | (76,707,130 | ) | ||||
|
| |||||||
Increase (decrease) in net assets derived from capital share transactions | (45,992,159 | ) | (11,976,666 | ) | ||||
|
| |||||||
Net increase (decrease) in net assets | (53,798,269 | ) | 6,943,938 | |||||
| Net Assets | ||||||||
Beginning of year | 217,143,799 | 210,199,861 | ||||||
|
| |||||||
End of year | $ | 163,345,530 | $ | 217,143,799 | ||||
|
| |||||||
Accumulated net investment loss | $ | (4,351,838 | ) | $ | (610,426 | ) | ||
|
| |||||||
| The notes to the financial statements are an integral part of, and should be read in conjunction with, the financial statements. | 31 |
Financial Highlights selected per share data and ratios
| Year ended November 30, | April 2, 2013** through November 30, | |||||||||||||||||||
| Class A | 2017 | 2016 | 2015 | 2014 | 2013*** | |||||||||||||||
Net asset value at beginning of period | $ | 20.95 | $ | 18.91 | $ | 23.29 | $ | 22.65 | $ | 20.00 | ||||||||||
|
|
|
|
|
| �� |
|
|
|
| ||||||||||
Net investment income (loss) (a) | (0.21 | ) | (0.01 | ) | 0.03 | 0.01 | (0.12 | ) | ||||||||||||
Net realized and unrealized gain (loss) on investments | 0.57 | 2.61 | (3.85 | ) | 1.19 | 3.09 | ||||||||||||||
|
|
|
|
|
|
|
|
|
| |||||||||||
Total from investment operations | 0.36 | 2.60 | (3.82 | ) | 1.20 | 2.97 | ||||||||||||||
|
|
|
|
|
|
|
|
|
| |||||||||||
| Less dividends and distributions: | ||||||||||||||||||||
From net investment income | — | — | (0.03 | ) | (0.03 | ) | — | |||||||||||||
From net realized gain on investment | — | — | — | — | (0.02 | ) | ||||||||||||||
From return of capital | (0.56 | ) | (0.56 | ) | (0.53 | ) | (0.53 | ) | (0.30 | ) | ||||||||||
|
|
|
|
|
|
|
|
|
| |||||||||||
Total dividends and distributions | (0.56 | ) | (0.56 | ) | (0.56 | ) | (0.56 | ) | (0.32 | ) | ||||||||||
|
|
|
|
|
|
|
|
|
| |||||||||||
Redemption fees retained (a)(b) | — | — | — | 0.00 | ‡ | 0.00 | ‡ | |||||||||||||
|
|
|
|
|
|
|
|
|
| |||||||||||
Net asset value at end of period | $ | 20.75 | $ | 20.95 | $ | 18.91 | $ | 23.29 | $ | 22.65 | ||||||||||
|
|
|
|
|
|
|
|
|
| |||||||||||
Total investment return (c) | 1.87 | % | 14.35 | % | (16.57 | %) | 5.14 | % | 14.92 | % | ||||||||||
| Ratios (to average net assets)/Supplemental Data: | ||||||||||||||||||||
Net investment income (loss) | (1.05 | %) | (0.06 | %) | 0.15 | % | 0.03 | % | (0.83 | %)†† | ||||||||||
Net expenses | 1.59 | % | 1.65 | % | 1.69 | % | 1.80 | % | 2.00 | % †† | ||||||||||
Expenses (before waiver/reimbursement) | 1.59 | % | 1.68 | % | 1.73 | % | 1.81 | % | 5.65 | % †† | ||||||||||
Portfolio turnover rate | 166 | % | 314 | % | 149 | % | 115 | % | 23 | % | ||||||||||
Net assets at end of period (in 000’s) | $ | 27,303 | $ | 38,686 | $ | 42,135 | $ | 51,472 | $ | 6,867 | ||||||||||
| ** | Inception date. |
| *** | This period was audited by a predecessor audit firm whose opinion was unqualified. |
| ‡ | Less than one cent per share. |
| †† | Annualized. |
| (a) | Per share data based on average shares outstanding during the period. |
| (b) | Redemption fees were only applicable prior to reorganization. (See Note 1) |
| (c) | Total investment return is calculated exclusive of sales charges and assumes the reinvestment of dividends and distributions. |
| For periods of less than one year, total return is not annualized. |
| 32 | MainStay Cushing Renaissance Advantage Fund | The notes to the financial statements are an integral part of, and should be read in conjunction with, the financial statements. |
Financial Highlights selected per share data and ratios
| Year ended November 30, | July 12, November 30, | |||||||||||||||
| Investor Class | 2017 | 2016 | 2015 | 2014 | ||||||||||||
Net asset value at beginning of period | $ | 20.90 | $ | 18.90 | $ | 23.30 | $ | 26.80 | ||||||||
|
|
|
|
|
|
|
| |||||||||
Net investment income (loss) (a) | (0.24 | ) | (0.04 | ) | 0.00 | ‡ | 0.03 | |||||||||
Net realized and unrealized gain (loss) on investments | 0.57 | 2.60 | (3.84 | ) | (3.25 | ) | ||||||||||
|
|
|
|
|
|
|
| |||||||||
Total from investment operations | 0.33 | 2.56 | (3.84 | ) | (3.22 | ) | ||||||||||
|
|
|
|
|
|
|
| |||||||||
| Less dividends and distributions: | ||||||||||||||||
From net investment income | — | — | (0.03 | ) | (0.02 | ) | ||||||||||
From return of capital | (0.56 | ) | (0.56 | ) | (0.53 | ) | (0.26 | ) | ||||||||
|
|
|
|
|
|
|
| |||||||||
Total dividends and distributions | (0.56 | ) | (0.56 | ) | (0.56 | ) | (0.28 | ) | ||||||||
|
|
|
|
|
|
|
| |||||||||
Net asset value at end of period | $ | 20.67 | $ | 20.90 | $ | 18.90 | $ | 23.30 | ||||||||
|
|
|
|
|
|
|
| |||||||||
Total investment return (b)(c) | 1.73 | % | 14.15 | % | (16.68 | %) | (12.10 | %) | ||||||||
| Ratios (to average net assets)/Supplemental Data: | ||||||||||||||||
Net investment income (loss) | (1.21 | %) | (0.25 | %) | 0.01 | % | 0.31 | % †† | ||||||||
Net expenses | 1.74 | % | 1.80 | % | 1.83 | % | 1.70 | % †† | ||||||||
Expenses (before waiver/reimbursement) | 1.74 | % | 1.83 | % | 1.87 | % | 1.70 | % †† | ||||||||
Portfolio turnover rate | 166 | % | 314 | % | 149 | % | 115 | % | ||||||||
Net assets at end of period (in 000’s) | $ | 3,382 | $ | 3,985 | $ | 2,989 | $ | 1,651 | ||||||||
| ** | Inception date. |
| ‡ | Less than one cent per share. |
| †† | Annualized. |
| (a) | Per share data based on average shares outstanding during the period. |
| (b) | Total investment return is calculated exclusive of sales charges and assumes the reinvestment of dividends and distributions. |
| (c) | Total investment return may reflect adjustments to conform to generally accepted accounting principles. |
| For periods of less than one year, total return is not annualized. |
| The notes to the financial statements are an integral part of, and should be read in conjunction with, the financial statements. | 33 |
Financial Highlights selected per share data and ratios
| Year ended November 30, | April 2, 2013** through November 30, | |||||||||||||||||||
| Class C | 2017 | 2016 | 2015 | 2014 | 2013*** | |||||||||||||||
Net asset value at beginning of period | $ | 20.32 | $ | 18.53 | $ | 23.02 | $ | 22.56 | $ | 20.00 | ||||||||||
|
|
|
|
|
|
|
|
|
| |||||||||||
Net investment income (loss) (a) | (0.37 | ) | (0.16 | ) | (0.15 | ) | (0.16 | ) | (0.23 | ) | ||||||||||
Net realized and unrealized gain (loss) on investments | 0.54 | 2.51 | (3.78 | ) | 1.18 | 3.11 | ||||||||||||||
|
|
|
|
|
|
|
|
|
| |||||||||||
Total from investment operations | 0.17 | 2.35 | (3.93 | ) | 1.02 | 2.88 | ||||||||||||||
|
|
|
|
|
|
|
|
|
| |||||||||||
| Less dividends and distributions: | ||||||||||||||||||||
From net investment income | — | — | (0.03 | ) | (0.03 | ) | — | |||||||||||||
From net realized gain on investment | — | — | — | — | (0.02 | ) | ||||||||||||||
From return of capital | (0.56 | ) | (0.56 | ) | (0.53 | ) | (0.53 | ) | (0.30 | ) | ||||||||||
|
|
|
|
|
|
|
|
|
| |||||||||||
Total dividends and distributions | (0.56 | ) | (0.56 | ) | (0.56 | ) | (0.56 | ) | (0.32 | ) | ||||||||||
|
|
|
|
|
|
|
|
|
| |||||||||||
Redemption fees retained (a)(b) | — | — | — | 0.00 | ‡ | — | ||||||||||||||
|
|
|
|
|
|
|
|
|
| |||||||||||
Net asset value at end of period | $ | 19.93 | $ | 20.32 | $ | 18.53 | $ | 23.02 | $ | 22.56 | ||||||||||
|
|
|
|
|
|
|
|
|
| |||||||||||
Total investment return (c) | 0.98 | % | 13.28 | % | (17.28 | %) | 4.40 | % | 14.47 | % | ||||||||||
| Ratios (to average net assets)/Supplemental Data: | ||||||||||||||||||||
Net investment income (loss) | (1.92 | %) | (0.93 | %) | (0.72 | %) | (0.65 | %) | (1.58 | %)†† | ||||||||||
Net expenses | 2.49 | % | 2.55 | % | 2.56 | % | 2.52 | % | 2.75 | % †† | ||||||||||
Expenses (before waiver/reimbursement) | 2.49 | % | 2.58 | % | 2.60 | % | 2.53 | % | 6.40 | % †† | ||||||||||
Portfolio turnover rate | 166 | % | 314 | % | 149 | % | 115 | % | 23 | % | ||||||||||
Net assets at end of period (in 000’s) | $ | 17,216 | $ | 26,223 | $ | 35,398 | $ | 47,022 | $ | 2,263 | ||||||||||
| ** | Inception date. |
| *** | This period was audited by a predecessor audit firm whose opinion was unqualified. |
| ‡ | Less than one cent per share. |
| †† | Annualized. |
| (a) | Per share data based on average shares outstanding during the period. |
| (b) | Redemption fees were only applicable prior to reorganization. (See Note 1) |
| (c) | Total investment return is calculated exclusive of sales charges and assumes the reinvestment of dividends and distributions. |
| For periods of less than one year, total return is not annualized. |
| 34 | MainStay Cushing Renaissance Advantage Fund | The notes to the financial statements are an integral part of, and should be read in conjunction with, the financial statements. |
Financial Highlights selected per share data and ratios
| Year ended November 30, | April 2, 2013** through November 30, | |||||||||||||||||||
| Class I | 2017 | 2016 | 2015 | 2014 | 2013*** | |||||||||||||||
Net asset value at beginning of period | $ | 21.13 | $ | 19.02 | $ | 23.36 | $ | 22.66 | $ | 20.00 | ||||||||||
|
|
|
|
|
|
|
|
|
| |||||||||||
Net investment income (loss) (a) | (0.16 | ) | 0.02 | 0.07 | 0.09 | (0.08 | ) | |||||||||||||
Net realized and unrealized gain (loss) on investments | 0.57 | 2.65 | (3.85 | ) | 1.17 | 3.06 | ||||||||||||||
|
|
|
|
|
|
|
|
|
| |||||||||||
Total from investment operations | 0.41 | 2.67 | (3.78 | ) | 1.26 | 2.98 | ||||||||||||||
|
|
|
|
|
|
|
|
|
| |||||||||||
| Less dividends and distributions: | ||||||||||||||||||||
From net investment income | — | — | (0.03 | ) | (0.03 | ) | — | |||||||||||||
From net realized gain on investment | — | — | — | — | (0.02 | ) | ||||||||||||||
From return of capital | (0.56 | ) | (0.56 | ) | (0.53 | ) | (0.53 | ) | (0.30 | ) | ||||||||||
|
|
|
|
|
|
|
|
|
| |||||||||||
Total dividends and distributions | (0.56 | ) | (0.56 | ) | (0.56 | ) | (0.56 | ) | (0.32 | ) | ||||||||||
|
|
|
|
|
|
|
|
|
| |||||||||||
Redemption fees retained (a)(b) | — | — | — | 0.00 | ‡ | 0.00 | ‡ | |||||||||||||
|
|
|
|
|
|
|
|
|
| |||||||||||
Net asset value at end of period | $ | 20.98 | $ | 21.13 | $ | 19.02 | $ | 23.36 | $ | 22.66 | ||||||||||
|
|
|
|
|
|
|
|
|
| |||||||||||
Total investment return (c) | 2.14 | % | 14.64 | % | (16.34 | %) | 5.41 | % | 14.97 | % | ||||||||||
| Ratios (to average net assets)/Supplemental Data: | ||||||||||||||||||||
Net investment income (loss) | (0.80 | %) | 0.12 | % | 0.34 | % | 0.37 | % | (0.58 | %)†† | ||||||||||
Net expenses | 1.34 | % | 1.40 | % | 1.43 | % | 1.51 | % | 1.75 | % †† | ||||||||||
Expenses (before waiver/reimbursement) | 1.34 | % | 1.43 | % | 1.46 | % | 1.52 | % | 5.40 | % †† | ||||||||||
Portfolio turnover rate | 166 | % | 314 | % | 149 | % | 115 | % | 23 | % | ||||||||||
Net assets at end of period (in 000’s) | $ | 115,445 | $ | 148,250 | $ | 129,677 | $ | 316,002 | $ | 16,779 | ||||||||||
| ** | Inception date. |
| *** | This period was audited by a predecessor audit firm whose opinion was unqualified. |
| ‡ | Less than one cent per share. |
| †† | Annualized. |
| (a) | Per share data based on average shares outstanding during the period. |
| (b) | Redemption fees were only applicable prior to reorganization. (See Note 1) |
| (c) | Total investment return is calculated exclusive of sales charges and assumes the reinvestment of dividends and distributions. Class I shares are not subject to sales charges. For periods of less than one year, total return is not annualized. |
| The notes to the financial statements are an integral part of, and should be read in conjunction with, the financial statements. | 35 |
MainStay Cushing Energy Income Fund
Investment and Performance Comparison1 (Unaudited)
Performance data quoted represents past performance. Past performance is no guarantee of future results. Because of market volatility and other factors, current performance may be lower or higher than the figures shown. Investment return and principal value will fluctuate, and as a result, when shares are redeemed, they may be worth more or less than their original cost. The graph below depicts the historical performance of Class I shares of the Fund. Performance will vary from class to class based on differences in class-specific expenses and sales charges. For performance information current to the most recent month-end, please call 800-MAINSTAY (624-6782) or visit mainstayinvestments.com.
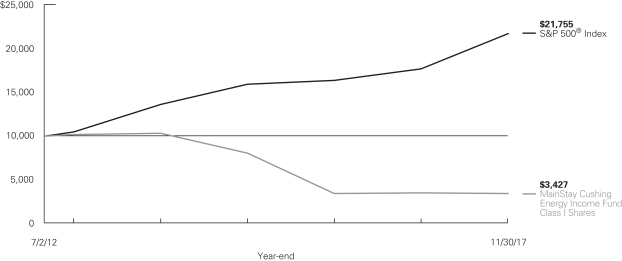
Average Annual Total Returns for the Year Ended November 30, 2017
| Class | Sales Charge | Inception Date | One Year | Five Years or Since Inception | Since Inception | Gross Expense Ratio2 | ||||||||||||||||||
| Class A Shares3 | Maximum 5.5% Initial Sales Charge | With sales charge Excluding sales charge | 7/2/2012 | | –8.11 –2.77 | %
| | –20.68 –19.77 | %
| | –18.98 –18.13 | %
| | 1.79 1.79 | %
| |||||||||
| Investor Class Shares | Maximum 5.5% Initial Sales Charge | With sales charge Excluding sales charge | 7/11/2014 | | –8.42 –3.09 |
| | –31.19 –30.03 |
| | N/A N/A |
| | 1.89 1.89 |
| |||||||||
| Class C Shares3 | Maximum 1% CDSC if Redeemed Within One Year of Purchase | With sales charge Excluding sales charge | | 7/2/2012 | | | –4.64 –3.71 |
| | –20.44 –20.44 |
| | –18.80 –18.80 |
| | 2.67 2.67 |
| |||||||
| Class I Shares3 | No Sales Charge | 7/2/2012 | –2.69 | –19.59 | –17.94 | 1.55 | ||||||||||||||||||
| 1. | The performance table and graph do not reflect the deduction of taxes that a shareholder would pay on distributions or Fund share redemptions. Total returns reflect maximum applicable sales charges as indicated in the table above, if any, changes in share price, and reinvestment of dividend and capital gain distributions. The graph assumes the initial investment amount shown above and reflects the deduction of all sales charges that would have applied for the period of investment. Performance figures may reflect certain fee waivers and/or expense limitations, without which total returns may have been lower. For more information on share classes and current fee waivers and/or expense limitations (if any), please refer to the Notes to Financial Statements. |
| 2. | The gross expense ratios presented reflect the Fund’s “Total Annual Fund Operating Expenses” from the most recent Prospectus and may differ from other expense ratios disclosed in this report. |
| 3. | Performance figures for Class A shares, Class C shares and Class I shares reflect the historical performance of the then-existing Class A shares, Class C shares and Class I shares, respectively, of the Cushing® Energy Income Fund (the predecessor to the Fund, which was subject to a different fee structure) for periods prior to July 12, 2014. The Cushing® Energy Income Fund commenced operations on July 2, 2012. |
The footnotes on the next page are an integral part of the table and graph and should be carefully read in conjunction with them.
| 36 | MainStay Cushing Energy Income Fund |
| Benchmark Performance | One Year | Five Years | Since Inception | |||||||||
S&P 500® Index4 | 22.87 | % | 15.74 | % | 15.44 | % | ||||||
Morningstar Equity Energy Category Average5 | –8.89 | –4.45 | –1.18 | |||||||||
| 4. | The S&P 500® Index is the Fund’s primary benchmark. “S&P 500®” is a trademark of The McGraw-Hill Companies, Inc. The S&P 500® Index is widely regarded as the standard index for measuring large-cap U.S. stock market performance. Results assume reinvestment of all dividends and capital gains. An investment cannot be made directly in an index. |
| 5. | The Morningstar Equity Energy Category Average is representative of funds that invest primarily in equity securities of U.S. or non-U.S. companies who |
| conduct business primarily in energy-related industries. This includes and is not limited to companies in alternative energy, coal, exploration, oil and gas services, pipelines, natural gas services, and refineries. Results are based on average total returns of similar funds with all dividends and capital gain distributions reinvested. |
The footnotes on the preceding page are an integral part of the table and graph and should be carefully read in conjunction with them.
| 37 |
Cost in Dollars of a $1,000 Investment in MainStay Cushing Energy Income Fund (Unaudited)
The example below is intended to describe the fees and expenses borne by shareholders during the six-month period from June 1, 2017, to November 30, 2017, and the impact of those costs on your investment.
Example
As a shareholder of the Fund, you incur two types of costs: (1) transaction costs, including exchange fees and sales charges (loads) on purchases (as applicable), and (2) ongoing costs, including management fees, distribution and/or service (12b-1) fees, and other Fund expenses (as applicable). This example is intended to help you understand your ongoing costs (in dollars) of investing in the Fund and to compare these costs with the ongoing costs of investing in other mutual funds. The example is based on an investment of $1,000 made at the beginning of the six-month period and held for the entire period from June 1, 2017, to November 30, 2017.
This example illustrates your Fund’s ongoing costs in two ways:
Actual Expenses
The second and third data columns in the table below provide information about actual account values and actual expenses. You may use the information in these columns, together with the amount you invested, to estimate the expenses that you paid during the six months ended November 30, 2017. Simply divide your account value by $1,000 (for example, an $8,600 account value divided by $1,000 = 8.6), then
multiply the result by the number under the heading entitled “Expenses Paid During Period” to estimate the expenses you paid on your account during this period.
Hypothetical Example for Comparison Purposes
The fourth and fifth data columns in the table below provide information about hypothetical account values and hypothetical expenses based on the Fund’s actual expense ratio and an assumed rate of return of 5% per year before expenses, which is not the Fund’s actual return. The hypothetical account values and expenses may not be used to estimate the actual ending account balances or expenses you paid for the six-month period shown. You may use this information to compare the ongoing costs of investing in the Fund with the ongoing costs of investing in other mutual funds. To do so, compare this 5% hypothetical example with the 5% hypothetical examples that appear in the shareholder reports of the other Funds.
Please note that the expenses shown in the table are meant to highlight your ongoing costs only and do not reflect any transactional costs, such as exchange fees or sales charges (loads). Therefore, the fourth and fifth data columns of the table are useful in comparing ongoing costs only and will not help you determine the relative total costs of owning different funds. In addition, if these transactional costs were included, your costs would have been higher.
| Share Class | Beginning Value | Ending Account Value (Based | Expenses During | Ending Account Value (Based on Hypothetical 5% Annualized Return and Actual Expenses) 11/30/17 | Expenses During | Net Expense Ratio During Period2 | ||||||||||||||||||
| Class A Shares | $ | 1,000.00 | $ | 1,041.50 | $ | 7.42 | $ | 1,017.80 | $ | 7.33 | 1.45 | % | ||||||||||||
| Investor Class Shares | $ | 1,000.00 | $ | 1,038.40 | $ | 8.02 | $ | 1,017.20 | $ | 7.94 | 1.57 | % | ||||||||||||
| Class C Shares | $ | 1,000.00 | $ | 1,035.80 | $ | 11.84 | $ | 1,013.44 | $ | 11.71 | 2.32 | % | ||||||||||||
| Class I Shares | $ | 1,000.00 | $ | 1,042.40 | $ | 6.14 | $ | 1,019.05 | $ | 6.07 | 1.20 | % | ||||||||||||
| 1. | Expenses are equal to the Fund’s annualized expense ratio of each class multiplied by the average account value over the period, divided by 365 and multiplied by 183 (to reflect the six-month period). Expenses for the six-month period ended November 30, 2017 excluded a franchise tax expense to the Fund that equaled (0.03)% for Class A, (0.03)% for Investor Class, (0.03)% for Class C, and (0.04)% for Class I. The table above represents the actual expenses incurred during the six-month period. |
| 2. | Expenses are equal to the Fund’s annualized expense ratio to reflect the six-month period. |
| 38 | MainStay Cushing Energy Income Fund |
Portfolio Composition as of November 30, 2017(1) (Unaudited)
(Expressed as a Percentage of Total Investments)

See Portfolio of Investments beginning on page 41 for specific holdings within these categories.
Top Ten Holdings as of November 30, 2017 (excluding short-term investments) (Unaudited)
| 1. | Royal Dutch Shell PLC |
| 2. | Golar LNG Partners, L.P. |
| 3. | Chevron Corporation |
| 4. | GasLog Partners, L.P. |
| 5. | BP PLC |
| 6. | Targa Resources Corporation |
| 7. | Total S.A. |
| 8. | Suncor Energy, Inc. |
| 9. | Pioneer Natural Resource Company |
| 10. | EnLink Midstream Partners, L.P. |
| (1) | Fund holdings and sector allocations are subject to change, and there is no assurance that the Fund will continue to hold any particular security. |
| (2) | MLPs and Related Companies |
| (3) | Common Stocks |
| (4) | Fixed Income |
| (5) | Convertible Preferred Stocks |
| 39 |
Portfolio Management Discussion and Analysis (Unaudited)
Questions answered by portfolio managers Jerry V. Swank, Matthew A. Lemme, CFA, and Nicholas C. English of Cushing Asset Management, LP, the Fund’s Subadvisor.
How did MainStay Cushing Energy Income Fund perform relative to its primary benchmark and peers during the 12 months ended November 30, 2017?
Excluding all sales charges, MainStay Cushing Energy Income Fund returned –2.77% for Class A shares, –3.09% for Investor Class shares and –3.71% for Class C shares for the 12 months ended November 30, 2017. Over the same period, Class I shares returned –2.69%. For the 12 months ended November 30, 2017, all share classes underperformed the 22.87% return of the S&P 500® Index,1 which is the Fund’s broad-based securities-market index. Over the same period, all share classes outperformed the –8.89% return of the Morningstar Equity Energy Category Average.2 See page 36 for Fund returns with applicable sales charges.
What factors affected the Fund’s performance relative to the S&P 500® Index during the reporting period?
The Fund’s performance lagged that of S&P 500® Index because the Fund’s investment program is focused exclusively on investments in companies involved in the energy sector. By comparison, the Index tracks the performance of stocks in a wide variety of sectors. During the reporting period, energy companies within the S&P 500® Index (as measured by the S&P 500® Energy Index)3 declined by 3.80%, while the overall S&P 500® Index increased by 22.87%. The largest factors affecting the Fund’s performance during the reporting period were the ongoing changes in the price of energy commodities. West Texas Intermediate crude oil prices increased by 9.67% during the 12 months ended November 30, 2017, while natural gas prices declined by 9.08% over the same period.
Which subsectors were the strongest contributors to the Fund’s relative performance and which subsectors were particularly weak?
The two strongest-contributing subsectors to the Fund’s relative performance were integrated oil & gas (formerly known as integrated E&P) and marine transportation. (Contributions take weightings and total returns into account.) The weakest-contributing subsectors to the Fund’s relative performance were midstream master limited partnerships (MLPs), oil & gas exploration & production, and oil & gas equipment & services.
During the reporting period, which individual holdings made the strongest contributions to the Fund’s absolute performance and which holdings detracted the most?
The holdings that made the strongest contributions to the Fund’s absolute performance were Netherlands-based exploration & production company Royal Dutch Shell PLC, France-based exploration & production company Total S.A., United States–based oil & gas exploration & production company Rice Energy, Norway-based exploration & production company Statoil ASA, and United Kingdom–based BP PLC. The holdings that detracted the most from the Fund’s absolute performance were all based in the United States. They included large-cap diversified MLPs Energy Transfer Partners, L.P., and Kinder Morgan, Inc.; energy equipment & services company Halliburton; and propane MLP NGL Energy Partners, L.P.
Did the Fund make any significant purchases or sales during the reporting period?
During the reporting period, the Fund bought shares of oil sands company Suncor Energy, Inc., and oil & gas exploration & production company Canadian Natural Resources, Ltd. Both companies are headquartered in Canada and, in our opinion, added valuable exposure to the Fund. During the reporting period, the Fund bought and sold Halliburton shares because of relative underperformance and bought and sold shares of Rice Energy because of the company’s purchase by EQT Corp.
How did the Fund’s subsector weightings change during the reporting period?
During the reporting period, the Fund increased its holdings among oil & gas exploration & production and oil & gas storage & transportation companies. Over the same period, the Fund reduced positions in oil & gas refining & marketing companies.
How was the Fund positioned at the end of the reporting period?
As of November 30, 2017, the Fund held relatively equally weighted positions among companies in the integrated oil & gas, oil & gas exploration & production, and oil & gas storage & transportation subsectors.
| 1. | See footnote on page 37 for more information on the S&P 500® Index. |
| 2. | See footnote on page 37 for more information on the Morningstar Equity Energy Category Average. |
| 3. | The S&P 500® Energy Index comprises those companies in the S&P 500® Index that are classified as members of the energy sector by the Global Industry Classification Standard (GICS®). GICS® is an equity classification standard jointly developed by Morgan Stanley Capital International and Standard & Poor’s. |
The opinions expressed are those of the portfolio managers as of the date of this report and are subject to change. There is no guarantee that any forecasts made will come to pass. This material does not constitute investment advice and is not intended as an endorsement of any specific investment.
| 40 | MainStay Cushing Energy Income Fund |
Portfolio of Investments November 30, 2017
| Shares | Value | |||||||
| Common Stocks 59.2%† | ||||||||
Exploration & Production 50.9% |
| |||||||
Canada 8.0% |
| |||||||
Canadian Natural Resources Ltd. | 50,000 | $ | 1,696,000 | |||||
¨Suncor Energy, Inc. | 82,000 | 2,850,320 | ||||||
France 5.1% | ||||||||
¨Total S.A. | 51,000 | 2,884,050 | ||||||
Netherlands 7.2% | ||||||||
¨Royal Dutch Shell PLC | 64,200 | 4,116,504 | ||||||
Norway 3.8% | ||||||||
Statoil ASA | 109,437 | 2,197,495 | ||||||
United Kingdom 5.1% | ||||||||
¨BP PLC | 72,194 | 2,892,814 | ||||||
United States 21.7% | ||||||||
¨Chevron Corporation | 25,600 | 3,046,144 | ||||||
Cimarex Energy Company | 7,000 | 812,770 | ||||||
Concho Resources, Inc. (a) | 12,000 | 1,678,320 | ||||||
EOG Resources, Inc. | 17,356 | 1,775,866 | ||||||
¨Pioneer Natural Resource Company | 17,938 | 2,799,045 | ||||||
QEP Resources, Inc. (a) | 98,000 | 946,680 | ||||||
RSP Permian, Inc. (a) | 35,000 | 1,285,550 | ||||||
|
| |||||||
| 28,981,558 | ||||||||
|
| |||||||
Natural Gas Gatherers & Processors 5.1% |
| |||||||
United States 5.1% |
| |||||||
¨Targa Resources Corporation | 66,582 | 2,889,659 | ||||||
|
| |||||||
Oil & Gas Exploration & Production 1.7% |
| |||||||
United States 1.7% |
| |||||||
EQT Corporation | 16,650 | 992,340 | ||||||
|
| |||||||
Oil & Gas Refining & Marketing 1.5% |
| |||||||
United States 1.5% |
| |||||||
WPX Energy, Inc. (a) | 66,000 | 836,220 | ||||||
|
| |||||||
Total Common Stocks | 33,699,777 | |||||||
|
| |||||||
| Convertible Preferred Stocks 3.1% | ||||||||
Large Cap Diversified 3.1% |
| |||||||
United States 3.1% |
| |||||||
Kinder Morgan, Inc. | 50,000 | 1,782,000 | ||||||
|
| |||||||
Total Convertible Preferred Stocks | 1,782,000 | |||||||
|
| |||||||
| MLP Investments and Related Companies 24.9% | ||||||||
Large Cap Diversified 3.8% |
| |||||||
United States 3.8% |
| |||||||
Energy Transfer Partners, L.P. | 129,858 | 2,156,941 | ||||||
|
| |||||||
| Shares | Value | |||||||
Natural Gas Gatherers & Processors 9.9% |
| |||||||
United States 9.9% | ||||||||
American Midstream Partners, L.P. | 114,000 | $ | 1,362,300 | |||||
DCP Midstream Partners, L.P. | 58,000 | 2,038,120 | ||||||
¨EnLink Midstream Partners, L.P. | 139,000 | 2,222,610 | ||||||
|
| |||||||
| 5,623,030 | ||||||||
|
| |||||||
Shipping 10.6% |
| |||||||
Republic of the Marshall Islands 10.6% |
| |||||||
¨GasLog Partners, L.P. | 135,000 | 2,983,500 | ||||||
¨Golar LNG Partners, L.P. | 153,500 | 3,068,465 | ||||||
|
| |||||||
| 6,051,965 | ||||||||
|
| |||||||
Upstream 0.6% |
| |||||||
United States 0.6% |
| |||||||
Mid-Con Energy Partners, L.P. (a) (b) (c) | 348,837 | 327,907 | ||||||
|
| |||||||
Total MLP Investments and Related Companies (Cost $15,735,491) | 14,159,843 | |||||||
|
| |||||||
Principal | ||||||||
| Fixed Income 5.7% | ||||||||
Exploration & Production 0.9% |
| |||||||
United States 0.9% |
| |||||||
Bill Barrett Corporation | ||||||||
7.00%, 10/15/2022 | $ | 500,000 | 511,250 | |||||
|
| |||||||
Oil & Gas Exploration & Production 3.0% |
| |||||||
United States 3.0% |
| |||||||
Sanchez Energy Corporation (d) | ||||||||
6.13%, 01/15/2023 | 2,000,000 | 1,697,500 | ||||||
|
| |||||||
Upstream 1.8% |
| |||||||
United States 1.8% |
| |||||||
Legacy Reserves, L.P. (d) | ||||||||
6.63%, 12/01/2021 | 1,500,000 | 1,020,000 | ||||||
|
| |||||||
Total Fixed Income | 3,228,750 | |||||||
|
| |||||||
| Short-Term Investments—Investment Companies 6.7% | ||||||||
United States 6.7% |
| |||||||
Fidelity Government Portfolio Fund—Institutional Class, 0.97% (e) | 954,122 | 954,122 | ||||||
First American Prime Obligations Fund—Class Z, 0.95% (e) | 954,122 | 954,122 | ||||||
Invesco Short-Term Government & Agency Portfolio—Institutional Class, 0.98% (e) | 954,122 | 954,122 | ||||||
| † | Calculated as a percentage of net assets applicable to common shareholders. |
| ¨ | Among the Portfolio’s 10 largest holdings or issuers held, as of November 30, 2017, excluding short-term investments. May be subject to change daily. (Unaudited) |
| The notes to the financial statements are an integral part of, and should be read in conjunction with, the financial statements. | 41 |
Portfolio of Investments November 30, 2017 (continued)
Principal | Value | |||||||
| Short-Term Investments—Investment Companies (continued) | ||||||||
United States (continued) |
| |||||||
Morgan Stanley Institutional Liquidity Funds—Government Portfolio—Institutional Class, | $ | 954,123 | $ | 954,123 | ||||
|
| |||||||
Total Short-Term Investments—Investment Companies |
| 3,816,489 | ||||||
|
| |||||||
Total Investments | 99.6 | % | 56,686,859 | |||||
Other Assets, Less Liabilities | 0.4 | 231,632 | ||||||
Net Assets | 100.0 | % | $ | 56,918,491 | ||||
| (a) | No distribution or dividend was made during the period ended November 30, 2017. As such, it is classified as a non-income producing security as of November 30, 2017. |
| (b) | Illiquid security—As of November 30, 2017, the total market value of securities deemed illiquid under procedures approved by the Board of Trustees was $327,907, which represented 0.58% of the Fund’s net assets. (Unaudited) |
| (c) | Fair-value security—represents fair value measured in good faith under procedures approved by the Board of Trustees. As of November 30, 2017, the total market value of these securities was $327,907, which represents 0.58% of the Funds’ net assets. |
| (d) | May be sold to Institutional Investors only under Rule 144A or securities offered pursuant to Section 4(a)(2) of the Securities Act of 1933, as amended. |
| (e) | Rate reported is the current yield as of November 30, 2017. |
The following is a summary of the fair valuations according to the inputs used as of November 30, 2017, for valuing the Fund’s assets and liabilities.
Asset Valuation Inputs
Description | Quoted Prices in Active Markets for Identical Assets (Level 1) | Significant Other Observable Inputs (Level 2) | Significant Unobservable Inputs (Level 3) | Total | ||||||||||||
| Investments in Securities (a) | ||||||||||||||||
Common Stocks | $ | 33,699,777 | $ | — | $ | — | $ | 33,699,777 | ||||||||
Convertible Preferred Stocks | 1,782,000 | — | — | 1,782,000 | ||||||||||||
MLP Investments and Related Companies | 13,831,936 | 327,907 | — | 14,159,843 | ||||||||||||
Fixed Income | — | 3,228,750 | — | 3,228,750 | ||||||||||||
Short-Term Investments—Investment Companies | 3,816,489 | — | — | 3,816,489 | ||||||||||||
|
|
|
|
|
|
|
| |||||||||
| Total Investments in Securities | $ | 53,130,202 | $ | 3,556,657 | $ | — | $ | 56,686,859 | ||||||||
|
|
|
|
|
|
|
| |||||||||
| (a) | For a complete listing of investments and their industries, see the Portfolio of Investments. |
The Fund recognizes transfers between the levels as of the beginning of the period.
For the year ended November 30, 2017, the Fund did not have any transfers between Level 1 and Level 2 fair value measurements (See Note 2).
As of November 30, 2017, the Fund did not hold any investments with significant unobservable inputs (Level 3) (See Note 2).
| 42 | MainStay Cushing Energy Income Fund | The notes to the financial statements are an integral part of, and should be read in conjunction with, the financial statements. |
Statement of Assets and Liabilities as of November 30, 2017
| Assets | ||||
Investments, at value | $ | 56,686,859 | ||
Receivables: | ||||
Dividends and interest | 268,414 | |||
Fund shares sold | 135,027 | |||
Prepaid expenses | 52,426 | |||
|
| |||
Total assets | 57,142,726 | |||
|
| |||
| Liabilities | ||||
Payables: | ||||
Fund shares redeemed | 101,249 | |||
Advisory fees (See Note 3) | 43,714 | |||
NYLIFE Distributors (See Note 3) | 34,931 | |||
Transfer agent (See Note 3) | 21,741 | |||
Professional fees | 10,424 | |||
Shareholder communication | 6,995 | |||
Custodian | 2,456 | |||
Trustees | 803 | |||
Accrued expenses | 1,922 | |||
|
| |||
Total liabilities | 224,235 | |||
|
| |||
Net assets | $ | 56,918,491 | ||
|
| |||
| Composition of Net Assets | ||||
Shares of beneficial interest outstanding (par value of | $ | 13,404 | ||
Additional paid-in capital | 294,283,682 | |||
|
| |||
| 294,297,086 | ||||
Accumulated net investment loss | (3,496,191 | ) | ||
Accumulated net realized gain (loss) on investments | (236,365,345 | ) | ||
Net unrealized appreciation (depreciation) on investments | 2,482,941 | |||
|
| |||
Net assets | $ | 56,918,491 | ||
|
| |||
Class A | ||||
Net assets applicable to outstanding shares | $ | 30,582,537 | ||
|
| |||
Shares of beneficial interest outstanding | 7,153,635 | |||
|
| |||
Net asset value per share outstanding | $ | 4.28 | ||
Maximum sales charge (5.50% of offering price) | 0.25 | |||
|
| |||
Maximum offering price per share outstanding | $ | 4.53 | ||
|
| |||
Investor Class | ||||
Net assets applicable to outstanding shares | $ | 2,788,593 | ||
|
| |||
Shares of beneficial interest outstanding | 654,289 | |||
|
| |||
Net asset value per share outstanding | $ | 4.26 | ||
Maximum sales charge (5.50% of offering price) | 0.25 | |||
|
| |||
Maximum offering price per share outstanding | $ | 4.51 | ||
|
| |||
Class C | ||||
Net assets applicable to outstanding shares | $ | 12,643,689 | ||
|
| |||
Shares of beneficial interest outstanding | 3,077,941 | |||
|
| |||
Net asset value per share outstanding | $ | 4.11 | ||
|
| |||
Class I | ||||
Net assets applicable to outstanding shares | $ | 10,903,672 | ||
|
| |||
Shares of beneficial interest outstanding | 2,517,884 | |||
|
| |||
Net asset value per share outstanding | $ | 4.33 | ||
|
|
| The notes to the financial statements are an integral part of, and should be read in conjunction with, the financial statements. | 43 |
Statement of Operations for the year ended November 30, 2017
| Investment Income (Loss) | ||||
Income | ||||
Dividends and distributions | $ | 1,546,570 | ||
Interest | 603,772 | |||
|
| |||
Total Income | 2,150,342 | |||
|
| |||
Expenses | ||||
Manager (See Note 3) | 667,123 | |||
Distribution/Service—Class A (See Note 3) | 90,270 | |||
Distribution/Service—Investor Class (See Note 3) | 8,057 | |||
Distribution/Service—Class C (See Note 3) | 157,294 | |||
Transfer agent (See Note 3) | 159,763 | |||
Registration | 73,025 | |||
Professional fees | 62,826 | |||
Shareholder communication | 36,572 | |||
Trustees | 2,587 | |||
Custodian | 7,965 | |||
Insurance | 804 | |||
Franchise tax refund | (10,487 | ) | ||
Miscellaneous | 7,797 | |||
|
| |||
Total expenses before waiver/reimbursement | 1,263,596 | |||
Expense waiver/reimbursement from Manager (see Note 3) | (152,260 | ) | ||
|
| |||
Net expenses | 1,111,336 | |||
|
| |||
Net investment income (loss) | 1,039,006 | |||
|
| |||
| Realized and Unrealized Gain (Loss) on Investments | ||||
Net realized gain (loss) on: | ||||
Investments | (4,428,152 | ) | ||
Foreign currency transactions | (3,472 | ) | ||
|
| |||
Net realized gain (loss) on investments | �� | (4,431,624 | ) | |
|
| |||
Net change in unrealized appreciation (depreciation) on investments | 618,532 | |||
|
| |||
Net realized and unrealized gain (loss) on investments | (3,813,092 | ) | ||
|
| |||
Net increase (decrease) in net assets resulting from operations | $ | (2,774,086 | ) | |
|
| |||
| (a) | Dividends and distributions recorded net of foreign withholding taxes in the amount of $122,962. |
| 44 | MainStay Cushing Energy Income Fund | The notes to the financial statements are an integral part of, and should be read in conjunction with, the financial statements. |
Statements of Changes in Net Assets
| Year ended November 30, 2017 | Year ended November 30, 2016 | |||||||
| Increase (Decrease) in Net Assets | ||||||||
Operations: | ||||||||
Net investment income (loss) | $ | 1,039,006 | $ | 885,893 | ||||
Net realized gain (loss) on investments | (4,431,624 | ) | (115,774,812 | ) | ||||
Net change in unrealized appreciation (depreciation) on investments | 618,532 | 112,105,113 | ||||||
|
| |||||||
Net increase (decrease) in net assets resulting from operations | (2,774,086 | ) | (2,783,806 | ) | ||||
|
| |||||||
Dividends and distributions to shareholders: | ||||||||
From net investment income: | ||||||||
Class A | — | (176,009 | ) | |||||
Investor Class | — | (10,887 | ) | |||||
Class C | — | (80,062 | ) | |||||
Class I | — | (64,935 | ) | |||||
|
| |||||||
| — | (331,893 | ) | ||||||
|
| |||||||
From return of capital: | ||||||||
Class A | (1,663,000 | ) | (3,088,251 | ) | ||||
Investor Class | (145,368 | ) | (191,023 | ) | ||||
Class C | (616,233 | ) | (1,404,765 | ) | ||||
Class I | (740,333 | ) | (1,139,340 | ) | ||||
|
| |||||||
| (3,164,934 | ) | (5,823,379 | ) | |||||
|
| |||||||
Total dividends and distributions to shareholders | (3,164,934 | ) | (6,155,272 | ) | ||||
|
| |||||||
Capital share transactions: | ||||||||
Net proceeds from sale of shares | 14,019,158 | 25,458,612 | ||||||
Net asset value of shares issued to shareholders in reinvestment of dividends and distributions | 2,973,191 | 5,656,620 | ||||||
Cost of shares redeemed | (37,266,196 | ) | (41,697,862 | ) | ||||
|
| |||||||
Increase (decrease) in net assets derived from capital share transactions | (20,273,847 | ) | (10,582,630 | ) | ||||
|
| |||||||
Net increase (decrease) in net assets | (26,212,867 | ) | (19,521,708 | ) | ||||
| Net Assets | ||||||||
Beginning of year | 83,131,358 | 102,653,066 | ||||||
|
| |||||||
End of year | $ | 56,918,491 | $ | 83,131,358 | ||||
|
| |||||||
Accumulated net investment loss | $ | (3,496,191 | ) | $ | (9,375,642 | ) | ||
|
| |||||||
| The notes to the financial statements are an integral part of, and should be read in conjunction with, the financial statements. | 45 |
Financial Highlights selected per share data and ratios
| Year ended November 30, | ||||||||||||||||||||
| Class A | 2017 | 2016 | 2015 | 2014 | 2013** | |||||||||||||||
Net asset value at beginning of year | $ | 4.61 | $ | 4.96 | $ | 12.99 | $ | 18.23 | $ | 19.58 | ||||||||||
|
|
|
|
|
|
|
|
|
| |||||||||||
Net investment income (loss) (a) | 0.07 | 0.06 | (0.02 | ) | (0.08 | ) | 0.03 | |||||||||||||
Net realized and unrealized gain (loss) on investments | (0.20 | ) | (0.06 | ) | (7.21 | ) | (3.56 | ) | 0.22 | |||||||||||
|
|
|
|
|
|
|
|
|
| |||||||||||
Total from investment operations | (0.13 | ) | 0.00 | (7.23 | ) | (3.64 | ) | 0.25 | ||||||||||||
|
|
|
|
|
|
|
|
|
| |||||||||||
| Less dividends and distributions: | ||||||||||||||||||||
From net investment income | — | (0.02 | ) | — | — | — | ||||||||||||||
From return of capital | (0.20 | ) | (0.33 | ) | (0.80 | ) | (1.60 | ) | (1.60 | ) | ||||||||||
|
|
|
|
|
|
|
|
|
| |||||||||||
Total dividends and distributions | (0.20 | ) | (0.35 | ) | (0.80 | ) | (1.60 | ) | (1.60 | ) | ||||||||||
|
|
|
|
|
|
|
|
|
| |||||||||||
Redemption fees retained (a)(b) | — | — | — | 0.00 | ‡ | — | ||||||||||||||
|
|
|
|
|
|
|
|
|
| |||||||||||
Net asset value at end of year | $ | 4.28 | $ | 4.61 | $ | 4.96 | $ | 12.99 | $ | 18.23 | ||||||||||
|
|
|
|
|
|
|
|
|
| |||||||||||
Total investment return (c) | (2.77 | %) | 2.17 | % | (57.56 | %) | (22.12 | %) | 1.23 | % | ||||||||||
| Ratios (to average net assets)/Supplemental Data: | ||||||||||||||||||||
Net investment income (loss) (including net deferred income tax benefit (expense)) | 1.57 | % (d) | 1.39 | %(d)(e) | (0.24 | %)(d)(e) | 1.75 | % (e) | (0.19 | %)(e) | ||||||||||
Net investment income (loss) (excluding net deferred income tax benefit (expense)) | 1.56 | % (d) | 1.33 | %(d)(e) | (0.19 | %)(d)(e) | (0.53 | %)(e) | 0.10 | % (e) | ||||||||||
Net expenses (including net deferred income tax (benefit) expense) (f) | 1.44 | % (d) | 1.47 | %(d)(e) | 1.79 | % (d)(e) | 3.02 | % (e) | 2.29 | % (e) | ||||||||||
Expenses (before waiver/reimbursement, including net deferred income tax (benefit) expense) (f) | 1.65 | % (d) | 1.85 | %(d)(e) | 2.04 | % (d)(e) | 3.19 | % (e) | 3.80 | % (e) | ||||||||||
Portfolio turnover rate | 51 | % | 64 | % | 95 | % | 27 | % | 62 | % | ||||||||||
Net assets at end of year (in 000’s) | $ | 30,582 | $ | 42,712 | $ | 48,885 | $ | 136,037 | $ | 50,565 | ||||||||||
| ** | This year was audited by a predecessor audit firm whose opinion was unqualified. |
| ‡ | Less than one cent per share. |
| (a) | Per share data based on average shares outstanding during the period. |
| (b) | Redemption fees were only applicable prior to reorganization. |
| (c) | Total investment return is calculated exclusive of sales charges and assumes the reinvestment of dividends and distributions. |
| For periods of less than one year, total return is not annualized. |
| (d) | Ratios including/excluding net deferred income tax benefit (expense) includes applicable franchise tax expense for the period. |
| For the year ended November 30, 2017, the Fund received a franchise tax refund in the amount of $(10,487), of which $(5,634) is attributable to Class A. |
| For the year ended November 30, 2016, the Fund accrued $(55,919) in franchise tax expense, of which $(29,562) is attributable to Class A. |
| For the year ended November 30, 2015, the Fund accrued $109,516 in franchise tax expense, of which $51,919 is attributable to Class A. |
| (e) | For the year ended November 30, 2016, the Fund accrued $13,006 in net current tax expense, of which $6,919 is attributable to Class A. |
| For the year ended November 30, 2015, the Fund received a tax refund in the amount of $6,000, of which $2,773 is attributable to Class A. |
| For the year ended November 30, 2014, the Fund accrued $65,316 in net current and deferred income tax benefit, of which $(978,230) is attributable to Class A. |
| For the year ended November 30, 2013, the Fund accrued $71,348 in net current and deferred income tax expense, of which $58,510 is attributable to Class A. |
| For the period from July 2, 2012 to November 30, 2012, the Fund accrued $31 in net current and deferred income tax benefit, of which $13 is attributable to Class A. |
| (f) | The ratio of expenses excluding net current and deferred income tax benefit to average net assets before waiver was 1.66%, 1.91%, 1.98%, 1.97% and 3.26% for the fiscal years ended November 30, 2017, 2016, 2015, 2014 and 2013, respectively. The ratio of expenses excluding deferred income tax benefit to average net assets after waiver was 1.45%, 1.53%, 1.73% 1.80% and 1.75% for the fiscal years ended November 30, 2017, 2016, 2015, 2014 and 2013, respectively. |
| 46 | MainStay Cushing Energy Income Fund | The notes to the financial statements are an integral part of, and should be read in conjunction with, the financial statements. |
Financial Highlights selected per share data and ratios
| Year ended November 30, | July 12, through | |||||||||||||||
| Investor Class | 2017 | 2016 | 2015 | 2014 | ||||||||||||
Net asset value at beginning of period | $ | 4.60 | $ | 4.95 | $ | 12.99 | $ | 19.15 | ||||||||
|
|
|
|
|
|
|
| |||||||||
Net investment income (loss) (a) | 0.06 | 0.05 | (0.04 | ) | (0.02 | ) | ||||||||||
Net realized and unrealized gain (loss) on investments | (0.20 | ) | (0.05 | ) | (7.20 | ) | (5.34 | ) | ||||||||
|
|
|
|
|
|
|
| |||||||||
Total from investment operations | (0.14 | ) | 0.00 | (7.24 | ) | (5.36 | ) | |||||||||
|
|
|
|
|
|
|
| |||||||||
| Less dividends and distributions: | ||||||||||||||||
From net investment income | — | (0.02 | ) | — | — | |||||||||||
From return of capital | (0.20 | ) | (0.33 | ) | (0.80 | ) | (0.80 | ) | ||||||||
|
|
|
|
|
|
|
| |||||||||
Total dividends and distributions | (0.20 | ) | (0.35 | ) | (0.80 | ) | (0.80 | ) | ||||||||
|
|
|
|
|
|
|
| |||||||||
Net asset value at end of period | $ | 4.26 | $ | 4.60 | $ | 4.95 | $ | 12.99 | ||||||||
|
|
|
|
|
|
|
| |||||||||
Total investment return (b)(c) | (3.09 | %) | 1.97 | % | (57.56 | %) | (28.99 | %) | ||||||||
| Ratios (to average net assets)/Supplemental Data: | ||||||||||||||||
Net investment income (loss) (including net deferred income tax benefit (expense)) | 1.47 | % (d) | 1.25 | %(d)(e) | (0.48 | %)(d)(e) | 1.97 | % (e)†† | ||||||||
Net investment income (loss) (excluding net deferred income tax benefit (expense)) | 1.46 | % (d) | 1.19 | %(d)(e) | (0.39 | %)(d)(e) | (0.20 | %)(e)†† | ||||||||
Net expenses (including net deferred income tax (benefit) expense) (f) | 1.56 | % (d) | 1.58 | %(d)(e) | 1.91 | % (d)(e) | (0.55 | %)(e)†† | ||||||||
Expenses (before waiver/reimbursement, including net deferred income tax (benefit) expense) (f) | 1.78 | % (d) | 1.93 | %(d)(e) | 2.24 | % (d)(e) | (0.45 | %)(e)†† | ||||||||
Portfolio turnover rate | 51 | % | 64 | % | 95 | % | 27 | % | ||||||||
Net assets at end of period (in 000’s) | $ | 2,788 | $ | 3,513 | $ | 2,554 | $ | 908 | ||||||||
| ** | Inception date. |
| †† | Annualized. |
| (a) | Per share data based on average shares outstanding during the period. |
| (b) | Total investment return is calculated exclusive of sales charges and assumes the reinvestment of dividends and distributions. |
| (c) | Total investment return may reflect adjustments to conform to generally accepted accounting principles. |
| For periods of less than one year, total return is not annualized. |
| (d) | Ratios including/excluding net deferred income tax benefit (expense) includes applicable franchise tax expense for the period. |
| For the year ended November 30, 2017, the Fund received a franchise tax refund in the amount of $(10,487), of which $(514) is attributable to Investor Class. |
| For the year ended November 30, 2016, the Fund accrued $(55,919) in franchise tax expense, of which $(2,115) is attributable to Investor Class. |
| For the year ended November 30, 2015, the Fund accrued $109,516 in franchise tax expense, of which $2,175 is attributable to Investor Class. |
| (e) | For the year ended November 30, 2016, the Fund accrued $13,006 in net current tax expense, of which $490 is attributable to Investor Class. |
| For the year ended November 30, 2015, the Fund received a tax refund in the amount of $6,000, of which $70 is attributable to Investor Class. |
| For the year ended November 30, 2014, the Fund accrued $65,316 in net current and deferred income tax benefit, of which $8,533 is attributable to Investor Class. |
| (f) | The ratio of expenses excluding net current and deferred income tax benefit to average net assets before waiver was 1.79%, 1.99%, 2.15% and 1.72% for the fiscal years ended November 30, 2017, 2016, 2015 and the period from July 12, 2014 to November 30, 2014, respectively. The ratio of expenses excluding deferred income tax benefit to average net assets after waiver was 1.57%, 1.64%, 1.82% and 1.62% for the fiscal years ended November 30, 2017, 2016, 2015 and the period from July 12, 2014 to November 30, 2014, respectively. |
| The notes to the financial statements are an integral part of, and should be read in conjunction with, the financial statements. | 47 |
Financial Highlights selected per share data and ratios
| Year ended November 30, | ||||||||||||||||||||
| Class C | 2017 | 2016 | 2015 | 2014 | 2013** | |||||||||||||||
Net asset value at beginning of year | $ | 4.44 | $ | 4.80 | $ | 12.74 | $ | 18.04 | $ | 19.53 | ||||||||||
|
|
|
|
|
|
|
|
|
| |||||||||||
Net investment income (loss) (a) | 0.03 | 0.02 | (0.08 | ) | (0.20 | ) | (0.11 | ) | ||||||||||||
Net realized and unrealized gain (loss) on investments | (0.19 | ) | (0.05 | ) | (7.06 | ) | (3.50 | ) | 0.22 | |||||||||||
|
|
|
|
|
|
|
|
|
| |||||||||||
Total from investment operations | (0.16 | ) | (0.03 | ) | (7.14 | ) | (3.70 | ) | 0.11 | |||||||||||
|
|
|
|
|
|
|
|
|
| |||||||||||
| Less dividends and distributions: | ||||||||||||||||||||
From net investment income | — | (0.02 | ) | — | — | — | ||||||||||||||
From return of capital | (0.17 | ) | (0.31 | ) | (0.80 | ) | (1.60 | ) | (1.60 | ) | ||||||||||
|
|
|
|
|
|
|
|
|
| |||||||||||
Total dividends and distributions | (0.17 | ) | (0.33 | ) | (0.80 | ) | (1.60 | ) | (1.60 | ) | ||||||||||
|
|
|
|
|
|
|
|
|
| |||||||||||
Redemption fees retained (a)(b) | — | — | — | 0.00 | ‡ | — | ||||||||||||||
|
|
|
|
|
|
|
|
|
| |||||||||||
Net asset value at end of year | $ | 4.11 | $ | 4.44 | $ | 4.80 | $ | 12.74 | $ | 18.04 | ||||||||||
|
|
|
|
|
|
|
|
|
| |||||||||||
Total investment return (c) | (3.71 | %) | 1.29 | % | (57.93 | %) | (22.71 | %) | 0.48 | % | ||||||||||
| Ratios (to average net assets)/Supplemental Data: | ||||||||||||||||||||
Net investment income (loss) (including net deferred income tax benefit (expense)) | 0.73 | % (d) | 0.53 | %(d)(e) | (1.04 | %)(d)(e) | (0.93 | %)(e) | (0.94 | %)(e) | ||||||||||
Net investment income (loss) (excluding net deferred income tax benefit (expense)) | 0.72 | % (d) | 0.47 | %(d)(e) | (0.98 | %)(d)(e) | (1.21 | %)(e) | (0.65 | %)(e) | ||||||||||
Net expenses (including net deferred income tax (benefit) expense) (f) | 2.31 | % (d) | 2.35 | %(d)(e) | 2.59 | % (d)(e) | 2.23 | % (e) | 3.04 | % (e) | ||||||||||
Expenses (before waiver/reimbursement, including net deferred income tax (benefit) expense) (f) | 2.53 | % (d) | 2.73 | %(d)(e) | 2.85 | % (d)(e) | 2.38 | % (e) | 4.55 | % (e) | ||||||||||
Portfolio turnover rate | 51 | % | 64 | % | 95 | % | 27 | % | 62 | % | ||||||||||
Net assets at end of year (in 000’s) | $ | 12,644 | $ | 19,075 | $ | 25,053 | $ | 48,574 | $ | 8,379 | ||||||||||
| ** | This year was audited by a predecessor audit firm whose opinion was unqualified. |
| ‡ | Less than one cent per share. |
| (a) | Per share data based on average shares outstanding during the period. |
| (b) | Redemption fees were only applicable prior to reorganization. |
| (c) | Total investment return is calculated exclusive of sales charges and assumes the reinvestment of dividends and distributions. |
| For periods of less than one year, total return is not annualized. |
| (d) | Ratios including/excluding net deferred income tax benefit (expense) includes applicable franchise tax expense for the period. |
| For the year ended November 30, 2017, the Fund received a franchise tax refund in the amount of $(10,487), of which $(2,338) is attributable to Class C. |
| For the year ended November 30, 2016, the Fund accrued $(55,919) in franchise tax expense, of which $(13,411) is attributable to Class C. |
| For the year ended November 30, 2015, the Fund accrued $109,516 in franchise tax expense, of which $26,603 is attributable to Class C. |
| (e) | For the year ended November 30, 2016, the Fund accrued $13,006 in net current tax expense, of which $3,142 is attributable to Class C. |
| For the year ended November 30, 2015, the Fund received a tax refund in the amount of $6,000, of which $1,344 is attributable to Class C. |
| For the year ended November 30, 2014, the Fund accrued $65,316 in net current and deferred income tax benefit, of which $62,248 is attributable to Class C. |
| For the year ended November 30, 2013, the Fund accrued $71,348 in net current and deferred income tax expense, of which $10,203 is attributable to Class C. |
| (f) | The ratio of expenses excluding net current and deferred income tax benefit to average net assets before waiver was 2.54%, 2.79%, 2.79%, 2.66% and 4.26% for the fiscal years ended November 30, 2017, 2016, 2015, 2014 and 2013, respectively. The ratio of expenses excluding deferred income tax benefit to average net assets after waiver was 2.32%, 2.41%, 2.53%, 2.51% and 2.75% for the fiscal years ended November 30, 2017, 2016, 2015, 2014 and 2013, respectively. |
| 48 | MainStay Cushing Energy Income Fund | The notes to the financial statements are an integral part of, and should be read in conjunction with, the financial statements. |
Financial Highlights selected per share data and ratios
| Year ended November 30, | ||||||||||||||||||||
| Class I | 2017 | 2016 | 2015 | 2014 | 2013** | |||||||||||||||
Net asset value at beginning of year | $ | 4.67 | $ | 5.01 | $ | 13.08 | $ | 18.30 | $ | 19.60 | ||||||||||
|
|
|
|
|
|
|
|
|
| |||||||||||
Net investment income (loss) (a) | 0.09 | 0.06 | (0.00 | )‡ | (0.02 | ) | 0.08 | |||||||||||||
Net realized and unrealized gain (loss) on investments | (0.22 | ) | (0.04 | ) | (7.27 | ) | (3.60 | ) | 0.22 | |||||||||||
|
|
|
|
|
|
|
|
|
| |||||||||||
Total from investment operations | (0.13 | ) | 0.02 | (7.27 | ) | (3.62 | ) | 0.30 | ||||||||||||
|
|
|
|
|
|
|
|
|
| |||||||||||
| Less dividends and distributions: | ||||||||||||||||||||
From net investment income | — | (0.02 | ) | — | — | — | ||||||||||||||
From return of capital | (0.21 | ) | (0.34 | ) | (0.80 | ) | (1.60 | ) | (1.60 | ) | ||||||||||
|
|
|
|
|
|
|
|
|
| |||||||||||
Total dividends and distributions | (0.21 | ) | (0.36 | ) | (0.80 | ) | (1.60 | ) | (1.60 | ) | ||||||||||
|
|
|
|
|
|
|
|
|
| |||||||||||
Net asset value at end of year | $ | 4.33 | $ | 4.67 | $ | 5.01 | $ | 13.08 | $ | 18.30 | ||||||||||
|
|
|
|
|
|
|
|
|
| |||||||||||
Total investment return (b) | (2.69 | %) | 2.54 | % | (57.47 | %) | (21.92 | %) | 1.49 | % | ||||||||||
| Ratios (to average net assets)/Supplemental Data: | ||||||||||||||||||||
Net investment income (loss) (including net deferred income tax benefit (expense)) | 2.03 | % (c) | 1.53 | %(c)(d) | (0.03 | %)(c)(d) | 4.33 | % (d) | 0.06 | %(d) | ||||||||||
Net investment income (loss) (excluding net deferred income tax benefit (expense)) | 2.02 | % (c) | 1.47 | %(c)(d) | 0.02 | % (c)(d) | (0.01 | %)(d) | 0.35 | %(d) | ||||||||||
Net expenses (including net deferred income tax (benefit) expense) (e) | 1.19 | % (c) | 1.23 | %(c)(d) | 1.54 | % (c)(d) | (2.94 | %)(d) | 2.04 | %(d) | ||||||||||
Expenses (before waiver/reimbursement, including net deferred income tax (benefit) expense) (e) | 1.41 | % (c) | 1.62 | %(c)(d) | 1.76 | % (c)(d) | (2.83 | %)(d) | 3.55 | %(d) | ||||||||||
Portfolio turnover rate | 51 | % | 64 | % | 95 | % | 27 | % | 62 | % | ||||||||||
Net assets at end of year (in 000’s) | $ | 10,904 | $ | 17,831 | $ | 26,161 | $ | 94,975 | $ | 1,667 | ||||||||||
| ** | This year was audited by a predecessor audit firm whose opinion was unqualified. |
| ‡ | Less than one cent per share. |
| (a) | Per share data based on average shares outstanding during the period. |
| (b) | Total investment return is calculated exclusive of sales charges and assumes the reinvestment of dividends and distributions. Class I shares are not subject to sales charges. For periods of less than one year, total return is not annualized. |
| (c) | Ratios including/excluding net deferred income tax benefit (expense) includes applicable franchise tax expense for the period. |
| For the year ended November 30, 2017, the Fund received a franchise tax refund in the amount of $(10,487), of which $(2,001) is attributable to Class I. |
| For the year ended November 30, 2016, the Fund accrued $(55,919) in franchise tax expense, of which $(10,831) is attributable to Class I. |
| For the year ended November 30, 2015, the Fund accrued $109,516 in franchise tax expense, of which $28,819 is attributable to Class I. |
| (d) | For the year ended November 30, 2016, the Fund accrued $13,006 in net current tax expense, of which $2,455 is attributable to Class I. |
| For the year ended November 30, 2015, the Fund received a tax refund in the amount of $6,000, of which $1,813 is attributable to Class I. |
| For the year ended November 30, 2014, the Fund accrued $65,316 in net current and deferred income tax benefit, of which $972,765 is attributable to Class I. |
| For the year ended November 30, 2013, the Fund accrued $71,348 in net current and deferred income tax expense, of which $2,635 is attributable to Class I. |
| (e) | The ratio of expenses excluding net current and deferred income tax benefit to average net assets before waiver was 1.42%, 1.68%, 1.71%, 1.52% and 3.26% for the fiscal years ended November 30, 2017, 2016, 2015, 2014 and 2013, respectively. The ratio of expenses excluding deferred income tax benefit to average net assets after waiver was 1.20%, 1.29%, 1.48%, 1.41% and 1.75% for the fiscal years ended November 30, 2017, 2016, 2015, 2014 and 2013, respectively. |
| The notes to the financial statements are an integral part of, and should be read in conjunction with, the financial statements. | 49 |
Note 1–Organization and Business
MainStay Funds Trust (the “Trust”) was organized as a Delaware statutory trust on April 28, 2009 and is governed by a Declaration of Trust. The Trust is registered under the Investment Company Act of 1940, as amended (the “1940 Act”), as an open-end management investment company, and is comprised of thirty-seven funds (collectively referred to as the “Funds” and each individually, referred to as a “Fund”). These financial statements and notes relate to the MainStay Cushing MLP Premier Fund, MainStay Cushing Renaissance Advantage Fund and MainStay Cushing Energy Income Fund (collectively referred to as the “MainStay Cushing Funds” and each individually referred to as a “MainStay Cushing Fund”), each a “non diversified” portfolio, as that term is defined in the 1940 Act, as interpreted or modified by regulatory authorities having jurisdiction, from time to time. Each MainStay Cushing Fund is the successor to the corresponding series of The Cushing® Funds Trust (collectively referred to as the “Predecessor Funds” and each individually referred to as a “Predecessor Fund”), for which Cushing® Asset Management, LP, a Texas limited partnership and the MainStay Cushing Funds’ Subadvisor (as defined in Note 3(A)), served as investment adviser. The financial statements of the MainStay Cushing Funds reflect the historical results of the Predecessor Funds prior to their reorganization on July 11, 2014. Upon the completion of the reorganizations, Class A, Class C and Class I shares of each MainStay Cushing Fund assumed the performance, financial and other information of the Predecessor Funds. All information and references to periods prior to July 11, 2014 refer to the Predecessor Funds.
The MainStay Cushing MLP Premier Fund currently has six classes of shares registered for sale. Class A, Class C and Class I shares commenced operations on October 20, 2010. Investor Class shares commenced operations on July 11, 2014. The investment objective is to seek current income and capital appreciation. In seeking current income, the Fund intends to pay current cash distributions to shareholders, regardless of the character of such distributions for tax or accounting purposes. Class T shares of the Fund were registered for sale as of February 28, 2017. Class R6 shares of the Fund were registered for sale effective as of March 31, 2017. As of November 30, 2017, Class R6 and Class T shares were not yet offered for sale.
The MainStay Cushing Renaissance Advantage Fund currently has six classes of shares registered for sale. Class A, Class C and Class I shares commenced operations on April 2, 2013. Investor Class shares commenced operations on July 11, 2014. The investment objective is to seek total return. Class T shares of the Fund were registered for sale as of February 28, 2017. Class R6 shares of the Fund were registered for sale effective as of March 31, 2017. As of November 30, 2017, Class R6 and Class T shares were not yet offered for sale.
The MainStay Cushing Energy Income Fund currently has six classes of shares registered for sale. Class A, Class C and Class I shares commenced operations on July 2, 2012. Investor Class shares commenced operations on July 11, 2014. The investment objective is to seek current income and capital appreciation. Class T shares of the Fund were registered for sale as of February 28, 2017. Class R6 shares of the Fund were registered for sale effective as of March 31, 2017. As of November 30, 2017, Class R6 and Class T shares were not yet offered for sale.
Class A and Investor Class shares are offered at net asset value (“NAV”) per share plus an initial sales charge. No initial sales charge applies to investments of $1 million or more (and certain other qualified purchases) in Class A and Investor Class shares. Effective August 1, 2017, a contingent deferred sales charge (“CDSC”) of 1.00% may be imposed on certain redemptions of Class A and Investor Class shares made within 18 months of the date of purchase on shares that were purchased without an initial sales charge. For purchases of Class A and Investor Class shares made from January 1, 2017, through July 31, 2017, a CDSC of 1.00% may be imposed on certain redemptions of such shares made within 24 months of the date of purchase on shares that were purchased without an initial sales charge. For purchases of Class A and Investor Class shares made prior to January 1, 2017, a CDSC of 1.00% may be imposed on certain redemptions of such shares made within one year of the date of purchase on shares that were purchased without an initial sales charge. Class C shares are offered at NAV without an initial sales charge, although a 1.00% CDSC may be imposed on certain redemptions of such shares made within one year of the date of purchase of Class C shares. Class T shares are currently expected to be offered at NAV per share plus an initial sales charge. Class I shares are offered at NAV and are not subject to a sales charge. Class R6 shares are currently expected to be offered at NAV and to not be subject to a sales charge. As disclosed in the MainStay Cushing Funds’ prospectus, Class A shares may convert automatically to Investor Class shares and Investor Class shares may convert automatically to Class A shares. Under certain circumstances and as may be permitted by the Trust’s multiple class plan pursuant to Rule 18f-3 under the 1940 Act, specified share classes of a MainStay Cushing Fund may be converted to one or more other share classes of the MainStay Cushing Fund as disclosed in the capital share transactions in these Notes. The classes of shares have the same voting (except for issues that relate solely to one class), dividend, liquidation and other rights, and the same terms and conditions, except that, under a distribution plan pursuant to Rule 12b-1 under the 1940 Act, Class C shares are subject to higher distribution and/or service fees than Class A, Investor Class and Class T shares. Class I and Class R6 shares are not subject to a distribution and/or service fee.
Note 2–Significant Accounting Policies
The MainStay Cushing Funds are investment companies and accordingly follow the investment company accounting and reporting guidance of the Financial Accounting Standards Board (“FASB”) Accounting Standard Codification Topic 946 Financial Services – Investment Companies. The MainStay Cushing Funds prepare their financial statements in accordance with generally accepted accounting principles in the United States (“GAAP”) and follow the significant accounting policies described below.
(A) Securities Valuation. Investments are usually valued as of the close of regular trading on the New York Stock Exchange (the “Exchange”) (usually 4:00 p.m. Eastern time) on each day the MainStay Cushing Funds are open for business (“valuation date”).
The Board of Trustees of the Trust (the “Board”) adopted procedures establishing methodologies for the valuation of each MainStay Cushing Fund’s securities and other assets and delegated the responsibility for valuation determinations under those procedures to the Valuation
| 50 | MainStay Cushing Funds |
Committee of the Trust (the “Valuation Committee”). The Board authorized the Valuation Committee to appoint a Valuation Subcommittee (the “Subcommittee”) to deal in the first instance with establishing the prices of securities for which market quotations are not readily available or the prices of which are not otherwise readily determinable under these procedures. The Subcommittee meets (in person, via electronic mail or via teleconference) on an as-needed basis. Subsequently, the Valuation Committee meets to ensure that actions taken by the Subcommittee were appropriate. The procedures state that, subject to the oversight of the Board and unless otherwise noted, the responsibility for the day-to-day valuation of portfolio assets (including fair value measurements for the MainStay Cushing Funds’ assets and liabilities) rests with New York Life Investment Management LLC (“New York Life Investments” or the “Manager”), aided to whatever extent necessary by the Subadvisor (as defined in Note 3(A)).
To assess the appropriateness of security valuations, the Manager, Subadvisor, or the MainStay Cushing Funds’ third party service provider, who is subject to oversight by the Manager, regularly compares prior day prices, prices on comparable securities, and the sale prices to the prior and current day prices and challenges prices with changes exceeding certain tolerance levels with third party pricing services or broker sources. For those securities valued through either a standardized fair valuation methodology or a fair valuation measurement, the Subcommittee deals in the first instance with such valuation and the Valuation Committee reviews and affirms, if appropriate, the reasonableness of the valuation based on such methodologies and measurements on a regular basis after considering information that is reasonably available and deemed relevant by the Valuation Committee. Any action taken by the Subcommittee with respect to the valuation of a portfolio security or other asset is submitted for review and ratification (if appropriate) to the Valuation Committee and the Board at the next regularly scheduled meeting.
“Fair value” is defined as the price a MainStay Cushing Fund would reasonably expect to receive upon selling an asset or liability in an orderly transaction to an independent buyer in the principal or most advantageous market for the asset or liability. Fair value measurements are determined within a framework that establishes a three-tier hierarchy which maximizes the use of observable market data and minimizes the use of unobservable inputs to establish a classification of fair value measurements for disclosure purposes. “Inputs” refer broadly to the assumptions that market participants would use in pricing the asset or liability, including assumptions about risk, such as the risk inherent in a particular valuation technique used to measure fair value using a pricing model and/or the risk inherent in the inputs for the valuation technique. Inputs may be observable or unobservable. Observable inputs reflect the assumptions market participants would use in pricing the asset or liability based on market data obtained from sources independent of each MainStay Cushing Fund. Unobservable inputs reflect each MainStay Cushing Fund’s own assumptions about the assumptions market participants would use in pricing the asset or liability based on the information available. The inputs or methodology used for valuing assets or liabilities may not be an indication of the risks associated with investing in those assets or liabilities. The three-tier hierarchy of inputs is summarized below.
| • | Level 1—quoted prices in active markets for an identical asset or liability |
| • | Level 2—other significant observable inputs (including quoted prices for a similar asset or liability in active markets, interest rates and yield curves, prepayment speeds, credit risk, etc.) |
| • | Level 3—significant unobservable inputs (including each MainStay Cushing Fund’s own assumptions about the assumptions that market participants would use in measuring fair value of an asset or liability) |
The level of an asset or liability within the fair value hierarchy is based on the lowest level of an input, both individually and in the aggregate, that is significant to the fair value measurement. As of November 30, 2017, the aggregate value by input level of each MainStay Cushing Fund’s assets and liabilities is included at the end of each MainStay Cushing Fund’s Portfolio of Investments.
The MainStay Cushing Funds may use third party vendor evaluations, whose prices may be derived from one or more of the following standard inputs, among others:
• Benchmark Yields | • Reported Trades | |
• Broker/Dealer Quotes | • Issuer Spreads | |
• Two-sided markets | • Benchmark securities | |
• Bids/Offers | • Reference Data (corporate actions or material event notices) | |
• Industry and economic events | • Monthly payment information | |
• Comparable bonds |
An asset or liability for which market values cannot be measured using the methodologies described above is valued by methods deemed reasonable in good faith by the Valuation Committee, following the procedures established by the Board, to represent fair value. Under these procedures, the MainStay Cushing Funds generally use a market-based approach which may use related or comparable assets or liabilities, recent transactions, market multiples, book values, and other relevant information. The MainStay Cushing Funds may also use an income-based valuation approach in which the anticipated future cash flows of the asset or liability are discounted to calculate fair value. Discounts may also be applied due to the nature and/or duration of any restrictions on the disposition of the asset or liability. Fair value represents a good faith approximation of the value of a security. Fair value determinations involve the consideration of a number of subjective factors, an analysis of applicable facts and circumstances and the exercise of judgment. As a result, it is possible that the fair value for a security determined in good faith in accordance with the MainStay Cushing Funds’ valuation procedures may differ from valuations for the same security determined by other funds using their own valuation procedures. Although the MainStay Cushing Funds’ valuation procedures are designed to value a security at the price a MainStay Cushing Fund may reasonably expect to receive upon its sale in an orderly transaction, there can be no assurance that any fair value determination thereunder would, in fact, approximate the amount that a MainStay Cushing Fund would actually realize upon the sale of the security or the price at which the security would trade if a reliable market price were readily available. For the year ended November 30, 2017, there were no material changes to the fair value methodologies.
Certain securities held by the MainStay Cushing Funds may principally trade in foreign markets. Events may occur between the time the foreign
| 51 |
Notes to Financial Statements (continued)
markets close and the time at which the MainStay Cushing Funds’ NAVs are calculated. These events may include, but are not limited to, situations relating to a single issuer in a market sector, significant fluctuations in U.S. or foreign markets, natural disasters, armed conflicts, governmental actions or other developments not tied directly to the securities markets. Should the Manager or Subadvisor conclude that such events may have affected the accuracy of the last price of such securities reported on the local foreign market, the Sub-Committee may, pursuant to procedures adopted by the Board, adjust the value of the local price to reflect the estimated impact on the price of such securities as a result of such events. In this instance, securities are generally categorized as Level 3 in the hierarchy. Additionally, certain foreign equity securities are also fair valued whenever the movement of a particular index exceeds certain thresholds. In such cases, the securities are fair valued by applying factors provided by a third party vendor in accordance with valuation procedures adopted by the Board and are generally categorized as Level 2 in the hierarchy. As of November 30, 2017, securities that were fair valued in such a manner are shown in the applicable MainStay Cushing Fund’s Portfolio of Investments.
Equity and non-equity securities which may be valued in this manner include, but are not limited to: (i) a security for which trading has been halted or suspended; (ii) a debt security that has recently gone into default and for which there is not a current market quotation; (iii) a security of an issuer that has entered into a restructuring; (iv) a security that has been de-listed from a national exchange; (v) a security for which the market price is not readily available from a third party pricing source or, if so provided, does not, in the opinion of the Manager or Subadvisor reflect the security’s market value; (vi) a security subject to trading collars for which no or limited trading takes place; and (vii) a security whose principal market has been temporarily closed at a time when, under normal conditions, it would be open. Securities for which market quotations or observable inputs are not readily available are generally categorized as Level 3 in the hierarchy. As of November 30, 2017, the MainStay Cushing Funds did not hold any securities that were fair valued in such a manner.
Equity securities and shares of exchange-traded funds are valued at the last quoted sales prices as of the close of regular trading on the relevant exchange on each valuation date. Securities that are not traded on the valuation date are valued at the mean of the last quoted bid and ask prices. Prices are normally taken from the principal market in which each security trades. Investments in mutual funds, including money market funds, are valued at their respective NAVs as of the close of the Exchange on the valuation date. The amortized cost method involves valuing a security at its cost on the date of purchase and thereafter assuming a constant amortization to maturity of the difference between such cost and the value on maturity date. Amortized cost approximates the current fair value of a security. Securities valued at amortized cost are not valued using quoted prices in an active market and are generally categorized as Level 2 in the hierarchy.
Debt securities (other than convertible and municipal bonds) are valued at the evaluated bid prices (evaluated mean prices in the case of convertible and municipal bonds) supplied by a pricing agent or broker selected by the Manager, in consultation with the Subadvisor. Those values reflect broker/dealer supplied prices and electronic data processing techniques, if the evaluated bid or mean prices are deemed
by the Manager, in consultation with the Subadvisor, to be representative of market values, at the regular close of trading of the Exchange on each valuation date. Debt securities purchased on a delayed delivery basis are marked to market daily until settlement at the forward settlement date. Debt securities, including corporate bonds, U.S. government & federal agency bonds, municipal bonds, foreign bonds, convertible bonds, asset-backed securities and mortgage-backed securities are generally categorized as Level 2 in the hierarchy.
Temporary cash investments acquired in excess of 60 days to maturity at the time of purchase are valued using the latest bid prices or using valuations based on a matrix system (which considers such factors as security prices, yields, maturities, and ratings), both as furnished by independent pricing services. Other temporary cash investments which mature in 60 days or less at the time of purchase (“Short-Term Investments”) are valued using the amortized cost method of valuation, unless the use of such method would be inappropriate. The amortized cost method involves valuing a security at its cost on the date of purchase and thereafter assuming a constant amortization to maturity of the difference between such cost and the value on maturity date. Amortized cost approximates the current fair value of a security. These securities are generally categorized as Level 2 in the hierarchy.
The information above is not intended to reflect an exhaustive list of the methodologies that may be used to value portfolio investments. The valuation procedures permit the use of a variety of valuation methodologies in connection with valuing portfolio investments. The methodology used for a specific type of investment may vary based on the market data available or other considerations. The methodologies summarized above may not represent the specific means by which portfolio investments are valued on any particular business day.
A MainStay Cushing Fund security or other asset may be determined to be illiquid under procedures approved by the Board. Illiquidity of a security might prevent the sale of such security at a time when the Manager or Subadvisor might wish to sell, and these securities could have the effect of decreasing the overall level of a MainStay Cushing Fund’s liquidity. Further, the lack of an established secondary market may make it more difficult to value illiquid securities, requiring a MainStay Cushing Fund to rely on judgments that may be somewhat subjective in measuring value, which could vary materially from the amount that a MainStay Cushing Fund could realize upon disposition. Difficulty in selling illiquid securities may result in a loss or may be costly to a MainStay Cushing Fund. Under the supervision of the Board, the Manager or Subadvisor determine the liquidity of a MainStay Cushing Fund’s investments; in doing so, the Manager or Subadvisor may consider various factors, including (i) the frequency of trades and quotations, (ii) the number of dealers and prospective purchasers, (iii) dealer undertakings to make a market, and (iv) the nature of the security and the market in which it trades (e.g., the time needed to dispose of the security, the method of soliciting offers and the mechanics of transfer). Illiquid securities are often valued in accordance with methods deemed by the Board in good faith to be reasonable and appropriate to accurately reflect their fair value. The liquidity of each MainStay Cushing Fund’s investments, as shown in their respective Portfolio of Investments, was determined as of November 30, 2017 and can change at any time in response to, among other relevant factors, market conditions or events or developments with respect to an individual issuer or
| 52 | MainStay Cushing Funds |
instrument. As of November 30, 2017, securities deemed to be illiquid under procedures approved by the Board are shown in the applicable MainStay Cushing Fund’s Portfolio of Investments.
(B) Income Taxes. The MainStay Cushing MLP Premier Fund is taxed as a C-corporation and is subject to federal and state income tax on its taxable income. As of November 30, 2017, the maximum marginal regular federal income tax rate for a corporation is 35%. The MainStay Cushing MLP Premier Fund may be subject to a 20% federal alternative minimum tax on its federal alternative minimum taxable income to the extent that its alternative minimum tax liability exceeds its regular federal income tax liability.
The MainStay Cushing MLP Premier Fund invests its assets principally in the equity securities of master limited partnerships (“MLPs”), which generally are treated as partnerships for federal income tax purposes. As a limited partner in MLPs, The MainStay Cushing MLP Premier Fund includes its allocable share of each MLP’s taxable income in computing its own taxable income.
The MainStay Cushing MLP Premier Fund’s tax expense or benefit is included in the Statement of Operations based on the component of income or gains (losses) to which such expense or benefit relates. Deferred income taxes reflect the net tax effects of temporary differences between the carrying amounts of assets and liabilities for financial reporting purposes and the amounts used for income tax purposes. A deferred income tax liability balance will be accrued at the effective federal corporate income tax rate (35% through December 22, 2017) plus an estimated state and local income tax rate for any future tax liability associated capital appreciation of MLP investments and distributions received on MLP investments considered to be a return of capital as well as for any net operating income or gains. A deferred income tax asset balance may also be accrued, which reflects an estimate of future tax benefits associated with net operating losses and/or unrealized losses. A valuation allowance is recognized if, based on the weight of available evidence, it is more likely than not that some portion or all of any deferred income tax asset will not be realized. The factors considered in assessing whether a valuation allowance is recognized include the nature, frequency and magnitude of current and cumulative losses, the duration of the statutory carryforward periods as well as the associated risks that operating and capital loss carryforwards may expire unused. As new information becomes available, the MainStay Cushing MLP Premier Fund may periodically modify its estimates and assumptions regarding its deferred income tax liability or deferred income tax asset balances.
The MainStay Cushing Renaissance Advantage Fund’s policy is to comply with the requirements of the Internal Revenue Code applicable to RICs and to distribute all of the taxable income to the shareholders of the Fund within the allowable time limits. Therefore, no federal, state, and local income tax provisions are required.
The MainStay Cushing Energy Income Fund invests its assets in a portfolio of energy companies involved in exploring, developing, producing, transporting, gathering and processing, storing, refining, distributing, mining or marketing natural gas, natural gas liquids (including propane), crude oil, refined products or coal. The MainStay Cushing Energy Income Fund has elected to be treated as a regulated investment company (“RIC”) under Subchapter M of the Internal Revenue Code of 1986, as amended (the “Internal Revenue Code”).
Consistent with that intention, the MainStay Cushing Energy Income Fund intends to invest no more than 25% of its total assets in securities of energy MLPs.
The MainStay Cushing Energy Income Fund also intends to comply with the requirements of the Internal Revenue Code applicable to RICs, and to distribute all of its taxable income to its shareholders within allowable time limits. Since the MainStay Cushing Energy Income Fund has elected to be subject to tax as a RIC, effective with its fiscal and taxable year ended November 30, 2016, no federal, state and local income tax provisions are required.
Management evaluates each MainStay Cushing Fund’s tax positions to determine if the tax positions taken meet the minimum recognition threshold in connection with accounting for uncertainties in income tax positions taken or expected to be taken for the purposes of measuring and recognizing tax liabilities in the financial statements. Recognition of tax benefits of an uncertain tax position is required only when the position is “more likely than not” to be sustained assuming examination by taxing authorities. Management has analyzed the MainStay Cushing Funds’ tax positions taken on federal, state and local income tax returns for all open tax years. Management has concluded that no provisions for federal, state and local income tax are required in the MainStay Cushing Renaissance Advantage Fund and the MainStay Cushing Energy Income Fund’s financial statements. Management has concluded that provisions for federal, state and local income tax are required to be included in the financial statements for the MainStay Cushing MLP Premier Fund which is taxed as a corporation and is subject to federal and state income tax on its taxable income. The MainStay Cushing Funds’ federal, state and local income and federal excise tax returns for tax years for which the applicable statutes of limitations have not expired are subject to examination by the Internal Revenue Service (“IRS”) and state and local departments of revenue.
(C) Dividends and Distributions to Shareholders. Dividends and distributions are recorded on the ex-dividend date. The MainStay Cushing MLP Premier Fund intends to declare and pay distributions, if any, at least monthly. On a book basis, all realized capital gains net of applicable taxes will be retained by the MainStay Cushing MLP Premier Fund. The MainStay Renaissance Advantage Fund and the MainStay Cushing Energy Income Fund intend to declare and pay distributions from net investment income quarterly and from net capital gains, if any, annually. Unless the shareholder elects otherwise, all dividends and distributions are reinvested in the same class of shares of the respective MainStay Cushing Fund, at NAV. Dividends and distributions to shareholders are determined in accordance with federal income tax regulations and may differ from GAAP.
(D) Security Transactions and Investment Income. The MainStay Cushing Funds record security transactions on the trade date. Realized gains and losses on security transactions are determined using the identified cost method. Dividend income is recognized on the ex-dividend date, net of any foreign tax withheld at the source, and interest income is accrued as earned using the effective interest rate method. Discounts and premiums on Short-Term Investments are accreted and amortized, respectively, on the straight-line method. The straight-line method approximates the effective interest method for Short-Term Investments. Income from payment-in-kind securities is accreted daily based on the effective interest method of accrual. Distributions from
| 53 |
Notes to Financial Statements (continued)
MLPs are generally recorded based on the characterization reported on the MainStay Cushing Fund’s IRS Form 1065, Schedule K-1, received from each MLP. The MainStay Cushing Funds record their pro rata share of the income and deductions, and capital gains and losses allocated from each MLP, as well as adjusting the cost basis of each MLP accordingly.
Distributions received from each of the MainStay Cushing Fund’s investments in energy related U.S. royalty trusts and Canadian royalty trusts and exploration and production companies (collectively, “Energy Trusts”) and MLPs generally are comprised of ordinary income, capital gains and return of capital from the Energy Trusts and MLPs. The MainStay Cushing Funds record investment income on the ex-date of the distributions. For financial statement purposes, the MainStay Cushing Funds use return of capital and income estimates to allocate the dividend income received. Each MainStay Cushing Fund estimates 100% of the distribution received from MLPs to be from return of capital unless other relevant information states otherwise. Such estimates are based on historical information available from each Energy Trust, MLP and other industry sources. These estimates may subsequently be revised based on information received from Energy Trusts or MLPs after their tax reporting periods are concluded, as the actual character of these distributions is not known until after the MainStay Cushing Funds’ fiscal year end.
Each MainStay Cushing Fund estimates the allocation of investment income and return of capital for the distributions received from MLPs within the Statements of Operations. Investment income and realized and unrealized gains and losses on investments of the MainStay Cushing Funds are allocated to separate classes of shares pro rata based upon their relative net assets on the date the income is earned or realized and unrealized gains and losses are incurred.
(E) Expenses. Expenses of the Trust are allocated to the individual MainStay Cushing Funds in proportion to the net assets of the respective MainStay Cushing Funds when the expenses are incurred, except where direct allocations of expenses can be made. Expenses (other than transfer agent expenses and fees incurred under the shareholder services plans and/or the distribution plans further discussed in Note 3(B)) are allocated to separate classes of shares pro rata based upon their relative net assets on the date the expenses are incurred. The expenses borne by the MainStay Cushing Funds, including those of related parties to the MainStay Cushing Funds, are shown in the Statement of Operations.
(F) Use of Estimates. In preparing financial statements in conformity with GAAP, management makes estimates and assumptions that affect the reported amounts and disclosures in the financial statements. Actual results could differ from those estimates.
(G) Concentration of Risk. The MainStay Cushing MLP Premier Fund, under normal market conditions, invests at least 80% of its assets (net assets plus any borrowings for investment purposes) in a portfolio of MLPs and MLP-related investments. Under normal market conditions, the MainStay Cushing Renaissance Advantage Fund invests at least 80% of its assets (net assets plus any borrowings for investment purposes) in a portfolio of (i) companies across the energy supply chain spectrum, including upstream, midstream and downstream energy companies, as well as oil and gas services companies, (ii) energy-intensive chemical,
metal and industrial and manufacturing companies and engineering and construction companies that the Subadvisor expects to benefit from growing energy production and lower feedstock costs relative to global costs and, (iii) transportation and logistics companies providing solutions to the U.S. manufacturing industry. Under normal market conditions, the MainStay Cushing Energy Income Fund invests at least 80% of its assets (net assets plus any borrowings for investment purposes) in a portfolio of energy companies involved in exploring, developing, producing, transporting, gathering and processing, storing, refining, distributing, mining or marketing natural gas, natural gas liquids (including propane), crude oil, refined products or coal. Therefore the MainStay Cushing Funds may be subject to more risks than if they were more broadly diversified over numerous industries and sectors of the economy. General changes in market sentiment towards companies in the sectors in which they invest may adversely affect the MainStay Cushing Funds, and the performance of such sectors may lag behind the broader market as a whole.
The MainStay Cushing Funds are also subject to MLP structure risk. Holders of MLP units are subject to certain risks inherent in the structure of MLPs, including (i) tax risks, (ii) the limited ability to elect or remove management or the general partner or managing member, (iii) limited voting rights, except with respect to extraordinary transactions, and (iv) conflicts of interest between the general partner or managing member and its affiliates, on the one hand, and the limited partners or members, on the other hand, including those arising from incentive distribution payments or corporate opportunities.
(H) Indemnifications. Under the Trust’s organizational documents, its officers and trustees are indemnified against certain liabilities that may arise out of performance of their duties to the Trust. Additionally, in the normal course of business, the MainStay Cushing Funds enter into contracts with third-party service providers that contain a variety of representations and warranties and which may provide general indemnifications. The MainStay Cushing Funds’ maximum exposure under these arrangements is unknown, as this would involve future claims that may be made against the MainStay Cushing Funds that have not yet occurred. Based on experience, management is of the view that the risk of loss in connection with these potential indemnification obligations is remote. However, there can be no assurance that material liabilities related to such obligations will not arise in the future, which could adversely impact the MainStay Cushing Funds.
Note 3–Fees and Related Party Transactions
(A) Manager and Subadvisor. New York Life Investments, a registered investment adviser and an indirect, wholly-owned subsidiary of New York Life Insurance Company (“New York Life”), serves as the MainStay Cushing Funds’ Manager, pursuant to an Amended and Restated Management Agreement, (“Management Agreement”). The Manager provides offices, conducts clerical, recordkeeping and bookkeeping services, and keeps most of the financial and accounting records required to be maintained by the MainStay Cushing Funds. Except for the portion of salaries and expenses that are the responsibility of the MainStay Cushing Funds, the Manager pays the salaries and expenses of all personnel affiliated with the MainStay Cushing Funds and certain operational expenses of the MainStay Cushing Funds. The MainStay Cushing Funds reimburse New York Life Investments in an amount equal to a portion of the compensation of the Chief Compliance
| 54 | MainStay Cushing Funds |
Officer attributable to the MainStay Cushing Funds. Cushing® Asset Management, LP (“Cushing® Asset Management” or the “Subadvisor”), a registered investment adviser, serves as Subadvisor to the MainStay Cushing Funds and is responsible for the day-to-day portfolio management of the MainStay Cushing Funds. Pursuant to the terms of a Subadvisory Agreement (“Subadvisory Agreement”) between New York Life Investments and Cushing® Asset Management, New York Life Investments pays for the services of the Subadvisor.
Under the Management Agreement, the MainStay Cushing MLP Premier Fund pays the Manager a monthly fee for services performed and facilities furnished at an annual rate of the Fund’s average daily net assets as follows: 1.10% up to $3 billion and 1.05% over $3 billion.
Under the Management Agreement, the MainStay Cushing Renaissance Advantage Fund pays the Manager a monthly fee for services performed and facilities furnished at an annual rate of Fund’s average daily net assets as follows: 1.20% up to $500 million and 1.15% over $500 million.
Under the Management Agreement, the MainStay Cushing Energy Income Fund pays the Manager a monthly fee for services performed and facilities furnished at an annual rate of 0.95% of the Fund’s average daily net assets.
MainStay Cushing Renaissance Advantage Fund
New York Life Investments has contractually agreed to waive a portion of the MainStay Cushing Renaissance Advantage Fund’s management fees and/or reimburse expenses so that Total Annual Fund Operating Expenses (excluding taxes, interest, litigation, extraordinary expenses, brokerage and other transaction expenses relating to the purchase or sale of portfolio investments and acquired (underlying) fund fees and expenses) for Class A shares do not exceed 1.61% of its average daily net assets. New York Life Investments will apply an equivalent waiver or reimbursement, in an equal number of basis points, to the other share classes. This agreement will remain in effect until March 31, 2018 unless extended by New York Life Investments and approved by the Board.
MainStay Cushing Energy Income Fund
New York Life Investments has contractually agreed to waive a portion of the MainStay Cushing Energy Income Fund’s management fees and/or reimburse expenses so that Total Annual Fund Operating Expenses (excluding taxes, deferred income tax expenses, interest, litigation, extraordinary expenses, brokerage and other transaction expenses relating to the purchase or sale of portfolio investments and acquired (underlying) fund fees and expenses) for Class A shares do not exceed 1.45% of its average daily net assets. New York Life Investments will apply an equivalent waiver or reimbursement, in an equal number of basis points, to the other share classes. This agreement will remain in effect until March 31, 2018 unless extended by New York Life Investments and approved by the Board.
For the year ended November 30, 2017, New York Life Investments earned fees from the MainStay Cushing Funds and waived its fees and/or reimbursed expenses as follows:
| Fees Earned | Fees Reimbursed | |||||||
MainStay Cushing MLP Premier Fund | $ | 15,510,492 | $ | — | ||||
MainStay Cushing Renaissance Advantage Fund | 2,501,879 | — | ||||||
MainStay Cushing Energy Income Fund | 667,123 | 152,260 | ||||||
U.S. Bancorp Fund Services, LLC (“U.S. Bancorp”) provides sub-administration and sub-accounting services to the MainStay Cushing Funds pursuant to an agreement with New York Life Investments. These services include calculating the daily NAVs of the MainStay Cushing Funds, maintaining the general ledger and sub-ledger accounts for the calculation of the MainStay Cushing Funds’ respective NAVs, and assisting New York Life Investments in conducting various aspects of the MainStay Cushing Funds’ administrative operations. For providing these services to the MainStay Cushing Funds, U.S. Bancorp is compensated by New York Life Investments.
(B) Distribution and Service Fees. The Trust, on behalf of the MainStay Cushing Funds, has entered into a distribution agreement with NYLIFE Distributors LLC (the ‘‘Distributor’’), an indirect, wholly-owned subsidiary of New York Life. The MainStay Cushing Funds have adopted a distribution plan (the ‘‘Plan’’) in accordance with the provisions of Rule 12b-1 under the 1940 Act.
Pursuant to the Class A, Investor Class and Class T Plans, the Distributor receives a monthly distribution fee from the Class A, Investor Class and Class T shares, at an annual rate of 0.25% of the average daily net assets of the Class A, Investor Class and Class T shares for distribution and/or service activities as designated by the Distributor. Pursuant to the Class C Plan, Class C shares pay the Distributor a monthly distribution fee at an annual rate of 0.75% of the average daily net assets of the Class C shares, along with a service fee at an annual rate of 0.25% of the average daily net assets of the Class C shares, for a total 12b-1 fee of 1.00%. Class I and Class R6 shares are not subject to a distribution and/or service fee.
The Plans provide that the distribution and service fees are payable to the Distributor regardless of the amounts actually expended by the Distributor for distribution of the MainStay Cushing Funds’ shares and service activities.
(C) Sales Charges. The MainStay Cushing Funds were advised by the Distributor that the amounts of initial sales charges retained on sales of Class A and Investor Class shares for the year ended November 30, 2017, were as follows:
MainStay Cushing MLP Premier Fund | ||||
Class A | $ | 254,380 | ||
Investor Class | 3,374 | |||
MainStay Cushing Renaissance Advantage Fund |
| |||
Class A | $ | 15,909 | ||
Investor Class | 3,940 | |||
| 55 |
Notes to Financial Statements (continued)
MainStay Cushing Energy Income Fund |
| |||
Class A | $ | 13,674 | ||
Investor Class | 2,421 | |||
The MainStay Cushing Funds were also advised that the Distributor retained CDSCs on redemptions of Class A, Investor Class and Class C shares, for the year ended November 30, 2017, were as follows:
MainStay Cushing MLP Premier Fund |
| |||
Class A | $ | 9,526 | ||
Investor Class | — | |||
Class C | 70,774 | |||
MainStay Cushing Renaissance Advantage Fund |
| |||
Class A | $ | 1,395 | ||
Investor Class | — | |||
Class C | 2,346 | |||
MainStay Cushing Energy Income Fund |
| |||
Class A | $ | 1,439 | ||
Investor Class | — | |||
Class C | 2,410 | |||
(D) Transfer, Dividend Disbursing and Shareholder Servicing Agent. NYLIM Service Company LLC, an affiliate of New York Life Investments, is the MainStay Cushing Funds’ transfer, dividend disbursing and shareholder servicing agent pursuant to an agreement between NYLIM Service Company LLC and the Trust. NYLIM Service Company LLC has entered into an agreement with DST Asset Manager Solutions Inc., formerly known as Boston Financial Data Services, Inc. (“BFDS”) pursuant to which BFDS performs certain transfer agent services on behalf of NYLIM Service Company LLC. Transfer agent expenses incurred by the MainStay Cushing Funds’ share classes for the year ended November 30, 2017, were as follows:
MainStay Cushing MLP Premier Fund |
| |||
Class A | $ | 275,196 | ||
Investor Class | 3,447 | |||
Class C | 557,215 | |||
Class I | 491,936 | |||
MainStay Cushing Renaissance Advantage Fund |
| |||
Class A | $ | 19,716 | ||
Investor Class | 7,853 | |||
Class C | 44,709 | |||
Class I | 94,637 | |||
MainStay Cushing Energy Income Fund |
| |||
Class A | $ | 70,020 | ||
Investor Class | 10,261 | |||
Class C | 50,078 | |||
Class I | 29,404 | |||
(E) Small Account Fee. Shareholders with small accounts adversely impact the cost of providing transfer agency services. In an effort to reduce total transfer agency expenses, the MainStay Cushing Funds have implemented a small account fee on certain types of accounts. Certain shareholders with an account balance of less than $1,000 are charged an annual per account fee of $20 (assessed semi-annually), the proceeds from which offset transfer agent fees as reflected in the Statement of Operations.
Note 4–Federal Income Tax
MainStay Cushing MLP Premier Fund
As of November 30, 2017, the cost and unrealized appreciation (depreciation) of the Fund’s investment portfolio, including other financial instruments, as determined on a federal income tax basis, were as follows:
| Federal Tax Cost | Gross Unrealized Appreciation | Gross Unrealized Depreciation | Net Unrealized Appreciation/ (Depreciation) | |||||||||||||
Investments in Securities | $ | 1,043,714,488 | $ | 242,174,116 | $ | (22,608,849 | ) | $ | 219,565,267 | |||||||
Deferred income taxes reflect the net tax effect of temporary differences between the carrying amount of assets and liabilities for financial reporting and tax purposes. Components of the MainStay Cushing MLP Premier Fund deferred tax assets as of November 30, 2017, are as follows:
MainStay Cushing MLP Premier Fund |
| |||
Deferred tax assets | ||||
Federal net operating loss carryforward | $ | 78,833,155 | ||
State net operating loss carryforward | 6,822,570 | |||
Capital loss carryforward | 136,934,320 | |||
Less deferred tax liabilities | ||||
Net unrealized appreciation on investment in securities | 88,880,079 | |||
Net deferred tax asset (liability) before valuation allowance | ||||
Less: valuation allowance | 133,709,966 | |||
| Total net deferred tax asset (liability) | $ | — | ||
The MainStay Cushing MLP Premier Fund periodically reviews the recoverability of its deferred tax asset, if any, based on the weight of available evidence. When assessing the recoverability of the MainStay Cushing MLP Premier Fund’s deferred tax asset, significant weight is given to the effects of potential future realized and unrealized gains on investments, and the period over which this deferred tax asset can be realized. Unexpected significant decreases in cash distributions from the MainStay Cushing MLP Premier Fund’s MLP investments or significant declines in the fair value of its investments may change the MainStay Cushing MLP Premier Fund’s assessment regarding the recoverability of its deferred tax assets and may result in a valuation allowance. The MainStay Cushing MLP Premier Fund will continue to assess the need to record a valuation allowance in the future. If a valuation allowance is required to reduce any deferred tax asset in the future, it could have a material impact on the MainStay Cushing MLP Premier Fund’s net asset value and results of operations in the period it is recovered.
The Tax Cuts and Jobs Act of 2017 was signed on December 22, 2017 reducing the federal corporate income tax rate from 35% to 21%. As a
| 56 | MainStay Cushing Funds |
result, the Fund’s net deferred tax asset balance of $111,564,040 on December 22, 2017 was reduced to $70,689,921 which continues to be offset by a full valuation allowance. Due to the full valuation allowance, the reduction in the federal corporate income tax rate had no impact on the Fund’s net asset value per share. If the Fund’s deferred tax asset were to change to a deferred tax liability the liability would be reflected at the newly enacted corporate tax rate of 21% plus an estimated state and local income tax rate.
The MainStay Cushing MLP Premier Fund may rely, to some extent, on information provided by the MLPs, which may not necessarily be timely, to estimate taxable income allocable to MLP units held in its portfolio and to estimate its associated deferred tax benefit (liability). Such estimates are made in good faith. From time to time, as new information becomes available, the MainStay Cushing MLP Premier Fund will modify its estimates or assumptions regarding its tax benefit (liability).
The MainStay Cushing MLP Premier Fund’s net operating loss carryforward and capital loss carryforward are available to offset its future taxable income. For C-corporations, capital losses can only be used to offset capital gains and cannot be used to offset ordinary income. Capital losses of C-corporations may be carried forward for five years and, accordingly, would begin to expire as of November 30, 2020. Net operating losses of C-corporations can be carried forward for 20 years and, accordingly, would begin to expire as of November 30, 2030. The MainStay Cushing MLP Premier Fund has the following net operating loss carryover and capital loss carryover amounts:
| MainStay Cushing MLP Premier Fund | ||||||
Fiscal Year Ended Net Operating Loss | Amount | Expiration | ||||
November 30, 2010 | $ | 3,330 | November 30, 2030 | |||
| November 30, 2011 | 541,249 | November 30, 2031 | ||||
| November 30, 2012 | 9,226,669 | November 30, 2032 | ||||
| November 30, 2013 | 22,865,115 | November 30, 2033 | ||||
| November 30, 2014 | 29,334,750 | November 30, 2034 | ||||
| November 30, 2015 | 51,787,077 | November 30, 2035 | ||||
| November 30, 2016 | 21,362,379 | November 30, 2036 | ||||
| November 30, 2017 | 90,117,016 | November 30, 2037 | ||||
|
| |||||
| Total | $ | 225,237,585 | ||||
|
| |||||
Fiscal Year Ended Capital Loss | Amount | Expiration | ||||
| November 30, 2015 | $ | 42,784,840 | November 30, 2020 | |||
November 30, 2016 | 308,877,920 | November 30, 2021 | ||||
|
| |||||
| Total | $ | 351,662,760 | ||||
|
| |||||
The MainStay Cushing MLP Premier Fund’s total income tax benefit (current and deferred) differs from the amount computed by applying the federal statutory income tax rate of 35% to net investment income and realized and unrealized gains (losses) on investments before taxes for the year ended November 30, 2017, as follows:
| MainStay Cushing MLP Premier Fund | ||||
Income tax provision (benefit) at the federal statutory rate of 35% | $ | (41,990,659 | ) | |
| State income tax (benefit), net of federal benefit | (2,427,116 | ) | ||
| Permanent differences, net | (261,816 | ) | ||
| Change in valuation allowance | 44,679,591 | |||
|
| |||
| Total tax expense (benefit) | $ | — | ||
|
| |||
MainStay Cushing Renaissance Advantage Fund
As of November 30, 2017, the cost and unrealized appreciation (depreciation) of the Fund’s investment portfolio, including other financial instruments, as determined on a federal income tax basis, were as follows:
| Federal Tax Cost | Gross Unrealized Appreciation | Gross Unrealized Depreciation | Net Unrealized Appreciation/ (Depreciation) | |||||||||||||
Investments in Securities | $ | 153,197,435 | $ | 22,659,444 | $ | (12,083,546 | ) | $ | 10,575,898 | |||||||
As of November 30, 2017, the components of accumulated gain (loss) on a tax basis were as follows:
| Ordinary Income | Accumulated Capital and Other Gain (Loss) | Other Temporary Differences | Unrealized Appreciation (Depreciation) | Total Gain (Loss) | ||||
| $ — | $(64,447,215) | $(3,458,263) | $10,575,898 | $(57,329,580) |
The difference between book basis and tax basis unrealized depreciation is primarily due to wash sale and partnership adjustments. Other temporary differences are due to a late year loss deferral.
The following table discloses the current year reclassifications between undistributed net investment income (loss), accumulated net realized gain (loss) on investments, and additional paid-in capital arising from permanent differences; net assets as of November 30, 2017 were not affected. These reclassifications are primarily due to partnerships.
| Undistributed Net Investment Income (Loss) | Accumulated Net Realized Gain (Loss) on Investments | Additional Paid-In Capital | ||
| $(1,751,771) | $1,753,924 | $(2,153) |
As of November 30, 2017, for federal income tax purposes, capital loss carryforwards of $64,447,215 were available as shown in the table below, to the extent provided by the Internal Revenue Code, to offset future realized capital gains through the years indicated.
Capital Loss Available Through | Short-Term Amounts (000’s) | Long-Term Amounts (000’s) | ||
| Unlimited | $52,296 | $12,151 |
MainStay Cushing Energy Income Fund
As of November 30, 2017, the cost and unrealized appreciation (depreciation) of the Fund’s investment portfolio, including other financial instruments, as determined on a federal income tax basis, were as follows:
| Federal Tax Cost | Gross Unrealized Appreciation | Gross Unrealized Depreciation | Net Unrealized Appreciation/ (Depreciation) | |||||||||||||
Investments in Securities | $ | 56,219,657 | $ | 6,584,526 | $ | (6,117,324 | ) | $ | 467,202 | |||||||
| 57 |
Notes to Financial Statements (continued)
As of November 30, 2017, the components of accumulated gain (loss) on a tax basis were as follows:
| Ordinary Income | Accumulated Capital and Other Gain (Loss) | Other Temporary Differences | Unrealized Appreciation (Depreciation) | Total Gain (Loss) | ||||
| $ — | $(236,113,349) | $(1,732,448) | $467,202 | $(237,378,595) |
The difference between book basis and tax basis unrealized depreciation is primarily due to wash sale and partnership adjustments. Other temporary differences are due to a late year loss deferral.
The following table discloses the current year reclassifications between undistributed net investment income (loss), accumulated net realized gain (loss) on investments, and additional paid-in capital arising from permanent differences; net assets as of November 30, 2017 were not affected. These reclassifications are primarily due to partnerships.
| Undistributed Net Investment Income (Loss) | Accumulated Net Realized Gain (Loss) on Investments | Additional Paid-In Capital | ||
| $4,840,445 | $146,952 | $(4,987,397) |
Under the Regulated Investment Company Modernization Act of 2010, the Fund is permitted to carry forward capital losses incurred in taxable years beginning with November 30, 2016 (the Fund’s initial year
electing to be taxed as a Regulated Investment Company) for an unlimited period. However, any losses incurred during future years will be required to be utilized prior to the losses incurred in its previous tax years when it was taxed as a C-Corporation. As a result of this ordering rule, prior year capital loss carryforwards subject to expiration may be more likely to expire unused. Additionally, future capital losses that are carried forward will retain their character as either short-term or long-term capital losses rather than being considered all short-term as under previous law.
As of November 30, 2017, for federal income tax purposes, capital loss carryforwards of $236,113,349 were available as shown in the table below, to the extent provided by the Internal Revenue Code, to offset future realized capital gains through the years indicated:
Fiscal Year Ended Capital Loss | Amount (000’s) | Expiration | ||||
November 30, 2013 | $ | 1,372 | November 30, 2018 | |||
| November 30, 2014 | 3,091 | November 30, 2019 | ||||
| November 30, 2015 | 117,036 | November 30, 2020 | ||||
|
| |||||
| Total | $ | 121,499 | ||||
|
| |||||
Capital Loss Available Through | Short-Term Amounts (000’s) | Long-Term Amounts (000’s) | ||
| Unlimited | $54,005 | $60,609 |
The tax character of distributions paid by the MainStay Cushing Funds during the year ended November 30, 2017 shown in the Statements of Changes in Net Assets was as follows:
| 2017 | 2016 | |||||||||||||||||||||||
| Tax Based Distributions from Ordinary Income | Tax Based Distributions from Return of Capital | Total | Tax Based Distributions from Ordinary Income | Tax Based Distributions from Return of Capital | Total | |||||||||||||||||||
MainStay Cushing MLP Premier Fund | $ | — | $ | 141,868,464 | $ | 141,868,464 | $ | — | $ | 134,996,990 | $ | 134,996,990 | ||||||||||||
MainStay Cushing Renaissance Advantage Fund | — | 5,730,182 | 5,730,182 | — | 5,739,564 | 5,739,564 | ||||||||||||||||||
MainStay Cushing Energy Income Fund | — | 3,164,934 | 3,164,934 | 331,893 | 5,823,379 | 6,155,272 | ||||||||||||||||||
Note 5–Custodian
U.S. Bank, N.A. is the custodian of cash and securities held by the MainStay Cushing Funds. Custodial fees are charged to the MainStay Cushing Funds based on the MainStay Cushing Fund’s net assets and/or the market value of securities held by the MainStay Cushing Funds and the number of certain cash transactions incurred by the MainStay Cushing Funds.
Note 6–Line of Credit
The MainStay Cushing Funds and certain other funds managed by New York Life Investments maintain a line of credit with a syndicate of banks in order to secure a source of funds for temporary purposes to meet unanticipated or excessive redemption requests.
Effective August 1, 2017, under the credit agreement (the “Credit Agreement”), the aggregate commitment amount is $600,000,000 with
an additional uncommitted amount of $100,000,000. The commitment fee is an annual rate of 0.15% of the average commitment amount payable quarterly, regardless of usage, to State Street, who serves as the agent to the syndicate. The commitment fee is allocated among each MainStay Cushing Fund and certain other funds managed by New York Life Investments based upon their respective net assets and other factors. Interest on any revolving credit loan is charged based upon the Federal Funds Advances Rate or the one month London InterBank Offered Rate, whichever is higher. The Credit Agreement expires on July 31, 2018, although the MainStay Cushing Funds, certain other funds managed by New York Life Investments and the syndicate of banks may renew the Credit Agreement for an additional year on the same or different terms. Prior to August 1, 2017, the aggregate commitment amount and commitment fee of the previous credit agreement were the same as those under the Credit Agreement, but Bank of New York Mellon served as agent to the syndicate. During the year ended November 30, 2017, there were no borrowings made or
| 58 | MainStay Cushing Funds |
outstanding with respect to the MainStay Cushing Funds under the Credit Agreement or the credit agreement for which Bank of New York Mellon served as agent.
Note 7–Interfund Lending Program
Pursuant to an exemptive order issued by the SEC, the MainStay Cushing Funds, along with certain other funds managed by New York Life Investments, may participate in an interfund lending program. The interfund lending program provides an alternate credit facility that permits the MainStay Cushing Funds and certain other funds managed by New York Life Investments to lend or borrow money for temporary purposes directly to or from one another, subject to the conditions of the exemptive order. During the year ended November 30, 2017, there were no interfund loans made or outstanding with respect to the MainStay Cushing Funds.
Note 8–Purchases and Sales of Securities (in 000’s)
For the year ended November 30, 2017, purchases and sales of securities, other than short-term securities, were as follows:
| Purchases | Sales | |||||||
MainStay Cushing MLP Premier Fund | $ | 463,627 | $ | 389,978 | ||||
MainStay Cushing Renaissance Advantage Fund | 337,051 | 384,333 | ||||||
MainStay Cushing Energy Income Fund | 34,808 | 57,816 | ||||||
Note 9–Capital Share Transactions
MainStay Cushing MLP Premier Fund
Class A | Shares | Amount | ||||||
Year ended November 30, 2017: | ||||||||
Shares sold | 8,012,932 | $ | 109,984,409 | |||||
Shares issued to shareholders in reinvestment of dividends and distributions | 2,158,456 | 28,900,951 | ||||||
Shares redeemed | (8,731,606 | ) | (118,506,402 | ) | ||||
|
|
|
| |||||
Net increase (decrease) in shares before conversion | 1,439,782 | 20,378,958 | ||||||
Shares converted into Class A (See Note 1) | 64,367 | 846,886 | ||||||
Shares converted from Class A (See Note 1) | (4,508,337 | ) | (70,117,304 | ) | ||||
|
|
|
| |||||
Net increase (decrease) | (3,004,188 | ) | $ | (48,891,460 | ) | |||
|
| |||||||
Year ended November 30, 2016: | ||||||||
Shares sold | 10,595,544 | $ | 140,805,107 | |||||
Shares issued to shareholders in reinvestment of dividends and distributions | 2,171,965 | 28,424,119 | ||||||
Shares redeemed | (8,939,289 | ) | (113,911,430 | ) | ||||
Net increase (decrease) in shares before conversion | 3,828,220 | 55,317,796 | ||||||
Shares converted into Class A (See Note 1) | 86,995 | 1,180,861 | ||||||
Shares converted from Class A (See Note 1) | (300,392 | ) | (4,139,339 | ) | ||||
|
|
|
| |||||
Net increase (decrease) | 3,614,823 | $ | 52,359,318 | |||||
|
| |||||||
Investor Class | Shares | Amount | ||||||
Year ended November 30, 2017: | ||||||||
Shares sold | 65,083 | $ | 933,271 | |||||
Shares issued to shareholders in reinvestment of dividends and distributions | 22,437 | 300,988 | ||||||
Shares redeemed | (36,539 | ) | (484,281 | ) | ||||
|
|
|
| |||||
Net increase (decrease) in shares before conversion | 50,981 | 749,978 | ||||||
Shares converted into Investor Class (See Note 1) | 8,957 | 120,081 | ||||||
Shares converted from Investor Class (See Note 1) | (60,602 | ) | (790,573 | ) | ||||
|
|
|
| |||||
Net increase (decrease) | (664 | ) | $ | 79,486 | ||||
|
| |||||||
Year ended November 30, 2016: | ||||||||
Shares sold | 119,631 | $ | 1,494,490 | |||||
Shares issued to shareholders in reinvestment of dividends and distributions | 22,674 | 296,460 | ||||||
Shares redeemed | (49,956 | ) | (670,793 | ) | ||||
|
|
|
| |||||
Net increase (decrease) in shares before conversion | 92,349 | 1,120,157 | ||||||
Shares converted into Investor Class (See Note 1) | 36,854 | 423,385 | ||||||
Shares converted from Investor Class (See Note 1) | (86,994 | ) | (1,180,862 | ) | ||||
|
|
|
| |||||
Net increase (decrease) | 42,209 | $ | 362,680 | |||||
|
| |||||||
Class C | Shares | Amount | ||||||
Year ended November 30, 2017: | ||||||||
Shares sold | 8,671,438 | $ | 112,096,364 | |||||
Shares issued to shareholders in reinvestment of dividends and distributions | 4,285,275 | 53,517,440 | ||||||
Shares redeemed | (12,491,466 | ) | (155,557,248 | ) | ||||
|
|
|
| |||||
Net increase (decrease) in shares before conversion | 465,247 | 10,056,556 | ||||||
Shares converted from Class C (See Note 1) | (40,158 | ) | (498,395 | ) | ||||
|
|
|
| |||||
Net increase (decrease) | 425,089 | $ | 9,558,161 | |||||
|
| |||||||
Year ended November 30, 2016: | ||||||||
Shares sold | 10,454,107 | $ | 128,451,009 | |||||
Shares issued to shareholders in reinvestment of dividends and distributions | 4,345,602 | 53,595,474 | ||||||
Shares redeemed | (14,312,736 | ) | (172,093,632 | ) | ||||
Net increase (decrease) in shares before conversion | 486,973 | 9,952,851 | ||||||
Shares converted from Class C (See Note 1) | (1,863 | ) | (24,797 | ) | ||||
|
|
|
| |||||
Net increase (decrease) | 485,110 | $ | 9,928,054 | |||||
|
| |||||||
| 59 |
Notes to Financial Statements (continued)
Class I | Shares | Amount | ||||||
Year ended November 30, 2017: | ||||||||
Shares sold | 22,090,718 | $ | 301,743,454 | |||||
Shares issued to shareholders in reinvestment of dividends and distributions | 3,931,809 | 53,528,446 | ||||||
Shares redeemed | (19,257,766 | ) | (259,062,662 | ) | ||||
|
|
|
| |||||
Net increase (decrease) in shares before conversion | 6,764,761 | 96,209,238 | ||||||
Shares converted into Class I (See Note 1) | 4,441,808 | 70,439,305 | ||||||
|
|
|
| |||||
Net increase (decrease) | 11,206,569 | $ | 166,648,543 | |||||
|
| |||||||
Year ended November 30, 2016: | ||||||||
Shares sold | 21,560,171 | $ | 276,267,293 | |||||
Shares issued to shareholders in reinvestment of dividends and distributions | 3,419,269 | 45,240,133 | ||||||
Shares redeemed | (22,314,506 | ) | (283,767,350 | ) | ||||
|
|
|
| |||||
Net increase (decrease) in shares before conversion | 2,664,934 | 37,740,076 | ||||||
Shares converted into Class I (See Note 1) | 260,770 | 3,740,752 | ||||||
|
|
|
| |||||
Net increase (decrease) | 2,925,704 | $ | 41,480,828 | |||||
|
| |||||||
| MainStay Cushing Renaissance Advantage Fund | ||||||||
Class A | Shares | Amount | ||||||
Year ended November 30, 2017: | ||||||||
Shares sold | 334,282 | $ | 6,985,046 | |||||
Shares issued to shareholders in reinvestment of dividends and distributions | 40,883 | 816,119 | ||||||
Shares redeemed | (650,310 | ) | (13,028,423 | ) | ||||
|
|
|
| |||||
Net increase (decrease) in shares before conversion | (275,145 | ) | (5,227,258 | ) | ||||
Shares converted into Class A (See Note 1) | 50,459 | 1,003,977 | ||||||
Shares converted from Class A (See Note 1) | (306,154 | ) | (6,777,961 | ) | ||||
|
|
|
| |||||
Net increase (decrease) | (530,840 | ) | $ | (11,001,242 | ) | |||
|
| |||||||
Year ended November 30, 2016: | ||||||||
Shares sold | 326,145 | $ | 5,746,831 | |||||
Shares issued to shareholders in reinvestment of dividends and distributions | 57,981 | 1,019,150 | ||||||
Shares redeemed | (774,244 | ) | (13,582,854 | ) | ||||
|
|
|
| |||||
Net increase (decrease) in shares before conversion | (390,118 | ) | (6,816,873 | ) | ||||
Shares converted into Class A (See Note 1) | 31,040 | 560,552 | ||||||
Shares converted from Class A (See Note 1) | (22,003 | ) | (399,025 | ) | ||||
|
|
|
| |||||
Net increase (decrease) | (381,081 | ) | $ | (6,655,346 | ) | |||
|
| |||||||
Investor Class | Shares | Amount | ||||||
Year ended November 30, 2017: | ||||||||
Shares sold | 50,820 | $ | 1,051,587 | |||||
Shares issued to shareholders in reinvestment of dividends and distributions | 5,296 | 104,837 | ||||||
Shares redeemed | (37,873 | ) | (737,827 | ) | ||||
|
|
|
| |||||
Net increase (decrease) in shares before conversion | 18,243 | 418,597 | ||||||
Shares converted into Investor Class (See Note 1) | 5,313 | 105,491 | ||||||
Shares converted from Investor Class (See Note 1) | (50,607 | ) | (1,003,977 | ) | ||||
|
|
|
| |||||
Net increase (decrease) | (27,051 | ) | $ | (479,889 | ) | |||
|
| |||||||
Year ended November 30, 2016: | ||||||||
Shares sold | 73,352 | $ | 1,262,701 | |||||
Shares issued to shareholders in reinvestment of dividends and distributions | 5,535 | 98,061 | ||||||
Shares redeemed | (28,716 | ) | (502,389 | ) | ||||
|
|
|
| |||||
Net increase (decrease) in shares before conversion | 50,171 | 858,373 | ||||||
Shares converted into Investor Class (See Note 1) | 13,413 | 240,378 | ||||||
Shares converted from Investor Class (See Note 1) | (31,077 | ) | (560,552 | ) | ||||
|
|
|
| |||||
Net increase (decrease) | 32,507 | $ | 538,199 | |||||
|
| |||||||
Class C | Shares | Amount | ||||||
Year ended November 30, 2017: | ||||||||
Shares sold | 142,722 | $ | 2,880,144 | |||||
Shares issued to shareholders in reinvestment of dividends and distributions | 28,525 | 548,599 | ||||||
Shares redeemed | (597,808 | ) | (11,392,573 | ) | ||||
|
|
|
| |||||
Net increase (decrease) | (426,561 | ) | $ | (7,963,830 | ) | |||
|
| |||||||
Year ended November 30, 2016: | ||||||||
Shares sold | 432,763 | $ | 7,357,549 | |||||
Shares issued to shareholders in reinvestment of dividends and distributions | 41,578 | 707,444 | ||||||
Shares redeemed | (1,094,493 | ) | (18,137,394 | ) | ||||
|
|
|
| |||||
Net increase (decrease) | (620,152 | ) | $ | (10,072,401 | ) | |||
|
| |||||||
| 60 | MainStay Cushing Funds |
Class I | Shares | Amount | ||||||
Year ended November 30, 2017: | ||||||||
Shares sold | 2,063,080 | $ | 42,657,161 | |||||
Shares issued to shareholders in reinvestment of dividends and distributions | 194,354 | 3,897,373 | ||||||
Shares redeemed | (4,070,940 | ) | (79,774,202 | ) | ||||
|
|
|
| |||||
Net increase (decrease) in shares before conversion | (1,813,506 | ) | (33,219,668 | ) | ||||
Shares converted into Class I (See Note 1) | 298,034 | 6,672,470 | ||||||
|
|
|
| |||||
Net increase (decrease) | (1,515,472 | ) | $ | (26,547,198 | ) | |||
|
| |||||||
Year ended November 30, 2016: | ||||||||
Shares sold | 2,577,411 | $ | 45,069,674 | |||||
Shares issued to shareholders in reinvestment of dividends and distributions | 195,107 | 3,469,054 | ||||||
Shares redeemed | (2,581,074 | ) | (44,484,493 | ) | ||||
|
|
|
| |||||
Net increase (decrease) in shares before conversion | 191,444 | 4,054,235 | ||||||
Shares converted into Class I (See Note 1) | 8,544 | 158,647 | ||||||
|
|
|
| |||||
Net increase (decrease) | 199,988 | $ | 4,212,882 | |||||
|
| |||||||
| MainStay Cushing Energy Income Fund | ||||||||
Class A | Shares | Amount | ||||||
Year ended November 30, 2017: | ||||||||
Shares sold | 1,037,493 | $ | 4,732,810 | |||||
Shares issued to shareholders in reinvestment of dividends and distributions | 349,460 | 1,540,552 | ||||||
Shares redeemed | (2,974,724 | ) | (13,106,880 | ) | ||||
|
|
|
| |||||
Net increase (decrease) in shares before conversion | (1,587,771 | ) | (6,833,518 | ) | ||||
Shares converted into Class A (See Note 1) | 184,594 | 824,655 | ||||||
Shares converted from Class A (See Note 1) | (702,050 | ) | (3,361,751 | ) | ||||
|
|
|
| |||||
Net increase (decrease) | (2,105,227 | ) | $ | (9,370,614 | ) | |||
|
| |||||||
Year ended November 30, 2016: | ||||||||
Shares sold | 2,320,264 | $ | 8,951,396 | |||||
Shares issued to shareholders in reinvestment of dividends and distributions | 806,904 | 2,922,602 | ||||||
Shares redeemed | (3,745,933 | ) | (14,877,269 | ) | ||||
|
|
|
| |||||
Net increase (decrease) in shares before conversion | (618,765 | ) | (3,003,271 | ) | ||||
Shares converted into Class A (See Note 1) | 169,905 | 686,888 | ||||||
Shares converted from Class A (See Note 1) | (157,020 | ) | (624,073 | ) | ||||
|
|
|
| |||||
Net increase (decrease) | (605,880 | ) | $ | (2,940,456 | ) | |||
|
| |||||||
Investor Class | Shares | Amount | ||||||
Year ended November 30, 2017: | ||||||||
Shares sold | 176,502 | $ | 798,145 | |||||
Shares issued to shareholders in reinvestment of dividends and distributions | 30,822 | 135,211 | ||||||
Shares redeemed | (155,722 | ) | (673,887 | ) | ||||
|
|
|
| |||||
Net increase (decrease) in shares before conversion | 51,602 | 259,469 | ||||||
Shares converted into Investor Class (See Note 1) | 24,333 | 108,640 | ||||||
Shares converted from Investor Class (See Note 1) | (185,197 | ) | (824,655 | ) | ||||
|
|
|
| |||||
Net increase (decrease) | (109,262 | ) | $ | (456,546 | ) | |||
|
| |||||||
Year ended November 30, 2016: | ||||||||
Shares sold | 388,692 | $ | 1,505,712 | |||||
Shares issued to shareholders in reinvestment of dividends and distributions | 50,992 | 187,294 | ||||||
Shares redeemed | (131,014 | ) | (530,683 | ) | ||||
|
|
|
| |||||
Net increase (decrease) in shares before conversion | 308,670 | 1,162,323 | ||||||
Shares converted into Investor Class (See Note 1) | 109,365 | 413,159 | ||||||
Shares converted from Investor Class (See Note 1) | (170,105 | ) | (686,888 | ) | ||||
|
|
|
| |||||
Net increase (decrease) | 247,930 | $ | 888,594 | |||||
|
| |||||||
Class C | Shares | Amount | ||||||
Year ended November 30, 2017: | ||||||||
Shares sold | 246,252 | $ | 1,070,937 | |||||
Shares issued to shareholders in reinvestment of dividends and distributions | 135,284 | 574,625 | ||||||
Shares redeemed | (1,599,124 | ) | (6,787,091 | ) | ||||
|
|
|
| |||||
Net increase (decrease) | (1,217,588 | ) | $ | (5,141,529 | ) | |||
|
| |||||||
Year ended November 30, 2016: | ||||||||
Shares sold | 827,296 | $ | 3,119,513 | |||||
Shares issued to shareholders in reinvestment of dividends and distributions | 391,450 | 1,347,520 | ||||||
Shares redeemed | (2,137,787 | ) | (8,172,548 | ) | ||||
|
|
|
| |||||
Net increase (decrease) | (919,041 | ) | $ | (3,705,515 | ) | |||
|
| |||||||
| 61 |
Notes to Financial Statements (continued)
Class I | Shares | Amount | ||||||
Year ended November 30, 2017: | ||||||||
Shares sold | 1,713,307 | $ | 7,417,266 | |||||
Shares issued to shareholders in reinvestment of dividends and distributions | 161,927 | 722,803 | ||||||
Shares redeemed | (3,846,501 | ) | (16,698,338 | ) | ||||
|
|
|
| |||||
Net increase (decrease) in shares before conversion | (1,971,267 | ) | (8,558,269 | ) | ||||
Shares converted into Class I (See Note 1) | 669,435 | 3,253,111 | ||||||
|
|
|
| |||||
Net increase (decrease) | (1,301,832 | ) | $ | (5,305,158 | ) | |||
|
| |||||||
Year ended November 30, 2016: | ||||||||
Shares sold | 2,792,050 | $ | 11,881,991 | |||||
Shares issued to shareholders in reinvestment of dividends and distributions | 327,890 | 1,199,204 | ||||||
Shares redeemed | (4,572,700 | ) | (18,117,362 | ) | ||||
|
|
|
| |||||
Net increase (decrease) in shares before conversion | (1,452,760 | ) | (5,036,167 | ) | ||||
Shares converted into Class I (See Note 1) | 47,389 | 210,914 | ||||||
|
|
|
| |||||
Net increase (decrease) | (1,405,371 | ) | $ | (4,825,253 | ) | |||
|
| |||||||
Note 10–Subsequent Events
In connection with the preparation of the financial statements of the MainStay Cushing Funds as of and for the year ended November 30, 2017, events and transactions subsequent to November 30, 2017, through the date the financial statements were issued have been evaluated by the MainStay Cushing Funds’ management for possible adjustment and/or disclosure. No subsequent events requiring financial statement adjustment or disclosure have been identified other than the following:
On December 22, 2017, subsequent to the date of the financial statements, new U.S. tax legislation was signed into law. This tax legislation lowers the general Federal corporate income tax rate from 35 percent to
21 percent, restricts the annual utilization of and indefinitely extends future Federal net operating losses, repeals the corporate alternative minimum tax, restricts corporate deductibility of interest expense and provides for other changes to the U.S taxation of domestic earnings.
The legislation may affect the MainStay Cushing MLP Premier Fund’s estimates of its current income tax expense and of its deferred tax asset balance, including any valuation allowance, and its deferred tax liability balance, as used in the calculation of its NAV. The Fund will be evaluating this tax legislation for its potential effects on the Fund’s tax expense, deferred tax balances, and impact on its NAV. This tax legislation may also affect information provided to the Fund by MLP portfolio investments, information that may not be provided timely. The MainStay Cushing MLP Premier Fund may modify its estimates and assumptions regarding its current taxes and deferred tax asset and liability balances as this evaluation of the tax legislation occurs and as new information regarding the legislation or other matters becomes available. Modifications in estimates or assumptions may have a material impact on the Fund’s NAV. (See Note 4 ).
On December 29, 2017 the MainStay Cushing MLP Premier Fund declared a distribution payable of $0.1117 per share, to Class A shareholders, Investor Class shareholders, Class C shareholders and Class I shareholders of record on December 28, 2017, and payable on December 29, 2017.
On January 19, 2018 the MainStay Cushing Renaissance Advantage Fund declared a distribution payable of $0.14 per share, to Class A shareholders, Investor Class shareholders, Class C shareholders and Class I shareholders of record on January 18, 2018, and payable on January 19, 2018.
On January 19, 2018 the MainStay Cushing Energy Income Fund declared distributions of $0.0532, 0.0535, 0.0453 and 0.0582 per share, to Class A shareholders, Investor Class shareholders, Class C shareholders and Class I shareholders of record on January 18, 2018, and payable on January 19, 2018.
| 62 | MainStay Cushing Funds |
Report of Independent Registered Public Accounting Firm
The Board of Trustees and Shareholders of
MainStay Funds Trust:
We have audited the accompanying statements of assets and liabilities, including the portfolios of investments, of MainStay Cushing MLP Premier Fund, MainStay Cushing Renaissance Advantage Fund, and MainStay Cushing Energy Income Fund (each a “Fund” and collectively, the “Funds”), three of the funds constituting MainStay Funds Trust, as of November 30, 2017, and the related statements of operations for the year then ended, the statements of changes in net assets for each of the years in the two-year period then ended, and the financial highlights for each of the years or periods in the four-year period then ended. These financial statements and financial highlights are the responsibility of the Funds’ management. Our responsibility is to express an opinion on these financial statements and financial highlights based on our audits. The financial highlights for each of the years or periods presented through November 30, 2013, were audited by other auditors, whose report thereon dated January 29, 2014, expressed an unqualified opinion on those financial statements and financial highlights.
We conducted our audits in accordance with the standards of the Public Company Accounting Oversight Board (United States). Those standards require that we plan and perform the audit to obtain reasonable assurance about whether the financial statements and financial highlights are free of material misstatement. An audit includes examining, on a test basis, evidence supporting the amounts and disclosures in the financial statements. Our procedures included confirmation of securities owned as of November 30, 2017, by correspondence with the custodian and brokers or by other appropriate auditing procedures where replies from brokers were not received. An audit also includes assessing the accounting principles used and significant estimates made by management, as well as evaluating the overall financial statement presentation. We believe that our audits provide a reasonable basis for our opinion.
In our opinion, the financial statements and financial highlights referred to above present fairly, in all material respects, the financial position of MainStay Cushing MLP Premier Fund, MainStay Cushing Renaissance Advantage Fund, and MainStay Cushing Energy Income Fund as of November 30, 2017, the results of their operations for the year then ended, the changes in its net assets for each of the years in the two-year period then ended, and the financial highlights for each of the years or periods in the four-year period then ended, in conformity with U.S. generally accepted accounting principles.

Philadelphia, Pennsylvania
January 25, 2018
| 63 |
(Unaudited)
At a meeting held on June 22, 2017, the Board approved submitting the following proposals (“Proposals”) to shareholders of the Funds at a special meeting held on October 23, 2017 (with any postponements or adjournments, “Special Meeting”):
| 1. | To elect eight Trustees to the Board |
| 2. | To approve amendments of the fundamental investment restrictions for certain funds |
On or about September 28, 2017, shareholders of record of the Funds as of the close of business on August 24, 2017 were sent a proxy statement containing further information regarding the Proposals. The proxy statement also included information about the Special Meeting, at which shareholders of the Funds were asked to consider and approve the Proposals. In addition, the proxy statement included information about voting on the Proposals and options shareholders had to do so.
The Special Meeting was held on October 23, 2017, and Proposal 1 passed.
Proposal 2 was not applicable to the Cushing Funds.
The results of the Special Meeting (all Funds and classes thereof voting together) were as follows:
Proposal 1 To elect eight Trustees to the Board:
Yie-Hsin Hung:
Votes For | Votes Withheld | Total | ||
| 1,395,315,558.515 | 20,770,500.840 | 1,416,086,059.355 |
David H. Chow:
Votes For | Votes Withheld | Total | ||
| 1,397,917,470.765 | 18,168,588.590 | 1,416,086,059.355 |
Susan B. Kerley:
Votes For | Votes Withheld | Total | ||
| 1,396,818,692.317 | 19,267,367.038 | 1,416,086,059.355 |
Alan R. Latshaw:
Votes For | Votes Withheld | Total | ||
| 1,396,373,783.248 | 19,712,276.107 | 1,416,086,059.355 |
Peter Meenan:
Votes For | Votes Withheld | Total | ||
| 1,395,471,167.907 | 20,614,891.448 | 1,416,086,059.355 |
Richard H. Nolan, Jr.:
Votes For | Votes Withheld | Total | ||
| 1,395,958,365.396 | 20,127,693.959 | 1,416,086,059.355 |
Jacques P. Perold:
Votes For | Votes Withheld | Total | ||
| 1,396,793,762.076 | 19,292,297.279 | 1,416,086,059.355 |
Richard S. Trutanic:
Votes For | Votes Withheld | Total | ||
| 1,396,080,652.375 | 20,005,406.980 | 1,416,086,059.355 |
Proxy Voting Policies and Procedures and Proxy Voting Record (Unaudited)
A description of the policies and procedures that New York Life Investments uses to vote proxies related to the Funds’ securities is available without charge, upon request, (i) by visiting the Funds’ website at mainstayinvestments.com; and (ii) on the Securities and Exchange Commission’s (“SEC”) website at www.sec.gov.
The Funds are required to file with the SEC its proxy voting record for the 12-month period ending June 30 on Form N-PX. The Funds’ most recent Form N-PX is available free of charge upon request by calling 800-MAINSTAY (624-6782); visiting the Fund’s website at mainstayinvestments.com; or on the SEC’s website at www.sec.gov.
Shareholder Reports and Quarterly Portfolio Disclosure (Unaudited)
Each Cushing Fund is required to file its complete schedule of portfolio holdings with the SEC for its first and third fiscal quarters on Form N-Q. Each Cushing Fund’s Form N-Q is available without charge, on the SEC’s website at www.sec.gov or by calling MainStay Investments at 800-MAINSTAY (624-6782). You also can obtain and review copies of Form N-Q by visiting the SEC’s Public Reference Room in Washington, DC (information on the operation of the Public Reference Room may be obtained by calling 1-800-SEC-0330).
| 64 | MainStay Cushing Funds |
Board of Trustees and Officers (Unaudited)
The Trustees and officers of the Funds are listed below. The Board oversees the MainStay Group of Funds (which consists of The MainStay Funds and MainStay Funds Trust), MainStay VP Funds Trust, MainStay DefinedTerm Municipal Opportunities Fund, the Manager and the Subadvisors, and elects the officers of the Funds who are responsible for the day-to-day operations of the Funds. Information pertaining to the Trustees and officers is set forth below. Each Trustee serves until his or her successor is elected and qualified or until his or her resignation, death or removal. Under the Board’s retirement policy, unless an exception is made, a Trustee must tender his or her resignation by the
end of the calendar year during which he or she reaches the age of 75. Mr. Meenan reached the age of 75 during the calendar year 2016, and his term was extended for one additional year. Accordingly, Mr. Meenan served until the end of calendar year 2017, at which time he retired. Officers are elected annually by the Board. The business address of each Trustee and officer listed below is 51 Madison Avenue, New York, New York 10010. A majority of the Trustees are not “interested persons” (as defined by the 1940 Act and rules adopted by the SEC thereunder) of the Fund (“Independent Trustees”).
Name and Date of Birth | Term of Office, Position(s) Held and Length of Service | Principal Occupation(s) During Past Five Years | Number of Portfolios in the MainStay Group of Funds Overseen by Trustee | Other Directorships Held by Trustee | ||||||||
| Interested Trustee | Yie-Hsin Hung* 8/12/62 | MainStay Funds Trust: Trustee since January 2017. | Senior Vice President of New York Life since joining in 2010, Member of the Executive Management Committee since January 1, 2017, Chief Executive Officer, New York Life Investment Management Holdings LLC & New York Life Investment Management LLC since May 2015. Senior Managing Director and Co-President of New York Life Investment Management LLC from January 2014 to May 2015. Previously held positions of increasing responsibility, including head of NYLIM International, Alternative Growth Businesses, and Institutional investments since joining New York Life in 2010. | 82 | None |
| * | This Trustee is considered to be an “interested person” of the MainStay Group of Funds, MainStay VP Funds Trust and MainStay DefinedTerm Municipal Opportunities Fund, within the meaning of the 1940 Act because of her affiliation with New York Life Insurance Company, New York Life Investment Management LLC, Candriam Belgium, Candriam France S.A.S., Cornerstone Capital Management Holdings LLC, MacKay Shields LLC, NYL Investors LLC, NYLIFE Securities LLC and/or NYLIFE Distributors LLC, as described in detail above in the column entitled “Principal Occupation(s) During Past Five Years.” |
| 65 |
Name and Date of Birth | Term of Office, Position(s) Held and Length of Service | Principal Occupation(s) During Past Five Years | Number of Portfolios in the MainStay Group of Funds Overseen by Trustee | Other Directorships Held by Trustee | ||||||||
| Independent Trustees | David H. Chow 12/29/57 | MainStay Funds Trust: Trustee since January 2016, Advisory Board Member (June 2015 to December 2015). | Founder and CEO, DanCourt Management, LLC (since 1999) | 82 | VanEck Vectors Group of Exchange-Traded Funds: Independent Chairman of the Board of Trustees since 2008 and Trustee since 2006 (57 portfolios); and Berea College of Kentucky: Trustee since 2009. | |||||||
Susan B. Kerley 8/12/51 | MainStay Funds Trust: Chairman since January 2017 and Trustee since 1990.** | President, Strategic Management Advisors LLC (since 1990) | 82 | Legg Mason Partners Funds: Trustee since 1991 (54 portfolios). | ||||||||
Alan R. Latshaw 3/27/51 | MainStay Funds Trust: Trustee and Audit Committee Financial Expert since 2007.** | Retired; Partner, Ernst & Young LLP (2002 to 2003); Partner, Arthur Andersen LLP (1989 to 2002); Consultant to the MainStay Funds Audit and Compliance Committee (2004 to 2006) | 82 | State Farm Associates Funds Trusts: Trustee since 2005 (4 portfolios); State Farm Mutual Fund Trust: Trustee since 2005 (15 portfolios); and State Farm Variable Product Trust: Trustee since 2005 (9 portfolios). | ||||||||
Peter Meenan*** 12/5/41 | MainStay Funds Trust: Trustee since 2002.** | Retired; Independent Consultant (2004 to 2013); President and Chief Executive Officer, Babson—United, Inc. (financial services firm) (2000 to 2004); Independent Consultant (1999 to 2000); Head of Global Funds, Citicorp (1995 to 1999) | 82 | None | ||||||||
Richard H. Nolan, Jr. 11/16/46 | MainStay Funds Trust: Trustee since 2007.** | Managing Director, ICC Capital Management (since 2004); President—Shields/Alliance, Alliance Capital Management (1994 to 2004) | 82 | None | ||||||||
Jacques P. Perold 5/12/58 | MainStay Funds Trust: Trustee since January 2016, Advisory Board Member (June 2015 to December 2015). | Retired; President, Fidelity Management & Research Company (2009 to 2014); Founder, President and Chief Executive Officer, Geode Capital Management, LCC (2001 to 2009) | 82 | Allstate Corporation: Director since 2015; MSCI, Inc. Director since March 2017 and Boston University: Trustee since 2014. | ||||||||
Richard S. Trutanic 2/13/52 | MainStay Funds Trust: Trustee since 2007.** | Chairman and Chief Executive Officer, Somerset & Company (financial advisory firm) (since 2004); Managing Director, The Carlyle Group (private investment firm) (2002 to 2004); Senior Managing Director, Partner and Board Member, Groupe Arnault S.A. (private investment firm) (1999 to 2002) | 82 | None |
| ** | Includes prior service as a Director/Trustee of certain predecessor entities to MainStay Funds Trust. |
| *** | Pursuant to the Retirement Policy. Mr. Meenan has retired from the Board of Trustees effective December 31, 2017. |
| 66 | MainStay Cushing Funds |
Name and Date of Birth | Position(s) Held and Length of Service | Principal Occupation(s) During Past Five Years | ||||||
Officers of the Trust (Who are not Trustees)* | Kirk C. Lehneis 6/29/74 | President, MainStay Funds Trust (since September 2017) | Chief Operating Officer and Senior Managing Director (since 2016), New York Life Investment Management LLC; Chairman of the Board (since September 2017), NYLIFE Distributors LLC; Chairman of the Board, NYLIM Service Company LLC (since September 2017); President, MainStay DefinedTerm Municipal Opportunities Fund, MainStay VP Funds Trust and The MainStay Funds (since September 2017); Senior Managing Director, Global Product Development (From March 2015—May 2016); Managing Director, Product Development (From March 2010—February 2015) | |||||
Jack R. Benintende 5/12/64 | Treasurer and Principal Financial and Accounting Officer, MainStay Funds Trust (since 2009) | Managing Director, New York Life Investment Management LLC (since 2007); Treasurer and Principal Financial and Accounting Officer, MainStay DefinedTerm Municipal Opportunities Fund (since 2011), The MainStay Funds and MainStay VP Funds Trust (since 2007)**; and Assistant Treasurer, New York Life Investment Management Holdings LLC (2008 to 2012) | ||||||
Kevin M. Bopp 2/24/69 | Vice President and Chief Compliance Officer, MainStay Funds Trust (since 2014) | Chief Compliance Officer, New York Life Investment Management LLC, IndexIQ ETF (since January 2016), Director and Associate General Counsel (2011 to 2014) and Vice President and Assistant General Counsel (2010 to 2011), New York Life Investment Management LLC; Vice President and ChiefCompliance Officer, MainStay VP Funds Trust, The MainStay Funds, MainStay DefinedTerm Municipal Opportunities Fund (since 2014); Assistant Secretary, MainStay Funds, MainStay Funds Trust and MainStay VP Funds Trust (2010 to 2014)**, MainStay DefinedTerm Municipal Opportunities Fund (2011 to 2014) | ||||||
J. Kevin Gao 10/13/67 | Secretary and Chief Legal Officer, MainStay Funds Trust (since 2010) | Managing Director and Associate General Counsel, New York Life Investment Management LLC (since 2010); Secretary and Chief Legal Officer, MainStay DefinedTerm Municipal Opportunities Fund (since 2011), The MainStay Funds and MainStay VP Funds Trust (since 2010)** | ||||||
Scott T. Harrington 2/8/59 | Vice President—Administration, MainStay Funds Trust (since 2009) | Director, New York Life Investment Management LLC (including predecessor advisory organizations) (since 2000); Member of the Board of Directors, New York Life Trust Company (since 2009); Vice President—Administration, MainStay DefinedTerm Municipal Opportunities Fund (since 2011); The MainStay Funds and MainStay VP Funds Trust (since 2005)** |
| * | The officers listed above are considered to be “interested persons” of the MainStay Group of Funds, MainStay VP Funds Trust and MainStay Defined Term Municipal Opportunities Fund within the meaning of the 1940 Act because of their affiliation with the MainStay Group of Funds, New York Life Insurance Company and/or its affiliates, including New York Life Investment Management LLC, NYLIM Service Company LLC, NYLIFE Securities LLC and/or NYLIFE Distributors LLC, as described in detail in the column captioned “Principal Occupation(s) During Past Five Years.” Officers are elected annually by the Board. |
| ** | Includes prior service as an officer of MainStay VP Series Fund, Inc., the predecessor to MainStay VP Funds Trust. |
| 67 |
This page intentionally left blank
This page intentionally left blank
This page intentionally left blank
MainStay Funds
Equity
U.S. Equity
MainStay Common Stock Fund
MainStay Cornerstone Growth Fund
MainStay Epoch U.S. All Cap Fund
MainStay Epoch U.S. Equity Yield Fund
MainStay Epoch U.S. Small Cap Fund
MainStay Large Cap Growth Fund
MainStay MAP Equity Fund
MainStay S&P 500 Index Fund
MainStay U.S. Equity Opportunities Fund
International/Global Equity
MainStay Candriam Emerging Markets Equity Fund
MainStay Emerging Markets Equity Fund
MainStay Epoch Capital Growth Fund
MainStay Epoch Global Choice Fund
MainStay Epoch Global Equity Yield Fund
MainStay Epoch International Choice Fund
MainStay Epoch International Small Cap Fund
MainStay International Equity Fund
MainStay International Opportunities Fund
Income
Taxable Bond
MainStay Emerging Markets Debt Fund
MainStay Floating Rate Fund
MainStay Government Fund
MainStay High Yield Corporate Bond Fund
MainStay Indexed Bond Fund
MainStay Short Duration High Yield Fund
MainStay Total Return Bond Fund
MainStay Unconstrained Bond Fund
Municipal/Tax Advantaged Bond
MainStay California Tax Free Opportunities Fund1
MainStay High Yield Municipal Bond Fund
MainStay New York Tax Free Opportunities Fund2
MainStay Tax Advantaged Short Term Bond Fund
MainStay Tax Free Bond Fund
Money Market
MainStay Money Market Fund
Mixed Asset
MainStay Balanced Fund
MainStay Convertible Fund
MainStay Income Builder Fund
Alternative
MainStay Absolute Return Multi-Strategy Fund
MainStay Cushing Energy Income Fund
MainStay Cushing MLP Premier Fund
MainStay Cushing Renaissance Advantage Fund
Asset Allocation/Target Date
MainStay Conservative Allocation Fund
MainStay Growth Allocation Fund
MainStay Moderate Allocation Fund
MainStay Moderate Growth Allocation Fund
MainStay Retirement 2010 Fund
MainStay Retirement 2020 Fund
MainStay Retirement 2030 Fund
MainStay Retirement 2040 Fund
MainStay Retirement 2050 Fund
MainStay Retirement 2060 Fund
Manager
New York Life Investment Management LLC
New York, New York
Subadvisors
Candriam Belgium S.A.3
Brussels, Belgium
Candriam France S.A.S.3
Paris, France
Cornerstone Capital Management Holdings LLC3
New York, New York
Cushing Asset Management, LP
Dallas, Texas
Epoch Investment Partners, Inc.
New York, New York
MacKay Shields LLC3
New York, New York
Markston International LLC
White Plains, New York
NYL Investors LLC3
New York, New York
Winslow Capital Management, LLC
Minneapolis, Minnesota
Legal Counsel
Dechert LLP
Washington, District of Columbia
Independent Registered Public Accounting Firm
KPMG LLP
Philadelphia, Pennsylvania
1. Class A and Class I shares of this Fund are registered for sale in AZ, CA, MI, NV, OR, TX, UT and WA. Class I shares are registered for sale in CO, FL, GA, HI, ID, MA, MD, NH, NJ and NY.
2. This Fund is registered for sale in CA, CT, DE, FL, MA, NJ, NY and VT.
3. An affiliate of New York Life Investment Management LLC.
Not part of the Annual Report
For more information
800-MAINSTAY (624-6782)
mainstayinvestments.com
MainStay Investments® is a registered service mark and name under which New York Life Investment Management LLC does business. MainStay Investments, an indirect subsidiary of New York Life Insurance Company, New York, NY 10010, provides investment advisory products and services. The MainStay Funds® are managed by New York Life Investment Management LLC and distributed by NYLIFE Distributors LLC, 30 Hudson Street, Jersey City, NJ 07302, a wholly owned subsidiary of New York Life Insurance Company. NYLIFE Distributors LLC is a Member FINRA/SIPC.
©2017 NYLIFE Distributors LLC. All rights reserved.
| Not FDIC/NCUA Insured | Not a Deposit | May Lose Value | No Bank Guarantee | Not Insured by Any Government Agency |
| 1720364 MS346-17 | MSCU11-01/18 (NYLIM) NL258 |
| Item 2. | Code of Ethics. |
As of the end of the period covered by this report, the Registrant has adopted a code of ethics (the “Code”) that applies to the Registrant’s principal executive officer (“PEO”) and principal financial officer (“PFO”). A copy of the Code is filed herewith. The Registrant did not grant any waivers, including implicit waivers, from any provisions of the Code to the PEO or PFO during the period covered by this report.
| Item 3. | Audit Committee Financial Expert. |
The Board of Trustees has determined that the Registrant has one audit committee financial expert serving on its Audit Committee. The Audit Committee financial expert is Alan R. Latshaw. Mr. Latshaw is “independent” within the meaning of that term under the Investment Company Act of 1940.
| Item 4. | Principal Accountant Fees and Services. |
(a) Audit Fees
The aggregate fees billed for the fiscal year ended November 30, 2017 for professional services rendered by KPMG LLP (“KPMG”) for the audit of the Registrant’s annual financial statements or services that are normally provided by KPMG in connection with statutory and regulatory filings or engagements for that fiscal year were $206,100.
The aggregate fees billed for the fiscal year ended November 30, 2016 for professional services rendered by KPMG LLP (“KPMG”) for the audit of the Registrant’s annual financial statements or services that are normally provided by KPMG in connection with statutory and regulatory filings or engagements for that fiscal year were $199,400.
(b) Audit-Related Fees
The aggregate fees billed for assurance and related services by KPMG that are reasonably related to the performance of the audit of the Registrant’s financial statements and are not reported under paragraph (a) of this Item were: (i) $0 for the fiscal year ended November 30, 2017, and (ii) $0 for the fiscal year ended November 30, 2016. These audit-related services include review of financial highlights for Registrant’s registration statements and issuance of consents to use the auditor’s reports.
(c) Tax Fees
The aggregate fees billed for professional services rendered by KPMG for tax compliance, tax advice, and tax planning were: (i) $0 for the fiscal year ended November 30, 2017; and (ii) $0 for the fiscal year ended November 30, 2016. These services primarily included preparation of federal, state and local income tax returns and excise tax returns, as well as services relating to excise tax distribution requirements.
(d) All Other Fees
The aggregate fees billed for products and services provided by KPMG, other than the services reported in paragraphs (a) through (c) of this Item were: (i) $0 during the fiscal year ended November 30, 2017; and (ii) $0 during the fiscal year ended November 30, 2016.
(e) Pre-Approval Policies and Procedures
| (1) | The Registrant’s Audit Committee has adopted pre-approval policies and procedures (the “Procedures”) to govern the Committee’s pre-approval of (i) all audit services and permissible non-audit services to be provided to the Registrant by its independent accountant, and (ii) all permissible non-audit services to be provided by such independent accountant to the Registrant’s investment adviser and to any entity controlling, controlled by or under common control with the investment adviser that provides ongoing services to the Registrant (collectively, the “Service Affiliates”) if the services directly relate to the Registrant’s operations and financial reporting. In accordance with the Procedures, the Audit Committee is responsible for the engagement of the independent accountant to certify the Registrant’s financial statements for each fiscal year. With respect to the pre-approval of non-audit services provided to the Registrant and its Service Affiliates, the Procedures provide that the Audit Committee may annually pre-approve a list of the types of services that may be provided to the Registrant or its Service Affiliates, or the Audit Committee may pre-approve such services on a project-by-project basis as they arise. Unless a type of service has received general pre-approval, it will require specific pre-approval by the Audit Committee if it is to be provided by the independent accountant. The Procedures also permit the Audit Committee to delegate authority to one or more of its members to pre-approve any proposed non-audit services that have not been previously pre-approved by the Audit Committee, subject to the ratification by the full Audit Committee no later than its next scheduled meeting. To date, the Audit Committee has not delegated such authority. |
| (2) | With respect to the services described in paragraphs (b) through (d) of this Item 4, no amount was approved by the Audit Committee pursuant to paragraph (c)(7)(i)(C) of Rule 2-01 of Regulation S-X. |
(f) There were no hours expended on KPMG’s engagement to audit the Registrant’s financial statements for the most recent fiscal year was attributable to work performed by persons other than KPMG’s full-time, permanent employees.
(g) All non-audit fees billed by KPMG for services rendered to the Registrant for the fiscal years ended November 30, 2017 and November 30, 2016 are disclosed in 4(b)-(d) above.
The aggregate non-audit fees billed by KPMG for services rendered to the Registrant’s investment adviser (not including any sub-adviser whose role is primarily portfolio management and is subcontracted with or overseen by another investment adviser), and any entity controlling, controlled by, or under common
control with the adviser that provides ongoing services to the Registrant were approximately: (i) $0 for the fiscal year ended November 30, 2017; and (ii) $0 for the fiscal year ended November 30, 2016.
(h) The Registrant’s Audit Committee has determined that the non-audit services rendered by KPMG for the fiscal year ended November 30, 2017 to the Registrant’s investment adviser and any entity controlling, controlled by, or under common control with the Registrant’s investment adviser that provides ongoing services to the Registrant that were not required to be pre-approved by the Audit Committee because they did not relate directly to the operations and financial reporting of the registrant were compatible with maintaining the respective independence of KPMG during the relevant time period.
| Item 5. | Audit Committee of Listed Registrants |
Not applicable.
| Item 6. | Schedule of Investments |
The Schedule of Investments is included as part of Item 1 of this report.
| Item 7. | Disclosure of Proxy Voting Policies and Procedures for Closed-End Management Investment Companies. |
Not applicable.
| Item 8. | Portfolio Managers of Closed-End Management Investment Companies. |
Not applicable.
| Item 9. | Purchases of Equity Securities by Closed-End Management Investment Company and Affiliated Purchasers. |
Not Applicable.
| Item 10. | Submission of Matters to a Vote of Security Holders. |
Since the Registrant’s last response to this Item, there have been no material changes to the procedures by which shareholders may recommend nominees to the Registrant’s Board of Trustees.
Item 11. Controls and Procedures.
(a) Based on an evaluation of the Registrant’s Disclosure Controls and Procedures (as defined in Rule 30a-3(c) under the Investment Company Act of 1940) (the “Disclosure Controls”), as of a date within 90 days prior to the filing date (the “Filing Date”) of this Form N-CSR (the “Report”), the Registrant’s principal executive officer and principal financial officer have concluded that the Disclosure Controls are reasonably designed to ensure that information required to be disclosed by the Registrant in the Report is recorded, processed, summarized and reported by the Filing Date, including ensuring that information required to be disclosed in the Report is accumulated and communicated to the Registrant’s management, including the Registrant’s principal executive officer and principal financial officer, as appropriate to allow timely decisions regarding required disclosure.
(b) There were no changes in the Registrant’s internal control over financial reporting (as defined in Rule 30a-3(d)) under the Investment Company Act of 1940 that occurred during the second fiscal quarter
of the period covered by this report that has materially affected, or is reasonably likely to materially affect, the Registrant’s internal control over financial reporting.
Item 12. Exhibits.
| (a)(1) | Code of Ethics |
| (a)(2) | Certifications of principal executive officer and principal financial officer as required by Rule 30a-2 under the Investment Company Act of 1940. |
| (b) | Certifications of principal executive officer and principal financial officer as required by Section 906 of the Sarbanes-Oxley Act of 2002. |
SIGNATURES
Pursuant to the requirements of the Securities Exchange Act of 1934 and the Investment Company Act of 1940, the Registrant has duly caused this Report to be signed on its behalf by the undersigned, thereunto duly authorized.
MAINSTAY FUNDS TRUST
| By: | /s/ Kirk C. Lehneis | |
Kirk C. Lehneis President and Principal Executive Officer | ||
| Date: | February 7, 2018 | |
Pursuant to the requirements of the Securities Exchange Act of 1934 and the Investment Company Act of 1940, this Report has been signed below by the following persons on behalf of the Registrant and in the capacities and on the dates indicated.
| By: | /s/ Kirk C. Lehneis | |
Kirk C. Lehneis President and Principal Executive Officer | ||
| Date: | February 7, 2018 | |
| By: | /s/ Jack R. Benintende | |
Jack R. Benintende Treasurer and Principal Financial and Accounting Officer | ||
| Date: | February 7, 2018 | |
EXHIBIT INDEX
| (a)(1) | Code of Ethics |
| (a)(2) | Certifications of principal executive officer and principal financial officer as required by Rule 30a-2 under the Investment Company Act of 1940. |
| (b) | Certification of principal executive officer and principal financial officer as required by Section 906 of the Sarbanes-Oxley Act of 2002. |