UNITED STATES
SECURITIES AND EXCHANGE COMMISSION
Washington, D.C. 20549
FORM 6-K
REPORT OF FOREIGN ISSUER
PURSUANT TO RULE 13a-16 OR 15d-16 UNDER
PURSUANT TO RULE 13a-16 OR 15d-16 UNDER
SECURITIES EXCHANGE ACT OF 1934
For the month of March, 2017
(Commission File No. 001-34429),PAMPA ENERGIA S.A.
(PAMPA ENERGY INC.)
(PAMPA ENERGY INC.)
Argentina
(Jurisdiction of incorporation or organization)
Ortiz de Ocampo 3302
Building #4
C1425DSR
Buenos Aires
Argentina
Building #4
C1425DSR
Buenos Aires
Argentina
(Address of principal executive offices)
(Indicate by check mark whether the registrant files or will file annual reports under cover of Form 20-F or Form 40-F.)
Form 20-F ___X___ Form 40-F ______
Form 20-F ___X___ Form 40-F ______
(Indicate by check mark whether the registrant by furnishing the
information contained in this form is also thereby furnishing the
information to the Commission pursuant to Rule 12g3-2(b) under
the Securities Exchange Act of 1934.)
Yes ______ No ___X___
(If "Yes" is marked, indicate below the file number assigned to the
registrant in connection with Rule 12g3-2(b): 82- .)
registrant in connection with Rule 12g3-2(b): 82- .)
Main Results for the Fiscal Year 2016 (‘FY 2016’) and Fourth Quarter of 2016 (‘Q4 16’)¹
Consolidated sales revenues of AR$31,295 million²for the fiscal year ended on December 31, 2016, higher than the AR$7,106 million for the same period of 2015, primarily explained by the addition as of August 2016 of Petrobras Argentina. The net sales increased AR$2,206 million in power generation, AR$9,277 million in electricity distribution, AR$7,091 million in oil and gas, AR$6,550 million in refining and distribution, AR$2,507 million in petrochemicals and AR$26 million in holding and others segment, partially offset by higher eliminations from intersegment sales for AR$3,468 million. |
¹The financial information presented in this document for the quarters ended on December 31, 2016 and of 2015 are based on unaudited financial statements prepared according to the IFRS accounting standards in force in Argentina corresponding to the fiscal years 2016 and 2015, and the quarter ended on December 31, 2016 and of 2015 and the results corresponding to the nine-month period of 2016 and of 2015.
² Under the International Financial Reporting Standards (‘IFRS’), OldelVal, Refinor, TGS and Transener are not consolidated in Pampa’s income statement and balance sheet, being only its equity income shown as ‘Results for participation in associates’ and ‘Results for participation in joint businesses’. For more information, please refer to section 3 of this Earnings Release.
Pampa Energia• Q4 2016 Earnings Release • 1 |

Consolidated sales revenues of AR$13,015 million for the quarter ended on December 31, 2016, compared to AR$1,791 million for the fourth quarter 2015 (‘Q4 15’), mainly explained by increases of AR$1,099 million in power generation, AR$3,070 million in electricity distribution, AR$3,547 million in oil and gas, AR$3,825 million in refining and distribution, AR$1,592 million in petrochemicals and AR$1 million in holding and others segment, partially offset by higher eliminations from intersegment sales of AR$1,910 million.
Consolidated adjusted EBITDA³of AR$7,344 million for the fiscal year ended on December 31, 2016, compared to a AR$4,079 million for the same period of 2015, mainly due to increases of AR$734 million in power generation, AR$4,637 million in oil and gas, AR$113 million in petrochemicals and AR$122 million in intersegment eliminations, partially offset by decreases of AR$1,132 million in electricity distribution, AR$102 million in refining and distribution and AR$1,108 million in holding and others segment.
Consolidated adjusted EBITDA of AR$4,184 million for the quarter ended on December 31, 2016, compared to an adjusted EBITDA of AR$1,479 million for Q4 15, mainly due to increases of AR$326 million in power generation, AR$944 million in electricity distribution, AR$2,248 million in oil and gas segment, AR$70 million in petrochemicals and AR$100 million in intersegment eliminations, partially offset by reductions of AR$371 million in refining and distribution and AR$613 million in holding and others.
Consolidated Loss of AR$252 million during the fiscal year ended on December 31, 2016, of which AR$11 million is attributable to the owners of the Company, below the gain of AR$3,065 million attributable to the owners of the Company in the same period of 2015, mainly explained by reported losses in electricity distribution (AR$1,147 million), petrochemicals (AR$89 million) and holding and others (AR$674 million), partially offset by reported profits in power generation (AR$1,045 million), oil and gas (AR$627 million), refining and distribution (AR$106 million) and intersegment eliminations (AR$121 million).
Consolidated gain of AR$1,292 million for the quarter ended on December 31, 2016, of which AR$982 million are attributable to the owners of the Company, AR$1,080 million less compared to the gain of AR$2,062 million attributable to the owners of the Company in the Q4 15, explained by reported losses in our segments of refining and distribution (AR$109 million), petrochemicals (AR$118 million), partially offset by reported earnings in our segments of power generation (AR$439 million), electricity distribution (AR$214 million), oil and gas (AR$29 million), holding and others (AR$427 million) and intersegment eliminations (AR$100 million).
³ Adjusted consolidated EBITDA represents the consolidated results for continuing activities before net financial results, income taxes, depreciation, amortization, one-time income and expenses, and non-controlling interest, including other non-accrued collections and other adjustments related to IFRS. For more information regarding the adjustments in the EBITDA, please refer to section 3 of this Earnings Release.
Pampa Energia• Q4 2016 Earnings Release •2 |
Table of Contents
Pampa Energia• Q4 2016 Earnings Release •3 |
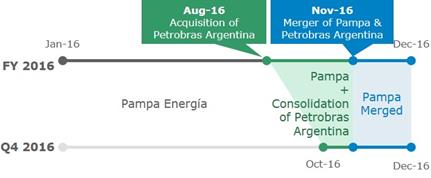
1.1 The Acquisition of Petrobras Argentina S.A. (‘Petrobras Argentina’)
1.1.1 Final Adjustments to the Acquisition Price
Based on the stock purchase agreement signed on May 13, 2016, on November 21, 2016, Pampa and Petrobras Brasileiro S.A. carried out certain adjustments to the final price paid by Pampa for the capital stock and votes of Petrobras Participaciones S.L., a company that held 67.1933% of the capital stock and votes of Petrobras Argentina (the ‘Transaction’). The final price was set at US$900.4 million.
1.1.2 Share Exchange of Transportadora de Gas del Sur S.A. (‘TGS’) and Collection of the Seller Financing
According to the sale contract of TGS subscribed on July 19, 2016, Pampa agreed an option due on February 2017 to receive the rights as a unique beneficiary of a trust, that held 40% of the share capital of Compañía de Inversiones de Energía S.A. (‘CIESA’), the controlling company of the 51% of TGS, in exchange of 40% of CIESA shares under Petrobras Argentina ownership.
On January 17, 2017, Pampa executed the option, by which Grupo Inversor Petroquímica S.L. (‘GIP’) and PCT LLC assigned to Petrobras Hispano Argentina S.A. the CIESA trust, in exchange of 40% of CIESA. Therefore, the indirect participations of GIP, PCT LLC and Pampa over TGS stayed unaltered after the exchange, which was approved by ENARGAS on December 29, 2016.
In addition, on January 17, 2017, GIP, PCT LLC and WST S.A. paid Pampa and PISA the outstanding purchase price of US$80 million plus interests.
1.1.3 Cancellation of the Syndicate Loan
On July 26, 2016, Pampa subscribed a Syndicate Loan led by Deutsche Bank, Citibank, ICBC, Banco Galicia, Crédit Agricole and Banco Hipotecario. The Syndicate Loan financed US$271 million from the US$ tranche at the closing of the Transaction on July 27, 2016. Moreover, on November 22, 2016 the Syndicate Loan disbursed another AR$2,956 million from the AR$ tranche to partially finance the cash tender offer for the acquisition of the remaining 32.8% of Petrobras Argentina, mandatory according to the Capital Markets Law (‘CML’).
On December 7, 2016, Pampa partially settled US$130 million to the US$ tranche and AR$1,000 million to the AR$ tranche.
Finally, as of the issuance of this Earnings Release, Pampa fully repaid the outstanding amounts in US$ and AR$ tranches.
1.1.4 Mandatory Cash Tender Offers and Voluntary Exchange Offers for Petrobras Argentina Shares
In compliance with the CML and the rules from Comisión Nacional de Valores (Argentine Securities Commission or the ‘CNV’), on October 6, 2016, the Company announced the commencement of the mandatory cash tender offer for0020the shares of Petrobras Argentina not owned by Pampa (the ‘Cash Offer’) and a voluntary exchange offer of the shares of Petrobras Argentina for Pampa’s shares (the ‘Exchange Offer’, jointly the ‘Offers’). The Offers were closed on November 14, 2016, being the results as follows:
Pampa Energia• Q4 2016 Earnings Release •4 |
i. Exchange Offer: validly tendered and not withdrawn 53.9 million shares and 21.4 million ADSs of Petrobras Argentina, consequently Pampa issued in exchange 28.3 million shares and 4.5 million ADSs of Pampa, respectively;
ii. Cash Offer: validly tendered and not withdrawn 311.7 million shares of Petrobras Argentina, consequently Pampa paid a total amount of AR$3,233 million, being in each case net of applicable Argentine withholding taxes. In order to finance said disbursement, AR$2,956 million from the Syndicate Loan AR$ tranche was called, and the remaining amount was financed from short-term loans called from several banks.
Thus, following Pampa’s issuances, the Company reached to 1,836,494,690 of outstanding shares and held direct and indirectly 90.4% of the capital stock and votes of Petrobras Argentina. The settlement of the Exchange and Cash Offers took place on November 22 and 23, 2016, respectively.
1.1.5 Corporate Intragroup Reorganization: Merger of Pampa and Petrobras Argentina
In accordance with the merger by absorption of Pampa —as the surviving company— with Petrobras Argentina and its fully-owned subsidiaries Petrobras Energía Internacional S.A. (‘PEISA’) and Albares Renovables Argentina S.A. (‘Albares’) —as the absorbed companies—, on December 7, 2016 the Board of Directors of Pampa approved the exchange ratio of 0.3648 ordinary shares of Pampa for each ordinary share of Petrobras Argentina.
However, on December 19, 2016 the CNV informed Pampa of its decision to reject the proposed exchange ratio. In accordance with the notice from the CNV, the CNV understands that there are no objective changes in the economic circumstances involving the companies for which reason the exchange ratio offered in the voluntary Exchange Offer that expired on November 14, 2016 should be changed. Along with these line, Pampa and Petrobras Argentina analyzed the consequences of appealing such decision and considered it would result in serious delays to the merger process, and therefore, on December 23, 2016 Pampa and Petrobras Argentina resolved to accept the request from the CNV, thereby modifying the merger exchange ratio and fixing it at the same ratio that was used in the voluntary Exchange Offer, which was 0.5253 ordinary shares of Pampa for each ordinary share of Petrobras Argentina.
On January 16, 2017, Pampa and Petrobras Argentina called for an extraordinary shareholder’s meeting on February 16, 2017, in order to submit for its approval the conditions for the corporate intragroup reorganization. The merger prospectus for both local shareholders and ADSs shareholders were reviewed and authorized by the respective regulatory entities, and published on their respective public sites.
The approval of the merger was solved by a majority vote of 99.99% of the shares with a right to vote of Pampa. Moreover, the General Extraordinary Shareholder’s Meeting of Petrobras Argentina approved the Merger by a majority of 92.98% of the shares with a right to vote, having registered 0.16% of votes against it, 0.03% of abstentions and 6.83% of shareholders that did not participate of the Shareholders Meeting.
According to CNV’s rules, Pampa filed before said authority the necessary authorization procedures for the merger. Once the exchange offer are fully executed, Pampa will issue 101,873,741 ordinary shares, with a nominal value of AR$1 and entitled to one vote per share, being the capital stock of the Company composed by 1,938,368,431 ordinary shares following the effect of the merger. As of the issuance of this Earnings Release, regulatory actions and CNV’s instruction to subscribe the merger before the Public Registry are pending.
Pampa Energia• Q4 2016 Earnings Release • 5 |
1.2 Issuance of Series 1 Bond Notes of Pampa Energía
Under the simple Bond Notes program up to US$1 billion or its equivalent in other currencies, on January 17, 2017, the Company successfully completed the placement of series 1 Bond Notes, denominated in US$ at a fixed rate, issuing for a nominal value of US$750 million after having received offers of purchase of US$4 billion, more than 5 times compared to the original nominal value to be issued. The issue price was 99.136% of the face value, at a fixed nominal annual rate of 7.5%, yielding 7.625% and maturing in 10 years. The banks that led the transaction were Citigroup and Deutsche Bank Securities, in addition to Crédit Agricole CIB and Santander as initial purchasers and BACS Banco de Crédito y Securitización, Banco Hipotecario, Banco Galicia, ICBC and BST as local underwriters.
1.3 Relevant Events from Our Generation Segment
1.3.1 SEE Res. No. 19E/17
On January 27, 2017, it was published in the Public Gazzette (‘BO’) the SEE Res. No. 19E/17, invalidating the remuneration scheme of the former SE Res. No. 22/16, but not revoking the SE Res. No. 95/13 and its amendments. The new regime mainly considers:
i. | A gradual implementation since February 1, 2017 until its completion in November 2017; |
ii. | Remunerative items in US$ breakdown by capacity and dispatch energy, differentiating technology and size, instead of the remuneration in AR$ from the SE Res. No. 22/16. Moreover, for Pampa’s generation units the thermal monomic price increases roughly by 42%, meanwhile the hydro monomic price increases by 80% approximately[4]; |
iii. | The centralization of the fuel procurement and delivery is still managed by the Wholesale Electricity Market (‘WEM’) Clearing House (‘CAMMESA’); |
iv. | Elimination of the credit-form remuneration, being the sales collected in cash in the next 45 days after settlement according to CAMMESA Procedures. It is worth to mention that during 2016 the days of sales outstanding have been normalized, having reached to a maximum of 105 days in 2016 and decreasing to the current average of 45 days of sales outstanding. |
1.3.2 Contract with CAMMESA for the Expansion of Central Piedra Buena S.A. (‘CPB’)
Under the SEE Res. No. 21/16 - Call to Companies Interested in Offering New Capacity with an Availability Commitment within the WEM, on December 5, 2016, our fully-owned subsidiary CPB signed a power supply contract for its 100 MW capacity expansion, which remunerates a fixed price of US$21.8 thousand per MW/month and an agreed variable price of US$12 and US$15 per MWh, for gas-fired and FO-fired, respectively.
1.3.3 Contract with CAMMESA for Pampa Eólico I Wind Farm (Corti)
Under the National and International Open Call ‘Programa RenovAr Ronda 1’, our awarded project named Pampa Eólico I - Corti, which consists in building a 100 MW installed capacity wind farm in Bahía Blanca, Buenos Aires Province and developed by our subsidiary Greenwind S.A. (‘Greenwind’), on January 23, 2017 signed a power supply contract with a monomic price of US$58/MWh.
4Only considers cash remuneration items.
Pampa Energia• Q4 2016 Earnings Release • 6 |
1.3.4 Sale of Greenwind Capital Stock
On March 12, 2017, Central Térmica Loma de la Lata S.A. (‘CTLL’) sold Greenwind’s 50% of share capital and votes to Valdatana Servicios y Gestiones S.L.U., an investment vehicle led by Castlelake L.P., a private equity global investment company that manages private funds, for a total consideration of US$11.2 million.
1.3.5 Summary of Committed Expansion Projects
Project | MW | Equipment Provider | Marketing | Awarded Price | Estimated Capex in | Date of Commissioning | ||
Capacity | Variable | Total | ||||||
Thermal |
|
|
|
|
|
|
|
|
Loma de la Lata | 15 | MAN | Res. SEE N° 19/17 | na | na | na | 18 | Q4 2017 |
105 | GE | US$ PPA for 10 years | 23,000 | 7.5 | 39.0 | 90 | Q3 2017 | |
Parque Ind. Pilar | 100 | Wärtsilä | US$ PPA for 10 years | 26,900 | 15 - 16 | 52 | 105 | Q3 2017 |
Piedra Buena | 100 | Wärtsilä | US$ PPA for 10 years | 21,800 | 12 - 15 | 42 - 45 | 90 | Q1 2018 |
Renewable |
|
|
|
|
|
|
|
|
Pampa Eólico I (Corti) | 100 | Vestas | US$ PPA for 20 years | na | na | 58 | 135 | Q2 2018 |
Total | 420 |
|
|
|
|
| 438 |
|
* Amounts without VAT
1.4 Relevant Events of Transener
1.4.1 Extension of the Instrumental Agreement
On December 26, 2016, the SEE recognized in favor of Transener and Transba higher costs variation credits for the amount of AR$1,503 million and AR$515 million, respectively, for the period between December 2015 and January 2017 (included). Therefore, the SEE instructed CAMMESA for the subscription of a Loan and Assignment of Credits as a Guarantee, which shall be settled by the assignment and determination of recognized credits mentioned before. In addition, the agreement considers an investment plan for the period of October 2016 and March 2017, for an amount of AR$299 million for Transener and AR$121 million for Transba.
The agreement acknowledging higher costs will be valid until January 31, 2017, date the tariff schedules from the Integral Tariff Revision (‘RTI’) came into force. As of December 31, 2016, the outstanding estimated recognized credit was AR$736 million and AR$177 million for Transener and Transba, respectively.
1.4.2 RTI
In accordance with the Ministry of Energy and Mining (‘MEyM’) Res. No. 524/16 that approved the electricity transportation RTI program, in December 2016 it was carried out the public hearings in which Transener presented its proposal, requesting a capital base of AR$12,214 million and AR$6,157 million as well as regulated income of AR$4,173 million and AR$2,112 million for Transener and Transba, respectively.
On January 31, 2017, the National Regulatory Authority of Electricity (‘ENRE’) issued the Resolutions No. 66/17 and 73/17, in which established the tariffs for the five-year period 2017/2021, being recognized a capital base of AR$8,343 million and AR$3,397 million as well as granted a regulated income of AR$3,274 million and AR$1,499 million for Transener and Transba, respectively. In addition, theENRE established the
Pampa Energia• Q4 2016 Earnings Release •7 |
remuneration updating mechanism, the service’s quality standards, awards and penalties and the investment plan to be done by both companies during these five-year period.
However, Transener is currently analyzing the RTI impact and assessing the course of measures to be taken.
1.5.1 Injunctions
As of the closing of the third quarter of 2016, the customers from La Matanza and Pilar districts were exempt since February 2016 from the application of the tariff scheme with the increases established by the MEyM Res. No. 6 and 7/16. Though, within the Note No. 123.967 dated December 28, 2016, the ENRE established that Edenor can proceed to apply the tariff scheme with increases to the clients from La Matanza and Pilar districts since October 24, 2016 and November 14, 2016, respectively.
Moreover, the Note established that Edenor should collect retroactively since February 2016 to the T2 and T3 category clients from Pilar district, in the number of installments equivalent to the number of bills affected due to the application of these injunctions. At the request of the client, the number of installments could be extended to the double, subject to the interest rate established by the bank Banco de la Nación Argentina.
Until the legal matter of the affected injunctions is solved, the ENRE instructed not to collect the retroactive amounts to the clients of La Matanza and the category T1 clients from Pilar. Because of the described situation and aiming to preserve a secured and continuous public service of electricity distribution, Edenor was forced to halt temporarily and partially the payments for energy purchases to CAMMESA, for the period between July and November of 2016. Finally, on December 26, 2016, CAMMESA, with the instructions of MEyM, proceeded to grant the credits in favor of Edenor due to the effect from the injunctions that affected the electricity price and the Value-Added of Distribution (‘VAD’) for a total amount of AR$1,126 million of VAD and AR$270 million of energy purchases.
1.5.2 RTI
On February 1, 2017, in the BO it was published the ENRE Res. No. 63/17, in which established the definitive tariff schemes, the cost reviews, the required quality standards and other rights and duties that Edenor must comply with as of February 1, 2017.
The RTI resulted in a tariff scheme applicable during the following five-year period, which results in income 18% below the requested level. The income granted by the regulator and passed through into tariff considers an asset base of AR$34.5 billion, corresponding to the net replacement value of the assets depreciated, a capital remuneration income that emerge from the application of the cost of capital rate before tax of 12.46% over the indicated asset base as well as operating costs of AR$6,352 million. These figures are as of December 2015. Going forward, the tariff scheme foresees semiannual adjustments in order to reflect the inflation whenever the variation is greater than 5%, considering the wage increases, wholesale and consumer price indexes. The considered index to bring the figures expressed above to 2017 was 38%.
Said Res. indicates that ENRE, by the MEyM’s instruction, must limit the VAD increase to the maximum of 42% in relation to the current VAD at the date of issuance of the aforementioned Res., requiring to complete the application of the remaining increase in two stages, being the first 19% incremental in November 2017 and the last one 17% incremental in February 2018. The three tariff schemes to be applied for each date are published in the Resolution. Additionally, the ENRE shall recognize the difference of the VAD produced to the gradual application of the tariff increase, recognized in the RTI, payable in 48 installments since February 2018, which will be incorporated to the VAD resulting as of that date.
Pampa Energia• Q4 2016 Earnings Release • 8 |
In addition, the ENRE published an amended Res. No. 92/17, where the residential users are breakdown into nine categories instead of seven.
However, as of the date of this Earnings Release, it is still pending the definitive treatment regarding all the aspects generated due to the default of the Agreement (Acta Acuerdo), including the outstanding regulatory liabilities and other effects derived from the partial adopted measures.
In November 2016, TGS submitted before ENARGAS for its approval its tariff proposal for the next five years as of April 1, 2017. The proposal was presented within public hearings carried out on December 2, 2016, in which consisted in:
i. The determination of the asset base or the assets’ value;
ii. The submission of the investment plan for the period 2017 – 2021, being the annual average of AR$1.4 billion approximately for the five-year period, which in comparison with the amounts invested in 2015 represents an increase of 665%; and
iii. The estimation of operating expenditures.
To the date of this Earnings Release, the regulatory entity has not disclosed the resulting tariff schemes from the RTI. It is expected that the new tariff schedule to be in force as of April 1, 2017, which is the stipulated date in the MEyM Res. No. 31/16.
1.7 Encouragement Program for the Investment in Development of Natural Gas Production from Unconventional Reservoirs
On March 6, 2017, the MEyM issued the Res. No. 46-E/2017, in which aims to incentivize investments for natural gas production from unconventional reservoirs in Neuquina Basin, creating the Encouragement Program valid since its publication until December 31, 2021 (the ‘Program’).
This Program sets a compensation mechanism for each beneficiary company for the unconventional gas -tight orshale- volume produced in Neuquina Basin, calculated from the minimum guaranteed price for the Program (the ‘Minimum Price’) and the weighted average sale price to the domestic market for each company, including gas from conventional and unconventional production (the ‘Effective Price’). The Minimum Price will be US$7.5/MBTU for the calendar year of 2018, decreasing by US$0.5/MBTU per year until reaching US$6.0/MBTU for the calendar year of 2021.
In addition, this Program stipulates a more agile payment method, where there is an initial disbursement of 85% of the theoretical compensation resulting from projections, and then it is adjusted by the real production, which could be positive or negative.
Finally, from the compensation entitled for each concession, it will be paid 88% to the companies and 12% to the province corresponding for each concession participating the Program.
1.8 RTI of Oleoductos del Valle S.A. (‘OldelVal’)
On March 8, 2017, the MEyM issued the Res. No. 49E/17, in which it granted a tariff increase for the oil transportation service of roughly 34% in relation to the current schedules, for the next five-year period 2017/2021 as of March 2017. It is worth to mention that OldelVal’s tariffs are denominated in US$ and the last tariff increase was set in December 2013.
Pampa Energia• Q4 2016 Earnings Release •9 |
1.9 Collection of Refino Plus Program
On November 30, 2016, the Decree No. 1204/16 was published in the BO, which approved the payment of the pending compensations of the Small Refiners Program (where our affiliate company, Refinería del Norte S.A., ‘Refinor’, is participant) with US$53.6 million in nominal value of Argentine sovereign bonds at an annual interest rate of 8% due to 2020 (‘Bonar 2020’), and revoked the Special Regime for Small Refiners (‘REFIPYME’) created within the Res. No. 1312/08. The date of collection was on March 1, 2017.
1.10 Creation of Compensation Plan in Shares
On February 10, 2017, with the aim of aligning personnel performance with Pampa’s strategic plan and creating a transparent and direct link between value creation for the shareholder and personnel remuneration, the Company approved the creation of a compensation plan payable in shares and a committee for its implementation. Messrs. Marcelo Mindlin, Gustavo Mariani, Damián Mindlin and Ricardo Torres are members of the Committee and they are not beneficiaries of the Plan.
Among the beneficiaries of 2017-2019 Plan, there are executive directors, certain directors and managers of Pampa. Plan beneficiaries could be altered through time.
To fund said Plan, the board of the Company approved the repurchase of shares of Pampa under the following terms and conditions:
i. | Maximum amount:up to AR$104.5 million from the Voluntary Reserve of Pampa; |
ii. | Maximum quantity and price:2.5 million ordinary shares or 100 thousand ADSs (0.136% of current Pampa’s capital stock or 0.129% of Pampa’s post-merger capital stock) and up to AR$42 per ordinary share or US$60 per ADS; and |
iii. | Market transactions limits:according to the rules, the daily quantity of shares to be repurchased shall be up to 25% of the share’s average daily trading volume for the 90 prior trading days, calculated from the stock markets that the Company is listed and to be carried out between February 14, 2017 and March 10, 2017. |
It is worth to mention that the amount of shares to be repurchased during the indicated period covers the payment of 2016 and 2017 fiscal years’ compensation Plan. To the date of this Release, Pampa repurchased in open market operations 193,000 ordinary shares and 92,280 ADSs, at an average price of AR$28.49 per ordinary share and US$46.36 per ADS.
1.11 The General Ordinary and Extraordinary Shareholder’s Meeting
The Board of Directors of Pampa solved to call the annual general ordinary and extraordinary shareholder’s meeting on April 7, 2017 at 11 am, to take place in the Pampa Energía Building.
Pampa Energia• Q4 2016 Earnings Release •10 |
2.1 Consolidated Balance Sheet (AR$ Million)
| As of 12.31.16 | As of 12.31.15 |
ASSETS | ||
Participation in joint businesses | 3,699 | 224 |
Participation in associates | 787 | 123 |
Property, plant and equipment | 41,090 | 14,509 |
Intangible assets | 2,014 | 734 |
Biological assets | 13 | 2 |
Other assets | 742 | 2,578 |
Financial assets with a results changing fair value | 62 | - |
Deferred tax assets | 1,232 | 52 |
Trade receivable and other credits | 4,469 | 1,229 |
Total non-current assets | 54,108 | 19,451 |
Inventories | 3,360 | 225 |
Other Assets | 1 | - |
Financial assets with a results changing fair value | 4,188 | 4,081 |
Investments at amortized cost | 23 | - |
Financial derivatives | 13 | - |
Trade receivable and other credits | 14,144 | 4,876 |
Cash and cash equivalents | 1,421 | 517 |
Total current assets | 23,150 | 9,699 |
Non-current assets held for sale | 19 | - |
Total assets | 77,277 | 29,150 |
| As of 12.31.16 | As of 12.31.15 |
EQUITY | ||
Share capital | 1,938 | 1,696 |
Share premium and other reserves | 4,963 | 1,231 |
Statutory reserve | 232 | 51 |
Voluntary reserve | 3,862 | 978 |
Retained earnings | (11) | 3,065 |
Other comprehensive result | 70 | (31) |
Equity attributable to | 11,054 | 6,990 |
Non-controlling interests | 3,020 | 1,391 |
Total equity | 14,074 | 8,381 |
LIABILITIES | ||
Accounts payable and other liabilities | 5,336 | 2,699 |
Borrowings | 15,286 | 6,685 |
Deferred revenues | 200 | 154 |
Salaries and social security payable | 94 | 80 |
Defined benefit plan obligations | 921 | 264 |
Deferred tax liabilities | 3,796 | 592 |
Income tax and minimum expected profit tax liability | 934 | 272 |
Tax payable | 306 | 128 |
Provisions | 6,267 | 313 |
Total non-current liabilities | 33,140 | 11,187 |
Accounts payable and other liabilities | 12,867 | 6,639 |
Borrowings | 10,686 | 1,308 |
Deferred income | 1 | 1 |
Salaries and social security payable | 1,745 | 887 |
Defined benefit plan obligations | 112 | 46 |
Income tax and minimum expected profit tax liability | 1,454 | 139 |
Tax payable | 2,392 | 473 |
Financial derivatives | - | 18 |
Provisions | 806 | 71 |
Total current liabilities | 30,063 | 9,582 |
Total liabilities | 63,203 | 20,769 |
Total liabilities and equity | 77,277 | 29,150 |
Pampa Energia• Q4 2016 Earnings Release •11 |
2.2 Consolidated Income Statement (AR$ Million)
| Full Year | 4th Quarter | ||||||
| 2016 |
| 2015 | 2016 |
| 2015 | ||
Sales revenue | 31,295 | 7,106 | 13,015 | 1,791 | ||||
Cost of sales | (25,136) | (7,038) | (9,615) | (1,875) | ||||
|
| |||||||
Gross profit |
| 6,159 |
| 68 |
| 3,400 |
| (84) |
|
| |||||||
Selling expenses | (2,952) | (973) | (1,250) | (297) | ||||
Administrative expenses | (3,676) | (1,221) | (1,328) | (425) | ||||
Exploration expenses | (135) | (3) | (59) | (3) | ||||
Other operating income | 2,854 | 941 | 829 | 611 | ||||
Other operating expenses | (2,253) | (769) | (1,136) | (335) | ||||
Recovery of property, plant and equipment impairment | - | 25 | 299 | - | ||||
Results for participation in joint businesses | 105 | 9 | 5 | (37) | ||||
Results for participation in associates | 7 | (10) | - | (8) | ||||
Results for sale of companies' stakes | 480 | - | - | - | ||||
|
| |||||||
Operating income before higher cost recognition and SE Res. No. 32/15 |
| 589 |
| (1,933) |
| 760 |
| (578) |
|
| |||||||
Income Recognition - Injunction in force Note MEyM No. 2016-04484723 | 1,126 | - | 1,126 | - | ||||
Income Recognition on account of the RTI – SE Res. No. 32/15 | 419 | 5,025 | 0 | 1,215 | ||||
Higher Cost Recognition – SE Res. No. 250/13 and subsequent Notes | 82 | 551 | - | 365 | ||||
|
| |||||||
Operating income |
| 2,216 |
| 3,643 |
| 1,886 |
| 1,002 |
|
| |||||||
Financial income | 893 | 336 | 410 | 140 | ||||
Financial costs | (4,296) | (1,257) | (1,257) | (561) | ||||
Other financial results | (163) | 1,714 | (320) | 1,529 | ||||
Financial results, net | (3,566) | 793 | (1,167) | 1,108 | ||||
|
| |||||||
Profit before tax |
| (1,350) |
| 4,436 |
| 719 |
| 2,110 |
|
| |||||||
Income tax and minimum expected profit tax | 1,098 | (587) | 573 | 199 | ||||
|
| |||||||
Net income for the period |
| (252) |
| 3,849 |
| 1,292 |
| 2,309 |
|
| |||||||
Attributable to: | ||||||||
Owners of the Company | (11) | 3,065 | 982 | 2,062 | ||||
Non-controlling interests | (241) | 784 | 310 | 247 | ||||
|
| |||||||
Net income for the period attributable to the owners of the Company (AR$ per share): | ||||||||
Basic and diluted income per share |
| (0.0063) |
| 2.2769 |
| 0.5287 |
| 1.4305 |
Pampa Energia• Q4 2016 Earnings Release •12 |
2.3 Cash and Financial Borrowings (AR$ Million)
Cash(1) | Consolidated Financial Statements | Ownership Adjusted |
(as of December 31, 2016) | ||
Power Generation | 571 | 514 |
Electricity Distribution | 2,260 | 1,167 |
Refining & Distribution | 14 | 14 |
Petrochemicals | - | - |
Holding and Others | 627 | 627 |
Oil and gas | 2,161 | 1,738 |
Total | 5,632 | 4,060 |
(1) It includes cash and ST investments from the consolidated financial statements. | ||
Bank and Financial Debt | Consolidated Financial Statements | Ownership Adjusted |
(as of December 31, 2016) | ||
Power Generation(2) | 2,991 | 2,973 |
Electricity Distribution | 2,854 | 1,485 |
Refining & Distribution | - | - |
Petrochemicals | - | - |
Holding and Others | 12,484 | 12,484 |
Oil and gas | 5,190 | 3,098 |
Total | 23,518 | 20,040 |
(1) It includes cash and short-term investments. (2) It does not include regulatory debt held against CAMMESA of AR$2,454 million.
2.3.1 Summary of Listed Debt Securities
Subsidiary | Security | Maturity | Amount Issued | Amount Outstanding | Coupon |
In US$ |
|
|
|
|
|
Transener1 | ON Series 2 | 2021 | 101 | 99 | 9.75% |
Edenor | ON par at fixed rate | 2022 | 300 | 176 | 9.75% |
EASA | ON par at fixed rate | 2017 | 4 | 2 | 5% |
ON at discount and fixed rate2 | 2021 | 130 | - | 8.5% | |
CTG | ON Series VIII US$-Link3 | 2020 | 1 | 1 | 7% |
CTLL | ON Series 4 US$-Link4 | 2020 | 34 | 34 | 6.25% |
TGS1 | ON par at fixed rate | 2020 | 192 | 192 | 9.625% |
Pampa Energía | ON Series T at discount & fixed rate | 2023 | 500 | 500 | 7.375% |
ON Series I at discount & fixed rate5 | 2027 | 750 | 750 | 7.5% | |
In AR$ |
|
|
|
|
|
CTG | ON Series VII | 2018 | 173 | 173 | Badlar Privada + 3.5% |
Petrolera Pampa | VCP Series XIV | 2017 | 296 | 296 | Badlar Privada + 5.9% |
ON Series II 'Inciso k' | 2017 | 525 | 525 | Badlar Privada | |
ON Series VII | 2017 | 310 | 310 | Badlar Privada + 5% | |
ON Series VIII | 2017 | 403 | 403 | Badlar Privada + 4% | |
Loma de la Lata | ON Series 3 | 2017 | 51 | 51 | Badlar Privada + 5% |
ON Series C | 2017 | 258 | 258 | Badlar Privada +4.5% | |
ON Series A | 2018 | 282 | 282 | Badlar Privada | |
ON Series E | 2020 | 575 | 575 | Badlar Privada |
Note: (1) Affiliates are not consolidated in Pampa’s financial statements, according to the IFRS standards. (2) Issuance amount includes capitalized interests. (3) Bond Note dollar-link, with initial FX rate of AR$14.7908/US$. (4) Bond Note dollar-link, with initial FX rate of AR$8.4917 /US$. (5) Bond Note issued after the closing of fiscal year.
Pampa Energia• Q4 2016 Earnings Release •13 |
3. Analysis of the Fourth Quarter 2016
Consolidated sales revenues of AR$13,015 million for the quarter ended on December 31, 2016, compared to AR$1,791 million for the fourth quarter 2015 (‘Q4 15’), mainly explained by increases of AR$1,099 million in power generation, AR$3,070 million in electricity distribution, AR$3,547 million in oil and gas, AR$3,825 million in refining and distribution, AR$1,592 million in petrochemicals and AR$1 million in holding and others segment, partially offset by higher eliminations from intersegment sales of AR$1,910 million.
Consolidated adjusted EBITDA of AR$4,184 million for the quarter ended on December 31, 2016, compared to an adjusted EBITDA of AR$1,479 million for Q4 15, mainly due to increases of AR$326 million in power generation, AR$944 million in electricity distribution, AR$2,248 million in oil and gas segment, AR$70 million in petrochemicals and AR$100 million in intersegment eliminations, partially offset by reductions of AR$371 million in refining and distribution and AR$613 million in holding and others.
Consolidated gain of AR$1,292 million for the quarter ended on December 31, 2016, of which AR$982 million are attributable to the owners of the Company, AR$1,080 million less compared to the gain of AR$2,062 million attributable to the owners of the Company in the Q4 15, explained by reported losses in our segments of refining and distribution (AR$109 million), petrochemicals (AR$118 million), partially offset by reported earnings in our segments of power generation (AR$439 million), electricity distribution (AR$214 million), oil and gas (AR$29 million), holding and others (AR$427 million) and intersegment eliminations (AR$100 million).
Consolidated Adjusted EBITDA Calculation, in AR$ million | FY16 | FY15 | Q4 16 | Q4 15 | ||||
Consolidated operating income | 2,216 | 3,643 | 1,886 | 1,002 | ||||
Consolidated depreciations and amortizations | 3,022 | 720 | 1,227 | 243 | ||||
Consolidated EBITDA under IFRS standards |
| 5,238 |
| 4,363 |
| 3,113 |
| 1,245 |
|
|
| ||||||
Adjustments from generation segment |
| (32) |
| (32) |
| (22) |
| - |
Adjustments from distribution segment |
| 1,007 |
| (610) |
| 91 |
| (37) |
SE Res. No. 250/13, 32/15 and subsequent notes adjustments |
| - |
| (682) |
| - |
| (48) |
Backdated penalties and interests adjustments |
| 873 |
| - |
| 48 |
| - |
Other Adjustments (PUREE, late payment interests) |
| 134 |
| 72 |
| 43 |
| 12 |
Adjustments from oil and gas segment |
| 1,460 |
| - |
| 1,552 |
| - |
Results for sale of property, plant and equipment |
| - |
| - |
| 358 |
| - |
Extraordinary contribution contigency |
| 281 |
| - |
| 281 |
| - |
Cease of operations in Medanito block (La Pampa) |
| 213 |
| - |
| (0) |
| - |
Re-estimation of Ship or Pay contract (Ecuador) |
| 371 |
| - |
| 371 |
| - |
Loss from credit removal due to Oil Companies' agreement (WTI 28.5 US$/BBL) |
| 365 |
| - |
| 365 |
| - |
Others (update of contingencies from Petrobras Argentina, retirement of wells) |
| 229 |
| - |
| 177 |
| - |
Adjustments from refining and distribution segment |
| (364) |
| - |
| (363) |
| - |
Gain from liability removal due to Oil Companies' agreement (WTI 28.5 US$/BBL) |
| (365) |
| - |
| (365) |
| - |
Adjustments from petrochemicals segment |
| 166 |
| - |
| 166 |
| - |
Adjustments from holding and others segment |
| (131) |
| 359 |
| (354) |
| 270 |
Revaluation of arbitral lawsuit |
| - |
| 215 |
| - |
| 215 |
Re-estimation of Ship of Pay contract (Ecuador) |
| (522) |
| - |
| (522) |
| - |
Expenses related to the acquisition of Petrobras Argentina |
| 539 |
| - |
| 121 |
| - |
Results from the sale of participation in subsidiaries |
| (480) |
| - |
| - |
| - |
TGS's EBITDA adjusted by indirect ownership of 25.5% |
| 296 |
| 10 |
| 243 |
| 8 |
Transener's EBITDA adjusted by indirect ownership of 26.3% |
| (18) |
| 134 |
| (263) |
| 47 |
Others (update of contingencies from Petrobras Argentina, recovery of expenses) |
| 55 |
| - |
| 67 |
| (0) |
|
|
|
|
|
|
|
|
|
Consolidated adjusted EBITDA |
| 7,344 |
| 4,079 |
| 4,184 |
| 1,479 |
Pampa Energia• Q4 2016 Earnings Release •14 |
3.1 Analysis of the Power Generation Segment
Power Generation Segment, Consolidated | Fiscal Year | 4th Quarter | ||||
2016 | 2015 | ∆ % | 2016 | 2015 | ∆ % | |
Sales revenue | 4,624 | 2,418 | +91.2% | 1,662 | 563 | +195.2% |
Cost of sales | (2,726) | (1,282) | +112.6% | (1,125) | (323) | +248.3% |
Gross profit | 1,898 | 1,136 | +67.1% | 537 | 240 | +123.8% |
Selling expenses | (65) | (24) | +170.8% | (28) | (8) | +250.0% |
Administrative expenses | (392) | (262) | +49.6% | (69) | (69) | - |
Other operating income | 55 | 91 | -39.6% | 25 | 76 | -67.1% |
Other operating expenses | (104) | (79) | +31.6% | (38) | (26) | +46.2% |
Recovery of property, plant and equipment impairment | - | 25 | -100.0% | - | - | NA |
Operating income | 1,392 | 887 | +56.9% | 427 | 213 | +100.5% |
Finance income | 600 | 295 | +103.4% | 246 | 113 | +117.7% |
Finance costs | (750) | (358) | +109.5% | (200) | (111) | +80.2% |
Other financial results | 228 | (82) | NA | 53 | 25 | +112.0% |
Profit before tax | 1,470 | 742 | +98.1% | 526 | 240 | +119.2% |
Income tax and minimum expected profit tax | (317) | (192) | +65.1% | (62) | (47) | +31.9% |
Net income for the period | 1,153 | 550 | +109.6% | 464 | 193 | +140.4% |
Attributable to: | ||||||
Owners of the Company | 1,045 | 497 | +110.3% | 439 | 169 | +159.8% |
Non-controlling interests | 108 | 53 | +103.8% | 25 | 24 | +4.2% |
Adjusted EBITDA | 1,738 | 1,004 | +73.2% | 574 | 248 | +131.6% |
In Q4 16, power generation gross margin was AR$537 million, 124% higher than the same period of 2015, mainly due to the inclusion as of August 2016 of Pichi Picún Leufú Hydroelectric Plant (‘HPPL’), Genelba Thermal Power Plant (‘CTGEBA’) and EcoEnergía Co-Generation Plant (‘EcoEnergía’), which during Q4 16 contributed sales by 1,624 GWh of the total of 3,763 GWh sold.
In operating terms, the mentioned assets’ performance was lower compared to the same period of 2015, mainly due to the lower dispatch at HPPL explained by poor water inputs (-142 GWh), partially offset by higher power generation in CTGEBA and EcoEnergía (+20 GWh).
Pampa’s power generation during Q4 16 increased 94% compared to Q4 15, mainly due to higher dispatch in CTLL (+264 GWh) due to the commissioning of the 105 MW TG04 in July 2016, in addition to a larger dispatch of our hydro units (+48 GWh) due to greater water inputs and pumping activity and lesser maintenance stops and unavailability in CTG and CTP (+58 GWh). These increases were partially offset by a technical problem with a heater at CPB (-136 GWh).
Pampa Energia• Q4 2016 Earnings Release •15 |
Summary of | Hydroelectric | Thermal | Total | |||||||
HINISA | HIDISA | HPPL1 | CTLL2 | CTG3 | CTP | CPB | Genelba1 | Eco- | ||
Installed Capacity (MW) | 265 | 388 | 285 | 645 | 361 | 30 | 620 | 825 | 14 | 3,433 |
Market Share | 0.8% | 1.1% | 0.8% | 1.9% | 1.1% | 0.1% | 1.8% | 2.4% | 0.04% | 10.1% |
Full Year |
|
|
|
|
|
|
|
|
|
|
Net Generation 2016 (GWh) | 706 | 564 | 176 | 3,644 | 1,577 | 155 | 2,054 | 2,211 | 43 | 11,131 |
Market Share | 0.5% | 0.4% | na | 2.7% | 1.2% | 0.1% | 1.5% | na | na | 8.2% |
Sales 2016 (GWh) | 706 | 564 | 176 | 3,644 | 2,076 | 155 | 2,056 | 2,499 | 44 | 11,921 |
Net Generation 2015 (GWh) | 538 | 367 | 0 | 2,582 | 1,682 | 152 | 2,737 | 0 | 0 | 8,057 |
Variation Net Generation 2016 - 2015 | +31.2% | +53.8% | na | +41.1% | -6.2% | +2.4% | -24.9% | na | na | +38.2% |
Sales 2015 (GWh) | 539 | 367 | 0 | 2,582 | 2,283 | 152 | 2,739 | 0 | 0 | 8,661 |
Average Price 2016 (US$ / MWh) | 17.4 | 16.8 | 24.3 | 27.1 | 30.5 | 51.6 | 14.2 | 34.0 | 60.2 | 26.3 |
Average Gross Margin 2016 (US$ / MWh) | 8.0 | 4.3 | 21.9 | 22.8 | 13.6 | n.d. | 1.1 | 11.7 | 18.9 | 13.0 |
Average Gross Margin 2016 (US$ / MWh) | 2.4 | (1.5) | n.d. | 34.8 | 12.1 | n.d. | 4.5 | n.d. | n.d. | 15.3 |
Fourth Quarter |
|
|
|
|
|
|
|
|
|
|
Net Generation Q4 16 (GWh) | 244 | 176 | 119 | 837 | 386 | 43 | 333 | 1,304 | 27 | 3,469 |
Market Share | 0.7% | 0.5% | 0.4% | 2.5% | 1.2% | 0.1% | 1.0% | 3.9% | 0.1% | 10.5% |
Sales Q4 16 (GWh) | 244 | 176 | 119 | 837 | 505 | 43 | 333 | 1,478 | 27 | 3,763 |
Net Generation Q4 15 (GWh) | 239 | 134 | 0 | 572 | 339 | 32 | 469 | 0 | 0 | 1,785 |
Variation Net Generation Q4 16 - Q4 15 | +2.5% | +31.6% | na | +46.2% | +13.9% | +34.4% | -28.9% | na | na | +94.4% |
Sales Q4 15 (GWh) | 239 | 134 | 0 | 572 | 476 | 32 | 470 | 0 | 0 | 1,922 |
Average Price Q4 16 (US$ / MWh) | 14.4 | 15.0 | 21.7 | 30.0 | 30.7 | 46.7 | 16.6 | 33.5 | 54.2 | 27.1 |
Average Gross Margin Q4 16 (US$ / MWh) | 5.9 | 4.2 | 16.8 | 22.4 | 11.2 | n.d. | (9.9) | 13.9 | 14.4 | 10.8 |
Average Gross Margin Q4 15 (US$ / MWh) | 4.0 | 0.5 | - | 28.6 | 16.2 | n.d. | (1.6) | - | - | 12.9 |
Note: Gross margin before amortization and depreciation. FX rate of AR$/US$: 2016 – 14.78; 2015 – 9.27; 4T16 – 15.45; 4T15 – 10.17. (1) The figures from HPPL, CTGEBA and EcoEnergía accounts from the closing of the acquisition on August 2016. (2) The installed capacity of CTLL includes 105 MW from the new gas turbine that commissioned on July 2016. (3) CTG’s gross margin considers results for CTP.
The increase in gross margin is also explained by the update in old capacity remuneration scheme by the application of SEE Res. No. 22/16 from February 2016 and the devaluation in the nominal exchange rate with impact on our Energy Plus and Resolution SE No. 220/07 power supply contracts. These increases were partially offset by higher labor costs and expenses for scheduled maintenance services.
Net operating costs increased 253% in relation to Q4 15, mainly due to higher labor costs and the inclusion of HPPL, CTGEBA and EcoEnergía.
Net financial results had a higher profit of AR$72 million compared to Q4 15, recording a gain of AR$99 million in Q4 16, mainly due to higher profit from holding financial instruments and lower net exchange difference losses due to the lower devaluation of the local currency against the US dollar, partially offset by higher interest losses on financial liabilities.
Adjusted EBITDA increased by 132% over Q4 15, mainly due to the inclusion of former Petrobras Argentina's generation assets since August 2016, which contributed to adjusted EBITDA AR$132 million in Q4 16, together with a better price remuneration, Peso devaluation, recognition of a higher price for assignments of gas, partially offset by higher labor and maintenance costs. Adjusted EBITDA does not include minor non-recurring amounts such as recovery of insurance and expenses, that amounted to AR$22 million at CTG in Q4 16.
Pampa Energia• Q4 2016 Earnings Release •16 |
3.2 Analysis of the Electricity Distribution Segment
Electricity Distribution Segment, Consolidated | Fiscal Year | 4th Quarter | ||||
2016 | 2015 | ∆ % | 2016 | 2015 | ∆ % | |
Sales revenue | 13,079 | 3,802 | +244.0% | 3,961 | 891 | NA |
Cost of sales | (12,220) | (5,189) | +135.5% | (2,869) | (1,300) | +120.7% |
Gross profit | 859 | (1,387) | NA | 1,092 | (409) | NA |
Selling expenses | (1,618) | (833) | +94.2% | (517) | (232) | +122.8% |
Administrative expenses | (1,171) | (697) | +68.0% | (351) | (224) | +56.7% |
Other operating income | 91 | 80 | +13.8% | 32 | 27 | +18.5% |
Other operating expenses | (465) | (599) | -22.4% | (108) | (269) | -59.9% |
Operating income before higher cost recognition and | (2,304) | (3,436) | -32.9% | 148 | (1,107) | NA |
Income Recognition – Injunctions Note MEyM No. 2016-04484723 | 1,126 | - | NA | 1,126 | - | NA |
Income Recognition on account of the RTI – SE Res. No. 32/15 | 419 | 5,025 | -91.7% | 0 | 1,215 | -100.0% |
Higher Cost Recognition – SE Res. No. 250/13 and subsequent Notes and SE Res. No. 32/15 | 82 | 551 | -85.1% | - | 365 | -100.0% |
Operating income | (677) | 2,140 | NA | 1,274 | 473 | +169.3% |
Finance income | 206 | 96 | +114.6% | 66 | 37 | +78.4% |
Finance costs | (1,645) | (577) | +185.1% | (412) | (335) | +23.0% |
Other financial results | (360) | (870) | -58.6% | (73) | (700) | -89.6% |
Profit before tax | (2,476) | 789 | NA | 855 | (525) | NA |
Income tax and minimum expected profit tax | 753 | (176) | NA | (325) | 392 | NA |
Net income for the period | (1,723) | 613 | NA | 530 | (133) | NA |
Attributable to: | ||||||
Owners of the Company | (1,147) | 59 | NA | 214 | (232) | NA |
Non-controlling interests | (576) | 554 | NA | 316 | 99 | +219.2% |
Adjusted EBITDA | 694 | 1,825 | -62.0% | 1,462 | 517 | +182.5% |
Our electricity distribution segment was the only business not affected by the incorporation of Petrobras Argentina’s assets.
In Q4 16, net sales increased AR$3,070 million in relation to Q4 15, mainly due to the application of the tariff increase for customers not framed within the injunctions. Those who are beneficiaries of the injunctions are located in La Matanza and Pilar districts and paid the tariff without increase until October 24 and November 14, 2016, respectively[5]. Moreover, in Q4 16 it was recorded higher accrual of funds destined to FOCEDE, posting an amount of AR$550 million.
These increases were partially offset by lower electricity sales in Q4 16, which decreased by 5% in GWh terms compared to the same period in 2015. At the same time, Edenor's customers increased by 1%.
[5] For further information, see section 1.5.1 of this Earnings Release.
Pampa Energia• Q4 2016 Earnings Release •17 |
Edenor's Sales | 2016 | 2015 | Variation | |||||
In GWh | Part. % | Clients | In GWh | Part. % | Clients | % | % Clients | |
Full Year |
|
|
|
|
|
|
|
|
Residential | 9,708 | 44% | 2,496,946 | 9,671 | 43% | 2,467,757 | +0.4% | +1.2% |
Commercial | 3,639 | 16% | 361,485 | 3,706 | 17% | 359,626 | -1.8% | +0.5% |
Industrial | 3,677 | 17% | 6,840 | 3,680 | 16% | 6,706 | -0.1% | +2.0% |
Wheeling System | 4,014 | 18% | 713 | 4,200 | 19% | 708 | -4.4% | +0.7% |
Others | ||||||||
Public Lighting | 704 | 3% | 21 | 688 | 3% | 22 | +2.3% | -4.5% |
Shantytowns and Others | 511 | 2% | 407 | 435 | 2% | 410 | +17.5% | -0.7% |
|
|
|
|
|
|
|
|
|
Total | 22,253 | 100% | 2,866,412 | 22,381 | 100% | 2,835,229 | -0.6% | +1.1% |
Fourth Quarter |
|
|
|
|
|
|
|
|
Residential | 2,086 | 41% | 2,496,946 | 2,267 | 42% | 2,467,757 | -8.0% | +1.2% |
Commercial | 874 | 17% | 361,485 | 922 | 17% | 359,626 | -5.2% | +0.5% |
Industrial | 907 | 18% | 6,840 | 934 | 17% | 6,706 | -2.8% | +2.0% |
Wheeling System | 1,004 | 20% | 713 | 1,051 | 19% | 708 | -4.5% | +0.7% |
Others | ||||||||
Public Lighting | 160 | 3% | 21 | 151 | 3% | 22 | +5.8% | -4.5% |
Shantytowns and Others | 108 | 2% | 407 | 97 | 2% | 410 | +10.5% | -0.7% |
|
|
|
|
|
|
|
|
|
Total | 5,139 | 100% | 2,866,412 | 5,422 | 100% | 2,835,229 | -5.2% | +1.1% |
Net operating costs, excluding energy purchases, increased by 173% compared to Q4 15, mainly due to the increase in penalties driven by the tariff increase, which was not fully pass-through to the proportion of customers without tariff increase, in addition to higher salary costs and fees to third parties. Energy purchases increased by 173% compared to Q4 15, due to the increase in electricity prices as of February 2016 set forth in MEyM Res. No. 6/16.
Operating result increased by AR$801 million compared to Q4 15, mainly due to CAMMESA’s acknowledgement of AR$1,126 million to the effect of injunctions in force, caused by not applying the tariff increases as of February 2016 to La Matanza and Pilar districts. In addition, the increase in operating costs was higher than the application of SE Res. No. 32/15, 250 / 12 and MEyM Res. No. 7/16.
During Q4 16, losses on net financial results decreased by AR$579 million to a loss of AR$419 million, mainly due to higher profit from the holding of financial instruments and lower net foreign exchange rate losses as a result of a lower devaluation of the local currency against the US dollar, partially offset by higher commercial interests from the debt held against CAMMESA, together with higher interest loss on financial liabilities in US$.
Adjusted EBITDA in Q4 16 for our electricity distribution segment posted a gain of AR$1,462 million, which includes late payment penalties for AR$43 million and a reclassification of financial interests over the balance of sanctioned penalties of AR$48 million, while in Q4 15 the adjusted EBITDA amounted to AR$517 million and only included AR$12 million of late payment penalties and a negative adjustment from the gain recorded from recognition of higher salary costs loan (SE Res. No. 32/15) for AR$48 million.
Pampa Energia• Q4 2016 Earnings Release •18 |
3.3 Analysis of the Oil and Gas Segment
Oil & Gas Segment, Consolidated | Fiscal Year | 4th Quarter | ||||
2016 | 2015 | ∆ % | 2016 | 2015 | ∆ % | |
Sales revenue | 8,035 | 944 | NA | 3,887 | 340 | NA |
Cost of sales | (5,678) | (660) | NA | (2,691) | (270) | NA |
Gross profit | 2,357 | 284 | NA | 1,196 | 70 | NA |
Selling expenses | (397) | (116) | +242.2% | (180) | (57) | +215.8% |
Administrative expenses | (657) | (150) | NA | (320) | (74) | NA |
Gastos de exploración | (135) | (3) | NA | (59) | (3) | NA |
Other operating income | 2,127 | 552 | +285.3% | 533 | 292 | +82.5% |
Other operating expenses | (1,482) | (82) | NA | (1,022) | (36) | NA |
Operating income | 1,824 | 485 | +276.1% | 155 | 192 | -19.3% |
Finance income | 141 | 6 | NA | 102 | 5 | NA |
Finance costs | (740) | (389) | +90.2% | (167) | (140) | +19.3% |
Other financial results | (21) | 414 | NA | 55 | 305 | -82.0% |
Profit before tax | 1,204 | 516 | +133.3% | 145 | 362 | -59.9% |
Income tax and minimum expected profit tax | (329) | (164) | +100.6% | (88) | (117) | -24.8% |
Net income for the period | 875 | 352 | +148.6% | 57 | 245 | -76.7% |
- | - | |||||
Attributable to: | ||||||
Owners of the Company | 627 | 175 | +258.3% | 29 | 121 | -76.0% |
Non-controlling interests | 248 | 177 | +40.1% | 28 | 124 | -77.4% |
Adjusted EBITDA | 5,398 | 761 | NA | 2,568 | 320 | NA |
The total production of oil and gas of Pampa in Q4 16 increased by 63.2 kboe/day in relation to Q4 15, mainly due to the inclusion of Petrobras Argentina since August 2016, essentially through its activities in the Neuquén Basin, which contributed 54.5 kboe/day out of the 77.1 kboe/day produced in Q4 16.
Only for operating comparison terms, the production of gas in Q4 16 from these assets including PELSA in comparison to the same period in 2015 was 24% lower, mainly due to the divestments in Río Neuquén, Aguada de la Arena y Colpa y Caranda. These decreases were partially offset by higher production as a result of improvements in average sales prices and an increase in the unconventional production at the Neuquén Basin, resulting in 5.1 million m3/day in Q4 16 and 6.7 million m3/day in the comparative period (Q4 15 includes 0.3 million m3/day from Bolivia). Moreover, oil production decreased to 23.8 kb/d, in comparison to 32.6 kb/d in Q4 15 (it includes 2.1 kb/d and 3.1 kb/d of foreign production in Q4 16 and Q4 15, respectively), mainly due to the cease of operations at Jagüel de los Machos block in the province of La Pampa in September 2015 as well as the cease of Medanito La Pampa in October 2016.
Moreover, Petrolera Pampa’s gas production increased from 2.3 million m3/day in Q4 15 to 3.2 million m3/day plus 3.9 kb/d of oil production in the same period of 2016, mainly as a result of our partnership with YPF in the Rincón del Mangrullo block and the service provided in Medanito La Pampa.
In Q4 16 the gross margin of our oil and gas segment increased by AR$1,126 million compared to Q4 15, mainly due to the production increase and the oil and gas price improvements in pesos, as an effect of the devaluation in the nominal exchange rate. These effects were partially offset by higher fixed assets amortization costs, higher gas production, transportation and royalties costs from higher production levels, in addition to the effect of the exchange rate variation over the costs denominated in US$.
At the end of 2016, in Argentina we accounted 1,924 productive wells and proven developed and undeveloped reserves amounted to 144 million boe, of which 67% corresponds to natural gas. The investments during Q4 16 amounted to AR$2,504 million, 3.5 times the amount disbursed on Q4 15.
Pampa Energia• Q4 2016 Earnings Release •19 |
Oil & Gas Production | Oil (m3/d) | Gas (dam3/d) | LPG (ton/d) | ||||||
Petrolera | Pampa | PELSA | Total | Petrolera | Pampa | PELSA | Total | Total | |
Full Year |
|
|
|
|
|
|
|
|
|
2016 Volume | 190 | 2,821 | 1,201 | 4,213 | 2,781 | 5,133 | 688 | 8,603 | 66 |
Average Price 2016 (US$/bbl) | 64.4 | 57.4 | 63.9 | 59.5 | |||||
Average Price 2016 (US$/MBTU) | 7.3 | 5.3 | 5.5 | 6.0 | |||||
Average Price 2016 (US$/ton) | 215.7 | ||||||||
| |||||||||
Volume 2015 | 26 | - | - | 26 | 1,547 | - | - | 1,547 | - |
Average Price 2015 (US$/bbl) | 71.4 | - | - | 71.4 | |||||
Average Price 2015 (US$/MBTU) | 7.2 | - | - | 7.2 | |||||
| |||||||||
Volume Variation 2016 - 2015 | na | na | na | na | +79.8% | na | na | na | na |
Price Variation 2016 - 2015 | -9.8% | na | na | -16.7% | +2.2% | na | ba | -16.8% | na |
| |||||||||
Fourth Quarter |
|
|
|
|
|
|
|
|
|
Volume Q4 16 | 625 | 2,600 | 1,183 | 4,408 | 3,168 | 4,436 | 666 | 8,270 | 60 |
Average Price Q4 16 (US$/bbl) | 57.3 | 53.7 | 58.6 | 55.3 | |||||
Average Price Q4 16 (US$/MBTU) | 7.3 | 5.3 | 5.4 | 6.1 | |||||
Average Price Q4 16 (US$/ton) | 223.7 | ||||||||
| |||||||||
Volume Q4 15 | 32 | - | - | 32 | 2,332 | - | - | 2,332 | - |
Average Price Q4 15 (US$/bbl) | 69.9 | - | - | 69.9 | |||||
Average Price Q4 15 (US$/MBTU) | 7.3 | - | - | 7.3 | |||||
| |||||||||
Volume Variation Q4 16 - Q4 15 | na | na | na | na | +35.9% | na | na | na | na |
Price Variation Q4 16 - Q4 15 | -17.9% | na | na | -20.8% | +1.0% | na | na | -16.4% | na |
|
|
|
|
|
|
|
|
|
|
Note: Pampa and PELSA’s volume accounts from the closing of the acquisition of former Petrobras Argentina on August 2016. The production considers the net contribution of Medanito La Pampa, a block that Petrolera Pampa is currently providing a service. FX rate of AR$/US$: 2016 – 14.78; 2015 – 9.27; 4T16 – 15.45; 4T15 – 10.17.
The compensation received through the Natural Gas Excess Injection Encouragement Program Res. No. 1/13 and for the Companies with Natural Gas Reduced Injection Res. No. 60/13 (‘Plan Gas’) was the main reason for other operating income positive variation, increasing by AR$469 million to al total amount of AR$760 million in the Q4 16, being Petrolera Pampa’s stake AR$457 million.
Net financial results decreased during the Q4 16 by AR$180 million to a loss of AR$10 million, mainly due to higher losses from interests in financial liabilities and net exchange difference as a result of higher indebtedness.
The adjusted EBITDA of our oil and gas segment rose by AR$2,248 million in the Q4 16, mainly due to the inclusion of former Petrobras Argentina’s E&P assets as of August 2016, in addition to higher sales volume and the effect of the exchange rate variation in our sales price. The adjusted EBITDA does not consider the reporting adjustments derived from the registration of the acquisition of Petrobras Argentina within Pampa’s financial statements (Purchase Price Allocation), which includes the losses due to the re-estimation of OCP’s Ship or Pay contract in Ecuador, item that at the consolidated level is partially offset with the gain recorded for the same concept in holding and others segment. Moreover, the adjusted EBITDA does not include the reversion of the profit from the sale of equipment of Petrobras Argentina to TGS at Río Neuquén natural gas processing plant, a loss from credits removal arose from 2003 Oil Companies’ Agreement, which has a neutral effect in total as the refining and distribution segment also registered a gain from liabilities removal for the same concept, and other losses due to the re-estimation of environmental liabilities and higher contingencies (AR$129 million). Furthermore, the adjusted EBITDA does not consider the charges from retired wells (AR$55 million), the accrued extraordinary contribution contingency from Plan Gas at Petrolera Pampa and equity income from OldelVal and other associates.
Pampa Energia• Q4 2016 Earnings Release •20 |
3.4 Analysis of the Refining and Distribution Segment
Refining & Distribution Segment, Consolidated | Fiscal Year | 4th Quarter | ||||
2016 | 2015 | ∆ % | 2016 | 2015 | ∆ % | |
Sales revenue | 6,550 | - | NA | 3,825 | - | NA |
Cost of sales | (5,973) | - | NA | (3,458) | - | NA |
Gross profit | 577 | - | NA | 367 | - | NA |
Selling expenses | (757) | - | NA | (453) | - | NA |
Administrative expenses | (23) | - | NA | (16) | - | NA |
Other operating income | 459 | - | NA | 139 | - | NA |
Other operating expenses | (98) | - | NA | (103) | - | NA |
Results for participation in associates | (1) | - | NA | (2) | - | NA |
Operating income | 157 | - | NA | (68) | - | NA |
Finance income | 6 | - | NA | 5 | - | NA |
Finance costs | (9) | - | NA | (4) | - | NA |
Other financial results | (40) | - | NA | (36) | - | NA |
Profit before tax | 114 | - | NA | (103) | - | NA |
Income tax and minimum expected profit tax | (8) | - | NA | (6) | - | NA |
Net income for the period | 106 | - | NA | (109) | - | NA |
Adjusted EBITDA | (102) | - | NA | (371) | - | NA |
Refining and distribution segment comes from the acquisition of Petrobras Argentina, which was not a shared business within the original portfolio of assets of Pampa.
In operating terms and not considering Pampa’s consolidation effect, total sales volume of refined products decreased 16%, totaling 476 thousand m3 in Q4 2016 and 567 thousand m3 in Q4 15, mainly due to decreases in crude oil volume, IFOs sold to the shipping sector, fuel oil sold to the energy industry and lower volume of diesel oil and gasoline, which are mainly sold to brokers and gas stations. The amounts corresponding to Pampa are shown below:
Refining & Distribution | Products | |||||
Crude Oil | Diesel Oil | Gasolines | Fuel Oil, IFOs & Asphalts | Other distillates | Total | |
Full Year |
|
|
|
|
|
|
Volume 2016 (km3) | 7 | 376 | 225 | 131 | 73 | 812 |
Average Price 2016 (US$/m3) | 348 | 581 | 606 | 397 | 346 | 535 |
Fourth Quarter |
|
|
|
|
|
|
Volume Q4 16 (km3) | 4 | 213 | 145 | 71 | 42 | 476 |
Average Price Q4 16 (US$/m3) | 319 | 556 | 558 | 378 | 348 | 509 |
|
|
|
|
|
|
|
Note: Pampa’s volume accounts from the closing of the acquisition of Petrobras Argentina on August 2016. FX rate of AR$/US$: 2016 – 14.78; 4T16 – 15.45.
The gross margin during Q4 16 increased to 10% over sales, in comparison to 9% of gross margin reached in Q4 15, mainly explained by lower costs from the purchase of barrels of crude oil, which began its convergence toward export parity.
The adjusted EBITDA of our refining and distribution segment does not consider the results from our participation in Refinor, a company that Pampa owns 28.5% of equity, as well as due to the Purchase Price Allocation of former Petrobras Argentina into Pampa’s statements, the EBITDA does not include the accounting profit derived from the liability removal from Oil Companies’ Agreement of 2003, which has a neutral impact in total as oil and gas segment also registered a loss from credit removal for the same concept.
Pampa Energia• Q4 2016 Earnings Release •21 |
3.5 Analysis of the Petrochemicals Segment
Petrochemicals Segment, Consolidated | Fiscal Year | 4th Quarter | ||||
2016 | 2015 | ∆ % | 2016 | 2015 | ∆ % | |
Sales revenue | 2,507 | - | NA | 1,592 | - | NA |
Cost of sales | (2,207) | - | NA | (1,493) | - | NA |
Gross profit | 300 | - | NA | 99 | - | NA |
Selling expenses | (110) | - | NA | (67) | - | NA |
Administrative expenses | (15) | - | NA | (9) | - | NA |
Other operating income | - | - | NA | 6 | - | NA |
Other operating expenses | (263) | - | NA | (150) | - | NA |
Operating income | (88) | - | NA | (121) | - | NA |
Finance income | 2 | - | NA | 1 | - | NA |
Other financial results | (3) | - | NA | 2 | - | NA |
Profit before tax | (89) | - | NA | (118) | - | NA |
Income tax and minimum expected profit tax | - | - | NA | - | - | NA |
Net income for the period | (89) | - | NA | (118) | - | NA |
Adjusted EBITDA | 113 | - | NA | 70 | - | NA |
As refining and distribution, petrochemicals segment also comes from the acquisition of Petrobras Argentina and was not a shared business within the original portfolio of assets of Pampa.
In operating terms and not considering Pampa’s consolidation effect, total sales volume of our petrochemicals segment declined 8% in Q4 16, totaling 127 thousand ton in Q4 2016 and 138 thousand ton in Q4 15. These reductions mainly respond to lower domestic sales due to decrease in local demand and competition with imports, as well as lower exports because of international prices decline and larger overseas supply. The amounts corresponding to Pampa are shown below:
Petrochemicals | Products | |||
Styrene & Polystyrene1 | SBR | Other | Total | |
Full Year |
|
|
|
|
Volume 2016 (kton) | 57 | 11 | 137 | 205 |
Average Price 2016 (US$/ton) | 1,344 | 1,877 | 532 | 828 |
Fourth Quarter |
|
|
|
|
Volume Q4 16 (kton) | 37 | 7 | 83 | 127 |
Average Price Q4 16 (US$/ton) | 1,283 | 1,866 | 519 | 814 |
|
|
|
|
|
Note: Pampa’s volume accounts from the closing of the acquisition of Petrobras Argentina on August 2016. FX rate of AR$/US$: 2016 – 14.78; 4T16 – 15.45. (1) Includes Propylene, Ethylene and BOPs.
The gross margin in Q4 16 declined to 6% over sales in comparison to 9% over sales reached in the same period of 2015, mainly due to higher costs offset by an improvement in average sale prices in spite of declining international prices, as well as prices that are nominated in US dollars reflected an increase in pesos because of the depreciation.
The adjusted EBITDA of our petrochemicals segment does not consider the loss from the update of contingencies refered to this segment, derived from the Purchase Price Allocation of Petrobras Argentina.
Pampa Energia• Q4 2016 Earnings Release •22 |
3.6 Analysis of the Holding and Others Segment
Holding & Others Segment, Consolidated | Fiscal Year | 4th Quarter | ||||
2016 | 2015 | ∆ % | 2016 | 2015 | ∆ % | |
Sales revenue | 80 | 54 | +48.1% | 23 | 22 | +4.5% |
Cost of sales | (3) | (3) | - | (1) | (2) | -50.0% |
Gross profit | 77 | 51 | +51.0% | 22 | 20 | +10.0% |
Selling expenses | (5) | - | NA | (5) | - | NA |
Administrative expenses | (1,446) | (128) | NA | (574) | (63) | NA |
Other operating income | 560 | 218 | +156.9% | 532 | 216 | +146.3% |
Other operating expenses | (282) | (9) | NA | (155) | (4) | NA |
Results for participation in joint businesses | 105 | 9 | NA | 299 | (37) | NA |
Results for participation in associates | (3) | (10) | -70.0% | - | (8) | -100.0% |
Gain for acquisition of companies | 480 | - | NA | - | - | NA |
Operating income | (514) | 131 | NA | 119 | 124 | -4.0% |
Finance income | 105 | 26 | NA | 87 | 9 | NA |
Finance costs | (1,320) | (20) | NA | (572) | 1 | NA |
Other financial results | 35 | 2,252 | -98.4% | (320) | 1,899 | NA |
Profit before tax | (1,694) | 2,389 | NA | (686) | 2,033 | NA |
Income tax and minimum expected profit tax | 999 | (55) | NA | 1,054 | (29) | NA |
Net income for the period | (695) | 2,334 | NA | 368 | 2,004 | -81.6% |
Attributable to: | ||||||
Owners of the Company | (674) | 2,334 | NA | 427 | 2,004 | -78.7% |
Non-controlling interests | (21) | - | NA | (59) | - | NA |
Adjusted EBITDA | (619) | 490 | NA | (220) | 393 | NA |
During Q4 16, the gross margin from our holding and others segment rose by 10% compared to the same period of 2015, mainly explained by higher income from fees charged to our subsidiaries.
However, not considering the results from our participation in joint businesses (Transener) and in associates (TGS), the operating income recorded a loss of AR$180 million, lower than the gain of AR$169 million for the same period in 2015, mainly due to the inclusion of former Petrobras Argentina’s corporate segment since August 2016, which contributed higher operating expenses of AR$401 million, in addition to higher third party fees and labor costs as a result of the acquisition of Petrobras Argentina (AR$121 million in Q4 16).
The losses in net financial results increased by AR$2,714 million compared to the same period of 2015, registering a AR$805 million loss in the Q4 16, mainly due to losses incurred from interests on financial liabilities and exchange rate difference, both related to the acquisition of Petrobras Argentina and the US$500 million outstanding series T bond notes.
The adjusted EBITDA of our holding and others segment fell by AR$613 million in the Q4 16, recording a loss of AR$220 million. Moreover, aiming to uniform reporting criteria, the adjusted EBITDA from our holding and others segment removes equity income from affiliates but considers the EBITDAs from our participation in TGS and Transener, companies in which Pampa co-controls because of regulatory reasons and under IFRS standards its results are not consolidated in Pampa’s financial statements. Therefore, a consolidation of EBITDAs adjusted by indirect ownership participation in these businesses is included in our calculation.
In the case of TGS, its ownership-adjusted results are recorded as from the closing of the acquisition of Petrobras Argentina. Pampa used to hold an indirect stake in TGS and the regulatory approval over the capital stock holding as of its sale on July 2016 was not granted. Therefore, until then, Pampa used to record its TGS results as a financial investment (CIESA Trust) and as a result for participation in associates (PEPCA). In Q4 16 the EBITDA adjusted by indirect ownership of 25.5% over TGS was AR$243 million, which means an implicit total of AR$952 million, which is higher to the registered in Q4 15, mainly due to transitional tariff increase of 200.1% for gas transportation business and the margin improvement in the liquids segment, due to prices as well as nominal exchange rate.
In the case of Transener, the EBITDA adjusted by stake ownership of 26.3% is AR$36 million (implicit total of AR$138 million) and includes the difference between collected amounts and accrued sales corresponding to CAMMESA’s credit regarding the Instrumental Agreement. In Q4 16 the accrued amounts of AR$1,198 million as capital and AR$95 million as interests due to the acknowledgment of higher costs surpassed the collected amounts during the quarter, therefore the total adjustment for Transener was negative for AR$635 million, in comparison to AR$123 million of negative adjustment registered in Q4 15.
Pampa Energia• Q4 2016 Earnings Release • 23 |
Furthermore, the EBITDA of our holding and others segment does not consider the accounting adjustments derived from the Purchase Price Allocation of Petrobras Argentina in Pampa’s financial statements, which include the profit from the re-estimation of OCP’s Ship or Pay contract in Ecuador, which at the consolidated level will be a net loss of AR$151 million. Additionally, it does not consider the losses from higher contingencies and removal of credits.
Pampa Energia• Q4 2016 Earnings Release • 24 |
3.7 Fiscal Year Analysis by Subsidiary (AR$ Million)[6]
| Fiscal Year 2016 | Fiscal Year 2015 | ||||||
Subsidiary | % Pampa | Adjusted EBITDA | Net Debt3 | Net Income4 | % Pampa | Adjusted EBITDA | Net Debt3 | Net Income4 |
Power Generation Segment |
|
|
|
|
|
|
|
|
Diamante | 56.0% | 9 | (19) | 36 | 56.0% | (20) | (69) | 12 |
Los Nihuiles | 47.0% | 57 | (63) | 136 | 47.0% | (9) | (32) | 66 |
CPB | 100.0% | (79) | 442 | (208) | 100.0% | 35 | 174 | (18) |
CTG | 90.4% | 341 | 81 | 208 | 90.4% | 190 | 36 | 145 |
CTLL1 | 100.0% | 1,021 | 2,464 | 513 | 100.0% | 764 | 1,205 | 301 |
Pampa Energía | 100.0% | 222 | (8) | 416 | 0% | - | - | - |
Other companies, adjustments & deletions2 | 100.0% | 168 | (477) | (57) | 100.0% | 44 | (530) | (8) |
Subtotal Generation |
| 1,738 | 2,420 | 1,045 |
| 1,004 | 784 | 497 |
Electricity Distribution Segment |
|
|
|
|
|
|
|
|
Edenor1 | 51.5% | 703 | 569 | (1,189) | 51.5% | 1,913 | 820 | 1,142 |
EASA1 | 100.0% | 29 | 2,146 | (528) | 100.0% | (65) | 1,630 | (523) |
Adjustments & deletions2 | 50% | (38) | (2,122) | 570 | 50% | (23) | (1,742) | (560) |
Subtotal Distribution |
| 694 | 594 | (1,147) |
| 1,825 | 709 | 59 |
Oil & Gas Segment |
|
|
|
|
|
|
|
|
Petrolera Pampa | 49.5% | 2,752 | 3,307 | 528 | 49.6% | 760 | 1,859 | 352 |
PELSA | 58.9% | 352 | (411) | (44) | 0% | - | - | - |
Pampa Energía (Stand-Alone)1 | 100.0% | 3,751 | 316 | 391 | 0% | - | - | - |
Adjustments & deletions2 | 100% | (1,457) | (182) | (248) | 100% | 1 | - | (177) |
Subtotal Oil & Gas |
| 5,398 | 3,029 | 627 |
| 761 | 1,859 | 175 |
Refining & Distribution Segment |
|
|
|
|
|
|
|
|
Pampa Energía | 100.0% | (101) | (14) | 107 | 0% | - | - | - |
Adjustments & deletions2 | 100% | (1) | - | (1) | 100% | - | - | - |
Subtotal Refining & Distribution |
| (102) | (14) | 106 |
| - | - | - |
Petrochemicals Segment |
|
|
|
|
|
|
|
|
Pampa Energía | 100.0% | 112 | - | (90) | 0% | - | - | - |
Adjustments & deletions2 | 100% | 1 | - | 1 | 100% | - | - | - |
Subtotal Petrochemicals |
| 113 | - | (89) |
| - | - | - |
Holding & Others Segment |
|
|
|
|
|
|
|
|
Pampa Energía (Stand-Alone)1 | 100.0% | (874) | 18,356 | (1,523) | 100.0% | 359 | (997) | (136) |
Transener | 26.3% | 329 | 920 | (57) | 26.3% | 542 | 922 | 52 |
Non-controlling stake adjustment | (243) | (678) | 42 | (399) | (679) | (38) | ||
Adjustments & deletions2 | 26% | - | (24) | - | 26% | - | (34) | - |
Total Transmission | 26% | 87 | 218 | (15) | 143 | 209 | 14 | |
TGS | 25.5% | 1,148 | 1,458 | 483 | 0% | - | - | - |
Non-controlling stake adjustment | (855) | (1,086) | (360) | - | - | - | ||
Total Gas Midstream | 26% | 293 | 372 | 123 | - | - | - | |
Other companies, adjustments & deletions2 | 100% | (124) | (6,499) | 741 | 100% | (12) | (438) | 2,456 |
Subtotal Holding & Others |
| (619) | 12,447 | (674) |
| 490 | (1,226) | 2,334 |
Deletions | 100% | 122 | (590) | 121 | 100% | - | (209) | - |
Total Consolidated Amounts to the Owners |
| 7,344 | 17,886 | (11) |
| 4,079 | 1,917 | 3,065 |
Total Adjusted by Ownership |
| 5,422 | 15,980 | (11) |
| 2,776 | 690 | 3,065 |
1 Non-consolidated amounts.2 The deletions in net debt correspond to inter-companies and debt repurchases.3 Net debt includes holding companies and does not consider financing from CAMMESA in the power generation segment. The deletions in net income mainly correspond to non-controlling interest.4 CTLL, EASA and Pampa Energía (stand-alone) do not include results from its subsidiaries.
Pampa Energia• Q4 2016 Earnings Release •25 |
3.8 Analysis of the Quarter, by Subsidiary (AR$ Million)
| 4th Quarter 2016 | 4th Quarter 2015 | ||||||
Subsidiary | % Pampa | Adjusted EBITDA | Net Debt3 | Net Income4 | % Pampa | Adjusted EBITDA | Net Debt3 | Net Income4 |
Power Generation Segment |
|
|
|
|
|
|
|
|
Diamante | 56.0% | (1) | (19) | 7 | 56.0% | (4) | (69) | 14 |
Los Nihuiles | 47.0% | 12 | (63) | 31 | 47.0% | 2 | (32) | 24 |
CPB | 100.0% | (77) | 442 | (86) | 100.0% | (32) | 174 | (45) |
CTG | 90.4% | 69 | 81 | 53 | 90.4% | 61 | 36 | 57 |
CTLL1 | 100.0% | 262 | 2,464 | 124 | 100.0% | 206 | 1,205 | 127 |
Pampa Energía | 100.0% | 132 | (8) | 326 | 0.0% | - | - | - |
Other companies, adjustments & deletions2 | 100.0% | 177 | (477) | (16) | 100.0% | 16 | (530) | (8) |
Subtotal Generation |
| 574 | 2,420 | 439 |
| 248 | 784 | 169 |
Electricity Distribution Segment |
|
|
|
|
|
|
|
|
Edenor1 | 51.5% | 1,466 | 569 | 654 | 51.5% | 234 | 820 | 204 |
EASA1 | 100.0% | 8 | 2,146 | (121) | 100.0% | (74) | 1,630 | (335) |
Adjustments & deletions2 | 50% | (12) | (2,122) | (319) | 50.0% | (8) | (1,742) | (101) |
Subtotal Distribution |
| 1,462 | 594 | 214 |
| 152 | 709 | (232) |
Oil & Gas Segment |
|
|
|
|
|
|
|
|
Petrolera Pampa | 49.5% | 787 | 3,307 | 87 | 49.6% | 320 | 1,859 | 246 |
PELSA | 58.9% | 211 | (411) | (39) | 0.0% | - | - | - |
Pampa Energía (Stand-Alone)1 | 100.0% | 3,031 | 316 | 9 | 0.0% | - | - | - |
Adjustments & deletions2 | 100% | (1,461) | (182) | (28) | 100.0% | 0 | - | (125) |
Subtotal Oil & Gas |
| 2,568 | 3,029 | 29 |
| 320 | 1,859 | 121 |
Refining & Distribution Segment |
|
|
|
|
|
|
|
|
Pampa Energía | 100.0% | (369) | (14) | (108) | 0.0% | - | - | - |
Adjustments & deletions2 | 100% | (2) | - | (1) | 100.0% | - | - | - |
Total Refining & Distribution |
| (371) | (14) | (109) |
| - | - | - |
Petrochemicals Segment |
|
|
|
|
|
|
|
|
Pampa Energía | 100.0% | 69 | - | (120) | 0.0% | - | - | - |
Adjustments & deletions2 | 100% | 1 | - | 2 | 100.0% | - | - | - |
Total Petrochemicals |
| 70 | - | (118) |
| - | - | - |
Holding & Others Segment |
|
|
|
|
|
|
|
|
Pampa Energía (Stand-Alone)1 | 100.0% | (836) | 18,356 | (634) | 100.0% | 389 | (997) | 19 |
Transener | 26.3% | 138 | 920 | 484 | 26.3% | 39 | 922 | (98) |
Non-controlling stake adjustment | (102) | (678) | (357) | (29) | (679) | 72 | ||
Adjustments & deletions2 | 26% | - | (24) | - | 26.3% | - | (34) | - |
Total Transmission | 0% | 36 | 218 | 128 | 10 | 209 | (26) | |
TGS | 25.5% | 952 | 1,458 | 462 | 0.0% | - | - | - |
Non-controlling stake adjustment | (709) | (1,086) | (344) | - | - | - | ||
Total Gas Midstream | 0% | 243 | 372 | 118 | - | - | - | |
Other companies, adjustments & deletions2 | 100% | 337 | (6,499) | 816 | 100.0% | (6) | (438) | 2,011 |
Total Holding & Others |
| (220) | 12,447 | 427 |
| 393 | (1,226) | 2,004 |
Deletions | 100% | 100 | (590) | 100 | 100.0% | - | (209) | - |
Total Consolidated Amounts to the Owners |
| 4,184 | 17,886 | 982 |
| 1,114 | 1,917 | 2,062 |
Total Adjusted by Ownership |
| 2,983 | 15,980 | 982 |
| 838 | 690 | 2,062 |
1 Non - consolidated amounts.2 The deletions in net debt correspond to inter-companies and debt repurchases.3 Net debt includes holding companies and does not consider financing from CAMMESA in the power generation segment. The deletions in net income mainly correspond to non-controlling interest.4 CTLL, EASA and Pampa Energía (stand-alone) do not include results from its subsidiaries.
Pampa Energia• Q4 2016 Earnings Release • 26 |
4. Information about the Conference Call
There will be a conference call to discuss Pampa and Edenor’s fourth quarter 2016 results on Wednesday March 15, 2017 at 10:00 a.m. New York Time / 11:00 p.m. Buenos Aires Time.
The hosts will be Mr. Leandro Montero, CFO of Edenor and Ms. Lida Wang, Investor Relations Manager at Pampa. For those interested in participating, please dial 0-800-444-2930 in Argentina, +1 (844) 854-4411 in the United States or +1 (412) 317-5481 from any other country. Participants of the conference call should use the identification password Pampa Energía / Edenor and dial in five minutes before the scheduled time. There will also be a live audio webcast of the conference atwww.pampaenergia.com/ir.
You may find additional information on the Company at:
ü www.pampaenergia.com/ri
ü www.cnv.gob.ar
ü www.sec.gov
SIGNATURE
Pursuant to the requirements of the Securities Exchange Act of 1934, the registrant has duly caused this report to be signed on its behalf by the undersigned, thereunto duly authorized.
Date: March 14, 2017
Pampa Energía S.A. | ||
| By: | /s/ Ricardo Torres | |
Name: Ricardo Torres Title: Co-Chief Executive Officer | ||
FORWARD-LOOKING STATEMENTS
This press release may contain forward-looking statements. These statements are statements that are not historical facts, and are based on management's current view and estimates offuture economic circumstances, industry conditions, company performance and financial results. The words "anticipates", "believes", "estimates", "expects", "plans" and similar expressions, as they relate to the company, are intended to identify forward-looking statements. Statements regarding the declaration or payment of dividends, the implementation of principal operating and financing strategies and capital expenditure plans, the direction of future operations and the factors or trends affecting financial condition, liquidity or results of operations are examples of forward-looking statements. Such statements reflect the current views of management and are subject to a number of risks and uncertainties. There is no guarantee that the expected events, trends or results will a ctually occur. The statements are based on many assumptions and factors, including general economic and market conditions, industry conditions, and operating factors. Any changes in such assumptions or factors could cause actual results to differ materially from current expectations.