UNITED STATES
SECURITIES AND EXCHANGE COMMISSION
Washington, D.C. 20549
FORM 6-K
REPORT OF FOREIGN ISSUER
PURSUANT TO RULE 13a-16 OR 15d-16 UNDER
PURSUANT TO RULE 13a-16 OR 15d-16 UNDER
SECURITIES EXCHANGE ACT OF 1934
For the month of November, 2017
(Commission File No. 001-34429),PAMPA ENERGIA S.A.
(PAMPA ENERGY INC.)
(PAMPA ENERGY INC.)
Argentina
(Jurisdiction of incorporation or organization)
Maipú 1
C1084ABA
City of Buenos Aires
Argentina
C1084ABA
City of Buenos Aires
Argentina
(Address of principal executive offices)
(Indicate by check mark whether the registrant files or will file annual reports under cover of Form 20-F or Form 40-F.)
Form 20-F ___X___ Form 40-F ______
Form 20-F ___X___ Form 40-F ______
(Indicate by check mark whether the registrant by furnishing the
information contained in this form is also thereby furnishing the
information to the Commission pursuant to Rule 12g3-2(b) under
the Securities Exchange Act of 1934.)
Yes ______ No ___X___
(If "Yes" is marked, indicate below the file number assigned to the
registrant in connection with Rule 12g3-2(b): 82- .)
registrant in connection with Rule 12g3-2(b): 82- .)
![]()

Main Results for the Nine-Month Period ended on September 30, 2017 (‘9M17’)
Consolidated net revenues of AR$48,158 million1, 163.4% higher than the AR$18,280 million for the same period of 2016 (‘9M16’), explained by increases of AR$3,813 million in power generation, AR$8,459 million in electricity distribution, AR$7,811 million in oil and gas, AR$9,529 million in refining and distribution, AR$4,459 million in petrochemicals and AR$254 million in holding and others segment, partially offset by higher eliminations as a result of intersegment sales for AR$4,447 million.
ðPower Generation of 11,494GWhfrom 10 power plants ðElectricity sales of 16,440GWhto 2.9 million end-users ðProduction of 70.4 thousand barrels per day of hydrocarbons:285 million cf/d of gas and 23 kboe/d of oil and NGL ðSales of 1.4 million m3 of refined products and 354 thousand tons of petrochemical products |
Adjusted consolidated EBITDA2 of AR$12,811 million, compared to AR$3,252 million for 9M16, mainly due to increases of AR$2,145 million in power generation, AR$2,594 million in electricity distribution, AR$3,708 million in oil and gas, AR$556 million in refining and distribution, AR$198 million in petrochemicals, AR$343 million in holding and others segment, and AR$15 million in intersegment eliminations.
Consolidated gain of AR$3,970 million, of which AR$3,094 million is attributable to the owners of the Company, higher than the AR$993 million of loss attributable to the owners in 9M16, explained by higher reported gains in power generation (AR$2,199 million), electricitydistribution (AR$1,733 million), oil and gas (AR$1,629 million), refining and distribution (AR$408 million) and intersegment eliminations (AR$16 million), partially offset by losses in petrochemicals (AR$146 million) and higher losses in holding and others segment (AR$1,752 million).
1 Under the International Financial Reporting Standards (‘IFRS’), Greenwind, OldelVal, Refinor, Transener and TGS are not consolidated in Pampa’s income statement and balance sheet, its equity income being shown only as ‘Results for participation in associates’ and ‘Results for participation in joint businesses’. For more information, please refer to section 3 of this Earnings Release.
2 Consolidated adjusted EBITDA represents the consolidated results before net financial results, income tax and minimum notional income tax, depreciations and amortizations, non-recurring incomes and expenses and non-controlling interests, and includes other incomes not accrued and other adjustments from the IFRS implementation. For more information, please refer to section 3 of this Earnings Release.
Pampa Energía● Q3 17 Earning Release● 1
|

Main Results for the Third Quarter of 2017 (‘Q3 17’)3
Consolidated net revenues of AR$17,357 million, compared to AR$9,897 million recorded in the third quarter 2016 (‘Q3 16’), mainly explained by increases of AR$1,339 million in power generation, AR$3,047 million in electricity distribution, AR$1,157 million in oil and gas, AR$1,379 million in refining and distribution, AR$998 million in petrochemicals and AR$88 million in holding and others segment, partially offset by higher eliminations from intersegment sales of AR$548 million.
ðPower generation of 3,724 GWhfrom 10 power plants
ðElectricity sales of 5,583 GWhto 2.9 million of end-users
ðProduction of 70.6 kboe/d of hydrocarbons:287 million cf/d of gas and 22.7 kboe/d of oil and NGL
ðSales of 447 thousand m3 of refined products and 124 thousand tons of petrochemical products
Consolidated adjusted EBITDA of AR$5,090 million, compared to AR$1,464 million in Q3 16, due to increases of AR$998 million in power generation, AR$1,406 million in electricity distribution, AR$647 million in oil and gas, AR$223 million in refining and distribution, AR$8 million in petrochemicals and AR$390 million in holding and others segment, partially offset by decreases of AR$46 million in intersegment eliminations.
Consolidated gain of AR$1,624 million, of which AR$1,284 million is attributable to the owners of the Company, higher than the loss of AR$932 million attributable to the owners of the Company in the Q3 16, explained by reported higher earnings in our segments of power generation (AR$779 million), electricity distribution (AR$578 million), oil and gas (AR$179 million), refining and distribution (AR$225 million) and in our holding and others segment (AR$633 million), partially offset by losses in petrochemicals (AR$133 million) and intersegment eliminations (AR$45 million).
3 The financial information presented in this document for the quarters ended on September 30, 2017 and of 2016 are based on unaudited financial statements prepared according to the IFRS accounting standards in force in Argentina corresponding to the nine-month period ended on September 30, 2017 and of 2016, and the quarter ended on June 30, 2017 and 2016.
Pampa Energía● Q3 17 Earning Release● 2
|
Table of Contents
| Main Results for the 9M17 | 1 | ||
| Main Results for the Q3 17 | 2 | ||
| 1. | Relevant Events | 4 | |
| 1.1 | News from Power Generation Segment | 4 | |
| 1.2 | Transener: Response to the Motion for Reconsideration of the Integral Tariff Review (‘RTI’) | ||
| applicable to the 2017 – 2021 Period | 5 | ||
| 1.3 | Call for Public Hearings | 5 | |
| 1.4 | Recognition of Edenor’s Investments | 6 | |
| 1.5 | News from Oil and Gas, and Refining and Distribution Segments | 7 | |
| 1.6 | Corporate Reorganization | 8 | |
| 1.7 | Modifications in the Company’s Board of Directors and Supervisory Committee | 9 | |
| 1.8 | Debt Securities Transactions | 10 | |
| 2. | Financial Highlights | 12 | |
| 2.1 | Consolidated Balance Sheet | 12 | |
| 2.2 | Consolidated Income Statement | 13 | |
| 2.3 | Cash and Financial Borrowings | 14 | |
| 3. | Analysis of the Q3 17 | 15 | |
| 3.1 | Analysis of the Power Generation Segment | 16 | |
| 3.2 | Analysis of the Electricity Distribution Segment | 18 | |
| 3.3 | Analysis of the Oil and Gas Segment | 20 | |
| 3.4 | Analysis of the Refining and Distribution Segment | 22 | |
| 3.5 | Analysis of the Petrochemicals Segment | 24 | |
| 3.6 | Analysis of the Holding and Others Segment | 25 | |
| 3.7 | Analysis of the Nine-Month Period, by Subsidiary | 27 | |
| 3.8 | Analysis of the Quarter, by Subsidiary | 28 | |
| 4. | Information about the Conference Call | 29 | |
Pampa Energía● Q3 17 Earning Release● 3
|
1. Relevant Events
1.1 News from Power Generation Segment
1.1.1 Awarding of Closing to Combined Cycle Project at Genelba Thermal Power Plant (‘CTGEBA’)
On October 18, 2017, under the call for closing to combined cycle and co-generation projects, Resolution No. 926-E/2017 of the Secretariat of Electric Energy (‘SEE’) was published, whereby the Ministry of Energy and Mining (‘MEyM’) selected projects to enter into Wholesale Power Purchase Agreement (‘PPA’) with the Wholesale Electricity Market Company (‘CAMMESA’).
Genelba Plus’s closing to combined cycle, which will add an incremental capacity of 383 MW to CTGEBA’s current facilities owned by the Company (the ‘Project’), is among the twelve selected projects, which altogether will add more than 1.8 GW of power capacity to the grid.
The Project consists of the installation of a new gas turbine and a steam turbine, as well as other enhancement works over the current Genelba Plus’s gas turbine, which altogether will complete the second combined cycle at CTGEBA, with a gross power capacity of 552 MW and 52% of efficiency. The Project’s investment budget is estimated around US$360 million, and the Project’s engineering, equipment procurement and construction (‘EPC’) will be jointly carried out by Siemens and Techint. Its commissioning at open cycle is expected for the second quarter of 2019, and as closed cycle for the second quarter of 2020. The PPA will be effective for a term of fifteen years and will remunerate a fixed price of US$20,500 per MW per month and a variable price of US$6 per MWh.
Along with this expansion, CTGEBA, which is located in Marcos Paz, Province of Buenos Aires, will have two combined cycles and will reach a total installed capacity of 1.2 GW. Currently, Genelba generates power with a 674 MW combined cycle and a 169 MW Genelba Plus’s gas turbine, in which the Project will be conducted. Once all expansion projects are commissioned, Pampa Energía will contribute a total installed capacity of 4.3 GW to the Argentine grid.
1.1.2 Commissioning of the New Thermal Power Plant Parque Pilar (‘CTPP’)
On August 31, 2017, CAMMESA granted the commercial operation of CTPP, pursuant to the PPA executed between CAMMESA and Pampa as awardee under the Call for New Generation Capacity pursuant to SEE Resolution No. 21/2016.
The project, which consisted of the construction of a new thermal power plant in the Pilar Industrial Complex (located at Pilar, Province of Buenos Aires), is made up of 6 cutting-edge high-efficiency Wärtsilä engines, with a total power capacity of 100 MW and able to fire either natural gas or, alternatively, fuel oil. It is worth pointing out that said commissioning was achieved before the terms stipulated in the PPA, as from which time the applicable supply obligations became effective.
1.1.3 II RenovAr Tender
Pursuant to MEyM Resolution No. 275-E/2017 published in the Public Gazette (‘BO’) on August 17, 2017, it opened the National and International Call ‘RenovAr Program II Round’ for the electric energy from renewable sources contracted within the Wholesale Electric Market (‘WEM’). The Call’s purpose is to install power capacity for up to 1.2 GW, taking into consideration the source, power capacity, technology and region, with a maximum price for each specific technology.
Pampa Energía● Q3 17 Earning Release●4
|
On October 19, 2017, technical proposals were opened, with 228 projects submitted for a total offered power capacity of 9.4 GW, including, among other technologies, 58 wind farm projects for 3.8 GW and 99 solar farm projects of 5.3 GW. The Company submitted the projects shown in the table. |
|
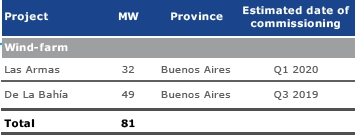
The stipulated date for the awarding of tenders is set on November 29, 2017.
1.1.4 Technical Problem at CTGEBA
On September 22, 2017, a technical problem occurred in one of the two gas turbines at the combined-cycle in CTGEBA. Consequently, the combined-cycle generation capacity has been reduced by 50%, operating with a 337 MW power capacity. Moreover, all applicable claims were filed and notices were given to the corresponding insurance companies.
The Company is currently working on the failure together with the generator’s manufacturer, Siemens. Repair tasks are expected to be completed by the end of the year.
1.2 Transener: Response to the Motion for Reconsideration of the RTI Applicable to the 2017 – 2021 Period
On October 31, 2017, Transener was served notice of Resolutions No. 516/2017 and 517/2017 issued by the National Electricity Regulatory Agency (‘ENRE’), whereby this regulatory body partially upheld the motions for reconsideration of the RTI filed in April 2017 against ENRE Resolutions No. 66/2017 and 73/2017 for Transener and Transba, respectively.
The informed resolutions establish new tariff schemes for Transener and Transba, applicable retroactively to February 1, 2017, representing an increase of 4% in capital base and 8% in regulatory revenues, compared to the amounts granted in the RTI conducted in February 2017.
As regards the semiannual cost variation adjustment pursuant to the RTI, Transener requested the ENRE an approximate of 11% increase retroactive to August 2017. As of the date of this Earnings Release, the ENRE has not issued an instruction providing for its application.
1.3.1 New Natural Gas Prices at Transportation System Entry Point (‘PIST’)
Pursuant to MEyM Resolution No. 400-E/2017, published in the BO on October 23, 2017, a public hearing was called for November 15, 2017, to discuss new PIST prices for natural gas and propane gas for the distribution of undiluted propane gas through pipes, which should be effective as from December 1, 2017.
1.3.2 Transportadora del Gas del Sur (‘TGS’)
Pursuant to Resolution No. 62/2017 issued by the National Gas Regulatory Agency (‘ENARGAS’) and published in the BO on October 20, 2017, a public hearing was called to discuss TGS’ transitory tariff adjustment, resulting from the RTI process implemented in April 2017.
The public hearing, which will be held on November 14, 2017 in the City of Bahía Blanca, Province of Buenos Aires, will determine the new tariff schemes effective as from December 1, 2017.
Pampa Energía● Q3 17 Earning Release● 5
|
1.3.3 Electricity Sector
On October 25, 2017, the MEyM issued Resolution No. 403-E/2017 whereby the ENRE called for a public hearing for November 17, 2017 in order to discuss:
(i) New reference prices for power capacity and energy within the WEM for the 2017-2018 summer seasonal period (the ‘Seasonal Price’), reaching the coverage of almost 100% of the WEM’s monomic cost as of December 2018;
(ii) The electricity savings incentive plan;
(iii) The social tariff;
(iv) The electricity distribution methodology; and
(v) The cost of remunerating the extra high voltage power transmission.
Following this hearing, another hearing will be held pursuant to ENRE Resolution No. 526/2017, in order to inform the impact of the previously-mentioned measures on Edenor’s end-users’ bills.
As regards the item (iv) above, on October 31, 2017, Edenor was informed through ENRE Note No. 128,399 that the MEyM instructed this entity to defer until December 1, 2017, the application of the 18% tariff increase on the Distribution Value Added (‘VAD’) scheduled in the RTI for November 1, 2017. This increase should be recognized in real terms, pursuant to the RTI update mechanism provided for by ENRE Resolution No. 63/2017.
Moreover, as regards the deferral in the implementation of the Own Distribution Costs (‘CPD’) variation monitoring mechanism, which, according to the RTI, should have been applicable since August 2017, it is informed that this item will be applicable as from December 1, 2017, also using the above-mentioned update mechanism for its recognition in real terms. In August 2017, after verifying the activation of the trigger clause, Edenor requested the application of the CPD variation for the first semester (January-June, 2017), which amounted to 11.63%.
1.4 Recognition of Edenor’s Investments
On October 4, 2017, SEE Resolution No. 840-E/2017 was published in the BO, which recognized the amount of AR$323 million in consideration of works performed before the termination of the Fund for Electricity Distribution Expansion and Consolidation Works (‘FOCEDE’), which had been implemented to administer the funds generated as a result of the application of ENRE Resolution No. 347/2012.
Its implementation is conditional upon Edenor waiving all administrative and/or judicial claims associated with the FOCEDE it may have already brought, as well as any other future claims against the National Government, the MEyM, the SEE, the ENRE and/or CAMMESA. Therefore, on October 9, 2017, Edenor stated that it had no administrative or judicial claims against these bodies related to FOCEDE, considering that the direct appeal filed in 2015 by Edenor against ENRE Resolution No. 356/2014 —which imposed a penalty for the failure to timely apply FOCEDE’s remaining funds— is not covered by this requirement.
As of the date of this Earnings Release, Edenor is conducting all applicable business and procedures to enforce the recognition of this receivable.
Pampa Energía● Q3 17 Earning Release● 6
|
1.5 News from Oil and Gas, and Refining and Distribution Segments
1.5.1 Modification to the Encouragement Program for the Investment in Development of Natural Gas Production from Unconventional Reservoirs in Neuquina Basin
On November 2, 2017, MEyM Resolution No. 419-E/2017 was published in the BO; this resolution amends the terms and conditions provided for by MEyM Resolution No. 46-E/2017 issued in March 2017.
The new resolution measures the monthly average unconventional gas production for the July 2016- June 2017 period (the ‘Initial Production’) and classifies concessions into the following categories: (i) undeveloped (‘Pilot’), with an Initial Production lower than 17.7 million cf/day; and (ii) developing, with an Initial Production higher than or equal to 17.7 million cf/day.
Undeveloped concessions applying for the incentive may obtain a guaranteed minimum price for their whole production, provided they reach an annual average production equal to or higher than 17.7 million cf/day during a twelve-month period by December 31, 2019. Developing concessions may only apply for the incentive the incremental portion on top of their Initial Production. The reference price for incentive calculation will be the domestic market’s weighted average reported by the MEyM’s Secretariat of Hydrocarbon Resources.
Moreover, permanence in the program is conditional upon the blocks meeting the investment plan timely informed to the provincial enforcement authority; otherwise, collected amounts should be returned, adjusted by the Argentine National Bank’ s interest rate.
As of the date of this Earnings Release, the Company is analyzing the impact and its inclusion to the mentioned program.
1.5.2 Suspension of the Producers and Refiners’ Agreement
On September 22, 2017, the MEyM notified, through Note No. 21505927/2017, the signatories to the Agreement for the Transition to International Prices of the Argentine Hydrocarbon Industry (the ‘Producers and Refiners’ Agreement’) of its suspension as from October 1, 2017. Going forward, the domestic price of crude oil barrel to be used as raw material for refining and gas pump prices would be determined based on domestic market rules.
The Producers and Refiners’ Agreement had established a gradual convergence path for the domestic price of crude oil until achieving parity with international markets during the course of 2017, as well as a price adjustment mechanism for the gas pump prices of refined products.
Consequently, on October 1, 2017, the Company increased its prices for high-grade gasoline and diesel oil by 11%, and for Podium gasoline and Podium diesel by 5% in its distributor channel. Furthermore, on October 23, 2017, the Company increased its prices for Podium gasoline by 12%, for high-grade gasoline and Podium diesel by 10%, and for diesel oil by 9% in its gas station network.
1.5.3 Bioethanol Price Adjustment
On October 31, 2017, MEyM Resolution No. 415-E/2017 was published in the BO, which modifies the procedure to determine the purchase price for corn- or sugarcane-based bioethanol to be blended with gasoline for automotive use. This modification results in a 1.5% decrease in the purchase costs of bioethanol, a raw material that should make up 12% of the volume of gasoline for automotive use sold in the Argentine territory.
Therefore, on November 4, 2017, Pampa accompanied the measure adopted by the major market players by reducing suggested gasoline prices at gas stations, thus transferring this cost reduction to end consumers, except in the Provinces of Chubut and Santa Cruz.
Pampa Energía● Q3 17 Earning Release● 7
|
1.5.4 Termination of Petrolera Pampa’s Service at Medanito - La Pampa Block
Pursuant to the offer made to Pampetrol, whereby Petrolera Pampa performed operating services for the exploitation of hydrocarbons in the 25 de Mayo – Medanito Sudeste block, located in the Province of La Pampa (‘Medanito La Pampa’), it was terminated on October 28, 2017. The Company performed all its obligations under the offer, returned the facilities as and when required and in an operating status, and provided all the applicable environmental documentation.
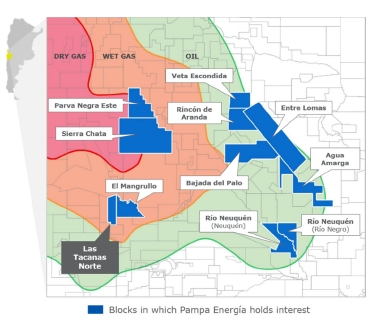
1.5.5 Tender for Hydrocarbon Exploration Licenses in Unconventional Blocks Under the Public Tender No 1/2017 - V Round, for the selection of companies interested in the exploration, development and eventual exploitation of the blocks located in the Province of Neuquén and concessional in favor of the Gas y Petróleo del Neuquén S.A. (‘GyP’), on November 1, 2017, the Board of Directors of GyP has proceed to award in favor of the Company for the offer summited for Las Tacanas Norte block. Las Tacanas Norte block has 120 km2 surface and is neighboring to El Mangrullo block, which the company currently operates. The accepted offer consists of drilling 8 wells targeting Vaca Muerta formation, and other exploratory studies. The exploratory license is for a 4-year term (2018-2021). The awarded block is shown in the map. |
|
1.6.1 Merger of Thermal Power Plant Loma de la Lata (‘CTLL’), Electricidad Argentina S.A. (‘EASA’) and IEASA S.A. (‘IEASA’)
Regarding the merger by absorption between CTLL, as absorbing company, and EASA and IEASA, as absorbed companies, on August 11, 2017 and pursuant to the Board of Directors’ Resolution No. 347, the ENRE decided, by a majority of votes, to deny the merger authorization request filed by CTLL. CTLL has appealed this resolution before the SEE timely and in due form as it considers that it does not conform to law.
As of the issuance of this Earnings Release, the SEE has not rendered a decision in this respect. Should the required approvals fail to be obtained, the Company will have to roll back the effects of the merger.
1.6.2 New Corporate Reorganization Process
On September 22, 2017, the Company resolved to incorporate Petrolera Pampa S.A. (‘Petrolera Pampa’) into its corporate reorganization process, which had been previously disclosed on August 23, 2017.
Pampa Energía● Q3 17 Earning Release●8
|
Consequently, subject to obtaining the corresponding corporate and regulatory approvals, Pampa, in its capacity as absorbing company, will merge by absorption the following companies of the economic group (the ‘Absorbed Companies’, in brackets it is stated Pampa Energía’s direct and indirect stake):
· Petrolera Pampa (49.5%); · Central Térmica Güemes S.A. (‘CTG’, 90.4%); · CTLL (100%); · EG3 Red S.A. (100%); · Bodega Loma la Lata S.A. (100%); | · Inversora Diamante S.A. (91.6%); · Inversora Nihuiles S.A. (90.3%); · Inversora Piedra Buena S.A. (100%); · Pampa Participaciones II S.A. (100%); and · Transelec Argentina S.A. (100%) |
This reorganization would become effective as from October 1, 2017, all of which subject to obtaining all the necessary corporate and regulatory approvals and the corresponding registration of the merger and dissolution without liquidation of the Absorbed Companies before the Public Registry.
Furthermore, since Petrolera Pampa and Pampa’s shares are subject to the public offering regime and listed in the Argentine stock market Bolsas y Mercados Argentinos (‘ByMA’), the Boards of Directors of both companies resolved to propose to their respective Shareholders’ Meetings an exchange ratio based on the volume-weighted average stock price of Pampa and Petrolera Pampa’s shares traded over the last six calendar months, determined retroactively as from the closing of operations on September 22, 2017, with a resulting exchange ratio of 2.2699 Pampa’s ordinary shares in book-entry form, with a face value of AR$1 each and granted the right to one vote per share, for each Petrolera Pampa’s ordinary share in book-entry form, with a face value of AR$1 each and granted the right to one vote per share.
The economic group led by the Company would thus complete the corporate consolidation process initiated with the merger by absorption with Petrobras Argentina S.A., continued with other intragroup reorganizations and finishing with the above-mentioned merger.
1.7 Modifications in the Company’s Board of Directors and Supervisory Committee
On October 31, 2017, the Company’s Board of Directors received the resignations presented by:
· Mr. Diego Salaverri, to his position as director and executive director of legal affairs, effective October 31, 2017;
· Mrs. Clarisa Lifsic, to her position as independent director and member of the Audit Committee, effective October 31, 2017;
· Mr. Javier Campos Malbrán, to his position as independent director, effective December 1, 2017; and
· Mr. Damián Burgio, to his position as alternate supervisory auditor, effective October 31, 2017.
1.8 �� Debt Securities Transactions
1.8.1 Loan Granted to Finance Corti Wind Farm Project (the ‘Corti Project’)
With the purpose of diversifying and optimizing financing sources, our power generation affiliate Greenwind S.A. executed as a borrower a credit facility for US$104 million with the Inter-American Investment Corporation (‘IIC’), the Inter-American Development Bank (‘IDB’)’s multilateral financial institution. The Santander Bank and the Industrial and Commercial Bank of China Limited Dubai Branch (‘ICBC’) acted as participants.
This credit facility represents an important milestone for Pampa since it is the first loan by a multilateral institution granted to a project awarded under the RenovAR tenders. Moreover, the loan offers
Pampa Energía● Q3 17 Earning Release●9
|
a tenor of 9 year door-to-door, an unprecedented term in Argentina for these kind of transactions, and is secured with a corporate lien granted by Pampa.
Net proceeds from this facility will be allocated to the construction, operation and maintenance of the Corti Project, located in Bahía Blanca, Province of Buenos Aires, consisting of the installation of Vestas 100 MW power capacity windmills, which commissioning is scheduled for the second quarter of 2018. The Corti Project contributes to the increase and diversification of Argentina’s energy matrix, as well as to the supply of clean energy, avoiding CO2 emissions by approximately 213,000 tons per year during the life of the project.
1.8.2 Redemption of CTG’s Corporate Bonds (‘CBs’)
On September 11, 2017, CTG redeemed 100% of its outstanding US$-link Series VIII CBs at a 7% fixed rate maturing in 2020 for an original face value of US$1.4 million plus interest accrued until the redemption date.
1.8.3 Loan Granted to Edenor
On October 11, 2017, Edenor was granted a loan by ICBC in the amount of US$50 million and for a 36-month term, which will be allocated to the financing of its investment plan and working capital.
1.8.4 Upgrade to Pampa Group’s CBs Ratings
Because of the favorable regulatory environment resulting from the implementation of the RTI, which enhances the predictability over short and medium-term cash flow generation, credit rating agency Standard & Poor’s Global Ratings (‘S&P’) upgraded the ratings of Transener and Edenor’s CBs. By the end of August 2017 Transener’s global rating was upgraded from ‘CCC+’ to ‘B’, whereas local rating was upgraded from ‘raBB+’ with a positive outlook to ‘raA+’ with a stable outlook. Moreover, in mid-September 2017, S&P upgraded Edenor’s CBs global rating from ‘CCC+’ to ‘B-’ and local rating from ‘raBB+’ with a positive outlook to ‘raBBB’ with a stable outlook.
Finally, as a result of the upgrade in the global rating of Argentina’s sovereign debt from ‘B’ to ‘B+’ and in its local rating from ‘raA+’ to ‘raAA’ by the end of October 2017, S&P also upgraded Pampa and TGS’s ratings. In the case of Pampa, the global rating was upgraded from ‘B’ to ‘B+’, whereas, in the case of TGS, the global rating was upgraded from ‘B’ to ‘B+’ and the local rating from ‘raA+’ with a stable outlook to ‘raAA’ with a stable outlook.
1.8.5 Loans Granted to Pampa Energía
In October 2017, Pampa entered into bank loans with local financial entities for a total amount of AR$2,270 million, maturing in August 2018 and October 2019 and accruing interest at a 22% weighted-average fixed rate. Additionally, it executed export pre-financing loans with local financial entities for a total amount of US$68 million, maturing in August, October and December 2018, and accruing interest at a 2.8% average fixed rate.
Pampa Energía● Q3 17 Earning Release●10
|
2. Financial Highlights
2.1 Consolidated Balance Sheet (AR$ Million)
| As of 9.30.17 | As of 12.31.16 |
ASSETS | ||
Participation in joint businesses | 4,692 | 3,699 |
Participation in associates | 825 | 787 |
Property, plant and equipment | 47,102 | 41,090 |
Intangible assets | 1,909 | 2,014 |
Other assets | 2 | 13 |
Financial assets with a results changing fair value | 150 | 742 |
Investments at amortized cost | 1 | 62 |
Deferred tax assets | 1,636 | 1,232 |
Trade receivable and other credits | 5,407 | 4,469 |
Total non-current assets | 61,724 | 54,108 |
Other Assets | - | 1 |
Inventories | 4,154 | 3,360 |
Financial assets with a results changing fair value | 11,864 | 4,188 |
Investments at amortized cost | 214 | 23 |
Financial derivatives | 4 | 13 |
Trade receivable and other credits | 16,136 | 14,144 |
Cash and cash equivalents | 462 | 1,421 |
Total current assets | 32,834 | 23,150 |
Non-current assets held for sale | 32 | 19 |
Total assets | 94,590 | 77,277 |
| As of 9.30.17 | As of 12.31.16 |
EQUITY | ||
Share capital | 1,935 | 1,938 |
Share premium and other reserves | 4,842 | 4,828 |
Repurchased shares | 3 | - |
Cost of repurchased shares | (72) | - |
Statutory reserve | 300 | 232 |
Voluntary reserve | 5,146 | 3,862 |
Other reserves | 134 | 135 |
Retained earnings | 1,731 | (11) |
Other comprehensive result | 292 | 70 |
Equity attributable to owners of the parent | 14,311 | 11,054 |
Non-controlling interests | 3,987 | 3,020 |
Total equity | 18,298 | 14,074 |
LIABILITIES | ||
Accounts payable and other liabilities | 5,675 | 5,336 |
Borrowings | 33,053 | 15,286 |
Deferred revenues | 195 | 200 |
Salaries and social security payable | 106 | 94 |
Defined benefit plan obligations | 1,030 | 921 |
Deferred tax liabilities | 3,685 | 3,796 |
Income tax and minimum expected profit tax liability | 821 | 934 |
Tax payable | 444 | 306 |
Provisions | 5,377 | 6,267 |
Total non-current liabilities | 50,386 | 33,140 |
Accounts payable and other liabilities | 14,921 | 12,867 |
Borrowings | 4,962 | 10,686 |
Deferred income | 3 | 1 |
Salaries and social security payable | 1,814 | 1,745 |
Defined benefit plan obligations | 113 | 112 |
Income tax and minimum expected profit tax liability | 890 | 1,454 |
Tax payable | 2,395 | 2,392 |
Provisions | 808 | 806 |
Total current liabilities | 25,906 | 30,063 |
Total liabilities | 76,292 | 63,203 |
Total liabilities and equity | 94,590 | 77,277 |
Pampa Energía● Q3 17 Earning Release●11
|
2.2 Consolidated Income Statement (AR$ Million)
| 9-Month Period | 3rd Quarter | ||||||
| 2017 |
| 2016 | 2017 |
| 2016 | ||
Sales revenue | 48,158 | 18,280 | 17,357 | 9,897 | ||||
Cost of sales | (33,954) | (15,490) | (11,972) | (8,179) | ||||
|
| |||||||
Gross profit |
| 14,204 |
| 2,790 |
| 5,385 |
| 1,718 |
|
| |||||||
Selling expenses | (3,610) | (1,702) | (1,179) | (851) | ||||
Administrative expenses | (3,611) | (2,379) | (1,246) | (1,448) | ||||
Exploration expenses | (51) | (76) | (28) | (76) | ||||
Other operating income | 2,955 | 2,526 | 871 | 1,187 | ||||
Other operating expenses | (2,463) | (1,117) | (826) | (719) | ||||
Results for participation in joint businesses | 820 | (194) | 263 | (121) | ||||
Results for participation in associates | 45 | 2 | 34 | 5 | ||||
Results from sale of equity share in companies and financial instruments | - | 480 | - | 480 | ||||
|
| |||||||
Operating income |
| 8,289 |
| 330 |
| 3,274 |
| 175 |
|
| |||||||
Financial income | 1,047 | 483 | 365 | 228 | ||||
Financial costs | (3,692) | (3,039) | (1,273) | (1,619) | ||||
Other financial results | (1,325) | 157 | (534) | (78) | ||||
Financial results, net | (3,970) | (2,399) | (1,442) | (1,469) | ||||
|
| |||||||
Profit before tax |
| 4,319 |
| (2,069) |
| 1,832 |
| (1,294) |
|
| |||||||
Income tax and minimum expected profit tax | (349) | 525 | (208) | 176 | ||||
|
| |||||||
Net income for the period |
| 3,970 |
| (1,544) |
| 1,624 |
| (1,118) |
|
| |||||||
Attributable to: | ||||||||
Owners of the Company | 3,094 | (993) | 1,284 | (932) | ||||
Non-controlling interests | 876 | (551) | 340 | (186) | ||||
|
| |||||||
Net income per share for the period attributable to the owners of the Company | ||||||||
Basic and diluted income per share |
| 1.5981 |
| (0.5855) |
| 0.6624 |
| (0.5495) |
Pampa Energía● Q3 17 Earning Release●12
|
2.3 Cash and Financial Borrowings (AR$ Million)
Cash(1) | Consolidated Financial Statements | Ownership Adjusted |
(as of September 30, 2017) | ||
Power generation | 1,452 | 1,254 |
Electricity distribution | 1,866 | 962 |
Refining & distribution | 332 | 331 |
Petrochemicals | - | - |
Holding and others | 7,657 | 7,657 |
Oil and gas | 1,233 | 720 |
Total | 12,540 | 10,925 |
Bank and Financial Debt | Consolidated Financial Statements | Ownership Adjusted |
(as of September 30, 2017) | ||
Power generation(2) | 3,085 | 3,085 |
Electricity distribution | 3,155 | 1,626 |
Refining & distribution | - | - |
Petrochemicals | - | - |
Holding and others | 25,972 | 25,972 |
Oil and gas | 2,615 | 1,295 |
Total | 34,827 | 31,978 |
Note: (1) It includes cash and short-term investments. (2) It does not include regulatory liability held against CAMMESA for AR$3,189 million.
2.3.1 Summary of Listed Debt Securities (AR$ Million)
Company | Security | Maturity | Amount Issued | Amount Outstanding | Coupon |
In US$ |
|
|
|
|
|
Transener1 | ON Series 2 | 2021 | 101 | 99 | 9.75% |
Edenor | ON par at fixed rate | 2022 | 300 | 176 | 9.75% |
CTLL | ON Series 4 US$-Link2 | 2020 | 34 | 34 | 6.25% |
TGS1 | ON par at fixed rate | 2020 | 192 | 192 | 9.625% |
Pampa Energía | ON Series T at discount & fixed rate | 2023 | 500 | 500 | 7.375% |
ON Series I at discount & fixed rate | 2027 | 750 | 750 | 7.5% | |
In AR$ |
|
|
|
|
|
CTLL | ON Series A | 2018 | 282 | 282 | Badlar Privada |
ON Series E | 2020 | 575 | 575 | Badlar Privada |
Note: (1) Affiliates are not consolidated in Pampa’s financial statements, according to the IFRS standards. (2) Bond Note dollar-link, with initial FX rate of AR$8.4917 /US$.
Pampa Energía● Q3 17 Earning Release●13
|
3. Analysis of the Third Quarter 2017
Consolidated net revenues of AR$17,357 million, compared to AR$9,897 million recorded in Q3 16, mainly explained by increases of AR$1,339 million in power generation, AR$3,047 million in electricity distribution, AR$1,157 million in oil and gas, AR$1,379 million in refining and distribution, AR$998 million in petrochemicals and AR$88 million in holding and others segment, partially offset by higher eliminations from intersegment sales of AR$548 million.
ðPower generation of 3,724 GWhfrom 10 power plants
ðElectricity sales of 5,583 GWhto 2.9 million of end-users
ðProduction of 70.6 kboe/d of hydrocarbons:287 million cf/d of gas and 22.7 kboe/d of oil and NGL
ðSales of 447 thousand m3 of refined products and 124 thousand tons of petrochemical products
Consolidated adjusted EBITDA of AR$5,090 million, compared to AR$1,464 million in Q3 16, due to increases of AR$998 million in power generation, AR$1,406 million in electricity distribution, AR$647 million in oil and gas, AR$223 million in refining and distribution, AR$8 million in petrochemicals and AR$390 million in holding and others segment, partially offset by decreases of AR$46 million in intersegment eliminations.
Consolidated gain of AR$1,624 million, of which AR$1,284 million is attributable to the owners of the Company, higher than the loss of AR$932 million attributable to the owners of the Company in the Q3 16, explained by reported higher earnings in our segments of power generation (AR$779 million), electricity distribution (AR$578 million), oil and gas (AR$179 million), refining and distribution (AR$225 million) and in our holding and others segment (AR$633 million), partially offset by losses in petrochemicals (AR$133 million) and intersegment eliminations (AR$45 million).
Consolidated Adjusted EBITDA Calculation, in AR$ million | 9M17 | 9M16 | Q3 17 | Q3 16 | ||||
Consolidated operating income | 8,289 | 330 | 3,274 | 175 | ||||
Consolidated depreciations and amortizations | 3,963 | 1,796 | 1,433 | 1,201 | ||||
Consolidated EBITDA under IFRS standards |
| 12,252 |
| 2,126 |
| 4,707 |
| 1,376 |
|
|
| ||||||
Adjustments from generation segment |
| (172) |
| (10) |
| 2 |
| (3) |
Deletion of profit from tax amnesty | (174) | - |
| - |
| - | ||
Others |
| 2 |
| (10) |
| 2 |
| (3) |
Adjustments from distribution segment |
| (254) |
| 1,003 |
| 26 |
| 97 |
Adjustments from retroactive penalties |
| (333) |
| 912 |
| - |
| 70 |
Late payment interests |
| 79 |
| 91 |
| 26 |
| 27 |
Adjustments from oil and gas segment |
| 70 |
| (85) |
| 38 |
| (96) |
Results for sale of property, plant and equipment |
| - |
| (358) |
| - |
| (358) |
Cease of operations in Medanito block (La Pampa) |
| - |
| 213 |
| - |
| 213 |
Devaluation of wells |
| 27 |
| 56 |
| 22 |
| 45 |
Deletions of results from share in associates |
| (28) |
| (4) |
| (17) |
| (4) |
OldelVal's EBITDA adjusted by ownership |
| 71 |
| 8 |
| 33 |
| 8 |
Adjustments from refining and distribution segment |
| 19 |
| 8 |
| 1 |
| 8 |
Deletions of results from share in associates |
| (17) |
| (1) |
| (17) |
| (1) |
Refinor's EBITDA adjusted by ownership |
| 36 |
| 9 |
| 18 |
| 9 |
Adjustments from petrochemicals segment |
| 262 |
| - |
| 115 |
| - |
Contingencies from Ex Petrobras Argentina |
| 262 |
| - |
| 115 |
| - |
Adjustments from holding and others segment |
| 634 |
| 210 |
| 201 |
| 82 |
Deletion of profit from tax amnesty |
| (128) |
| - |
| - |
| - |
Expenses related to the acquisition of Petrobras Argentina |
| - |
| 418 |
| - |
| 392 |
Results from the sale of participation in subsidiaries |
| - |
| (480) |
| - |
| (480) |
Deletions of results from share in joint ventures/associates |
| (824) |
| 197 |
| (265) |
| 121 |
TGS's EBITDA adjusted by ownership |
| 891 |
| 34 |
| 271 |
| 34 |
Transener's EBITDA adjusted by ownership |
| 670 |
| 53 |
| 195 |
| 15 |
Others |
| 25 |
| (12) |
| - |
| - |
|
|
|
|
|
|
|
|
|
Consolidated adjusted EBITDA |
| 12,811 |
| 3,252 |
| 5,090 |
| 1,464 |
|
|
|
|
|
|
|
|
|
Pampa Energía● Q3 17 Earning Release●14
|
3.1 Analysis of the Power Generation Segment
Power Generation Segment, Consolidated | 9-Month Period | 3rd Quarter | ||||
2017 | 2016 | ∆ % | 2017 | 2016 | ∆ % | |
Sales revenue | 6,775 | 2,962 | +128.7% | 2,760 | 1,421 | +94.2% |
Cost of sales | (3,732) | (1,601) | +133.1% | (1,343) | (884) | +51.9% |
Gross profit | 3,043 | 1,361 | +123.6% | 1,417 | 537 | +163.9% |
Selling expenses | (63) | (37) | +70.3% | (27) | (21) | +28.6% |
Administrative expenses | (267) | (323) | -17.3% | (97) | (128) | -24.2% |
Other operating income | 374 | 30 | NA | 37 | 9 | NA |
Other operating expenses | (156) | (66) | +136.4% | (26) | (22) | +18.2% |
Results for participation in joint businesses | (4) | - | NA | (2) | - | NA |
Operating income | 2,927 | 965 | +203.3% | 1,302 | 375 | +247.2% |
Finance income | 612 | 354 | +72.9% | 216 | 167 | +29.3% |
Finance costs | (723) | (549) | +31.7% | (283) | (252) | +12.3% |
Other financial results | 54 | 175 | -69.1% | 69 | 41 | +68.3% |
Profit before tax | 2,870 | 945 | +203.7% | 1,304 | 331 | +294.0% |
Income tax and minimum expected profit tax | 57 | (255) | NA | (255) | (82) | +211.0% |
Net income for the period | 2,927 | 690 | NA | 1,049 | 249 | NA |
Attributable to: | ||||||
Owners of the Company | 2,805 | 606 | NA | 1,004 | 225 | NA |
Non-controlling interests | 122 | 84 | +45.2% | 45 | 24 | +87.5% |
Adjusted EBITDA | 3,309 | 1,164 | +184.3% | 1,493 | 495 | +201.3% |
Increases in property, plant and equipment | 4,728 | 1,322 | +257.6% | 1,108 | 655 | +69.2% |
Depreciation and amortization | 554 | 209 | +165.1% | 189 | 123 | +53.7% |
In Q3 17, power generation gross margin was AR$1,417 million, 164% higher than the same period of 2016, mainly due to the update in the legacy remuneration scheme by the application of SEE Resolution No. 19E/2017. Pursuant to this resolution, as from February 2017 the remuneration is US$-nominated for power capacity and dispatched energy, gradually increased from a minimum remuneration discriminated by technology and scale, followed by an increase to a base remuneration with availability commitment (‘DIGO’) in May 2017, and reaching to the full and final remuneration scheme as from November 2017. It is worth mentioning that during the entire Q3 17 the legacy capacity was billed under the new scheme of base remuneration (being thermal units monthly subject to DIGO and real availability); while in Q3 16 the remuneration scheme for the legacy capacity was AR$-nominated and under a lower pricing scheme, pursuant to SEE Resolution No. 22/2016.
Furthermore, the increase in gross margin is explained by the devaluation in the nominal exchange rate with impact on our new capacity contracts (Energy Plus and SE Resolution No. 220/2007) and our legacy capacity remuneration, as well as the new contracts at CTLL for the units GT04 and GT05 and CTPP4 coming into force.
The increase in gross margin is also explained by the full quarter inclusion of Pichi Picún Leufú Hydroelectric Plant (‘HPPL’), CTGEBA and EcoEnergía Co-Generation Plant (‘EcoEnergía’), which during Q3 17 contributed sales by 1,776 GWh over the total of 4,108 GWh sold. The joint performance of the assets CTGEBA, HPPL and EcoEnergía was higher compared to the same period of 2016, mainly due to the higher water flow at HPPL (+113 GWh), partially offset by lower dispatch due to a programmed maintenance service during September 2017 at Genelba Plus’s turbine (-26 GWh).
4 For further information, please refer to section 1.1.2 of this Earnings Release.
Pampa Energía● Q3 17 Earning Release●15
|
In operating terms, Pampa’s power generation during Q3 17 increased by 9% compared to Q3 16, mainly due to the full quarter inclusion of former Petrobras Argentina’s assets plus its performance improvement mentioned before (+599 GWh), higher generation at CTG (+164 GWh) due to higher availability of natural gas in the region, and the commissioning of the gas turbine GT05 at CTLL (+31 GWh) and at CTPP (+63 GWh). These increases were partially offset by lesser generation at CPB due to lower dispatch (-470 GWh) and lower water flow at HINISA and HIDISA (-97 GWh).
Summary of | Hydroelectric | Thermal | Total | ||||||||
HINISA | HIDISA | HPPL1 | CTLL2 | CTG3 | CTP | CPB | CTPP4 | CTGEBA1 | Eco- | ||
Installed Capacity (MW) | 265 | 388 | 285 | 750 | 361 | 30 | 620 | 100 | 843 | 14 | 3,656 |
New Capacity (MW) | - | - | - | 349 | 100 | 30 | - | 100 | 169 | 14 | 762 |
Market Share | 0.7% | 1.1% | 0.8% | 2.1% | 1.0% | 0.1% | 1.7% | 0.3% | 2.3% | 0.04% | 10.1% |
9-Month Period |
|
|
|
|
|
|
|
|
|
|
|
Net Generation 9M17 (GWh) | 476 | 332 | 444 | 3,247 | 1,410 | 124 | 1,302 | 63 | 4,024 | 73 | 11,494 |
Market Share | 0.5% | 0.3% | 0.4% | 3.2% | 1.4% | 0.1% | 1.3% | 0.1% | 3.9% | 0.1% | 11.2% |
Sales 9M17 (GWh) | 476 | 332 | 444 | 3,247 | 1,848 | 124 | 1,302 | 63 | 4,578 | 75 | 12,488 |
Net Generation 9M16 (GWh) | 462 | 388 | 57 | 2,807 | 1,191 | 112 | 1,721 | - | 908 | 16 | 7,662 |
Variation Net Generation 9M17 - 9M16 | +3.1% | -14.5% | +675.2% | +15.6% | +18.4% | +10.3% | -24.3% | na | +343.4% | +345.4% | +50.0% |
Sales 9M16 (GWh) | 462 | 388 | 57 | 2,807 | 1,572 | 112 | 1,722 | - | 1,021 | 17 | 8,158 |
Average Price 9M17 (US$ / MWh) | 25.5 | 33.8 | 24.9 | 33.4 | 29.8 | 49.4 | 26.3 | 58.3 | 34.1 | 68.4 | 32.3 |
Average Price 9M16 (US$ / MWh) | 18.9 | 17.5 | 28.0 | 26.2 | 30.4 | 53.5 | 13.8 | na | 33.1 | 66.7 | 24.9 |
Average Gross Margin 9M17 (US$ / MWh) | 12.1 | 16.4 | 13.9 | 29.7 | 14.0 | na | 10.4 | 49.1 | 13.6 | 19.6 | 17.8 |
Average Gross Margin 9M17 (US$ / MWh) | 9.2 | 4.2 | 14.2 | 22.9 | 14.4 | na | 3.3 | na | 6.0 | 23.6 | 13.2 |
Third Quarter |
|
|
|
|
|
|
|
|
|
|
|
Net Generation Q3 17 (GWh) | 87 | 71 | 199 | 1,134 | 492 | 36 | 260 | 63 | 1,352 | 29 | 3,724 |
Market Share | 0.3% | 0.2% | 0.6% | 3.3% | 1.4% | 0.1% | 0.8% | 0.2% | 3.9% | 0.1% | 10.9% |
Sales Q3 17 (GWh) | 87 | 71 | 199 | 1,134 | 680 | 36 | 260 | 63 | 1,548 | 29 | 4,108 |
Net Generation Q3 16 (GWh) | 134 | 122 | 57 | 1,103 | 329 | 30 | 731 | - | 908 | 16 | 3,428 |
Variation Net Generation Q3 17 vs. Q3 16 | -35.2% | -41.4% | +247.8% | +2.8% | +49.8% | +21.2% | -64.4% | na | +49.0% | +75.0% | +8.6% |
Sales Q3 16 (GWh) | 134 | 122 | 57 | 1,103 | 450 | 30 | 731 | - | 1,021 | 17 | 3,663 |
Avg. Price Q3 17 (US$/MWh) | 45.9 | 52.0 | 21.5 | 43.6 | 28.5 | 55.4 | 50.4 | 54.8 | 34.6 | 64.6 | 37.7 |
Avg. Price Q3 16 (US$/MWh) | 20.5 | 21.8 | 27.2 | 24.4 | 32.9 | 63.6 | 14.3 | na | 32.2 | 65.0 | 25.9 |
Avg. Gross Margin Q3 17 (US$/MWh) | 20.4 | 22.9 | 13.2 | 38.8 | 13.7 | na | 22.6 | 46.2 | 15.4 | 19.9 | 22.6 |
Avg. Gross Margin Q3 16 (US$/MWh) | 8.1 | 6.5 | na | 21.1 | 12.8 | na | 7.6 | na | na | na | 12.0 |
|
|
|
|
|
|
|
|
|
|
|
|
Note: Gross margin before amortization and depreciation. FX rate of AR$/US$: 9M17 – 16.26; 9M16 – 14.56; Q3 17 – 17.29; Q3 16 – 14.95.
(1) The figures from HPPL, CTGEBA and EcoEnergía accounts from the closing of the acquisition in August 2016. (2) The installed capacity of CTLL includes 210 MW from GT04 and GT05. (3) CTG’s average gross margin considers results for CTP. (4) CTPP commissioned as from August 29, 2017.
The increase in gross margin was partially offset by higher labor costs, higher energy purchase costs to cover contracts from devaluation in the nominal exchange rate and higher depreciations due to new units, programmed maintenance services and the Purchase Price Allocation as a result of the acquisition of former Petrobras Argentina’s assets.
Net operating costs increased by 39% compared to Q3 16, mainly due to higher labor costs and the full quarter inclusion of HPPL, CTGEBA and EcoEnergía power plants.
Net financial results had a positive variation of AR$46 million compared to Q3 16, recording a AR$2 million profit in Q3 17, mainly due to higher gains from the holding of financial instruments and the recognition of net interest to the credits held against CAMMESA by the former Petrobras Argentina’s generation assets. These effects were partially offset by lower gains from net exchange difference and higher interest losses on financial liabilities and loan agreements with CAMMESA.
Adjusted EBITDA increased by 201% over Q3 16 to AR$1,493 million, mainly due to a better remuneration for legacy capacity, Peso devaluation, the full quarter inclusion of former Petrobras Argentina's generation assets, together with the commissioning of units at CTLL and CTPP, and therecognition of a higher price for assignments of gas, partially offset by higher labor and energy purchase costs.
Pampa Energía● Q3 17 Earning Release●16
|
The following table shows a summary of the committed expansion projects, in which CTGEBA’s 383 MW project is included:
Project | MW | Equipment Provider | Marketing | Awarded Price | Estimated Capex in | Date of | ||
Capacity | Variable | Total | ||||||
Thermal |
|
|
|
|
|
|
|
|
Loma de la Lata | 15 | MAN | Res. SEE N° 19/17 | na | na | na | 18 | Q1 2018 |
105 | GE | US$ PPA for 10 years | 23,000 | 7.5 | 39 | 90 | August 5, 2017 | |
Parque Ind. Pilar | 100 | Wärtsilä | US$ PPA for 10 years | 26,900 | 15 - 16 | 52 | 103 | August 29, 2017 |
Ing. White | 100 | Wärtsilä | US$ PPA for 10 years | 21,800 | 12 - 15 | 42 - 45 | 90 | Q4 2017 |
Cierre Genelba Plus | 383 | Siemens | US$ PPA for 15 years | 20,500 | 6 | 34 | 350 | GT: Q2 2019 / CC: Q2 2020 |
Renewable |
|
|
|
|
|
|
|
|
Pampa Eólico I (Corti)2 | 100 | Vestas | US$ PPA for 20 years | na | na | 58 | 135 | Q2 2018 |
Total | 803 |
|
|
|
|
| 786 |
|
Note: (1) Amounts without VAT. (2) Awarded price does not consider incentive and adjustment factors.
3.2 Analysis of the Electricity Distribution Segment
Electricity Distribution Segment, Consolidated | 9-Month Period | 3rd Quarter | ||||
2017 | 2016 | ∆ % | 2017 | 2016 | ∆ % | |
Sales revenue | 17,576 | 9,117 | +92.8% | 6,457 | 3,410 | +89.4% |
Cost of sales | (12,720) | (9,351) | +36.0% | (4,638) | (3,405) | +36.2% |
Gross profit | 4,856 | (234) | NA | 1,819 | 5 | NA |
Selling expenses | (1,460) | (1,101) | +32.6% | (441) | (339) | +30.1% |
Administrative expenses | (1,009) | (819) | +23.2% | (379) | (324) | +17.0% |
Other operating income | 70 | 558 | -87.5% | 29 | 12 | +141.7% |
Other operating expenses | (612) | (357) | +71.4% | (299) | (82) | +264.6% |
Operating income | 1,845 | (1,953) | NA | 729 | (728) | NA |
Finance income | 182 | 140 | +30.0% | 64 | 49 | +30.6% |
Finance costs | (1,152) | (1,233) | -6.6% | (380) | (449) | -15.4% |
Other financial results | 71 | (288) | NA | (13) | 23 | NA |
Profit before tax | 946 | (3,334) | NA | 400 | (1,105) | NA |
Income tax and minimum expected profit tax | (256) | 1,078 | NA | (100) | 368 | NA |
Net income for the period | 690 | (2,256) | NA | 300 | (737) | NA |
Attributable to: | ||||||
Owners of the Company | 370 | (1,363) | NA | 159 | (419) | NA |
Non-controlling interests | 320 | (893) | NA | 141 | (318) | NA |
Adjusted EBITDA | 1,911 | (683) | NA | 869 | (537) | NA |
Increases in property, plant and equipment | 2,873 | 2,009 | +43.0% | 1,137 | 669 | +70.0% |
Depreciation and amortization | 320 | 267 | +19.9% | 114 | 94 | +21.3% |
In Q3 17, net sales increased by AR$3,047 million in relation to Q3 16, mainly due to the implementation of the first stage of the 42% tariff increase as from February 2017, as a result of the new tariff scheme from the RTI in addition to last year’s injunction that negatively affected Q3 16 performance. Moreover, Edenor’s customers increased by 2%.
As of September 30, 2017, the amount generated by the gradual application of the tariff increase amounts to AR$4,197 million approximately, which is recognized by ENRE but, in accordance with thereporting standards, is not recognized in Edenor’s financial statements. This amount is payable in 48 installments as from February 1, 2018 and will be included in the resulting VAD at that date.
Pampa Energía● Q3 17 Earning Release●17
|
The sales increase was partially offset by the non-accrual of FOCEDE, as a consequence of the RTI implementation, registering AR$172 million in Q3 16. Moreover, a lower electricity sales was recorded in Q3 17, which decreased by 3% in GWh terms compared to the same period in 2016, mainly explained by tariff increase and mild winter.
Edenor's Sales | 2017 | 2016 | Variation | |||||
In GWh | Part. % | Clients | In GWh | Part. % | Clients | % | % Clients | |
9-Month Period |
|
|
|
|
|
|
|
|
Residential | 7,138 | 43% | 2,553,412 | 7,621 | 45% | 2,489,695 | -6.3% | +2.6% |
Commercial | 2,656 | 16% | 362,796 | 2,765 | 16% | 359,845 | -3.9% | +0.8% |
Industrial | 2,765 | 17% | 6,859 | 2,770 | 16% | 6,823 | -0.2% | +0.5% |
Wheeling System | 2,960 | 18% | 708 | 3,011 | 18% | 713 | -1.7% | -0.7% |
Others | ||||||||
Public Lighting | 551 | 3% | 21 | 544 | 3% | 21 | +1.3% | - |
Shantytowns and Others | 371 | 2% | 419 | 404 | 2% | 407 | -8.1% | +2.9% |
|
|
|
|
|
|
|
|
|
Total | 16,440 | 100% | 2,924,215 | 17,114 | 100% | 2,857,504 | -3.9% | +2.3% |
Third Quarter |
|
|
|
|
|
|
|
|
Residential | 2,464 | 44% | 2,553,412 | 2,631 | 46% | 2,489,695 | -6.4% | +2.6% |
Commercial | 875 | 16% | 362,796 | 896 | 16% | 359,845 | -2.4% | +0.8% |
Industrial | 912 | 16% | 6,859 | 898 | 16% | 6,823 | +1.5% | +0.5% |
Wheeling System | 987 | 18% | 708 | 959 | 17% | 713 | +2.9% | -0.7% |
Others | ||||||||
Public Lighting | 197 | 4% | 21 | 194 | 3% | 21 | +2.0% | - |
Shantytowns and Others | 148 | 3% | 419 | 151 | 3% | 407 | -2.1% | +2.9% |
|
|
|
|
|
|
|
|
|
Total | 5,583 | 100% | 2,924,215 | 5,729 | 100% | 2,857,504 | -2.6% | +2.3% |
Net operating costs, excluding energy purchases, increased by 7% compared to Q3 16, mainly due to higher salary costs, fees for third-party services, operating taxes and provision for sales’ credits, caused from a higher billing resulting from the new tariff schemes, partially offset by a lower penalties charge by ENRE because of a change in the valuation criteria. Energy purchases increased by 72% compared to Q3 16, due to the increase in electricity prices as subsidies are being removed gradually, partially offset by a decrease in electricity losses, which posted 18.4% of the demanded electricity in Q3 17 in comparison to 18.9% reached in Q3 16.
Operating results increased by AR$1,457 million compared to Q3 16, mainly due to the RTI’s new tariff scheme application and lower penalties charge, partially offset by higher operating expenses.
During Q3 17, losses on net financial results decreased by AR$48 million to a loss of AR$329 million, mainly due to a higher profit from the holding of financial instruments, partially offset by higher interests and net exchange rate losses as a result of a higher devaluation of the Argentine Peso against the US Dollar, currency in which Edenor’s financial liabilities are denominated.
Adjusted EBITDA in Q3 17 for our electricity distribution segment posted a gain of AR$869 million, which includes late payment penalties collected from our customers for AR$26 million. In Q3 16 the adjusted EBITDA amounted to a loss of AR$537 million and included AR$27 million of late payment penalties and a reclassification of financial interest on the penalties’ balance for AR$70 million.
Pampa Energía● Q3 17 Earning Release●18
|
3.3 Analysis of the Oil and Gas Segment
Oil & Gas Segment, Consolidated | 9-Month Period | 3rd Quarter | ||||
2017 | 2016 | ∆ % | 2017 | 2016 | ∆ % | |
Sales revenue | 11,959 | 4,148 | +188.3% | 4,175 | 3,018 | +38.3% |
Cost of sales | (8,113) | (2,956) | +174.5% | (2,816) | (2,276) | +23.7% |
Gross profit | 3,846 | 1,192 | +222.7% | 1,359 | 742 | +83.2% |
Selling expenses | (476) | (217) | +119.4% | (148) | (144) | +2.8% |
Administrative expenses | (810) | (368) | +120.1% | (286) | (243) | +17.7% |
Exploration expenses | (51) | (76) | -32.9% | (28) | (76) | -63.2% |
Other operating income | 2,050 | 1,881 | +9.0% | 739 | 1,129 | -34.5% |
Other operating expenses | (610) | (460) | +32.6% | (229) | (394) | -41.9% |
Results for participation in associates | 28 | 4 | NA | 17 | 4 | NA |
Operating income | 3,977 | 1,956 | +103.3% | 1,424 | 1,018 | +39.9% |
Finance income | 97 | 39 | +148.7% | 26 | 39 | -33.3% |
Finance costs | (241) | (574) | -58.0% | (30) | (203) | -85.2% |
Other financial results | (335) | (75) | NA | (185) | 35 | NA |
Profit before tax | 3,498 | 1,346 | +159.9% | 1,235 | 889 | +38.9% |
Income tax and minimum expected profit tax | (550) | (241) | +128.2% | (165) | (82) | +101.2% |
Net income for the period | 2,948 | 1,105 | +166.8% | 1,070 | 807 | +32.6% |
Attributable to: | ||||||
Owners of the Company | 2,514 | 885 | +184.1% | 916 | 737 | +24.3% |
Non-controlling interests | 434 | 220 | +97.3% | 154 | 70 | +120.0% |
Adjusted EBITDA | 6,834 | 3,125 | +118.7% | 2,488 | 1,841 | +35.2% |
Increases in property, plant and equipment | 2,753 | 1,542 | +78.5% | 1,137 | 860 | +32.2% |
Depreciation and amortization | 2,787 | 1,254 | +122.2% | 1,026 | 919 | +11.6% |
In Q3 17 the gross margin from our oil and gas segment increased by AR$617 million compared to Q3 16, mainly due to full quarter inclusion of former Petrobras Argentina’s assets in comparison to only two months in Q3 16, in addition to gas sales price improvements in US Dollar and expressed in Argentine Peso as an effect of the devaluation in the nominal exchange rate. These effects were partially offset by lower level of gas, oil and NGL production, as a result of divestments in October 2016 from former Petrobras Argentina of certain assets, higher fixed assets depreciation costs, higher gas production, transportation and royalties’ costs and inflation levels in Argentine Peso, in addition to the effect of the exchange rate variation over the costs denominated in US Dollar.
The total production of this segment of Pampa in Q3 17 decreased by 14.6 kboe/day in relation to Q3 16, mainly due to the divestments in October 2016 of Aguada de la Arena, Colpa and Caranda and partially in Río Neuquén (-12.8 kboe/day), in addition to the termination of the concession of Medanito La Pampa block by the end of October 2016 (-5.6 kboe/day). These decreases were partially offset by the operating service agreement between Petrolera Pampa and Pampetrol for Medanito La Pampa (+3.4 kboe/day)5 and higher level of gas production in El Mangrullo and Sierra Chata blocks (+2.3 kboe/day).
Only for operating comparison purposes, the production of gas in Q3 17 from former Petrobras Argentina’s assets including PELSA was 23% lower in comparison to the same period in 2016, mainly due to the mentioned divestments, resulting in 189 million cf/day in Q3 17 and 243 million cf/day in the comparative period (Q3 16 includes 11 million cf/day from overseas). Moreover, crude oil and NGL production decreased to 20.5 kboe/day, in comparison to 28.7 kboe/day in Q3 16 (they include 1.1 kboe/day and 2.3 kboe/day of foreign production in Q3 17 and Q3 16, respectively), mainly due to the cease of operations in Medanito La Pampa by the end of October 2016, lower level of oil production as a result of lower local price in USDollar and Argentine Peso, and lower level of production in Venezuela.Moreover, Petrolera Pampa’s gas production was 99 million cf/day in Q3 17, slightly lower than 101 million cf/day in Q3 16, while the oil production increased from 0.3 kb/day in Q3 16 to 3.3 kb/day in Q3 17, mainly as a result of the service provided in Medanito La Pampa.
5 For further information, please refer to section 1.5.4 of this Earnings Release.
Pampa Energía● Q3 17 Earning Release●19
|
As of September 30, 2017, we accounted 1,957 productive wells in Argentina, in comparison to 1,924 as of December 31, 2016.
Oil & Gas Production | Oil | Gas | NGL | Total | ||||||
Petrolera | Pampa | PELSA | Total | Petrolera | Pampa | PELSA | Total | Total | ||
9-Month Period |
|
|
|
|
|
|
|
|
|
|
Volume 9M17 |
|
|
|
|
|
|
|
|
|
|
In thousand m3/day | 0.6 | 1.9 | 1.1 | 3.5 | 2,955 | 4,380 | 723 | 8,058 | 0.1 | |
In thousand boe/day | 3.5 | 12.0 | 6.8 | 22.3 | 17.4 | 25.8 | 4.3 | 47.4 | 0.7 | 70.4 |
In million cubic feet/day | 104 | 155 | 26 | 285 | ||||||
Avg. Price 9M17 |
|
|
|
|
|
|
|
|
|
|
In US$/bbl | 55.6 | 51.1 | 56.8 | 53.6 | ||||||
In US$/MBTU | 7.4 | 5.4 | 5.8 | 6.2 | ||||||
In US$/ton | 318.2 | |||||||||
Volume 9M16 |
|
|
|
|
|
|
|
|
|
|
In thousand m3/day | 0.0 | 2.8 | 1.2 | 4.1 | 2,652 | 5,877 | 722 | 9,250 | 0.1 | |
In thousand boe/day | 0.3 | 17.7 | 7.7 | 25.7 | 15.6 | 34.6 | 4.2 | 54.4 | 0.8 | 80.9 |
In million cubic feet/day | 94 | 208 | 25 | 327 | ||||||
Variation 9M17 v. 9M16 | na | -32.2% | -12.6% | -13.3% | +11.5% | -25.5% | +0.2% | -12.9% | -7.2% | -13.0% |
Avg. Price 9M16 |
|
|
|
|
|
|
|
|
|
|
In US$/bbl | 64.9 | 59.8 | 65.9 | 61.8 | ||||||
In US$/MBTU | 7.3 | 5.2 | 5.6 | 6.6 | ||||||
In US$/ton | 187.9 | |||||||||
Variation 9M17 v. 9M16 | -14.4% | -14.5% | -13.7% | -13.3% | +0.6% | +4.4% | +4.1% | -6.1% | +69.3% | |
Third Quarter |
|
|
|
|
|
|
|
|
|
|
Volume Q3 17 |
|
|
|
|
|
|
|
|
|
|
In thousand m3/day | 0.5 | 2.0 | 1.0 | 3.5 | 2,799 | 4,559 | 781 | 8,140 | 0.1 | |
In thousand boe/day | 3.3 | 12.5 | 6.3 | 22.1 | 16.5 | 26.8 | 4.6 | 47.9 | 0.6 | 70.6 |
In million cubic feet/day | 99 | 161 | 28 | 287 | ||||||
Avg. Price Q3 17 |
|
|
|
|
|
|
|
|
|
|
In US$/bbl | 52.8 | 49.5 | 55.0 | 51.6 | ||||||
In US$/MBTU | 7.3 | 5.7 | 6.0 | 6.3 | ||||||
In US$/ton | 284.7 | |||||||||
Volume Q3 16 |
|
|
|
|
|
|
|
|
|
|
In thousand m3/day | 0.1 | 2.8 | 1.2 | 4.1 | 2,872 | 5,877 | 722 | 9,470 | 0.1 | |
In thousand boe/day | 0.3 | 17.7 | 7.7 | 25.8 | 16.9 | 34.6 | 4.2 | 55.7 | 0.8 | 82.3 |
In million cubic feet/day | 101 | 208 | 25 | 334 | ||||||
Variation Q3 17 v. Q3 16 | na | -29.3% | -18.9% | -14.3% | -2.5% | -22.4% | +8.3% | -14.0% | -15.3% | -14.1% |
Avg. Price Q3 16 |
|
|
|
|
|
|
|
|
|
|
In US$/bbl | 64.8 | 59.8 | 65.9 | 61.7 | ||||||
In US$/MBTU | 7.3 | 5.2 | 5.6 | 6.1 | ||||||
In US$/ton | 187.9 | |||||||||
Variation Q3 17 v. Q3 16 | -18.5% | -17.1% | -16.5% | -16.4% | +0.3% | +9.0% | +6.3% | +3.4% | +51.5% | |
|
|
|
|
|
|
|
|
|
|
|
Note: Pampa and PELSA’s volume accounts from the closing of the acquisition of former Petrobras Argentina in August 2016. The production considers the 100% contribution of Medanito La Pampa, a block where Petrolera Pampa provided services until the end of October 2017. Moreover, the production does not consider foreign production of 1.5 kboe/day in 9M17; 4.5 kboe/day in 9M16; 1.1 kboe/day in Q3 17; and 4.1 kboe/day in Q3 16. FX rate of AR$/US$: 9M17 – 16.26; 9M16 – 14.56; Q3 17 – 17.29; Q3 16 – 14.95.
The compensation received through the Natural Gas Surplus Injection Promotion Program SE Resolution No. 1/2013 and for the Companies with Natural Gas Reduced Injection SE Resolution No. 60/2013 (‘Plan Gas’) decreased due to the divestments from former Petrobras Argentina’s certain assets in October 2016, together with the demand price increase, diminishing by AR$60 million to al total amount of AR$691 million in Q3 17, in comparison to AR$751 million registered in Q3 16, Petrolera Pampa’s stake being AR$327 million and AR$315 million, respectively.
Pampa Energía● Q3 17 Earning Release●20
|
Losses on net financial results increased during Q3 17 by AR$60 million to a loss of AR$189 million, mainly due to higher accrual of losses as a result of net exchange rate difference, partially offset by lower losses from financial interests.
The adjusted EBITDA of our oil and gas segment increased by AR$647 million, posting an amount of AR$2,488 million in Q3 17, mainly due to the full quarter inclusion of former Petrobras Argentina’s assets, in addition to higher sales volumes and the effect of the exchange rate variation in our gas sales price, partially offset by divestments from former Petrobras Argentina’s certain assets in October 2016. The adjusted EBITDA does not consider wells retirements for AR$22 million in Q3 17 and AR$45 million in Q3 16, and in turn considers the proportional EBITDA of OldelVal, an oil transportation company, in which Pampa holds a direct participation of 23.1%, for AR$33 million in Q3 17, in comparison to AR$8 million in the same period of 2016. Moreover, the Q3 16’s adjusted EBITDA does not consider the profit from the sale of equipment to TGS at Río Neuquén natural gas processing plant (AR$358 million) and the reporting loss due to block revert and cease of operations in Medanito La Pampa (AR$213 million), both items registered in other income and expenses.
3.4 Analysis of the Refining and Distribution Segment
Refining & Distribution Segment, Consolidated | 9-Month Period | 3rd Quarter | ||||
2017 | 2016 | ∆ % | 2017 | 2016 | ∆ % | |
Sales revenue | 12,254 | 2,725 | NA | 4,104 | 2,725 | +50.6% |
Cost of sales | (10,540) | (2,515) | NA | (3,482) | (2,515) | +38.4% |
Gross profit | 1,714 | 210 | NA | 622 | 210 | +196.2% |
Selling expenses | (1,422) | (304) | NA | (494) | (304) | +62.5% |
Administrative expenses | (53) | (7) | NA | (17) | (7) | +142.9% |
Other operating income | 164 | 33 | NA | 49 | 33 | +48.5% |
Other operating expenses | (66) | 5 | NA | (23) | 5 | NA |
Results for participation in associates | 17 | 1 | NA | 17 | 1 | NA |
Operating income | 354 | (62) | NA | 154 | (62) | NA |
Finance income | 14 | 1 | NA | 7 | 1 | NA |
Finance costs | (13) | (5) | +160.0% | (4) | (5) | -20.0% |
Other financial results | (11) | (4) | +175.0% | 1 | (4) | NA |
Profit before tax | 344 | (70) | NA | 158 | (70) | NA |
Income tax and minimum expected profit tax | (8) | (2) | +300.0% | (5) | (2) | +150.0% |
Net income for the period | 336 | (72) | NA | 153 | (72) | NA |
Adjusted EBITDA | 547 | (9) | NA | 214 | (9) | NA |
Increases in property, plant and equipment | 123 | 63 | +95.2% | 63 | 63 | - |
Depreciation and amortization | 174 | 45 | +286.7% | 59 | 45 | +31.1% |
Refining and distribution segment comes from the acquisition of former Petrobras Argentina, and was a new business to the original portfolio of assets of Pampa.
The gross margin of this segment during Q3 17 increased to AR$622 million, 196% higher than Q3 16, mainly because of lower costs from the purchase of barrels of crude oil that began its convergence toward export parity, which also decreased in Argentine Peso as the exchange rate impact was lower than the price variation in US Dollar, together with the improvements in sales prices of diesel oil and gasoline, which are mainly sold to brokers and gas stations, and IFOs sold to the shipping sector. These effects were partially offset by larger operating costs incurred due to increased sales volume. The amounts corresponding to Pampa are shown below:
Pampa Energía● Q3 17 Earning Release● 21
|
Refining & Distribution | Products | |||||
Crude Oil | Diesel Oil | Gasolines | Fuel Oil, IFOs & Asphalts | Other distillates | Total | |
9-Month Period |
|
|
|
|
|
|
Volume 9M17 (thousand m3) | 13 | 609 | 337 | 232 | 210 | 1,400 |
Average Price 9M17 (US$/m3) | 310 | 569 | 664 | 385 | 430 | 538 |
Volume 9M16 (thousand m3) | 3 | 162 | 81 | 60 | 30 | 336 |
Average price 9M16 (US$/m3) | 370 | 590 | 655 | 405 | 432 | 557 |
Volume Variation 9M17 - 9M16 | +278.4% | +275.1% | +318.4% | +288.2% | +593.8% | +316.5% |
Price Variation 9M17 - 9M16 | -16.1% | -3.6% | +1.4% | -5.0% | -0.6% | -3.3% |
Third Quarter |
|
|
|
|
|
|
Volume Q3 17 (thousand m3) | 4 | 196 | 110 | 79 | 58 | 447 |
Average Price Q3 17 (US$/m3) | 304 | 557 | 648 | 371 | 457 | 531 |
Volume Q3 16 (thousand m3) | 3 | 162 | 81 | 60 | 30 | 336 |
Average Price Q3 16 (US$/m3) | 360 | 575 | 638 | 395 | 421 | 542 |
Volume Variation Q3 17 - Q3 16 | +19.7% | +20.7% | +36.6% | +32.1% | +92.1% | +32.9% |
Price Variation Q3 17 - Q3 16 | -15.7% | -3.1% | +1.6% | -6.0% | +8.5% | -2.0% |
|
|
|
|
|
|
|
Note: Pampa’s volume accounts from the closing of the acquisition of Petrobras Argentina in August 2016. FX rate of AR$/US$: 9M17 – 16.26; 9M16 – 14.56; Q3 17 – 17.29; Q3 16 – 14.95.
In operating terms and not considering Pampa’s consolidation effect, sales volume of refined products totaled 447 thousand m3 in Q3 17, 11% lower than 500 thousand m3 in Q3 16, mainly due to lower load factor at the refinery and diesel oil imports, as a result of a decline in diesel oil and gasoline’s demand, partially offset by higher sales of asphalts and IFOs due to the market activity improvement.
The adjusted EBITDA of our refining and distribution segment considers the EBITDA adjusted by ownership of Refinor, a company where Pampa holds 28.5% stake, recording AR$18 million in Q3 17, in comparison to AR$9 million in the same period of 2016.
3.5 Analysis of the Petrochemicals Segment
Petrochemicals Segment, Consolidated | 9-Month Period | 3rd Quarter | ||||
2017 | 2016 | ∆ % | 2017 | 2016 | ∆ % | |
Sales revenue | 5,374 | 915 | NA | 1,913 | 915 | +109.1% |
Cost of sales | (4,923) | (714) | NA | (1,795) | (714) | +151.4% |
Gross profit | 451 | 201 | +124.4% | 118 | 201 | -41.3% |
Selling expenses | (208) | (43) | NA | (78) | (43) | +81.4% |
Administrative expenses | (51) | (6) | NA | (20) | (6) | +233.3% |
Other operating income | 35 | (6) | NA | 14 | (6) | NA |
Other operating expenses | (332) | (113) | +193.8% | (128) | (113) | +13.3% |
Operating income | (105) | 33 | NA | (94) | 33 | NA |
Finance income | 10 | 1 | NA | 4 | 1 | +300.0% |
Other financial results | (22) | (5) | NA | (14) | (5) | +180.0% |
Profit before tax | (117) | 29 | NA | (104) | 29 | NA |
Income tax and minimum expected profit tax | - | - | NA | - | - | NA |
Net income for the period | (117) | 29 | NA | (104) | 29 | NA |
Adjusted EBITDA | 241 | 43 | NA | 51 | 43 | +18.6% |
Increases in property, plant and equipment | 59 | 18 | +227.8% | 23 | 18 | +27.8% |
Depreciation and amortization | 84 | 10 | NA | 30 | 10 | +200.0% |
Pampa Energía● Q3 17 Earning Release●22
|
As refining and distribution, petrochemicals segment also comes from the acquisition of former Petrobras Argentina and was not a business within the original portfolio of assets of Pampa.
The gross margin in this segment during Q3 17 posted AR$118 million, 41% lower than Q3 16, mainly driven by higher operating and raw materials’ costs, mostly denominated in US Dollar, partially offset by higher international pricing references, also denominated in US Dollar. The amounts corresponding to Pampa are shown below:
Petrochemicals | Products | |||
Styrene & Polystyrene1 | SBR | Other | Total | |
9-Month Period |
|
|
|
|
Volume 9M17 (thousand ton) | 102 | 25 | 228 | 354 |
Average Price 9M17 (US$/ton) | 1,470 | 2,134 | 562 | 933 |
Volume 9M16 (thousand ton) | 20 | 4 | 54 | 78 |
Average Price 9M16 (US$/ton) | 1,368 | 1,780 | 523 | 804 |
Volume Variation 9M17 - 9M16 | +406.2% | +525.2% | +321.0% | +353.3% |
Price Variation 9M17 - 9M16 | +7.4% | +19.9% | +7.5% | +16.0% |
Third Quarter |
|
|
|
|
Volume Q3 17 (thousand ton) | 33 | 8 | 83 | 124 |
Average Price Q3 17 (US$/ton) | 1,434 | 1,789 | 578 | 889 |
Volume Q3 16 (thousand ton) | 20 | 4 | 54 | 78 |
Average Price Q3 16 (US$/ton) | 1,332 | 1,734 | 509 | 783 |
Volume Variation Q3 17 - Q3 16 | +65.5% | +112.4% | +52.7% | +59.0% |
Price Variation Q3 17 - Q3 16 | +7.6% | +3.2% | +13.4% | +13.5% |
|
|
|
|
|
Note: Pampa’s volume accounts from the closing of the acquisition of Petrobras Argentina in August 2016. FX rate of AR$/US$: 9M17 – 16.26; 9M16 – 14.56; Q3 17 – 17.29; Q3 16 – 14.95. (1) Includes Propylene, Ethylene and BOPs.
In operating terms and not considering Pampa’s consolidation effect, total sales volume of our petrochemicals segment increased by 7% in Q3 17, totaling 124 thousand tons compared to 117 thousand tons in Q3 16. This increase mainly responds to higher domestic sales of octanes followed by styrene products, in addition to higher exports of SBR because of international prices’ improvement, partially offset by lower export sales of reforming products.
The adjusted EBITDA of our petrochemicals segment increased by AR$8 million, posting AR$51 million in Q3 17, it does not consider a contingencies’ update with customs from former Petrobras Argentina for AR$115 million.
Pampa Energía● Q3 17 Earning Release●23
|
3.6 Analysis of the Holding and Others Segment
Holding & Others Segment, Consolidated | 9-Month Period | 3rd Quarter | ||||
2017 | 2016 | ∆ % | 2017 | 2016 | ∆ % | |
Sales revenue | 312 | 58 | NA | 96 | 8 | NA |
Cost of sales | (3) | (2) | +50.0% | - | - | NA |
Gross profit | 309 | 56 | NA | 96 | 8 | NA |
Administrative expenses | (1,454) | (873) | +66.6% | (460) | (746) | -38.3% |
Other operating income | 262 | 30 | NA | 3 | 10 | -70.0% |
Other operating expenses | (687) | (127) | NA | (121) | (114) | +6.1% |
Results for participation in joint businesses | 824 | (194) | NA | 265 | (121) | NA |
Results for participation in associates | - | (3) | -100.0% | - | - | NA |
Results from sale of equity share in companies and financial instruments | - | 480 | -100.0% | - | 480 | -100.0% |
Operating income | (746) | (631) | +18.2% | (217) | (483) | -55.1% |
Finance income | 170 | 18 | NA | 52 | 14 | +271.4% |
Finance costs | (1,601) | (748) | +114.0% | (580) | (753) | -23.0% |
Other financial results | (1,082) | 355 | NA | (392) | (167) | +134.7% |
Profit before tax | (3,259) | (1,006) | +224.0% | (1,137) | (1,389) | -18.1% |
Income tax and minimum expected profit tax | 408 | (55) | NA | 317 | (26) | NA |
Net income for the period | (2,851) | (1,061) | +168.7% | (820) | (1,415) | -42.0% |
Adjusted EBITDA | (68) | (410) | -83.5% | (1) | (391) | -99.7% |
Increases in property, plant and equipment | 50 | 57 | -12.3% | 18 | 57 | -68.4% |
Depreciation and amortization | 44 | 11 | +300.0% | 15 | 10 | +50.0% |
During Q3 17, the gross margin from our holding and others segment increased by AR$88 million compared to the same period of 2016, mainly explained by higher income from fees charged to our subsidiaries.
Moreover, without considering the results from our participation in joint businesses (Transener and TGS) and the results from the sale of CIESA Trust in Q3 16, the operating income recorded a loss of AR$482 million in comparison to the loss of AR$842 million for the same period in 2016, mainly due to the third party fees and legal costs incurred as a result of the acquisition of former Petrobras Argentina in Q3 16 (AR$392 million).
The losses on net financial results increased by AR$14 million, registering AR$920 million of losses in Q3 17, mainly because of higher interest and net exchange rate differences losses from our increased financial liabilities, partially offset by higher gains from the holding of financial instruments.
The adjusted EBITDA of our holding and others segment increased by AR$390 million in the Q3 17, recording a loss of AR$1 million. The adjusted EBITDA removes equity income from Transener and TGS, and in turn, considers a consolidation of EBITDAs adjusted by indirect ownership participation in these businesses. Moreover, the adjusted EBITDA in Q3 16 does not consider the expenses related to the acquisition of former Petrobras Argentina, as they are considered one-offs.
In Q3 17 the EBITDA adjusted by indirect ownership of 25.5% over TGS was AR$271 million (implicit total of AR$1,064 million), a significantly higher amount compared to Q3 16, mainly due to the tariff increase resulting from the RTI for gas transportation business, effective as of April 2017 along with the first out of three installments equivalent to approximately 58% on average. Furthermore, the margin improvement in the liquids segment, which was due to prices as well as nominal exchange rate, contributed to the EBITDA’s performance.
In the case of Transener, the EBITDA adjusted by stake ownership of 26.3% was AR$195 million (implicit total of AR$739 million), which was positively impacted by the implementation of the new tariff
Pampa Energía● Q3 17 Earning Release●24
|
scheme resulting from the RTI in only one installment as of February 2017 (1185% and 1332% increases over the tariff scheme of Transener and Transba, respectively, considering the appeal result and excluding Instrumental Agreement and the Federal Plan6). Furthermore, the adjusted EBITDA includes the difference between collected amounts and accrued sales corresponding to CAMMESA’s credit regarding the Instrumental Agreement. The last milestone for the acknowledgment of higher costs were accrued and collected in Q2 17, consequently having no adjustment as from Q3 17, in comparison to AR$398 million of positive adjustment registered in Q3 16.
6For further information, please refer to section 1.2 of this Earnings Release.
Pampa Energía● Q3 17 Earning Release●25
|
3.7 Analysis of the Nine-Month Period, by Subsidiary (AR$ Million)7
| 9-Month Period 2017 | 9-Month Period 2016 | ||||||
Subsidiary | % Pampa | Adjusted EBITDA | Net Debt5 | Net Income6 | % Pampa | Adjusted EBITDA | Net Debt5 | Net Income6 |
Power Generation Segment |
|
|
|
|
|
|
|
|
Diamante | 56.0% | 61 | (161) | 60 | 56.0% | 9 | (22) | 29 |
Los Nihuiles | 47.0% | 73 | (156) | 129 | 47.0% | 45 | (76) | 105 |
CPB | 100.0% | 148 | 651 | (58) | 100.0% | (3) | 371 | (122) |
CTG | 90.4% | 381 | (406) | 262 | 90.4% | 272 | 22 | 155 |
CTLL1 | 100.0% | 1,517 | 2,528 | 1,218 | 100.0% | 758 | 1,846 | 389 |
Pampa Energía2 | 100.0% | 1,155 | - | 1,299 | 67% | 91 | (9) | 90 |
Other companies, adjustments & deletions3 | 100.0% | (27) | (822) | (105) | 100.0% | (9) | (445) | (41) |
Subtotal Power Generation |
| 3,309 | 1,633 | 2,805 |
| 1,164 | 1,686 | 606 |
Electricity Distribution Segment |
|
|
|
|
|
|
|
|
Edenor1 | 51.4% | 1,905 | 1,289 | 660 | 51.5% | (676) | 696 | (1,842) |
EASA1,4 | - | - | - | 100.0% | 21 | 2,027 | (407) | |
Adjustments & deletions3 | 50% | 6 | - | (290) | 50% | (28) | (1,816) | 887 |
Subtotal Electricity Distribution |
| 1,911 | 1,289 | 370 |
| (683) | 906 | (1,363) |
Oil & Gas Segment |
|
|
|
|
|
|
|
|
Petrolera Pampa | 49.5% | 2,381 | 2,202 | 866 | 49.5% | 2,010 | 3,801 | 442 |
PELSA | 58.9% | 968 | (741) | (1) | 40% | 223 | (522) | 29 |
Pampa Energía (Stand-Alone)1,2 | 100.0% | 3,454 | (80) | 2,128 | 67% | 593 | 335 | 347 |
OldelVal | 23.1% | 307 | (101) | 135 | 52 | (89) | 23 | |
Non-controlling stake adjustment | (236) | 78 | (104) | (44) | 75 | (19) | ||
Subtotal OldelVal | 23% | 71 | (23) | 31 | 8 | (14) | 4 | |
Adjustments & deletions3 | 100% | (40) | 1 | (509) | 100% | 292 | 1,299 | 63 |
Subtotal Oil & Gas |
| 6,834 | 1,358 | 2,514 |
| 3,125 | 4,899 | 885 |
Refining & Distribution Segment |
|
|
|
|
|
|
|
|
Pampa Energía2 | 100.0% | 512 | (331) | 336 | 67% | 268 | (58) | 215 |
Refinor | 28.5% | 125 | (249) | (16) | 46 | 652 | 8 | |
Non-controlling stake adjustment | (89) | 178 | 11 | (37) | (527) | (6) | ||
Subtotal Refinor | 29% | 36 | (71) | (4) | 9 | 125 | 1 | |
Adjustments & deletions3 | 100% | (1) | - | 4 | 100% | (286) | (125) | (288) |
Subtotal Refining & Distribution |
| 547 | (403) | 336 |
| (9) | (58) | (72) |
Petrochemicals Segment |
|
|
|
|
|
|
|
|
Pampa Energía2 | 100.0% | 241 | - | (117) | 67% | 44 | - | 29 |
Adjustments & deletions3 | 100% | 0 | - | (0) | 100% | (1) | - | (0) |
Subtotal Petrochemicals |
| 241 | - | (117) |
| 43 | - | 29 |
Holding & Others Segment |
|
|
|
|
|
|
|
|
Pampa Energía (Stand-Alone)1,2 | 100.0% | (1,605) | 21,039 | (3,798) | 100.0% | (833) | 13,642 | (1,253) |
Former Petrobras Argentina - Corporate2 | - | - | - | 67.2% | (288) | 3,867 | (662) | |
Transener | 26.3% | 2,546 | (274) | 1,386 | 26.3% | 203 | 1,108 | (541) |
Non-controlling stake adjustment | (1,876) | 202 | (1,021) | (149) | (817) | 399 | ||
Adjustments & deletions3 | 0% | - | - | - | 26% | - | (24) | - |
Total Transmission | 26% | 670 | (72) | 365 | 53 | 268 | (142) | |
TGS | 25.5% | 3,493 | 199 | 1,819 | 17% | 196 | 2,131 | 21 |
Non-controlling stake adjustment | (2,603) | (148) | (1,355) | (163) | (1,766) | (17) | ||
Total Gas Midstream | 26% | 891 | 51 | 464 | 34 | 365 | 4 | |
Other companies, adjustments & deletions3 | 100% | (23) | (2,724) | 119 | 100% | 624 | (6,774) | 955 |
Subtotal Holding & Others |
| (68) | 18,294 | (2,851) |
| (410) | 11,368 | (1,099) |
Deletions | 100% | 37 | 116 | 37 | 100% | 22 | (633) | 21 |
Total Consolidated |
| 12,811 | 22,287 | 3,094 |
| 3,252 | 18,170 | (993) |
Total Adjusted by Ownership |
| 10,181 | 20,937 | 3,094 |
| 2,158 | 15,270 | (993) |
1 Non - consolidated amounts.2 Corresponding to former Petrobras Argentina until November 1, 2016.3 The deletions in net debt correspond to inter-companies and debt repurchases.4 CTLL is in process of merging EASA by absorption as from January 1, 2017; see section 1.6.1 of this Earnings Release. 5 Net debt includes holding companies and does not consider financing from CAMMESA in the power generation segment.6 Attributable to the Owners of the Company. CTLL, EASA and Pampa Energía (stand-alone) do not include results from its subsidiaries.
Pampa Energía● Q3 17 Earning Release●26
|
3.8 Analysis of the Quarter, by Subsidiary (AR$ Million)8
| 3rd Quarter 2017 |
| 3rd Quarter 2016 |
| |||||
Subsidiary | % Pampa | Adjusted EBITDA | Net Debt3 | Net Income4 | % Pampa | Adjusted EBITDA | Net Debt3 | Net Income4 | |
|
|
|
|
|
|
|
|
| |
Power Generation Segment |
|
|
|
|
|
|
|
| |
Diamante | 56.0% | 16 | (161) | 19 | 56.0% | 5 | (22) | 9 | |
Los Nihuiles | 47.0% | 23 | (156) | 49 | 47.0% | 9 | (76) | 32 | |
CPB | 100.0% | 78 | 651 | (10) | 100.0% | 58 | 371 | (10) | |
CTG | 90.4% | 145 | (406) | 108 | 90.4% | 59 | 22 | 31 | |
CTLL1 | 100.0% | 722 | 2,528 | 354 | 100.0% | 278 | 1,846 | 81 | |
Pampa Energía2 | 100.0% | 520 | - | 519 | 0.0% | 91 | (9) | 90 | |
Other companies, adjustments & deletions3 | 100.0% | (11) | (822) | (36) | 100.0% | (4) | (445) | (9) | |
Subtotal Power Generation |
| 1,493 | 1,633 | 1,004 |
| 495 | 1,686 | 225 | |
|
|
|
|
|
|
|
|
| |
Electricity Distribution Segment |
|
|
|
|
|
|
|
| |
Edenor1 | 51.4% | 870 | 1,289 | 291 | 51.5% | (536) | 696 | (657) | |
EASA1,4 | 0.0% | - | - | - | 100.0% | 8 | 2,027 | (78) | |
Adjustments & deletions3 | 50% | (0) | - | (132) | 50% | (9) | (1,816) | 315 | |
Subtotal Electricity Distribution |
| 869 | 1,289 | 159 |
| (537) | 906 | (419) | |
|
|
|
|
|
|
|
|
| |
Oil & Gas Segment |
|
|
|
|
|
|
|
| |
Petrolera Pampa | 49.5% | 815 | 2,202 | 297 | 49.5% | 725 | 3,801 | 144 | |
PELSA | 58.9% | 325 | (741) | (6) | 0.0% | 223 | (522) | 29 | |
Pampa Energía (Stand-Alone)1,2 | 100.0% | 1,288 | (80) | 780 | 0.0% | 593 | 335 | 347 | |
|
|
|
|
|
|
|
|
| |
OldelVal | 23.1% | 143 | (101) | 72 |
| 52 | (89) | 23 | |
Non-controlling stake adjustment | (110) | 78 | (55) |
| (44) | 75 | (19) | ||
Subtotal OldelVal | 23.1% | 33 | (23) | 17 |
| 8 | (14) | 4 | |
|
|
|
|
|
|
|
|
| |
Adjustments & deletions3 | 100% | 28 | 1 | (171) | 100% | 292 | 1,299 | 213 | |
Subtotal Oil & Gas |
| 2,488 | 1,358 | 916 |
| 1,841 | 4,899 | 737 | |
|
|
|
|
|
|
|
|
| |
Refining & Distribution Segment |
|
|
|
|
|
|
|
| |
Pampa Energía2 | 100.0% | 197 | (331) | 153 | 0.0% | 268 | (58) | 215 | |
|
|
|
|
|
|
|
|
| |
Refinor | 28.5% | 64 | (249) | 26 |
| 46 | 652 | 8 | |
Non-controlling stake adjustment | (46) | 178 | (18) |
| (37) | (527) | (6) | ||
Subtotal Refinor |
| 18 | (71) | 7 |
| 9 | 125 | 1 | |
|
|
|
|
|
|
|
|
| |
Adjustments & deletions3 | 100% | (1) | - | (7) | 100% | (286) | (125) | (288) | |
Subtotal Refining & Distribution |
| 214 | (403) | 153 |
| (9) | (58) | (72) | |
|
|
|
|
|
|
|
|
| |
Petrochemicals Segment |
|
|
|
|
|
|
|
| |
Pampa Energía2 | 100.0% | 50 | - | (104) | 0.0% | 44 | - | 29 | |
Adjustments & deletions3 | 100% | 1 | - | (0) | 100% | (1) | - | (0) | |
Subtotal Petrochemicals |
| 51 | - | (104) |
| 43 | - | 29 | |
|
|
|
|
|
|
|
|
| |
Holding & Others Segment |
|
|
|
|
|
|
|
| |
Pampa Energía (Stand-Alone)1,2 | 100.0% | (465) | 21,039 | (1,252) | 100.0% | 195 | 13,642 | (210) | |
Former Petrobras Argentina - Corporate2 | - | - | - | 67.2% | (288) | 3,867 | (662) | ||
|
|
|
|
|
|
|
|
| |
Transener | 26.3% | 739 | (274) | 510 | 26.3% | 58 | 1,108 | (270) | |
Non-controlling stake adjustment | (544) | 202 | (376) |
| (43) | (817) | 199 | ||
Adjustments & deletions3 | 26% | - | - | - | 26% | - | (24) | - | |
Total Transmission |
| 195 | (72) | 134 |
| 15 | 268 | (71) | |
|
|
|
|
|
|
|
|
| |
TGS | 25.5% | 1,064 | 199 | 518 | 0.0% | 196 | 2,131 | 21 | |
Non-controlling stake adjustment | (793) | (148) | (386) |
| (163) | (1,766) | (17) | ||
Total Gas Midstream |
| 271 | 51 | 132 |
| 34 | 365 | 4 | |
|
|
|
|
|
|
|
|
| |
Other companies, adjustments & deletions3 | 100% | (2) | (2,724) | 166 | 100% | (347) | (6,774) | (513) | |
Subtotal Holding & Others |
| (1) | 18,294 | (820) |
| (391) | 11,368 | (1,453) | |
|
|
|
|
|
|
|
|
| |
Deletions | 100% | (24) | 116 | (24) | 100% | 22 | (633) | 21 | |
Total Consolidated |
| 5,090 | 22,287 | 1,284 |
| 1,464 | 18,170 | (932) | |
|
|
|
|
|
|
|
|
| |
Total Adjusted by Ownership |
| 4,091 | 20,937 | 1,284 |
| 983 | 15,270 | (932) | |
1 Non - consolidated amounts.2 Corresponding to former Petrobras Argentina until November 1, 2016.3 The deletions in net debt correspond to inter-companies and debt repurchases.4 CTLL is in process of merging EASA by absorption as from January 1, 2017; see section 1.6.1 of this Earnings Release. 5 Net debt includes holding companies and does not consider financing from CAMMESA in the power generation segment.6 Attributable to the Owners of the Company. CTLL, EASA and Pampa Energía (stand-alone) do not include results from its subsidiaries.
Pampa Energía● Q3 17 Earning Release●27
|
4. Information about the Conference Call
There will be a conference call to discuss Pampa and Edenor’s third quarter 2017 results on Monday November 13, 2017 at 10:00 a.m. New York Time / 12:00 p.m. Buenos Aires Time.
The hosts will be Leandro Montero, CFO of Edenor, and Lida Wang, Investor Relations Manager at Pampa. For those interested in participating, please dial 0-800-444-2930 in Argentina, +1 (844) 854-4411 in the United States or +1 (412) 317-5481 from any other country. Participants of the conference call should use the identification password Pampa Energía / Edenor and dial in five minutes before the scheduled time. Please download the Q3 17 Conference Call Presentation.
There will also be a live audio webcast and presentation of the conference atwww.pampaenergia.com/ir.
You may find additional information on the Company at:
üwww.pampaenergia.com/ir
ü www.cnv.gob.ar
ü www.sec.gov
Pampa Energía● Q3 17 Earning Release●28
SIGNATURE
Pursuant to the requirements of the Securities Exchange Act of 1934, the registrant has duly caused this report to be signed on its behalf by the undersigned, thereunto duly authorized.
Date: November 10, 2017
Pampa Energía S.A. | ||
| By: | /s/ Marcos Marcelo Mindlin | |
Name: Marcos Marcelo Mindlin Title: Chief Executive Officer | ||
FORWARD-LOOKING STATEMENTS
This press release may contain forward-looking statements. These statements are statements that are not historical facts, and are based on management's current view and estimates offuture economic circumstances, industry conditions, company performance and financial results. The words "anticipates", "believes", "estimates", "expects", "plans" and similar expressions, as they relate to the company, are intended to identify forward-looking statements. Statements regarding the declaration or payment of dividends, the implementation of principal operating and financing strategies and capital expenditure plans, the direction of future operations and the factors or trends affecting financial condition, liquidity or results of operations are examples of forward-looking statements. Such statements reflect the current views of management and are subject to a number of risks and uncertainties. There is no guarantee that the expected events, trends or results will a ctually occur. The statements are based on many assumptions and factors, including general economic and market conditions, industry conditions, and operating factors. Any changes in such assumptions or factors could cause actual results to differ materially from current expectations.