![]()

Pampa Energía S.A. (‘Pampa’ or the ‘Company’), the largest independent energy integrated company in Argentina, with active participation in the country’s electricity and gas value chain, announces the results for the nine-month period and quarter ended on September 30, 2018. |
Buenos Aires,November12, 2018
Stock Information | |||
 | Buenos Aires Stock | Main Results for the Nine-Month Period Ended on September 30, 2018 (‘9M18’)1In order to reflect the financial performance, as from 2018 and for the comparative periods, financial results, selling and administrative expenses, which used to be assigned to holding and others, will be redistributed among power generation, oil and gas and petrochemicals. Consolidated net revenues of AR$66,028 million2, 82% higher than the AR$36,216 million for the same period of 2017 (‘9M17’), explained by increases of 110% in power generation, 98% in electricity distribution, 51% in oil and gas, 38% in petrochemicals and 162% in holding and others, partially offset by 21% of higher eliminations due to intersegment sales. ðPower Generation of 11,520 GWhfrom 12 power plants ðElectricity sales of 16,520 GWhto 3 million end-users ðProduction of 45.6 thousand barrels per day of hydrocarbons ðSales of 267 thousand tons of petrochemical products Consolidated adjusted EBITDA3 for continuing operations of AR$23,961 million, compared to AR$10,689 million for 9M17, mainly due to increases of AR$5,046 million in power generation, AR$4,524 million in electricity distribution, AR$1,159 million in oil and gas, AR$100 million in refining and distribution, AR$2,488 million in holding and others and lower intersegment eliminations of AR$8 million, partially offset by higher losses of AR$53 million in petrochemicals. Consolidated loss attributable to the owners of the Company of AR$6,783 million, lower than the AR$3,094 million gain in 9M17, mainly explained by the AR$31,210 million loss accrued due to 121% of AR$ depreciation against US$ in 9M18, currency in which most of the Company’s financial liabilities are denominated, whereas the FS reports in AR$, without inflation adjustment. | |
 | New York Stock Exchange | ||
Share capital in diluted basis, net of repurchases: Market Capitalization: For further information, contact: Gustavo Mariani Ricardo Torres Mariano Batistella Lida Wang The Pampa Energía Building Tel: +54 (11) 4344-6000 investor@pampaenergia.com ri.pampaenergia.com/en | |||
1 The financial information presented in this document are based on financial statements (‘FS’) prepared according to the International Financial Reporting Standards (‘IFRS’), except application of IAS 29 (please refer to section 1.7 of this Earnings Release). Consequently, the FS discriminates the continuing operations from the assets agreed for sale, which are reported as discontinued operations.
2 Under the IFRS, Greenwind, OldelVal, Refinor, Transener and TGS are not consolidated in Pampa’s FS, being its equity income shown as ‘Results for participation in associates/joint businesses’.
3 Consolidated adjusted EBITDA represents the results before net financial results, income tax and minimum notional income tax, depreciations and amortizations, non-recurring and non-cash income and expense, equity income and other adjustments from the IFRS implementation, and includes affiliates’ EBITDA at ownership. For more information, see section 3 of this Earnings Release.
Pampa Energía ● Q3 18 Earning Release ●1 |
![]()
Main Results for the Third Quarter of 2018 (‘Q3 18’)4
Consolidated net revenues of AR$26,310 million, 96% higher than the AR$13,415 million for the third quarter 2017 (‘Q3 17’), explained by increases of 107% in power generation, 108% in electricity distribution, 80% in oil and gas, 52% in petrochemicals and 246% in holding and others, partially offset by 41% of higher eliminations due to intersegment sales.
ð Power Generation of 3,572 GWhfrom 12 power plants
ð Electricity sales of 5,626 GWhto 3 million end-users
ð Production of 45 thousand barrels per day of hydrocarbons
ð Sales of 85 thousand tons of petrochemical products
Consolidated adjusted EBITDA for continuing operations of AR$9,078 million, compared to AR$4,355 million for Q3 17, mainly due to increases of AR$2,101 million in power generation, AR$1,033 million in electricity distribution, AR$567 million in oil and gas, AR$94 million in refining and distribution, AR$1,056 million in holding and others, and lower intersegment eliminations of AR$47 million, partially offset by losses of AR$175 million in petrochemicals.
Consolidated loss attributable to the owners of the Company of AR$7,135 million, lower than the AR$1,284 million gain recorded in Q3 17, mainly explained by the accrual of AR$17,438 million loss due to 43% AR$ depreciation against US$ in Q3 18.
Information about the Conference Call
There will be a conference call to discuss Pampa’s Q3 18 results on Tuesday November 13, 2018 at 10:00 a.m. Eastern Standard Time / 12:00 p.m. Buenos Aires Time.
The host will be Lida Wang, Investor Relations Manager at Pampa. For those interested in participating, please dial 0-800-444-2930 in Argentina, +1 (844) 854-4411 in the United States or +1 (412) 317-5481 from any other country. Participants of the conference call should use the identification password ‘Pampa Energía’ and dial in five minutes before the scheduled time. Please download the Q3 18 Conference Call Presentation from our IR website. There will also be a live audio webcast and presentation of the conference athttp://bit.ly/PampaQ318Call.
You may find additional information on the Company at:
ü ri.pampaenergia.com/en
ü www.cnv.gob.ar
ü www.sec.gov
4 The financial information presented in this document for the quarters ended on September 30, 2018 and of 2017 are based on unaudited FS prepared according to the IFRS accounting standards in force in Argentina, except application of IAS 29 (please refer to section 1.7 of this Earnings Release) corresponding to the nine-month period of 2018 and 2017, and the six-month periods ended on June 30, 2018 and 2017, respectively.
Pampa Energía ● Q3 18 Earning Release ●2 |
![]()
Table of Contents
Main Results of the 9M18 | 1 | ||
Main Results of the Q3 18 | 2 | ||
Information about the Conference Call | 2 | ||
1. | Relevant Events | 4 | |
1.1 | Relevant Events from Oil & Gas Segment | 4 | |
1.2 | Relevant Events from Power Generation Segment | 5 | |
1.3 | Relevant Events from Transportadora de Gas del Sur S.A. (‘TGS’) | 6 | |
1.4 | Relevant Events from Empresa Distribuidora y Comercializadora Norte S.A. (‘Edenor’) | 7 | |
1.5 | Relevant Events from Power Transmission Segment | 7 | |
1.6 | Repurchase of Own Financial Securities | 8 | |
1.7 | IFRS: Restatement of Financial Information | 9 | |
2. | Financial Highlights | 10 | |
2.1 | Consolidated Balance Sheet | 10 | |
2.2 | Consolidated Income Statement | 11 | |
2.3 | Cash and Financial Borrowings | 12 | |
3. | Analysis of the Results of the Q3 18 | 14 | |
3.1 | Analysis of the Power Generation Segment | 15 | |
3.2 | Analysis of the Electricity Distribution Segment | 18 | |
3.3 | Analysis of the Oil and Gas Segment | 20 | |
3.4 | Analysis of the Refining and Distribution Segment | 23 | |
3.5 | Analysis of the Petrochemicals Segment | 25 | |
3.6 | Analysis of the Holding and Others Segment | 27 | |
3.7 | Analysis of the Nine-Month Period, by Subsidiary | 28 | |
3.8 | Analysis of the Quarter, by Subsidiary | 29 | |
Pampa Energía ● Q3 18 Earning Release ●3 |
![]()
1. Relevant Events
1.1 Relevant Events from Oil & Gas Segment
CAMMESA’s Gas Tender for Power Generation
On August 24, 2018, the Gas Electronic Market (‘MEGSA’) issued Circular Letter No. 254/2018, regulating the auction mechanism requested by the Argentine Wholesale Electricity Market Clearing Company (‘CAMMESA’) for the natural gas supply to thermal power plants for the September – December 2018 period. This auction took place on September 6, 2018, and price indications were received for a total gas volume of 5 billion cubic feet per day on a non-firm basis, at a weighted average Transportation System Entry Point (‘PIST’) price of US$3.8/MBTU. Pampa participated in the auction and is currently selling gas to CAMMESA on a non-firm basis at the committed prices under such bids, effective until December 2018.
Furthermore, seeking that the Wholesale Electricity Market (‘WEM’) should bear the costs of imported gas and, therefore, reflect them on the variable costs the electricity dispatch is based on, on October 4, 2018 the Secretariat of Energy Government (‘SGE’, former Ministry of Energy (‘MinEn’)) issued Resolution No. 25/2018 exempting CAMMESA from adopting the maximum reference prices established by MinEn Resolution No. 46/2018 in case the supplier is the Argentine Energy Integration (‘IEASA’, former ENARSA), with the application of the acquisition and commercialization cost, effective as from October 1, 2018.
New Tariff Schemes for Natural Gas End-Users in Distribution
Following the applicable public hearings held in September 2018, at the beginning of October 2018 the National Gas Regulatory Agency (‘ENARGAS’) issued Resolutions No. 280-289 and 292/2018 establishing, effective as from October 1, 2018, the new final natural gas tariffs for residential users, the P General Service with full service (‘SGP’) and compressed natural gas (‘CNG’), in which they consider a price for natural gas as a raw material for the following 6 months ranging between AR$2.42/m3 (equivalent to US$1.74/MBTU) and AR$5.53/m3 (equivalent to US$3.98/MBTU), including the reduced tariff5. These gas prices differ among distribution utility companies and geographical location.
Consequently, gas prices stipulated as from October 2018 under the agreements executed in November 2017 between the distribution utility companies and Pampa were rendered ineffective and, therefore, prices are agreed in a spot daily basis.
Furthermore, on account of the large Argentine Peso devaluation and the impossibility for distribution companies to pass this new exchange rate through to end-users’ tariff schedules, many gas producers, including Pampa, accrued receivables for the FX difference between the gas price stipulated in the agreements entered into in November 2017 and that recognized in the final tariffs of gas distribution companies during the April 1-September 30, 2018 period.
In order to remediate this situation, on October 4, 2018 SGE Resolution No. 20/2018 was issued establishing a new mechanism for the recovery of this receivable in 24 installments collectable as from January 1, 2019. However, on October 12, 2018, SGE Resolution No. 41/2018 abrogated the previously mentioned resolution; therefore, the affected companies are still waiting for the formalization of the announced solution.
5 Resolutions with the new tariff schedules assume FX of AR$37.69/US$, corresponding to the Banco de la Nación Argentina’s closing rate on October 3, 2018.
Pampa Energía ● Q3 18 Earning Release ●4 |
![]()
Gas Export Regulation
On August 21 and September 15, 2018, MinEn Resolution No. 104/2018 and SGE Resolution No. 9/2018, respectively, were issued establishing a Procedure for the Authorization of Natural Gas Exports. Authorizations may consist of short-term (up to 1 year) or long-term (1 to 10 years) exports on a non-firm basis, or firm basis for the summer period (October - April for a term of up to 5 years), or operational exchanges in emergency situations, in all cases conditional upon the security of supply to the Argentine domestic market.
Furthermore, in the case of projects belonging to the Encouragement Program for the Investment in Development of Natural Gas Production from Unconventional Reservoirs Program approved by Resolutions No. 46, 419, 447 /2017 and 12/2018 (‘Unconventional Plan Gas’) issued by the former Ministry of Energy and Mining (‘MEyM’), exported natural gas may not be counted as part of and/or within the production applicable to the Unconventional Plan Gas.
Pampa has submitted the relevant documentation for the granting of these authorizations, and is currently awaiting their approval.
Sale of Equity Ownership at Oleoductos del Valle S.A. (‘OldelVal’)
In line with the Company’s strategy to focus its resources on core businesses, on November 2, 2018 Pampaexecuted an agreement with ExxonMobil Exploration Argentina S.R.L. (‘ExxonMobil’) for the sale of 21% of the capital stock of Oldelval, a company engaged in the crude oil transportation through a main pipeline from Neuquén to Puerto Rosales, Province of Buenos Aires. It is worth highlighting that Pampa still holds a 2.1% equity ownership in Oldelval.
The sale price amounts to US$36.4 million, being the closing of the transaction subject to certain customary precedent conditions. Moreover, even though the Company is currently performing the relevant analysis under the applicable accounting standards, the net reporting result of the operation is estimated to amount to approximately AR$700 million.
1.2 Relevant Events from Power Generation Segment
Fuel Self-Procurement by Thermal Power Plants
SGE Resolution No. 70/2018, published in the Public Gazette (‘BO’) on November 6, 2018, authorizes power generators, co-generators and self-generators within the WEM to acquire fuels, without distinction, needed for their own power generation. This resolution replaces Section 8 of Resolution No. 95/2013 of the former Secretariat of Energy (‘SE’), which provided that fuel procurement for power generation would be centralized by CAMMESA (with exception of the power generation under Energía Plus regime).
The generation cost with self-procured fuel will be valued according to the Variable Production Costs (‘CVP’) recognition mechanism followed by CAMMESA. However, this resolution does not provide further details.
Moreover, the self-procurement capacity will not affect commitments undertaken by power generators under WEM supply agreements (‘PPA’) executed with CAMMESA, and CAMMESA will remain in charge of the commercial management and fuel dispatch for power generators which ‘do not or cannot’ make use of such capacity.
The Company is currently analyzing the impact of this resolution and awaiting additional regulations by the SGE and/or CAMMESA.
Pampa Energía ● Q3 18 Earning Release ●5 |
![]()
1.3 Relevant Events from TGS
Semiannual Remuneration Update
Under the framework of the public hearing held on September 4, 2018, in which TGS requested, based on the variation in the Wholesale Domestic Price Index (‘IPIM’) recorded for the February - August 2018 period, an approximate 30% tariff increase, on September 27, 2018 ENARGAS issued Resolution No. 265/2018 granting a 19.7% increase in tariff schedules applicable for the natural gas transportation utility service provided by TGS, effective as from October 1, 2018, and represents an approximate 3% increase for end-users.
This increase was determined by ENARGAS based on the simple average of the IPIM, the Construction Cost Index for the February - August 2018 period, and the Salary Variation Index for the December 2017 - June 2018 period based on ENARGAS Resolution No. 4362/2017 concerning the Integral Tariff Review (‘RTI’), which stipulates, among other issues, that under certain macroeconomic conditions and circumstances, such as the significant devaluation that took place in April 2018 and considering that the semiannual update is a non-automatic adjustment mechanism, this entity may use other indexes different from the IPIM to determine tariff increases.
As of the issuance of this Earnings Release, TGS is evaluating the actions it will take to be compensated for the loss resulting from the lower tariff increase.
Long-Term Ethane Sales Agreement
On September 6, 2018, TGS entered into an ethane sales agreement with PBB Polisur (‘PBB’), a subsidiary of Dow Chemical and TGS’s sole customer for the commercialization of this product, which is produced at the General Cerri Complex located in the City of Bahía Blanca, Province of Buenos Aires.
This agreement is retroactively effective as from May 1, 2018 and will expire on December 27, 2027. The ethane price is determined by both parties and is subject to certain adjustment clauses resulting from variation in different factors, such as annual delivered volumes and the gas price. Additionally, this agreement includes take-or-pay (‘ToP’) and delivery-or-pay (‘DoP’) commitments for minimum annual quantities.
New Export Duty
Executive Orders No. 793 and 865/2018, passed by the National Executive Branch (‘PEN’) on September 3 and 27, 2018, respectively, regulated the application of a duty on the amounts exported for the consumption of several products, including natural gas, propane, butane and natural gasoline, effective from September 4, 2018 to December 31, 2020. This exports duty provides for a AR$4 withholding on each exported US Dollar, with a maximum 12% tax rate.
The export duty amount should be stated in Argentine Peso at the FX rate of the registration date corresponding to the request for export, and if applicable, it will be kept in Argentine Peso until the settlement of the obligation. Additionally, beneficiaries of the Simplified Exports Regime called ‘Exporta Simple’ are exempted from this duty.
Payment of Dividends
By virtue of the faculty delegated by TGS Shareholders’ Meeting held on April 10, 2018, on September 6, 2018 TGS’s Board of Directors announced the payment of cash dividends in the amount of AR$1,573 million. Therefore, as of today the total annual dividend paid amounts to AR$3,705 million. This dividend represents AR$2.0 per ordinary share or US$0.4 per outstanding American Depositary Receipt (‘ADR’). Dividends were made available to shareholders as from September 20, 2018.
Pampa Energía ● Q3 18 Earning Release ●6 |
![]()
1.4 Relevant Events from Edenor
WEM Summer Seasonal Programming
On October 26, 2018, Provision No. 97/2018 issued by the Under Secretariat of Electric Power (‘SEE’) was published in the BO, which establishes the same reference prices for power capacity, energy and transmission previously approved by SEE Provision No. 75/2018, effective as from November 1, 2018. Moreover, the criteria on subsidies to users under the social tariff category and discounts for savings under SEE Resolution No. 1091/2017 remained effective.
Memorandum of Understanding
On September 15, 2018, SEE Note No. 2018-45662399 extended the term by the end of November 2018 to regularize outstanding liabilities for the Transition Period. Moreover, on September 28, 2018, the SEE required Edenor to update the timely filed information.
Claim Filed Against Rivera Desarrollos S.A. (‘RDSA’)
With the purpose of concentrating Edenor’s centralized functions on a single facility and reducing rental costs and the risk of future increases in rent, in October 2015 Edenor acquired from RDSA a real estate asset to be built for a total amount of US$46 million, equivalent to AR$439 million, at the exchange rate effective on the agreement’s execution date. In order to guarantee payment of the applicable compensation in case of breach by RDSA, Edenor received a surety bond for up to US$46 million, adjusted by Badlar interest rate in US Dollar plus 2%.
In this respect, in view of the default to deliver the real estate, of which maturity date was due on June 1, 2018, Edenor proceeded to constitute RDSA in arrears, notifying the insurance company issuer of the surety bond and executing the applicable penalty collection. Later, and upon the expiration of the legal terms stipulated in the agreement, on August 27, 2018 Edenor notified RDSA of its resolution due to its breach, demanding the return of the purchase price plus interest at a rate of 15% in US Dollar, applicable as from the price payment date until the arrears’ date, minus the penalties for delay abovementioned.
As of September 30, 2018, the receivables’ value registered by Edenor amounts to AR$2,069 million, which does not exceed its estimated recoverable value. The net result generated by this transaction amounts to AR$1,629 million before taxes. As of the issuance of this Earnings Release, Edenor is promoting the applicable judicial and extrajudicial actions.
1.5 Relevant Events from Power Transmission Segment
Semiannual Remuneration Update
As of the issuance of this Earnings Release, the National Electricity Regulatory Agency (‘ENRE’) has still not issued the resolutions corresponding to the semiannual update for Transener’s remuneration, which, according to the RTI, should have been applicable as from the month of August 2018. Consequently, on October 17, 2018 Transener, through the Association of Electric Power Transmission Companies of the Republic of Argentina (‘ATEERA’), submitted a note before the ENRE claiming the said tariff update.
RTI for Independent Power Transmitters
As regards the proceeding to determine the remuneration to independent power transmission companies, on October 8, 2018 the information on costs, investments and tariff expectations for the Fourth Line (operated by our subsidiary Transener) and TIBA (operated by Transener’s subsidiary,Transba) were submitted before the ENRE. Moreover, on October 17, 2018 Enecor, the Company’s subsidiary, filed the request for the corresponding tariff review.
Pampa Energía ● Q3 18 Earning Release ●7 |
![]()
1.6 Repurchase of Own Financial Securities
Pampa Energía
As of August 15, 2018, Pampa had a total of 2,082,690,514 issued common shares with a par value of AR$1 each and each granting the right to one vote. However, in view of the gap between the value of the Company’s assets and its shares’ market price, and taking into consideration its strong cash position, Pampa started repurchasing shares under the Programs announced on April 27 and June 22, 2018 (the ‘Programs’).
The last transaction was made on October 23, 2018, date on which the legal limit of 10% of the issued capital treasury shares was reached. Consequently, a total number of 202,929,825 common shares or 8,117,193 ADRs were repurchased, with a total disbursement of US$328 million.
| Pampa | |
| Repurchase Program I | Repurchase Program II |
Maximum amount for repurchase | US$200 million | US$200 million |
Maximum price | AR$50/ordinary share or US$60/ADR | AR$62/ordinary share or US$55/ADR |
Period in force | 120 days since April 30, 2018 | 120 days since June 27, 2018 |
Repurchases to date | 4,119,451 ADRs @ US$48.52/ADR | 3,997,742 ADRs @ US$32.14/ADR |
Progress | 100% - Complete | 64% - Complete |
Note: Repurchases consider concerted transactions.
The following table shows Pampa’s shareholdings:
Holder | Number of Shares, | Number of ADRs, | % of Issued Capital | % of Capital Net Repurchases |
Management1 | 371.1 | 14.8 | 17.8% | 19.7% |
Free Float2 | 1,503.3 | 60.1 | 72.2% | 80.0% |
Share buyback program3 | 202.9 | 8.1 | 9.7% | - |
Employee stock-based compensation plan | 5.3 | 0.2 | 0.3% | 0.3% |
Total Issued Capital | 2,082.7 | 83.3 | 100.0% | 100.0% |
Total Outstanding Capital4 | 1,879.8 | 75.2 |
Note: All figures have been subject to rounding, so the total may not equal the sum. 1 Management’s direct and indirect holdings as of September 2018. 2 Listed in the New York and Buenos Aires Stock Exchanges. 3 Repurchases made under the Programs. Including 182.8 million common shares, of which cancellation was approved by the Shareholders’ Meeting. 4 Net of repurchases under the Programs.
Pampa’s Extraordinary General Meeting of Shareholders held on October 2, 2018 resolved to approve a capital stock reduction through the cancellation of 182,820,250 common treasury shares of Pampa, which represent 8.8% of issued capital. The withdrawal of the repurchased shares from the capital stock provides the Company with the possibility to continue repurchasing shares in the market, always if it is accretive for shareholders.
Finally, as of the quarter’s closing Pampa held in treasury Series 1 Corporate Bond (‘CB’) maturing bullet in 2027 for a face value of US$9 million, repurchased between August and September 2018 and at an average clean price of US$79.2 per face value of US$100.
Pampa Energía ● Q3 18 Earning Release ●8 |
![]()
TGS
On September 7, 2018, TGS’s Board of Directors updated the terms and conditions applicable to the repurchase program approved on May 9, 2018. As of the date hereof, TGS has repurchased 13,570,280 ordinary shares or 2,714,056 ADRs.
| TGS | |
| Repurchase Program I | Repurchase Program II |
Maximum amount for repurchase | AR$1.7 billion | Increased to AR$1.8 billion |
Maximum price | AR$95/ordinary share or US$20/ADR | Increased to AR$130/ordinary share or US$17/ADR |
Period in force | 120 days since May 10, 2018 | 180 days since September 7, 2018 |
Repurchases to date | 2,103,082 ADRs @ US$15.19/ADR | 610,974 ADRs @ US$13.63/ADR |
Progress | 65% - In process | |
Note: Repurchases consider concerted transactions.
Acquisition of Edenor and TGS’s Shares
As of September 30, 2018, the Company acquired a total of 329,166 Edenor’s ADRs at an average acquisition cost of US$26.8 per ADR, thus the Company’s equity interest amounting to 51.7% of Edenor’s issued capital stock. Furthermore, as of the issuance of this Earnings Release, Pampa additionally acquired 17,104 Edenor’s ADRs at an average acquisition cost of US$21.0 per ADR. Therefore, Pampa’s equity interest in Edenor amounts to 51.8%.
Moreover, as of September 30, 2018, the Company acquired a total of 77,500 TGS’s ADRs at an average acquisition cost of US$12.5 per ADR, therefore Pampa’s ownership amounts to 25.55% of TGS’s issued capital stock. No acquisitions have been recorded since the closing of the Q3 18.
1.7 IFRS: Restatement of Financial Information
IFRS standards require the FS of an entity with a functional currency that is hyperinflationary to be restated in terms of the measuring unit current at the end of the reporting period (IAS 29), whether they are based on a historical cost or current cost approach. Under IFRS, an economy is categorized as hyperinflationary if the cumulative inflation rate over three years approaches, or exceeds, 100%. For this reason, under IAS 29 the Argentine economy should be considered hyperinflationary as from July 1, 2018.
However, it should be taken into consideration that, as of the issuance of this Earnings Release, PEN Executive Order No. 664/2003, which prohibits the presentation of restated FS before the Argentine National Securities Commission (‘CNV’), is still in force. Therefore, pursuant to this Executive Order and the CNV rules, Pampa’s Management has not applied IAS 29 in the preparation of its FS. Notwithstanding, there is a law project that renders ineffective PEN Executive Decree No. 664/2003, and currently holds for preliminary approval of the Argentine National Congress’ House of Representatives.
As of the issuance of this Earnings Release, should IAS 29 were applied, and considering an accumulated inflation rate of 32.4% and an average inflation rate of 16% for 9M18, the Shareholders’ Equity estimated by the Company would amount to AR$38 billion.
Pampa Energía ● Q3 18 Earning Release ● 9 |
![]()
2. Financial Highlights
2.1 Consolidated Balance Sheet
In AR$ million | As of 9.30.18 | As of 12.31.17 |
ASSETS | ||
Participation in joint businesses and associates | 6,575 | 5,754 |
Property, plant and equipment | 51,074 | 41,214 |
Intangible assets | 1,560 | 1,586 |
Other assets | 29 | 2 |
Financial assets at fair value with changing results | 150 | 150 |
Deferred tax credits | 6,317 | 1,306 |
Trade receivable and other credits | 11,843 | 5,042 |
Total non-current assets | 77,548 | 55,054 |
Inventories | 4,551 | 2,326 |
Financial assets at fair value with changing results | 23,425 | 14,613 |
Investments at amortized cost | 395 | 25 |
Financial derivatives | 36 | 4 |
Trade receivable and other credits | 31,257 | 19,145 |
Cash and cash equivalents | 5,138 | 799 |
Total current assets | 64,802 | 36,912 |
Assets classified as held for sale | - | 12,501 |
Total assets | 142,350 | 104,467 |
EQUITY | ||
Share capital | 1,895 | 2,080 |
Share premium | 5,838 | 5,818 |
Repurchased shares | 188 | 3 |
Cost of repurchased shares | (8,446) | (72) |
Statutory reserve | 416 | 300 |
Voluntary reserve | 8,412 | 5,146 |
Other reserves | (505) | 140 |
Retained earnings | (6,959) | 3,243 |
Other comprehensive result | (89) | 252 |
Equity attributable to owners of the parent | 750 | 16,910 |
Non-controlling interests | 1,877 | 3,202 |
Total equity | 2,627 | 20,112 |
LIABILITIES | ||
Investments in joint ventures and associates | 880 | - |
Accounts payable and other liabilities | 7,488 | 6,404 |
Borrowings | 76,536 | 37,126 |
Deferred revenues | 209 | 195 |
Salaries and social security payable | 144 | 120 |
Defined benefit plan obligations | 1,087 | 992 |
Deferred tax liabilities | 504 | 1,526 |
Income tax and minimum expected profit tax liability | 979 | 863 |
Tax payable | 787 | 366 |
Provisions | 7,377 | 4,435 |
Total non-current liabilities | 95,991 | 52,027 |
Accounts payable and other liabilities | 25,220 | 18,052 |
Borrowings | 11,991 | 5,840 |
Deferred income | 4 | 3 |
Salaries and social security payable | 1,925 | 2,154 |
Defined benefit plan obligations | 101 | 121 |
Income tax and minimum expected profit tax liability | 1,716 | 943 |
Tax payable | 2,226 | 1,965 |
Financial derivatives | 71 | 82 |
Provisions | 478 | 798 |
Total current liabilities | 43,732 | 29,958 |
Liabilities associated to assets classified as held for sale | - | 2,370 |
Total liabilities | 139,723 | 84,355 |
Total liabilities and equity | 142,350 | 104,467 |
Pampa Energía ● Q3 18 Earning Release ●10 |
![]()
2.2 Consolidated Income Statement
| Nine-Month Period | Third Quarter | ||||||
In AR$ million | 2018 |
| 2017 | 2018 |
| 2017 | ||
Sales revenue | 66,028 | 36,216 | 26,310 | 13,415 | ||||
Cost of sales | (40,693) | (24,656) | (16,199) | (8,935) | ||||
Gross profit |
| 25,335 |
| 11,560 |
| 10,111 |
| 4,480 |
Selling expenses | (3,446) | (2,056) | (1,584) | (646) | ||||
Administrative expenses | (4,114) | (3,217) | (1,409) | (1,129) | ||||
Exploration expenses | (10) | (37) | (6) | (24) | ||||
Other operating income | 4,380 | 2,601 | 634 | 757 | ||||
Other operating expenses | (4,296) | (1,711) | (1,109) | (560) | ||||
Results for participation in joint businesses and associates | 525 | 865 | (107) | 297 | ||||
Operating income |
| 18,374 |
| 8,005 |
| 6,530 |
| 3,175 |
Financial income | 1,835 | 1,015 | 879 | 351 | ||||
Financial costs | (5,817) | (3,855) | (2,563) | (1,336) | ||||
Other financial results | (28,307) | (1,271) | (14,966) | (566) | ||||
Financial results, net | (32,289) | (4,111) | (16,650) | (1,551) | ||||
Profit before tax |
| (13,915) |
| 3,894 |
| (10,120) |
| 1,624 |
Income tax | 5,521 | (212) | 3,585 | (100) | ||||
Net income for continuing operations |
| (8,394) |
| 3,682 |
| (6,535) |
| 1,524 |
Net income from discontinued operations | 3,046 | 288 | (23) | 100 | ||||
Net income for the period |
| (5,348) |
| 3,970 |
| (6,558) |
| 1,624 |
Attributable to: | ||||||||
Owners of the Company | (6,783) | 3,094 | (7,135) | 1,284 | ||||
Continuing operations | (9,766) | 2,824 | (7,112) | 1,187 | ||||
Discontinued operations | 2,983 | 270 | (23) | 97 | ||||
Non-controlling interests | 1,435 | 876 | 577 | 340 | ||||
Net income per share attributable to the owners of the Company | (3.4120) | 1.5982 | (3.7660) | 0.6624 | ||||
Basic and diluted income per share of continuing operations | (4.9125) | 1.4587 | (3.7539) | 0.6124 | ||||
Basic and diluted income per share of discontinued operations | 1.5005 | 0.1395 | (0.0121) | 0.0500 | ||||
Pampa Energía ● Q3 18 Earning Release ●11 |
![]()
2.3 Cash and Financial Borrowings
As of September 30, 2018, in AR$ million | Cash(1) |
| Financial Debt | ||
Consolidated | Ownership Adjusted |
| Consolidated | Ownership Adjusted | |
Power generation(2) | 1,036 | 652 | 24,302 | 24,302 | |
Electricity distribution | 8,157 | 4,219 | 9,641 | 4,987 | |
Refining & distribution | 10 | 10 | - | - | |
Petrochemicals | - | - | - | - | |
Holding and others | 9,262 | 9,262 | - | - | |
Oil and gas | 10,492 | 10,487 | 50,465 | 50,464 | |
Total | 28,958 | 24,630 |
| 84,408 | 79,753 |
Note: (1) It includes cash and cash equivalents, financial assets at fair value with changing results and investments at amortized cost.
(2) It does not include regulatory liability held against CAMMESA for AR$4,119 million.
2.3.1 Summary of Listed Debt Securities
Company | Security | Maturity | Amount Issued | Amount Outstanding | Coupon |
In US$ |
|
|
|
|
|
Transener1 | ON Series 2 | 2021 | 101 | 99 | 9.75% |
Edenor | ON par at fixed rate | 2022 | 300 | 176 | 9.75% |
TGS1 | ON at discount at fixed rate | 2025 | 500 | 500 | 6.75% |
Pampa Energía | ON Series 4 US$-Link2,3 | 2020 | 34 | 34 | 6.25% |
ON Series T at discount & fixed rate | 2023 | 500 | 500 | 7.375% | |
ON Series I at discount & fixed rate | 2027 | 750 | 741 | 7.5% | |
In AR$ |
|
|
|
|
|
Pampa Energía | ON Series E3 | 2020 | 575 | 575 | Badlar Privada |
Note: (1) Affiliates are not consolidated in Pampa’s FS, according to the IFRS standards. (2) CB dollar-link, with initial FX rate of AR$8.4917/US$. (3) Debt securities issued by CTLL, a power generation subsidiary merged by absorption to Pampa Energía.
2.3.2 Debt Transactions
In line with the Company’s liabilities management policy, Pampa continued refinancing or redeeming the short term facilities. As of September 30, 2018, the 2018-19 Pampa’s stand-alone principal maturities amounted to US$285 million, US$11 million less than last quarter’s closing. During the month of August 2018, pre-export finance facilities and bank loans were executed for a total amount of US$67 million, maturing in February and August 2019. Moreover, in October 2018, pre-export finance facilities were renewed in bank loans for a total amount of US$48 million, maturing in April 2019.
Furthermore, on October 5, 2018 Pampa fully redeemed on the maturity date the principal and interest balance of Series A CB for AR$282 million and AR$26 million, respectively. In the same month Pampa executed a bank loan for US$10 million, maturing in April 2019.
Pampa Energía ● Q3 18 Earning Release ●12 |
![]()
Finally, as of the quarter’s closing Pampa held in treasury Series I CB maturing in 2027 for a face value of US$9 million, repurchased between August and September 2018 at an average clean price of US$79.2 per face value of US$100.
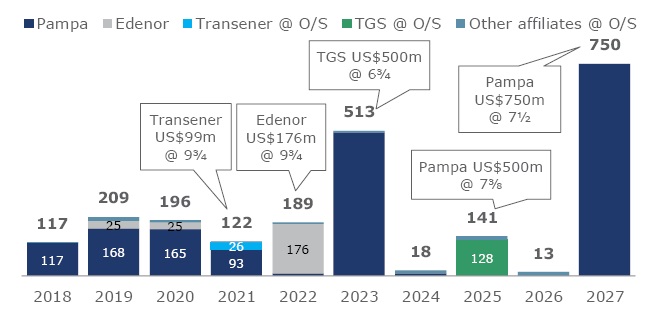
As of September 30, 2018, the average interest rates bearing US$ loans was 6.9%, currency in which 98% of gross debt is denominated. The average life of Pampa’s consolidated financial debt amounted to 5 years. The following chart shows the debt profile for the Pampa Corporate Group6 (in US$ million):
2.3.3 Pampa Corporate Group’s CBs Ratings
In August 2018 credit rating agency FitchRatings downgraded the global ratings of Pampa’s CBs from ‘B+’ to ‘B’, maintaining the stable outlook, mainly due to the Company’s exposure to CAMMESA.
Moreover, in September 2018 the credit rating agency Standard & Poor’s Global Ratings (‘S&P’) placed on CreditWatch negative the ‘B+’ and ‘B’ ratings on 10 argentine companies, including Pampa, TGS and Transener, mainly due to risks related to economic adjustments’ implementation. Moreover, S&P adjusted the global and local ratings of Edenor’s CBs, from positive to stable outlook, reaffirmed ‘B’ global ratings and downgraded local ratings from ‘raA+’ to ‘raA’.
The following table shows the Pampa Group’s CBs ratings:
Company | Agency | Ratings | |
Global | Local | ||
Pampa | S&P | B+ | na |
Moody's | B2 | na | |
FitchRatings | B | AA- | |
Edenor | S&P | B | raA |
Moody's | B1 | Aa3.ar | |
TGS | S&P | B+ | raAA |
Moody's | B1 | Aa2.ar | |
Transener | S&P | B+ | raAA |
6 It does not include interests, it considers Pampa stand-alone and Edenor at 100%, and the affiliates TGS, Transener, Greenwind, OldelVal and Refinor at our equity participation.
Pampa Energía ● Q3 18 Earning Release ●13 |
![]()
3. Analysis of the Results of the Q3 18
Consolidated net revenues of AR$26,310 million, 96% higher than the AR$13,415 million for the third quarter 2017 (‘Q3 17’), explained by increases of 107% in power generation, 108% in electricity distribution, 80% in oil and gas, 52% in petrochemicals and 246% in holding and others, partially offset by 41% of higher eliminations due to intersegment sales.
ð Power Generation of 3,572 GWhfrom 12 power plants
ð Electricity sales of 5,626 GWhto 3 million end-users
ð Production of 45 thousand barrels per day of hydrocarbons
ð Sales of 85 thousand tons of petrochemical products
Consolidated adjusted EBITDA for continuing operations of AR$9,078 million, compared to AR$4,355 million for Q3 17, mainly due to increases of AR$2,101 million in power generation, AR$1,033 million in electricity distribution, AR$567 million in oil and gas, AR$94 million in refining and distribution, AR$1,056 million in holding and others, and lower intersegment eliminations of AR$47 million, partially offset by losses of AR$175 million in petrochemicals.
Consolidated loss attributable to the owners of the Company of AR$7,135 million, lower than the AR$1,284 million gain recorded in Q3 17, mainly explained by the accrual of AR$17,438 million loss due to 43% AR$ depreciation against US$.
Consolidated Adjusted EBITDA Calculation,in AR$ million | 9M18 | 9M17 | Q3 18 | Q3 17 | ||||
Consolidated operating income | 18,374 | 8,005 | 6,530 | 3,175 | ||||
Consolidated depreciations and amortizations | 2,670 | 2,554 | 886 | 927 | ||||
Consolidated EBITDA under IFRS standards |
| 21,044 |
| 10,559 |
| 7,416 |
| 4,102 |
Adjustments from generation segment | 1,094 | (175) | 632 | 1 | ||||
Deletion of equity income from Greenwind | 1,005 | 4 | 530 | 2 | ||||
Greenwind's EBITDA adjusted by ownership | 132 | (2) | 108 | (1) | ||||
Other adjustments | (43) | (176) | (7) | - | ||||
Adjustments from distribution segment | 436 | (420) | 163 | (0) | ||||
Retroactive adjustments to penalties | 277 | (499) | 105 | (26) | ||||
Late payment interests | 159 | 79 | 58 | 26 | ||||
Adjustments from oil and gas segment | (879) | 70 | (160) | 38 | ||||
Deletion of equity income from OldelVal and other affiliates | (127) | (28) | (70) | (17) | ||||
OldelVal's EBITDA adjusted by ownership | 166 | 71 | 84 | 33 | ||||
Deletion of net gain from settlement agreement for subsidiary in Ecuador | (806) | - | - | - | ||||
Adjustment of royalties acrrued from Plan Gas 2017 | (178) | - | (178) | - | ||||
Other adjustments | 65 | 27 | 4 | 22 | ||||
Adjustments from refining and distribution segment | 133 | 19 | 102 | 1 | ||||
Deletion of equity income from Refinor | 81 | (17) | 74 | (17) | ||||
Refinor's EBITDA adjusted by ownership | 52 | 36 | 28 | 18 | ||||
Adjustments from petrochemicals segment | (13) | 12 | 4 | 12 | ||||
Contingencies and deletion of gained penalties | (13) | 12 | 4 | 12 | ||||
Adjustments from holding and others segment | 2,146 | 623 | 921 | 201 | ||||
Deletion of equity income from Transener and TGS | (1,484) | (824) | (427) | (265) | ||||
TGS's EBITDA adjusted by ownership | 2,675 | 891 | 1,017 | 271 | ||||
Transener's EBITDA adjusted by ownership | 955 | 670 | 331 | 195 | ||||
Other adjustments | - | (114) | - | - | ||||
Consolidated adjusted EBITDA for continuing operations |
| 23,961 |
| 10,689 |
| 9,078 |
| 4,355 |
Consolidated adjusted EBITDA for continuing and discontinued operations |
| 25,211 |
| 12,760 |
| 8,851 |
| 5,135 |
Pampa Energía ● Q3 18 Earning Release ●14 |
![]()
3.1 Analysis of the Power Generation Segment
Power Generation Segment, Consolidated | Nine-Month Period | Third Quarter | ||||
2018 | 2017 | ∆ % | 2018 | 2017 | ∆ % | |
Sales revenue | 12,166 | 5,782 | +110% | 4,992 | 2,415 | +107% |
Cost of sales | (4,192) | (2,739) | +53% | (1,552) | (998) | +56% |
Gross profit | 7,974 | 3,043 | +162% | 3,440 | 1,417 | +143% |
Selling expenses | (34) | (63) | -46% | (3) | (27) | -89% |
Administrative expenses | (706) | (522) | +35% | (260) | (172) | +51% |
Other operating income | 110 | 374 | -71% | 43 | 37 | +16% |
Other operating expenses | (112) | (191) | -41% | (49) | (39) | +26% |
Results for participation in joint businesses | (1,005) | (4) | NA | (530) | (2) | NA |
Operating income | 6,227 | 2,637 | +136% | 2,641 | 1,214 | +118% |
Finance income | 1,005 | 625 | +61% | 480 | 218 | +120% |
Finance costs | (1,724) | (1,171) | +47% | (773) | (425) | +82% |
Other financial results | (11,887) | (419) | NA | (7,106) | (150) | NA |
Profit before tax | (6,379) | 1,672 | NA | (4,758) | 857 | NA |
Income tax | 1,527 | 39 | NA | 1,243 | (266) | NA |
Net income for the period | (4,852) | 1,711 | NA | (3,515) | 591 | NA |
Attributable to: | ||||||
Owners of the Company | (5,195) | 1,589 | NA | (3,681) | 546 | NA |
Non-controlling interests | 343 | 122 | +181% | 166 | 45 | +269% |
Adjusted EBITDA | 8,074 | 3,028 | +167% | 3,509 | 1,408 | +149% |
Increases in prop., plant, equipment and intangible assets | 4,522 | 4,728 | -4% | 1,696 | 1,108 | +53% |
Depreciation and amortization | 753 | 566 | +33% | 236 | 193 | +22% |
In Q3 18, the gross margin at power generation recorded AR$3,440 million, 143% higher than the same period in 2017, mainly due to the 85% devaluation in the average nominal exchange rate, with impact on our US$-nominated sales, not only our new energy’s PPAs (Energía Plus, ex SE Res. No. 220/2007, ex MEyM Res. No. 21/2017 and RenovAr 1) but also our legacy energy’s remuneration pursuant to SEE Res. No. 19/2017. Moreover, the increase in gross margin is explained by the new units in force, GT05 at Loma de la Lata thermal power plant (‘CTLL’), Parque Pilar thermal power plant (‘CTPP’) and Ingeniero White thermal power plant (‘CTIW’), commissioned between July and December 2017, and Mario Cebreiro wind farm (‘PEMC’) online in June 2018, as well as the update in the legacy energy remuneration scheme, by which the remuneration is US$-nominated discriminated by technology and generation scale. Between May and October 2017 with the availability commitment statement (‘DIGO’), it was accrued the base remuneration followed by an increase to the full remuneration scheme as from November 2017. During the entire Q3 18 the legacy capacity was billed under the full remuneration, where thermal units’ real availability were tested each month against its DIGO, while in the Q3 17 was under the base remuneration.
In operating terms, Pampa’s power generation during Q3 18 slightly decreased by 4% compared to Q3 17, mainly because one of the combined cycle’s gas turbine and the Plus unit were out of service at Genelba thermal power plant (‘CTGEBA’), that took place in mid-August 2018 but recovered 100% of the power generation capacity by the end of September 2018 (-296 GWh). Moreover, in Q3 18 lower dispatch was required at Piedra Buena thermal power plant (‘CPB’) and units ST11 and ST12 at Güemes thermal power plant (‘CTG’) (-271 GWh), in addition to lower water input and flow at Diamante hydro power plant (‘HIDISA’) and Los Nihuiles hydro power plant (‘HINISA’) (-10 GWh). These negative variations were partially offset by power generation of the new power plants CTPP, CTIW and PEMC (+182 GWh), the gasturbine GT05 and capacity increase of the steam turbine ST01 at CTLL (+134 GWh), as well as higher water input at Pichi Picún Leufú hydro power plant (‘HPPL’) (+116 GWh).
Pampa Energía ● Q3 18 Earning Release ●15 |
![]()
Summary of | Hydroelectric | Wind | Thermal | Total | |||||||||
HINISA | HIDISA | HPPL | PEMC | CTLL | CTG | CTP | CPB | CTPP | CTIW | CTGEBA | Eco- | ||
Installed Capacity (MW) | 265 | 388 | 285 | 100 | 765 | 361 | 30 | 620 | 100 | 100 | 843 | 14 | 3,871 |
New Capacity (MW) | - | - | - | 100 | 364 | 100 | 30 | - | 100 | 100 | 169 | 14 | 977 |
Market Share | 0.7% | 1.0% | 0.7% | 0.3% | 2.0% | 0.9% | 0.1% | 1.6% | 0.3% | 0.3% | 2.2% | 0.04% | 10.1% |
9-Month Period |
|
|
|
|
|
|
|
|
|
|
|
|
|
Net Generation 9M18 (GWh) | 395 | 262 | 700 | 147 | 3,849 | 1,431 | 120 | 593 | 169 | 202 | 3,569 | 83 | 11,520 |
Market Share | 0.4% | 0.2% | 0.7% | 0.1% | 3.7% | 1.4% | 0.1% | 0.6% | 0.2% | 0.2% | 3.4% | 0.1% | 10.9% |
Sales 9M18 (GWh) | 395 | 262 | 700 | 147 | 3,849 | 1,880 | 120 | 593 | 169 | 202 | 4,054 | 85 | 12,456 |
Net Generation 9M17 (GWh) | 476 | 332 | 444 | - | 3,247 | 1,410 | 124 | 1,302 | 63 | - | 4,024 | 73 | 11,494 |
Variation 9M18 vs. 9M17 | -17% | -21% | +58% | na | +19% | +1% | -3% | -55% | +167% | na | -11% | +14% | +0% |
Sales 9M17 (GWh) | 476 | 332 | 444 | - | 3,247 | 1,848 | 124 | 1,302 | 63 | - | 4,578 | 75 | 12,488 |
Avg. Price 9M18 (US$/MWh) | 35 | 52 | 21 | 84 | 37 | 35 | 52 | 75 | 168 | 103 | 31 | 65 | 40 |
Avg. Price 9M17 (US$/MWh) | 25 | 34 | 25 | na | 33 | 30 | 49 | 26 | 58 | na | 24 | 68 | 29 |
Avg. Gross Margin 9M18 (US$/MWh) | 24 | 36 | 15 | 75 | 35 | 20 | na | 44 | 146 | 83 | 18 | 20 | 29 |
Avg. Gross Margin 9M18 (US$/MWh) | 12 | 16 | 14 | na | 30 | 14 | na | 10 | 49 | na | 14 | 20 | 18 |
Third Quarter |
|
|
|
|
|
|
|
|
|
|
|
|
|
Net Generation Q3 18 (GWh) | 82 | 65 | 315 | 101 | 1,268 | 390 | 29 | 91 | 70 | 74 | 1,056 | 29 | 3,572 |
Market Share | 0.2% | 0.2% | 0.9% | 0.3% | 3.6% | 1.1% | 0.1% | 0.3% | 0.2% | 0.2% | 3.0% | 0.1% | 10.1% |
Sales Q3 18 (GWh) | 82 | 65 | 315 | 101 | 1,268 | 516 | 29 | 91 | 70 | 74 | 1,195 | 29 | 3,837 |
Net Generation Q3 17 (GWh) | 87 | 71 | 199 | - | 1,134 | 492 | 36 | 260 | 63 | - | 1,352 | 29 | 3,724 |
Variation Q3 18 vs. Q3 17 | -5% | -8% | +58% | na | +12% | -21% | -19% | -65% | +10% | na | -22% | -0% | -4% |
Sales Q3 17 (GWh) | 87 | 71 | 199 | - | 1,134 | 680 | 36 | 260 | 63 | - | 1,548 | 29 | 4,108 |
Avg. Price Q3 18 (US$/MWh) | 55 | 68 | 18 | 78 | 39 | 37 | 70 | 159 | 141 | 107 | 31 | 57 | 43 |
Avg. Price Q3 17 (US$/MWh) | 46 | 52 | 21 | na | 44 | 28 | 55 | 50 | 55 | na | 26 | 65 | 34 |
Avg. Gross Margin Q3 18 (US$/MWh) | 40 | 49 | 14 | 70 | 37 | 22 | na | 102 | 125 | 83 | 17 | 9 | 32 |
Avg. Gross Margin Q3 17 (US$/MWh) | 20 | 23 | na | na | 39 | 14 | na | 23 | 46 | na | na | na | 23 |
|
|
|
|
|
|
|
|
|
|
|
|
|
|
Note: Gross margin before amortization and depreciation. FX rate of AR$/US$: 9M18 – 25.25; 9M17 – 16.26; Q3 18 – 32.04; Q3 17 – 17.29.
Net operating costs increased by 52% compared to Q3 17, mainly due to higher costs of gas and transportation to cover Plus contracts, labor costs, new machines’ operation and maintenance at CTLL, CTPP, CTIW and PEMC, and depreciations from these new units and programmed maintenance services, partially offset by lower expenses as a result of the merger of certain power plants into Pampa as from October 2017.
The losses on net financial results increased by AR$7,042 million in comparison to Q3 17, registering a AR$7,399 million loss in Q3 18, mainly due to higher loss from net FX differences, as a result of a higher devaluation of the AR$ against the US$, currency in which most of the financial liabilities allocated to the segment are denominated, and higher interest losses on loan agreements with CAMMESA and financial borrowings, partially offset by higher gains from commercial interests charged to CAMMESA due to late payment.
Adjusted EBITDA increased by 149% over Q3 17 to a profit of AR$3,509 million, mainly due to the AR$ devaluation on our sales denominated in US$, the new PPAs performing at CTLL, CTPP, CTIW and PEMC, and a better remuneration for legacy energy in US$, partially offset by higher gas consumption, labor and the operation and maintenance costs of the increasing number of units. Adjusted EBITDA considers the proportional EBITDA of PEMC (Greenwind), in which Pampa holds a direct participation of 50%, for a gain of AR$108 million in Q3 18, in comparison to a loss of AR$1 million in the same period in 2017.
Pampa Energía ● Q3 18 Earning Release ●16 |
![]()
The following table shows a summary of the committed expansion projects:
Project | MW | Equipment Provider | Marketing | Awarded Price |
| Estimated Capex in | Date of | |||
Capacity | Variable | Total |
| Budget | % Executed | |||||
Thermal |
|
|
|
|
|
|
|
|
|
|
Loma de la Lata | 15 | MAN | Res. SEE No. 19/17 | 7,000 | 7 | 17 | 19 | 93% | Q1 2019 | |
105 | GE | US$ PPA for 10 years | 23,000 | 7.5 | 39 |
| 90 | 100% | August 5, 2017 | |
Parque Ind. Pilar | 100 | Wärtsilä | US$ PPA for 10 years | 26,900 | 15 - 16 | 52 |
| 103 | 100% | August 29, 2017 |
Ing. White | 100 | Wärtsilä | US$ PPA for 10 years | 21,800 | 12 - 15 | 42 - 45 |
| 92 | 100% | December 22, 2017 |
Closing Genelba Plus | 383 | Siemens | US$ PPA for 15 years | 20,500 | 6 | 34 | 350 | 49% | GT: Q2 2019 / | |
Renewable |
|
|
|
|
|
|
|
|
|
|
Mario Cebreiro2 | 100 | Vestas | US$ PPA for 20 years | na | na | 58(3) |
| 139 | 93% | June 8, 2018 |
Pampa Energía II-III | 106 | Vestas | MAT ER | na | na | na |
| 135 | 61% | II y III: Q2 2019 |
Pampa Energía IV | 53 | na | MAT ER | na | na | na | 74 | 0% | IV: Q4 2019 | |
Total | 963 |
|
|
|
|
|
| 1,001 | 68% |
|
Note: (1) Amounts without VA. (2) Pampa holds 50% of stake. (3) Awarded price does not consider incentive and adjustment factors.
Pampa Energía ● Q3 18 Earning Release ●17 |
![]()
3.2 Analysis of the Electricity Distribution Segment
Electricity Distribution Segment, Consolidated | Nine-Month Period | Third Quarter | ||||
2018 | 2017 | ∆ % | 2018 | 2017 | ∆ % | |
Sales revenue | 34,727 | 17,576 | +98% | 13,461 | 6,457 | +108% |
Cost of sales | (24,644) | (12,720) | +94% | (9,992) | (4,638) | +115% |
Gross profit | 10,083 | 4,856 | +108% | 3,469 | 1,819 | +91% |
Selling expenses | (2,609) | (1,460) | +79% | (1,143) | (441) | +159% |
Administrative expenses | (1,403) | (1,009) | +39% | (515) | (379) | +36% |
Other operating income | 199 | 70 | +184% | 72 | 29 | +148% |
Other operating expenses | (871) | (612) | +42% | (326) | (299) | +9% |
Operating income | 5,399 | 1,845 | +193% | 1,557 | 729 | +114% |
Finance income | 358 | 182 | +97% | 149 | 64 | +133% |
Finance costs | (1,950) | (1,152) | +69% | (900) | (380) | +137% |
Other financial results | (717) | 71 | NA | 456 | (13) | NA |
Profit before tax | 3,090 | 946 | +227% | 1,262 | 400 | +216% |
Income tax | (960) | (256) | +275% | (400) | (100) | +300% |
Net income for the period | 2,130 | 690 | +209% | 862 | 300 | +187% |
Attributable to: | ||||||
Owners of the Company | 1,101 | 370 | +198% | 451 | 159 | +184% |
Non-controlling interests | 1,029 | 320 | +222% | 411 | 141 | +191% |
Adjusted EBITDA | 6,269 | 1,745 | +259% | 1,876 | 843 | +123% |
Increases in prop., plant, equipment and intangible assets | 4,392 | 2,873 | +53% | 2,145 | 1,137 | +89% |
Depreciation and amortization | 434 | 320 | +36% | 156 | 114 | +37% |
In Q3 18, net sales increased by AR$7,004 million compared to Q3 17, mainly due to the implementation of the accumulated 98% full tariff increase as from February 2018 on the Distribution Added Value (‘VAD’) calculated in the RTI, while in Q3 17 only the first stage’s 42% tariff increase was implemented over VAD; in addition to the Own Distribution Cost (‘CPD’,Costo Propio de Distribución) variation, of which the three implementations made in December 2017, February and August 2018 accounts for 35% cumulative, and the accrual as from February 2018 of monthly installments generated by the gradual application of 2017 tariff increase (AR$540 million in Q3 18). These positive variations were partially offset by the implementation of efficiency and investment factors (-2.5%) on VAD. Moreover, it is worth highlighting that 50% of the last CPD update, in force as from August 1, 2018, was deferred to February 2019 in six consecutive monthly installments. Should 100% of the CPD variation had been recorded, Edenor would have accrued an additional sale for AR$308 million.
Furthermore, in a lesser extent the Q3 18 sales increase was due to a 1% higher electricity volume sales compared to the same period in 2017, mainly explained by higher consumption in residential segment related to lower temperatures in the months of July and August of 2018 in comparison to 2017, partially offset by higher temperature in September 2018 in comparison to 2017 plus the impact of tariff increase. This higher consumption was partially offset by lower sales to large industries (wheeling system) and commercial segment, in line with the activity downturn. Additionally, Edenor’s customers increased by 3%, mainly due to residential clients’ regularization as a result of the market discipline actions carried out.
Pampa Energía ● Q3 18 Earning Release ●18 |
![]()
Edenor's Sales | 2018 | 2017 | Variation | |||||
In GWh | Part. % | Clients | In GWh | Part. % | Clients | % GWh | % Clients | |
9-Month Period |
|
|
|
|
|
|
|
|
Residential1 | 7,148 | 43% | 2,644,011 | 7,138 | 43% | 2,553,412 | +0% | +4% |
Commercial | 2,683 | 16% | 355,749 | 2,737 | 17% | 362,796 | -2% | -2% |
Industrial | 2,781 | 17% | 6,871 | 2,765 | 17% | 6,859 | +1% | +0% |
Wheeling System | 2,904 | 18% | 705 | 2,958 | 18% | 708 | -2% | -0% |
Others | ||||||||
Public Lighting | 565 | 3% | 21 | 551 | 3% | 21 | +3% | - |
Shantytowns and Others | 438 | 3% | 450 | 371 | 2% | 419 | +18% | +7% |
|
|
|
|
|
|
|
|
|
Total | 16,520 | 100% | 3,007,807 | 16,520 | 100% | 2,924,215 | +0% | +3% |
Third Quarter |
|
|
|
|
|
|
|
|
Residential1 | 2,526 | 45% | 2,644,011 | 2,464 | 44% | 2,553,412 | +3% | +4% |
Commercial | 872 | 15% | 355,749 | 880 | 16% | 362,796 | -1% | -2% |
Industrial | 913 | 16% | 6,871 | 912 | 16% | 6,859 | +0% | +0% |
Wheeling System | 922 | 16% | 705 | 986 | 18% | 708 | -7% | -0% |
Others | ||||||||
Public Lighting | 200 | 4% | 21 | 197 | 4% | 21 | +1% | - |
Shantytowns and Others | 194 | 3% | 450 | 148 | 3% | 419 | +31% | +7% |
|
|
|
|
|
|
|
|
|
Total | 5,626 | 100% | 3,007,807 | 5,587 | 100% | 2,924,215 | +1% | +3% |
Note: (1) It includes 564,837 and 701,531 clients categorized under Social Tariff as of September 30, 2018 and 2017, respectively.
Energy purchases increased by 133% compared to Q3 17, due to the increase in electricity prices charged to end-users as subsidies are being gradually removed, as well as an increase in electricity losses in terms of rate and cost (losses rate of 20.4% of the demanded electricity in Q3 18 in comparison with 18.4% reached in Q3 17), mainly due to electricity theft with clandestine connections mostly observed in residential clients, as a consequence of lower temperature registered in July and August 2018 in comparison to 2017 and the tariff increase impact.
Net operating costs, excluding energy purchases, increased by 70% compared to Q3 17, mainly due to higher penalties and fines because the amounts accrued before the RTI are adjusted by inflation, while those fined as from the RTI are adjusted by interest rate, in addition to the penalties registered for the deviation from the Annual Investment Plan (‘SAPIA’) pursuant to ENRE Resolution No. 170/18. Moreover, higher charges from contractors were accrued, primarily related to operating tasks aiming to reduce electricity losses and increase the maintenance and reliability; higher provision of bad debts, resulting from higher billing due to new tariff schemes and changes in the contingencies’ calculation method as per the IFRS; and higher salary costs from labor negotiations.
During Q3 18 losses in net financial results decreased by AR$34 million amounting to a loss of AR$295 million, mainly due to the gain recorded from the receivable update with RDSA for AR$1,629 million7 and the gain from the FX difference on holding of financial instruments in US$, partially offset by a higher FX loss as a result of a larger devaluation of the AR$ against the US$, currency in which Edenor’s financial liabilities are denominated, in addition to losses from commercial interests due to higher payables stock held against CAMMESA for electricity purchases.
Adjusted EBITDA in Q3 18 for our electricity distribution segment posted a gain of AR$1,876 million, which includes the 2017 deferred income due to gradual tariff increase pursuant to RTI and late payment penalties for AR$58 million, and excludes SAPIA penalties as it belongs to fiscal year 2017. In Q3 17 the adjusted EBITDA was restated and amounted to AR$843 million, which includes SAPIA penalties for AR$26 million and penalty income for late payment of AR$26 million.
7 For further information, see section 1.4 of this Earnings Release.
Pampa Energía ● Q3 18 Earning Release ●19 |
![]()
3.3 Analysis of the Oil and Gas Segment8
Oil & Gas Segment, Consolidated | Nine-Month Period | Third Quarter | ||||
2018 | 2017 | ∆ % | 2018 | 2017 | ∆ % | |
Sales revenue | 11,552 | 7,675 | +51% | 4,890 | 2,715 | +80% |
Cost of sales | (5,862) | (4,723) | +24% | (2,302) | (1,663) | +38% |
Gross profit | 5,690 | 2,952 | +93% | 2,588 | 1,052 | +146% |
Selling expenses | (421) | (344) | +22% | (228) | (109) | +109% |
Administrative expenses | (1,049) | (964) | +9% | (293) | (331) | -11% |
Exploration expenses | (10) | (37) | -73% | (6) | (24) | -75% |
Other operating income | 3,692 | 1,860 | +98% | 263 | 674 | -61% |
Other operating expenses | (2,750) | (529) | NA | (415) | (194) | +114% |
Results for participation in associates | 127 | 28 | NA | 70 | 17 | NA |
Operating income | 5,279 | 2,966 | +78% | 1,979 | 1,085 | +82% |
Finance income | 171 | 109 | +57% | 94 | 23 | NA |
Finance costs | (1,693) | (1,287) | +32% | (696) | (362) | +92% |
Other financial results | (18,780) | (1,313) | NA | (10,710) | (644) | NA |
Profit before tax | (15,023) | 475 | NA | (9,333) | 102 | NA |
Income tax | 4,438 | (188) | NA | 2,696 | (59) | NA |
Net income for continuing operations | (10,585) | 287 | NA | (6,637) | 43 | NA |
Net income from discontinued operations | 2,148 | 305 | NA | (124) | 100 | NA |
Net income for the period | (8,437) | 592 | NA | (6,761) | 143 | NA |
Attributable to: | ||||||
Owners of the Company | (8,500) | 158 | NA | (6,761) | (11) | NA |
Non-controlling interests | 63 | 434 | -85% | - | 154 | -100% |
Adjusted EBITDA for continuing operations | 5,769 | 4,610 | +25% | 2,276 | 1,709 | +33% |
Adjusted EBITDA for cont. and discontinued operations | 6,408 | 6,549 | -2% | 2,126 | 2,401 | -11% |
Increases in prop., plant, equipment and intangible assets | 3,951 | 2,753 | +44% | 2,136 | 1,137 | +88% |
Depreciation and amortization | 1,369 | 1,574 | -13% | 457 | 586 | -22% |
In Q3 18 the gross margin for continuing operations from our oil and gas segment increased by AR$1,536 million compared to Q3 17, mainly due to the effect of the AR$ devaluation over oil and gas sale prices, which are denominated in US$ and expressed in AR$, in addition to a 34% higher oil price in US$ in comparison to Q3 17. These effects were partially offset by a lower accrual of gas price in US$ due to the expiration of the Companies with Natural Gas Reduced Injection Promotion Program - SE Resolution No. 60/2013 (‘Plan Gas 2’) and gas sales price reduction in US$, in addition to a lower level of oil production, due to the operation termination at Medanito La Pampa block during Q4 17, higher royalties due to FX variation and greater logistic and contractors’ costs.
In operating terms, the domestic production of oil and gas segment for continuing operations in Q3 18 registered 45.0 kboe/day, 5.0 boe/day lower than the 50.0 kboe/day reached in Q3 17. The production of gas slightly decreased in comparison to same period in 2017, reaching 238 mcf/day in Q3 18, mainly due to the natural decline and lower drilling rate at Rincón del Mangrullo block (-24 mcf/day), partially offset by production increase at El Mangrullo block (+10 mcf/day), of which evacuation is still conditioning the block’s processing capacity, and at Río Neuquén block (+5 mcf/day), a block in which capacityexpansion works were finished and commissioned during Q3 18. Moreover, oil production decreased from 8.3 kbbl/day in Q3 17 to 5.4 kbbl/day in Q3 18, mainly due to the service termination at Medanito La Pampa block (-3 kbbl/day), partially offset by a minor oil production increase at El Tordillo block (+0.1 kbbl/day).
8 The oil and gas segment only consolidates the continuing operations, because in January 2018 we agreed to divest certain assets that are mainly related to crude oil production, therefore because of reporting standards, this divestment is shown as discontinued operations as from the fourth quarter of 2017 not only the current but also the comparative period.
Pampa Energía ● Q3 18 Earning Release ● 20 |
![]()
As of September 30, 2018, we accounted 922 productive wells in Argentina for continuing operations, in comparison to 904 as of December 31, 2017.
Oil & Gas Production | Continuing Operations | Discontinued Operations | Total | |||||||||
Oil | Gas | Subtotal | Oil | Gas | LPG | Subtotal | ||||||
PEPASA | Pampa | Subtotal | PEPASA | Pampa | Subtotal | |||||||
9-Month Period |
|
|
|
|
|
|
|
|
|
|
|
|
Volume 9M18 |
|
|
|
|
|
|
|
|
|
|
|
|
In thousand m3/day | - | 0.8 | 0.8 | - | 6,908 | 6,908 | 2.0 | 1,112 | 0.1 | |||
In thousand boe/day | - | 4.9 | 4.9 | - | 40.7 | 40.7 | 45.6 | 12.7 | 6.5 | 0.6 | 19.8 | 65.4 |
In million cubic feet/day | - | 244 | 244 | 39 | ||||||||
Volume 9M17 |
|
|
|
|
|
|
|
|
|
|
|
|
In thousand m3/day | 0.6 | 0.7 | 1.3 | 2,955 | 4,103 | 7,058 | 2.3 | 1,000 | 0.1 | |||
In thousand boe/day | 3.5 | 4.6 | 8.1 | 17.4 | 24.2 | 41.5 | 49.7 | 14.2 | 5.9 | 0.7 | 20.8 | 70.4 |
In million cubic feet/day | 104 | 145 | 249 | 35 | ||||||||
Variation 9M18 v. 9M17 | na | +8% | -39% | na | +68% | -2% | -8% | -11% | +11% | -13% | -5% | -7% |
Avg. Price 9M18 |
|
|
|
|
|
|
|
|
|
|
|
|
In US$/bbl | na | 64.2 | 64.2 | 61.7 | ||||||||
In US$/MBTU | na | 5.1 | 5.1 | 4.4 | ||||||||
In US$/ton | 415.3 | |||||||||||
Avg. Price 9M17 |
|
|
|
|
|
|
|
|
|
|
|
|
In US$/bbl | 55.6 | 48.4 | 51.5 | 54.9 | ||||||||
In US$/MBTU | 7.4 | 5.5 | 6.3 | 5.2 | ||||||||
In US$/ton | 318.2 | |||||||||||
Variation 9M18 v. 9M17 | na | +33% | +25% | na | -7% | -19% | +12% | -16% | +31% | |||
Third Quarter |
|
|
|
|
|
|
|
|
|
|
|
|
Volume Q3 18 |
|
|
|
|
|
|
|
|
|
|
|
|
In thousand m3/day | - | 0.9 | 0.9 | - | 6,733 | 6,733 | ||||||
In thousand boe/day | - | 5.4 | 5.4 | - | 39.6 | 39.6 | 45.0 | 45.0 | ||||
In million cubic feet/day | - | 238 | 238 | |||||||||
Volume Q3 17 |
|
|
|
|
|
|
|
|
|
|
|
|
In thousand m3/day | 0.5 | 0.8 | 1.3 | 2,799 | 4,272 | 7,071 | 2.2 | 1,069 | 0.1 | |||
In thousand boe/day | 3.3 | 5.0 | 8.3 | 16.5 | 25.1 | 41.6 | 50.0 | 13.8 | 6.3 | 0.6 | 20.7 | 70.6 |
In million cubic feet/day | 99 | 151 | 250 | 38 | ||||||||
Variation Q3 18 v. Q3 17 | na | +7% | -36% | na | +58% | -5% | -10% | -36% | ||||
Avg. Price Q3 18 |
|
|
|
|
|
|
|
|
|
|
|
|
In US$/bbl | na | 66.4 | 66.4 | |||||||||
In US$/MBTU | na | 4.5 | 4.5 | |||||||||
Avg. Price Q3 17 |
|
|
|
|
|
|
|
|
|
|
|
|
In US$/bbl | 52.8 | 47.3 | 49.4 | 52.8 | ||||||||
In US$/MBTU | 7.4 | 5.6 | 6.3 | 5.3 | ||||||||
In US$/ton | 284.7 | |||||||||||
Variation Q3 18 v. Q3 17 | na | +40% | +34% | na | -19% | -28% | ||||||
|
|
|
|
|
|
|
|
|
|
|
|
|
Note: The production considers the 100% contribution of Medanito La Pampa, block in which services were provided until Q4 17, it does not consider foreign production of 0.3 kbbl/day in 9M18; 1.5 kbbl/day in 9M17; 0.1 kbbl/day in Q3 18 and 1.1 kbbl/day in Q3 17. During 9M18, discontinued operations considers only Q1 18 volumes. Due to merger as from October 1, 2017, the production of Pampa includes the production of Petrolera Pampa. FX rate of AR$/US$: 9M18 – 25.25; 9M17 – 16.26; Q3 18 – 32.04; Q3 17 – 17.29.
In Q3 18, our accrued gas average sale price was US$4.5/MBTU, 28% lower than the US$6.3/MBTU registered in Q3 17, mainly due to the expiration of Plan Gas 2 as from July 1, 2018, in addition to a 9% decline in end-users sale price in comparison to Q3 17, mainly explained by the reductionof reference price for gas fired at power plants and the gas tenders on a non-firm basis by CAMMESA9, which reflected demand seasonality and industrial consumption decline due to the economic recession. These effects were partially offset by higher price accrual from residential demand. In Q3 17, it was accrued AR$691 million for Plan Gas 2 (US$1.3/MBTU contribution to the accrued price).
Pampa Energía ● Q3 18 Earning Release ● 21 |
![]()
Net financial losses increased during Q3 18 by AR$10,329 million to a loss of AR$11,312 million, mainly due to higher accrual of FX losses as a result of AR$ devaluation against US$, currency in which most of financial liabilities allocated to the segment are denominated, partially offset by higher gains from the holding of financial instruments.
The adjusted EBITDA of our oil and gas segment for continuing operations increased by AR$565 million, posting AR$2,276 million in Q3 18, mainly due to the effect of devaluation in US$-denominated sales and improvements in oil sale price in US$, partially offset by lower gas prices in US$, Plan Gas 2 expiration and lower hydrocarbon production. The adjusted EBITDA considers the proportional of our 23.1% ownership at OldelVal, an oil pipeline company, for a gain of AR$84 million, in comparison to a gain of AR$33 million in Q3 17, and excludes the recovery of royalties accrued for Plan Gas 2 in fiscal year 2017 for AR$178 million.
The following table shows the results of our discontinued operations in oil and gas:
Oil & Gas Segment, Discontinued Operations | Nine-Month Period | Third Quarter | ||||
2018 | 2017 | ∆ % | 2018 | 2017 | ∆ % | |
Sales revenue | 1,743 | 4,284 | -59% | - | 1,460 | -100% |
Cost of sales | (866) | (3,391) | -74% | - | (1,153) | -100% |
Gross profit | 877 | 893 | -2% | - | 307 | -100% |
Selling expenses | (51) | (132) | -61% | - | (39) | -100% |
Administrative expenses | (33) | (92) | -64% | - | (27) | -100% |
Exploration expenses | (3) | (14) | -79% | - | (4) | -100% |
Other operating income | 43 | 190 | -77% | - | 65 | -100% |
Other operating expenses | (194) | (130) | +49% | (150) | (52) | +188% |
Result from the sale of shareholdings in companies and | 2,715 | - | NA | - | - | NA |
Operating income | 3,354 | 715 | NA | (150) | 250 | NA |
Finance income | 113 | 18 | NA | - | 7 | -100% |
Finance costs | (15) | - | NA | (15) | - | NA |
Other financial results | (99) | (127) | -22% | (11) | (53) | -79% |
Profit before tax | 3,353 | 606 | NA | (176) | 204 | NA |
Income tax | (1,205) | (301) | NA | 52 | (104) | NA |
Net income for the period | 2,148 | 305 | NA | (124) | 100 | NA |
Attributable to: | ||||||
Owners of the Company | 2,085 | 287 | NA | (124) | 97 | NA |
Non-controlling interests | 63 | 18 | +250% | - | 3 | -100% |
Adjusted EBITDA for discontinued operations | 639 | 1,939 | -67% | (150) | 692 | NA |
Depreciation and amortization | - | 1,224 | -100% | - | 442 | -100% |
9 For further information, see section 1.1 of this Earnings Release.
Pampa Energía ● Q3 18 Earning Release ● 22 |
![]()
3.4 Analysis of the Refining and Distribution Segment
Refining & Distribution Segment, Consolidated | Nine-Month Period | Third Quarter | ||||
2018 | 2017 | ∆ % | 2018 | 2017 | ∆ % | |
Selling expenses | (55) | - | NA | (55) | - | NA |
Other operating income | 137 | - | NA | 137 | - | NA |
Results for participation in associates | (81) | 17 | NA | (74) | 17 | NA |
Operating income | 1 | 17 | -94% | 8 | 17 | -53% |
Other financial results | 31 | - | NA | 31 | - | NA |
Profit before tax | 32 | 17 | +88% | 39 | 17 | +129% |
Income tax and minimum expected profit tax | (32) | - | NA | (32) | - | NA |
Net income for continuing operations | - | 17 | -100% | 7 | 17 | -59% |
Net income from discontinued operations | 914 | (54) | NA | 101 | 24 | NA |
Net income for the period | 914 | (37) | NA | 108 | 41 | +163% |
Adjusted EBITDA for continuing operations | 136 | 36 | +281% | 112 | 18 | NA |
Adjusted EBITDA for cont. and discontinued operations | 747 | 168 | NA | 35 | 106 | -67% |
Increases in prop., plant, equipment and intangible assets | 37 | 123 | -70% | 37 | 63 | -41% |
Depreciation and amortization | 2 | - | NA | 2 | - | NA |
The adjusted EBITDA of our refining and distribution segment for continuing operations10 posted a gain of AR$112 million in Q3 18, mainly due to the activities at Dock Sud dispatch facility and the proportional EBITDA of Refinor, a company in which Pampa holds a direct participation of 28.5%, for a gain of AR$28 million in Q3 18, in comparison to a gain of AR$18 million in the same period in 2017.
The amounts corresponding to Pampa’s discontinued operations are shown below:
Refining & Distribution | Products | |||||
Crude Oil | Diesel Oil | Gasolines | Fuel Oil, IFOs & Asphalts | Others | Total | |
9-Month Period |
|
|
|
|
|
|
Volume 9M18 (thousand m3) | 24 | 345 | 196 | 138 | 127 | 829 |
Volume 9M17 (thousand m3) | 13 | 609 | 337 | 232 | 210 | 1,400 |
Volume Variation 9M18 - 9M17 | +92% | -43% | -42% | -41% | -40% | -41% |
Average Price 9M18 (US$/m3) | 367 | 579 | 624 | 405 | 554 | 550 |
Average price 9M17 (US$/m3) | 310 | 569 | 664 | 385 | 430 | 538 |
Price Variation 9M18 - 9M17 | +18% | +2% | -6% | +5% | +29% | +2% |
Third Quarter |
|
|
|
|
|
|
Volume Q3 18 (thousand m3) | - | - | - | - | - | - |
Volume Q3 17 (thousand m3) | 4 | 196 | 110 | 79 | 58 | 447 |
Average Price Q3 18 (US$/m3) | - | - | - | - | - | - |
Average Price Q3 17 (US$/m3) | 304 | 557 | 648 | 371 | 457 | 531 |
|
|
|
|
|
|
|
Note: In 9M18, it considers only the volumes until June 30, 2018. FX rate of AR$/US$: 6M18 – 21.63; 9M17 – 16.26; Q3 17 – 17.29.
10 In December 2017 we agreed to divest assets related to refining and distribution segment, so for reporting purposes this segment is shown as discontinued operations for the current and comparative periods, only consolidating continuing operations, which are our stake at Refinor and Dock Sud’s dispatch facility.
Pampa Energía ● Q3 18 Earning Release ●23 |
![]()
The following table shows the results of our discontinued operations in refining and distribution:
Refining & Distribution Segment, Discontinued Operations | Nine-Month Period | Third Quarter | ||||
2018 | 2017 | ∆ % | 2018 | 2017 | ∆ % | |
Sales revenue | 9,872 | 12,254 | -19% | - | 4,104 | -100% |
Cost of sales | (8,211) | (10,540) | -22% | - | (3,482) | -100% |
Gross profit | 1,661 | 1,714 | -3% | - | 622 | -100% |
Selling expenses | (900) | (1,422) | -37% | - | (494) | -100% |
Administrative expenses | (117) | (302) | -61% | - | (90) | -100% |
Other operating income | 155 | 164 | -5% | - | 49 | -100% |
Other operating expenses | (277) | (207) | +34% | (98) | (63) | +56% |
Result from the sale of shareholdings in companies and | 149 | - | NA | - | - | NA |
Operating income | 671 | (53) | NA | (98) | 24 | NA |
Finance income | 19 | 14 | +36% | - | 7 | -100% |
Finance costs | (8) | (13) | -38% | - | (4) | -100% |
Other financial results | 618 | (11) | NA | 236 | 1 | NA |
Profit before tax | 1,300 | (63) | NA | 138 | 28 | NA |
Income tax | (386) | 9 | NA | (37) | (4) | NA |
Net income for the period | 914 | (54) | NA | 101 | 24 | NA |
Adjusted EBITDA for discontinued operations | 611 | 132 | NA | (77) | 88 | NA |
Depreciation and amortization | - | 185 | -100% | - | 64 | -100% |
Pampa Energía ● Q3 18 Earning Release ●24 |
![]()
3.5 Analysis of the Petrochemicals Segment
Petrochemicals Segment, Consolidated | Nine-Month Period | Third Quarter | ||||
2018 | 2017 | ∆ % | 2018 | 2017 | ∆ % | |
Sales revenue | 7,413 | 5,374 | +38% | 2,913 | 1,913 | +52% |
Cost of sales | (6,552) | (4,923) | +33% | (2,623) | (1,795) | +46% |
Gross profit | 861 | 451 | +91% | 290 | 118 | +146% |
Selling expenses | (326) | (208) | +57% | (154) | (78) | +97% |
Administrative expenses | (407) | (268) | +52% | (142) | (84) | +69% |
Other operating income | 141 | 35 | NA | 88 | 14 | NA |
Other operating expenses | (422) | (122) | +246% | (276) | 5 | NA |
Operating income | (153) | (112) | +37% | (194) | (25) | NA |
Finance income | 38 | 10 | +280% | 27 | 4 | NA |
Finance costs | (337) | (169) | +99% | (157) | (64) | +145% |
Other financial results | (1,706) | (103) | NA | (822) | (95) | NA |
Profit before tax | (2,158) | (374) | NA | (1,146) | (180) | NA |
Income tax | 618 | 75 | NA | 345 | 4 | NA |
Net income for the period | (1,540) | (299) | NA | (801) | (176) | NA |
Adjusted EBITDA | (60) | (7) | NA | (155) | 20 | NA |
Increases in prop., plant, equipment and intangible assets | 95 | 59 | +61% | 55 | 23 | +139% |
Depreciation and amortization | 106 | 93 | +14% | 35 | 33 | +6% |
The gross margin in this segment during Q3 18 posted AR$290 million, 146% higher than Q3 17, mainly driven by higher international pricing references, denominated in US$, partially offset by lower sales volume, higher labor costs and higher raw materials’ costs, also mostly denominated in US$, which were not able to be immediately passed through on the sale price.
The amounts corresponding to Pampa are shown below:
Petrochemicals | Products | |||
Styrene & Polystyrene1 | SBR | Others | Total | |
9-Month Period |
|
|
|
|
Volume 9M18 (thousand ton) | 91 | 22 | 154 | 267 |
Volume 9M17 (thousand ton) | 102 | 25 | 228 | 354 |
Volume Variation 9M18 - 9M17 | -10% | -12% | -33% | -25% |
Average Price 9M18 (US$/ton) | 1,511 | 1,858 | 752 | 1,101 |
Average Price 9M17 (US$/ton) | 1,470 | 2,134 | 562 | 933 |
Price Variation 9M18 - 9M17 | +3% | -13% | +34% | +18% |
Third Quarter |
|
|
|
|
Volume Q3 18 (thousand ton) | 26 | 5 | 53 | 85 |
Volume Q3 17 (thousand ton) | 33 | 8 | 83 | 124 |
Volume Variation Q3 18 - Q3 17 | -22% | -39% | -35% | -32% |
Average Price Q3 18 (US$/ton) | 1,506 | 2,133 | 760 | 1,074 |
Average Price Q3 17 (US$/ton) | 1,434 | 1,789 | 578 | 889 |
Price Variation Q3 18 - Q3 17 | +5% | +19% | +32% | +21% |
|
|
|
|
|
Note: FX rate of AR$/US$: 9M18 – 25.25; 9M17 – 16.26; Q3 18 – 32.04; Q3 17 – 17.29. (1) Includes Propylene, Ethylene and BOPs.
Pampa Energía ● Q3 18 Earning Release ● 25 |
![]()
In operating terms, total sales volume of our petrochemicals segment decreased by 32% in Q3 18, totaling 85 thousand tons compared to 124 thousand tons in the 2017 comparative period. This decrease mainly responds to lower availability and cost increase of imported virgin naphtha, impacting on lower sales of reforming products, in addition to a labor strike registered at the polystyrene plant in Zarate and a lower demand of styrene products, due to the increase in international prices.
The net financial results in Q3 18 decreased by AR$797 million to a loss of AR$952 million, mainly due to a higher accrual of losses from FX variation due tocontingencies’ update with San Lorenzo customs.
The adjusted EBITDA of our petrochemicals segment reported a loss of AR$155 million in Q3 18 in comparison to a gain of AR$20 million in the same period in 2017. The adjusted EBITDA excludes contingencies’ update with customs from former Petrobras Argentina for AR$4 million in Q3 18 and AR$12 million in Q3 17.
Pampa Energía ● Q3 18 Earning Release ●26 |
![]()
3.6 Analysis of the Holding and Others Segment
Holding & Others Segment, Consolidated | Nine-Month Period | Third Quarter | ||||
2018 | 2017 | ∆ % | 2018 | 2017 | ∆ % | |
Sales revenue | 740 | 282 | +162% | 294 | 85 | +246% |
Cost of sales | (2) | (3) | -33% | (2) | - | NA |
Gross profit | 738 | 279 | +165% | 292 | 85 | +244% |
Administrative expenses | (549) | (456) | +20% | (199) | (165) | +21% |
Other operating income | 101 | 262 | -61% | 31 | 3 | NA |
Other operating expenses | (160) | (257) | -38% | (58) | (33) | +76% |
Results for participation in joint businesses | 1,484 | 824 | +80% | 427 | 265 | +61% |
Operating income | 1,613 | 652 | +147% | 492 | 155 | +217% |
Finance income | 271 | 127 | +113% | 130 | 46 | +183% |
Finance costs | (121) | (114) | +6% | (38) | (109) | -65% |
Other financial results | 4,752 | 493 | NA | 3,185 | 336 | NA |
Profit before tax | 6,515 | 1,158 | NA | 3,769 | 428 | NA |
Income tax | (70) | 118 | NA | (267) | 321 | NA |
Net income for the period | 6,445 | 1,276 | NA | 3,502 | 749 | NA |
Adjusted EBITDA | 3,765 | 1,276 | +195% | 1,413 | 357 | +296% |
Increases in prop., plant, equipment and intangible assets | 138 | 50 | +176% | 16 | 18 | -11% |
Depreciation and amortization | 6 | 1 | NA | - | 1 | -100% |
The operating income without considering the results from our participation in joint businesses (Transener and TGS), recorded a gain of AR$65 million in comparison to the loss of AR$110 million in Q3 17, mainly explained by higher fees accrual and a lower charge of the executives’ compensation due to share price decrease, partially offset by higher labor and third party costs.
The gain on net financial results increased by AR$3,004 million, registering a AR$3,277 million gain in Q3 18, mainly because of higher FX gain from the holding of financial instruments in US$.
The adjusted EBITDA of our holding and others segment increased by AR$1,056 million in Q3 18, reaching AR$1,413 million. The adjusted EBITDA excludes equity income from our participation in Transener and TGS, and in turn, considers a consolidation of EBITDAs adjusted by equity ownership in these businesses.
In Q3 18 the EBITDA adjusted by our indirect ownership of 25.5% over TGS was AR$1,017 million (implicit total of AR$3,980 million), a significantly higher amount compared to the AR$271 million registered in Q3 17 (implicit total of AR$1,064 million), mainly because Q3 18 considers the full implementation of the RTI plus cost variation for gas transportation (three installments of 345% cumulative), while during Q3 17 only considers the first installment, equivalent to 64% on average since April 2017. Moreover, the margin improvement in the liquids business contributed to the EBITDA performance, which increased in comparison to Q3 17 due to the FX variation on sales as well as higher international pricing references in US$.
In Transener, the EBITDA adjusted by stake ownership of 26.3% was AR$331 million in Q3 18 (implicit total of AR$1,258 million), 70% higher than Q3 17, which was AR$195 million (implicit total of AR$739 million). This increase mainly responds to the appeal awarding of the RTI in October 2017,semiannual cost variation update in August 2017 and February 2018 over Transener and Transba remuneration (24%)11 and lower penalties (net of rewards).
11 For further information, see section 1.5 of this Earnings Release.
Pampa Energía ● Q3 18 Earning Release ●27 |
![]()
3.7 Analysis of the Nine-Month Period, by Subsidiary12
| Nine-Month Period 2018 | Nine-Month Period 2017 | ||||||
Subsidiary | % Pampa | Adjusted EBITDA | Net Debt4 | Net Income5 | % Pampa | Adjusted EBITDA | Net Debt4 | Net Income5 |
Power Generation Segment |
|
|
|
|
|
|
|
|
Diamante | 61.0% | 212 | (456) | 287 | 56.0% | 61 | (161) | 60 |
Los Nihuiles | 52.0% | 205 | (431) | - | 47.0% | 73 | (156) | 129 |
CPB | 100.0% | 600 | 5 | 233 | 100.0% | 148 | 651 | (58) |
CTG1 | 100.0% | - | - | - | 90.4% | 381 | (406) | 262 |
CTLL1 | 100.0% | - | - | - | 100.0% | 1,517 | 2,528 | 1,212 |
Pampa Energía2 | 100.0% | 6,914 | 24,302 | (5,316) | 100.0% | 865 | 6,313 | 69 |
Greenwind | 264 | 5,076 | (2,008) | (5) | 189 | (13) | ||
Non-controlling stake adjustment | (132) | (2,538) | 1,004 | 2 | (94) | 7 | ||
Subtotal Greenwind adjusted by ownership | 50.0% | 132 | 2,538 | (1,004) | 50.0% | (2) | 94 | (7) |
| �� | ||||||||
Other companies, adjustments & deletions3 |
| 11 | (155) | 605 |
| (14) | (822) | (79) |
Subtotal Power Generation |
| 8,074 | 25,804 | (5,195) |
| 3,028 | 8,040 | 1,589 |
Electricity Distribution Segment |
|
|
|
|
|
|
|
|
Edenor | 51.7% | 6,272 | 1,484 | 2,101 | 51.0% | 1,739 | 1,289 | 660 |
Adjustments & deletions3 |
| (3) | (0) | (1,000) |
| 6 | - | (290) |
Subtotal Electricity Distribution |
| 6,269 | 1,484 | 1,101 |
| 1,745 | 1,289 | 370 |
Oil & Gas Segment |
|
|
|
|
|
|
|
|
Petrolera Pampa1 | 100.0% | - | - | - | 49.5% | 2,359 | 2,202 | 866 |
Pampa Energía2 | 100.0% | 5,262 | 40,203 | (11,058) | 100.0% | 2,291 | 14,174 | (2,768) |
OldelVal | 719 | (206) | 562 | 307 | (101) | 135 | ||
Non-controlling stake adjustment | (553) | 159 | (432) | (236) | 78 | (104) | ||
Subtotal OldelVal adjusted by ownership | 23.1% | 166 | (48) | 130 | 23.1% | 71 | (23) | 31 |
Other companies, adjustments & deletions3 |
| 340 | (231) | 2,428 |
| (111) | (265) | 2,029 |
Subtotal Oil & Gas |
| 5,769 | 39,924 | (8,500) |
| 4,610 | 16,088 | 158 |
Refining & Distribution Segment |
|
|
|
|
|
|
|
|
Pampa Energía2 | 100.0% | 84 | (10) | 914 | 100.0% | - | (331) | (37) |
Refinor | 183 | (956) | (248) | 125 | (249) | (16) | ||
Non-controlling stake adjustment | (131) | 683 | 177 | (89) | 178 | 11 | ||
Subtotal Refinor adjusted by ownership | 28.5% | 52 | (272) | (71) | 28.5% | 36 | (71) | (4) |
Adjustments & deletions3 |
| - | - | 71 |
| - | - | 4 |
Subtotal Refining & Distribution |
| 136 | (282) | 914 |
| 36 | (403) | (37) |
Petrochemicals Segment |
|
|
|
|
|
|
|
|
Pampa Energía2 | 100.0% | (60) | - | (1,540) | 100.0% | (7) | - | (299) |
Subtotal Petrochemicals |
| (60) | - | (1,540) |
| (7) | - | (299) |
Holding & Others Segment |
|
|
|
|
|
|
|
|
Pampa Energía2 | 100.0% | 208 | - | 8,001 | 100.0% | (233) | 2,579 | 2,455 |
Transener | 3,626 | (1,717) | 2,398 | 2,546 | (274) | 1,386 | ||
Non-controlling stake adjustment | (2,671) | 1,265 | (1,766) | (1,876) | 202 | (1,021) | ||
Subtotal Transener adjusted by ownership | 26.3% | 955 | (452) | 631 | 26.3% | 670 | (72) | 365 |
TGS | 10,471 | 4,506 | 3,619 | 3,493 | 199 | 1,819 | ||
Non-controlling stake adjustment | (7,795) | (3,354) | (2,695) | (2,603) | (148) | (1,355) | ||
Subtotal TGS adjusted by ownership | 25.5% | 2,675 | 1,151 | 925 | 25.5% | 891 | 51 | 464 |
Other companies & deletions3 |
| (73) | (9,262) | (3,112) |
| (52) | (5,306) | (2,008) |
Subtotal Holding & Others |
| 3,765 | (8,563) | 6,445 |
| 1,276 | (2,749) | 1,276 |
Deletions |
| 8 | (2,916) | (8) |
| - | 21 | 37 |
Total Consolidated for Continuing Operations |
| 23,961 | 55,450 | (6,783) |
| 10,689 | 22,287 | 3,094 |
Total Adjusted by Ownership |
| 20,754 | 58,040 | (6,783) |
| 8,541 | 21,032 | 3,094 |
1 Due to the corporate reorganization, the 9M18 results are merged into Pampa. 2 Non - consolidated amounts. 3 The deletions in net debt correspond to other companies or inter-companies and debt repurchases. 4 Net debt includes holding companies and excludes financing from CAMMESA in the power generation segment. 5 Attributable to the Owners of the Company and does not include results from subsidiaries, but includes discontinued operations.
Pampa Energía ● Q3 18 Earning Release ● 28 |
![]()
3.8 Analysis of the Quarter, by Subsidiary
| Third Quarter 2018 | Third Quarter 2017 | ||||||
Subsidiary | % Pampa | Adjusted EBITDA | Net Debt4 | Net Income5 | % Pampa | Adjusted EBITDA | Net Debt4 | Net Income5 |
Power Generation Segment |
|
|
|
|
|
|
|
|
Diamante | 61.0% | 91 | (456) | 138 | 56.0% | 16 | (161) | 19 |
Los Nihuiles | 52.0% | 92 | (431) | 235 | 47.0% | 23 | (156) | 49 |
CPB | 100.0% | 279 | 5 | 131 | 100.0% | 78 | 651 | (10) |
CTG1 | 100.0% | - | - | - | 90.4% | 143 | (406) | 108 |
CTLL1 | 100.0% | - | - | - | 100.0% | 1,130 | 2,528 | 350 |
Pampa Energía2 | 100.0% | 2,938 | 24,302 | (3,717) | 100.0% | 434 | 6,313 | 56 |
Greenwind | 217 | 5,076 | (1,060) | (2) | 189 | (4) | ||
Non-controlling stake adjustment | (108) | (2,538) | 530 | 1 | (94) | 2 | ||
Subtotal Greenwind adjusted by ownership | 50.0% | 108 | 2,538 | (530) | 50.0% | (1) | 94 | (2) |
Other companies, adjustments & deletions3 |
| 2 | (155) | 63 |
| (415) | (822) | (24) |
Subtotal Power Generation |
| 3,509 | 25,804 | (3,681) |
| 1,408 | 8,040 | 546 |
Electricity Distribution Segment |
|
|
|
|
|
|
|
|
Edenor | 51.7% | 1,877 | 1,484 | 847 | 51.0% | 843 | 1,289 | 291 |
Adjustments & deletions3 |
| (1) | (0) | (396) |
| (0) | - | (132) |
Subtotal Electricity Distribution |
| 1,876 | 1,484 | 451 |
| 843 | 1,289 | 159 |
Oil & Gas Segment |
|
|
|
|
|
|
|
|
Petrolera Pampa1 | 100.0% | - | - | - | 49.5% | 815 | 2,202 | 297 |
Pampa Energía2 | 100.0% | 2,443 | 40,203 | (5,907) | 100.0% | 865 | 14,174 | (1,068) |
OldelVal | 364 | (206) | 286 | 143 | (101) | 72 | ||
Non-controlling stake adjustment | (280) | 159 | (220) | (110) | 78 | (55) | ||
Subtotal OldelVal adjusted by ownership | 23.1% | 84 | (48) | 66 | 23.1% | 33 | (23) | 17 |
Other companies, adjustments & deletions3 |
| (251) | (231) | (920) |
| (4) | (265) | 744 |
Subtotal Oil & Gas |
| 2,276 | 39,924 | (6,761) |
| 1,709 | 16,088 | (11) |
Refining & Distribution Segment |
|
|
|
|
|
|
|
|
Pampa Energía2 | 100.0% | 84 | (10) | 108 | 100.0% | - | (331) | 41 |
Refinor | 100 | (956) | (219) | 64 | (249) | 26 | ||
Non-controlling stake adjustment | (71) | 683 | 157 | (46) | 178 | (18) | ||
Subtotal Refinor adjusted by ownership | 28.5% | 28 | (272) | (62) | 28.5% | 18 | (71) | 7 |
Adjustments & deletions3 |
| - | - | 62 |
| - | - | (7) |
Subtotal Refining & Distribution |
| 112 | (282) | 108 |
| 18 | (403) | 41 |
Petrochemicals Segment |
|
|
|
|
|
|
|
|
Pampa Energía2 | 100.0% | (155) | - | (801) | 100.0% | 20 | - | (176) |
Subtotal Petrochemicals |
| (155) | - | (801) |
| 20 | - | (176) |
Holding & Others Segment |
|
|
|
|
|
|
|
|
Pampa Energía2 | 100.0% | 39 | - | 22,181 | 100.0% | (93) | 2,579 | 1,603 |
Transener | 1,258 | (1,717) | 858 | 739 | (274) | 510 | ||
Non-controlling stake adjustment | (927) | 1,265 | (632) | (544) | 202 | (376) | ||
Subtotal Transener adjusted by ownership | 26.3% | 331 | (452) | 226 | 26.3% | 195 | (72) | 134 |
TGS | 3,980 | 4,506 | 784 | 1,064 | 199 | 518 | ||
Non-controlling stake adjustment | (2,963) | (3,354) | (584) | (793) | (148) | (386) | ||
Subtotal TGS adjusted by ownership | 25.5% | 1,017 | 1,151 | 200 | 25.5% | 271 | 51 | 132 |
Other companies & deletions3 |
| 26 | (9,262) | (19,106) |
| (16) | (5,306) | (1,120) |
Subtotal Holding & Others |
| 1,413 | (8,563) | 3,502 |
| 357 | (2,749) | 749 |
Deletions |
| 47 | (2,916) | 47 |
| - | 21 | (24) |
Total Consolidated for Continuing Operations |
| 9,078 | 55,450 | (7,135) |
| 4,355 | 22,287 | 1,284 |
Total Adjusted by Ownership |
| 8,093 | 58,040 | (7,135) |
| 3,498 | 21,032 | 1,284 |
1 Due to the corporate reorganization, the Q3 18 results are merged into Pampa. 2 Non - consolidated amounts. 3 The deletions in net debt correspond to other companies or inter-companies and debt repurchases. 4 Net debt includes holding companies and excludes financing from CAMMESA in the power generation segment. 5 Attributable to the Owners of the Company and does not include results from subsidiaries, but includes discontinued operations.
Pampa Energía ● Q3 18 Earning Release ● 29 |