
1 The information is based on FS prepared according to IFRS in force in Argentina. Only continuing operations are considered.
2 It does not include sales from the affiliates Greenwind, OldelVal, Refinor, CTBSA, Transener and TGS, which at our ownership account for US$115 million. Under IFRS they are not consolidated in Pampa, thus shown as ‘Results for participation in joint businesses and associates’.
3 Consolidated adjusted EBITDA represents the results before financial results, income tax, depreciations and amortizations, extraordinary and non-cash income and expense, equity income and other adjustments from the IFRS implementation, and includes affiliates’ EBITDA at our ownership. For further information, see section 3 of this Earnings Release.
| Pampa Energía ● Q3 21 Earning release ● 1 |
 |
Table of contents
| Pampa Energía ● Q3 21 Earning release ● 2 |
| |
| 1. | Relevant events |
| 1.1 | Oil and gas segment |
The third round of Plan Gas.Ar
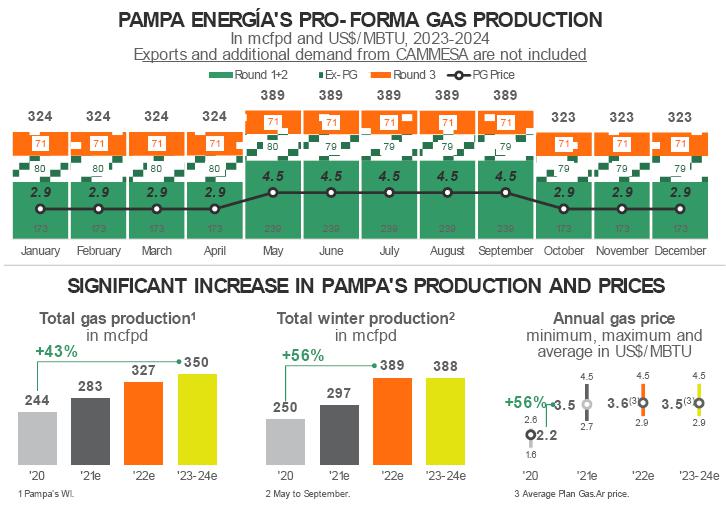
On October 19, 2021, the SE called for a new Plan Gas.Ar round to award 212 mcf/day of gas (half from Neuquina Basin), for the May 2022 – December 2024 period, under a GSA with the same conditions as the first round.
On November 10, 2021, the SE awarded a total of 106 mcf/day. Pampa participated and was awarded 71 mcf/day at US$3.347/MBTU.
Exports of gas
As of October 1, 2021, Pampa started exporting natural gas on a firm basis to Chile for a maximum volume of 53 mcf/day until May 1, 2022. Moreover, during off-peak season, Pampa exports to its clients in Chile on a spot basis.
| Pampa Energía ● Q3 21 Earning release ● 3 |
| |
| 1.2 | Power generation segment |
PEPE III expansion
On October 29, 2021, CAMMESA granted the dispatch priority for 36 MW. The capacity will be destined for the PEPE III expansion project, which output will be sold to large users through private PPA in MAT ER.
PEPE III is located in Coronel Rosales, 45 km from the City of Bahía Blanca, Province of Buenos Aires. It was commissioned in May 2019 with PEPE II and currently has an approximate 63% load factor.
Maturity of PPA at CTLL’s steam turbine
After fulfilling the 10-year PPA under SE Res. No. 220/07, the CCGT’s steam turbine LDLATV01 with a 180 MW capacity started to bill under spot energy scheme (SE Res. No. 440/21) from November 1, 2021, 12 am.
Transitionary pricing adjustment for legacy energy
To guarantee the supply of CAMMESA’s electricity exports and procure power plants’ availability and maintenance, SE Res. No. 1037/21 established an additional and transitionary recognition to legacy power plants (except for binational hydros), to be remunerated from September 2021 to February 2022.
This increase was instrumented to CAMMESA by the SE (Note NO-2021-108163338-APN-SE#ME). CAMMESA must assume that applicable thermal power plants have a 70% load factor, thus should receive 100% of the power capacity remuneration. Moreover, every month the energy exported by the grid is valued at AR$1.000/MWh, and said amount will be paid as an additional, prorated by each applicable power plant’s monthly generation.
Approval and issuance of IREC certificates
In August 2021, Pampa registered PEPE II and III wind farms under the International Renewable Energy Certificates (IREC) standard, issued by the International REC Standard Foundation, and became the first Argentine power generator to certify wind power. The IREC are internationally recognized certificates companies employ to offset carbon emission mitigation targets and support renewable energy development. Pampa could issue about 500,000 certificates per year, representing approximately 10% of the total certificates issued in the country4.
| 1.3 | TGS: midstream expansion in the Vaca Muerta Gas Pipeline |
Driven by the growth in gas production linked to Plan Gas.Ar, TGS completed the Tratayén plant’s expansion works in September 2021, increasing the treatment capacity from 191 to 275 mcf/day, demanding an approximate investment of US$16 million.
4 For further information, see this link.
| Pampa Energía ● Q3 21 Earning release ● 4 |
| |
| 1.4 | Other events |
Changes in the Board of Directors and Executive Committee
On September 30, 2021, Pampa’s General Ordinary and Extraordinary Shareholders’ Meeting approved the appointment of Maximiliano Sebastián Ramirez, an alternate independent director of Pampa, in replacement of Haroldo Adrián Montagu, and María Agustina Montes, alternate non-independent director of Pampa, replacing Victoria Hitce, until completing their respective terms.
Moreover, on November 10, 2021, the Board accepted the resignation of Gabriel Cohen, CFO, presented in October 2021, and appointed Nicolás Mindlin for his replacement. It is worth highlighting that Gabriel Cohen will continue as a regular member of our Board.
2020 Sustainability Report
In mid-October 2021, our fourth 2020 Sustainability Report was released. For the first time, the main ESG indicators were reviewed by an external auditor, we incorporated SASB indicators for the power generation and E&P, and we carried out a survey to all Pampa’s stakeholders about the materiality content of our Report.
2020 stood out for the substantial improvements in the environmental efficiency indicators in our power generation and E&P core businesses, such as water usage, energy consumption and carbon footprint intensities. Moreover, we detailed our response to COVID-19 in the community and our personnel, recording a 23% increase in US$ in our social investment, which amounted to US$3 million during the fiscal year.
Moreover, Pampa continues as a benchmark in sustainability matters, as a member of BYMA’s Sustainability Index, Bloomberg’s Gender Equality Index, and BYMA’s Corporate Governance Plus Panel. Pampa completed the S&P, Ecodavis and CDP questionnaires, becoming a signatory of this platform on environmental topics.
| Pampa Energía ● Q3 21 Earning release ● 5 |
| |
| 2. | Financial highlights |
| 2.1 | Consolidated balance sheet |
| Figures in million | As of 9.30.2021 | As of 12.31.2020 | ||||
| AR$ | US$ FX 98.74 | AR$ | US$ FX 84.15 | |||
| ASSETS | ||||||
| Property, plant and equipment | 159,563 | 1,616 | 135,445 | 1,610 | ||
| Intangible assets | 3,814 | 39 | 3,455 | 41 | ||
| Right-of-use assets | 1,440 | 15 | 867 | 10 | ||
| Deferred tax assets | 6,874 | 70 | 9,082 | 108 | ||
| Investments in joint ventures and associates | 70,500 | 714 | 46,229 | 549 | ||
| Financial assets at amortized cost | 9,906 | 100 | 8,428 | 100 | ||
| Financial assets at fair value through profit and loss | 4,780 | 48 | 942 | 11 | ||
| Other assets | 61 | 1 | 57 | 1 | ||
| Trade and other receivables | 2,599 | 26 | 3,631 | 43 | ||
| Total non-current assets | 259,537 | 2,628 | 208,136 | 2,473 | ||
| Inventories | 14,175 | 144 | 9,766 | 116 | ||
| Financial assets at amortized cost | - | - | 2,062 | 25 | ||
| Financial assets at fair value through profit and loss | 32,940 | 334 | 27,382 | 325 | ||
| Derivative financial instruments | 1 | 0 | 1 | - | ||
| Trade and other receivables | 47,840 | 485 | 28,678 | 341 | ||
| Cash and cash equivalents | 17,117 | 173 | 11,900 | 141 | ||
| Total current assets | 112,073 | 1,135 | 79,789 | 948 | ||
| Assets classified as held for sale | - | - | 123,603 | 1,469 | ||
| Total assets | 371,610 | 3,764 | 411,528 | 4,890 | ||
| EQUITY | ||||||
| Equity attributable to owners of the company | 169,789 | 1,720 | 120,247 | 1,428 | ||
| Non-controlling interest | 675 | 7 | 28,631 | 341 | ||
| Total equity | 170,464 | 1,726 | 148,878 | 1,769 | ||
| LIABILITIES | ||||||
| Investments in joint ventures and associates | 378 | 4 | 161 | 2 | ||
| Provisions | 13,921 | 141 | 9,326 | 111 | ||
| Income tax liabilities | 18,855 | 191 | 11,004 | 131 | ||
| Taxes payables | 151 | 2 | 128 | 2 | ||
| Deferred tax liabilities | - | - | 93 | 1 | ||
| Defined benefit plans | 2,165 | 22 | 1,460 | 17 | ||
| Borrowings | 134,564 | 1,363 | 115,428 | 1,372 | ||
| Other payables | 1,289 | 13 | 1,418 | 16 | ||
| Total non-current liabilities | 171,323 | 1,735 | 139,018 | 1,652 | ||
| Provisions | 546 | 6 | 1,379 | 16 | ||
| Income tax liabilities | 498 | 5 | 897 | 11 | ||
| Taxes payables | 3,947 | 40 | 3,030 | 36 | ||
| Defined benefit plans | 298 | 3 | 298 | 4 | ||
| Salaries and social security payable | 2,099 | 21 | 1,935 | 23 | ||
| Derivative financial instruments | 16 | 0 | 40 | - | ||
| Borrowings | 6,041 | 61 | 20,377 | 242 | ||
| Trade and other payables | 16,378 | 166 | 9,778 | 116 | ||
| Total current liabilities | 29,823 | 302 | 37,734 | 448 | ||
| Liabilities associated to assets classified as held for sale | - | - | 85,898 | 1,021 | ||
| Total liabilities | 201,146 | 2,037 | 262,650 | 3,121 | ||
| Total liabilities and equity | 371,610 | 3,764 | 411,528 | 4,890 | ||
| Pampa Energía ● Q3 21 Earning release ● 6 |
| |
| 2.2 | Consolidated income statement |
| Nine-month period | Third quarter | |||||||||||
| Figures in million | 2021 | 2020 | 2021 | 2020 | ||||||||
| AR$ | US$ | AR$ | US$ | AR$ | US$ | AR$ | US$ | |||||
| Sales revenue | 103,740 | 1,102 | 53,669 | 787 | 42,529 | 435 | 21,515 | 291 | ||||
| Cost of sales | (62,652) | (666) | (32,369) | (482) | (27,309) | (280) | (12,060) | (164) | ||||
| Gross profit | 41,088 | 436 | 21,300 | 305 | 15,220 | 155 | 9,455 | 127 | ||||
| Selling expenses | (1,752) | (18) | (1,356) | (20) | (669) | (6) | (356) | (4) | ||||
| Administrative expenses | (6,301) | (67) | (4,848) | (71) | (2,258) | (23) | (1,674) | (22) | ||||
| Exploration expenses | (50) | - | (21) | - | (6) | - | (12) | - | ||||
| Other operating income | 8,864 | 92 | 2,506 | 37 | 4,018 | 42 | 1,245 | 17 | ||||
| Other operating expenses | (4,623) | (50) | (1,781) | (26) | (792) | (8) | (505) | (7) | ||||
| Impairment of financial assets | (229) | (3) | (851) | (13) | (33) | (1) | (863) | (13) | ||||
| Impairment of PPE, intangible assets and inventories | (172) | (2) | (4,316) | (67) | - | - | - | - | ||||
| Results for part. in joint businesses and associates | 8,131 | 85 | 4,810 | 66 | 5,030 | 51 | 1,652 | 20 | ||||
| Operating income | 44,956 | 473 | 15,443 | 211 | 20,510 | 210 | 8,942 | 118 | ||||
| Financial income | 619 | 7 | 529 | 8 | 282 | 4 | 234 | 4 | ||||
| Financial costs | (14,128) | (151) | (8,598) | (127) | (6,287) | (65) | (3,250) | (45) | ||||
| Other financial results | 2,813 | 29 | 3,353 | 48 | (118) | - | 1,593 | 20 | ||||
| Financial results, net | (10,696) | (115) | (4,716) | (71) | (6,123) | (61) | (1,423) | (21) | ||||
| Profit before tax | 34,260 | 358 | 10,727 | 140 | 14,387 | 149 | 7,519 | 97 | ||||
| Income tax | (7,786) | (83) | (2,731) | (34) | (1,680) | (19) | (1,332) | (20) | ||||
| Net income for continuing operations | 26,474 | 275 | 7,996 | 106 | 12,707 | 130 | 6,187 | 77 | ||||
| Net income (loss) from discontinued operations | (7,129) | (75) | (1,765) | (23) | - | - | (17) | 1 | ||||
| Net income (loss) for the period | 19,345 | 200 | 6,231 | 83 | 12,707 | 130 | 6,170 | 78 | ||||
| Attributable to the owners of the Company | 22,577 | 234 | 7,156 | 96 | 12,804 | 131 | 6,161 | 78 | ||||
| Continuing operations | 26,303 | 273 | 8,101 | 108 | 12,804 | 131 | 6,159 | 77 | ||||
| Discontinued operations | (3,726) | (39) | (945) | (12) | - | - | 2 | 1 | ||||
| Attributable to the non-controlling interests | (3,232) | (34) | (925) | (13) | (97) | (1) | 9 | - | ||||
| Net income (loss) per share attributable to shareholders | 16.11 | 0.17 | 4.56 | 0.06 | 9.23 | 0.09 | 4.08 | 0.05 | ||||
| From continuing operations | 18.76 | 0.19 | 5.16 | 0.07 | 9.23 | 0.09 | 4.08 | 0.05 | ||||
| From discontinued operations | (2.66) | (0.03) | (0.60) | (0.01) | - | - | 0.00 | 0.00 | ||||
| Net income (loss) per ADR attributable to shareholders | 402.65 | 4.18 | 113.90 | 1.53 | 230.69 | 2.36 | 101.99 | 1.29 | ||||
| From continuing operations | 469.10 | 4.87 | 128.94 | 1.72 | 230.69 | 2.36 | 101.96 | 1.28 | ||||
| From discontinued operations | (66.45) | (0.70) | (15.04) | (0.19) | - | - | 0.03 | 0.02 | ||||
| Average outstanding common shares | 1,401.8 | 1,401.8 | 1,570.7 | 1,570.7 | 1,387.6 | 1,387.6 | 1,510.2 | 1,510.2 | ||||
| Outstanding common shares by the end of period | 1,386.4 | 1,386.4 | 1,479.0 | 1,479.0 | 1,386.4 | 1,386.4 | 1,479.0 | 1,479.0 | ||||
| Pampa Energía ● Q3 21 Earning release ● 7 |
| |
| 2.3 | Cash and financial borrowings |
| As of September 30, 2021, in US$ million | Cash1 | Financial debt | Net debt | ||||||
| Consolidated in FS | Ownership adjusted | Consolidated in FS | Ownership adjusted | Consolidated in FS | Ownership adjusted | ||||
| Power generation | 280 | 275 | 397 | 397 | 117 | 122 | |||
| Petrochemicals | - | - | - | - | - | - | |||
| Holding and others | 51 | 51 | - | - | (51) | (51) | |||
| Oil and gas | 175 | 175 | 1,027 | 1,027 | 852 | 852 | |||
| Total under IFRS/Restricted Group | 507 | 502 | 1,424 | 1,424 | 917 | 922 | |||
| Affiliates at O/S2 | 108 | 108 | 358 | 358 | 250 | 250 | |||
| Total with affiliates | 615 | 609 | 1,782 | 1,782 | 1,167 | 1,172 | |||
Note: Financial debt includes accrued interests. 1 It includes cash and cash equivalents, and financial assets at fair value with changing results. 2 Under IFRS, the affiliates Greenwind, OldelVal, Refinor, CTBSA, Transener, and TGS are not consolidated in Pampa.
Debt transactions
Year to date, Pampa’s financial debt at the consolidated level under IFRS decreased by US$190 million to US$1,424 million as of September 30, 2021. In terms of net debt, the reduction amounts to US$231 million. The average interest rate for US$-bearing indebtedness was 7.8%, currency in which 99.6% of the Company’s gross debt is denominated, mainly at a fixed rate. AR$ indebtedness’s average interest rate was 34.3%. Pampa’s consolidated financial debt averaged 4.7 years.
The following chart shows principal maturity profile, net of repurchases, in million US$ by the end of Q3 21:

In Q3 21, Pampa took bank calls for a total of AR$546 million and paid the total Series VI CB for AR$6,355 million FV at maturity. After the closing of the quarter, Pampa paid at maturity AR$500 million.
Moreover, due to the expiration of the CB program by the end of 2021, the Company’s Shareholders’ Meeting held on September 30, 2021, approved the creation of a new global program for up to US$2 billion of simple CB non-convertible into shares and/or convertible into shares.
Regarding our affiliates, in Q3 21, Transener paid at maturity Series II CB for US$86 million FV and loans for AR$56 million; also executed an AR$1 billion borrowing maturing in 3 years at Badlar plus 8% rate. Moreover, CTBSA paid at maturity US$33.2 million of syndicated loan and reopened Series I CB in US$-link, issuing an additional US$15.6 million at 4% nominal annual rate maturing in 2023 and Series II CB for an additional UVA27.9 million at 4% nominal annual rate with an initial value at AR$84.76/UVA maturing in 2024.
After the closing of the quarter, CTBSA paid at maturity US$4 million of the syndicated loan, and Transener paid at maturity borrowings for AR$28 million.
As of this Earnings Release issuance, the Company complies with the covenants established in its debt agreements.
| Pampa Energía ● Q3 21 Earning release ● 8 |
| |
Summary of debt securities
| Company In million | Security | Maturity | Amount issued | Amount outstanding | Coupon |
| In US$ | |||||
| TGS1 | CB at discount at fixed rate | 2025 | 500 | 479 | 6.75% |
| Pampa | CB Series T at discount & fixed rate | 2023 | 500 | 390 | 7.375% |
| CB Series I at discount & fixed rate | 2027 | 750 | 636 | 7.5% | |
| CB Series III at discount & fixed rate | 2029 | 300 | 293 | 9.125% | |
| In US$-link | |||||
| CTEB | CB Series I | 2023 | 43 | 43 | 4% |
| In UVA | |||||
| CTEB | CB Series II | 2024 | 65 | 65 | 4% |
Note: 1 According to IFRS, affiliates are not consolidated in Pampa’s FS.
Credit rating
In September 2021, S&P upgraded Pampa’s stand-alone global rating from ‘CCC+’ to ‘B-,’ above the sovereign ceiling due to the adequate liquidity and the comfortable debt profile.
The following table shows the Group’s ratings:
| Company | Agency | Rating | |
| Global | Local | ||
| Pampa | S&P | B-1 | na |
| Moody's | Caa3 | na | |
| FitchRatings2 | B- | AA (long-term) A1+ (short-term) | |
| TGS | S&P | CCC+ | na |
| Moody's | Caa3 | na | |
| Transener | FitchRatings2 | na | A+ (long-term) |
| CTEB | FitchRatings2 | na | A+ |
Note: 1 Stand-alone rating. 2 Local ratings issued by FIX SCR.
| Pampa Energía ● Q3 21 Earning release ● 9 |
| |
| 2.4 | Buyback of own financial securities5 |
Pampa
On August 31, 2021, Pampa’s Board of Directors halted the tenth share buyback program, which was terminated on November 5.
| X repurchase program | |
| Maximum amount to buyback | US$30 million |
| Maximum price | AR$110/common share or US$15.5/ADR |
| Period in force | 120 days as from July 8, 2021 |
| Status | Terminated |
In Q3 21, the Company, directly and indirectly, acquired 0.2 million ADR at an average price of US$15.4/ADR.
Moreover, Pampa’s Shareholders’ Meeting held on September 30, 2021, approved the capital stock reduction by canceling 12.5 million treasury common shares (equivalent to 0.5 million ADR). This reduction is in the process of registration before the Public Registry of Organizations (IGJ).
As of November 9, 2021, Pampa’s outstanding capital stock amounts to 1,386.4 million common shares (equivalent to 55.5 million ADR)6.
TGS
During Q3 21, TGS repurchased US$1.5 million FV of its 2025 CB. Therefore, as of November 9, 2021, the outstanding 2025 CB amounted to US$479 million FV.
5 Deemed to be effected transactions.
6 For further information, see Ownership Breakdown.
| Pampa Energía ● Q3 21 Earning release ● 10 |
| |
| 3. | Analysis of the Q3 21 results |
| Breakdown by segment Figures in US$ million | Q3 21 | Q3 20 | Variation | ||||||
| Sales | Adjusted EBITDA | Net Income | Sales | Adjusted EBITDA | Net Income | Sales | Adjusted EBITDA | Net Income | |
| Power generation | 173 | 126 | 74 | 160 | 132 | 74 | +8% | -5% | - |
| Oil and Gas | 148 | 104 | 52 | 83 | 36 | (13) | +78% | +187% | NA |
| Petrochemicals | 144 | 7 | 6 | 67 | 7 | 6 | +115% | -0% | - |
| Holding and Others | 4 | 25 | (1) | 6 | 31 | 10 | -33% | -18% | NA |
| Eliminations | (34) | - | - | (25) | - | - | +36% | NA | NA |
| Subtotal continuing operations | 435 | 262 | 131 | 291 | 206 | 77 | +49% | +27% | +70% |
| Electricity distribution (discont.) | - | - | - | - | 28 | 1 | NA | -100% | -100% |
| Total | 435 | 262 | 131 | 291 | 234 | 78 | +49% | +12% | +67% |
Note: Net income attributable to the Company’s shareholders.
| 3.1 | Reconciliation of consolidated adjusted EBITDA |
| Reconciliation of consolidated adjusted EBITDA, in US$ million | Nine-month period | Third quarter | ||||
| 2021 | 2020 | 2021 | 2020 | |||
| Consolidated operating income | 473 | 211 | 210 | 118 | ||
| Consolidated depreciations and amortizations | 147 | 153 | 56 | 53 | ||
| EBITDA | 620 | 364 | 266 | 171 | ||
| Adjustments from generation segment | 21 | 66 | 7 | (4) | ||
| Deletion of equity income | (32) | (37) | (18) | (17) | ||
| Deletion of PPE & intangible assets' impairment | 2 | 56 | - | - | ||
| Deletion of provision recovery of PEPE IV surety bond | (13) | (7) | - | (7) | ||
| Deletion of gain from commercial interests | (20) | (17) | (8) | (5) | ||
| Deletion of outage provision at GEBATG03 | 8 | - | - | - | ||
| Deletion of PPE's impairment | 8 | - | 8 | - | ||
| Greenwind's EBITDA adjusted by ownership | 8 | 9 | 3 | 3 | ||
| CTBSA's EBITDA adjusted by ownership | 59 | 62 | 21 | 22 | ||
| Adjustments from oil and gas segment | (10) | 15 | (20) | 11 | ||
| Deletion of equity income | (22) | 4 | (20) | - | ||
| Deletion of gain from commercial interests | (2) | (3) | (0) | (2) | ||
| Deletion of provision for environmental remediation | 14 | - | - | - | ||
| Deletion of impairment of receivables from distCos | - | 13 | - | 13 | ||
| OldelVal's EBITDA adjusted by ownership | 1 | 1 | 0 | 0 | ||
| Adjustments from petrochemicals segment | (0) | 11 | (0) | (0) | ||
| Deletion of inventory impairment | - | 11 | - | - | ||
| Deletion of gain from commercial interests | (0) | (0) | (0) | (0) | ||
| Adjustments from holding and others segment | 75 | 60 | 9 | 28 | ||
| Deletion of equity income | (31) | (33) | (13) | (3) | ||
| Deletion of gain from commercial interests | (0) | (2) | (0) | (0) | ||
| Deletion of contigencies provision | 12 | - | (1) | - | ||
| Deletion of executive compensation liabilities' reversal | (7) | - | (7) | - | ||
| TGS's EBITDA adjusted by ownership | 84 | 73 | 25 | 25 | ||
| Transener's EBITDA adjusted by ownership | 12 | 22 | 4 | 7 | ||
| Refinor's EBITDA adjusted by ownership | 4 | 0 | 1 | (1) | ||
| Consolidated adjusted EBITDA, continuing op. | 706 | 516 | 262 | 206 | ||
| At our ownership | 705 | 512 | 262 | 205 | ||
| + Discontinued op. EBITDA: Edenor | 17 | 67 | - | 28 | ||
| Consolidated adjusted EBITDA, cont. and discont. op. | 723 | 583 | 262 | 234 | ||
| At our ownership | 711 | 549 | 262 | 216 | ||
| Pampa Energía ● Q3 21 Earning release ● 11 |
| |
| 3.2 | Analysis of the power generation segment |
| Power generation segment, consolidated Figures in US$ million | Nine-month period | Third quarter | ||||||
| 2021 | 2020 | ∆% | 2021 | 2020 | ∆% | |||
| Sales revenue | 501 | 409 | +22% | 173 | 160 | +8% | ||
| Cost of sales | (266) | (181) | +47% | (95) | (68) | +40% | ||
| Gross profit | 235 | 228 | +3% | 78 | 92 | -15% | ||
| Selling expenses | (1) | (1) | - | - | 1 | -100% | ||
| Administrative expenses | (21) | (22) | -5% | (8) | (7) | +14% | ||
| Other operating income | 36 | 25 | +44% | 10 | 11 | -9% | ||
| Other operating expenses | (4) | (5) | -20% | (2) | (2) | - | ||
| Impairment of PPE and intangible assets | (2) | (56) | -96% | - | - | NA | ||
| Results for participation in joint businesses | 32 | 37 | -14% | 18 | 17 | +6% | ||
| Operating income | 275 | 206 | +33% | 96 | 112 | -14% | ||
| Finance income | 3 | 3 | - | 2 | 1 | +100% | ||
| Finance costs | (32) | (42) | -24% | (10) | (14) | -29% | ||
| Other financial results | 13 | (1) | NA | - | (2) | -100% | ||
| Financial results, net | (16) | (40) | -60% | (8) | (15) | -47% | ||
| Profit (loss) before tax | 259 | 166 | +56% | 88 | 97 | -9% | ||
| Income tax | (70) | (41) | +71% | (15) | (23) | -35% | ||
| Net income (loss) for the period | 189 | 125 | +51% | 73 | 74 | -1% | ||
| Attributable to owners of the Company | 187 | 127 | +47% | 74 | 74 | - | ||
| Attributable to non-controlling interests | 2 | (2) | NA | (1) | - | NA | ||
| Adjusted EBITDA | 362 | 341 | +6% | 126 | 132 | -5% | ||
| Adjusted EBITDA at our share ownership | 361 | 337 | +7% | 127 | 131 | -4% | ||
| Increases in PPE, intangible and right-of-use assets | 7 | 52 | -87% | 2 | 13 | -85% | ||
| Depreciation and amortization | 66 | 69 | -4% | 23 | 24 | -4% | ||
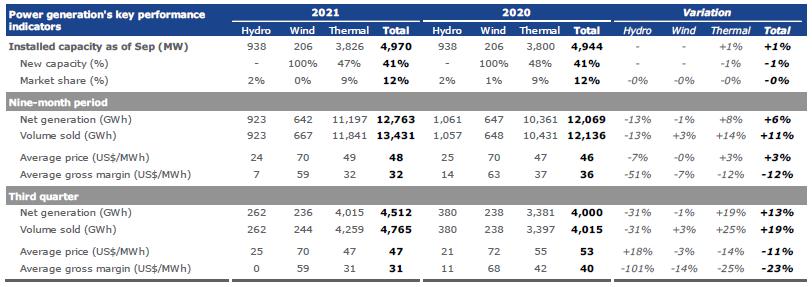
In Q3 21, the US$13 million year-on-year increase in sales is mainly explained by higher own gas sales, which, in turn, drive increased costs due to higher gas purchases to our E&P. The fuel self-procurement is only available for PPA under SEE Res. No. 287/17 (as from 2021 recognized under Plan Gas.Ar) and Energía Plus contracts. Moreover, the sales increase is explained by the post-lockdown recovery of industrial demand and Energía Plus prices, and to a lesser extent, by higher dispatch of thermal units, especially at CTLL. However, these effects were partially offset by lower revenues due to outages at CTGEBA and CTG’s Plus units between June and July 2021 and CTP’s 10-year PPA maturity in mid-July 2021.
Spot or legacy energy sales remained stable vs. Q3 20. Even though spot energy comprises 59% of the 4,970 MW operated by Pampa7, it represented 24% of the segment’s sales in Q3 21. The 29% update in AR$ prices was entirely diluted by the nominal depreciation, maintaining the US$ monomic price similar to Q3 20: the power capacity remuneration was US$3.6 thousand per MW-month for thermal units and US$2.0 thousand per MW-month for hydroelectric units.
In operating terms, the power generation operated by Pampa increased 13% vs. Q3 20, higher than the +4.5% in nationwide electricity demand and in line with the +16.3% at the industrial segment. From units operated by Pampa, there was higher dispatch at CTLL and CTGEBA’s CCGT01 (+661 GWh) due to increased gas availability and generation with liquid fuels at CTEB, CPB and CTIW (+151 GWh), and to a lesser extent, at Mendoza’s hydros due to more water flow, at EcoEnergía because of higher steam availability and PEPE II and III due to better wind resource. However, these effects were partially offset by the outages mentioned above at CTGEBA and CTG (-181 GWh), lower water input at HPPL (-129 GWh), and to a lesser extent, a year-on-year generation decrease at PEMC due to less wind and at CTPP and CTP explained by lower fuel availability.
7 Under IFRS, CTEB (567 MW) and PEMC (100 MW) are affiliates; their results are not consolidated in the FS, but they are operated by Pampa and their EBITDA at our equity stake are included in Pampa’s adjusted EBITDA.
| Pampa Energía ● Q3 21 Earning release ● 12 |
| |
In Q3 21, all power units operated by Pampa reached an average availability rate of 95.0%, 358 basis points lower than the 98.6% recorded in Q3 20, mainly explained by the forced outage at HINISA in September 2021 and the above-mentioned technical problems at CTGEBA and CTG’s Plus units. Especially, thermal units recorded an availability of 96.1%, 268 basis points lower than the 98.8% availability reached in Q3 20.
Note: Gross margin before amortization and depreciation. It includes CTEB and PEMC, operated by Pampa (50% of equity stake).
Q3 21 net operating costs, excluding depreciation and amortizations, increased 76% vs. Q3 20, mainly explained by higher energy purchases to cover Plus contracts due to the outages mentioned above. Moreover, even though our own gas volume consumption decreased (63 mcf/day vs. 85 mcf/day in Q3 20), higher gas purchases to our E&P segment were recorded due to increased unit costs due to Plan Gas.Ar. CAMMESA provides the remaining gas and liquid fuel consumed to dispatch our thermal units, without representing any cost for the Company. Moreover, in Q3 21, PPE impairments were charged at certain legacy units (US$8 million), while in Q3 20, we accrued US$7 million compensation from the insurance company due to technical problems at PEPE II and II.
The Q3 21 financial results amounted to a net loss of US$8 million (US$7 million improvement vs. Q3 20), mainly explained by lower financial interests because of lower stock of debt and allocation to the segment, in addition to lower FX losses over the active monetary position due to lower devaluation in Q3 21, partially offset by own CB buyback profit in Q3 20.
In Q3 21, our power generation’s adjusted EBITDA amounted to US$126 million, 5% lower vs. Q3 20, mainly explained by outages at CTGEBA and CTG (lower sales and higher energy purchases to cover contracts) and the termination of CTP’s PPA, partially offset by the Energía Plus’s increased margins and better thermal dispatch (especially at CTLL). In addition, the adjusted EBITDA considers our proportional 50% stake of CTEB (CTBSA), contributing US$21 million in Q3 21 (vs. US$22 million in Q3 20), and a 50% stake of PEMC (Greenwind), contributing US$3 million in Q3 21 (the same as Q3 20). Moreover, the adjusted EBITDA excludes the recognition of commercial interests from delayed receivables, mostly from CAMMESA (US$8 million in Q3 21 and US$5 million in Q3 20), in addition to the PPE impairment charged as operating expenses in Q3 21 (US$8 million) and the compensation from the insurance company received in Q3 20 due to technical problems at PEPE II and III (US$7 million).
Finally, capital expenditures in Q3 21, excluding CTEB and PEMC, decreased 85% vs. Q3 20, mainly explained by the completion of CTGEBA’s second CCGT.
| Pampa Energía ● Q3 21 Earning release ● 13 |
| |
Regarding our expansion projects, the following summary shows the current status:
| Project | MW | Marketing | Currency | Awarded price | Estimated capex in US$ million1 | Date of commissioning | ||||
| Capacity per MW-month | Variable per MWh | Total per MWh | Budget | % Executed @9/30/21 | ||||||
| Loma de la Lata | 15 | SE Res. No. 440/21 | AR$ | 208,980 - 551,475(2) | 418 | 939 | 22 | 90% | August 3, 2021 | |
| Closing to CCGT Genelba Plus | 400 | PPA for 15 years | US$ | 20,500 | 6 | 34 | 350 | 90% | OC: June 12, 2019(3) CC: July 2, 2020 | |
| Closing to CCGT Ensenada | 280 | PPA for 10 years | US$ | 23,962 | 10.5 | 43 | 213 | 61% | Q2 2022 (est.) | |
Note: 1 Amount without value-added tax. 2 It considers the range of load factor coefficient and the HMRT additional remuneration.
3 201 MW were remunerated under spot energy until July 1, 2020.
| 3.3 | Analysis of the oil and gas segment |
| Oil & gas segment, consolidated Figures in US$ million | Nine-month period | Third quarter | ||||||
| 2021 | 2020 | ∆% | 2021 | 2020 | ∆% | |||
| Sales revenue | 334 | 226 | +48% | 148 | 83 | +78% | ||
| Cost of sales | (200) | (185) | +8% | (85) | (63) | +35% | ||
| Gross profit | 134 | 41 | +227% | 63 | 20 | +215% | ||
| Selling expenses | (8) | (13) | -38% | (3) | (3) | - | ||
| Administrative expenses | (32) | (32) | - | (12) | (10) | +20% | ||
| Other operating income | 52 | 6 | NA | 29 | 5 | NA | ||
| Other operating expenses | (26) | (11) | +136% | (6) | (3) | +100% | ||
| Impairment of financial assets | (1) | (13) | -92% | - | (13) | -100% | ||
| Results for participation in joint businesses | 22 | (4) | NA | 20 | - | NA | ||
| Operating income (loss) | 141 | (26) | NA | 91 | (4) | NA | ||
| Finance income | 2 | 5 | -60% | - | 2 | -100% | ||
| Finance costs | (86) | (82) | +5% | (24) | (29) | -17% | ||
| Other financial results | (6) | 21 | NA | (3) | 9 | NA | ||
| Financial results, net | (90) | (56) | +61% | (27) | (18) | +50% | ||
| Profit (loss) before tax | 51 | (82) | NA | 64 | (22) | NA | ||
| Income tax | (2) | 23 | NA | (12) | 9 | NA | ||
| Net income (loss) for the period | 49 | (59) | NA | 52 | (13) | NA | ||
| Adjusted EBITDA | 210 | 72 | +193% | 104 | 36 | +187% | ||
| Increases in PPE and intangible assets | 144 | 34 | NA | 62 | - | NA | ||
| Depreciation and amortization | 79 | 83 | -5% | 33 | 29 | +14% | ||
In Q3 21, our oil and gas sales increased by US$65 million vs. Q3 20, mainly explained by the Plan Gas.Ar GSA (higher sale price and volume), the post-lockdown recovery of hydrocarbon demand and prices (natural gas for the industrial segment and oil for the domestic market), in addition to gas exports, resumed by the end of August 2021.
In operating terms, in Q3 21, our oil and gas segment total production registered 57.4 kboe/day (+23% vs. Q3 20 and +20% vs. Q2 21). Gas production reached the maximum level in the last five years, 316 mcf/day (+23% vs. Q3 20 and +22% vs. Q2 21), mainly explained by Plan Gas.Ar seasonality. In particular, a significant increase was recorded at El Mangrullo, with an all-time-high production of 218 mcf/day in Q3 21 (+25% vs. Q3 20 and +23% vs. Q2 21), comprising 69% of our total gas production. A significant production increase was also recorded at Río Neuquén (50 mcf/day in Q3 21, +56% vs. Q3 20 and +31% vs. Q2 21) and at Sierra Chata (23 mcf/day in Q3 21, +35% year-on-year and +42% vs. Q2 21). These effects were partially offset by lesser output at Rincón del Mangrullo due to lower activity and natural decline (18 mcf/day in Q3 21, -30% year-on-year and -12% vs. Q2 21).
| Pampa Energía ● Q3 21 Earning release ● 14 |
| |
Our accrued gas average sale price was US$4.4/MBTU in Q3 21 (+76% vs. Q3 20), mainly explained by the winter period of Plan Gas.Ar8 and the recovery of industrial demand, which prices increased in line or at a marginal discount to Plan Gas.Ar. Moreover, 52% of our gas deliveries went to the residential segment due to seasonal priority under Plan Gas.Ar, 24% was sold to the industrial/spot market, and 23% was consumed as raw material for our petrochemical plants and our thermal power plants9, affected by the outages at CTGEBA and CTG. The marginal balance was sold directly to CAMMESA and exports. On the other hand, in Q3 20, 50% of the deliveries were destined to CAMMESA’s spot tenders. In contrast, industrial/spot and residential segments held only 9% and 3%, respectively. The balance was destined to our thermal power plants and petrochemicals without recording any exports.
Oil production reached 4.8 kbbl/day in Q3 21 (+17% vs. Q3 20 and +4% vs. Q2 21), mainly due to the domestic demand recovery, offset by lower export demand. Production increased at El Tordillo, Río Neuquén, Gobernador Ayala and Los Blancos (4.4 kbbl/day in Q3 21, +22% year-on-year). Moreover, 68% of the volume sold during Q3 21 was destined to the domestic market (vs. 60% in Q3 20). As a result, our accrued oil average sale price in Q3 21 increased year-on-year by 52% to US$61.6/bbl, explained by the rise of the Brent but moderated by domestic prices.
As of the quarter’s closing, we accounted for 886 productive wells vs. 858 as of December 31, 2020.
| Oil and gas' key performance indicators | 2021 | 2020 | Variation | |||||||||
| Oil | Gas | Total | Oil | Gas | Total | Oil | Gas | Total | ||||
| Nine-month period | ||||||||||||
| Volume | ||||||||||||
| Production | ||||||||||||
| In thousand m3/day | 0.7 | 7,673 | 0.7 | 6,976 | +1% | +10% | +9% | |||||
| In million cubic feet/day | 271 | 246 | ||||||||||
| In thousand boe/day | 4.5 | 45.2 | 49.7 | 4.5 | 41.1 | 45.5 | ||||||
| Sales | ||||||||||||
| In thousand m3/day | 0.7 | 7,839 | 0.7 | 7,331 | +1% | +7% | +6% | |||||
| In million cubic feet/day | 277 | 259 | ||||||||||
| In thousand boe/day | 4.6 | 46.1 | 50.7 | 4.5 | 43.1 | 47.7 | ||||||
| Average Price | ||||||||||||
| In US$/bbl | 58.9 | 38.3 | +54% | +67% | ||||||||
| In US$/MBTU | 3.8 | 2.3 | ||||||||||
| Third quarter | ||||||||||||
| Volume | ||||||||||||
| Production | ||||||||||||
| In thousand m3/day | 0.8 | 8,940 | 0.6 | 7,249 | +17% | +23% | +23% | |||||
| In million cubic feet/day | 316 | 256 | ||||||||||
| In thousand boe/day | 4.8 | 52.6 | 57.4 | 4.1 | 42.7 | 46.8 | ||||||
| Sales | ||||||||||||
| In thousand m3/day | 0.9 | 9,245 | 0.7 | 7,483 | +40% | +24% | +25% | |||||
| In million cubic feet/day | 326 | 264 | ||||||||||
| In thousand boe/day | 5.9 | 54.4 | 60.4 | 4.2 | 44.0 | 48.3 | ||||||
| Average Price | ||||||||||||
| In US$/bbl | 61.6 | 40.4 | +52% | +76% | ||||||||
| In US$/MBTU | 4.4 | 2.5 | ||||||||||
Note: Net production in Argentina. Gas volume standardized at 9,300 kilocalories (kCal).
8 A 4-year contract until December 2024 to supply gas to power plants and the retail segment, at price of US$4.5/MBTU during the winter period (May to September) and US$3.0/MBTU for the rest of the year.
9 Energía Plus and SEE Res. No. 287/17.
| Pampa Energía ● Q3 21 Earning release ● 15 |
| |
Net operating costs in Q3 21, excluding depreciation and amortizations and Plan Gas.Ar, increased by 59% compared to Q3 20 and by 43% vs. Q2 21, mainly due to increases in royalties and levies from higher prices and volume sold, and operating expenses resulting from increased activity (contractors, treatment, conditioning). In particular, the lifting cost10 reached US$6.0 per produced boe in Q3 21, 11% higher than the US$5.4/boe recorded in Q3 20 and similar quarter-on-quarter.
In Q3 21, financial results reached a net loss of US$27 million, US$9 million higher than Q3 20, mainly because of losses from the holding of financial securities and the profit of own CB buyback recorded in Q3 20, partially offset by lower financial interests due to the decreased stock of debt.
Our oil and gas’ adjusted EBITDA amounted to US$104 million in Q3 21 vs. US$36 million in Q3 20, mainly explained by the increase in both hydrocarbon price and volume sold, especially natural gas, partially offset by higher royalties, taxes and costs related to the activity resumption. In addition, the adjusted EBITDA excludes the recognition of commercial interests due to collection delays, mostly charged to CAMMESA (US$0.4 million in Q3 21 and US$2 million in Q3 20) and the impairment of receivables to gas distribution utilities in Q3 20 (US$13 million).
Finally, the segment’s capital expenditures amounted to US$62 million, whereas in Q3 20 were marginal, mainly explained by the commitments under Plan Gas.Ar, which reactivated drilling and completion activity at gas fields, especially since the beginning of winter.
| 3.4 | Analysis of the petrochemicals segment |
| Petrochemicals segment, consolidated Figures in US$ million | Nine-month period | Third quarter | ||||||
| 2021 | 2020 | ∆% | 2021 | 2020 | ∆% | |||
| Sales revenue | 346 | 180 | +92% | 144 | 67 | +115% | ||
| Cost of sales | (294) | (161) | +83% | (134) | (58) | +131% | ||
| Gross profit | 52 | 19 | +174% | 10 | 9 | +11% | ||
| Selling expenses | (9) | (6) | +50% | (3) | (2) | +50% | ||
| Administrative expenses | (3) | (3) | - | (1) | (1) | - | ||
| Other operating income | 1 | 1 | - | 1 | 1 | - | ||
| Other operating expenses | (2) | (4) | -50% | - | - | NA | ||
| Recovery of financial assets impairment | - | 1 | -100% | - | - | NA | ||
| Impairment of inventories | - | (11) | -100% | - | - | NA | ||
| Operating income (loss) | 39 | (3) | NA | 7 | 7 | - | ||
| Finance costs | (2) | (2) | - | (1) | (1) | - | ||
| Other financial results | (2) | 6 | NA | 1 | 2 | -50% | ||
| Financial results, net | (4) | 4 | NA | - | 1 | -100% | ||
| Profit (loss) before tax | 35 | 1 | NA | 7 | 8 | -13% | ||
| Income tax | (11) | - | NA | (1) | (2) | -50% | ||
| Net income (loss) for the period | 24 | 1 | NA | 6 | 6 | - | ||
| Adjusted EBITDA | 41 | 9 | NA | 7 | 7 | -0% | ||
| Increases in PPE and intangible assets | 5 | 1 | NA | 1 | 1 | - | ||
| Depreciation and amortization | 2 | 1 | +100% | - | - | NA | ||
The adjusted EBITDA of the petrochemicals segment amounted to US$7 million in Q3 21, with no variations year-on-year. The substantial price improvement, both domestic and international, and the post-lockdown recovery of demand were partially offset by higher costs of virgin naphtha and other raw materials (driven by international reference prices) and the Plan Gas.Ar effect over the cost of gas. Quarter-on-quarter, adjusted EBITDA decreased by US$9 million, explained by higher cost of raw material, partially offset by an increase in the demand of octane bases and naphthas, as well as the maintenance of the reforming plant in Q2 21.
10 Metric equivalent to cost of sales excluding purchase and inventory, royalties, direct taxes and depreciations and amortizations.
| Pampa Energía ● Q3 21 Earning release ● 16 |
| |
Total volume sold increased 43% compared to Q3 20, mainly explained by the recovery of gasoline domestic demand and increased exports of reforming products, and to a lesser extent, due to higher polystyrene exports, as well as domestic demand of SBR, styrene and polystyrene. The amounts corresponding to Pampa are shown below:
| Petrochemicals' key performance indicators | Products | Total | ||||
| Styrene & polystyrene1 | SBR | Reforming | ||||
| Nine-month period | ||||||
| Volume sold 9M21 (thousand ton) | 82 | 38 | 183 | 303 | ||
| Volume sold 9M20 (thousand ton) | 66 | 27 | 137 | 230 | ||
| Variation 9M21 vs. 9M20 | +25% | +44% | +34% | +32% | ||
| Average price 9M21 (US$/ton) | 1,751 | 1,914 | 706 | 1,140 | ||
| Average price 9M20 (US$/ton) | 1,170 | 1,263 | 502 | 781 | ||
| Variation 9M21 vs. 9M20 | +50% | +52% | +41% | +46% | ||
| Third quarter | ||||||
| Volume sold Q3 21 (thousand ton) | 29 | 14 | 86 | 129 | ||
| Volume sold Q3 20 (thousand ton) | 26 | 12 | 52 | 90 | ||
| Variation Q3 21 vs. Q3 20 | +12% | +14% | +64% | +43% | ||
| Average price Q3 21 (US$/ton) | 1,767 | 2,252 | 725 | 1,123 | ||
| Average price Q3 20 (US$/ton) | 1,128 | 1,150 | 469 | 748 | ||
| Variation Q3 21 vs. Q3 20 | +57% | +96% | +55% | +50% | ||
Note: 1 It includes Propylene.
No financial result was registered in Q3 21, whereas a US$1 million net gain was recorded in Q3 20 due to the FX difference.
The capital expenditures in the segment reached US$1 million both in Q3 21 and Q3 20.
| Pampa Energía ● Q3 21 Earning release ● 17 |
| |
| 3.5 | Analysis of the holding and others segment |
| Holding and others segment, consolidated Figures in US$ million | Nine-month period | Third quarter | ||||||
| 2021 | 2020 | ∆% | 2021 | 2020 | ∆% | |||
| Sales revenue | 15 | 17 | -12% | 4 | 6 | -33% | ||
| Gross profit | 15 | 17 | -12% | 4 | 6 | -33% | ||
| Administrative expenses | (11) | (14) | -21% | (2) | (4) | -50% | ||
| Other operating income | 3 | 5 | -40% | 2 | - | NA | ||
| Other operating expenses | (18) | (6) | +200% | - | (2) | -100% | ||
| Impairment of financial assets | (2) | (1) | +100% | (1) | - | NA | ||
| Results for participation in joint businesses | 31 | 33 | -6% | 13 | 3 | NA | ||
| Operating income (loss) | 18 | 34 | -47% | 16 | 3 | NA | ||
| Finance income | 2 | 1 | +100% | 2 | 1 | +100% | ||
| Finance costs | (31) | (2) | NA | (30) | (1) | NA | ||
| Other financial results | 24 | 22 | +9% | 2 | 11 | -82% | ||
| Financial results, net | (5) | 21 | NA | (26) | 11 | NA | ||
| Profit (loss) before tax | 13 | 55 | -76% | (10) | 14 | NA | ||
| Income tax | - | (16) | -100% | 9 | (4) | NA | ||
| Net income for the period | 13 | 39 | -67% | (1) | 10 | NA | ||
| Adjusted EBITDA | 93 | 94 | -2% | 25 | 31 | -18% | ||
| Increases in PPE | 2 | 1 | +120% | 1 | - | NA | ||
| Depreciation and amortization | - | - | NA | - | - | NA | ||
In the holding and others segment, without considering the equity income from affiliates (Transener, TGS and Refinor), we recorded a positive operating margin of US$3 million. In contrast, in Q3 20, no operating margin was recorded, mainly explained by the US$7 million profit from the resetting of the senior management’s compensation plan, offset by lower accrued fees.
During Q3 21, we recorded a US$37 million year-on-year decrease in the financial results, reaching a net loss of US$26 million, mainly due to fiscal interests related to contingencies from the tax on presumed minimum profit and lower profit from FX.
The adjusted EBITDA of our holding and others decreased 18%, recording US$25 million in Q3 21. The adjusted EBITDA excludes commercial interests and the equity income from our participation in TGS, Transener and Refinor. In turn, it adds the EBITDA adjusted by equity ownership in these businesses. Moreover, it excludes the gain from reversing the senior management’s deferred compensation and contingencies provision recovery.
The EBITDA from our direct and indirect ownership of 29.0% and 27.6% in TGS were US$25 million (US$87 million at 100%) in Q3 21 and US$25 million (US$89 million at 100%) in Q3 20. The slight variation is explained by lower regulated revenues due to the lack of tariff adjustment since April 2019 and the AR$ devaluation. In addition, TGS processed fewer liquids, LPG exports and ethane to Dow Chemical compared to Q3 20 because of the higher gas demand from the post-lockdown recovery. Moreover, higher US$ unit cost affected natural gas, which is used to replace thermal reduction at Cerri Complex Plant (offset by lower volume). However, these effects were partially offset by the higher international reference price of natural gasoline and LPG, the increase in ethane price and more midstream revenues from natural gas transportation and conditioning service in Vaca Muerta.
In Transener, the EBITDA adjusted by our indirect stake ownership of 26.3% decreased to US$4 million (US$15 million at 100%) in Q3 21 vs. US$7 million (US$26 million at 100%) in Q3 20, mainly because of the lack of tariff adjustment, frozen as from February 2020, and devaluation effect.
| Pampa Energía ● Q3 21 Earning release ● 18 |
| |
In Refinor, the EBITDA adjusted by our stake ownership of 28.5% in Q3 21 recorded a gain of US$1 million (US$3 million at 100%), whereas a loss of US$1 million (US$(2) million at 100%) was recorded in Q3 20, mainly explained by the gradual recovery of gasoline demand and higher sale prices, partially offset by increased crude oil costs, which is the refinery’s main raw material, and devaluation effect over AR$-nominated revenues.
| 3.6 | Analysis of the nine-month period, by subsidiary and segment |
| Subsidiary In US$ million | Nine-month period 2021 | Nine-month period 2020 | |||||||
| % Pampa | Adjusted EBITDA | Net debt2 | Net income3 | % Pampa | Adjusted EBITDA | Net debt2 | Net income3 | ||
| Power generation segment | |||||||||
| Diamante | 61.0% | 3 | (5) | 3 | 61.0% | 5 | (17) | 1 | |
| Los Nihuiles | 52.0% | (2) | (7) | 2 | 52.0% | 4 | (15) | (5) | |
| Greenwind | 17 | 77 | (4) | 19 | 95 | 4 | |||
| Non-controlling stake adjustment | (8) | (39) | 2 | (9) | (47) | (2) | |||
| Subtotal Greenwind adjusted by ownership | 50.0% | 8 | 39 | (2) | 50.0% | 9 | 47 | 2 | |
| CTBSA | 117 | 200 | 67 | 123 | 258 | 70 | |||
| Non-controlling stake adjustment | (59) | (100) | (33) | (62) | (129) | (35) | |||
| Subtotal CTBSA adjusted by ownership | 50.0% | 59 | 100 | 33 | 50.0% | 62 | 129 | 35 | |
| Pampa stand-alone, other companies, adjs. & deletions1 | 100.0% | 293 | 129 | 151 | 100% | 261 | 426 | 93 | |
| Subtotal power generation | 362 | 255 | 187 | 341 | 570 | 127 | |||
| Oil & gas segment | |||||||||
| OldelVal | 44 | (20) | 14 | 42 | (12) | 24 | |||
| Non-controlling stake adjustment | (43) | 20 | (14) | (41) | 12 | (24) | |||
| Subtotal OldelVal adjusted by ownership | 2.1% | 1 | (0) | 0 | 2.1% | 1 | (0) | 1 | |
| Pampa stand-alone, other companies, adjs. & deletions1 | #REF! | 210 | 852 | 49 | #REF! | 71 | 879 | (60) | |
| Subtotal oil & gas | 210 | 851 | 49 | 72 | 879 | (59) | |||
| Petrochemicals segment | |||||||||
| Pampa Energía | 100.0% | 41 | (175) | 24 | 100.0% | 9 | - | 1 | |
| Subtotal petrochemicals | 41 | - | 24 | 9 | - | 1 | |||
| Holding & others segment | |||||||||
| Transener | 46 | (22) | (10) | 83 | 2 | 44 | |||
| Non-controlling stake adjustment | (34) | 16 | 7 | (61) | (1) | (32) | |||
| Subtotal Transener adjusted by ownership | 26.3% | 12 | (6) | (3) | 26.3% | 22 | 0 | 11 | |
| TGS | 292 | 366 | 130 | 264 | 241 | 81 | |||
| Non-controlling stake adjustment | (208) | (260) | (93) | (191) | (174) | (58) | |||
| Subtotal TGS adjusted by ownership | 29.0% | 84 | 106 | 38 | 27.6% | 73 | 66 | 22 | |
| Refinor | 15 | 40 | (5) | 1 | 16 | (1) | |||
| Non-controlling stake adjustment | (10) | (28) | 3 | (1) | (12) | 1 | |||
| Subtotal Refinor adjusted by ownership | 28.5% | 4 | 11 | (1) | 28.5% | 0 | 5 | (0) | |
| Pampa stand-alone, other companies, adjs. & deletions1 | 100% | (8) | (51) | (21) | 100% | (1) | (18) | 6 | |
| Subtotal holding & others | 93 | 60 | 13 | 94 | 54 | 39 | |||
| Deletions | 100% | - | (250) | - | 100% | - | (248) | - | |
| Total consolidated, continuing operations | 706 | 917 | 273 | 516 | 1,255 | 108 | |||
| At our share ownership | 705 | 1,172 | 273 | 512 | 1,517 | 108 | |||
| + Discontinued operations: Edenor | 4.1% | 17 | - | (39) | 55.1% | 67 | (3) | (12) | |
| Total consolidated, continuing and discontinued operations | 723 | 917 | 234 | 583 | 1,252 | 96 | |||
| At our share ownership | 711 | 1,172 | 234 | 549 | 1,515 | 96 | |||
Note: 1 The deletions correspond to other companies or inter-companies or debt repurchases. 2 Net debt includes holding companies.
3 Attributable to the Company’s shareholders.
| Pampa Energía ● Q3 21 Earning release ● 19 |
| |
| 3.7 | Analysis of the quarter, by subsidiary and segment |
| Subsidiary In US$ million | Third quarter 2021 | Third quarter 2020 | |||||||
| % Pampa | Adjusted EBITDA | Net debt2 | Net income3 | % Pampa | Adjusted EBITDA | Net debt2 | Net income3 | ||
| Power generation segment | |||||||||
| Diamante | 61.0% | 0 | (5) | 1 | 61.0% | 1 | (17) | (0) | |
| Los Nihuiles | 52.0% | (2) | (7) | (2) | 52.0% | 1 | (15) | (0) | |
| Greenwind | 6 | 77 | 1 | 7 | 95 | (0) | |||
| Non-controlling stake adjustment | (3) | (39) | (1) | (3) | (47) | 0 | |||
| Subtotal Greenwind adjusted by ownership | 50.0% | 3 | 39 | 1 | 50.0% | 3 | 47 | (0) | |
| CTBSA | 43 | 200 | 34 | 44 | 258 | 23 | |||
| Non-controlling stake adjustment | (21) | (100) | (17) | (22) | (129) | (11) | |||
| Subtotal CTBSA adjusted by ownership | 50.0% | 21 | 100 | 17 | 50.0% | 22 | 129 | 11 | |
| Pampa stand-alone, other companies, adjs. & deletions1 | 100.0% | 103 | 129 | 58 | 100% | 105 | 426 | 63 | |
| Subtotal power generation | 126 | 255 | 74 | 132 | 570 | 74 | |||
| Oil & gas segment | |||||||||
| OldelVal | 14 | (20) | 5 | 14 | (12) | 6 | |||
| Non-controlling stake adjustment | (14) | 20 | (5) | (14) | 12 | (6) | |||
| Subtotal OldelVal adjusted by ownership | 2.1% | 0 | (0) | 0 | 2.1% | 0 | (0) | 0 | |
| Pampa stand-alone, other companies, adjs. & deletions1 | #REF! | 104 | 852 | 52 | #REF! | 36 | 879 | (13) | |
| Subtotal oil & gas | 104 | 851 | 52 | 36 | 879 | (13) | |||
| Petrochemicals segment | |||||||||
| Pampa Energía | 100.0% | 7 | (175) | 6 | 100.0% | 7 | - | 6 | |
| Subtotal petrochemicals | 7 | - | 6 | 7 | - | 6 | |||
| Holding & others segment | |||||||||
| Transener | 15 | (22) | 4 | 26 | 2 | 11 | |||
| Non-controlling stake adjustment | (11) | 16 | (3) | (19) | (1) | (8) | |||
| Subtotal Transener adjusted by ownership | 26.3% | 4 | (6) | 1 | 26.3% | 7 | 0 | 3 | |
| TGS | 87 | 366 | 50 | 89 | 241 | 5 | |||
| Non-controlling stake adjustment | (61) | (260) | (35) | (65) | (174) | (3) | |||
| Subtotal TGS adjusted by ownership | 29.0% | 25 | 106 | 14 | 27.6% | 25 | 66 | 1 | |
| Refinor | 3 | 40 | (7) | (2) | 16 | (4) | |||
| Non-controlling stake adjustment | (2) | (28) | 5 | 2 | (12) | 3 | |||
| Subtotal Refinor adjusted by ownership | 28.5% | 1 | 11 | (2) | 28.5% | (1) | 5 | (1) | |
| Pampa stand-alone, other companies, adjs. & deletions1 | 100% | (5) | (51) | (15) | 100% | (0) | (18) | 7 | |
| Subtotal holding & others | 25 | 60 | (1) | 31 | 54 | 10 | |||
| Deletions | 100% | - | (250) | - | 100% | - | (248) | - | |
| Total consolidated, continuing operations | 262 | 917 | 131 | 206 | 1,255 | 77 | |||
| At our share ownership | 262 | 1,172 | 131 | 205 | 1,517 | 77 | |||
| + Discontinued operations: Edenor | 4.1% | - | - | - | 55.1% | 28 | (3) | 1 | |
| Total consolidated, continuing and discontinued operations | 262 | 917 | 131 | 234 | 1,252 | 78 | |||
| At our share ownership | 262 | 1,172 | 131 | 216 | 1,515 | 78 | |||
Note: 1 The deletions correspond to other companies or inter-companies or debt repurchases. 2 Net debt includes holding companies.
3 Attributable to the Company’s shareholders.
| Pampa Energía ● Q3 21 Earning release ● 20 |
| |
| 4. | Appendix |
| 4.1 | Power generation main operational KPIs |
| Power generation's key performance indicators | Hydroelectric | Wind | Subtotal hydro +wind | Thermal | Total | |||||||||||||||||
| HINISA | HIDISA | HPPL | PEMC1 | PEPE2 | PEPE3 | CTLL | CTG | CTP | CPB | CTPP | CTIW | CTGEBA2 | Eco- Energía | CTEB1 | Subtotal | |||||||
| Installed capacity (MW) | 265 | 388 | 285 | 100 | 53 | 53 | 1,144 | 780 | 361 | 30 | 620 | 100 | 100 | 1,253 | 14 | 567 | 3,826 | 4,970 | ||||
| New capacity (MW) | - | - | - | 100 | 53 | 53 | 206 | 364 | 100 | - | - | 100 | 100 | 565 | 14 | 567 | 1,811 | 2,017 | ||||
| Market share | 0.6% | 0.9% | 0.7% | 0.2% | 0.1% | 0.1% | 2.7% | 1.8% | 0.8% | 0.1% | 1.5% | 0.2% | 0.2% | 2.9% | 0.03% | 1.3% | 9.0% | 11.7% | ||||
| Nine-month period | ||||||||||||||||||||||
| Net generation 9M21 (GWh) | 267 | 222 | 434 | 281 | 163 | 198 | 1,566 | 3,621 | 170 | 31 | 159 | 237 | 224 | 6,411 | 59 | 286 | 11,197 | 12,763 | ||||
| Market share | 0.3% | 0.2% | 0.4% | 0.3% | 0.2% | 0.2% | 1.5% | 3.4% | 0.2% | 0.0% | 0.2% | 0.2% | 0.2% | 6.1% | 0.1% | 0.3% | 10.6% | 12.1% | ||||
| Sales 9M21 (GWh) | 268 | 221 | 434 | 281 | 187 | 198 | 1,590 | 3,621 | 335 | 31 | 160 | 237 | 224 | 6,826 | 123 | 285 | 11,841 | 13,431 | ||||
| Net generation 9M20 (GWh) | 286 | 194 | 581 | 312 | 157 | 178 | 1,709 | 3,291 | 347 | 40 | 488 | 115 | 142 | 5,701 | 57 | 181 | 10,361 | 12,069 | ||||
| Variation 9M21 vs. 9M20 | -6% | +14% | -25% | -10% | +4% | +11% | -8% | +10% | -51% | -22% | -67% | +107% | +58% | +12% | +4% | +58% | +8% | +6% | ||||
| Sales 9M20 (GWh) | 286 | 194 | 576 | 312 | 154 | 182 | 1,705 | 3,286 | 354 | 40 | 487 | 115 | 142 | 5,763 | 64 | 181 | 10,431 | 12,136 | ||||
| Avg. price 9M21 (US$/MWh) | 23 | 38 | 17 | 71 | 72 | 67 | 43 | 33 | 57 | 124 | 96 | 121 | 101 | 35 | 31 | na | 49 | 48 | ||||
| Avg. price 9M20 (US$/MWh) | 28 | 48 | 16 | 70 | 74 | 68 | 42 | 36 | 38 | 127 | 41 | na | 149 | 26 | 59 | na | 47 | 46 | ||||
| Avg. gross margin 9M21 (US$/MWh) | (3) | 16 | 8 | 61 | 55 | 58 | 28 | 29 | 10 | 69 | 7 | 98 | 79 | 17 | 10 | na | 32 | 32 | ||||
| Avg. gross margin 9M20 (US$/MWh) | 15 | 30 | 8 | 62 | 64 | 64 | 32 | 33 | 16 | 92 | 16 | na | 116 | 16 | 22 | na | 37 | 36 | ||||
| Third quarter | ||||||||||||||||||||||
| Net generation Q3 21 (GWh) | 84 | 64 | 114 | 105 | 59 | 72 | 497 | 1,383 | 29 | 6 | 67 | 72 | 77 | 2,255 | 21 | 104 | 4,015 | 4,512 | ||||
| Market share | 0.2% | 0.2% | 0.3% | 0.3% | 0.2% | 0.2% | 1.3% | 3.7% | 0.1% | 0.0% | 0.2% | 0.2% | 0.2% | 6.1% | 0.1% | 0.3% | 10.9% | 12.2% | ||||
| Sales Q3 21 (GWh) | 84 | 64 | 114 | 105 | 68 | 72 | 507 | 1,389 | 74 | 6 | 68 | 72 | 77 | 2,427 | 42 | 104 | 4,259 | 4,765 | ||||
| Net generation Q3 20 (GWh) | 77 | 61 | 243 | 112 | 58 | 68 | 618 | 816 | 37 | 9 | - | 76 | 64 | 2,332 | 15 | 33 | 3,381 | 4,000 | ||||
| Variation Q3 21 vs. Q3 20 | +9% | +6% | -53% | -6% | +1% | +5% | -20% | +70% | -22% | -25% | na | -6% | +20% | -3% | +40% | na | +19% | +13% | ||||
| Sales Q3 20 (GWh) | 77 | 61 | 243 | 112 | 58 | 68 | 618 | 813 | 43 | 9 | - | 76 | 64 | 2,339 | 19 | 33 | 3,397 | 4,015 | ||||
| Avg. price Q3 21 (US$/MWh) | 21 | 38 | 20 | 72 | 70 | 67 | 47 | 30 | 92 | 87 | 79 | 132 | 99 | 34 | 36 | na | 47 | 47 | ||||
| Avg. price Q3 20 (US$/MWh) | 29 | 43 | 13 | 71 | 80 | 68 | 41 | 47 | 86 | na | na | 123 | 114 | 32 | 61 | na | 55 | 53 | ||||
| Avg. gross margin Q3 21 (US$/MWh) | (17) | 8 | 8 | 63 | 51 | 60 | 28 | 26 | (4) | (31) | (1) | 108 | 73 | 18 | 9 | na | 31 | 31 | ||||
| Avg. gross margin Q3 20 (US$/MWh) | 11 | 22 | 8 | 63 | 75 | 70 | 33 | 42 | 17 | 149 | na | 100 | 93 | 21 | 35 | na | 42 | 40 | ||||
Note: Gross margin before amortization and depreciation. 1 Operated by Pampa (50% of equity stake). 2 Commissioning of ST02 as of July 2, 2020.
| Pampa Energía ● Q3 21 Earning release ● 21 |
| |
| 4.2 | Oil and gas production in the main areas |
| Main areas' production | Nine-month period | Third quarter | ||||||
| 2021 | 2020 | Variation | 2021 | 2020 | Variation | |||
| Gas (k boe/day) | ||||||||
| El Mangrullo | 31.1 | 26.5 | +17% | 36.3 | 29.0 | +25% | ||
| Río Neuquén | 6.5 | 5.5 | +18% | 8.4 | 5.4 | +56% | ||
| Sierra Chata | 3.1 | 2.9 | +6% | 3.9 | 2.9 | +35% | ||
| Rincón del Mangrullo1 | 3.3 | 4.7 | -31% | 3.0 | 4.2 | -30% | ||
| Others | 1.1 | 1.3 | -16% | 1.1 | 1.2 | -11% | ||
| Total gas at O/S | 45.2 | 41.1 | +10% | 52.6 | 42.7 | +23% | ||
| Oil (k boe/day) | ||||||||
| El Tordillo2 | 2.4 | 2.5 | -3% | 2.4 | 2.2 | +10% | ||
| Gobernador Ayala | 0.9 | 0.8 | +20% | 1.0 | 0.8 | +22% | ||
| Associated oil3 | 0.9 | 0.9 | -2% | 1.1 | 0.9 | +16% | ||
| Others | 0.3 | 0.3 | -6% | 0.4 | 0.2 | +70% | ||
| Total oil at O/S | 4.5 | 4.5 | +1% | 4.8 | 4.1 | +17% | ||
| Total at O/S (kboe/day) | 49.7 | 45.5 | +9% | 57.4 | 46.8 | +23% | ||
Note: Production in Argentina. 1 It doesn’t include shale formation. 2 It includes La Tapera - Puesto Quiroga field. 3 From gas fields.
| 4.3 | Electricity distribution segment, discontinued11 |
| Electricity distribution segment, consolidated Figures in US$ million | Nine-month period | Third quarter | ||||||
| 2021 | 2020 | ∆% | 2021 | 2020 | ∆% | |||
| Sales revenue | 493 | 865 | -43% | - | 301 | -100% | ||
| Cost of sales | (398) | (726) | -45% | - | (246) | -100% | ||
| Gross profit | 95 | 139 | -32% | - | 55 | -100% | ||
| Selling expenses | (36) | (57) | -36% | - | (20) | -100% | ||
| Administrative expenses | (26) | (41) | -35% | - | (14) | -100% | ||
| Other operating income | 21 | 20 | +7% | - | 4 | -100% | ||
| Other operating expenses | (17) | (16) | +7% | - | (5) | -100% | ||
| Impairment of financial assets | (11) | (40) | -72% | - | (13) | -100% | ||
| Recovery of PPE impairment | 15 | - | NA | - | - | NA | ||
| Results for participation in joint businesses | - | - | NA | - | - | NA | ||
| Operating income (loss) | 41 | 5 | NA | - | 7 | -100% | ||
| RECPAM | 120 | 79 | +52% | - | 33 | -100% | ||
| Finance income | 0 | 0 | +9% | - | - | NA | ||
| Finance costs | (106) | (71) | +50% | - | (29) | -100% | ||
| Other financial results | 8 | (21) | NA | - | (2) | -100% | ||
| Profit (loss) before tax | 62 | (8) | NA | - | 9 | -100% | ||
| Income tax | (138) | (15) | NA | - | (8) | -100% | ||
| Net income (loss) for the period | (75) | (23) | +226% | - | 1 | -100% | ||
| Attributable to owners of the Company | (39) | (12) | +214% | - | 1 | -100% | ||
| Attributable to non-controlling interests | (37) | (11) | +241% | - | - | NA | ||
| Adjusted EBITDA, discontinued | 17 | 67 | -75% | - | 28 | -100% | ||
| Increases in PPE, intangible and right-of-use assets | 64 | 95 | -32% | - | 38 | -100% | ||
| Depreciation and amortization | - | 62 | -100% | - | 21 | -100% | ||
11 On June 30, 2021, the sale closing of the controlling stake in Edenor was closed. Consequently, under IFRS, the electricity distribution segment is deconsolidated from Pampa’s FS and shown as discontinued operations for the current and comparative periods.
| Pampa Energía ● Q3 21 Earning release ● 22 |
| |
| 5. | Glossary of terms |
| Term | Definition |
| Q2 21/Q2 20 | Second quarter of 2021/Second quarter of 2020 |
| Q3 21/Q3 20 | Third-quarter of 2021/Third quarter of 2020 |
| 9M 21/9M 20 | First nine months of 2021/First nine months of 2020 |
| ADRs/ADSs | American Depositary Receipts |
| AR$ | Argentine Pesos |
| Bbl | Barrel |
| Boe | Barrels of oil equivalent |
| CAMMESA | Compañía Administradora del Mercado Mayorista Eléctrico S.A. (Argentine Wholesale Electricity Market Clearing Company) |
| CB | Corporate Bonds |
| CCGT | Combined cycle gas turbine |
| CDP | Carbon Diclosure Project |
| CEO | Chief Executive Officer |
| CFO | Chief Financial Officer |
| CPB | Piedra Buena Thermal Power Plant |
| CTBSA | CT Barragán S.A. |
| CTEB | Ensenada Barragán Thermal Power Plant |
| CTG | Güemes Thermal Power Plant |
| CTGEBA | Genelba Thermal Power Plant |
| CTIW | Ingeniero White Thermal Power Plant |
| CTLL | Loma De La Lata Thermal Power Plant |
| CTP | Piquirenda Thermal Power Plant |
| CTPP | Parque Pilar Thermal Power Plant |
| DNU | Decreto de Necesidad y Urgencia (Executive Decree) |
| E&P | Exploration and Production |
| EBITDA | Earnings before interest, tax, depreciation and amortization |
| EcoEnergía | EcoEnergía Co-Generation Power Plant |
| Edenor | Empresa Distribuidora y Comercializadora Norte S.A. |
| Energía Plus | Energía Plus Program, SE Res. No. 1,281/06 |
| Est. | Estimated |
| ESG | Environmental, Social and Governance |
| FS | Financial Statements |
| FV | Face Value |
| FX | Nominal exchange rate |
| GSA | Gas Supply Agreement |
| Greenwind | Greenwind S.A. |
| GWh | Gigawatt-hour |
| HIDISA | Diamante Hydroelectric Power Plant |
| HINISA | Los Nihuiles Hydroelectric Power Plant |
| HMRT | Horas de Alto Requerimiento Térmico del Mes (Hours of the month with a high thermal demand) |
| HPPL | Pichi Picún Leufú Hydroelectric Power Plant |
| IFRS | International Financial Reporting Standards |
| Kbbl/kboe | Thousands of barrels/thousands of barrels of oil equivalent |
| LPG | Liquified Petroleum Gas |
| M3 | Cubic meter |
| Pampa Energía ● Q3 21 Earning release ● 23 |
| |
| Mcf | Million cubic feet |
| MBTU | Million British Thermal Unit |
| MW/MWh | Megawatt/Megawatt-hour |
| N.a. | Not applicable |
| O/S | At equity ownership |
| OldelVal | Oleoductos del Valle S.A. |
| Pampa / the Company | Pampa Energía S.A. |
| Pampa Group | Pampa Energía S.A. and its subsidiaries |
| PEMC | Ingeniero Mario Cebreiro Wind Farm |
| PEPE | Pampa Energía Wind Farm |
| PG | Plan Gas.Ar |
| Plan Gas.Ar | Argentine Natural Gas Production Promotion Program – 2020 – 2024 Supply and Demand Scheme (DNU No. 892/20 and supplementary regulations) |
| PPA | Power Purchase Agreement |
| PPE | Property, Plant and Equipment |
| RECPAM | Results from a net monetary position |
| Refinor | Refinería del Norte S.A. |
| Res. | Resolution/Resolutions |
| SASB | Sustainability Accounting Standards Board |
| SBR | Styrene-Butadiene Rubber |
| SE | Secretariat of Energy |
| SEE | Under Secretariat of Electric Energy (former Secretariat of Electric Energy) |
| TGS | Transportadora de Gas del Sur S.A. |
| Ton | Metric Ton |
| Transener | Compañía de Transporte de Energía Eléctrica en Alta Tensión Transener S.A. |
| US$ | U.S. Dollars |
| UVA | Unidad de Valor Adquisitivo (Acquisitive Value Units) |
| WI | Working Interest |
| Pampa Energía ● Q3 21 Earning release ● 24 |