Table of Contents
Pampa Energía, an independent company with active participation in Argentina’s electricity and gas value chain, announces the results for the fiscal year and quarter ended on December 31, 2021. |
Buenos Aires, March 10, 2022
Stock information 

Share capital net of repurchases and reductions,
as of March 9, 2022:
1,383.6 million common shares/
55.3 million ADSs Market capitalization:
AR$248 billion/US$1,281 million Information about the videoconference Date and time: Friday, March 11, at 10 AM Eastern Standard Time/
12 PM Buenos Aires Time Access link:
bit.ly/Pampa4Q21VC For further information about Pampa · Email: investor@pampaenergia.com · Website for investors: ri.pampaenergia.com/en · Argentina’s Securities and Exchange Commission: www.argentina.gob.ar/cnv · Securities and Exchange Commission: sec.gov | | | Basis of presentation Pampa’s financial information adopts US$ as functional currency, and it is expressed in AR$ at transactional FX. However, our affiliates Transener, TGS and Refinor report under local currency. Hence, their figures are adjusted by inflation as of December 31, 2021, except for previous periods already reported. Main results from the quarter1 42% year-on-year increase in sales, recording US$406 million2 in Q4 21, explained by the rise in prices of gas, oil and petrochemical products, increased physical volume sold in all our businesses and higher legacy energy sales, offset by the PPA maturity at CTLL’s steam turbine. |
| | | | | | | |
| | | Pampa's main operational KPIs | Q4 21 | Q4 20 | Variation |
| | | Power | Generation (GWh) | 4,670 | 4,400 | +6% |
| | | | Gross margin (US$/MWh) | 26.1 | 33.2 | -21% |
| | | | | | | |
| | | Hydrocarbon | Production (k boe/day) | 58.1 | 43.7 | +33% |
| | | | Gas over total production | 91% | 90% | +1% |
| | | | Average gas price (US$/MBTU) | 3.1 | 2.1 | +47% |
| | | | Average oil price (US$/bbl) | 58.6 | 41.3 | +42% |
| | | | | | | |
| | | Petrochemicals | Volume sold (k ton) | 114 | 107 | +6% |
| | | | Average price (US$/ton) | 1,266 | 795 | +59% |
| | | | | | | |
| | | 8% year-on-year increase in the adjusted EBITDA3, recording US$199 million in Q4 21, explained by an increase of US$27 million in oil and gas, and US$5 million in holding and others, offset by decreases of US$16 million in power generation and US$1 million in petrochemicals. Pampa recorded a consolidated profit attributable to the Company’s shareholders of US$39 million, vs. a net loss of US$463 million in Q4 20, mainly due to the impairment of assets from discontinued operations in Q4 20, better operating margin in oil and gas, and lower stock of debt, offset by losses from the holding of financial securities in Q4 21. Consolidated net debt decreased to US$866 million as of December 31, 2021, recording a continuous and significant reduction compared to the US$1,148 million recorded by the end of 2020. |
1 The information is based on FS prepared according to IFRS in force in Argentina. Only continuing operations are considered.
2 It does not include sales from the affiliates Greenwind, OldelVal, Refinor, CTBSA, Transener and TGS, which at our ownership account for US$147 million. Under IFRS they are not consolidated in Pampa, thus shown as ‘Results for participation in joint businesses and associates’.
3 Consolidated adjusted EBITDA represents the results before financial results, income tax, depreciations and amortizations, extraordinary and non-cash income and expense, equity income and other adjustments from the IFRS implementation, and includes affiliates’ EBITDA at our ownership. For further information, see section 3 of this Earnings Release.
| |
Pampa Energía ● Q4 21 Earning release ● 1 |
Table of contents
| |
Pampa Energía ● Q4 21 Earning release ● 2 |
| 1.1 | Power generation segment |
PEPE III expansion
In the fourth quarter of 2021, Pampa announced PEPE III’s expansion project, which will increase the existing gross capacity from 53.2 MW to 134.2 MW, with an estimated investment of US$128 million. Its output will be sold in the MAT ER through a US$-denominated PPA with private parties, and it is estimated to be commissioned in stages, fully commissioning in the second quarter of 2023.
PEPE III is located in Coronel Rosales, 45 km from the City of Bahía Blanca, Province of Buenos Aires. Currently, it comprises 14 Vestas wind turbines and during 2021 its load factor reached 58%, highlighting the outstanding wind quality in the area. The expansion project consists of the assembly and installation of 18 wind turbines of the same brand.
As of today, Pampa owns three wind farms: PEMC (100 MW), and PEPE II and PEPE III (53.2 MW each). Once works are completed, our wind farms will contribute to the national grid a total of 287.4 MW of renewable energy.
This expansion, in addition to the closing to CCGT at CTEB and the investments committed under Plan Gas.Ar, are part of the Company’s strategy to focus its investments on our core businesses: power generation and natural gas production.
Issuance of Pampa’s first Green Bond
In order to finance PEPE III’s expansion, on January 18, 2022, Pampa issued the first Green Bond (Series VIII CB) for a AR$3,107 million FV, at a variable interest rate of Badlar plus 2%, maturing in July 2023 with American amortization system, after receiving offers of purchase for more than AR$9,646 million, more than three times compared to the issued nominal value.
This is the first green bond issued by Pampa, which reflects the commitment to finance projects with a positive impact on the environment and diversify the country’s energy matrix. The issuance was distinguished by Fix Ratings, an affiliate of Fitch Ratings, with a Green Bond (BV1) rating, one of the best ratings, as it is in line with ICMA’s four core components of the Green Bond Principles (GBP). Moreover, this bond joined ByMA’s SGS Bonds Panel (Social, Green and Sustainable Bonds), which promotes the conditions for the Capital Markets of Argentina to become more sustainable.
Plan Gas.Ar and expansion at El Mangrullo
Thanks to the Plan Gas.Ar implementation, in December 2021 Pampa achieved a 38% year-on-year net production increase, reaching 9.1 million m3/day. This increase is equivalent to more than double the nation-wide growth for the same period (16%).
Moreover, as one of the only two producers participating in all the rounds of Plan Gas.Ar, Pampa will add 2 million m3/day as from May 2022, awarded in the third round. It is worth mentioning that in this last round, Pampa’s awarded volume represented 2/3 of the total.
| |
Pampa Energía ● Q4 21 Earning release ● 3 |

In line with our production commitment under Plan Gas.Ar and the outstanding productivity of our leading block, El Mangrullo, it is estimated to increase this block’s processing capacity in stages: (i) the 2.5 million m3/day expansion of the temporary production facility as from May 2022, the beginning of winter; (ii) the commissioning of our 4.8 million m3/day gas treatment plant as from the third quarter of 2022; and (iii) the usage extension of the facilities at Rincón del Mangrullo for 2.0 million m3/day until January 2025. Therefore, the production capacity at El Mangrullo will reach a maximum of 13.6 million m3/day.
El Mangrullo is one of the largest gas-bearing blocks in the Neuquina Basin with almost 200 km2 area and access to Mulichinco and Agrio formations (tight sands or tight gas), and Vaca Muerta (shale gas). Pampa operates and holds 100% working interest of the exploration and explotation concession until 2053.
Exports of natural gas
In December 2021, Pampa obtained permits to export natural gas to different clients in Chile on a firm basis for a maximum volume of 1.22 million m3/day between January – April 2022. Considering the permit granted for the October 2021 – April 2022 period, as from January 2022 the maximum volume exported on a firm basis amounts to 2.72 million m3/day, which allowed to maintain a constant level of production above 9 million m3/day, despite the lower local demand due to off-peak period.
The SE Res. No. 67/22 of February 7, 2022 created the Transport.Ar National Production program to execute gas transportation works allowing, among others: (i) natural gas self-supply; (ii) development of unconventional reserves in the Neuquina Basin on a large scale; (iii) replacement of imports of gas, LNG, and liquid fuel (FO or GO); and (iv) increase in natural gas exports, primarily to neighboring countries.
| |
Pampa Energía ● Q4 21 Earning release ● 4 |
Moreover, the construction of Presidente Néstor Kirchner main gas pipeline and its supplementary works as a strategic project was declared of national public interest, after witnessing a substantial increase in the production of gas due to Plan Gas.Ar, especially in the Neuquina Basin, in addition to the bottleneck on the existing gas pipelines connecting the Neuquina Basin with the large consumption areas, as well as the lower availability of gas in the Noroeste Basin and from Bolivia.
Through PEN Executive Order No. 76/22 of February 11, 2022, a 35-year concession for this gas pipeline was granted to IEASA, and the FONDESGAS (Fondo de Desarrollo Gasífero Argentino) trust was created, being IEASA the trustor and beneficiary, and BICE the trustee.
This pipeline will connect the town of Tratayén, Province of Neuquén, with the City of Salliqueló, Province of Buenos Aires (I Phase), and Salliqueló with the City of San Jerónimo, Province of Santa Fe (II Phase). IEASA will lead the works, which could be performed on its own account or through third parties, giving the priority to YPF. If a call for tenders is launched, TGS will evaluate the suitability to participate for the operation and maintenance.
Transener and TGS’s tariff situation
The PEN Executive Order No. 871/21 of December 23, 2021 extended the term of the Executive Branch’s power to intervene administratively the ENRE and ENARGAS, established in the Solidarity Law, until December 31, 2022.
Moreover, on February 25, 2022, ENRE Res. No. 68/22 and 69/22 were issued, granting a transitionary tariff adjustment of 25% and 23% to Transener and Transba, respectively, retroactive to February 1, 2022. Due to the existing differences between the tariff proposals of said companies and the final tariff schemes, Transener and Transba filed a request to review the proceeding and a preliminary challenge, and will appeal to both resolutions.
On the other hand, through PEN Executive Order No. 91/22 and ENARGAS Res. No. 60/22 of February 2022, the 60% transitionary tariff adjustment was granted to TGS, effective as from March 1, 2022. Among other conditions, the grating of said adjustment did not establish a mandatory investment plan and it has forbidden to: (i) distribute dividends; and (ii) to prepaid financial and commercial debt with shareholders, to acquire other companies or to grant credits.
Pursuant to the 2022 Transitional Agreement, TGS has committed not to initiate any new claims, motions, actions, lawsuits or appeals; and/or to suspend, remain or extend the suspension of all filed motions and claims related to the Comprehensive Tariff Review Renegotiation in force, the Law No. 27,541 and PEN Executive Order No. 287/20 and DNU No. 1020/20.
It is worth mentioning that the tariff schemes of Transener and Transba, and TGS had been unchanged since August and April 2019, respectively. Moreover, during their respective public hearings held in 2022, they informed that their transportation costs represented around 2% and 13% of the residential user’s final bill (comprised of the raw materials, the transportation, the distribution and the tax).
TGS: midstream service expansion at Vaca Muerta
The increase of natural gas activity and production in the Neuquina Basin, promoted by the Plan Gas.Ar, allowed TGS to move forward with two projects approved in the last quarter of 2021, comprised of the installation of: (i) two gas conditioning modular plants, with a capacity of 3.5 million m3/day each, and a gasoline stabilizer tower; and (ii) a conditioning plant with a capacity of 6.6 million m3/day. The estimated investment amounts to US$22 million and US$82 million, commissioning in 2022 and mid-2023, respectively.
| |
Pampa Energía ● Q4 21 Earning release ● 5 |
| 2.1 | Consolidated balance sheet |
| Figures in million | | As of 12.31.2021 | | As of 12.31.2020 |
| | AR$ | US$ FX 102.72 | | AR$ | US$ FX 84.15 |
| ASSETS | | | | | | |
| Property, plant and equipment | | 170,390 | 1,659 | | 135,445 | 1,610 |
| Intangible assets | | 3,956 | 39 | | 3,455 | 41 |
| Right-of-use assets | | 1,231 | 12 | | 867 | 10 |
| Deferred tax assets | | 8,675 | 84 | | 9,082 | 108 |
| Investments in joint ventures and associates | | 79,500 | 774 | | 46,229 | 549 |
| Financial assets at amortized cost | | 10,821 | 105 | | 8,428 | 100 |
| Financial assets at fair value through profit and loss | | 2,998 | 29 | | 942 | 11 |
| Other assets | | 61 | 1 | | 57 | 1 |
| Trade and other receivables | | 3,379 | 33 | | 3,631 | 43 |
| Total non-current assets | | 281,011 | 2,736 | | 208,136 | 2,473 |
| Inventories | | 15,888 | 155 | | 9,766 | 116 |
| Financial assets at amortized cost | | 537 | 5 | | 2,062 | 25 |
| Financial assets at fair value through profit and loss | | 47,026 | 458 | | 27,382 | 325 |
| Derivative financial instruments | | 16 | 0 | | 1 | 0 |
| Trade and other receivables | | 40,892 | 398 | | 28,678 | 341 |
| Cash and cash equivalents | | 11,283 | 110 | | 11,900 | 141 |
| Total current assets | | 115,642 | 1,126 | | 79,789 | 948 |
| Assets classified as held for sale | | - | - | | 123,603 | 1,469 |
| Total assets | | 396,653 | 3,861 | | 411,528 | 4,890 |
| | | | | | | |
| EQUITY | | | | | | |
| Equity attributable to owners of the company | | 183,431 | 1,786 | | 120,247 | 1,429 |
| Non-controlling interest | | 609 | 6 | | 28,631 | 340 |
| Total equity | | 184,040 | 1,792 | | 148,878 | 1,769 |
| | | | | | | |
| LIABILITIES | | | | | | |
| Investments in joint ventures and associates | | 386 | 4 | | 161 | 2 |
| Provisions | | 14,444 | 141 | | 9,326 | 111 |
| Income tax and presumed minimum income tax liabilities | | 19,287 | 188 | | 11,004 | 131 |
| Taxes payables | | - | - | | 128 | 2 |
| Deferred tax liabilities | | - | - | | 93 | 1 |
| Defined benefit plans | | 2,419 | 24 | | 1,460 | 17 |
| Borrowings | | 139,630 | 1,359 | | 115,428 | 1,372 |
| Other payables | | 1,340 | 13 | | 1,418 | 17 |
| Total non-current liabilities | | 177,506 | 1,728 | | 139,018 | 1,652 |
| Provisions | | 560 | 5 | | 1,379 | 16 |
| Income tax liabilities | | 2,098 | 20 | | 897 | 11 |
| Taxes payables | | 2,314 | 23 | | 3,030 | 36 |
| Defined benefit plans | | 515 | 5 | | 298 | 4 |
| Salaries and social security payable | | 2,876 | 28 | | 1,935 | 23 |
| Derivative financial instruments | | 18 | 0 | | 40 | 0 |
| Borrowings | | 8,165 | 79 | | 20,377 | 242 |
| Trade and other payables | | 18,561 | 181 | | 9,778 | 116 |
| Total current liabilities | | 35,107 | 342 | | 37,734 | 448 |
| Liabilities associated to assets classified as held for sale | | - | - | | 85,898 | 1,021 |
| Total liabilities | | 212,613 | 2,070 | | 262,650 | 3,121 |
| | | | | | | |
| Total liabilities and equity | | 396,653 | 3,861 | | 411,528 | 4,890 |
| |
Pampa Energía ● Q4 21 Earning release ● 6 |
| 2.2 | Consolidated income statement |
| | | Fiscal year | | Fourth quarter |
| Figures in million | | 2021 | | 2020 | | 2021 | | 2020 |
| | | AR$ | US$ | | AR$ | US$ | | AR$ | US$ | | AR$ | US$ |
| Sales revenue | | 144,641 | 1,508 | | 76,775 | 1,073 | | 40,901 | 406 | | 23,106 | 286 |
| Cost of sales | | (91,342) | (955) | | (46,850) | (663) | | (28,690) | (289) | | (14,481) | (181) |
| | | | | | | | | | | | | |
| Gross profit | | 53,299 | 553 | | 29,925 | 410 | | 12,211 | 117 | | 8,625 | 105 |
| | | | | | | | | | | | | |
| Selling expenses | | (3,156) | (33) | | (1,828) | (26) | | (1,404) | (15) | | (472) | (6) |
| Administrative expenses | | (9,507) | (99) | | (6,588) | (93) | | (3,206) | (32) | | (1,740) | (22) |
| Exploration expenses | | (61) | - | | (29) | - | | (11) | - | | (8) | - |
| Other operating income | | 10,196 | 105 | | 3,628 | 51 | | 1,332 | 13 | | 1,122 | 14 |
| Other operating expenses | | (5,360) | (58) | | (2,550) | (36) | | (737) | (8) | | (769) | (10) |
| Impairment of financial assets | | (220) | (2) | | (560) | (9) | | 9 | 1 | | 291 | 4 |
| Impairment of PPE, intangible assets and inventories | | (332) | (4) | | (10,351) | (139) | | (160) | (2) | | (6,035) | (72) |
| Results for part. in joint businesses and associates | | 11,567 | 117 | | 6,551 | 85 | | 3,436 | 32 | | 1,741 | 19 |
| | | | | | | | | | | | | |
| Operating income | | 56,426 | 579 | | 18,198 | 243 | | 11,470 | 106 | | 2,755 | 32 |
| | | | | | | | | | | | | |
| Financial income | | 847 | 10 | | 686 | 9 | | 228 | 3 | | 157 | 1 |
| Financial costs | | (17,512) | (185) | | (12,528) | (177) | | (3,384) | (34) | | (3,930) | (50) |
| Other financial results | | (1,545) | (14) | | 6,131 | 84 | | (4,358) | (43) | | 2,778 | 36 |
| Financial results, net | | (18,210) | (189) | | (5,711) | (84) | | (7,514) | (74) | | (995) | (13) |
| | | | | | | | | | | | | |
| Profit before tax | | 38,216 | 390 | | 12,487 | 159 | | 3,956 | 32 | | 1,760 | 19 |
| | | | | | | | | | | | | |
| Income tax | | (7,301) | (77) | | (3,122) | (35) | | 485 | 6 | | (391) | (1) |
| | | | | | | | | | | | | |
| Net income for continuing operations | | 30,915 | 313 | | 9,365 | 124 | | 4,441 | 38 | | 1,369 | 18 |
| | | | | | | | | | | | | |
| Net income (loss) from discontinued operations | | (7,129) | (75) | | (49,333) | (592) | | - | - | | (47,568) | (569) |
| | | | | | | | | | | | | |
| Net income (loss) for the period | | 23,786 | 238 | | (39,968) | (468) | | 4,441 | 38 | | (46,199) | (551) |
| Attributable to the owners of the Company | | 27,097 | 273 | | (31,447) | (367) | | 4,520 | 39 | | (38,603) | (463) |
| Continuing operations | | 30,823 | 312 | | 9,952 | 132 | | 4,520 | 39 | | 1,851 | 24 |
| Discontinued operations | | (3,726) | (39) | | (41,399) | (499) | | - | - | | (40,454) | (487) |
| Attributable to the non-controlling interests | | (3,311) | (35) | | (8,521) | (101) | | (79) | (1) | | (7,596) | (88) |
| | | | | | | | | | | | | |
| Net income (loss) per share attributable to shareholders | | 19.38 | 0.20 | | (20.40) | (0.24) | | 3.26 | 0.03 | | (26.53) | (0.32) |
| From continuing operations | | 22.05 | 0.22 | | 6.46 | 0.09 | | 3.26 | 0.03 | | 1.27 | 0.02 |
| From discontinued operations | | (2.67) | (0.03) | | (26.85) | (0.32) | | - | - | | (27.804) | (0.335) |
| | | | | | | | | | | | | |
| Net income (loss) per ADR attributable to shareholders | | 484.61 | 4.88 | | (509.97) | (5.95) | | 81.51 | 0.70 | | (663.30) | (7.96) |
| From continuing operations | | 551.25 | 5.58 | | 161.39 | 2.14 | | 81.51 | 0.70 | | 31.81 | 0.41 |
| From discontinued operations | | (66.64) | (0.70) | | (671.36) | (8.09) | | - | - | | (695.11) | (8.37) |
| | | | | | | | | | | | | |
| Average outstanding common shares | | 1,397.9 | 1,397.9 | | 1,541.6 | 1,541.6 | | 1,386.3 | 1,386.3 | | 1,455.0 | 1,455.0 |
| Outstanding common shares by the end of period | | 1,386.0 | 1,386.0 | | 1,453.9 | 1,453.9 | | 1,386.0 | 1,386.0 | | 1,453.9 | 1,453.9 |
| |
Pampa Energía ● Q4 21 Earning release ● 7 |
| 2.3 | Cash and financial borrowings |
As of December 31, 2021,
in US$ million | | Cash1 | | Financial debt | | Net debt |
| | Consolidated
in FS | Ownership adjusted | | Consolidated
in FS | Ownership adjusted | | Consolidated
in FS | Ownership adjusted |
| | | | | | | | | |
| Power generation | | 261 | 257 | | 418 | 418 | | 156 | 161 |
| Petrochemicals | | - | - | | - | - | | - | - |
| Holding and others | | 91 | 91 | | - | - | | (91) | (91) |
| Oil and gas | | 220 | 220 | | 1,021 | 1,021 | | 801 | 801 |
| Total under IFRS/Restricted Group | | 573 | 568 | | 1,439 | 1,439 | | 866 | 871 |
| Affiliates at O/S2 | | 101 | 101 | | 339 | 339 | | 238 | 238 |
| Total with affiliates | | 674 | 669 | | 1,778 | 1,778 | | 1,104 | 1,109 |
Note: Financial debt includes accrued interests. 1 It includes cash and cash equivalents, financial assets at fair value with changing results and investments at amortized cost. 2 Under IFRS, the affiliates Greenwind, OldelVal, Refinor, CTBSA, Transener, and TGS are not consolidated in Pampa.
Debt transactions
Pampa’s financial debt at the consolidated level under IFRS decreased to US$1,439 million as of December 31, 2021 (-US$175 million vs. closing of 2020). In terms of net debt, the reduction amounts to US$282 million. The average interest rate for US$-bearing indebtedness was 7.8%, currency in which 99.2% of the Company’s gross debt is denominated, mainly at a fixed rate. AR$ indebtedness’s average interest rate was 33.0%. Pampa’s consolidated financial debt averaged 4.4 years.
The following chart shows principal maturity profile, net of repurchases, in million US$ by the end of Q4 21:

Note: It only considers Pampa consolidated under IFRS; it does not include affiliates TGS, OldelVal, Transener, Greenwind, CTBSA and Refinor.
In Q4 21, Pampa paid bank calls for a total of AR$546 million and borrowings for US$3.9 million. After the closing of the quarter, to finance PEPE III expansion, Pampa issued its first Green Bond4 (Series VIII CB) for a AR$3,107 million FV, at a variable interest rate of Badlar plus 2%, maturing in July 2023 with American amortization system. Moreover, Pampa paid borrowings for AR$1,178 million.
Regarding our affiliates, in Q4 21, Transener paid at maturity loans for AR$83 million and Greenwind paid US$3.5 million of the credit facility executed with IDB Invest. Moreover, CTBSA issued Series IV CB in US$-link for US$96 million at 0% nominal annual rate maturing in 36 months, paid at maturity US$33.2 million of the syndicated loan and prepaid the VRDs for US$94 million.
After the closing of the quarter, CTBSA paid at maturity US$6.4 million of the syndicated loan and Transener paid at maturity borrowings for AR$56 million.
4 For further information, see section 1.1 of this Earnings Release.
| |
Pampa Energía ● Q4 21 Earning release ● 8 |
As of this Earnings Release issuance, the Company complies with the covenants established in its debt agreements.
Summary of debt securities
Company
In million | Security | Maturity | Amount issued | Amount outstanding | Coupon |
| In US$ | | | | | |
| TGS1 | CB at discount at fixed rate | 2025 | 500 | 478 | 6.75% |
| Pampa | CB Series T at discount & fixed rate | 2023 | 500 | 390 | 7.375% |
| CB Series I at discount & fixed rate | 2027 | 750 | 636 | 7.5% |
| CB Series III at discount & fixed rate | 2029 | 300 | 293 | 9.125% |
| | | | | | |
| In US$-link | | | | | |
| CTEB1 | CB Series I | 2023 | 43 | 43 | 4% |
| CB Series IV | 2024 | 96 | 96 | 0% |
| | | | | | |
| In AR$ | | | | | |
| Pampa | CB Series VIII (Green Bond) | 2023 | 3,107 | 3,107 | Badlar Privada +2% |
| | | | | | |
| In UVA | | | | | |
| CTEB1 | CB Series II | 2024 | 65 | 65 | 4% |
Note: 1 According to IFRS, affiliates are not consolidated in Pampa’s FS.
Credit rating
The following table shows the Group’s ratings:
| Company | Agency | Rating |
| Global | Local |
| Pampa | S&P | B-1 | na |
| Moody's | Caa3 | na |
| FitchRatings2 | B- | AA (long-term)
A1+ (short-term) |
| TGS | S&P | CCC+ | na |
| Moody's | Caa3 | na |
| Transener | FitchRatings2 | na | A+ (long-term) |
| CTEB | FitchRatings2 | na | A+ |
Note: 1 Stand-alone rating. 2 Local ratings issued by FIX SCR.
| |
Pampa Energía ● Q4 21 Earning release ● 9 |
| 2.4 | Buyback of own financial securities5 |
Pampa
On December 1, 2021, Pampa’s Board of Directors approved the XI share buyback program under the following terms and conditions. However, on March 10, 2022, Pampa’s Board of Directors resolved to suspend this program as the Company’s share and ADR’s quote reached values exceeding the repurchase cap. If the conditions previously approved in the share repurchase program is reestablished, the program will be automatically restored the next business day after this event.
| | XI repurchase program |
| Maximum amount to buyback | US$30 million |
| Maximum price | AR$167/common share or US$19/ADR |
| Period in force | 120 days as from December 3, 2021 |
| Status | Suspended |
In Q4 21, the Company indirectly acquired 15 thousand ADR at an average price of US$18.0/ADR. After the closing of the quarter, the Company indirectly acquired 95 thousand ADR at an average price of US$18.4/ADR.
On the other hand, on March 3, 2022, the cancellation of 12.5 million shares (equivalent to 0.5 million ADR) became effective, which was previously approved by the Shareholders’ Meeting held on September 30, 2021.
Therefore, as of March 9, 2022, Pampa’s outstanding capital stock amounts to 1,383.6 million common shares (equivalent to 55.3 million ADR)6.
TGS
As of March 9, 2022, TGS’s outstanding capital stock amounts to 752.8 million common shares (equivalent to 150.6 million ADR).
On the other hand, in Q4 21, Pampa indirectly acquired 1.9 million ADR of TGS at an average cost of US$4.9/ADR. After the closing of the quarter, Pampa acquired 0.1 million ADR of TGS at an average cost of US$4.3/ADR. As of March 9, 2022, the Company’s direct and indirect ownership of TGS amounts to 29.3% of its issued capital stock.
Regarding debt securities, in Q4 21 TGS repurchased US$1.3 million FV of its 2025 CB. As of March 9, 2022, the outstanding 2025 CB amounted to US$477.6 million FV.
5 Deemed to be effected transactions.
6 For further information, see Ownership Breakdown.
| |
Pampa Energía ● Q4 21 Earning release ● 10 |
| 3. | Analysis of the Q4 21 results |
Breakdown by segment
Figures in US$ million | Q4 21 | Q4 20 | Variation |
| Sales | Adjusted EBITDA | Net Income | Sales | Adjusted EBITDA | Net Income | Sales | Adjusted EBITDA | Net Income |
| | | | | | | | | | |
| Power generation | 155 | 105 | 31 | 150 | 121 | 20 | +3% | -13% | +55% |
| Oil and Gas | 119 | 46 | (5) | 68 | 19 | 2 | +75% | +146% | NA |
| Petrochemicals | 144 | 9 | 4 | 87 | 10 | 5 | +66% | -11% | -20% |
| Holding and Others | 7 | 39 | 9 | 3 | 34 | (3) | +133% | +13% | NA |
| Eliminations | (19) | - | - | (22) | - | - | -14% | NA | NA |
| | | | | | | | | | |
| Subtotal continuing operations | 406 | 199 | 39 | 286 | 184 | 24 | +42% | +8% | +63% |
| | | | | | | | | | |
| Electricity distribution (discont.) | - | - | - | - | (16) | (487) | NA | -100% | -100% |
| | | | | | | | | | |
| Total | 406 | 199 | 39 | 286 | 168 | (463) | +42% | +18% | NA |
Note: Net income attributable to the Company’s shareholders.
| 3.1 | Reconciliation of consolidated adjusted EBITDA |
Reconciliation of consolidated adjusted EBITDA,
in US$ million | | Fiscal year | | Fourth quarter |
| | 2021 | 2020 | | 2021 | 2020 |
| Consolidated operating income | | 579 | 243 | | 106 | 32 |
| Consolidated depreciations and amortizations | | 205 | 205 | | 58 | 52 |
| EBITDA | | 784 | 448 | | 164 | 84 |
| | | | | | | |
| Adjustments from generation segment | | 29 | 126 | | 8 | 60 |
| Deletion of equity income | | (47) | (67) | | (15) | (30) |
| Deletion of PPE & intangible assets' impairment | | 2 | 128 | | - | 72 |
| Deletion of provision recovery of PEPE IV surety bond | | (13) | (7) | | - | - |
| Deletion of gain from commercial interests | | (24) | (23) | | (4) | (6) |
| Deletion of outage provision at GEBATG03 | | 8 | - | | - | - |
| Deletion of PPE's impairment | | 14 | - | | 5 | - |
| Greenwind's EBITDA adjusted by ownership | | 11 | 12 | | 3 | 3 |
| CTBSA's EBITDA adjusted by ownership | | 78 | 83 | | 19 | 21 |
| Adjustments from oil and gas segment | | 13 | 9 | | 0 | (1) |
| Deletion of gain from commercial interests | | (3) | (4) | | (0) | (2) |
| Deletion of provision for environmental remediation | | 14 | - | | - | - |
| Deletion of impairment of receivables from distCos | | - | 13 | | - | - |
| OldelVal's EBITDA adjusted by ownership | | 1 | 1 | | 0 | 0 |
| Adjustments from petrochemicals segment | | 2 | 11 | | 2 | (0) |
| Deletion of inventory impairment | | 2 | 11 | | 2 | - |
| Deletion of gain from commercial interests | | (0) | (0) | | (0) | (0) |
| Adjustments from holding and others segment | | 77 | 104 | | 25 | 41 |
| Deletion of equity income | | (70) | (18) | | (17) | 11 |
| Deletion of gain from commercial interests | | (0) | (2) | | (0) | (0) |
| Deletion of contigencies provision | | 12 | - | | - | - |
| Deletion of executive compensation liabilities' reversal | | (7) | - | | - | - |
| TGS's EBITDA adjusted by ownership | | 123 | 98 | | 39 | 25 |
| Transener's EBITDA adjusted by ownership | | 14 | 27 | | 2 | 5 |
| Refinor's EBITDA adjusted by ownership | | 5 | (1) | | 1 | (0) |
| | | | | | | |
| Consolidated adjusted EBITDA, continuing op. | | 905 | 698 | | 199 | 184 |
| At our ownership | | 905 | 694 | | 200 | 184 |
| | | | | | | |
| + Discontinued op. EBITDA: Edenor | | 17 | 51 | | - | (16) |
| | | | | | | |
| Consolidated adjusted EBITDA, cont. and discont. op. | | 921 | 749 | | 199 | 168 |
| At our ownership | | 911 | 722 | | 200 | 175 |
| |
Pampa Energía ● Q4 21 Earning release ● 11 |
| 3.2 | Analysis of the power generation segment |
Power generation segment, consolidated
Figures in US$ million | | Fiscal year | | Fourth quarter |
| | 2021 | 2020 | ∆% | | 2021 | 2020 | ∆% |
| Sales revenue | | 656 | 559 | +17% | | 155 | 150 | +3% |
| Cost of sales | | (355) | (254) | +40% | | (89) | (73) | +22% |
| | | | | | | | | |
| Gross profit | | 301 | 305 | -1% | | 66 | 77 | -14% |
| | | | | | | | | |
| Selling expenses | | (2) | (2) | - | | (1) | (1) | - |
| Administrative expenses | | (31) | (30) | +3% | | (10) | (8) | +25% |
| Other operating income | | 42 | 35 | +20% | | 6 | 10 | -40% |
| Other operating expenses | | (5) | (6) | -17% | | (1) | (1) | - |
| Impairment of PPE and intangible assets | | (2) | (128) | -98% | | - | (72) | -100% |
| Results for participation in joint businesses | | 47 | 67 | -30% | | 15 | 30 | -50% |
| | | | | | | | | |
| Operating income | | 350 | 241 | +45% | | 75 | 35 | +114% |
| | | | | | | | | |
| Finance income | | 4 | 3 | +33% | | 1 | - | NA |
| Finance costs | | (46) | (73) | -37% | | (14) | (31) | -55% |
| Other financial results | | (14) | 1 | NA | | (27) | 2 | NA |
| Financial results, net | | (56) | (69) | -19% | | (40) | (29) | +38% |
| | | | | | | | | |
| Profit (loss) before tax | | 294 | 172 | +71% | | 35 | 6 | NA |
| | | | | | | | | |
| Income tax | | (75) | (33) | +127% | | (5) | 8 | NA |
| | | | | | | | | |
| Net income (loss) for the period | | 219 | 139 | +58% | | 30 | 14 | +114% |
| Attributable to owners of the Company | | 218 | 147 | +48% | | 31 | 20 | +55% |
| Attributable to non-controlling interests | | 1 | (8) | NA | | (1) | (6) | -83% |
| | | | | | | | | |
| Adjusted EBITDA | | 467 | 462 | +1% | | 105 | 121 | -13% |
| Adjusted EBITDA at our share ownership | | 467 | 458 | +2% | | 106 | 121 | -12% |
| | | | | | | | | |
| Increases in PPE, intangible and right-of-use assets | | 39 | 61 | -36% | | 32 | 9 | +256% |
| Depreciation and amortization | | 88 | 95 | -7% | | 22 | 26 | -15% |
In Q4 21, the US$5 million year-on-year increase in sales is mainly explained by the additional and transitionary income for legacy energy (SE Res. No. 1037/21), and the recovery of industrial demand and Energía Plus prices, partially offset by the maturity of PPA at the ST of CTLL and at CTP, billed under spot energy as from November 1 and July 15, 2021, respectively.
Even though spot energy comprises 63% of the 4,970 MW operated by Pampa7, it represented 30% of the segment’s sales in Q4 21. SE Res. No. 1037/21 established that CAMMESA should pay 100% of the power capacity remuneration, assuming a 70% load factor, plus an additional amount for the electricity exported by CAMMESA, retroactive to September 1, 2021 and until February 28, 2022. Thanks to this transitionary income, the power capacity remuneration was US$3.6 thousand/MW-month for our thermal legacy units and US$1.9 thousand/MW-month for hydros, being 23% and 5% higher than Q4 20, respectively. However, a higher increase of AR$-denominated costs was recorded in certain units as the inflation was higher than the AR$ devaluation.
Revenues from fuel were slightly higher than Q4 20 as the increase in prices due to Plan Gas.Ar was offset by lower volume as a consequence of the programmed maintenance at the second CCGT of CTGEBA. It is worth mentioning that this income, which also affects the cost of sales due to gas purchases to our E&P, only applies to PPA under SEE Res. No. 287/17 and Energía Plus contracts. CAMMESA provides directly the remaining gas and liquid fuel consumed to dispatch our thermal units, without representing any revenues or costs for the Company.
In operating terms, the power generation operated by Pampa increased by 6% vs. Q4 20, similar to the national demand growth (+6.5%), whereas the nationwide generation increased only 1%. From units
7 Under IFRS, CTEB (567 MW) and PEMC (100 MW) are affiliates; their results are not consolidated in the FS, but they are operated by Pampa and their EBITDA at our equity stake are included in Pampa’s adjusted EBITDA.
| |
Pampa Energía ● Q4 21 Earning release ● 12 |
operated by Pampa, there was a higher dispatch at almost all our thermal units (+665 GWh), except for the CCGT at CTLL and the new CCGT at CGEBA, affected by programmed maintenance (-288 GWh), and the engines CTPP and CTIW due to lower exports from the SADI (-27 GWh). Moreover, there was lower hydroelectric generation (-65 GWh) and wind generation (-16 GWh) due to lower water inputs and wind resources, respectively.
In Q4 21, all power units operated by Pampa reached an average availability rate of 95.5%, slightly higher than the 94.2% recorded in Q4 20, mainly explained by the forced outage at CTG’s Plus unit and the programmed maintenance at CTEB in Q4 20, partially offset by the programmed maintenance at CTLL’s CCGT and the new CCGT at CTGEBA in Q4 21. Especially, thermal units recorded an availability of 98.2% (Q4 21) and 98.1% (Q4 20).
| Power generation's key performance indicators | | 2021 | | 2020 | | Variation |
| Hydro | Wind | Thermal | Total | Hydro | Wind | Thermal | Total | Hydro | Wind | Thermal | Total |
| Installed capacity as of Dec (MW) | | 938 | 206 | 3,826 | 4,970 | | 938 | 206 | 3,811 | 4,955 | | - | - | +0% | +0% |
| New capacity (%) | | - | 100% | 43% | 37% | | - | 100% | 48% | 41% | | - | - | -6% | -4% |
| Market share (%) | | 2% | 0% | 9% | 12% | | 2% | 0% | 9% | 12% | | -0% | -0% | -0% | -0% |
| | | | | | | | | | | | | | | | |
| Fiscal year | | | | | | | | | | | | | | | |
| Net generation (GWh) | | 1,343 | 838 | 15,252 | 17,433 | | 1,546 | 859 | 14,065 | 16,470 | | -13% | -2% | +8% | +6% |
| Volume sold (GWh) | | 1,342 | 870 | 16,246 | 18,458 | | 1,542 | 862 | 14,159 | 16,563 | | -13% | +1% | +15% | +11% |
| | | | | | | | | | | | | | | | |
| Average price (US$/MWh) | | 22 | 70 | 47 | 46 | | 22 | 71 | 47 | 46 | | -1% | -0% | -1% | -0% |
| Average gross margin (US$/MWh) | | 4 | 58 | 31 | 30 | | 10 | 63 | 36 | 35 | | -64% | -8% | -15% | -14% |
| | | | | | | | | | | | | | | | |
| Fourth quarter | | | | | | | | | | | | | | | |
| Net generation (GWh) | | 419 | 195 | 4,055 | 4,670 | | 485 | 211 | 3,705 | 4,400 | | -13% | -7% | +9% | +6% |
| Volume sold (GWh) | | 419 | 203 | 4,405 | 5,028 | | 486 | 214 | 3,727 | 4,427 | | -14% | -5% | +18% | +14% |
| | | | | | | | | | | | | | | | |
| Average price (US$/MWh) | | 18 | 71 | 42 | 41 | | 15 | 72 | 48 | 46 | | +21% | -1% | -12% | -9% |
| Average gross margin (US$/MWh) | | -3 | 57 | 27 | 26 | | 3 | 64 | 35 | 33 | | -204% | -11% | -22% | -21% |
Note: Gross margin before amortization and depreciation. It includes CTEB and PEMC, operated by Pampa (50% of equity stake).
Q4 21 net operating costs, excluding depreciation and amortizations, increased by 55% vs. Q4 20, mainly explained by higher energy purchases to cover the rise in Plus demand, increase in material and wage expenses as the inflation and wage evolutions were higher than the AR$ devaluation, and lower commercial interests due to collection delays received from CAMMESA as it improved the days sales outstanding. Moreover, in Q4 21 PPE impairments were charged at certain legacy energy units (US$5 million).
The Q4 21 financial results amounted to a net loss of US$40 million, US$11 million higher than Q4 20, mainly explained by losses from the holding of financial securities in Q4 21, partially offset by lower financial interests due to lower stock of debt and allocation to the segment.
In Q4 21, our power generation’s adjusted EBITDA amounted to US$105 million, 13% lower vs. Q4 20, mainly due to the PPA maturity at the ST of CTLL, partially offset by the additional and transitionary income for legacy energy, and the Energía Plus’s increased margins. The adjusted EBITDA considers our proportional 50% stake of CTEB (CTBSA), contributing US$19 million in Q4 21 (vs. US$21 million in Q4 20), and a 50% stake of PEMC (Greenwind), contributing US$3 million in Q4 21 (the same as Q4 20). Moreover, the adjusted EBITDA excludes the recognition of commercial interests from delayed receivables, mostly from CAMMESA (US$4 million in Q4 21 and US$6 million in Q4 20), in addition to the PPE impairment charged as operating expenses in Q4 21 (US$ 5 million).
Finally, capital expenditures in Q4 21, excluding CTEB and PEMC, increased by US$23 million vs. Q4 20, mainly explained by PEPE III’s expansion project.
| |
Pampa Energía ● Q4 21 Earning release ● 13 |
Regarding our expansion projects, the following summary shows the current status:
| Project | MW | Marketing | Currency | Awarded price | | Estimated capex in
US$ million1 | Date of
commissioning |
Capacity per
MW-month | Variable
per MWh | Total
per MWh | | Budget | % Executed
@12/31/21 |
| Thermal | | | | | | | | | | |
| Loma de la Lata | 15 | SE Res. No. 440/21 | AR$ | 208,980 - 551,475(2) | 418 | 939 | | 22 | 90% | August 3, 2021 |
| Closing to CCGT Genelba Plus | 400 | PPA for 15 years | US$ | 20,500 | 6 | 34 | | 350 | 90% | OC: June 12, 2019(3)
CC: July 2, 2020 |
| Closing to CCGT Ensenada | 280 | PPA for 10 years | US$ | 23,962 | 10.5 | 43 | | 213 | 76% | Q3 2022 (est.) |
| | | | | | | | | | | |
| Renewable | | | | | | | | | | |
| Pampa Energía III | 81 | MAT ER | US$ | na | na | 58(4) | | 128 | 0% | Q2 2023 (est.) |
Note: 1 Amount without value-added tax. 2 It considers the range of load factor coefficient and the HMRT additional remuneration.
3 201 MW were remunerated under spot energy until July 1, 2020. 4 Estimated average.
| 3.3 | Analysis of the oil and gas segment |
Oil & gas segment, consolidated
Figures in US$ million | | Fiscal year | | Fourth quarter |
| | 2021 | 2020 | ∆% | | 2021 | 2020 | ∆% |
| Sales revenue | | 453 | 294 | +54% | | 119 | 68 | +75% |
| Cost of sales | | (289) | (243) | +19% | | (89) | (58) | +53% |
| | | | | | | | | |
| Gross profit | | 164 | 51 | +222% | | 30 | 10 | +200% |
| | | | | | | | | |
| Selling expenses | | (18) | (15) | +20% | | (10) | (2) | NA |
| Administrative expenses | | (46) | (42) | +10% | | (14) | (10) | +40% |
| Other operating income | | 58 | 9 | NA | | 6 | 3 | +100% |
| Other operating expenses | | (28) | (17) | +65% | | (2) | (6) | -67% |
| Impairment of financial assets | | - | (13) | -100% | | 1 | - | NA |
| | | | | | | | | |
| Operating income (loss) | | 130 | (27) | NA | | 11 | (5) | NA |
| | | | | | | | | |
| Finance income | | 3 | 7 | -57% | | 1 | 2 | -50% |
| Finance costs | | (103) | (100) | +3% | | (17) | (18) | -6% |
| Other financial results | | (16) | 44 | NA | | (10) | 23 | NA |
| Financial results, net | | (116) | (49) | +137% | | (26) | 7 | NA |
| | | | | | | | | |
| Profit (loss) before tax | | 14 | (76) | NA | | (15) | 2 | NA |
| | | | | | | | | |
| Income tax | | 8 | 23 | -65% | | 10 | - | NA |
| | | | | | | | | |
| Net income (loss) for the period | | 22 | (53) | NA | | (5) | 2 | NA |
| | | | | | | | | |
| Adjusted EBITDA | | 257 | 90 | +184% | | 46 | 19 | +146% |
| | | | | | | | | |
| Increases in PPE and intangible assets | | 213 | 41 | NA | | 67 | 7 | NA |
| Depreciation and amortization | | 114 | 108 | +6% | | 35 | 25 | +40% |
In Q4 21, our oil and gas sales increased by US$51 million vs. Q4 20, mainly explained by the Plan Gas.Ar GSA (higher sale price and volume), the recovery of natural gas demand and prices on the industrial segment, and the substantial growth of gas exported to Chile at higher prices than local market, and to a lesser extent, the increase of oil price.
In operating terms, in Q4 21, our oil and gas segment total production registered 58.1 kboe/day (+33% vs. Q4 20 and +1% vs. Q3 21). Gas production reached 9.0 million m3/day (+34% vs. Q4 20 and +1% vs. Q3 21), mainly explained by the activity resumption as a result of Plan Gas.Ar. In particular, a significant growth was recorded at El Mangrullo, reaching a new record production of 6.3 million m3/day in Q4 21 (+39% vs. Q4 20 and +2% vs. Q3 21), comprising 70% of our total gas production. A significant production increase was also recorded at Río Neuquén, (1.5 million m3/day in Q4 21, +84% vs. Q4 20 and
| |
Pampa Energía ● Q4 21 Earning release ● 14 |
+8% vs. Q3 21). These effects were partially offset by reduced output at Rincón del Mangrullo, due to lower activity and natural decline (0.4 million m3/day in Q4 21, -34% year-on-year and -19% vs. Q3 21).
Our accrued gas average sale price was US$3.1/MBTU in Q4 21 (+47% vs. Q4 20), mainly explained by the Plan Gas.Ar8, the gradual convergence of the industrial/spot prices to the Plan Gas.Ar and the high prices from exports to Chile. Moreover, 40% of our gas deliveries went to the industrial/spot market, 22% was consumed as raw material for our thermal power plants9 and our petrochemical plants, 21% was exported and 15% was destined to the residential segment. The marginal balance was sold directly to CAMMESA. On the other hand, in Q4 20, 52% of the deliveries were destined to CAMMESA’s spot tenders, 40% went to our thermal power plants and petrochemicals, and the balance to the industrial/spot segment.
Oil production reached 5.2 kbbl/day in Q4 21 (+20% vs. Q4 20 and +9% vs. Q3 21), mainly due to the domestic demand recovery, offset by lower exports. Production increased at El Tordillo, Río Neuquén and Gobernador Ayala (4.5 kbbl/day in Q4 21, +29% year-on-year). Moreover, 93% of the volume sold during Q4 21 was destined to the domestic market (vs. 86% in Q4 20). Our accrued oil average sale price in Q4 21 increased year-on-year by 42% to US$58.6/bbl, explained by the rise of Brent but moderated by local prices.
Oil and gas'
key performance indicators | | 2021 | | 2020 | | Variation |
| Oil | Gas | Total | Oil | Gas | Total | Oil | Gas | Total |
| Fiscal year | | | | | | | | | | | | |
| Volume | | | | | | | | | | | | |
| Production | | | | | | | | | | | | |
| In thousand m3/day | | 0.7 | 8,004 | | | 0.7 | 6,902 | | | +6% | +16% | +15% |
| In million cubic feet/day | | | 283 | | | | 244 | | |
| In thousand boe/day | | 4.7 | 47.1 | 51.8 | | 4.4 | 40.6 | 45.1 | |
| Sales | | | | | | | | | | | | |
| In thousand m3/day | | 0.7 | 8,122 | | | 0.7 | 7,190 | | | +1% | +13% | +12% |
| In million cubic feet/day | | | 287 | | | | 254 | | |
| In thousand boe/day | | 4.6 | 47.8 | 52.4 | | 4.6 | 42.3 | 46.9 | |
| | | | | | | | | | | | | |
| Average Price | | | | | | | | | | | | |
| In US$/bbl | | 58.8 | | | | 39.0 | | | | +51% | +61% | |
| In US$/MBTU | | | 3.6 | | | | 2.2 | | | |
| | | | | | | | | | | | | |
| Fourth quarter | | | | | | | | | | | | |
| Volume | | | | | | | | | | | | |
| Production | | | | | | | | | | | | |
| In thousand m3/day | | 0.8 | 8,987 | | | 0.7 | 6,683 | | | +20% | +34% | +33% |
| In million cubic feet/day | | | 317 | | | | 236 | | |
| In thousand boe/day | | 5.2 | 52.9 | 58.1 | | 4.3 | 39.3 | 43.7 | |
| Sales | | | | | | | | | | | | |
| In thousand m3/day | | 0.7 | 8,962 | | | 0.7 | 6,772 | | | +1% | +32% | +29% |
| In million cubic feet/day | | | 316 | | | | 239 | | |
| In thousand boe/day | | 4.7 | 52.7 | 57.4 | | 4.7 | 39.9 | 44.5 | |
| | | | | | | | | | | | | |
| Average Price | | | | | | | | | | | | |
| In US$/bbl | | 58.6 | | | | 41.3 | | | | +42% | +47% | |
| In US$/MBTU | | | 3.1 | | | | 2.1 | | | |
Note: Net production in Argentina. Gas volume standardized at 9,300 kilocalories (kCal).
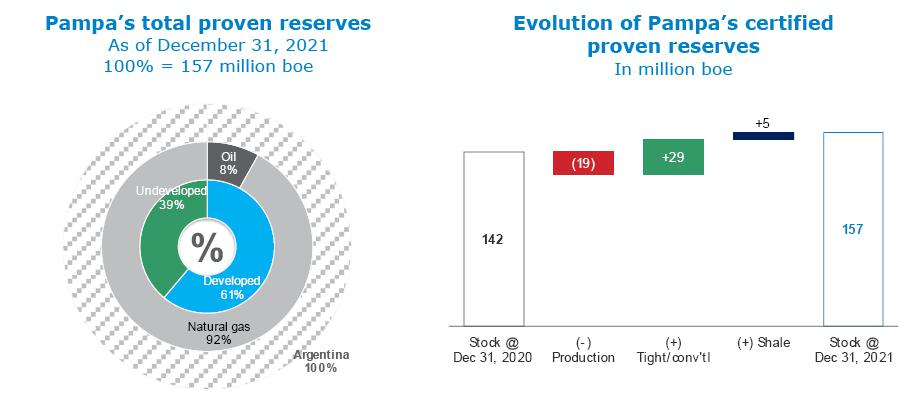
As of December 31, 2021, we accounted for 884 productive wells, 26 more than December 31, 2020. Moreover, Pampa’s proven reserves by the end of 2021 amounted to 157 million boe, 11% higher than 2020’s end of year. Besides, we recorded shale reserves from the Vaca Muerta formation 40% higher than
8 A 4-year contract until December 2024 to supply gas to power plants and the retail segment, at price of US$4.5/MBTU during the winter period (May to September) and US$3.0/MBTU for the rest of the year.
9 Energía Plus and SEE Res. No. 287/17.
| |
Pampa Energía ● Q4 21 Earning release ● 15 |
the volume certified in 2020. Considering the production levels and additional reserves achieved in 2021, the replacement ratio amounted to 1.8 and the average reserve life was 8.4 years approximately.
Net operating costs in Q4 21, excluding depreciation and amortizations as well as Plan Gas.Ar, increased by 63% vs. Q4 20, mainly due to higher gas activity (contractors and maintenance), the increase in gas transportation expenses due to higher exports, more royalties and levies from higher volume and prices sold, and higher wages expenses as the wage evolution was higher than the AR$ devaluation. Compared to Q3 21, net operating costs increased 9%, mainly due to higher gas activity and the increase in the transportation costs from gas exports, partially offset by lower royalties and levies due to price seasonality and increase of oil stock, exported in January 2022. In particular, the lifting cost10 reached US$7.8 per produced boe in Q4 21, 29% higher than the US$6.0/boe recorded in Q4 20 and Q3 21.
In Q4 21, financial results reached a net loss of US$26 million, whereas a US$7 million net gain was recorded in Q4 20, mainly because of profits from the holding of financial securities in Q4 20, and to a lesser extent, higher financial interests due to higher allocation to the segment (offset by lower stock of debt).
Our oil and gas’ adjusted EBITDA amounted to US$46 million in Q4 21 vs. US$19 million in Q4 20, mainly explained by the Plan Gas.Ar effect over natural gas volume and price sold, in addition to higher oil price, partially offset by the increase in expenses related to the resumption of gas activity and its exports. The adjusted EBITDA excludes the recognition of commercial interest due to collection delays, mostly charged to CAMMESA (US$0.3 million in Q4 21 and US$2 million in Q4 21).
Finally, the segment’s capital expenditures amounted to US$67 million in Q4 21, whereas US$7 million was recorded in Q4 20, mainly explained by the commitments under Plan Gas.Ar, which reactivated drilling and completion activities at gas-bearing blocks.
10 Metric equivalent to cost of sales excluding purchase and inventory, royalties, direct taxes and depreciations and amortizations.
| |
Pampa Energía ● Q4 21 Earning release ● 16 |
| 3.4 | Analysis of the petrochemicals segment |
Petrochemicals segment, consolidated
Figures in US$ million | | Fiscal year | | Fourth quarter |
| | 2021 | 2020 | ∆% | | 2021 | 2020 | ∆% |
| Sales revenue | | 490 | 267 | +84% | | 144 | 87 | +66% |
| Cost of sales | | (424) | (233) | +82% | | (130) | (72) | +81% |
| | | | | | | | | |
| Gross profit | | 66 | 34 | +94% | | 14 | 15 | -7% |
| | | | | | | | | |
| Selling expenses | | (13) | (9) | +44% | | (4) | (3) | +33% |
| Administrative expenses | | (4) | (3) | +33% | | (1) | - | NA |
| Other operating income | | 1 | - | NA | | - | (1) | -100% |
| Other operating expenses | | (3) | (6) | -50% | | (1) | (2) | -50% |
| Recovery of financial assets impairment | | - | 1 | -100% | | - | - | NA |
| Impairment of inventories | | (2) | (11) | -82% | | (2) | - | NA |
| | | | | | | | | |
| Operating income (loss) | | 45 | 6 | NA | | 6 | 9 | -33% |
| | | | | | | | | |
| Finance costs | | (3) | (3) | - | | (1) | (1) | - |
| Other financial results | | (2) | 5 | NA | | - | (1) | -100% |
| Financial results, net | | (5) | 2 | NA | | (1) | (2) | -50% |
| | | | | | | | | |
| Profit (loss) before tax | | 40 | 8 | NA | | 5 | 7 | -29% |
| | | | | | | | | |
| Income tax | | (12) | (2) | NA | | (1) | (2) | -50% |
| | | | | | | | | |
| Net income (loss) for the period | | 28 | 6 | NA | | 4 | 5 | -20% |
| | | | | | | | | |
| Adjusted EBITDA | | 50 | 19 | +164% | | 9 | 10 | -11% |
| | | | | | | | | |
| Increases in PPE and intangible assets | | 6 | 3 | +100% | | 1 | 2 | -50% |
| Depreciation and amortization | | 3 | 2 | +50% | | 1 | 1 | - |
The adjusted EBITDA of the petrochemicals segment amounted to US$9 million in Q4 21, slightly lower than Q4 20. The higher costs of virgin naphtha and other raw materials (driven by international reference prices) and the Plan Gas.Ar effect over the cost of gas were partially offset by the substantial price improvement, both domestic and international, and the recovery of demand, mainly in the local market. Quarter-on-quarter, adjusted EBITDA increased by US$2 million, explained by better international reference prices, lower costs of gas due to off-peak period, and higher volume sold of styrene and polystyrene in the domestic market.
Total volume sold increased by 6% vs. Q4 20, mainly explained by the increase of reforming products sales in the domestic market due to higher gasoline consumption (offset by lower exports), as well as higher domestic and foreign demand of styrene and polystyrene. It is worth mentioning that, in Q4 21, 6 thousand ton of bases and gasoline were dispatched as toll processing, which were not recorded as volume sold. The amounts corresponding to Pampa are shown below:
| |
Pampa Energía ● Q4 21 Earning release ● 17 |
Petrochemicals'
key performance indicators | | Products | | Total |
| | Styrene & polystyrene1 | SBR | Reforming | |
| Fiscal year | | | | | | |
| Volume sold 2021 (thousand ton) | | 114 | 49 | 254 | | 417 |
| Volume sold 2020 (thousand ton) | | 94 | 37 | 205 | | 337 |
| Variation 2021 vs. 2020 | | +21% | +32% | +24% | | +24% |
| | | | | | | |
| Average price 2021 (US$/ton) | | 1,778 | 2,003 | 741 | | 1,175 |
| Average price 2020 (US$/ton) | | 1,195 | 1,302 | 503 | | 786 |
| Variation 2021 vs. 2020 | | +49% | +54% | +47% | | +50% |
| | | | | | | |
| Fourth quarter | | | | | | |
| Volume sold Q4 21 (thousand ton) | | 33 | 11 | 70 | | 114 |
| Volume sold Q4 20 (thousand ton) | | 29 | 11 | 68 | | 107 |
| Variation Q4 21 vs. Q4 20 | | +14% | +3% | +4% | | +6% |
| | | | | | | |
| Average price Q4 21 (US$/ton) | | 1,846 | 2,318 | 831 | | 1,266 |
| Average price Q4 20 (US$/ton) | | 1,252 | 1,401 | 506 | | 795 |
| Variation Q4 21 vs. Q4 20 | | +47% | +65% | +64% | | +59% |
Note: 1 It includes Propylene.
In Q4 21, financial results reached a net loss of US$1 million (US$1 million improvement vs. Q4 20), mainly explained by losses from the holding of financial securities and FX net difference in Q4 20.
The capital expenditures reached US$1 million in Q4 21 and US$2 million in Q4 20.
| 3.5 | Analysis of the holding and others segment |
Holding and others segment, consolidated
Figures in US$ million | | Fiscal year | | Fourth quarter |
| | 2021 | 2020 | ∆% | | 2021 | 2020 | ∆% |
| Sales revenue | | 22 | 20 | +10% | | 7 | 3 | +133% |
| | | | | | | | | |
| Gross profit | | 22 | 20 | +10% | | 7 | 3 | +133% |
| | | | | | | | | |
| Administrative expenses | | (18) | (18) | - | | (7) | (4) | +75% |
| Other operating income | | 4 | 7 | -43% | | 1 | 2 | -50% |
| Other operating expenses | | (22) | (7) | +214% | | (4) | (1) | +300% |
| Impairment of financial assets | | (2) | 3 | NA | | - | 4 | -100% |
| Results for participation in joint businesses | | 70 | 18 | +289% | | 17 | (11) | NA |
| | | | | | | | | |
| Operating income (loss) | | 54 | 23 | +135% | | 14 | (7) | NA |
| | | | | | | | | |
| Finance income | | 4 | 1 | +300% | | 2 | - | NA |
| Finance costs | | (34) | (3) | NA | | (3) | (1) | +200% |
| Other financial results | | 18 | 34 | -47% | | (6) | 12 | NA |
| Financial results, net | | (12) | 32 | NA | | (7) | 11 | NA |
| | | | | | | | | |
| Profit (loss) before tax | | 42 | 55 | -24% | | 7 | 4 | +75% |
| | | | | | | | | |
| Income tax | | 2 | (23) | NA | | 2 | (7) | NA |
| | | | | | | | | |
| Net income for the period | | 44 | 32 | +38% | | 9 | (3) | NA |
| | | | | | | | | |
| Adjusted EBITDA | | 131 | 127 | +3% | | 39 | 34 | +13% |
| | | | | | | | | |
| Increases in PPE | | 2 | 2 | +10% | | 1 | 1 | - |
| Depreciation and amortization | | - | - | NA | | - | - | NA |
In the holding and others segment, without considering the equity income from affiliates (Transener, TGS and Refinor), we recorded a US$3 million operating loss, whereas in Q4 20 a US$4 million profit was recorded, mainly explained by higher provision for contingencies, partially offset by higher accrued fees.
| |
Pampa Energía ● Q4 21 Earning release ● 18 |
The Q4 21 financial results amounted to a net loss of US$7 million, whereas in Q4 20 was a net gain of US$11 million, mainly due to FX net difference losses in Q4 21 as a result of lower devaluation over the net passive monetary position in AR$, in addition to the interests related to contingencies from the tax of presumed minimum profit.
The adjusted EBITDA of our holding and others increased by 13%, recording US$39 million in Q4 21. The adjusted EBITDA excludes commercial interests (marginal) and the equity income from our participation in TGS, Transener and Refinor. In turn, it adds the EBITDA adjusted by equity ownership in these businesses.
The EBITDA from our direct and indirect ownership of 29.2% and 27.7% in TGS were US$39 million (US$133 million at 100%) in Q4 21 vs. US$25 million (US$91 million at 100%) in Q4 20. The increase of total adjusted EBITDA was mainly explained by higher international reference prices of natural gasoline and LPG, higher LPG export volume, the increase in ethane price and more midstream revenues from natural gas transportation and conditioning service in Vaca Muerta. These effects were partially offset by the higher US$ unit cost of natural gas, which is used to replace thermal reduction at Cerri Complex Plant, and lower regulated revenues due to the lack of tariff adjustment since April 2019 and the AR$ devaluation, in addition to a higher export duties charge.
In Transener, the EBITDA adjusted by our indirect stake ownership of 26.3% decreased to US$2 million (US$8 million at 100%) in Q4 21 vs. US$5 million (US$19 million at 100%) in Q4 20, mainly because of the lack of tariff adjustment, frozen as from August 2019, and devaluation effect.
In Refinor, the EBITDA adjusted by our stake ownership of 28.5% in Q4 21 recorded a gain of US$1 million (US$3 million at 100%), whereas in Q4 20 was marginal. The increase is mainly explained by the gradual recovery of demand and higher sales prices, partially offset by increased crude oil costs, which is the refinery’s main raw material.
| |
Pampa Energía ● Q4 21 Earning release ● 19 |
| 3.6 | Analysis of the fiscal year, by subsidiary and segment |
Subsidiary
In US$ million | Fiscal year 2021 | | Fiscal year 2020 |
| % Pampa | Adjusted EBITDA | Net debt2 | Net income3 | | % Pampa | Adjusted EBITDA | Net debt2 | Net income3 |
| |
| Power generation segment | | | | | | | | | |
| Diamante | 61.0% | 4 | (6) | 4 | | 61.0% | 6 | (2) | (3) |
| Los Nihuiles | 52.0% | (3) | (5) | (1) | | 52.0% | 4 | (10) | (13) |
| | | | | | | | | | |
| Greenwind | | 22 | 72 | (4) | | | 24 | 90 | 5 |
| Non-controlling stake adjustment | | (11) | (36) | 2 | | | (12) | (45) | (3) |
| Subtotal Greenwind adjusted by ownership | 50.0% | 11 | 36 | (2) | | 50.0% | 12 | 45 | 3 |
| | | | | | | | | | |
| CTBSA | | 156 | 220 | 98 | | | 165 | 202 | 129 |
| Non-controlling stake adjustment | | (78) | (110) | (49) | | | (83) | (101) | (65) |
| Subtotal CTBSA adjusted by ownership | 50.0% | 78 | 110 | 49 | | 50.0% | 83 | 101 | 65 |
| | | | | | | | | | |
| Pampa stand-alone, other companies, adjs. & deletions1 | 100.0% | 378 | 167 | 168 | | 100% | 358 | 465 | 96 |
| Subtotal power generation | | 467 | 302 | 218 | | | 462 | 598 | 147 |
| | | | | | | | | | |
| Oil & gas segment | | | | | | | | | |
| OldelVal | | 61 | (27) | 25 | | | 55 | (10) | 24 |
| Non-controlling stake adjustment | | (60) | 26 | (24) | | | (54) | 9 | (24) |
| Subtotal OldelVal adjusted by ownership | 2.1% | 1 | (1) | 1 | | 2.1% | 1 | (0) | 1 |
| | | | | | | | | | |
| Pampa stand-alone, other companies, adjs. & deletions1 | | 255 | 801 | 21 | | | 89 | 744 | (54) |
| Subtotal oil & gas | | 257 | 801 | 22 | | | 90 | 744 | (53) |
| | | | | | | | | | |
| Petrochemicals segment | | | | | | | | | |
| Pampa Energía | 100.0% | 50 | - | 28 | | 100.0% | 19 | - | 6 |
| Subtotal petrochemicals | | 50 | - | 28 | | | 19 | - | 6 |
| | | | | | | | | | |
| Holding & others segment | | | | | | | | | |
| Transener | | 54 | (31) | (13) | | | 102 | (9) | 49 |
| Non-controlling stake adjustment | | (40) | 22 | 9 | | | (75) | 6 | (36) |
| Subtotal Transener adjusted by ownership | 26.3% | 14 | (8) | (3) | | 26.3% | 27 | (2) | 13 |
| | | | | | | | | | |
| TGS | | 425 | 310 | 204 | | | 356 | 406 | 39 |
| Non-controlling stake adjustment | | (302) | (220) | (145) | | | (257) | (294) | (28) |
| Subtotal TGS adjusted by ownership | 29.2% | 123 | 90 | 59 | | 27.7% | 98 | 113 | 11 |
| | | | | | | | | | |
| Refinor | | 17 | 35 | (4) | | | (4) | 27 | (8) |
| Non-controlling stake adjustment | | (12) | (25) | 3 | | | 3 | (19) | 6 |
| Subtotal Refinor adjusted by ownership | 28.5% | 5 | 10 | (1) | | 28.5% | (1) | 8 | (2) |
| | | | | | | | | | |
| Pampa stand-alone, other companies, adjs. & deletions1 | 100% | (11) | (91) | (11) | | 100% | 3 | (48) | 11 |
| Subtotal holding & others | | 131 | 1 | 44 | | | 127 | 70 | 32 |
| | | | | | | | | | |
| Deletions | 100% | - | (238) | - | | 100% | - | (263) | - |
| Total consolidated, continuing operations | | 905 | 866 | 312 | | | 698 | 1,148 | 132 |
| At our share ownership | | 905 | 1,109 | 312 | | | 694 | 1,416 | 132 |
| | | | | | | | | | |
| + Discontinued operations: Edenor | 4.2% | 17 | - | (39) | | 55.1% | 51 | (0) | (499) |
| | | | | | | | | | |
| Total consolidated, continuing and discontinued operations | | 921 | 866 | 273 | | | 749 | 1,148 | (367) |
| At our share ownership | | 911 | 1,109 | 273 | | | 722 | 1,416 | (367) |
Note: 1 The deletions correspond to other companies or inter-companies or debt repurchases. 2 Net debt includes holding companies.
3 Attributable to the Company’s shareholders.
| |
Pampa Energía ● Q4 21 Earning release ● 20 |
| 3.7 | Analysis of the quarter, by subsidiary and segment |
Subsidiary
In US$ million | Fourth quarter 2021 | | Fourth quarter 2020 |
| % Pampa | Adjusted EBITDA | Net debt2 | Net income3 | | % Pampa | Adjusted EBITDA | Net debt2 | Net income3 |
| |
| Power generation segment | | | | | | | | | |
| Diamante | 61.0% | 1 | (6) | 1 | | 61.0% | 1 | (2) | (4) |
| Los Nihuiles | 52.0% | (2) | (5) | (3) | | 52.0% | (0) | (10) | (9) |
| | | | | | | | | | |
| Greenwind | | 5 | 72 | 0 | | | 6 | 90 | 1 |
| Non-controlling stake adjustment | | (3) | (36) | (0) | | | (3) | (45) | (1) |
| Subtotal Greenwind adjusted by ownership | 50.0% | 3 | 36 | 0 | | 50.0% | 3 | 45 | 1 |
| | | | | | | | | | |
| CTBSA | | 38 | 220 | 31 | | | 42 | 202 | 59 |
| Non-controlling stake adjustment | | (19) | (110) | (15) | | | (21) | (101) | (30) |
| Subtotal CTBSA adjusted by ownership | 50.0% | 19 | 110 | 15 | | 50.0% | 21 | 101 | 30 |
| | | | | | | | | | |
| Pampa stand-alone, other companies, adjs. & deletions1 | 100.0% | 85 | 167 | 17 | | 100% | 97 | 465 | 3 |
| Subtotal power generation | | 105 | 302 | 31 | | | 121 | 598 | 20 |
| | | | | | | | | | |
| Oil & gas segment | | | | | | | | | |
| OldelVal | | 17 | (27) | 11 | | | 13 | (10) | (0) |
| Non-controlling stake adjustment | | (17) | 26 | (11) | | | (13) | 9 | 0 |
| Subtotal OldelVal adjusted by ownership | 2.1% | 0 | (1) | 0 | | 2.1% | 0 | (0) | (0) |
| | | | | | | | | | |
| Pampa stand-alone, other companies, adjs. & deletions1 | | 46 | 801 | (5) | | | 18 | 744 | 2 |
| Subtotal oil & gas | | 46 | 801 | (5) | | | 19 | 744 | 2 |
| | | | | | | | | | |
| Petrochemicals segment | | | | | | | | | |
| Pampa Energía | 100.0% | 9 | - | 4 | | 100.0% | 10 | - | 5 |
| Subtotal petrochemicals | | 9 | - | 4 | | | 10 | - | 5 |
| | | | | | | | | | |
| Holding & others segment | | | | | | | | | |
| Transener | | 8 | (31) | (3) | | | 19 | (9) | 6 |
| Non-controlling stake adjustment | | (6) | 22 | 2 | | | (14) | 6 | (4) |
| Subtotal Transener adjusted by ownership | 26.3% | 2 | (8) | (1) | | 26.3% | 5 | (2) | 2 |
| | | | | | | | | | |
| TGS | | 133 | 310 | 73 | | | 91 | 406 | (42) |
| Non-controlling stake adjustment | | (94) | (220) | (52) | | | (66) | (294) | 30 |
| Subtotal TGS adjusted by ownership | 29.2% | 39 | 90 | 21 | | 27.7% | 25 | 113 | (12) |
| | | | | | | | | | |
| Refinor | | 3 | 35 | 1 | | | (0) | 27 | (1) |
| Non-controlling stake adjustment | | (2) | (25) | (0) | | | 0 | (19) | 1 |
| Subtotal Refinor adjusted by ownership | 28.5% | 1 | 10 | 0 | | 28.5% | (0) | 8 | (0) |
| | | | | | | | | | |
| Pampa stand-alone, other companies, adjs. & deletions1 | 100% | (3) | (91) | (12) | | 100% | 4 | (48) | 7 |
| Subtotal holding & others | | 39 | 1 | 9 | | | 34 | 70 | (3) |
| | | | | | | | | | |
| Deletions | 100% | - | (238) | - | | 100% | - | (263) | - |
| Total consolidated, continuing operations | | 199 | 866 | 39 | | | 184 | 1,148 | 24 |
| At our share ownership | | 200 | 1,109 | 39 | | | 184 | 1,416 | 24 |
| | | | | | | | | | |
| + Discontinued operations: Edenor | 4.2% | - | - | - | | 55.1% | (16) | (0) | (487) |
| | | | | | | | | | |
| Total consolidated, continuing and discontinued operations | | 199 | 866 | 39 | | | 168 | 1,148 | (463) |
| At our share ownership | | 200 | 1,109 | 39 | | | 175 | 1,416 | (463) |
Note: 1 The deletions correspond to other companies or inter-companies or debt repurchases. 2 Net debt includes holding companies.
3 Attributable to the Company’s shareholders.
| |
Pampa Energía ● Q4 21 Earning release ● 21 |
| 4.1 | Power generation main operational KPIs |
Power generation's
key performance indicators | | Hydroelectric | | Wind | | Subtotal
hydro
+wind | Thermal | | Total |
| | HINISA | HIDISA | HPPL | | PEMC1 | PEPE2 | PEPE3 | | CTLL | CTG | CTP | CPB | CTPP | CTIW | CTGEBA2 | Eco-
Energía | CTEB1 | Subtotal | |
| Installed capacity (MW) | | 265 | 388 | 285 | | 100 | 53 | 53 | | 1,144 | 780 | 361 | 30 | 620 | 100 | 100 | 1,253 | 14 | 567 | 3,826 | | 4,970 |
| New capacity (MW) | | - | - | - | | 100 | 53 | 53 | | 206 | 184 | 100 | - | - | 100 | 100 | 565 | 14 | 567 | 1,631 | | 1,837 |
| Market share | | 0.6% | 0.9% | 0.7% | | 0.2% | 0.1% | 0.1% | | 2.7% | 1.8% | 0.8% | 0.1% | 1.4% | 0.2% | 0.2% | 2.9% | 0.03% | 1.3% | 8.9% | | 11.6% |
| | | | | | | | | | | | | | | | | | | | | | | |
| Fiscal year | | | | | | | | | | | | | | | | | | | | | | |
| Net generation 2021 (GWh) | | 467 | 325 | 550 | | 367 | 215 | 256 | | 2,181 | 4,682 | 392 | 53 | 312 | 299 | 301 | 8,594 | 75 | 546 | 15,252 | | 17,433 |
| Market share | | 0.3% | 0.2% | 0.4% | | 0.3% | 0.2% | 0.2% | | 1.5% | 3.3% | 0.3% | 0.0% | 0.2% | 0.2% | 0.2% | 6.1% | 0.1% | 0.4% | 10.8% | | 12.3% |
| Sales 2021 (GWh) | | 467 | 325 | 550 | | 367 | 247 | 256 | | 2,212 | 4,692 | 624 | 53 | 313 | 299 | 300 | 9,266 | 153 | 546 | 16,246 | | 18,458 |
| | | | | | | | | | | | | | | | | | | | | | | |
| Net generation 2020 (GWh) | | 481 | 323 | 742 | | 409 | 207 | 243 | | 2,404 | 4,406 | 368 | 55 | 576 | 193 | 229 | 7,912 | 72 | 255 | 14,065 | | 16,470 |
| Variation 2021 vs. 2020 | | -3% | +1% | -26% | | -10% | +4% | +5% | | -9% | +6% | +7% | -4% | -46% | +55% | +31% | +9% | +5% | #### | +8% | | +6% |
| Sales 2020 (GWh) | | 482 | 323 | 737 | | 409 | 207 | 246 | | 2,404 | 4,399 | 418 | 55 | 575 | 193 | 229 | 7,946 | 89 | 255 | 14,159 | | 16,563 |
| | | | | | | | | | | | | | | | | | | | | | | |
| Avg. price 2021 (US$/MWh) | | 18 | 34 | 18 | | 71 | 73 | 67 | | 41 | 31 | 45 | 84 | 75 | 126 | 100 | 34 | 33 | na | 47 | | 46 |
| Avg. price 2020 (US$/MWh) | | 21 | 37 | 16 | | 70 | 76 | 68 | | 39 | 36 | 42 | 123 | 43 | na | 125 | 27 | 58 | na | 47 | | 46 |
| Avg. gross margin 2021 (US$/MWh) | | (6) | 12 | 7 | | 61 | 55 | 58 | | 25 | 26 | 10 | 41 | 12 | 103 | 78 | 17 | 12 | na | 31 | | 30 |
| Avg. gross margin 2020 (US$/MWh) | | 8 | 20 | 7 | | 62 | 65 | 65 | | 29 | 33 | 13 | 90 | 12 | na | 100 | 17 | 19 | na | 36 | | 35 |
| | | | | | | | | | | | | | | | | | | | | | | |
| Fourth quarter | | | | | | | | | | | | | | | | | | | | | | |
| Net generation Q4 21 (GWh) | | 200 | 104 | 116 | | 86 | 52 | 58 | | 615 | 1,061 | 222 | 22 | 152 | 62 | 77 | 2,182 | 16 | 260 | 4,055 | | 4,670 |
| Market share | | 0.6% | 0.3% | 0.3% | | 0.2% | 0.1% | 0.2% | | 1.7% | 3.0% | 0.6% | 0.1% | 0.4% | 0.2% | 0.2% | 6.2% | 0.0% | 0.7% | 11.5% | | 13.2% |
| Sales Q4 21 (GWh) | | 200 | 104 | 116 | | 86 | 59 | 58 | | 623 | 1,071 | 290 | 22 | 152 | 62 | 77 | 2,440 | 30 | 261 | 4,405 | | 5,028 |
| | | | | | | | | | | | | | | | | | | | | | | |
| Net generation Q4 20 (GWh) | | 195 | 129 | 160 | | 97 | 50 | 64 | | 696 | 1,115 | 21 | 15 | 88 | 78 | 87 | 2,211 | 15 | 74 | 3,705 | | 4,400 |
| Variation Q4 21 vs. Q4 20 | | +2% | -20% | -28% | | -11% | +4% | -10% | | -12% | -5% | na | +45% | +73% | -21% | -12% | -1% | +7% | na | +9% | | +6% |
| Sales Q4 20 (GWh) | | 196 | 129 | 161 | | 97 | 52 | 64 | | 700 | 1,113 | 64 | 15 | 88 | 78 | 87 | 2,183 | 25 | 74 | 3,727 | | 4,427 |
| | | | | | | | | | | | | | | | | | | | | | | |
| Avg. price Q4 21 (US$/MWh) | | 12 | 26 | 20 | | 72 | 74 | 67 | | 35 | 25 | 31 | 26 | 52 | 149 | 97 | 31 | 43 | na | 42 | | 41 |
| Avg. price Q4 20 (US$/MWh) | | 12 | 20 | 14 | | 71 | 80 | 67 | | 32 | 34 | 65 | 113 | 53 | 120 | 88 | 31 | 57 | na | 48 | | 46 |
| Avg. gross margin Q4 21 (US$/MWh) | | (11) | 2 | 6 | | 61 | 54 | 56 | | 17 | 17 | 10 | (1) | 18 | 120 | 75 | 18 | 18 | na | 27 | | 26 |
| Avg. gross margin Q4 20 (US$/MWh) | | (1) | 6 | 6 | | 61 | 67 | 67 | | 22 | 31 | (4) | 85 | (5) | 97 | 75 | 20 | 12 | na | 35 | | 33 |
Note: Gross margin before amortization and depreciation. 1 Operated by Pampa (50% of equity stake). 2 Commissioning of ST02 as of July 2, 2020.
| |
Pampa Energía ● Q4 21 Earning release ● 22 |
| 4.2 | Oil and gas production in the main areas |
| Main areas' production | | Fiscal year | | Fourth quarter |
| 2021 | 2020 | Variation | 2021 | 2020 | Variation |
| Gas (k boe/day) | | | | | | | | |
| El Mangrullo | | 32.6 | 26.6 | +23% | | 37.0 | 26.7 | +39% |
| Río Neuquén | | 7.2 | 5.4 | +34% | | 9.1 | 4.9 | +84% |
| Sierra Chata | | 3.1 | 2.9 | +10% | | 3.3 | 2.7 | +20% |
| Rincón del Mangrullo1 | | 3.1 | 4.5 | -31% | | 2.4 | 3.7 | -34% |
| Others | | 1.1 | 1.3 | -16% | | 1.1 | 1.3 | -15% |
| Total gas at O/S | | 47.1 | 40.6 | +16% | | 52.9 | 39.3 | +34% |
| | | | | | | | | |
| Oil (k boe/day) | | | | | | | | |
| El Tordillo2 | | 2.5 | 2.4 | +4% | | 2.9 | 2.3 | +26% |
| Gobernador Ayala | | 0.9 | 0.8 | +20% | | 1.0 | 0.8 | +21% |
| Associated oil3 | | 0.9 | 0.9 | +3% | | 1.0 | 0.9 | +13% |
| Others | | 0.3 | 0.3 | -4% | | 0.4 | 0.4 | +1% |
| Total oil at O/S | | 4.7 | 4.4 | +6% | | 5.2 | 4.3 | +20% |
| Total at O/S (kboe/day) | | 51.8 | 45.1 | +15% | | 58.1 | 43.7 | +33% |
Note: Production in Argentina. 1 It doesn’t include shale formation. 2 It includes La Tapera - Puesto Quiroga field. 3 From gas fields.
| 4.3 | Electricity distribution segment, discontinued11 |
Electricity distribution segment, consolidated
Figures in US$ million | | Fiscal year | | Fourth quarter |
| | 2021 | 2020 | ∆% | | 2021 | 2020 | ∆% |
| Sales revenue | | 493 | 1,085 | -55% | | - | 220 | -100% |
| Cost of sales | | (398) | (926) | -57% | | - | (200) | -100% |
| | | | | | | | | |
| Gross profit | | 95 | 159 | -40% | | - | 20 | -100% |
| | | | | | | | | |
| Selling expenses | | (36) | (79) | -54% | | - | (22) | -100% |
| Administrative expenses | | (26) | (64) | -59% | | - | (23) | -100% |
| Other operating income | | 21 | 29 | -28% | | - | 9 | -100% |
| Other operating expenses | | (18) | (25) | -28% | | - | (9) | -100% |
| Impairment of financial assets | | (11) | (50) | -78% | | - | (10) | -100% |
| Recovery of PPE impairment | | 16 | (589) | NA | | - | (589) | -100% |
| | | | | | | | | |
| Operating income (loss) | | 41 | (619) | NA | | - | (624) | -100% |
| | | | | | | | | |
| RECPAM | | 120 | 115 | +4% | | - | 36 | -100% |
| Finance income | | - | 1 | -100% | | - | 1 | -100% |
| Finance costs | | (106) | (110) | -4% | | - | (39) | -100% |
| Other financial results | | 8 | (20) | NA | | - | 1 | -100% |
| | | | | | | | | |
| Profit (loss) before tax | | 63 | (633) | NA | | - | (625) | -100% |
| | | | | | | | | |
| Income tax | | (138) | 41 | NA | | - | 56 | -100% |
| | | | | | | | | |
| Net income (loss) for the period | | (75) | (592) | -87% | | - | (569) | -100% |
| Attributable to owners of the Company | | (39) | (499) | -92% | | - | (487) | -100% |
| Attributable to non-controlling interests | | (36) | (93) | -61% | | - | (82) | -100% |
| | | | | | | | | |
| Adjusted EBITDA, discontinued | | 17 | 51 | -68% | | - | (16) | -100% |
| | | | | | | | | |
| Increases in PPE, intangible and right-of-use assets | | 64 | 135 | -52% | | - | 40 | -100% |
| Depreciation and amortization | | - | 81 | -100% | | - | 19 | -100% |
11 On June 30, 2021, the sale closing of the controlling stake in Edenor was closed. Consequently, under IFRS, the electricity distribution segment is deconsolidated from Pampa’s FS and shown as discontinued operations for the current and comparative periods.
| |
Pampa Energía ● Q4 21 Earning release ● 23 |
| Term | Definition |
| Q3 21/Q3 20 | Third quarter of 2021/Third quarter of 2020 |
| Q4 21/Q4 20 | Fourth quarter of 2021/Fourth quarter of 2020 |
| ADRs/ADSs | American Depositary Receipts |
| AR$ | Argentine Pesos |
| Bbl | Barrel |
| BICE | Banco de Inversión y Comercio Exterior S.A. (Investment and Foreign Trade Bank) |
| Boe | Barrels of oil equivalent |
| CAMMESA | Compañía Administradora del Mercado Mayorista Eléctrico S.A. (Argentine Wholesale Electricity Market Clearing Company) |
| CB | Corporate Bonds |
| CCGT | Combined cycle gas turbine |
| CEO | Chief Executive Officer |
| CFO | Chief Financial Officer |
| CPB | Piedra Buena Thermal Power Plant |
| CTBSA | CT Barragán S.A. |
| CTEB | Ensenada Barragán Thermal Power Plant |
| CTG | Güemes Thermal Power Plant |
| CTGEBA | Genelba Thermal Power Plant |
| CTIW | Ingeniero White Thermal Power Plant |
| CTLL | Loma De La Lata Thermal Power Plant |
| CTP | Piquirenda Thermal Power Plant |
| CTPP | Parque Pilar Thermal Power Plant |
| DNU | Decreto de Necesidad y Urgencia (Necessity and Urgency Executive Order) |
| E&P | Exploration and Production |
| EBITDA | Earnings before interest, tax, depreciation and amortization |
| EcoEnergía | EcoEnergía Co-Generation Power Plant |
| Edenor | Empresa Distribuidora y Comercializadora Norte S.A. |
| ENARGAS | Ente Nacional Regulador del Gas (National Gas Regulatory Entity) |
| Energía Plus | Energía Plus Program, SE Res. No. 1,281/06 |
| ENRE | Ente Nacional Regulador de la Electricidad (National Electricity Regulatory Entity) |
| FO | Fuel oil |
| FS | Financial Statements |
| FV | Face Value |
| FX | Nominal exchange rate |
| GO | Gas oil (Diesel oil) |
| Greenwind | Greenwind S.A. |
| GSA | Gas Supply Agreement |
| GWh | Gigawatt-hour |
| HIDISA | Diamante Hydroelectric Power Plant |
| HINISA | Los Nihuiles Hydroelectric Power Plant |
| HMRT | Horas de Alto Requerimiento Térmico del Mes (Hours of the month with a high thermal demand) |
| HPPL | Pichi Picún Leufú Hydroelectric Power Plant |
| ICMA | International Capital Market Association |
| IDB Invest | Inter-American Development Bank Invest (former Inter-American Investment Corporation) |
| |
Pampa Energía ● Q4 21 Earning release ● 24 |
| IEASA/ENARSA | Integración Energética Argentina S.A. (former Energía Argentina S.A.) |
| IFRS | International Financial Reporting Standards |
| Kbbl/kboe | Thousands of barrels/thousands of barrels of oil equivalent |
| LNG | Liquified Natural Gas |
| LPG | Liquified Petroleum Gas |
| M3 | Cubic meter |
| MAT ER | Term Market from Renewable Energy Sources |
| MBTU | Million British Thermal Unit |
| MW/MWh | Megawatt/Megawatt-hour |
| N.a. | Not applicable |
| O/S | At equity ownership |
| OldelVal | Oleoductos del Valle S.A. |
| Pampa / the Company | Pampa Energía S.A. |
| Pampa Group | Pampa Energía S.A. and its subsidiaries |
| PEMC | Ingeniero Mario Cebreiro Wind Farm |
| PEN | Poder Ejecutivo Nacional (National Executive Branch) |
| PEPE | Pampa Energía Wind Farm |
| Plan Gas.Ar | Argentine Natural Gas Production Promotion Program – 2020 – 2024 Supply and Demand Scheme (DNU No. 892/20 and supplementary regulations) |
| PPA | Power Purchase Agreement |
| PPE | Property, Plant and Equipment |
| RECPAM | Results from a net monetary position |
| Refinor | Refinería del Norte S.A. |
| Res. | Resolution/Resolutions |
| SADI | Sistema Argentino de Interconexión (Argentine Electricity Grid) |
| SBR | Styrene-Butadiene Rubber |
| SE | Secretariat of Energy |
| SEE | Under Secretariat of Electric Energy (former Secretariat of Electric Energy) |
| ST | Steam turbine |
| TGS | Transportadora de Gas del Sur S.A. |
| Ton | Metric Ton |
| Transba | Empresa de Transporte de Energía Eléctrica por Distribución Troncal de la Provincia de Buenos Aires Transba S.A. |
| Transener | Compañía de Transporte de Energía Eléctrica en Alta Tensión Transener S.A. |
| US$ | U.S. Dollars |
| UVA | Unidad de Valor Adquisitivo (Acquisitive Value Units) |
| VRD | Debt Securities |
| Pampa Energía ● Q4 21 Earning release ● 25 |