
Pampa Energía, an independent company with active participation in Argentina’s electricity and gas value chain, announces the results for the six-month period and quarter ended on June 30, 2022. |
Buenos Aires, August 11, 2022
[1] The information is based on FS prepared according to IFRS in force in Argentina. Only continuing operations are considered.
[2] It does not include sales from the affiliates Greenwind, CTBSA, Transener and TGS, which at our ownership account for US$98 million. Under IFRS, they are not consolidated in Pampa, thus shown as ‘Results for participation in joint businesses and associates.’
[3] Consolidated adjusted EBITDA represents the results before financial results, income tax, depreciations and amortizations, extraordinary and non-cash income and expense, equity income and other adjustments from the IFRS implementation, and includes affiliates’ EBITDA at our ownership. For further information, see section 3 of this Earnings release.
| Pampa Energía ● Q2 22 Earning release ● 1 |
 |
Table of contents
| Pampa Energía ● Q2 22 Earning release ● 2 |
| |
| 1. | Relevant events |
| 1.1 | Exchange offer for notes maturing in 2023 |
On June 16, 2022, Pampa announced an offer to exchange its 7.375% US$500 million FV notes due July 2023 (the ‘2023 Notes’). The offer was amended on July 18, 2022 and for each US$1,000 FV to be exchanged, the following mutually exclusive options were offered:
| · | Option A: cash (30% of the total amount tendered and accepted for exchange, evenly distributed among holders choosing Option A), and the balance in 9.5% notes, amortizing in three consecutive annual installments starting in 2024 and maturing in December 2026 (the ‘2026 Notes’), weighted at a 1.02 exchange ratio; or |
| · | Option B: US$1,030 in 2026 Notes. |
The exchange offer expired on July 29, and US$407.1 million representing 81.4% of the 2023 Notes were tendered and accepted for exchange as per the following breakdown:
| · | US$193.8 million under Option A: for each US$1,000 FV of 2023 Notes, they receive approximately US$630.2 in cash and US$377.2 in 2026 Notes; and |
| · | US$213.3 million under Option B: for each US$1,000 FV of 2023 Notes, they receive US$1,030 in 2026 Notes. |
Consequently, on August 8, 2022 US$122.1 million was paid in cash, and 2026 Notes were issued for a US$292.8 million FV.
The exchange strengthens the Company’s debt profile and equity structure, strategically focusing the use of capital on organically expanding Pampa’s core businesses: increasing the production and development of unconventional gas reserves and continuing to add efficient power generation. Thus, the Company contributes to the country through local production and a lower carbon footprint and enabling savings in foreign currency reserves.
| 1.2 | Authorization to export gas to Chile |
In August 2022, the SE cleared Pampa’s requests to export gas to Chile on a take-or-pay basis for a maximum volume of 1.5 million m3/day between October 1, 2022 and May 1, 2023.
| 1.3 | Power generation segment |
Amendment to CTEB’s expansion project
On July 1, 2022, CTBSA and the SACDE-Techint joint venture amended the construction agreement, by which CTBSA would recognize an US$8 million compensation to said joint venture on account of term and cost variations.
Technical problem in one of the gas turbines at CTLL
On June 23, 2022, a technical problem occurred at the LDLATG05 gas turbine. Jointly with the turbine manufacturer GE, Pampa performed the necessary works to dismantle and repair the failure. Moreover, Pampa is making all filings required before the insurance companies to collect the compensation for the sustained damages and minimize losses related to the breach of availability commitments.
| Pampa Energía ● Q2 22 Earning release ● 3 |
| |
| 2. | Financial highlights |
| 2.1 | Consolidated balance sheet |
| Figures in million | As of 6.30.2022 | As of 12.31.2021 | ||||
| AR$ | US$ FX 125.23 | AR$ | US$ FX 102.72 | |||
| ASSETS | ||||||
| Property, plant and equipment | 213,941 | 1,708 | 170,390 | 1,659 | ||
| Intangible assets | 5,732 | 46 | 3,956 | 39 | ||
| Right-of-use assets | 1,070 | 9 | 1,231 | 12 | ||
| Deferred tax asset | 26,073 | 208 | 8,675 | 84 | ||
| Investments in joint ventures and associates | 109,591 | 875 | 79,500 | 774 | ||
| Financial assets at amortized cost | 12,585 | 100 | 10,821 | 105 | ||
| Financial assets at fair value through profit and loss | 3,654 | 29 | 2,998 | 29 | ||
| Other assets | 69 | 1 | 61 | 1 | ||
| Trade and other receivables | 3,284 | 26 | 3,379 | 33 | ||
| Total non-current assets | 375,999 | 3,002 | 281,011 | 2,736 | ||
| Inventories | 21,590 | 172 | 15,888 | 155 | ||
| Financial assets at amortized cost | 1,276 | 10 | 537 | 5 | ||
| Financial assets at fair value through profit and loss | 56,428 | 451 | 47,026 | 458 | ||
| Derivative financial instruments | 172 | 1 | 16 | 0 | ||
| Trade and other receivables | 59,654 | 476 | 40,892 | 398 | ||
| Cash and cash equivalents | 13,172 | 105 | 11,283 | 110 | ||
| Total current assets | 152,292 | 1,216 | 115,642 | 1,126 | ||
| Assets classified as held for sale | 1,544 | 12 | - | - | ||
| Total assets | 529,835 | 4,231 | 396,653 | 3,861 | ||
| EQUITY | ||||||
| Equity attributable to owners of the company | 250,953 | 2,004 | 183,431 | 1,786 | ||
| Non-controlling interest | 968 | 8 | 609 | 6 | ||
| Total equity | 251,921 | 2,012 | 184,040 | 1,792 | ||
| LIABILITIES | ||||||
| Investments in joint ventures | 424 | 3 | 386 | 4 | ||
| Provisions | 17,758 | 142 | 14,444 | 141 | ||
| Income tax and presumed minimum income tax liabilities | 26,405 | 211 | 19,287 | 188 | ||
| Defined benefit plans | 3,210 | 26 | 2,419 | 24 | ||
| Borrowings | 175,046 | 1,398 | 139,630 | 1,359 | ||
| Other payables | 1,894 | 15 | 1,340 | 13 | ||
| Total non-current liabilities | 224,737 | 1,795 | 177,506 | 1,728 | ||
| Provisions | 594 | 5 | 560 | 5 | ||
| Income tax liabilities | 10,256 | 82 | 2,098 | 20 | ||
| Taxes payables | 4,499 | 36 | 2,314 | 23 | ||
| Defined benefit plans | 403 | 3 | 515 | 5 | ||
| Salaries and social security payable | 2,411 | 19 | 2,876 | 28 | ||
| Derivative financial instruments | - | - | 18 | 0 | ||
| Borrowings | 8,746 | 70 | 8,165 | 79 | ||
| Trade and other payables | 26,268 | 210 | 18,561 | 181 | ||
| Total current liabilities | 53,177 | 425 | 35,107 | 342 | ||
| Total liabilities | 277,914 | 2,219 | 212,613 | 2,070 | ||
| Total liabilities and equity | 529,835 | 4,231 | 396,653 | 3,861 | ||
| Pampa Energía ● Q2 22 Earning release ● 4 |
| |
| 2.2 | Consolidated income statement |
| First half | Second quarter | |||||||||||
| Figures in million | 2022 | 2021 | 2022 | 2021 | ||||||||
| AR$ | US$ | AR$ | US$ | AR$ | US$ | AR$ | US$ | |||||
| Sales revenue | 99,523 | 874 | 61,211 | 667 | 55,512 | 462 | 32,576 | 346 | ||||
| Cost of sales | (61,259) | (543) | (35,343) | (386) | (34,872) | (295) | (18,990) | (201) | ||||
| Gross profit | 38,264 | 331 | 25,868 | 281 | 20,640 | 167 | 13,586 | 145 | ||||
| Selling expenses | (3,358) | (30) | (1,083) | (12) | (1,438) | (11) | (541) | (5) | ||||
| Administrative expenses | (7,326) | (63) | (4,043) | (44) | (3,797) | (31) | (2,027) | (21) | ||||
| Exploration expenses | (15) | - | (44) | - | (7) | - | (37) | - | ||||
| Other operating income | 4,357 | 36 | 4,846 | 50 | 3,057 | 25 | 3,870 | 39 | ||||
| Other operating expenses | (2,632) | (23) | (3,831) | (42) | (964) | (8) | (781) | (9) | ||||
| Impairment of financial assets | (519) | (4) | (196) | (2) | (392) | (3) | (93) | (1) | ||||
| Impairment of PPE, int. assets & inventories | (4,384) | (35) | (172) | (2) | (4,375) | (35) | (172) | (2) | ||||
| Results for part. in joint businesses & associates | 6,861 | 57 | 3,101 | 34 | 4,179 | 32 | 875 | 8 | ||||
| Operating income | 31,248 | 269 | 24,446 | 263 | 16,903 | 136 | 14,680 | 154 | ||||
| Financial income | 450 | 5 | 337 | 3 | 204 | 2 | 172 | 1 | ||||
| Financial costs | (8,794) | (78) | (7,841) | (86) | (4,599) | (39) | (3,855) | (41) | ||||
| Other financial results | (4,170) | (35) | 2,931 | 29 | (3,881) | (33) | 4,992 | 53 | ||||
| Financial results, net | (12,514) | (108) | (4,573) | (54) | (8,276) | (70) | 1,309 | 13 | ||||
| Profit before tax | 18,734 | 161 | 19,873 | 209 | 8,627 | 66 | 15,989 | 167 | ||||
| Income tax | (29) | 6 | (6,106) | (64) | (376) | 1 | (5,391) | (56) | ||||
| Net income for continuing operations | 18,705 | 167 | 13,767 | 145 | 8,251 | 67 | 10,598 | 111 | ||||
| Net income (loss) from discontinued operations | - | - | (7,129) | (75) | - | - | (7,654) | (80) | ||||
| Net income (loss) for the period | 18,705 | 167 | 6,638 | 70 | 8,251 | 67 | 2,944 | 31 | ||||
| Attributable to the owners of the Company | 18,469 | 165 | 9,773 | 103 | 8,165 | 66 | 6,621 | 70 | ||||
| Continuing operations | 18,469 | 165 | 13,499 | 142 | 8,165 | 66 | 10,349 | 108 | ||||
| Discontinued operations | - | (0) | (3,726) | (39) | - | - | (3,728) | (38) | ||||
| Attributable to the non-controlling interests | 236 | 2 | (3,135) | (33) | 86 | 1 | (3,677) | (39) | ||||
| Net income (loss) per share to shareholders | 13.37 | 0.12 | 6.84 | 0.07 | 5.91 | 0.05 | 4.68 | 0.05 | ||||
| From continuing operations | 13.37 | 0.12 | 9.45 | 0.10 | 5.91 | 0.05 | 7.32 | 0.08 | ||||
| From discontinued operations | - | (0.0001) | (2.61) | (0.03) | - | - | (2.64) | (0.03) | ||||
| Net income (loss) per ADR to shareholders | 334.34 | 2.99 | 171.10 | 1.80 | 147.85 | 1.20 | 117.09 | 1.24 | ||||
| From continuing operations | 334.34 | 2.99 | 236.33 | 2.49 | 147.85 | 1.20 | 183.02 | 1.92 | ||||
| From discontinued operations | - | (0.003) | (65.23) | (0.69) | - | - | (65.93) | (0.67) | ||||
| Average outstanding common shares1 | 1,381 | 1,428 | 1,381 | 1,414 | ||||||||
| Outstanding shares by the end of period1 | 1,380 | 1,395 | 1,380 | 1,395 | ||||||||
Note: 1 It includes shares from the Employee stock-based compensation plan, which as of June 30, 2022 and 2021 amounted to 3.9 million common shares.
| Pampa Energía ● Q2 22 Earning release ● 5 |
| |
| 2.3 | Cash and financial borrowings |
| As of June 30, 2022, in US$ million | Cash1 | Financial debt | Net debt | |||||||
| Consolidated in FS | Ownership adjusted | Consolidated in FS | Ownership adjusted | Consolidated in FS | Ownership adjusted | |||||
| Power generation | 516 | 513 | 543 | 543 | 27 | 31 | ||||
| Petrochemicals | - | - | - | - | - | - | ||||
| Holding and others | 0 | 0 | - | - | (0) | (0) | ||||
| Oil and gas | 50 | 49 | 924 | 924 | 875 | 875 | ||||
| Total under IFRS/Restricted Group | 566 | 562 | 1,468 | 1,468 | 902 | 905 | ||||
| Affiliates at O/S2 | 91 | 91 | 319 | 319 | 228 | 228 | ||||
| Total with affiliates | 657 | 654 | 1,787 | 1,787 | 1,129 | 1,133 | ||||
Note: Financial debt includes accrued interest. 1 It includes cash and cash equivalents, financial assets at fair value with changing results, and investments at amortized cost. 2 Under IFRS, the affiliates Greenwind, CTBSA, Transener and TGS are not consolidated in Pampa.
Debt transactions
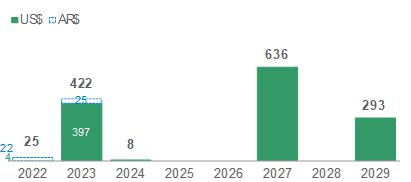
Pampa’s financial debt at the consolidated level under IFRS slightly increased to US$1,468 million as of June 30, 2022 (+US$29 million vs. the end of 2021). In terms of net debt, it increased by US$36 million, reaching US$902 million. The average interest rate for US$-bearing indebtedness was 7.8%, in which 96.7% of the Company’s gross debt is denominated, mainly at a fixed rate. AR$ indebtedness’s average interest rate was 47.7%. Pampa’s consolidated financial debt averaged 3.9 years.
The chart below shows principal maturity profile, net of repurchases, in US$ million by the end of Q2 22:
| Note: It only considers Pampa consolidated under IFRS; it does not include affiliates TGS, Transener, Greenwind and CTBSA. |
In Q2 22, Pampa paid borrowings for US$3.9 million and entered net bank calls for AR$1,391 million. After the quarter’s closing, Pampa exchanged US$407.1 million FV of 2023 Notes for US$122.1 million in cash, plus the issuance of 2026 Notes for US$292,8 million FV[4]. Moreover, Pampa undertook net borrowings for AR$7,125 million and issued Series XI CB for AR$21,655 million at Badlar Privada variable interest rate plus 0%, maturing in 18 months[5].
Regarding our affiliates, in Q2 22 Transener paid loans for AR$83 million, and Greenwind paid US$5.2 million under the credit facility executed with IDB Invest. Moreover, CTBSA paid US$33.2 million of the syndicated loan and issued Series VI CB in US$-link for US$25 million at 0% nominal annual rate maturing in 36 months, and Series VII CB for AR$1,754 million at a variable rate of Badlar Privada plus 2.98% maturing in 18 months. After the closing of Q2 22, CTBSA paid US$4 million of the syndicated loan, and Transener settled borrowings for AR$28 million.
[4] For further information, see section 1.1 of this Earnings release.
[5] AR$12,691 million were issued on July 15, 2022. On August 8, 2022 the series was extended, further issuing AR$8,964 million.
| Pampa Energía ● Q2 22 Earning release ● 6 |
| |
As of this Earnings release issuance, the Company complies with the covenants established in its debt agreements.
Summary of debt securities
| Company In million | Security | Maturity | Amount issued | Amount net of repurchases | Coupon |
| In US$ | |||||
| Pampa | CB Series T at discount & fixed rate2 | 2023 | 500 | 93 | 7.375% |
| CB Series IX at par & fixed rate3 | 2026 | 293 | 293 | 9.5% | |
| CB Series I at discount & fixed rate | 2027 | 750 | 636 | 7.5% | |
| CB Series III at discount & fixed rate | 2029 | 300 | 293 | 9.125% | |
| TGS1 | CB at discount at fixed rate | 2025 | 500 | 470 | 6.75% |
| In US$-link | |||||
| CTEB1 | CB Series I | 2023 | 43 | 43 | 4% |
| CB Series IV | 2024 | 96 | 96 | 0% | |
| CB Series VI | 2025 | 25 | 25 | 0% | |
| In AR$ | |||||
| Pampa | CB Series VIII (Green Bond) | 2023 | 3,107 | 3,107 | Badlar Privada +2% |
| CB Series XI3 | 2024 | 21,655 | 21,655 | Badlar Privada +0% | |
| CTEB1 | CB Series VII | 2023 | 1,754 | 1,754 | Badlar Privada +2.98% |
| In UVA | |||||
| CTEB1 | CB Series II | 2024 | 65 | 65 | 4% |
Note: 1 According to IFRS, affiliates are not consolidated in Pampa’s FS. 2 Outstanding amount after exchange offer detailed in section 1.1 of this Earnings Release. 3 Securities issued after Q2 22’s closing.
Credit rating
The following table shows the Pampa Group’s ratings:
| Company | Agency | Rating | |
| Global | Local | ||
| Pampa | S&P | b-1 | na |
| Moody's | Caa3 | na | |
| FitchRatings2 | B- | AA (long-term) A1+ (short-term) | |
| TGS | S&P | CCC+ | na |
| Moody's | Caa3 | na | |
| Transener | FitchRatings2 | na | A+ (long-term) |
| CTEB | FitchRatings2 | na | A+ |
Note: 1 Stand-alone rating. 2 Local ratings issued by FIX SCR.
| Pampa Energía ● Q2 22 Earning release ● 7 |
| |
| 3. | Analysis of the Q2 22 results |
| Breakdown by segment Figures in US$ million | Q2 22 | Q2 21 | Variation | ||||||
| Sales | Adjusted EBITDA | Net Income | Sales | Adjusted EBITDA | Net Income | Sales | Adjusted EBITDA | Net Income | |
| Power generation | 165 | 99 | (18) | 167 | 121 | 66 | -1% | -18% | NA |
| Oil and Gas | 165 | 102 | 52 | 107 | 73 | 30 | +54% | +39% | +73% |
| Petrochemicals | 158 | 19 | 14 | 99 | 16 | 7 | +60% | +19% | +100% |
| Holding and Others | 5 | 35 | 19 | 5 | 29 | 5 | - | +22% | +280% |
| Eliminations | (31) | (1) | (1) | (32) | - | - | -3% | NA | NA |
| Total continuing operations | 462 | 253 | 66 | 346 | 239 | 108 | +34% | +6% | -39% |
Note: Net income attributable to the Company’s shareholders.
| 3.1 | Reconciliation of consolidated adjusted EBITDA |
| Reconciliation of adjusted EBITDA, in US$ million | First half | Second quarter | ||||
| 2022 | 2021 | 2022 | 2021 | |||
| Consolidated operating income | 269 | 263 | 136 | 154 | ||
| Consolidated depreciations and amortizations | 106 | 91 | 56 | 48 | ||
| EBITDA | 375 | 354 | 192 | 202 | ||
| Adjustments from generation segment | 11 | 14 | 9 | 12 | ||
| Deletion of equity income | (34) | (14) | (12) | (3) | ||
| Deletion of PPE's impairment | - | 2 | - | 2 | ||
| Deletion of provision recovery of PEPE IV bond | - | (13) | - | (13) | ||
| Deletion of gain from commercial interests | (7) | (12) | (3) | (6) | ||
| Deletion of provision in outages | 6 | 8 | 6 | 8 | ||
| Deletion of PPE activation in operating expenses | 11 | - | 7 | - | ||
| Greenwind's EBITDA adjusted by ownership | 6 | 5 | 3 | 3 | ||
| CTBSA's EBITDA adjusted by ownership | 29 | 37 | 8 | 21 | ||
| Adjustments from oil and gas segment | 29 | 12 | 29 | (1) | ||
| Deletion of PPE & inventories' impairment | 29 | - | 29 | - | ||
| Deletion of gain from commercial interests | (0) | (2) | (0) | (1) | ||
| Deletion of provision for environmental remediation | - | 14 | - | - | ||
| Adjustments from petrochemicals segment | (0) | (0) | (0) | (0) | ||
| Deletion of gain from commercial interests | (0) | (0) | (0) | (0) | ||
| Adjustments from holding & others segment | 63 | 60 | 24 | 26 | ||
| Deletion of equity income | (23) | (20) | (20) | (5) | ||
| Deletion of gain from commercial interests | (1) | 0 | (1) | (0) | ||
| Deletion of contigencies provision | - | 13 | - | - | ||
| Deletion of intangible assets' impairment | 6 | - | 6 | - | ||
| TGS's EBITDA adjusted by ownership | 71 | 59 | 31 | 27 | ||
| Transener's EBITDA adjusted by ownership | 9 | 8 | 7 | 4 | ||
| Consolidated adjusted EBITDA, continuing op. | 478 | 440 | 253 | 239 | ||
| At our ownership | 477 | 439 | 253 | 238 | ||
| Pampa Energía ● Q2 22 Earning release ● 8 |
| |
| 3.2 | Analysis of the power generation segment |
| Power generation segment, consolidated Figures in US$ million | First half | Second quarter | ||||||
| 2022 | 2021 | ∆% | 2022 | 2021 | ∆% | |||
| Sales revenue | 331 | 328 | +1% | 165 | 167 | -1% | ||
| Cost of sales | (184) | (171) | +8% | (100) | (92) | +9% | ||
| Gross profit | 147 | 157 | -6% | 65 | 75 | -13% | ||
| Selling expenses | (1) | (1) | - | - | (1) | -100% | ||
| Administrative expenses | (19) | (13) | +46% | (10) | (6) | +67% | ||
| Other operating income | 7 | 26 | -73% | 3 | 20 | -85% | ||
| Other operating expenses | (2) | (2) | - | (1) | (1) | - | ||
| Impairment of PPE | - | (2) | -100% | - | (2) | -100% | ||
| Results for participation in joint businesses | 34 | 14 | +143% | 12 | 3 | +300% | ||
| Operating income | 166 | 179 | -7% | 69 | 88 | -22% | ||
| Finance income | 1 | 1 | - | - | - | NA | ||
| Finance costs | (27) | (22) | +23% | (14) | (10) | +40% | ||
| Other financial results | (42) | 13 | NA | (51) | 30 | NA | ||
| Financial results, net | (68) | (8) | NA | (65) | 20 | NA | ||
| Profit (loss) before tax | 98 | 171 | -43% | 4 | 108 | -96% | ||
| Income tax | (17) | (55) | -69% | (21) | (39) | -46% | ||
| Net income (loss) for the period | 81 | 116 | -30% | (17) | 69 | NA | ||
| Attributable to owners of the Company | 79 | 113 | -30% | (18) | 66 | NA | ||
| Attributable to non-controlling interests | 2 | 3 | -33% | 1 | 3 | -70% | ||
| Adjusted EBITDA | 220 | 236 | -7% | 99 | 121 | -18% | ||
| Adjusted EBITDA at our share ownership | 219 | 235 | -7% | 98 | 120 | -18% | ||
| Increases in PPE | 30 | 4 | NA | 20 | 3 | NA | ||
| Depreciation and amortization | 43 | 43 | - | 21 | 21 | - | ||
In Q2 22, the slight year-on-year decrease in sales is mainly explained by the PPA maturity at CTLL’s ST and CTP, which currently are remunerated as legacy energy from November 1 and July 15, 2021, respectively. Moreover, revenues from fuel decreased because gas was sold to distribution utilities as they hold priority during peak season under Plan Gas.Ar. It is worth mentioning that this revenue only applies for PPA under Energía Plus and SEE Res. No. 287/17, and also affects the cost of sales due to gas purchases to our E&P. The fuel for our remaining thermal units is provided by CAMMESA, not accruing revenues or costs.
These effects were partially offset by higher volumes and prices sold under Energía Plus (higher industrial demand, besides outages in Q2 21) and increases in the legacy energy[6], despite AR$ nominal depreciation and the retroactive adjustment as of February 2021 accrued in Q2 21. Therefore, the power capacity remuneration was US$4.3 thousand/MW-month for our thermal legacy units (+35% vs. Q2 21) and US$2.2 thousand/MW-month for our hydros (+5% vs. Q2 21). Legacy energy comprises 74% of the 4,970 MW operated by Pampa[7], though it represented 32% of the segment’s sales in Q2 22.
In operating terms, in Q2 22 the power generation operated by Pampa increased by 18% vs. Q2 21, above nationwide’s generation growth (+1%) and national demand (+6%). Because of seasonal demand, there was higher dispatch with liquid fuel at CPB, CTEB and CTIW (+377 GWh) and higher gas fired-generation at CTLL and CTGEBA (+336 GWh). Mind that CTGEBA was affected by outages in Q2 21. Moreover, we reached higher natural resources both at the Mendoza hydros (+21 GWh) and the wind farms (+12 GWh), partially offset by lower water input at HPPL (-75 GWh). Moreover, we reached higher natural resources both at the Mendoza hydros (+21 GWh) and the wind farms (+12 GWh), partially offset by lower water input at HPPL (-75 GWh).
[6] 30% remuneration increase and permanent elimination of utilization factor as of Feb-22, plus an additional 10% increase in Jun-22.
[7] Under IFRS, CTEB (567 MW) and PEMC (100 MW) are affiliates; their results are not consolidated in the FS, but they are operated by Pampa and their EBITDA at our equity stake are included in Pampa’s adjusted EBITDA.
| Pampa Energía ● Q2 22 Earning release ● 9 |
| |
In Q2 22, the power generation units operated by Pampa recorded an improved availability rate compared to Q2 21, reaching an average availability rate of 97.8% (+195 basis points vs. 95.8% in Q2 21), mainly due to the technical problem at CTG and CTGEBA Plus units in Q2 21, partially offset by certain outages at CPB in Q2 22. Particularly, thermal units recorded an availability of 97.3% in Q2 22 (+274 basis points vs. 94.6% recorded in Q2 21).
| Power generation's key performance indicators | 2022 | 2021 | Variation | ||||||||||||
| Hydro | Wind | Thermal | Total | Hydro | Wind | Thermal | Total | Hydro | Wind | Thermal | Total | ||||
| Installed capacity (MW) | 938 | 206 | 3,826 | 4,970 | 938 | 206 | 3,811 | 4,955 | - | - | +0% | +0% | |||
| New capacity (%) | - | 100% | 28% | 26% | - | 100% | 48% | 41% | - | - | -21% | -16% | |||
| Market share (%) | 2.2% | 0.5% | 8.9% | 11.6% | 2.2% | 0.5% | 9.0% | 11.7% | -0% | -0% | -0% | -0% | |||
| Semester | |||||||||||||||
| Net generation (GWh) | 596 | 442 | 8,331 | 9,369 | 662 | 407 | 7,183 | 8,251 | -10% | +9% | +16% | +14% | |||
| Volume sold (GWh) | 596 | 456 | 8,905 | 9,956 | 661 | 422 | 7,582 | 8,665 | -10% | +8% | +17% | +15% | |||
| Average price (US$/MWh) | 28 | 69 | 41 | 41 | 23 | 70 | 49 | 48 | +19% | -1% | -18% | -15% | |||
| Average gross margin (US$/MWh) | 10 | 58 | 25 | 26 | 9 | 59 | 33 | 32 | +2% | -0% | -24% | -21% | |||
| Second quarter | |||||||||||||||
| Net generation (GWh) | 224 | 215 | 4,038 | 4,477 | 278 | 204 | 3,326 | 3,808 | -20% | +6% | +21% | +18% | |||
| Volume sold (GWh) | 224 | 221 | 4,302 | 4,747 | 280 | 208 | 3,512 | 4,000 | -20% | +6% | +22% | +19% | |||
| Average price (US$/MWh) | 33 | 70 | 39 | 40 | 31 | 70 | 55 | 54 | +7% | -1% | -29% | -26% | |||
| Average gross margin (US$/MWh) | 8 | 60 | 21 | 22 | 12 | 60 | 35 | 35 | -39% | -0% | -41% | -37% | |||
Note: Gross margin before amortization and depreciation. It includes CTEB and PEMC, operated by Pampa (50% of equity stake).
Q2 22 net operating costs, excluding depreciation and amortizations, increased by 47% vs. Q2 21, mainly explained by the provision recovery of the PEPE IV surety bond (US$13 million) in Q2 21, whereas in Q2 22, PPE impairments were charged for certain legacy units and increased domestic costs because inflation outpaced the AR$ devaluation. Lower proprietary gas volume consumptions partially offset these effects[8], despite the higher unit cost. In addition, there were repair expenses in Q2 22 and Q2 21 due to the technical problems at CTLL and CTGEBA, respectively.
The Q2 22 financial results reached a net loss of US$65 million, against a net gain of US$20 million in Q2 21, mainly due to losses from holding financial securities in Q2 22 (while in Q2 21 we accrued profit).
In Q2 22, our power generation’s adjusted EBITDA amounted to US$99 million (-18% vs. Q2 21, mainly explained by the end of PPAs at CTLL’s ST, CTP and CTEB[9], and to a lower extent, the US$ increase in AR$-nominated expenses, partially offset by the rise in Energía Plus and legacy thermal energy sales, both price and volume. In addition, the EBITDA considers our proportional 50% stake in CTEB (CTBSA) (US$8 million in Q2 22 vs. US$21 million in Q2 21) and a 50% stake in PEMC (Greenwind) (US$3 million in both quarters). The adjusted EBITDA excludes the provision recovery, expenses resulting from technical problems, PPE impairments charged as operating expenses in Q2 22 and the recognition of commercial interests from delayed receivables, mostly from CAMMESA.
Finally, capital expenditures, excluding CTEB and PEMC, increased by US$17 million vs. Q2 21, reaching US$20 million in Q2 22, mainly explained by PEPE III’s expansion project.
[8] 1.7 million m3/day in Q2 22 vs. 2.1 million m3/day in Q2 21.
[9] Priced as legacy energy from April 27, 2022.
| Pampa Energía ● Q2 22 Earning release ● 10 |
| |
| Project | MW | Marketing | Currency | Awarded price | Estimated capex in US$ million1 | Date of commissioning | ||||
| Capacity per MW-month | Variable per MWh | Total per MWh | Budget | % Executed @6/30/22 | ||||||
| Thermal | ||||||||||
| Loma de la Lata | 15 | SE Res. No. 238/22 | AR$ | 498,069 - 788,609(2) | 597 | 1,478 | 22 | 91% | August 3, 2021 | |
| Closing to CCGT Ensenada | 280 | PPA for 10 years | US$ | 23,962 | 10.5 | 43 | 233 | 82% | Q4 2022 (est.) | |
| Renewable | ||||||||||
| Pampa Energía III | 81 | MAT ER | US$ | na | na | 58(3) | 128 | 14% | Q2 2023 (est.) | |
Note: 1 Amounts without value-added tax. 2 It considers the HMRT additional remuneration. 3 Estimated average.
| 3.3 | Analysis of the oil and gas segment |
| Oil & gas segment, consolidated Figures in US$ million | First half | Second quarter | ||||||
| 2022 | 2021 | ∆% | 2022 | 2021 | ∆% | |||
| Sales revenue | 302 | 186 | +62% | 165 | 107 | +54% | ||
| Cost of sales | (163) | (115) | +42% | (91) | (63) | +44% | ||
| Gross profit | 139 | 71 | +96% | 74 | 44 | +68% | ||
| Selling expenses | (21) | (5) | NA | (7) | (1) | NA | ||
| Administrative expenses | (28) | (20) | +40% | (14) | (10) | +40% | ||
| Other operating income | 24 | 23 | +4% | 20 | 19 | +5% | ||
| Other operating expenses | (16) | (20) | -20% | (4) | (4) | - | ||
| Impairment of financial assets | (1) | (1) | - | (1) | - | NA | ||
| Impairment of PPE and inventories | (29) | - | NA | (29) | - | NA | ||
| Operating income (loss) | 68 | 48 | +42% | 39 | 48 | -19% | ||
| Finance income | 1 | 2 | -50% | - | 1 | -100% | ||
| Finance costs | (43) | (62) | -31% | (19) | (30) | -37% | ||
| Other financial results | (5) | (3) | +67% | 7 | 18 | -61% | ||
| Financial results, net | (47) | (63) | -25% | (12) | (11) | +9% | ||
| Profit (loss) before tax | 21 | (15) | NA | 27 | 37 | -27% | ||
| Income tax | 27 | 10 | +170% | 25 | (7) | NA | ||
| Net income (loss) for the period | 48 | (5) | NA | 52 | 30 | +73% | ||
| Adjusted EBITDA | 158 | 106 | +49% | 102 | 73 | +39% | ||
| Increases in PPE and right-of-use assets | 148 | 84 | +76% | 85 | 55 | +55% | ||
| Depreciation and amortization | 61 | 46 | +33% | 34 | 26 | +31% | ||
In Q2 22, our oil and gas sales increased by 54% vs. Q2 21, mainly explained by increased gas production under Plan Gas.Ar, gas exports to Chile and higher sales of gas to the industrial segment and oil to the domestic market (both in terms of volume and price). Lower exported oil volumes partially offset these effects but accrued at higher prices than the domestic market.
In operating terms, in Q2 22 total production reached 64.6 kboe/day (+35% vs. Q2 21 and +12% vs. Q1 22). Gas production reached new historical highs, recording 10.1 million m3/day (+38% vs. Q2 21 and +14% vs. Q1 22), mainly explained by higher volumes under Plan Gas.Ar and exports to Chile, added to the limited production due to roadblocks in the Province of Neuquén in Q2 21. Analyzing by block, significant production growth was recorded at El Mangrullo, reaching 7.3 million m3/day (+46% vs. Q2 21 and 19% vs. Q1 22), comprising 72% of our total gas output. A significant production increase was also registered at Río Neuquén and Sierra Chata (2.1 million m3/day in Q2 22: +43% vs. Q2 21, similar to Q1 22). These increases were partially offset by the lower activity and the natural decline at Rincón del Mangrullo (0.4 million m3/day in Q2 22: -37% vs. Q2 21 and -7% vs. Q1 22).
| Pampa Energía ● Q2 22 Earning release ● 11 |
| |
Our gas price was US$4.4/MBTU in Q2 22 (+14% vs. Q2 21), mainly because export prices were higher than the domestic market and increased industrial/spot prices due to peak demand during the winter season.
Our gas deliveries were allocated as follows: 48% to the residential segment due to the winter period priority under Plan Gas.Ar, 21% to the industrial/spot market, 21% as raw material by our thermal power units[10] and our petrochemicals plants, and 10% was exported. Instead, in Q2 21 41% of our gas deliveries supplied the residential segment, 33% was fired at our thermal and petrochemicals plants, 23% was sold to the industrial/spot market, 3% was sold directly to CAMMESA, and no exports were recorded.
Oil production reached 5.1 kbbl/day in Q2 22 (+10% vs. Q2 21 and similar to Q1 22), mainly explained by the rise in domestic demand, offset by lower exports. Production increased at Los Blancos, Río Neuquén and Gobernador Ayala (+0.5 kbbl/day vs. Q2 21). Moreover, 78% of the volume sold in Q2 22 was placed in the domestic market (vs. 62% in Q2 21). Our average oil price in Q2 22 increased by 26% vs. Q2 21, to US$72.6/barrel, mainly explained by the rise of Brent but moderated by local prices.
By the end of Q2 22, we accounted for 896 productive wells vs. 884 as of December 31, 2021.
| Oil and gas' key performance indicators | 2022 | 2021 | Variation | |||||||||
| Oil | Gas | Total | Oil | Gas | Total | Oil | Gas | Total | ||||
| Semester | ||||||||||||
| Volume | ||||||||||||
| Production | ||||||||||||
| In thousand m3/day | 0.8 | 9,519 | 0.7 | 7,028 | +16% | +35% | +34% | |||||
| In million cubic feet/day | 336 | 248 | ||||||||||
| In thousand boe/day | 5.1 | 56.0 | 61.1 | 4.4 | 41.4 | 45.8 | ||||||
| Sales | ||||||||||||
| In thousand m3/day | 0.8 | 9,606 | 0.6 | 7,125 | +27% | +35% | +34% | |||||
| In million cubic feet/day | 339 | 252 | ||||||||||
| In thousand boe/day | 4.9 | 56.5 | 61.5 | 3.9 | 41.9 | 45.8 | ||||||
| Average Price | ||||||||||||
| In US$/bbl | 70.7 | 56.8 | +25% | +19% | ||||||||
| In US$/MBTU | 4.0 | 3.4 | ||||||||||
| Second quarter | ||||||||||||
| Volume | ||||||||||||
| Production | ||||||||||||
| In thousand m3/day | 0.8 | 10,118 | 0.7 | 7,332 | +10% | +38% | +35% | |||||
| In million cubic feet/day | 357 | 259 | ||||||||||
| In thousand boe/day | 5.1 | 59.6 | 64.6 | 4.6 | 43.2 | 47.7 | ||||||
| Sales | ||||||||||||
| In thousand m3/day | 0.7 | 10,227 | 0.7 | 7,421 | +3% | +38% | +35% | |||||
| In million cubic feet/day | 361 | 262 | ||||||||||
| In thousand boe/day | 4.7 | 60.2 | 64.9 | 4.5 | 43.7 | 48.2 | ||||||
| Average Price | ||||||||||||
| In US$/bbl | 72.6 | 57.7 | +26% | +14% | ||||||||
| In US$/MBTU | 4.4 | 3.9 | ||||||||||
Note: Net production in Argentina. Gas volume is standardized at 9,300 kilocalories (kCal).
Net operating costs in Q2 22, excluding depreciation, amortization, and Plan Gas.Ar’s compensation, increased by 64% vs. Q2 21, mainly because of increased expenses related to the higher activity (maintenance and contractors), more royalties and levies from higher volume and prices sold, and increased exported gas transportation expenses in Q2 22, besides higher AR$-nominated costs, which outpaced the AR$ devaluation. However, these variations were partially offset by the increase in oil stock, exported in July 2022. On the other hand, net operating costs were similar to Q1 22: the growing gas activity and royalties associated with higher prices, partially offset by lower transportation expenses for exported gas. Lifting cost reached US$6.1/boe produced in Q2 22 (+20% vs. Q2 21 and +5% vs. Q1 22).
The impairment of PPE and inventories of US$29 million recorded in Q2 22 is due to the strategic replanning of activities at the Rincón del Mangrullo block, thus recategorizing reserves as contingent resources.
[10] Energía Plus and SEE Res. No. 287/17.
| Pampa Energía ● Q2 22 Earning release ● 12 |
| |
In Q2 22, financial results reached a net loss of US$12 million, similar to Q2 21, mainly due to lower gains from holding financial securities, offset by lesser financial interests because of the lower stock of debt allocated to the segment.
Our oil and gas adjusted EBITDA amounted to US$102 million in Q2 22 (+39% vs. Q2 21), mainly explained by the increased deliveries under Plan Gas.Ar, gas exports to Chile and better gas prices due to higher gas demand from industrial customers and domestic oil markets. These effects were partially offset by higher expenses related to the growing gas activity and transportation, added to the US$ increase in AR$-nominated costs, which outpaced the AR$ devaluation.
Finally, the segment’s capital expenditures amounted to US$85 million in Q2 22 vs. US$55 million in Q2 21, mainly explained by higher commitments under Plan Gas.Ar.
| 3.4 | Analysis of the petrochemicals segment |
| Petrochemicals segment, consolidated Figures in US$ million | First half | Second quarter | ||||||
| 2022 | 2021 | ∆% | 2022 | 2021 | ∆% | |||
| Sales revenue | 284 | 202 | +41% | 158 | 99 | +60% | ||
| Cost of sales | (250) | (160) | +56% | (134) | (78) | +72% | ||
| Gross profit | 34 | 42 | -19% | 24 | 21 | +14% | ||
| Selling expenses | (8) | (6) | +33% | (4) | (3) | +33% | ||
| Administrative expenses | (2) | (2) | - | (1) | (1) | - | ||
| Other operating expenses | (1) | (2) | -50% | (1) | (2) | -50% | ||
| Operating income (loss) | 23 | 32 | -28% | 18 | 15 | +20% | ||
| Finance costs | (1) | (1) | - | - | - | NA | ||
| Other financial results | - | (3) | -100% | (1) | (2) | -50% | ||
| Financial results, net | (1) | (4) | -75% | (1) | (2) | -50% | ||
| Profit (loss) before tax | 22 | 28 | -21% | 17 | 13 | +31% | ||
| Income tax | (3) | (10) | -70% | (3) | (6) | -50% | ||
| Net income (loss) for the period | 19 | 18 | +6% | 14 | 7 | +100% | ||
| Adjusted EBITDA | 25 | 34 | -27% | 19 | 16 | +19% | ||
| Increases in PPE | 2 | 4 | -50% | 2 | 3 | -33% | ||
| Depreciation and amortization | 2 | 2 | - | 1 | 1 | - | ||
The petrochemicals segment’s adjusted EBITDA grew by 19% year-on-year, reaching US$19 million in Q2 22, mainly explained by the higher reforming products’ spread and sold volumes, as well as growing domestic demand for polystyrene. However, these effects were partially offset by higher costs of raw materials (driven by international reference prices) and, to a lesser extent, the increase in the winter gas unit cost and AR$-nominated expenses (which outpaced the AR$ devaluation). Quarter-on-quarter, adjusted EBITDA increased by US$13 million, mainly explained by the higher spread of all products, offset by the higher gas cost due to seasonality.
Total volume sold increased by 19% vs. Q2 21, mainly explained by the increased domestic demand for octane bases (associated with the fuel consumption recovery) and polystyrene (due to the pandemic’s second wave impact in Q2 21), in addition to higher gasoline exports (partially offset by lower domestic sales). Moreover, in Q2 22, 3 thousand tons of gasoline were dispatched as toll processing, which was not recorded as volume sold.
| Pampa Energía ● Q2 22 Earning release ● 13 |
| |
| Petrochemicals' key performance indicators | Products | Total | ||||
| Styrene & polystyrene1 | SBR | Reforming | ||||
| Semester | ||||||
| Volume sold 6M22 (thousand ton) | 56 | 24 | 103 | 182 | ||
| Volume sold 6M21 (thousand ton) | 53 | 24 | 97 | 175 | ||
| Variation 6M22 vs. 6M21 | +5% | -4% | +6% | +4% | ||
| Average price 6M22 (US$/ton) | 2,106 | 2,197 | 1,118 | 1,561 | ||
| Average price 6M21 (US$/ton) | 1,743 | 1,722 | 690 | 1,153 | ||
| Variation 6M22 vs. 6M21 | +21% | +28% | +62% | +35% | ||
| Second quarter | ||||||
| Volume sold Q2 22 (thousand ton) | 28 | 13 | 50 | 91 | ||
| Volume sold Q2 21 (thousand ton) | 24 | 12 | 40 | 76 | ||
| Variation Q2 22 vs. Q2 21 | +17% | +4% | +25% | +19% | ||
| Average price Q2 22 (US$/ton) | 2,296 | 2,322 | 1,272 | 1,739 | ||
| Average price Q2 21 (US$/ton) | 1,919 | 1,860 | 725 | 1,285 | ||
| Variation Q2 22 vs. Q2 21 | +20% | +25% | +76% | +35% | ||
Note: 1 Includes Propylene.
In Q2 22, financial results reached a net loss of US$1 million (US$1 million improvement vs. Q2 21), mainly explained by lower losses from the commodities hedge.
Capital expenditures reached US$2 million in Q2 22, against US$3 million in Q2 21.
| Pampa Energía ● Q2 22 Earning release ● 14 |
| |
| 3.5 | Analysis of the holding and others segment |
| Holding and others segment, consolidated Figures in US$ million | First half | Second quarter | ||||||
| 2022 | 2021 | ∆% | 2022 | 2021 | ∆% | |||
| Sales revenue | 12 | 11 | +9% | 5 | 5 | - | ||
| Gross profit | 12 | 11 | +9% | 5 | 5 | - | ||
| Administrative expenses | (14) | (9) | +56% | (6) | (4) | +50% | ||
| Other operating income | 5 | 1 | NA | 2 | - | NA | ||
| Other operating expenses | (4) | (18) | -78% | (2) | (2) | - | ||
| Impairment of financial assets | (3) | (1) | +200% | (2) | (1) | +100% | ||
| Impairment of intangible assets | (6) | - | NA | (6) | - | NA | ||
| Results for participation in joint businesses | 23 | 20 | +15% | 20 | 5 | +300% | ||
| Operating income (loss) | 13 | 4 | +225% | 11 | 3 | +267% | ||
| Finance income | 6 | - | NA | 3 | - | NA | ||
| Finance costs | (10) | (1) | NA | (7) | (1) | NA | ||
| Other financial results | 12 | 22 | -45% | 12 | 7 | +71% | ||
| Financial results, net | 8 | 21 | -62% | 8 | 6 | +33% | ||
| Profit (loss) before tax | 21 | 25 | -16% | 19 | 9 | +111% | ||
| Income tax | (1) | (9) | -89% | - | (4) | -100% | ||
| Net income for the period | 20 | 16 | +25% | 19 | 5 | +280% | ||
| Adjusted EBITDA | 76 | 64 | +18% | 35 | 29 | +22% | ||
| Increases in PPE and intangible assets | 2 | 1 | +36% | 1 | 1 | -17% | ||
| Depreciation and amortization | - | - | NA | - | - | NA | ||
In the holding and others segment, without considering the equity income from affiliates (Transener and TGS), recorded a US$9 million operating loss (+US$7 million vs. Q2 21), mainly explained by the impairment of intangible assets in Q2 22, added to higher AR$-nominated expenses (outpacing the AR$ devaluation).
In Q2 22, a US$2 million improvement was recorded in the financial results compared to Q2 21, reaching a net gain of US$8 million, mainly due to higher profits over the passive monetary position in AR$ due to higher devaluation, partially offset by higher tax interests.
The adjusted EBITDA of our holding and others segment increased by 20%, recording US$36 million in Q2 22. The adjusted EBITDA excludes the equity income from our participation in TGS and Transener. In turn, it adds the EBITDA adjusted by equity ownership in these businesses.
The EBITDA adjusted by our direct and indirect ownership of 29.3% and 29.0% in TGS were US$31 million (US$107 million at 100%) in Q2 22 vs. US$27 million (US$93 million at 100%) in Q2 21. The growth in the total adjusted EBITDA was mainly due to increases in international and local ethane prices, turnover in natural gas transportation and conditioning services in Vaca Muerta, and regulated revenues due to the 60% tariff adjustment in March 2022. However, these effects were partially offset by the higher US$ unit cost of gas, which is used to replace thermal reduction at Cerri Complex Plant (offset in turn by a lower consumption), lower propane and butane export volumes, and a reduced ethane dispatch to Dow Chemical as a result of the programmed maintenance in PBB Polisur.
In Transener, the EBITDA adjusted by our indirect stake ownership of 26.3% amounted to US$7 million in Q2 22 (US$27 million at 100%) vs. US$4 million in Q2 21 (US$14 million at 100%), mainly due to the tariff update in May 2022, retroactive to February 2022 (67% and 69% for Transener and Transba, respectively).
| Pampa Energía ● Q2 22 Earning release ● 15 |
| |
| 3.6 | Analysis of the six-month period, by subsidiary and segment |
| Subsidiary In US$ million | First half 2022 | First half 2021 | |||||||
| % Pampa | Adjusted EBITDA | Net debt2 | Net income3 | % Pampa | Adjusted EBITDA | Net debt2 | Net income3 | ||
| Power generation segment | |||||||||
| Diamante | 61.0% | 2 | (0) | 2 | 61.0% | 3 | (2) | 2 | |
| Los Nihuiles | 52.0% | 0 | (0) | 3 | 52.0% | 0 | (12) | 4 | |
| Greenwind | 11 | 65 | 1 | 10 | 73 | (5) | |||
| Non-controlling stake adjustment | (6) | (32) | (0) | (5) | (36) | 2 | |||
| Subtotal Greenwind adjusted by ownership | 50.0% | 6 | 32 | 0 | 50.0% | 5 | 36 | (2) | |
| CTBSA | 58 | 223 | 67 | 75 | 221 | 32 | |||
| Non-controlling stake adjustment | (29) | (111) | (33) | (37) | (110) | (16) | |||
| Subtotal CTBSA adjusted by ownership | 50.0% | 29 | 111 | 33 | 50.0% | 37 | 110 | 16 | |
| Pampa stand-alone, other companies, adjs. & deletions1 | 100.0% | 182 | 27 | 41 | 100% | 190 | 181 | 93 | |
| Subtotal power generation | 220 | 171 | 79 | 236 | 314 | 113 | |||
| Oil & gas segment | |||||||||
| Pampa stand-alone, other companies, adjs. & deletions1 | #REF! | 158 | 875 | 48 | #REF! | 106 | 915 | (5) | |
| Subtotal oil & gas | 158 | 875 | 48 | 106 | 915 | (5) | |||
| Petrochemicals segment | |||||||||
| Pampa Energía | 100.0% | 25 | - | 19 | 100.0% | 34 | - | 18 | |
| Subtotal petrochemicals | 25 | - | 19 | 34 | - | 18 | |||
| Holding & others segment | |||||||||
| Transener | 36 | (11) | 13 | 31 | 3 | (14) | |||
| Non-controlling stake adjustment | (26) | 8 | (9) | (23) | (2) | 11 | |||
| Subtotal Transener adjusted by ownership | 26.3% | 9 | (3) | 3 | 26.3% | 8 | 1 | (4) | |
| TGS | 244 | 296 | 119 | 205 | 404 | 81 | |||
| Non-controlling stake adjustment | (173) | (210) | (84) | (146) | (287) | (57) | |||
| Subtotal TGS adjusted by ownership | 29.3% | 71 | 87 | 35 | 29.0% | 59 | 117 | 23 | |
| Pampa stand-alone, other companies, adjs. & deletions1 | 100.0% | (5) | (0) | (18) | 100% | (3) | (41) | (4) | |
| Subtotal holding & others | 76 | 84 | 20 | 64 | 77 | 16 | |||
| Deletions | 100% | (1) | (228) | (1) | 100% | - | (265) | - | |
| Total consolidated from continuing operations | 478 | 902 | 165 | 440 | 1,042 | 142 | |||
| At our share ownership | 477 | 1,133 | 165 | 439 | 1,313 | 142 | |||
Note: 1 The deletions correspond to other companies or inter-companies or debt repurchases. 2 Net debt includes holding companies.
3 Attributable to the Company’s shareholders
| Pampa Energía ● Q2 22 Earning release ● 16 |
| |
| 3.7 | Analysis of the quarter, by subsidiary and segment |
| Subsidiary In US$ million | Q2 22 | Q2 21 | |||||||
| % Pampa | Adjusted EBITDA | Net debt2 | Net income3 | % Pampa | Adjusted EBITDA | Net debt2 | Net income3 | ||
| Power generation segment | |||||||||
| Diamante | 61.0% | 1 | (0) | 1 | 61.0% | 2 | (2) | 1 | |
| Los Nihuiles | 52.0% | 0 | (0) | 1 | 52.0% | (0) | (12) | 4 | |
| Greenwind | 5 | 65 | 0 | 5 | 73 | (5) | |||
| Non-controlling stake adjustment | (3) | (32) | (0) | (3) | (36) | 2 | |||
| Subtotal Greenwind adjusted by ownership | 50.0% | 3 | 32 | 0 | 50.0% | 3 | 36 | (2) | |
| CTBSA | 16 | 223 | 23 | 42 | 221 | 11 | |||
| Non-controlling stake adjustment | (8) | (111) | (12) | (21) | (110) | (6) | |||
| Subtotal CTBSA adjusted by ownership | 50.0% | 8 | 111 | 12 | 50.0% | 21 | 110 | 6 | |
| Pampa stand-alone, other companies, adjs. & deletions1 | 100.0% | 87 | 27 | (31) | 100% | 96 | 181 | 58 | |
| Subtotal power generation | 99 | 171 | (18) | 121 | 314 | 66 | |||
| Oil & gas segment | |||||||||
| Pampa stand-alone, other companies, adjs. & deletions1 | #REF! | 102 | 875 | 52 | #REF! | 73 | 915 | 30 | |
| Subtotal oil & gas | 102 | 875 | 52 | 73 | 915 | 30 | |||
| Petrochemicals segment | |||||||||
| Pampa Energía | 100.0% | 19 | - | 14 | 100.0% | 16 | - | 7 | |
| Subtotal petrochemicals | 19 | - | 14 | 16 | - | 7 | |||
| Holding & others segment | |||||||||
| Transener | 27 | (11) | 12 | 14 | 3 | (19) | |||
| Non-controlling stake adjustment | (20) | 8 | (9) | (10) | (2) | 14 | |||
| Subtotal Transener adjusted by ownership | 26.3% | 7 | (3) | 3 | 26.3% | 4 | 1 | (5) | |
| TGS | 107 | 296 | 45 | 93 | 404 | 38 | |||
| Non-controlling stake adjustment | (76) | (210) | (32) | (66) | (287) | (27) | |||
| Subtotal TGS adjusted by ownership | 29.3% | 31 | 87 | 13 | 29.0% | 27 | 117 | 11 | |
| Pampa stand-alone, other companies, adjs. & deletions1 | 100.0% | (4) | (0) | 3 | 100% | (2) | (41) | (1) | |
| Subtotal holding & others | 35 | 84 | 19 | 29 | 77 | 5 | |||
| Deletions | 100% | (1) | (228) | (1) | 100% | - | (265) | - | |
| Total consolidated from continuing operations | 253 | 902 | 66 | 239 | 1,042 | 108 | |||
| At our share ownership | 253 | 1,133 | 66 | 238 | 1,313 | 108 | |||
Note: 1 The deletions correspond to other companies or inter-companies or debt repurchases. 2 Net debt includes holding companies.
3 Attributable to the Company’s shareholders
| Pampa Energía ● Q2 22 Earning release ● 17 |
| |
| 4. | Appendix |
| 4.1 | Power generation’s main operational KPIs |

Note: Gross margin before amortization and depreciation. 1 Operated by Pampa (50% of equity stake).
| Pampa Energía ● Q2 22 Earning release ● 18 |
| |
| 4.2 | Oil and gas production in the main areas |
| In kboe/day at ownership | Semester | Second quarter | ||||||
| 2022 | 2021 | Variation | 2022 | 2021 | Variation | |||
| Gas | ||||||||
| El Mangrullo | 39.7 | 28.4 | +39% | 43.1 | 29.4 | +46% | ||
| Río Neuquén | 8.8 | 5.6 | +57% | 8.9 | 6.4 | +39% | ||
| Sierra Chata | 4.2 | 2.7 | +56% | 4.2 | 2.7 | +54% | ||
| Rincón del Mangrullo1 | 2.2 | 3.5 | -36% | 2.1 | 3.4 | -37% | ||
| Others | 1.1 | 1.2 | -3% | 1.2 | 1.2 | -0% | ||
| Total gas at O/S | 56.0 | 41.4 | +35% | 59.6 | 43.2 | +38% | ||
| Oil | ||||||||
| El Tordillo2 | 2.6 | 2.4 | +8% | 2.5 | 2.5 | +0% | ||
| Gobernador Ayala | 1.0 | 0.9 | +10% | 1.0 | 0.9 | +8% | ||
| Associated oil3 | 1.0 | 0.8 | +17% | 1.0 | 0.8 | +16% | ||
| Others | 0.5 | 0.2 | +113% | 0.5 | 0.3 | +91% | ||
| Total oil at O/S | 5.1 | 4.4 | +16% | 5.1 | 4.6 | +10% | ||
| Total | 61.1 | 45.8 | +34% | 64.6 | 47.7 | +35% | ||
Note: Production in Argentina. 1 It doesn’t include shale formation. 2 It includes La Tapera - Puesto Quiroga block. 3 From gas fields.
| 5. | Glossary of terms |
| Term | Definition |
| 6M 22-6M 21 | First six months of 2022/First six months of 2021 |
| ADR/ADS | American Depositary Receipts |
| AR$ | Argentine Pesos |
| Bbl | Barrel |
| Boe | Barrels of oil equivalent |
| CAMMESA | Compañía Administradora del Mercado Eléctrico Mayorista S.A. (Argentine Wholesale Electricity Market Clearing Company) |
| CB | Corporate Bonds |
| CC | Combined Cycle |
| CPB | Piedra Buena Thermal Power Plant |
| CTBSA | CT Barragán S.A. |
| CTEB | Ensenada Barragán Thermal Power Plant |
| CTG | Güemes Thermal Power Plant |
| CTGEBA | Genelba Thermal Power Plant |
| CTIW | Ingeniero White Thermal Power Plant |
| CTLL | Loma De la Lata Thermal Power Plant |
| CTP | Piquirenda Thermal Power Plant |
| CTPP | Parque Pilar Thermal Power Plant |
| E&P | Exploration and Production |
| EBITDA | Earnings before interest, tax, depreciation and amortization |
| EcoEnergía | EcoEnergía Co-Generation Power Plant |
| Energía Plus | Energía Plus Program, SE Res. No. 1,281/06 |
| FS | Financial Statements |
| FV | Face value |
| FX | Nominal exchange rate |
| Pampa Energía ● Q2 22 Earning release ● 19 |
| |
| GE | General Electric |
| Greenwind | Greenwind S.A. |
| GWh | Gigawatt-hour |
| HIDISA | Diamante Hydro Power Plant |
| HINISA | Los Nihuiles Hydro Power Plant |
| HMRT | Horas de Alto Requerimiento Térmico del Mes (Hours of the month with a high thermal demand) |
| HPPL | Pichi Picún Leufú Hydro Power Plant |
| IDB Invest | Inter-American Development Bank Invest (former Inter-American Investment Corporation - IIC) |
| IFRS | International Financial Reporting Standards |
| Kbbl/kboe | Thousands of barrels/thousands of barrels of oil equivalent |
| M3 | Cubic meters |
| MAT ER | Term Market from Renewable Energy Sources |
| MBTU | Million British Thermal Units |
| MW/MWh | Megawatt/Megawatt-hora |
| N.a. | Not applicable |
| Pampa / The Company | Pampa Energía S.A. |
| Pampa Group | Pampa Energía S.A. and its subsidiaries |
| PEMC | Ingeniero Mario Cebreiro Wind Farm |
| PEPE | Pampa Energía Wind Farm |
| Plan Gas.Ar | Argentine Natural Gas Production Promotion Program – 2020 – 2024 Supply and Demand Scheme (DNU No. 892/20 and supplementary regulations) |
| PPA | Power Purchase Agreement |
| PPE | Property, Plant and Equipment |
| Q1 22/Q1 21 | First quarter of 2022/First quarter of 2021 |
| Q2 22/Q2 21 | Second quarter of 2022/Second quarter of 2021 |
| Res. | Resolution/Resolutions |
| SACDE-Techint Joint Ventures | Unión Transitoria de Empresas Sociedad Argentina de Construcción y Desarrollo Estratégico S.A. y Techint Compañía Técnica Internacional S.A.C.E I. |
| SE | Secretariat of Energy |
| SEE | Under Secretariat of Electric Energy (former Secretariat of Electric Energy) |
| ST | Steam turbine |
| TGS | Transportadora de Gas del Sur S.A. |
| Ton | Metric ton |
| Transba | Empresa de Transporte de Energía Eléctrica por Distribución Troncal de la Provincia de Buenos Aires Transba S.A. |
| Transener | Compañía de Transporte de Energía Eléctrica en Alta Tensión Transener S.A. |
| US$ | U.S. Dollars |
| UVA | Unidad de Valor Adquisitivo (Acquisitive Value Units) |