Pampa Energía, an independent company with active participation in Argentina’s electricity and gas value chain, announces the results for the nine-month period and quarter ended on September 30, 2022. |
Buenos Aires, November 7, 2022
Stock information 
Share capital net of repurchases and reductions
as of November 4, 2022
1,383.6 million common shares/
55.3 million ADS Market capitalization:
AR$437.9 billion/US$1,434 million Information about the videoconference Date and time: Tuesday, November 8
10 AM Eastern Standard Time
12 PM Buenos Aires Time Access link: bit.ly/Pampa3Q2022VC For further information about Pampa · Email: investor@pampaenergia.com · Website for investors: ri.pampaenergia.com/en · Argentina’s Securities and Exchange Commission: www.argentina.gob.ar/cnv · Securities and Exchange Commission: sec.gov | | Basis of presentation Pampa’s financial information adopts US$ as functional currency, expressed in AR$ at transactional FX. However, our affiliates, Transener and TGS, report in local currency. Hence, their figures are adjusted by inflation as of September 30, 2022, except for previous periods already reported. Main results from the quarter[1] 17% year-on-year increase in sales, recording US$507 million[2] in Q3 22, explained by natural gas peak seasonality and higher prices in petrochemicals, Energía Plus and legacy energy, partially offset by the end of PPAs at CTLL’s ST and CTP.
Outstanding operating performance in natural gas and oil production (+20% and +14% year-on-year, respectively). |
| | Pampa's main operational KPIs | Q3 22 | Q3 21 | Variation |
| | Power | Generation (GWh) | 3,767 | 4,512 | -17% |
| | | Gross margin (US$/MWh) | 24.2 | 31.0 | -22% |
| | | | | | |
| | Hydrocarbon | Production (k boe/day) | 68,5 | 57,4 | +19% |
| | | Gas over total production | 92% | 92% | +0% |
| | | Average gas price (US$/MBTU) | 4.8 | 4.4 | +9% |
| | | Average oil price (US$/bbl) | 70.2 | 61.6 | +14% |
| | | | | | |
| | Petrochemicals | Volume sold (k ton) | 120 | 129 | -7% |
| | | Average price (US$/ton) | 1,496 | 1,118 | +34% |
| | | | | | |
| | 5% year-on-year decrease in the adjusted EBITDA[3], recording US$246 million in Q3 22, explained by power generation (-US$36 million) and holding and others (-US$4 million), offset by oil and gas (+US$14 million), and petrochemicals (+US$12 million). Profit attributable to the Company’s shareholders of US$176 million, 35% higher than Q3 21, mainly due to operating performance plus higher gains from holding financial securities and depreciation over the passive monetary position in AR$, offset by higher income tax charge. Net debt slightly grew to US$927 million, with a net leverage ratio of 1.3x. |
[1] The information is based on FS prepared according to IFRS in force in Argentina. Only continuing operations are considered.
[2] It does not include sales from the affiliates CTBSA, Transener and TGS, which at our ownership account for US$47 million. Greenwind was an affiliate until August 12, 2022, when Pampa fully owned the company and began to consolidate in FS. Under IFRS, affiliates are not consolidated in Pampa, thus shown as ‘Results for participation in joint businesses and associates.’
[3] Consolidated adjusted EBITDA represents the results before financial results, income tax, depreciations and amortizations, extraordinary and non-cash income and expense, equity income and other adjustments from the IFRS implementation, and includes affiliates’ EBITDA at our ownership. For further information, see section 3 of this Earnings release.
| | |
| Pampa Energía ● Earnings release Q3 22 ● | 1 |
Table of contents
| | |
| Pampa Energía ● Earnings release Q3 22 ● | 2 |
| 1.1 | Plan Gas.Ar: Time extension and new call for tender |
The Government issued Executive Order No. 730/22 on November 4, 2022, which extends Plan Gas.Ar until December 31, 2028, among other measures. The extension aims to consolidate the baseline production volume of 70 million m3/day awarded in the previous Plan Gas.Ar’s rounds and tender additional volume to tap the new transportation capacity.
Moreover, the Executive Order allows producers to export on ToP even in winter, ranking first those with the most competitive prices and/or largest volume under Plan Gas.Ar, once the domestic market is fulfilled. However, the volume exported by each producer should not exceed 30% of the national authorized export quota or 50% of the committed delivery under Plan Gas.Ar.
Finally, the Government’s provisional compensation payment increases from 75% to 85%, and during excess supply, the delivery volume prioritizes older rounds with the most competitive price.
| 1.2 | Acquisitions and divestments |
Acquisition of 50% of Greenwind – change of control
On August 12, 2022, the Pampa Group acquired from its former business partner the indirect stake in Greenwind (representing 50% of its capital stock and votes) for an amount of US$20.5 million. Therefore, the Pampa Group holds full ownership of Greenwind.
Greenwind’s sole asset is PEMC, a wind farm with an installed capacity of 100 MW and a PPA with CAMMESA under RenovAr for 20 years from its commissioning on June 8, 2018. As of June 30, 2022, the net debt of Greenwind amounts to US$65 million.
Sale of Refinor’s stake
On September 15, 2022, Pampa signed an agreement with Hidrocarburos del Norte S.A. to sell its Refinor’s ‘class A’ shares, representing 28.5% of its share capital, for a price of US$5.7 million.
On October 14, 2022, the Company transferred the mentioned shares fulfilling the signed contract. As a result, Pampa received US$1.7 million and a pending payment of US$4 million, financed at an 8% annual rate for one year as from the date of sale.
| 1.3 | Transener and Transba: public hearing for tariff increase |
On October 21, 2022, the ENRE called the power transmission utilities, including Transener and Transba, to a public hearing on November 30, 2022, to present the proposals for a transition tariff increase (ENRE Res. No. 539/22).
| 1.4 | Share capital reduction |
On October 17, 2022, 2.8 million shares (equivalent to 0.1 million ADR) were canceled, which was previously approved by the shareholders’ meeting on April 27, 2022.
| | |
| Pampa Energía ● Earnings release Q3 22 ● | 3 |
| 2.1 | Consolidated balance sheet |
| Figures in million | | As of 9.30.2022 | | As of 12.31.2021 |
| | AR$ | US$ FX 147,32 | | AR$ | US$ FX 102,72 |
| ASSETS | | | | | | |
| Property, plant and equipment | | 282,322 | 1,916 | | 170,390 | 1,659 |
| Intangible assets | | 11,028 | 75 | | 3,956 | 39 |
| Right-of-use assets | | 1,207 | 8 | | 1,231 | 12 |
| Deferred tax asset | | 34,719 | 236 | | 8,675 | 84 |
| Investments in joint ventures and associates | | 134,244 | 911 | | 79,500 | 774 |
| Financial assets at amortized cost | | 14,960 | 102 | | 10,821 | 105 |
| Financial assets at fair value through profit and loss | | 4,299 | 29 | | 2,998 | 29 |
| Other assets | | 79 | 1 | | 61 | 1 |
| Trade and other receivables | | 3,540 | 24 | | 3,379 | 33 |
| Total non-current assets | | 486,398 | 3,302 | | 281,011 | 2,736 |
| | | | | | | |
| Inventories | | 24,802 | 168 | | 15,888 | 155 |
| Financial assets at amortized cost | | 1,899 | 13 | | 537 | 5 |
| Financial assets at fair value through profit and loss | | 84,731 | 575 | | 47,026 | 458 |
| Derivative financial instruments | | 177 | 1 | | 16 | 0 |
| Trade and other receivables | | 67,816 | 460 | | 40,892 | 398 |
| Cash and cash equivalents | | 14,259 | 97 | | 11,283 | 110 |
| Total current assets | | 193,684 | 1,315 | | 115,642 | 1,126 |
| | | | | | | |
| Assets classified as held for sale | | 1,816 | 12 | | - | - |
| | | | | | | |
| Total assets | | 681,898 | 4,629 | | 396,653 | 3,861 |
| | | | | | | |
| EQUITY | | | | | | |
| Equity attributable to owners of the company | | 322,664 | 2,190 | | 183,431 | 1,786 |
| | | | | | | |
| Non-controlling interest | | 1,217 | 8 | | 609 | 6 |
| | | | | | | |
| Total equity | | 323,881 | 2,198 | | 184,040 | 1,792 |
| | | | | | | |
| LIABILITIES | | | | | | |
| Investments in joint ventures | | - | - | | 386 | 4 |
| Provisions | | 21,065 | 143 | | 14,444 | 141 |
| Income tax and presumed minimum income tax liabilities | | 47,823 | 325 | | 19,287 | 188 |
| Deferred tax liabilities | | 7,636 | 52 | | - | - |
| Defined benefit plans | | 3,597 | 24 | | 2,419 | 24 |
| Borrowings | | 195,733 | 1,329 | | 139,630 | 1,359 |
| Trade and other payables | | 2,648 | 18 | | 1,340 | 13 |
| Total non-current liabilities | | 278,502 | 1,890 | | 177,506 | 1,728 |
| | | | | | | |
| Provisions | | 656 | 4 | | 560 | 5 |
| Income tax liabilities | | 34 | 0 | | 2,098 | 20 |
| Taxes payables | | 5,668 | 38 | | 2,314 | 23 |
| Defined benefit plans | | 395 | 3 | | 515 | 5 |
| Salaries and social security payable | | 4,018 | 27 | | 2,876 | 28 |
| Derivative financial instruments | | - | - | | 18 | 0 |
| Borrowings | | 41,788 | 284 | | 8,165 | 79 |
| Trade and other payables | | 26,956 | 183 | | 18,561 | 181 |
| Total current liabilities | | 79,515 | 540 | | 35,107 | 342 |
| | | | | | | |
| Total liabilities | | 358,017 | 2,430 | | 212,613 | 2,070 |
| | | | | | | |
| Total liabilities and equity | | 681,898 | 4,629 | | 396,653 | 3,861 |
| | |
| Pampa Energía ● Earnings release Q3 22 ● | 4 |
| 2.2 | Consolidated income statement |
| | | Nine-month period | | Third quarter |
| Figures in million | | 2022 | | 2021 | | 2022 | | 2021 |
| | | AR$ | US$ | | AR$ | US$ | | AR$ | US$ | | AR$ | US$ |
| Sales revenue | | 168,748 | 1,381 | | 103,740 | 1,102 | | 69,225 | 507 | | 42,529 | 435 |
| Local market sales | | 136,862 | 1,114 | | 88,575 | 942 | | 58,154 | 426 | | 35,135 | 359 |
| Foreign market sales | | 31,886 | 267 | | 15,165 | 160 | | 11,071 | 81 | | 7,394 | 76 |
| Cost of sales | | (104,797) | (865) | | (62,652) | (666) | | (43,538) | (322) | | (27,309) | (280) |
| | | | | | | | | | | | | |
| Gross profit | | 63,951 | 516 | | 41,088 | 436 | | 25,687 | 185 | | 15,220 | 155 |
| | | | | | | | | | | | | |
| Selling expenses | | (4,945) | (41) | | (1,752) | (18) | | (1,587) | (11) | | (669) | (6) |
| Administrative expenses | | (12,389) | (101) | | (6,301) | (67) | | (5,063) | (38) | | (2,258) | (23) |
| Exploration expenses | | (23) | - | | (50) | - | | (8) | - | | (6) | - |
| Other operating income | | 10,345 | 79 | | 8,864 | 92 | | 5,988 | 43 | | 4,018 | 42 |
| Other operating expenses | | (4,209) | (33) | | (4,623) | (50) | | (1,577) | (10) | | (792) | (8) |
| Impairment of financial assets | | (672) | (5) | | (229) | (3) | | (153) | (1) | | (33) | (1) |
| Impairment of PPE, int. assets & inventories | | (4,260) | (34) | | (172) | (2) | | 124 | 1 | | - | - |
| Results for part. in joint businesses & associates | | 13,610 | 100 | | 8,131 | 85 | | 6,749 | 43 | | 5,030 | 51 |
| | | | | | | | | | | | | |
| Operating income | | 61,408 | 481 | | 44,956 | 473 | | 30,160 | 212 | | 20,510 | 210 |
| | | | | | | | | | | | | |
| Financial income | | 597 | 6 | | 619 | 7 | | 147 | 1 | | 282 | 4 |
| Financial costs | | (18,127) | (148) | | (14,128) | (151) | | (9,333) | (70) | | (6,287) | (65) |
| Other financial results | | 4,108 | 33 | | 2,813 | 29 | | 8,278 | 68 | | (118) | - |
| Financial results, net | | (13,422) | (109) | | (10,696) | (115) | | (908) | (1) | | (6,123) | (61) |
| | | | | | | | | | | | | |
| Profit before tax | | 47,986 | 372 | | 34,260 | 358 | | 29,252 | 211 | | 14,387 | 149 |
| | | | | | | | | | | | | |
| Income tax | | (5,224) | (26) | | (7,786) | (83) | | (5,195) | (32) | | (1,680) | (19) |
| | | | | | | | | | | | | |
| Net income for continuing operations | | 42,762 | 346 | | 26,474 | 275 | | 24,057 | 179 | | 12,707 | 130 |
| | | | | | | | | | | | | |
| Net income (loss) from discontinued operations | | - | - | | (7,129) | (75) | | - | - | | - | - |
| | | | | | | | | | | | | |
| Net income (loss) for the period | | 42,762 | 346 | | 19,345 | 200 | | 24,057 | 179 | | 12,707 | 130 |
| Attributable to the owners of the Company | | 42,448 | 343 | | 22,577 | 234 | | 23,979 | 178 | | 12,804 | 131 |
| Continuing operations | | 42,448 | 343 | | 26,303 | 273 | | 23,979 | 178 | | 12,804 | 131 |
| Discontinued operations | | - | - | | (3,726) | (39) | | - | - | | - | - |
| Attributable to the non-controlling interests | | 314 | 3 | | (3,232) | (34) | | 78 | 1 | | (97) | (1) |
| | | | | | | | | | | | | |
| Net income (loss) per share to shareholders | | 30.74 | 0.25 | | 15.98 | 0.17 | | 17.38 | 0.13 | | 9.26 | 0.09 |
| From continuing operations | | 30.74 | 0.25 | | 18.62 | 0.19 | | 17.38 | 0.13 | | 9.26 | 0.09 |
| From discontinued operations | | - | - | | (2.64) | (0.03) | | - | - | | - | - |
| | | | | | | | | | | | | |
| Net income (loss) per ADR to shareholders | | 768.43 | 6.21 | | 399.45 | 4.14 | | 434.40 | 3.23 | | 231.45 | 2.36 |
| From continuing operations | | 768.43 | 6.21 | | 465.38 | 4.82 | | 434.40 | 3.23 | | 231.45 | 2.36 |
| From discontinued operations | | - | - | | (65.92) | (0.68) | | - | - | | - | - |
| | | | | | | | | | | | | |
| Average outstanding common shares1 | | 1,381 | 1,381 | | 1,413 | 1,413 | | 1,380 | 1,380 | | 1,383 | 1,383.0 |
| Outstanding shares by the end of period1 | | 1,380 | 1,380 | | 1,382 | 1,382 | | 1,380 | 1,380 | | 1,382 | 1,382.0 |
Note: 1 It includes shares from the Employee stock-based compensation plan, which as of September 30, 2022 and 2021 amounted to 3.9 million common shares.
| | |
| Pampa Energía ● Earnings release Q3 22 ● | 5 |
| 2.3 | Cash and financial borrowings |
As of September 30, 2022,
in US$ million | | Cash1 | | Financial debt | | Net debt | |
| | Consolidated
in FS | Ownership adjusted | | Consolidated
in FS | Ownership adjusted | | Consolidated
in FS | Ownership adjusted | |
| |
| Power generation | | 566 | 563 | | 649 | 649 | | 82 | 86 | |
| Petrochemicals | | - | - | | - | - | | - | - | |
| Holding and others | | 1 | 1 | | - | - | | (1) | (1) | |
| Oil and gas | | 118 | 118 | | 963 | 963 | | 846 | 846 | |
| Total under IFRS/Restricted Group | | 685 | 681 | | 1,612 | 1,612 | | 927 | 931 | |
| Affiliates at O/S2 | | 103 | 103 | | 291 | 291 | | 188 | 188 | |
| Total with affiliates | | 788 | 784 | | 1,904 | 1,904 | | 1,115 | 1,119 | |
Note: Financial debt includes accrued interest. 1 It includes cash and cash equivalents, financial assets at fair value with changing results, and investments at amortized cost. 2 Under IFRS, the affiliates CTBSA, Transener and TGS are not consolidated in Pampa.
Debt transactions
Pampa’s financial debt at the consolidated level under IFRS slightly increased to US$1,612 million as of September 30, 2022 (+12% vs. the end of 2021). However, net debt only increased by 7%, reaching US$927 million. The average interest rate for US$-bearing indebtedness was 8.3%, in which 84.5% of the Company’s gross debt is denominated, mainly at a fixed rate. AR$ indebtedness’s average interest rate was 65.1%. Pampa’s consolidated financial debt averaged 3.7 years.
The chart below shows the principal maturity profile, net of repurchases, in US$ million by the end of Q3 22:

Note: It only considers Pampa consolidated under IFRS; it does not include affiliates TGS, Transener, and CTBSA.
In Q3 22, Pampa exchanged US$407.1 million FV of 2023 Notes for US$122.1 million in cash and issued 2026 Notes for US$292.8 million FV at a 9.5% interest rate, amortizing in three consecutive annual installments from December 2024. Moreover, Pampa issued Series XI CB for AR$21,655 million at Badlar Privada variable interest rate plus 0%, maturing in 18 months, and took net borrowings for AR$7,080 million and imports pre-financing loan for US$6.8 million.
Regarding our affiliates, in Q3 22, CTBSA issued Series VIII CB for AR$4,236 million at a Badlar Privada variable interest rate plus 1%, maturing in 18 months and paid US$6 million of the syndicated loan. Moreover, TGS undertook short-term bank loans for US$8 million and imports pre-financing loan for US$1 million, while Transener paid loans for AR$83 million. After the closing of Q3 22, CTBSA paid US$2 million of the syndicated loan, TGS undertook net imports pre-financing loan for US$0.9 million, and Transener settled borrowings for AR$28 million.
As of this Earnings release issuance, the Company complies with the covenants established in its debt agreements.
| | |
| Pampa Energía ● Earnings release Q3 22 ● | 6 |
Summary of debt securities
Company
In million | Security | Maturity | Amount issued | Amount
net of repurchases | Coupon |
| In US$ | | | | | |
| Pampa | CB Series T at discount & fixed rate2 | 2023 | 500 | 93 | 7.375% |
| CB Series IX at par & fixed rate | 2026 | 293 | 179 | 9.5% |
| CB Series I at discount & fixed rate | 2027 | 750 | 604 | 7.5% |
| CB Series III at discount & fixed rate | 2029 | 300 | 293 | 9.125% |
| TGS1 | CB at discount at fixed rate | 2025 | 500 | 470 | 6.75% |
| | | | | | |
| In US$-link | | | | | |
| CTEB1 | CB Series I | 2023 | 43 | 43 | 4% |
| CB Series IV | 2024 | 96 | 96 | 0% |
| CB Series VI3 | 2025 | 25 | 25 | 0% |
| | | | | | |
| In AR$ | | | | | |
| Pampa | CB Series VIII (Green Bond) | 2023 | 3,107 | 3,107 | Badlar Privada +2% |
| CB Series XI | 2024 | 21,655 | 21,655 | Badlar Privada +0% |
| CTEB1 | CB Series VII3 | 2023 | 1,754 | 1,754 | Badlar Privada +2.98% |
| CB Series VIII3 | 2024 | 4,236 | 4,236 | Badlar Privada +1% |
| | | | | | |
| In UVA | | | | | |
| CTEB1 | CB Series II | 2024 | 65 | 65 | 4% |
Note: 1 According to IFRS, affiliates are not consolidated in Pampa’s FS. 2 Net amount after the exchange. 3 CB secured by YPF and Pampa, subject to suspensive and resolutory conditions.
Credit rating
The following table shows the Pampa Group’s ratings:
| Company | Agency | Rating |
| Global | Local |
| Pampa | S&P | b-1 | na |
| Moody's | Caa3 | na |
| FitchRatings2 | B- | AA (long-term)
A1+ (short-term) |
| TGS | S&P | CCC+ | na |
| Moody's | Caa3 | na |
| Transener | FitchRatings2 | na | A+ (long-term) |
| CTEB | FitchRatings2 | na | A+ |
Note: 1 Stand-alone. 2 Local ratings issued by FIX SCR
| | |
| Pampa Energía ● Earnings release Q3 22 ● | 7 |
| 3. | Analysis of the Q3 22 results |
Breakdown by segment
Figures in US$ million | Q3 22 | Q3 21 | Variation |
| Sales | Adjusted EBITDA | Net Income | Sales | Adjusted EBITDA | Net Income | Sales | Adjusted EBITDA | Net Income |
| | | | | | | | | | |
| Power generation | 169 | 89 | 119 | 173 | 126 | 74 | -2% | -29% | +62% |
| Oil and Gas | 189 | 117 | 5 | 148 | 104 | 32 | +28% | +13% | -84% |
| Petrochemicals | 179 | 19 | 19 | 144 | 7 | 6 | +24% | +172% | +217% |
| Holding and Others | 4 | 21 | 35 | 4 | 24 | 19 | - | -15% | +84% |
| Eliminations | (34) | - | - | (34) | - | - | - | NA | NA |
| | | | | | | | | | |
| Total continuing operations | 507 | 246 | 178 | 435 | 261 | 131 | +17% | -5% | +36% |
Note: Net income attributable to the Company’s shareholders.
| 3.1 | Reconciliation of consolidated adjusted EBITDA |
Reconciliation of adjusted EBITDA,
in US$ million | | Nine-month period | | Third quarter |
| | 2022 | 2021 | | 2022 | 2021 |
| Consolidated operating income | | 481 | 473 | | 212 | 210 |
| Consolidated depreciations and amortizations | | 160 | 147 | | 54 | 56 |
| EBITDA | | 641 | 620 | | 266 | 266 |
| | | | | | | |
| Adjustments from generation segment | | (25) | 21 | | (36) | 7 |
| Deletion of equity income | | (67) | (32) | | (33) | (18) |
| Deletion of PPE's impairment | | - | 2 | | - | - |
| Deletion of provision recovery of PEPE IV bond | | - | (13) | | - | - |
| Deletion of gain from commercial interests | | (17) | (20) | | (11) | (8) |
| Deletion of provision in outages | | 6 | 8 | | - | - |
| Deletion of PPE activation in operating expenses | | 16 | 8 | | 5 | 8 |
| Greenwind's EBITDA adjusted by ownership | | 7 | 8 | | 1 | 3 |
| CTBSA's EBITDA adjusted by ownership | | 31 | 59 | | 2 | 21 |
| Adjustments from oil and gas segment | | 27 | 12 | | (2) | (0) |
| Deletion of PPE & inventories' impairment | | 29 | - | | - | - |
| Deletion of gain from commercial interests | | (2) | (2) | | (2) | (0) |
| Deletion of provision for environmental remediation | - | 14 | | - | - |
| Adjustments from petrochemicals segment | | (0) | (0) | | (0) | (0) |
| Deletion of gain from commercial interests | | (0) | (0) | | (0) | (0) |
| Adjustments from holding & others segment | | 81 | 49 | | 18 | (12) |
| Deletion of equity income | | (33) | (53) | | (10) | (33) |
| Deletion of gain from commercial interests | | (1) | (0) | | (0) | (0) |
| Deletion of contigencies provision | | - | 12 | | - | (1) |
| Deletion of executive compensation liabilities' reversal | - | (7) | | - | (7) |
| Deletion of intangible assets' impairment | | 5 | - | | (1) | - |
| TGS's EBITDA adjusted by ownership | | 97 | 84 | | 26 | 25 |
| Transener's EBITDA adjusted by ownership | | 12 | 12 | | 3 | 4 |
| | | | | | | |
| Consolidated adjusted EBITDA, continuing op. | | 724 | 701 | | 246 | 261 |
| At our ownership | | 723 | 700 | | 246 | 261 |
| | |
| Pampa Energía ● Earnings release Q3 22 ● | 8 |
| 3.2 | Analysis of the power generation segment |
Power generation segment, consolidated
Figures in US$ million | | Nine-month period | | Third quarter |
| | 2022 | 2021 | ∆% | | 2022 | 2021 | ∆% |
| Sales revenue | | 500 | 501 | -0% | | 169 | 173 | -2% |
| Local market sales | | 500 | 501 | -0% | | 169 | 173 | -2% |
| Foreign market sales | | - | - | NA | | - | - | NA |
| Cost of sales | | (278) | (266) | +5% | | (94) | (95) | -1% |
| | | | | | | | | |
| Gross profit | | 222 | 235 | -6% | | 75 | 78 | -4% |
| | | | | | | | | |
| Selling expenses | | (2) | (1) | +100% | | (1) | - | NA |
| Administrative expenses | | (29) | (21) | +38% | | (10) | (8) | +25% |
| Other operating income | | 18 | 36 | -50% | | 11 | 10 | +10% |
| Other operating expenses | | (3) | (4) | -25% | | (1) | (2) | -50% |
| Impairment of PPE | | - | (2) | -100% | | - | - | NA |
| Results for participation in joint businesses | | 67 | 32 | +109% | | 33 | 18 | +83% |
| | | | | | | | | |
| Operating income | | 273 | 275 | -1% | | 107 | 96 | +11% |
| | | | | | | | | |
| Finance income | | 1 | 3 | -67% | | - | 2 | -100% |
| Finance costs | | (47) | (32) | +47% | | (20) | (10) | +100% |
| Other financial results | | (11) | 13 | NA | | 31 | - | NA |
| Financial results, net | | (57) | (16) | +256% | | 11 | (8) | NA |
| | | | | | | | | |
| Profit (loss) before tax | | 216 | 259 | -17% | | 118 | 88 | +34% |
| | | | | | | | | |
| Income tax | | (15) | (70) | -79% | | 2 | (15) | NA |
| | | | | | | | | |
| Net income (loss) for the period | | 201 | 189 | +6% | | 120 | 73 | +64% |
| Attributable to owners of the Company | | 198 | 187 | +6% | | 119 | 74 | +62% |
| Attributable to non-controlling interests | | 3 | 2 | +50% | | 1 | (1) | NA |
| | | | | | | | | |
| Adjusted EBITDA | | 309 | 362 | -14% | | 89 | 126 | -29% |
| Adjusted EBITDA at our share ownership | | 308 | 361 | -15% | | 89 | 127 | -30% |
| | | | | | | | | |
| Increases in PPE | | 99 | 7 | NA | | 69 | 2 | NA |
| Depreciation and amortization | | 61 | 66 | -8% | | 18 | 23 | -22% |
In Q3 22, the slight decrease in power generation sales is mainly explained by the PPA maturity at CTLL’s ST and CTP, which are currently remunerated as legacy energy from November 1, 2021, and July 15, 2021, respectively. Moreover, it also affected CTLL’s GT05 outage between July and half of August 2022 and the lower power dispatch at Genelba Plus’s combined cycle due to a lack of gas for generation.
The effects above were partially offset by higher prices and volumes sold under legacy energy[4], which showed resilience despite being remunerated in Argentine Pesos and facing nominal depreciation. Therefore, the power capacity remuneration was US$4.5 thousand/MW-month for our thermal legacy units (+25% vs. Q3 21) and US$2.1 thousand/MW-month for our hydros (+4% vs. Q3 21). Legacy energy comprises 74% of the 4,970 MW operated by Pampa[5], but it represented only 30% of the segment’s sales in Q3 22. Moreover, we recorded higher sales under Energía Plus due to better prices and demand compared to Q3 21’s CTGEBA and CTG plus units outages, plus full consolidation of PEMC since August 12, 2022[6].
In operating terms, in Q3 22, the power generation operated by Pampa decreased by 17% vs. Q3 21, mainly because of lower gas availability during the winter, which affected CTGEBA and CTEB (-815 GWh). Also, technical outages occurred in some units of CTLL, wind farms and CTG (-129 GWh). However, these effects were partially offset by the higher dispatch with liquid fuel at CPB, CTPP and CTIW (+171 GWh), and higher water input at HPPL and HINISA (+35 GWh).
[4] 30% remuneration increase and permanent elimination of utilization factor as of Feb-22, plus an additional 10% increase in Jun-22.
[5] Under IFRS, CTEB (567 MW) is an affiliate and its result is not consolidated in the FS, but it is operated by Pampa and its EBITDA at our equity stake is included in Pampa’s adjusted EBITDA.
[6] For more information, see section 1.1 of this Earnings release
| | |
| Pampa Energía ● Earnings release Q3 22 ● | 9 |
The power generation units operated by Pampa reached an improved availability rate of 96.1% in Q3 22, recording 112 basis points higher year-on-year (95.0% in Q3 21), mainly due to last year’s forced unavailabilities at HINISA and at CTGEBA and CTG plus units. CTLL’s out-of-service and programmed maintenance partially offset the abovementioned effects in Q3 22. However, thermal units recorded a slight decrease in availability, reaching 95.9% in Q3 22 (-17 basis points vs. 96.1% in Q3 21).
Power generation's
key performance indicators | | 2022 | | 2021 | | Variation |
| Hydro | Wind | Thermal | Total | Hydro | Wind | Thermal | Total | Hydro | Wind | Thermal | Total |
| Installed capacity (MW) | | 938 | 206 | 3,826 | 4,970 | | 938 | 206 | 3,826 | 4,970 | | - | - | - | - |
| New capacity (%) | | - | 100% | 28% | 26% | | - | 100% | 47% | 41% | | - | - | -20% | -15% |
| Market share (%) | | 2.2% | 0.5% | 8.9% | 11.6% | | 2.2% | 0.5% | 9.0% | 11.7% | | -0% | -0% | -0% | -0% |
| | | | | | | | | | | | | | | | |
| Nine-month period | | | | | | | | | | | | | | | |
| Net generation (GWh) | | 888 | 655 | 11,594 | 13,136 | | 923 | 642 | 11,197 | 12,763 | | -4% | +2% | +4% | +3% |
| Volume sold (GWh) | | 888 | 673 | 12,437 | 13,999 | | 923 | 667 | 11,841 | 13,431 | | -4% | +1% | +5% | +4% |
| | | | | | | | | | | | | | | | |
| Average price (US$/MWh) | | 27 | 70 | 42 | 42 | | 24 | 70 | 49 | 48 | | +13% | -0% | -15% | -13% |
| Average gross margin (US$/MWh) | | 8 | 57 | 25 | 25 | | 7 | 59 | 32 | 32 | | +22% | -2% | -24% | -21% |
| | | | | | | | | | | | | | | | |
| Third quarter | | | | | | | | | | | | | | | |
| Net generation (GWh) | | 292 | 212 | 3,263 | 3,767 | | 262 | 236 | 4,015 | 4,512 | | +12% | -10% | -19% | -17% |
| Volume sold (GWh) | | 292 | 218 | 3,532 | 4,042 | | 262 | 244 | 4,259 | 4,765 | | +11% | -11% | -17% | -15% |
| | | | | | | | | | | | | | | | |
| Average price (US$/MWh) | | 25 | 71 | 44 | 44 | | 25 | 70 | 47 | 47 | | +1% | +2% | -7% | -6% |
| Average gross margin (US$/MWh) | | 5 | 55 | 24 | 24 | | 0 | 59 | 31 | 31 | | na | -6% | -24% | -22% |
Note: Gross margin before amortization and depreciation. It includes CTEB and PEMC, operated by Pampa (50% equity stake). Since August 12, 2022, PEMC has been fully-owned and consolidated in FS.
In Q3 22, net operating costs, excluding depreciation and amortizations, increased by 7% vs. Q3 21, mainly explained by CTLL’s repair expenses and higher payroll, by which inflation outpaced the AR$ devaluation. These effects were partially offset by lower energy purchases to cover Plus contracts because technical issues affected Plus units in Q3 21.
The Q3 22 financial results posted a net gain of US$11 million, US$20 million more than the US$8 million net loss in Q3 21, mainly explained by higher gains from holding financial securities, partially offset by higher losses from devaluation over AR$-trade receivables and financial interests due to increased debt in AR$ and the full consolidation in FS of PEMC.
In Q3 22, our power generation’s adjusted EBITDA recorded US$89 million (-29% vs. Q3 21), mainly explained by the end of PPAs at CTLL’s ST, CTP and CTEB and, to a lower extent, the technical outages and the US$ increase in labor expenses. Said variation was partially offset by the rise in legacy energy and Energía Plus sales, the consolidation of PEMC and decreased volume in energy purchases. In addition, the EBITDA considers our proportional 50% stake in CTEB (CTBSA) (US$2 million in Q3 22 vs. US$21 million in Q3 21), and a 50% stake in PEMC (Greenwind) (US$1 million in Q3 22 vs. US$3 million in Q3 21)[7]. The adjusted EBITDA excludes the PPE impairments charged as operating expenses and the recognition of commercial interests from delayed receivables, mostly from CAMMESA.
Finally, capital expenditures, excluding CTEB, recorded US$69 million in Q3 22 while, in Q3 21, they were US$2 million, mainly due to PEPE III’s expansion project.
[7] It considers Greenwind as an affiliate until August 11, 2022. For more information, see section 1.1 of this Earnings release.
| | |
| Pampa Energía ● Earnings release Q3 22 ● | 10 |
| Project | MW | Marketing | Currency | Awarded price | | Estimated capex in
US$ million1 | Date of
commissioning |
Capacity per
MW-month | Variable
per MWh | Total
per MWh | | Budget | % Executed
@9/30/22 |
| Thermal | | | | | | | | | | |
| Loma de la Lata | 15 | SE Res. No. 238/22 | AR$ | 498,069 - 788,609(2) | 597 | 1,478 | | 22 | 91% | August 3, 2021 |
| Closing to CCGT Ensenada | 280 | PPA for 10 years | US$ | 23,962 | 10.5 | 43 | | 242 | 90% | Q4 2022 (est.) |
| | | | | | | | | | | |
| Renewable | | | | | | | | | | |
| Pampa Energía III | 81 | MAT ER | US$ | na | na | 58(3) | | 128 | 54% | Q1 2023 (est.) |
Note: 1 Amounts without value-added tax. 2 It considers the HMRT additional remuneration. 3 Estimated average.
| 3.3 | Analysis of the oil and gas segment |
Oil & gas segment, consolidated
Figures in US$ million | | Nine-month period | | Third quarter |
| | 2022 | 2021 | ∆% | | 2022 | 2021 | ∆% |
| Sales revenue | | 491 | 334 | +47% | | 189 | 148 | +28% |
| Local market sales | | 379 | 305 | +24% | | 163 | 131 | +24% |
| Foreign market sales | | 112 | 29 | +286% | | 26 | 17 | +55% |
| Cost of sales | | (270) | (200) | +35% | | (107) | (85) | +26% |
| | | | | | | | | |
| Gross profit | | 221 | 134 | +65% | | 82 | 63 | +30% |
| | | | | | | | | |
| Selling expenses | | (27) | (8) | +238% | | (6) | (3) | +100% |
| Administrative expenses | | (44) | (32) | +38% | | (16) | (12) | +33% |
| Other operating income | | 55 | 52 | +6% | | 31 | 29 | +7% |
| Other operating expenses | | (22) | (26) | -15% | | (6) | (6) | - |
| Impairment of financial assets | | (1) | (1) | - | | - | - | NA |
| Impairment of PPE and inventories | | (29) | - | NA | | - | - | NA |
| | | | | | | | | |
| Operating income (loss) | | 153 | 119 | +29% | | 85 | 71 | +20% |
| | | | | | | | | |
| Finance income | | 2 | 2 | - | | 1 | - | NA |
| Finance costs | | (83) | (86) | -3% | | (40) | (24) | +67% |
| Other financial results | | (19) | (6) | +217% | | (14) | (3) | NA |
| Financial results, net | | (100) | (90) | +11% | | (53) | (27) | +96% |
| | | | | | | | | |
| Profit (loss) before tax | | 53 | 29 | +83% | | 32 | 44 | -27% |
| | | | | | | | | |
| Income tax | | - | (2) | -100% | | (27) | (12) | +125% |
| | | | | | | | | |
| Net income (loss) for the period | | 53 | 27 | +96% | | 5 | 32 | -84% |
| | | | | | | | | |
| Adjusted EBITDA | | 275 | 210 | +31% | | 117 | 104 | +13% |
| | | | | | | | | |
| Increases in PPE and right-of-use assets | | 209 | 144 | +45% | | 61 | 62 | -2% |
| Depreciation and amortization | | 95 | 79 | +20% | | 34 | 33 | +3% |
In Q3 22, the oil and gas segment’s sales grew 28% vs. Q3 21, mainly because of the increased gas production driven by Plan Gas.Ar and spot exports to Chile even during the winter season, in addition to higher domestic oil sales and rising export prices.
In operating terms, in Q3 22, total production reached 68.5 kboe/day (+19% vs. Q3 21 and +6% vs. Q2 22). Gas production reached new record highs, with 10.7 million m3/day output (+20% vs. Q3 21 and +6% vs. Q2 22), mainly explained by the higher delivery volumes under Plan Gas.Ar and exports to Chile. Analyzing by block, significant production growth was recorded again at El Mangrullo, reaching 8.1 million m3/day (+31% vs. Q3 21 and 11% vs. Q2 22), comprising 76% of our total gas output. However, this increase was partially offset by lower activity and the natural depletion at Rincón del Mangrullo (0.3 million m3/day, -39% vs. Q3 21 and -15% vs. Q2 22).
| | |
| Pampa Energía ● Earnings release Q3 22 ● | 11 |
Our gas price was US$4.8/MBTU in Q3 22 (+9% vs. Q3 21 and Q2 22), mainly because export prices were higher than the domestic market, and solid industrial demand led by limited local gas availability.
In Q3 22, our gas deliveries were allocated as follows: 60% to retail due to the priority under Plan Gas.Ar in the winter period, 18% as raw material to our thermal power units[8] and petchem plants, 16% to the industrial/spot market, 5% was exported, and the small rest was sold to CAMMESA. In Q3 21, 52% of our gas deliveries supplied the retail segment, 24% was sold to the industrial/spot market, 23% was fired at our thermal and petrochemicals plants, and the rest was sold directly to CAMMESA and exports.
Oil production reached 5.5 kbbl/day in Q3 22 (+14% vs. Q3 21 and +8% vs. Q2 22), mainly explained by the rise in domestic demand, offset by lower exports. Production increased at El Tordillo, Los Blancos and Gobernador Ayala (+0.7 kbbl/day vs. Q3 21). Moreover, 80% of the volume sold in Q3 22 was placed in the domestic market (vs. 55% in Q3 21). Our average oil price in Q3 22 increased by 14% year-on-year, reaching US$70.2/barrel, mainly explained by the rise of Brent and local prices.
By the end of Q3 22, we accounted for 887 productive wells vs. 884 as of December 31, 2021.
Oil and gas'
key performance indicators | | 2022 | | 2021 | | Variation |
| Oil | Gas | Total | Oil | Gas | Total | Oil | Gas | Total |
| Nine-month period | | | | | | | | | | | | |
| Volume | | | | | | | | | | | | |
| Production | | | | | | | | | | | | |
| In thousand m3/day | | 0.8 | 9,919 | | | 0.7 | 7,673 | | | +15% | +29% | +28% |
| In million cubic feet/day | | | 350 | | | | 271 | | |
| In thousand boe/day | | 5.2 | 58.4 | 63.6 | | 4.5 | 45.2 | 49.7 | |
| Sales | | | | | | | | | | | | |
| In thousand m3/day | | 0.8 | 10,002 | | | 0.7 | 7,839 | | | +15% | +28% | +26% |
| In million cubic feet/day | | | 353 | | | | 277 | | |
| In thousand boe/day | | 5.3 | 58.9 | 64.1 | | 4.6 | 46.1 | 50.7 | |
| | | | | | | | | | | | | |
| Average Price | | | | | | | | | | | | |
| In US$/bbl | | 70.5 | | | | 58.9 | | | | +20% | +13% | |
| In US$/MBTU | | | 4.3 | | | | 3.8 | | | |
| | | | | | | | | | | | | |
| Third quarter | | | | | | | | | | | | |
| Volume | | | | | | | | | | | | |
| Production | | | | | | | | | | | | |
| In thousand m3/day | | 0.9 | 10,705 | | | 0.8 | 8,940 | | | +14% | +20% | +19% |
| In million cubic feet/day | | | 378 | | | | 316 | | |
| In thousand boe/day | | 5.5 | 63.0 | 68.5 | | 4.8 | 52.6 | 57.4 | |
| Sales | | | | | | | | | | | | |
| In thousand m3/day | | 0.9 | 10,781 | | | 0.9 | 9,245 | | | -0% | +17% | +15% |
| In million cubic feet/day | | | 381 | | | | 326 | | |
| In thousand boe/day | | 5.9 | 63.5 | 69.4 | | 5.9 | 54.4 | 60.4 | |
| | | | | | | | | | | | | |
| Average Price | | | | | | | | | | | | |
| In US$/bbl | | 70.2 | | | | 61.6 | | | | +14% | +9% | |
| In US$/MBTU | | | 4.8 | | | | 4.4 | | | |
| | | | | | | | | | | | | |
| | | | | | | | | | | | | |
Note: Net production in Argentina. Gas volume is standardized at 9,300 kilocalories (kCal).
Net operating costs in Q3 22, excluding depreciation, amortization, and Plan Gas.Ar’s compensation, grew 38% vs. Q3 21, mainly because of increasing expenses related to the higher activity (treatment, maintenance, and transportation), more royalties, levies and taxes from higher volume and price sold, as well as increased costs in labor and exported gas transportation. Compared with Q2 22, net operating expenses increased by 20% due to the growing gas activity, oil stock consumption, royalties and labor costs, partially offset by lower transportation costs for exported gas. Lifting cost reached US$6.6/boe produced in Q3 22 (+22% vs. Q3 21 and +7% vs. Q2 22).
[8] Energía Plus and SEE Res. No. 287/17.
| | |
| Pampa Energía ● Earnings release Q3 22 ● | 12 |
In Q3 22, the losses from financial results doubled in comparison with Q3 21, posting a net loss of US$54 million, mainly due to the increased interests from the higher stock of AR$-debt and higher losses from devaluation over AR$-trade receivables, partially offset by gains from holding financial securities.
Our oil and gas adjusted EBITDA amounted to US$117 million in Q3 22 (+13% vs. Q3 21), mainly explained by the increased deliveries under Plan Gas.Ar, gas exports to Chile and better oil production and prices. These effects were partially offset by higher expenses related to the growing activity and gas exports, and the US$ increase in payroll.
Finally, the segment’s capital expenditures amounted to US$61 million in Q3 22, similar to Q3 21, mainly explained by the output commitments under Plan Gas.Ar.
| 3.4 | Analysis of the petrochemicals segment |
Petrochemicals segment, consolidated
Figures in US$ million | | Nine-month period | | Third quarter |
| | 2022 | 2021 | ∆% | | 2022 | 2021 | ∆% |
| Sales revenue | | 463 | 346 | +34% | | 179 | 144 | +24% |
| Local market sales | | 308 | 215 | +43% | | 124 | 85 | +46% |
| Foreign market sales | | 155 | 131 | +18% | | 55 | 59 | -7% |
| Cost of sales | | (405) | (294) | +38% | | (155) | (134) | +16% |
| | | | | | | | | |
| Gross profit | | 58 | 52 | +12% | | 24 | 10 | +140% |
| | | | | | | | | |
| Selling expenses | | (12) | (9) | +33% | | (4) | (3) | +33% |
| Administrative expenses | | (4) | (3) | +33% | | (2) | (1) | +100% |
| Other operating income | | - | 1 | -100% | | - | 1 | -100% |
| Other operating expenses | | (2) | (2) | - | | (1) | - | NA |
| | | | | | | | | |
| Operating income (loss) | | 40 | 39 | +3% | | 17 | 7 | +143% |
| | | | | | | | | |
| Finance costs | | (2) | (2) | - | | (1) | (1) | - |
| Other financial results | | 5 | (2) | NA | | 5 | 1 | NA |
| Financial results, net | | 3 | (4) | NA | | 4 | - | NA |
| | | | | | | | | |
| Profit (loss) before tax | | 43 | 35 | +23% | | 21 | 7 | +200% |
| | | | | | | | | |
| Income tax | | (5) | (11) | -55% | | (2) | (1) | +100% |
| | | | | | | | | |
| Net income (loss) for the period | | 38 | 24 | +58% | | 19 | 6 | +217% |
| | | | | | | | | |
| Adjusted EBITDA | | 44 | 41 | +7% | | 19 | 7 | +172% |
| | | | | | | | | |
| Increases in PPE | | 5 | 5 | - | | 3 | 1 | +200% |
| Depreciation and amortization | | 4 | 2 | +100% | | 2 | - | NA |
The petrochemicals segment’s adjusted EBITDA reached US$19 million in Q3 22 (+US$12 million vs. Q3 21), mainly explained by the higher prices in reforming products and increased deliveries of octane bases in the domestic market. However, these effects were partially offset by the higher cost of raw materials (driven by international reference prices) and, to a lesser extent, the increase in the gas per unit cost due to winter and labor expenses. Quarter-on-quarter, there was no change in the adjusted EBITDA because the higher domestic volume sold of octane bases was offset by a drop in the styrene’s margin.
Total volume sold decreased by 7% vs. Q3 21, mainly explained by the lesser reforming exports (during Q3 21, gasoline that had been in stock was shipped), lower polystyrene exports due to decreased margins, and a drop in SBR demand, explained by a conflict in the tire market. However, the variation was partially offset by the rise in local demand for styrene, polystyrene and octane bases (associated with the recovery in gasoline consumption).
| | |
| Pampa Energía ● Earnings release Q3 22 ● | 13 |
Petrochemicals'
key performance indicators | | Products | | Total |
| | Styrene & polystyrene1 | SBR | Reforming | |
| Nine-month period | | | | | | |
| Volume sold 9M22 (thousand ton) | | 84 | 36 | 182 | | 302 |
| Volume sold 9M21 (thousand ton) | | 82 | 38 | 183 | | 303 |
| Variation 9M22 vs. 9M21 | | +3% | -6% | -1% | | -1% |
| | | | | | | |
| Average price 9M22 (US$/ton) | | 2,148 | 2,317 | 1,097 | | 1,535 |
| Average price 9M21 (US$/ton) | | 1,751 | 1,914 | 706 | | 1,140 |
| Variation 9M22 vs. 9M21 | | +23% | +21% | +55% | | +35% |
| | | | | | | |
| Third quarter | | | | | | |
| Volume sold Q3 22 (thousand ton) | | 28 | 13 | 79 | | 120 |
| Volume sold Q3 21 (thousand ton) | | 29 | 14 | 86 | | 129 |
| Variation Q3 22 vs. Q3 21 | | -2% | -9% | -8% | | -7% |
| | | | | | | |
| Average price Q3 22 (US$/ton) | | 2,232 | 2,541 | 1,067 | | 1,496 |
| Average price Q3 21 (US$/ton) | | 1,767 | 2,252 | 717 | | 1,118 |
| Variation Q3 22 vs. Q3 21 | | +26% | +13% | +49% | | +34% |
Note: 1 Includes Propylene.
In Q3 22, financial results improved by US$4 million year-on-year, recording a net profit of US$4 million. The variation is mainly explained by higher gains from holding financial securities and in the passive AR$ monetary position due to devaluation.
Capital expenditures reached US$3 million in Q3 22 against US$1 million in Q3 21.
| | |
| Pampa Energía ● Earnings release Q3 22 ● | 14 |
| 3.5 | Analysis of the holding and others segment |
Holding and others segment, consolidated
Figures in US$ million | | Nine-month period | | Third quarter |
| | 2022 | 2021 | ∆% | | 2022 | 2021 | ∆% |
| Sales revenue | | 16 | 15 | +7% | | 4 | 4 | - |
| Local market sales | | 16 | 15 | +7% | | 4 | 4 | - |
| Foreign market sales | | - | - | NA | | - | - | NA |
| | | | | | | | | |
| Gross profit | | 16 | 15 | +7% | | 4 | 4 | - |
| | | | | | | | | |
| Administrative expenses | | (24) | (11) | +118% | | (10) | (2) | NA |
| Other operating income | | 6 | 3 | +100% | | 1 | 2 | -50% |
| Other operating expenses | | (6) | (18) | -67% | | (2) | - | NA |
| Impairment of financial assets | | (4) | (2) | +100% | | (1) | (1) | - |
| Impairment of intangible assets | | (5) | - | NA | | 1 | - | NA |
| Results for participation in joint businesses | | 33 | 53 | -38% | | 10 | 33 | -70% |
| | | | | | | | | |
| Operating income (loss) | | 16 | 40 | -60% | | 3 | 36 | -92% |
| | | | | | | | | |
| Finance income | | 8 | 2 | +300% | | 2 | 2 | - |
| Finance costs | | (21) | (31) | -32% | | (11) | (30) | -63% |
| Other financial results | | 58 | 24 | +142% | | 46 | 2 | NA |
| Financial results, net | | 45 | (5) | NA | | 37 | (26) | NA |
| | | | | | | | | |
| Profit (loss) before tax | | 61 | 35 | +74% | | 40 | 10 | +300% |
| | | | | | | | | |
| Income tax | | (6) | - | NA | | (5) | 9 | NA |
| | | | | | | | | |
| Net income for the period | | 55 | 35 | +57% | | 35 | 19 | +84% |
| | | | | | | | | |
| Adjusted EBITDA | | 97 | 89 | +9% | | 21 | 24 | -15% |
| | | | | | | | | |
| Increases in PPE and intangible assets | | 3 | 2 | +36% | | 1 | 1 | - |
| Depreciation and amortization | | - | - | NA | | - | - | NA |
The holding and others segment, without considering the affiliates’ equity income (Transener and TGS), posted a US$7 million operating loss, while in Q3 21, it was a US$3 million profit, mainly explained by the gain from the executive compensation resetting in Q3 21, added to higher contingencies provisions in Q3 22. However, the variation was partially offset by lower fees to third parties.
In Q3 22, financial results reached a net gain of US$37 million, while in Q3 21, it was a net loss of US$26 million. The improvement is because of higher profit from devaluation over AR$-denominated tax debt and lower tax interests.
The adjusted EBITDA of our holding and others segment decreased by 15%, recording US$21 million in Q3 22. The adjusted EBITDA excludes the equity income from our participation in TGS and Transener. In turn, it adds the EBITDA adjusted by equity ownership in these businesses.
The EBITDA adjusted by our direct and indirect ownership of 29.3% and 29.0% in TGS were US$26 million (US$88 million at 100%) in Q3 22 vs. US$25 million (US$87 million at 100%) in Q3 21. The slight growth in the total adjusted EBITDA was mainly due to rising ethane prices, propane exports (driven by international prices), and midstream revenues in Vaca Muerta. However, these effects were partially offset by lower regulated income. Though tariffs were increased by 60% in March 2022, they failed to offset the inflation and AR$ devaluation. In addition, they were also offset by the higher US$ unit cost of gas, which is used to replace thermal reduction at Cerri Complex Plant (offset by a lower gas consumption), and a decrease in ethane deliveries to Dow Chemical because of the programmed overhauls in PBB Polisur.
In Transener, the EBITDA adjusted by our indirect stake ownership of 26.3% amounted to US$3 million in Q3 22 (US$12 million at 100%) vs. US$4 million in Q3 21 (US$15 million at 100%), mainly due to the tariff update in February 2022 (67% and 69% for Transener and Transba, respectively) was not able to offset the inflation and AR$ devaluation.
| | |
| Pampa Energía ● Earnings release Q3 22 ● | 15 |
| 3.6 | Analysis of the nine-month period, by subsidiary and segment |
Subsidiary
In US$ million | Nine-month period 2022 | | Nine-month period 2021 |
| % Pampa | Adjusted EBITDA | Net debt2 | Net income3 | | % Pampa | Adjusted EBITDA | Net debt2 | Net income3 |
| |
| Power generation segment | | | | | | | | | |
| Diamante | 61.0% | 3 | (0) | 2 | | 61.0% | 3 | (5) | 3 |
| Los Nihuiles | 52.0% | 1 | (0) | 4 | | 52.0% | (2) | (7) | 2 |
| | | | | | | | | | |
| Greenwind4 | | 13 | - | 2 | | | 17 | 77 | (4) |
| Non-controlling stake adjustment | | (7) | - | (1) | | | (8) | (39) | 2 |
| Subtotal Greenwind adjusted by ownership | 50.0% | 7 | - | 1 | | 50.0% | 8 | 39 | (2) |
| | | | | | | | | | |
| CTBSA | | 63 | 241 | 86 | | | 117 | 200 | 67 |
| Non-controlling stake adjustment | | (31) | (120) | (43) | | | (59) | (100) | (33) |
| Subtotal CTBSA adjusted by ownership | 50.0% | 31 | 120 | 43 | | 50.0% | 59 | 100 | 33 |
| | | | | | | | | | |
| Pampa stand-alone, other companies, adjs. & deletions1 | 100.0% | 268 | 82 | 149 | | 100% | 293 | 129 | 151 |
| Subtotal power generation | | 309 | 203 | 198 | | | 362 | 255 | 187 |
| | | | | | | | | | |
| Oil & gas segment | | | | | | | | | |
| Pampa Energía | 100.0% | 275 | 846 | 53 | | 100.0% | 210 | 852 | 27 |
| Subtotal oil & gas | | 275 | 846 | 53 | | | 210 | 852 | 27 |
| | | | | | | | | | |
| Petrochemicals segment | | | | | | | | | |
| Pampa Energía | 100.0% | 44 | - | 38 | | 100.0% | 41 | - | 24 |
| Subtotal petrochemicals | | 44 | - | 38 | | | 41 | - | 24 |
| | | | | | | | | | |
| Holding & others segment | | | | | | | | | |
| Transener | | 47 | (29) | 15 | | | 46 | (22) | (10) |
| Non-controlling stake adjustment | | (35) | 21 | (11) | | | (34) | 16 | 7 |
| Subtotal Transener adjusted by ownership | 26.3% | 12 | (8) | 4 | | 26.3% | 12 | (6) | (3) |
| | | | | | | | | | |
| TGS | | 332 | 257 | 156 | | | 292 | 366 | 130 |
| Non-controlling stake adjustment | | (235) | (182) | (110) | | | (208) | (260) | (93) |
| Subtotal TGS adjusted by ownership | 29.3% | 97 | 75 | 46 | | 29.0% | 84 | 106 | 38 |
| | | | | | | | | | |
| Pampa stand-alone, other companies, adjs. & deletions1 | 100.0% | (13) | (1) | 5 | | 100% | (8) | (51) | (0) |
| Subtotal holding & others | | 97 | 67 | 55 | | | 89 | 49 | 35 |
| | | | | | | | | | |
| Deletions | 100% | (1) | (188) | (1) | | 100% | - | (239) | - |
| Total consolidated from continuing operations | | 724 | 927 | 343 | | | 701 | 917 | 273 |
| At our share ownership | | 723 | 1,119 | 343 | | | 700 | 1,161 | 273 |
Note: 1 The deletion corresponds to other companies, inter-companies or debt repurchases. 2 Net debt includes holding companies.
3 Attributable to the Company’s shareholders. 4 Consolidated in Pampa’s FS since August 12, 2022.
| | |
| Pampa Energía ● Earnings release Q3 22 ● | 16 |
| 3.7 | Analysis of the quarter, by subsidiary and segment |
Subsidiary
In US$ million | Q3 22 | | Q3 21 |
| % Pampa | Adjusted EBITDA | Net debt2 | Net income3 | | % Pampa | Adjusted EBITDA | Net debt2 | Net income3 |
| |
| Power generation segment | | | | | | | | | |
| Diamante | 61.0% | 0 | (0) | 0 | | 61.0% | 0 | (5) | 1 |
| Los Nihuiles | 52.0% | 0 | (0) | 1 | | 52.0% | (2) | (7) | (2) |
| | | | | | | | | | |
| Greenwind4 | | 2 | - | 1 | | | 6 | 77 | 1 |
| Non-controlling stake adjustment | | (1) | - | (0) | | | (3) | (39) | (1) |
| Subtotal Greenwind adjusted by ownership | 50.0% | 1 | - | 0 | | 50.0% | 3 | 39 | 1 |
| | | | | | | | | | |
| CTBSA | | 4 | 241 | 19 | | | 43 | 200 | 34 |
| Non-controlling stake adjustment | | (2) | (120) | (10) | | | (21) | (100) | (17) |
| Subtotal CTBSA adjusted by ownership | 50.0% | 2 | 120 | 10 | | 50.0% | 21 | 100 | 17 |
| | | | | | | | | | |
| Pampa stand-alone, other companies, adjs. & deletions1 | 100.0% | 86 | 82 | 108 | | 100% | 103 | 129 | 58 |
| Subtotal power generation | | 89 | 203 | 119 | | | 126 | 255 | 74 |
| | | | | | | | | | |
| Oil & gas segment | | | | | | | | | |
| Pampa Energía | 100.0% | 117 | 846 | 5 | | 100.0% | 104 | 852 | 32 |
| Subtotal oil & gas | | 117 | 846 | 5 | | | 104 | 852 | 32 |
| | | | | | | | | | |
| Petrochemicals segment | | | | | | | | | |
| Pampa Energía | 100.0% | 19 | - | 19 | | 100.0% | 7 | - | 6 |
| Subtotal petrochemicals | | 19 | - | 19 | | | 7 | - | 6 |
| | | | | | | | | | |
| Holding & others segment | | | | | | | | | |
| Transener | | 12 | (29) | 2 | | | 15 | (22) | 4 |
| Non-controlling stake adjustment | | (9) | 21 | (1) | | | (11) | 16 | (3) |
| Subtotal Transener adjusted by ownership | 26.3% | 3 | (8) | 1 | | 26.3% | 4 | (6) | 1 |
| | | | | | | | | | |
| TGS | | 88 | 257 | 37 | | | 87 | 366 | 50 |
| Non-controlling stake adjustment | | (62) | (182) | (26) | | | (61) | (260) | (35) |
| Subtotal TGS adjusted by ownership | 29.3% | 26 | 75 | 11 | | 29.0% | 25 | 106 | 14 |
| | | | | | | | | | |
| Pampa stand-alone, other companies, adjs. & deletions1 | 100.0% | (8) | (1) | 24 | | 100% | (5) | (51) | 3 |
| Subtotal holding & others | | 21 | 67 | 35 | | | 24 | 49 | 19 |
| | | | | | | | | | |
| Deletions | 100% | - | (188) | - | | 100% | - | (239) | - |
| Total consolidated from continuing operations | | 246 | 927 | 178 | | | 261 | 917 | 131 |
| At our share ownership | | 246 | 1,119 | 178 | | | 261 | 1,161 | 131 |
Note: 1 The deletion corresponds to other companies, inter-companies or debt repurchases. 2 Net debt includes holding companies.
3 Attributable to the Company’s shareholders. 4 Consolidated in Pampa’s FS since August 12, 2022.
| | |
| Pampa Energía ● Earnings release Q3 22 ● | 17 |
| 4.1 | Power generation’s main operational KPIs |
Power generation's
key performance indicators | | Hydroelectric | | Wind | | Subtotal
hydro
+wind | Thermal | | Total |
| | HINISA | HIDISA | HPPL | | PEMC1 | PEPE2 | PEPE3 | | CTLL | CTG | CTP | CPB | CTPP | CTIW | CTGEBA | Eco-
Energía | CTEB2 | Subtotal | |
| Installed capacity (MW) | | 265 | 388 | 285 | | 100 | 53 | 53 | | 1,144 | 780 | 361 | 30 | 620 | 100 | 100 | 1,253 | 14 | 567 | 3,826 | | 4,970 |
| New capacity (MW) | | - | - | - | | 100 | 53 | 53 | | 206 | 184 | 100 | - | - | 100 | 100 | 565 | 14 | - | 1,064 | | 1,270 |
| Market share | | 0.6% | 0.9% | 0.7% | | 0.2% | 0.1% | 0.1% | | 2.7% | 1.8% | 0.8% | 0.1% | 1.4% | 0.2% | 0.2% | 2.9% | 0.03% | 1.3% | 8.9% | | 11.6% |
| | | | | | | | | | | | | | | | | | | | | | | |
| Nine-month period | | | | | | | | | | | | | | | | | | | | | | |
| Net generation 9M22 (GWh) | | 257 | 202 | 429 | | 290 | 174 | 191 | | 1,543 | 3,889 | 198 | 34 | 822 | 280 | 253 | 5,572 | 55 | 490 | 11,594 | | 13,136 |
| Market share | | 0.2% | 0.2% | 0.4% | | 0.3% | 0.2% | 0.2% | | 1.5% | 3.8% | 0.2% | 0.0% | 0.8% | 0.3% | 0.2% | 5.4% | 0.1% | 0.5% | 11.3% | | 12.8% |
| Sales 9M22 (GWh) | | 257 | 203 | 429 | | 290 | 193 | 191 | | 1,562 | 3,889 | 369 | 34 | 822 | 280 | 253 | 6,182 | 117 | 490 | 12,437 | | 13,999 |
| | | | | | | | | | | | | | | | | | | | | | | |
| Net generation 9M21 (GWh) | | 267 | 222 | 434 | | 281 | 163 | 198 | | 1,566 | 3,621 | 170 | 31 | 159 | 237 | 224 | 6,411 | 59 | 286 | 11,197 | | 12,763 |
| Variation 9M22 vs. 9M21 | | -4% | -9% | -1% | | +3% | +7% | -4% | | -1% | +7% | +17% | +10% | na | +18% | +13% | -13% | -8% | +71% | +4% | | +3% |
| Sales 9M21 (GWh) | | 268 | 221 | 434 | | 281 | 187 | 198 | | 1,590 | 3,621 | 335 | 31 | 160 | 237 | 224 | 6,826 | 123 | 285 | 11,841 | | 13,431 |
| | | | | | | | | | | | | | | | | | | | | | | |
| Avg. price 9M22 (US$/MWh) | | 28 | 44 | 18 | | 69 | 75 | 67 | | 45 | 19 | 74 | 48 | 36 | 104 | 92 | 41 | 43 | na | 42 | | 42 |
| Avg. price 9M21 (US$/MWh) | | 23 | 38 | 17 | | 71 | 72 | 67 | | 43 | 33 | 57 | 124 | 96 | 121 | 101 | 35 | 31 | na | 49 | | 48 |
| Avg. gross margin 9M22 (US$/MWh) | | 5 | 17 | 6 | | 59 | 54 | 58 | | 29 | 11 | 28 | 17 | 13 | 83 | 69 | 22 | 19 | 126 | 25 | | 25 |
| Avg. gross margin 9M21 (US$/MWh) | | (3) | 16 | 8 | | 61 | 55 | 58 | | 28 | 29 | 10 | 69 | 7 | 98 | 79 | 17 | 10 | na | 32 | | 32 |
| | | | | | | | | | | | | | | | | | | | | | | |
| Third quarter | | | | | | | | | | | | | | | | | | | | | | |
| Net generation Q3 22 (GWh) | | 95 | 59 | 138 | | 94 | 55 | 64 | | 504 | 1,291 | 16 | 8 | 209 | 97 | 81 | 1,489 | 17 | 55 | 3,263 | | 3,767 |
| Market share | | 0.3% | 0.2% | 0.4% | | 0.3% | 0.2% | 0.2% | | 1.5% | 3.9% | 0.0% | 0.0% | 0.6% | 0.3% | 0.2% | 4.5% | 0.1% | 0.2% | 9.8% | | 11.3% |
| Sales Q3 22 (GWh) | | 95 | 60 | 138 | | 94 | 59 | 64 | | 510 | 1,290 | 77 | 8 | 209 | 97 | 81 | 1,678 | 37 | 55 | 3,532 | | 4,042 |
| | | | | | | | | | | | | | | | | | | | | | | |
| Net generation Q3 21 (GWh) | | 84 | 64 | 114 | | 105 | 59 | 72 | | 497 | 1,383 | 29 | 6 | 67 | 72 | 77 | 2,255 | 21 | 104 | 4,015 | | 4,512 |
| Variation Q3 22 vs. Q3 21 | | +13% | -7% | +21% | | -10% | -7% | -11% | | +1% | -7% | -45% | +27% | na | +36% | +5% | -34% | -20% | -47% | -19% | | -17% |
| Sales Q3 21 (GWh) | | 84 | 64 | 114 | | 105 | 68 | 72 | | 507 | 1,389 | 74 | 6 | 68 | 72 | 77 | 2,427 | 42 | 104 | 4,259 | | 4,765 |
| | | | | | | | | | | | | | | | | | | | | | | |
| Avg. price Q3 22 (US$/MWh) | | 25 | 42 | 18 | | 69 | 80 | 66 | | 45 | 17 | 124 | 65 | 47 | 101 | 96 | 51 | 49 | 145 | 44 | | 44 |
| Avg. price Q3 21 (US$/MWh) | | 21 | 38 | 20 | | 72 | 70 | 67 | | 47 | 30 | 92 | 87 | 79 | 132 | 99 | 34 | 36 | na | 47 | | 47 |
| Avg. gross margin Q3 22 (US$/MWh) | | 4 | 8 | 5 | | 59 | 51 | 54 | | 27 | 11 | 33 | 23 | 16 | 80 | 74 | 27 | 22 | 70 | 24 | | 24 |
| Avg. gross margin Q3 21 (US$/MWh) | | (17) | 8 | 8 | | 63 | 51 | 60 | | 28 | 26 | (4) | (31) | (1) | 108 | 73 | 18 | 9 | na | 31 | | 31 |
Note: Gross margin before amortization and depreciation 1 Fully owned by Pampa since August 12, 2022. Before, it was operated by Pampa with a 50% of equity stake. 2 Operated by Pampa (50% equity stake)
| | |
| Pampa Energía ● Earnings release Q3 22 ● | 18 |
| 4.2 | Oil and gas production in the main areas |
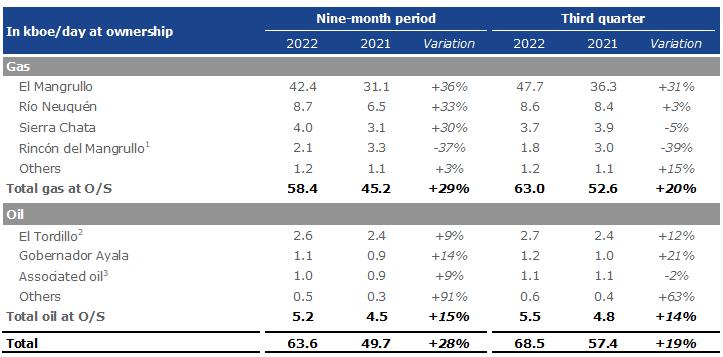
Note: Production in Argentina 1 It does not include shale formation. 2 It includes La Tapera – Puesto Quiroga block. 3 From gas fields.
| Term | Definition |
| 9M 22 - 9M 21 | First nine months of 2022/First nine months of 2021 |
| ADR/ADS | American Depositary Receipt |
| AR$ | Argentine Pesos |
| Bbl | Barrel |
| Boe | Barrels of oil equivalent |
| CAMMESA | Compañía Administradora del Mercado Mayorista Eléctrico S.A.(Argentina Wholesale Electricity Market Clearing Company) |
| CB | Corporate Bonds |
| CC | Combined Cycle |
| CPB | Piedra Buena Thermal Power Plant |
| CTBSA | CT Barragán S.A. |
| CTEB | Ensenada Barragán Thermal Power Plant |
| CTG | Güemes Thermal Power Plant |
| CTGEBA | Genelba Thermal Power Plant |
| CTIW | Ingeniero White Thermal Power Plant |
| CTLL | Loma De La Lata Thermal Power Plant |
| CTP | Piquirenda Thermal Power Plant |
| CTPP | Parque Pilar Thermal Power Plant |
| E&P | Exploration and Production |
| EBITDA | Earnings before interest, tax, depreciation and amortization |
| EcoEnergía | EcoEnergía Co-Generation Power Plant |
| Energía Plus | Energía Plus Program, SE Res. No. 1,281/06 |
| ENRE | Ente Nacional Regulador de la Electricidad |
| FS | Financial Statements |
| FV | Face value |
| | |
| Pampa Energía ● Earnings release Q3 22 ● | 19 |
| Greenwind | Greenwind S.A. |
| GT | Gas turbine |
| GWh | Gigawatt-hour |
| HIDISA | Diamante Hydro Power Plant |
| HINISA | Los Nihuiles Hydro Power Plant |
| HMRT | Horas de Alto Requerimiento Térmico del Mes (Hours of the month with high thermal demand) |
| HPPL | Pichi Picún Leufú Hydro Power Plant |
| IFRS | International Financial Reporting Standards |
| Kbbl/kboe | Thousands of barrels/thousands of barrels of oil equivalent |
| M3 | Cubic meters |
| MAT ER | Term Market from Renewable Energy Sources |
| MBTU | Million British Thermal Units |
| MW/MWh | Megawatt/Megawatt-hour |
| N.a. | Not applicable |
| Pampa / The Company | Pampa Energía S.A. |
| Pampa Group | Pampa Energía S.A. and its subsidiaries |
| PEMC | Ingeniero Mario Cebreiro Wind Farm |
| PEPE | Pampa Energía Wind Farm |
| Plan Gas.Ar | Re-assurance and Strengthening of the Federal Hydrocarbon Production through Self-Supply, Exports, Replacement of Imports and the Expansion of the Transportation System to All the Country's Hydrocarbon Basins Plan (Emergency Executive Order No. 892/20 and supplementary regulations) |
| PPA | Power Purchase Agreement |
| PPE | Property, Plant and Equipment |
| Q2 22/Q2 21 | Second quarter of 2022/ Second quarter of 2021 |
| Q3 22/Q3 21 | Third quarter of 2022/Third quarter of 2021 |
| Res. | Resolution/Resolutions |
| SE | Secretariat of Energy |
| SEE | Under Secretariat of Electric Energy (former Secretariat of Electric Energy) |
| ST | Steam tubine |
| TGS | Transportadora de Gas del Sur S.A. |
| Ton | Metric ton |
| ToP | Take or Pay |
| Transba | Empresa de Transporte de Energía Eléctrica por Distribución Troncal de la Provincia de Buenos Aires Transba S.A. |
| Transener | Compañía de Transporte de Energía Eléctrica en Alta Tensión Transener S.A. |
| US$ | U.S. Dollars |
| UVA | Unidad de Valor Adquisitivo (Acquisitive Value Units) |
| | |
| Pampa Energía ● Earnings release Q3 22 ● | 20 |