Pampa Energía, an independent company with active participation in Argentina’s electricity and gas value chain, announces the results for the fiscal year and quarter ended on December 31, 2022.
|
Buenos Aires, March 9, 2023
[1] The information is based on FS prepared according to IFRS in force in Argentina. Only continuing operations are considered.
[2] It does not include sales from the affiliates CTBSA, Transener and TGS, which at our ownership account for US$ 74 million. Under IFRS, affiliates are not consolidated in Pampa, thus shown as ‘Results for participation in joint businesses and associates’.
3 Consolidated adjusted EBITDA represents the results before financial results, income tax, depreciations and amortizations, extraordinary and non-cash income and expense, equity income and other adjustments from the IFRS implementation, and includes affiliates’ EBITDA at our ownership. For further information, see section 3 of this Earnings release.
| Pampa Energía ● Earnings release Q4 22 ● 1 |
 |
Table of contents
| Basis of presentation | 1 |
| Main results from the quarter | 1 |
| 1. | Relevant Events | 3 |
| 1.1 | Power generation segment | 3 |
| 1.2 | Oil and gas segment | 4 |
| 1.3 | Other news | 5 |
| 2. | Financial highlights | 6 |
| 2.1 | Consolidated balance sheet | 6 |
| 2.2 | Consolidated income statement | 7 |
| 2.3 | Cash and financial borrowings | 8 |
| 3. | Analysis of the Q4 22 results | 10 |
| 3.1 | Reconciliation of consolidated adjusted EBITDA | 10 |
| 3.2 | Analysis of the power generation segment | 11 |
| 3.3 | Analysis of the oil and gas segment | 13 |
| 3.4 | Analysis of the petrochemicals segment | 16 |
| 3.5 | Analysis of the holding and others segment | 17 |
| 3.6 | Analysis of the fiscal year, by subsidiary and segment | 19 |
| 3.7 | Analysis of the quarter, by subsidiary and segment | 20 |
| 4. | Appendix | 21 |
| 4.1 | Power generation’s main operational KPIs | 21 |
| 4.2 | Oil and gas production in the main areas | 22 |
| 5. | Glossary of terms | 22 |
| Pampa Energía ● Earnings release Q4 22 ● 2 |
| |
| 1. | Relevant Events |
| 1.1 | Power generation segment |
Wind expansion: acquisition of VAR and development of PEPE IV and PEPE VI
On December 16, 2022, Pampa acquired 100% of VAR, a company formerly owned by the Provincial Government of La Rioja. VAR operates PEA, a 100-MW wind farm located in Arauco, province of La Rioja. It has been selling its output under a 20-year RenovAr PPA since March 2020. The acquisition price amounts to US$170 million, of which US$128 million were paid at closing, while the balance will be settled in 12 monthly installments during 2023.
Regarding the expansion projects, 4 of the 18 4.5 MW Vestas wind turbines were commissioned in PEPE IV on December 29, 2022, and 4 additional wind turbines were online on February 25, 2023 (a total of 36 MW). Therefore, the full COD is estimated by the second quarter of 2023. Moreover, the construction of PEPE VI was announced on February 2023, a project that comprises 300 MW of wind energy in three stages. The first stage will install 94.5 MW, disbursing approximately US$186 million over a total investment exceeding US$500 million for the entire project. PEPE VI is located next to PEMC and PEPE II, 18 km from the city of Bahía Blanca, province of Buenos Aires. Pampa will mount 21 Vestas wind turbines, projecting its commissioning by the third quarter of 2024. Both wind farms will sell energy in the MAT ER under US$-PPA with private parties.
Commissioning of the closing to CCGT at CTEB
As of February 22, 2023, at midnight, CAMMESA commercially commissioned CTEB’s EBARTV01 unit for a gross capacity of up to 260 MW, thus completing the CCGT project. Since this milestone, CTEB bills the stipulated remuneration under the 10-year PPA with CAMMESA under SE Res. No. 220/07. Consequently, CTEB’s total gross capacity amounts to 827 MW, contributing a cleaner and more efficient plant to the national power grid.
Pampa, a co-controller shareholder with YPF, jointly invested more than US$250 million in the project. With this milestone, the guarantees’ resolutory condition as guarantors of CTBSA’s CB is fulfilled.
Updates to the legacy remuneration scheme (energy sold under spot or without PPA)
In December 2022, SE Res No. 826/22 increased 20% of the remuneration scheme as of June 2022, which is applicable from September 2022. Moreover, the Res. set a cumulative raise of 10% in December, 25% in February and 28% in August 2023. Finally, the Res. replaces the HMRT power remuneration with peak-hour energy generation as of November 2022.
Differential remuneration for CCGT under legacy energy
SE Res. No. 59/23 was published on February 7, 2023, seeking to promote the CCGT’s operational performance under the legacy energy scheme. Power producers are encouraged to execute a PPA with CAMMESA for up to 5 years, committing to maintain at least 85% net capacity availability.
In consideration, the capacity will be partially priced in US$, combining: (i) US$2,000/MW-month payment, linearly decreasing if availability falls below 85%, but setting a US$600/MW-month floor if availability is less than 50%; and (ii) 65% of the legacy’s capacity with DIGO price in AR$ for summer and winter, and 85% for the rest of the year. Moreover, the energy price generated by firing natural gas is US$3.5/MWh, US$6.1/MWh using FO o GO and US$8.7/MWh using biofuel. Operated and generated energy in peak hours will continue being remunerated in AR$ as legacy energy.
| Pampa Energía ● Earnings release Q4 22 ● 3 |
| |
Power producers may adhere to the Res. from 90 days after its publication. Pampa is analyzing because two CCGTs would apply under this scheme, CTLL and CTGEBA, with a 1,239 MW total capacity.
| 1.2 | Oil and gas segment |
Plan Gas.Ar: rounds 4 y 5
On December 22, 2022, rounds 4 (Neuquina Basin) and 5 (Austral Basin) were awarded through SE Res. No 860/22. In particular, rounds 4.1 and 5.1 extended most of the annual base volume from December 2024 until December 2028 under the following conditions:
| · | Round 1: 48.0 million m3/day at a price of US$3.592/MBTU in Neuquina Basin and 2.4 million m3/day at a price of US$3.479/MBTU in Austral Basin; and |
| · | Round 3: 3 million m3/day priced at US$3.435/MBTU at Neuquina Basin. |
Round 4.2 awarded new volumes until December 2028, which can be limited up to 30% with ENARSA as offtake to industrial clients and/or GNC, subject to the SE’s approval:
| · | Annual flat commitment since July 2023: 11 million m3/day at a price of US$3.41/MBTU; |
| · | Annual flat commitment since January 2024: 3 million m3/day at a price of US$2.989/MBTU; |
| · | Peak commitment (winter) from 2024: 7 million m3/day at a price of US$4.249/MTBU; and |
| · | Peak commitment (winter) from 2025: 7 million m3/day at a price of US$3.597/MTBU. |
Finally, round 5.2 awarded the maximum incremental volume vs. round 1 for 3.3 million m3/day at a price of US$7.319/MBTU for 2023-2028. CAMMESA is the client, with a daily DoP and monthly ToP of 80%.
Through round 4.1 results, Pampa extended until 2028 4.9 million m3/day awarded from round 1 at US$3.60/MBTU and 2 million m3/day from round 3 for US$3.347/MBTU. In addition, Pampa was granted an annual flat volume in round 4.2 for 4.8 million m3/day at US$3.485/MBTU, deliverable from July 2023.
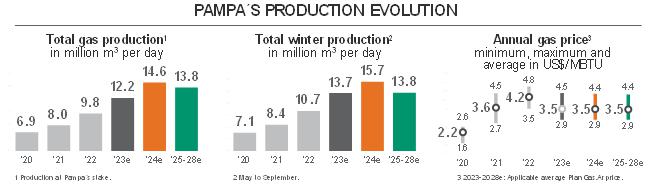
Note: Production assumes maximum daily volumes are delivered per contract.
Permits to export gas to Chile
PEN Executive Order No. 730/22, issued on November 4, 2022, allows exports on a firm basis even in winter, prioritizing producers with the most competitive prices and/or contributing with a higher volume under Plan Gas.Ar, always prioritizing internal supply.
Therefore, SE Res. No. 774/22 was issued on November 16, 2022, establishing the following: (i) No producer will export more than 30% of the authorized export quota per basin or more than 50% of the commitment under Plan Gas.Ar; (ii) ToP export quotas per basin are assigned for higher offered volume (45%) and price (55%); (iii) export volume will reduce Plan Gas.Ar commitment only during off-peak months ; (iv) minimum price will be the higher between a percentage of Brent set by the applicable authority and the seasonal-adjusted Plan Gas.Ar price; (v) reduction on committed volumes under Plan Gas.Ar with CAMMESA and/or ENARSA (previously, reductions were available only with CAMMESA).
| Pampa Energía ● Earnings release Q4 22 ● 4 |
| |
In February 2023, the SE approved Pampa’s export requests on a ToP basis to Chile for a maximum of 1.31 million m3/day between May-June 2023 (winter months).
Foreign currency scheme access for incremental hydrocarbon production
SE Res. No. 13/23, dated January 13, 2023, instrumented the foreign currency access regime (MULC) for the incremental oil and gas production (scheme initially created by PEN Executive Order No. 277/22).
Access to MULC will be allowed to pay principal and interests on commercial or financial liabilities held with foreign parties, including liabilities with non-resident related companies, and/or profit and dividends corresponding to full audit annual financial statements, and/or repatriation of direct investment made by non-resident companies.
In the case of natural gas, the MULC quota equals 30% of the incremental injection valued at the rolling 12-month-weighted average export price of Argentina, net of export duties. For oil, the quota is equivalent to 20% of the quarter’s incremental production valued at Brent’s rolling 12-month-average quote, defined by the applicable authority, net of export duties and adjusted by the crude oil’s quality[4]. Moreover, the quotas may be assigned to direct suppliers, associated third parties and/or block operators.
Pampa submitted a request to join both schemes and the quota benefits calculations for the third and fourth quarters of 2022. However, as of today, the SE has not responded to our request.
| 1.3 | Other news |
Transener and TGS’s tariff situation
On December 2022, Transener and Transba’s tariff schemes dated February 2022 were incremented by 155% and 154%, respectively, applicable since January 1, 2023 (ENRE Res. No. 698/22 and 702/22).
On the other hand, TGS’s public hearing took place on January 4, 2023, requesting a 135% tariff increase on March 2022’s schemes, to be applicable since February 2023. As of today, TGS is awaiting a response from ENARGAS.
TGS: Vaca Muerta midstream service
On February 2023, TGS partially commissioned expansion works in the Tratayén plant, installing two gas conditioning modules of 3.5 million m3/day each. It is estimated that the commissioning will be completed during Q2 2023. Consequently, the plant’s total conditioning capacity will reach 15 million m3/day.
Board’s Appointments
The shareholders’ meeting of Pampa, dated December 27, 2022, approved the appointment of María Renata Scafati as an independent board member, replacing Santiago Fraschina until term completion. Hence, 40% of the Board of Pampa comprises female members.
4 1.13 for Medanito, 0.92 for Escalante and 1 for Northwest oil.
| Pampa Energía ● Earnings release Q4 22 ● 5 |
| |
| 2. | Financial highlights |
| 2.1 | Consolidated balance sheet |
| Figures in million | As of 12.31.2022 | As of 12.31.2021 | ||||
| AR$ | US$ FX 177,16 | AR$ | US$ FX 102,72 | |||
| ASSETS | ||||||
| Property, plant and equipment | 383,464 | 2,165 | 170,390 | 1,659 | ||
| Intangible assets | 24,364 | 138 | 3,956 | 39 | ||
| Right-of-use assets | 1,521 | 9 | 1,231 | 12 | ||
| Deferred tax asset | 6,326 | 36 | 8,675 | 84 | ||
| Investments in joint ventures and associates | 159,833 | 902 | 79,500 | 774 | ||
| Financial assets at amortized cost | 18,000 | 102 | 10,821 | 105 | ||
| Financial assets at fair value through profit and loss | 4,867 | 27 | 2,998 | 29 | ||
| Other assets | 91 | 1 | 61 | 1 | ||
| Trade and other receivables | 3,415 | 19 | 3,379 | 33 | ||
| Total non-current assets | 601,881 | 3,397 | 281,011 | 2,736 | ||
| Inventories | 30,724 | 173 | 15,888 | 155 | ||
| Financial assets at amortized cost | 1,357 | 8 | 537 | 5 | ||
| Financial assets at fair value through profit and loss | 103,856 | 586 | 47,026 | 458 | ||
| Derivative financial instruments | 161 | 1 | 16 | 0 | ||
| Trade and other receivables | 83,328 | 470 | 40,892 | 398 | ||
| Cash and cash equivalents | 18,757 | 106 | 11,283 | 110 | ||
| Total current assets | 238,183 | 1,344 | 115,642 | 1,126 | ||
| Total assets | 840,064 | 4,742 | 396,653 | 3,861 | ||
| EQUITY | ||||||
| Equity attributable to owners of the company | 403,463 | 2,277 | 183,431 | 1,786 | ||
| Non-controlling interest | 1,157 | 7 | 609 | 6 | ||
| Total equity | 404,620 | 2,284 | 184,040 | 1,792 | ||
| LIABILITIES | ||||||
| Investments in joint ventures | - | - | 386 | 4 | ||
| Provisions | 26,062 | 147 | 14,444 | 141 | ||
| Income tax and presumed minimum income tax liabilities | 31,728 | 179 | 19,287 | 188 | ||
| Deferred tax liabilities | 19,854 | 112 | - | - | ||
| Defined benefit plans | 4,908 | 28 | 2,419 | 24 | ||
| Borrowings | 237,437 | 1,340 | 139,630 | 1,359 | ||
| Trade and other payables | 3,757 | 21 | 1,340 | 13 | ||
| Total non-current liabilities | 323,746 | 1,827 | 177,506 | 1,728 | ||
| Provisions | 779 | 4 | 560 | 5 | ||
| Income tax liabilities | 927 | 5 | 2,098 | 20 | ||
| Taxes payables | 4,966 | 28 | 2,314 | 23 | ||
| Defined benefit plans | 1,021 | 6 | 515 | 5 | ||
| Salaries and social security payable | 5,627 | 32 | 2,876 | 28 | ||
| Derivative financial instruments | 318 | 2 | 18 | 0 | ||
| Borrowings | 48,329 | 273 | 8,165 | 79 | ||
| Trade and other payables | 49,731 | 281 | 18,561 | 181 | ||
| Total current liabilities | 111,698 | 630 | 35,107 | 342 | ||
| Total liabilities | 435,444 | 2,458 | 212,613 | 2,070 | ||
| Total liabilities and equity | 840,064 | 4,742 | 396,653 | 3,861 | ||
| Pampa Energía ● Earnings release Q4 22 ● 6 |
| |
| 2.2 | Consolidated income statement |
| Fiscal year | Fourth quarter | |||||||||||
| Figures in million | 2022 | 2021 | 2022 | 2021 | ||||||||
| AR$ | US$ | AR$ | US$ | AR$ | US$ | AR$ | US$ | |||||
| Sales revenue | 242,182 | 1,829 | 144,641 | 1,508 | 73,434 | 448 | 40,901 | 406 | ||||
| Local market sales | 196,723 | 1,478 | 121,638 | 1,270 | 59,861 | 364 | 33,063 | 328 | ||||
| Foreign market sales | 45,459 | 351 | 23,003 | 238 | 13,573 | 84 | 7,838 | 78 | ||||
| Cost of sales | (150,891) | (1,148) | (91,342) | (955) | (46,094) | (283) | (28,690) | (289) | ||||
| Gross profit | 91,291 | 681 | 53,299 | 553 | 27,340 | 165 | 12,211 | 117 | ||||
| Selling expenses | (7,218) | (56) | (3,156) | (33) | (2,273) | (15) | (1,404) | (15) | ||||
| Administrative expenses | (18,708) | (138) | (9,507) | (99) | (6,319) | (37) | (3,206) | (32) | ||||
| Exploration expenses | (50) | - | (61) | - | (27) | - | (11) | - | ||||
| Other operating income | 19,066 | 131 | 10,196 | 105 | 8,721 | 52 | 1,332 | 13 | ||||
| Other operating expenses | (5,952) | (46) | (5,360) | (58) | (1,743) | (13) | (737) | (8) | ||||
| Impairment of financial assets | (1,142) | (8) | (220) | (2) | (470) | (3) | 9 | 1 | ||||
| Impairment of PPE, int. assets & inventories | (4,925) | (38) | (332) | (4) | (665) | (4) | (160) | (2) | ||||
| Results for part. in joint businesses & associates | 16,089 | 105 | 11,567 | 117 | 2,479 | 5 | 3,436 | 32 | ||||
| Operating income | 88,451 | 631 | 56,426 | 579 | 27,043 | 150 | 11,470 | 106 | ||||
| Financial income | 768 | 5 | 847 | 10 | 171 | (1) | 228 | 3 | ||||
| Financial costs | (30,488) | (221) | (17,512) | (185) | (12,361) | (73) | (3,384) | (34) | ||||
| Other financial results | 25,558 | 166 | (1,545) | (14) | 21,450 | 133 | (4,358) | (43) | ||||
| Financial results, net | (4,162) | (50) | (18,210) | (189) | 9,260 | 59 | (7,514) | (74) | ||||
| Profit before tax | 84,289 | 581 | 38,216 | 390 | 36,303 | 209 | 3,956 | 32 | ||||
| Income tax | (19,389) | (124) | (7,301) | (77) | (14,165) | (98) | 485 | 6 | ||||
| Net income for continuing operations | 64,900 | 457 | 30,915 | 313 | 22,138 | 111 | 4,441 | 38 | ||||
| Net income (loss) from discontinued operations | - | - | (7,129) | (75) | - | - | - | - | ||||
| Net income (loss) for the period | 64,900 | 457 | 23,786 | 238 | 22,138 | 111 | 4,441 | 38 | ||||
| Attributable to the owners of the Company | 64,859 | 456 | 27,097 | 273 | 22,411 | 113 | 4,520 | 39 | ||||
| Continuing operations | 64,859 | 456 | 30,823 | 312 | 22,411 | 113 | 4,520 | 39 | ||||
| Discontinued operations | - | - | (3,726) | (39) | - | - | - | - | ||||
| Attributable to the non-controlling interests | 41 | 1 | (3,311) | (35) | (273) | (2) | (79) | (1) | ||||
| Net income (loss) per share to shareholders | 46.97 | 0.33 | 19.29 | 0.19 | 16.24 | 0.08 | 3.27 | 0.03 | ||||
| From continuing operations | 46.97 | 0.33 | 21.94 | 0.22 | 16.24 | 0.08 | 3.27 | 0.03 | ||||
| From discontinued operations | - | - | (2.65) | (0.03) | - | - | - | - | ||||
| Net income (loss) per ADR to shareholders | 1,174.13 | 8.26 | 482.15 | 4.86 | 406.00 | 2.05 | 81.77 | 0.71 | ||||
| From continuing operations | 1,174.13 | 8.26 | 548.45 | 5.55 | 406.00 | 2.05 | 81.77 | 0.71 | ||||
| From discontinued operations | - | - | (66.30) | (0.70) | - | - | - | - | ||||
| Average outstanding common shares1 | 1,381 | 1,381 | 1,405 | 1,405 | 1,380 | 1,380 | 1,382 | 1,382.0 | ||||
| Outstanding shares by the end of period1 | 1,380 | 1,380 | 1,382 | 1,382 | 1,380 | 1,380 | 1,382 | 1,382.0 | ||||
Note: 1 It includes shares from the Employee stock-based compensation plan, which as of December 31, 2022 and 2021 amounted to 3.9 million common shares.
| Pampa Energía ● Earnings release Q4 22 ● 7 |
| |
| 2.3 | Cash and financial borrowings |
| As of December 31, 2022, in US$ million | Cash1 | Financial debt | Net debt | |||||||
| Consolidated in FS | Ownership adjusted | Consolidated in FS | Ownership adjusted | Consolidated in FS | Ownership adjusted | |||||
| Power generation | 528 | 524 | 688 | 688 | 161 | 165 | ||||
| Petrochemicals | - | - | - | - | - | - | ||||
| Holding and others | 0 | 0 | - | - | (0) | (0) | ||||
| Oil and gas | 172 | 172 | 925 | 925 | 753 | 753 | ||||
| Total under IFRS/Restricted Group | 700 | 696 | 1,613 | 1,613 | 913 | 917 | ||||
| Affiliates at O/S2 | 98 | 98 | 308 | 308 | 210 | 210 | ||||
| Total with affiliates | 798 | 794 | 1,921 | 1,921 | 1,123 | 1,127 | ||||
Note: Financial debt includes accrued interest. 1 It includes cash and cash equivalents, financial assets at fair value with changing results, and investments at amortized cost. 2 Under IFRS, the affiliates CTBSA, Transener and TGS are not consolidated in Pampa.
Debt transactions
Pampa’s financial debt at the consolidated level under IFRS increased to US$1,613 million as of December 31, 2022 (+12% vs. the end of 2021). Net debt only increased by 5%, reaching US$913 million. The average interest rate for US$-bearing indebtedness was 8.4%, in which 84% of the Company’s gross debt is denominated, mainly at a fixed rate. US$-link indebtedness’s rate was 0%, and AR$ indebtedness’s average interest rate was 65.1%. Pampa’s consolidated financial debt averaged 3.6 years. The chart below shows the principal maturity profile, net of repurchases, in US$ million by the end of Q4 22:
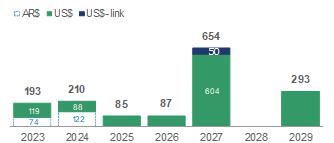 |
Note: It only considers Pampa consolidated under IFRS; it does not include affiliates TGS, Transener, and CTBSA. |
During Q4 22, Pampa issued the US$-link Series XIII CB for US$49.8 million at a 0% rate, maturing on December 2027. Pampa took net import pre-financing for US$0.8 million and short-term bank debt for AR$290 million. Moreover, Pampa paid US$9.1 million in pre-financings. After the quarter’s closing, Pampa issued Series XV CB for a total of AR$18,264[5] million at a Private Badlar plus 2% floating rate, maturing in 18 months, and re-opened Series XIII CB, issuing US$48.2 million. Also, Pampa paid short-term net bank debt for AR$10,065 million and net import pre-financing for US$0.7 million.
Regarding our affiliates, CTBSA re-opened the Series VI CB in US$-link on Q4 22, issuing US$58.6 million at a 0% rate, maturing in May 2025. Series VI’s US$10.8 million was exchanged with Series I CB, of which US$32.2 million is still outstanding. Additionally, CTBSA paid the syndicated loan’s final installment for US$2 million. Likewise, TGS took net import pre-financing for US$1 million, while Transener paid borrowings for AR$83 million. After the quarter’s closing, Transener paid borrowings for AR$56 million.
5 Two issuances in 2023: January 11 (AR$10,379 million) and March 6 (AR$7,885 million).
| Pampa Energía ● Earnings release Q4 22 ● 8 |
| |
As of this Earnings Release issuance, the Company complies with the covenants established in its debt agreements.
Summary of debt securities
| Company In million | Security | Maturity | Amount issued | Amount net of repurchases | Coupon |
| In US$ | |||||
| Pampa | CB Series T at discount & fixed rate2 | 2023 | 500 | 93 | 7.375% |
| CB Series IX at par & fixed rate | 2026 | 293 | 179 | 9.5% | |
| CB Series I at discount & fixed rate | 2027 | 750 | 604 | 7.5% | |
| CB Series III at discount & fixed rate | 2029 | 300 | 293 | 9.125% | |
| TGS1 | CB at discount at fixed rate | 2025 | 500 | 470 | 6.75% |
| In US$-link | |||||
| Pampa | CB Series XIII3 | 2027 | 98 | 98 | 0% |
| CTEB1 | CB Series I4 | 2023 | 32 | 32 | 4% |
| CB Series IV | 2024 | 96 | 96 | 0% | |
| CB Series VI | 2025 | 84 | 84 | 0% | |
| In AR$ | |||||
| Pampa | CB Series VIII (Green Bond) | 2023 | 3,107 | 3,107 | Badlar Privada +2% |
| CB Series XI | 2024 | 21,655 | 21,655 | Badlar Privada +0% | |
| CB Series XV5 | 2024 | 18,264 | 18,264 | Badlar Privada +2% | |
| CTEB1 | CB Series VII | 2023 | 1,754 | 1,754 | Badlar Privada +2.98% |
| CB Series VIII | 2024 | 4,236 | 4,236 | Badlar Privada +1% | |
| In UVA | |||||
| CTEB1 | CB Series II | 2024 | 65 | 65 | 4% |
Note: 1 According to IFRS, affiliates are not consolidated in Pampa’s FS. 2 Net amount after the exchange. 3 Includes re-opening for US$48.2 million issued post-Q4 22. 4 Includes partial cancelation (US$10.8 million). 5 Issued post-Q4 22.
Credit rating
The following table shows the Pampa Group’s ratings:
| Company | Agency | Rating | |
| Global | Local | ||
| Pampa | S&P | b-1 | na |
| Moody's | Caa3 | na | |
| FitchRatings2 | B- | AA (long-term) A1+ (short-term) | |
| TGS | S&P | CCC+ | na |
| Moody's | Caa3 | na | |
| Transener | FitchRatings2 | na | A+ (long-term) |
| CTEB | FitchRatings2 | na | A+ |
Note: 1 Stand-alone. 2 Local ratings issued by FIX SCR.
| Pampa Energía ● Earnings release Q4 22 ● 9 |
| |
| 3. | Analysis of the Q4 22 results |
| Breakdown by segment Figures in US$ million | Q4 22 | Q4 21 | Variation | ||||||
| Sales | Adjusted EBITDA | Net Income | Sales | Adjusted EBITDA | Net Income | Sales | Adjusted EBITDA | Net Income | |
| Power generation | 163 | 86 | 55 | 155 | 105 | 31 | +5% | -19% | +75% |
| Oil and Gas | 155 | 72 | (8) | 119 | 46 | (5) | +30% | +57% | +60% |
| Petrochemicals | 154 | 15 | 2 | 144 | 9 | 4 | +7% | +68% | -50% |
| Holding and Others | 4 | 10 | 63 | 7 | 38 | 9 | -43% | -74% | NA |
| Eliminations | (28) | 1 | 1 | (19) | - | - | +47% | NA | NA |
| Total continuing operations | 448 | 183 | 113 | 406 | 198 | 39 | +10% | -7% | +187% |
Note: Net income attributable to the Company’s shareholders.
| 3.1 | Reconciliation of consolidated adjusted EBITDA |
| Reconciliation of adjusted EBITDA, in US$ million | Fiscal year | Fourth quarter | ||||
| 2022 | 2021 | 2022 | 2021 | |||
| Consolidated operating income | 631 | 579 | 150 | 106 | ||
| Consolidated depreciations and amortizations | 212 | 205 | 52 | 58 | ||
| EBITDA | 843 | 784 | 202 | 164 | ||
| Adjustments from generation segment | (23) | 29 | 2 | 8 | ||
| Deletion of equity income | (65) | (47) | 2 | (15) | ||
| Deletion of PPE's impairment | - | 2 | - | - | ||
| Deletion of provision recovery of PEPE IV bond | - | (13) | - | - | ||
| Deletion of gain from commercial interests | (24) | (24) | (7) | (4) | ||
| Deletion of provision in outages | 6 | 8 | - | - | ||
| Deletion of PPE activation in operating expenses | 21 | 14 | 5 | 5 | ||
| Greenwind's EBITDA adjusted by ownership | 7 | 11 | - | 3 | ||
| CTBSA's EBITDA adjusted by ownership | 33 | 78 | 2 | 19 | ||
| Adjustments from oil and gas segment | 28 | 11 | 1 | (0) | ||
| Deletion of PPE & inventories' impairment | 30 | - | 1 | - | ||
| Deletion of gain from commercial interests | (2) | (3) | (0) | (0) | ||
| Deletion of provision for environmental remediation | - | 14 | - | - | ||
| Adjustments from petrochemicals segment | 2 | 2 | 2 | 2 | ||
| Deletion of inventory impairment | 2 | 2 | 2 | 2 | ||
| Deletion of gain from commercial interests | (0) | (0) | (0) | (0) | ||
| Adjustments from holding & others segment | 58 | 73 | (23) | 24 | ||
| Deletion of equity income | (40) | (70) | (7) | (17) | ||
| Deletion of gain from commercial interests | (1) | (0) | (0) | (0) | ||
| Deletion of contigencies provision | - | 12 | - | - | ||
| Deletion of executive compensation liabilities' reversal | - | (7) | - | - | ||
| Deletion of intangible assets' impairment | 6 | - | 1 | - | ||
| Deletion of Arbitration Award in Ecuador | (37) | - | (37) | - | ||
| TGS's EBITDA adjusted by ownership | 119 | 123 | 22 | 39 | ||
| Transener's EBITDA adjusted by ownership | 11 | 14 | (2) | 2 | ||
| Consolidated adjusted EBITDA, continuing op. | 908 | 899 | 183 | 198 | ||
| At our ownership | 906 | 899 | 183 | 198 | ||
| Pampa Energía ● Earnings release Q4 22 ● 10 |
| |
| 3.2 | Analysis of the power generation segment |
| Power generation segment, consolidated Figures in US$ million | Fiscal year | Fourth quarter | ||||||
| 2022 | 2021 | ∆% | 2022 | 2021 | ∆% | |||
| Sales revenue | 663 | 656 | +1% | 163 | 155 | +5% | ||
| Local market sales | 663 | 656 | +1% | 163 | 155 | +5% | ||
| Foreign market sales | - | - | NA | - | - | NA | ||
| Cost of sales | (370) | (355) | +4% | (92) | (89) | +3% | ||
| Gross profit | 293 | 301 | -3% | 71 | 66 | +8% | ||
| Selling expenses | (3) | (2) | +50% | (1) | (1) | - | ||
| Administrative expenses | (39) | (31) | +26% | (10) | (10) | - | ||
| Other operating income | 25 | 42 | -40% | 7 | 6 | +17% | ||
| Other operating expenses | (5) | (5) | - | (2) | (1) | +100% | ||
| Impairment of intangible assets and inventories | - | (2) | -100% | - | - | NA | ||
| Results for participation in joint businesses | 65 | 47 | +38% | (2) | 15 | NA | ||
| Operating income | 336 | 350 | -4% | 63 | 75 | -16% | ||
| Finance income | 1 | 4 | -75% | - | 1 | -100% | ||
| Finance costs | (82) | (46) | +78% | (35) | (14) | +150% | ||
| Other financial results | 72 | (14) | NA | 83 | (27) | NA | ||
| Financial results, net | (9) | (56) | -84% | 48 | (40) | NA | ||
| Profit (loss) before tax | 327 | 294 | +11% | 111 | 35 | +217% | ||
| Income tax | (73) | (75) | -3% | (58) | (5) | NA | ||
| Net income (loss) for the period | 254 | 219 | +16% | 53 | 30 | +77% | ||
| Attributable to owners of the Company | 253 | 218 | +16% | 55 | 31 | +75% | ||
| Attributable to non-controlling interests | 1 | 1 | - | (2) | (1) | +43% | ||
| Adjusted EBITDA | 395 | 467 | -15% | 86 | 105 | -19% | ||
| Adjusted EBITDA at our share ownership | 394 | 467 | -16% | 86 | 106 | -19% | ||
| Increases in PPE | 115 | 39 | +195% | 16 | 32 | -50% | ||
| Depreciation and amortization | 82 | 88 | -7% | 21 | 22 | -5% | ||
The 5% increase in power generation sales during Q4 22 is mainly explained by higher volumes and prices in legacy energy. Said pricing scheme is denominated in AR$ and had 20% and 10% cumulative increases in September and December 2022, respectively[6], exceeding the nominal depreciation of 20% in Q4 22. The capacity remuneration for our thermal legacy units was US$4.0 thousand/MW-month (+13% vs. Q4 21) and US$2.1 thousand/MW-month for hydros (+10% vs. Q4 21). 73% of the 5,088 MW operated by Pampa[7] is composed of legacy energy but represented just 32% of the Q4 22 segment’s sales.
Q4 22 sales also increased because of PEMC’s consolidation and higher gas volume assigned to CAMMESA as the second CTGEBA’s CCGT had a major overhaul in Q4 21. It is worth highlighting that fuel income only applies to PPAs under Energía Plus and SEE Res. No. 287/17, and in turn, the gas purchases to our E&P impact power generation costs. CAMMESA provides the remaining fuel for our thermal units without earning sales or accruing costs.
Those effects were partially offset by lesser PPA income due to contract maturities in CTLL’s ST and CTP (remunerated as legacy energy since November and July 2021, respectively) and the export incentive collected in Q4 21 from CAMMESA, discontinued in January 2022. In addition, we recorded an incident in CTLL’s GT05 in December 2022, which was put back on service in mid-January 2023.
6 Increases granted in December 2022. For further information, see section 1.1 of this release.
7 Under IFRS, we do not consolidate CTEB (567 MW) in our financial statements since it is an affiliate. However, it is an asset operated by Pampa and its EBITDA is incorporated to our shareholding to the total adjusted EBITDA.
| Pampa Energía ● Earnings release Q4 22 ● 11 |
| |
In operating terms, Pampa’s operated power generation grew 11% vs. Q4 21, while the Argentine power grid recorded a drop of 1%. The higher generation was mainly due to Q4 21’s programmed overhauls in CTEB, CTLL’s CCGT and second CTGEBA’s CCGT, partially offset by CTLL GT05’s outage and lesser gas availability in CTGEBA during Q4 22 (+343 GWh). Additionally, the higher output was explained by greater gas availability in CPB (+234 GWh) and better nature conditions in HPPL (+162 GWh) and wind farms (+38 GWh). However, these increases were partially offset by the gas depletion from Bolivia impacted in CTG and CTP (-199 GWh), lower liquid fuels usage in CTIW and CTPP (-43 GWh), and lesser water in HINISA and HIDISA (-32 GWh).
The availability of Pampa’s operated units reached 96.5% in Q4 22 (+93 basis vs. Q4 21’s 95.5%), mainly because of Q4 21’s programmed maintenance in CTLL’s CCGT and CTGEBA’s second CCGT and CPB’s outage in Q4 21, partially offset by CTLL’s GT05 incident in December 2022. Therefore, the thermal availability rate slightly improved from 95.3% in Q4 21 to 96.1% in Q4 22 (+76 basis points).
| Power generation's key performance indicators | 2022 | 2021 | Variation | ||||||||||||
| Hydro | Wind | Thermal | Total | Hydro | Wind | Thermal | Total | Hydro | Wind | Thermal | Total | ||||
| Installed capacity (MW) | 938 | 324 | 3,826 | 5,088 | 938 | 206 | 3,826 | 4,970 | - | +57% | - | +2% | |||
| New capacity (%) | - | 100% | 28% | 27% | - | 100% | 43% | 37% | - | - | -15% | -10% | |||
| Market share (%) | 2.2% | 0.8% | 8.9% | 11.9% | 2.2% | 0.5% | 8.9% | 11.6% | +0% | +0% | +0% | +0% | |||
| Fiscal year | |||||||||||||||
| Net generation (GWh) | 1,438 | 888 | 15,985 | 18,311 | 1,343 | 838 | 15,252 | 17,433 | +7% | +6% | +5% | +5% | |||
| Volume sold (GWh) | 1,438 | 897 | 17,133 | 19,468 | 1,342 | 870 | 16,246 | 18,458 | +7% | +3% | +5% | +5% | |||
| Average price (US$/MWh) | 23 | 70 | 39 | 39 | 22 | 70 | 47 | 46 | +3% | -1% | -17% | -16% | |||
| Average gross margin (US$/MWh) | 6 | 58 | 23 | 23 | 4 | 58 | 31 | 30 | +64% | -1% | -27% | -24% | |||
| Fourth quarter | |||||||||||||||
| Net generation (GWh) | 550 | 233 | 4,391 | 5,175 | 419 | 195 | 4,055 | 4,670 | +31% | +19% | +8% | +11% | |||
| Volume sold (GWh) | 550 | 223 | 4,696 | 5,470 | 419 | 203 | 4,405 | 5,028 | +31% | +10% | +7% | +9% | |||
| Average price (US$/MWh) | 16 | 69 | 31 | 31 | 18 | 71 | 42 | 41 | -11% | -3% | -25% | -24% | |||
| Average gross margin (US$/MWh) | 3 | 58 | 17 | 17 | -3 | 57 | 27 | 26 | -188% | +1% | -37% | -33% | |||
Note: Gross margin before amortization and depreciation. It includes CTEB, operated by Pampa (50% equity stake).
Without depreciation and amortizations, net operating costs rose 5% vs. Q4 21, mainly due to higher gas purchases either for generation or assigned to CAMMESA, and increased labor costs, which outnumbered the AR$ devaluation. Additionally, the lower electricity procured is explained by CTGEBA’s Plus unit outage in Q4 21. However, these effects were partially offset by a rise in delay interests from CAMMESA and lower maintenance costs.
Financial results from Q4 22 reached a net profit of US$48 million, while in Q4 21, a loss of US$40 million was recorded, mainly due to gains from the holding of financial instruments, partially offset by a raise of interests due to a higher debt stock in AR$ and the PEMC’s consolidation, in addition to higher foreign exchange losses from receivables.
Adjusted EBITDA from the power generation segment reached US$86 million in Q4 22 (-19% vs. Q4 21), mainly due to the end of CTLL, CTP and CTEB’s certain PPAs, CTLL’s GT05 outage and the rise of labor costs in US$, partially offset by higher legacy sales, PEMC’s consolidation and lower maintenance costs. In addition, the adjusted EBITDA considers CTEB (CTBSA)’s 50% ownership (US$2 million in Q4 22 vs. US$19 million in Q4 21) and PEMC (Greenwind)’s 50% share capital for US$3 million in Q4 21[8]. Adjusted EBITDA excludes items such as the commercial interests for late collection, mainly charged to CAMMESA, and PPE’s expenses as operating costs.
8 As of August 12, 2022 PEMC is consolidated into Pampa’s financial statemets.
| Pampa Energía ● Earnings release Q4 22 ● 12 |
| |
Finally, capital investments without CTEB registered US$16 million in Q4 22 (vs. US$32 million in Q4 21), mainly due to the advanced stage of the PEPE IV expansion project. The PEPE VI project was announced after the closing of Q4 22.
| Project | MW | Marketing | Currency | Awarded price | Estimated capex in US$ million1 | Date of commissioning | ||||
| Capacity per MW-month | Variable per MWh | Total per MWh | Budget | % Executed @12/31/22 | ||||||
| Thermal | ||||||||||
| Closing to CC Ensenada | 260 | PPA for 10 years | US$ | 23,962 | 10.5 | 43 | 253 | 91% | 22-Feb-23 | |
| Renewable | ||||||||||
| Pampa Energía IV2 | 45 | MAT ER | US$ | na | na | 58(3) | 128 | 79% | Q2 2023 (est.) | |
| Pampa Energía VI | 94.5 | MAT ER | US$ | na | na | 62(3) | 186 | 0% | Q3 2024 (est.) | |
Note: 1 Amount without value-added tax. 2 18 MW out of 81 MW was commissioned on December 29, 2022. An additional 18 MW was commissioned on February 25, 2023. 3 Estimated average.
| 3.3 | Analysis of the oil and gas segment |
| Oil & gas segment, consolidated Figures in US$ million | Fiscal year | Fourth quarter | ||||||
| 2022 | 2021 | ∆% | 2022 | 2021 | ∆% | |||
| Sales revenue | 646 | 453 | +43% | 155 | 119 | +30% | ||
| Local market sales | 487 | 395 | +23% | 107 | 90 | +19% | ||
| Foreign market sales | 159 | 58 | +174% | 47 | 29 | +63% | ||
| Cost of sales | (359) | (289) | +24% | (89) | (89) | - | ||
| Gross profit | 287 | 164 | +75% | 66 | 30 | +120% | ||
| Selling expenses | (36) | (18) | +100% | (9) | (10) | -10% | ||
| Administrative expenses | (60) | (46) | +30% | (16) | (14) | +14% | ||
| Other operating income | 61 | 58 | +5% | 6 | 6 | - | ||
| Other operating expenses | (26) | (28) | -7% | (4) | (2) | +100% | ||
| Impairment of financial assets | (2) | - | NA | (1) | 1 | NA | ||
| Impairment of PPE and inventories | (30) | - | NA | (1) | - | NA | ||
| Operating income (loss) | 194 | 130 | +49% | 41 | 11 | +273% | ||
| Finance income | 2 | 3 | -33% | - | 1 | -100% | ||
| Finance costs | (107) | (103) | +4% | (24) | (17) | +41% | ||
| Other financial results | (28) | (16) | +75% | (9) | (10) | -10% | ||
| Financial results, net | (133) | (116) | +15% | (33) | (26) | +27% | ||
| Profit (loss) before tax | 61 | 14 | NA | 8 | (15) | NA | ||
| Income tax | (16) | 8 | NA | (16) | 10 | NA | ||
| Net income (loss) for the period | 45 | 22 | +105% | (8) | (5) | +60% | ||
| Adjusted EBITDA | 347 | 255 | +36% | 72 | 46 | +57% | ||
| Increases in PPE and right-of-use assets | 324 | 213 | +52% | 114 | 67 | +70% | ||
| Depreciation and amortization | 125 | 114 | +10% | 30 | 35 | -14% | ||
In Q4 22, sales from the oil and gas segment grew 30% vs. Q4 21, mainly due to the high gas export prices to Chile and the increased volume of gas and oil sold, partially offset by a lower volume of gas exported.
| Pampa Energía ● Earnings release Q4 22 ● 13 |
| |
| Oil and gas' key performance indicators | 2022 | 2021 | Variation | |||||||||
| Oil | Gas | Total | Oil | Gas | Total | Oil | Gas | Total | ||||
| Fiscal year | ||||||||||||
| Volume | ||||||||||||
| Production | ||||||||||||
| In thousand m3/day | 0.8 | 9,811 | 0.7 | 8,004 | +14% | +23% | +22% | |||||
| In million cubic feet/day | 346 | 283 | ||||||||||
| In thousand boe/day | 5.3 | 57.7 | 63.1 | 4.7 | 47.1 | 51.8 | ||||||
| Sales | ||||||||||||
| In thousand m3/day | 0.8 | 9,842 | 0.7 | 8,122 | +16% | +21% | +21% | |||||
| In million cubic feet/day | 348 | 287 | ||||||||||
| In thousand boe/day | 5.3 | 57.9 | 63.3 | 4.6 | 47.8 | 52.4 | ||||||
| Average Price | ||||||||||||
| In US$/bbl | 69.6 | 58.8 | +18% | +16% | ||||||||
| In US$/MBTU | 4.2 | 3.6 | ||||||||||
| Fourth quarter | ||||||||||||
| Volume | ||||||||||||
| Production | ||||||||||||
| In thousand m3/day | 0.9 | 9,493 | 0.8 | 8,987 | +10% | +6% | +6% | |||||
| In million cubic feet/day | 335 | 317 | ||||||||||
| In thousand boe/day | 5.7 | 55.9 | 61.6 | 5.2 | 52.9 | 58.1 | ||||||
| Sales | ||||||||||||
| In thousand m3/day | 0.9 | 9,368 | 0.7 | 8,962 | +18% | +5% | +6% | |||||
| In million cubic feet/day | 331 | 316 | ||||||||||
| In thousand boe/day | 5.5 | 55.1 | 60.7 | 4.7 | 52.7 | 57.4 | ||||||
| Average Price | ||||||||||||
| In US$/bbl | 66.9 | 58.6 | +14% | +24% | ||||||||
| In US$/MBTU | 3.9 | 3.1 | ||||||||||
Note: Net production in Argentina. Gas volume is standardized at 9,300 kilocalories (kCal).
In operating terms, total production reached 61.6 kboe/day in Q4 22 (+6% vs. Q4 21 but -10% vs. Q3 22 due to seasonality). Gas production reached 9.5 million m3/day (+6% vs. Q4 21 and -11% vs. Q3 22), mainly explained by the higher delivery volumes under Plan Gas.Ar, offset by lower exports to Chile. Analyzing by block, El Mangrullo recorded 6.9 million m3/day (+9% vs. Q4 21 and -15% vs. Q3 22), comprising 72% of our total gas output. However, this increase was partially offset by lower activity and the natural depletion at Rincón del Mangrullo (0.3 million m3/day, -25% vs. Q4 21 and similar to Q3 22). At Río Neuquén and Sierra Chata, the year-on-year production was similar. Still, compared to the previous quarter, Río Neuquén raised 5% its deliveries, while Sierra Chata decreased by 10% due to the demand seasonality.
Our gas price in Q4 22 was US$3.9/MBTU (+24% vs. Q4 21 but -20% vs. Q3 22 due to seasonality), mainly driven by exports with prices better than the local market, and to a lower extent, a slight increase in the industrial segment.
In Q4 22, our gas deliveries were allocated as follows: 28% as raw material to our thermal power units[9] and petchem plants, 23% sold to CAMMESA, 22% to the industrial/spot market, 14% to retail and 13% exported. On the other hand, in Q4 21, 40% of our gas deliveries were sold to the industrial/spot market, 22% was fired at our thermal and petrochemicals plants, 21% was exported, 15% supplied the retail segment, and the rest was sold directly to CAMMESA.
Oil production reached 5.7 kbbl/day in Q4 22 (+10% vs. Q4 22 and +5% vs. Q3 22), mainly due to higher foreign demand: 83% of the volume sold in Q4 22 was placed in the domestic market vs. 93% in Q4 21. Production grew at Gobernador Ayala, Los Blancos and Río Neuquén (+0.7 kbbl/day vs. Q4 21), offset by a slight decline of 0.2 kbbl/day at El Tordillo.
9 Plus Energy and SEE Res. No. 287/17.
| Pampa Energía ● Earnings release Q4 22 ● 14 |
| |
Our oil price in Q4 22 increased by 14% year-on-year, reaching US$66.9/barrel, mainly explained by the rise of the international Brent reference and the improvement of local prices.
By the end of Q4 22, we accounted for 895 productive wells vs. 884 as of December 31, 2021.
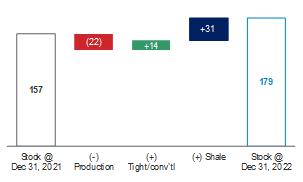
Pampa’s proven reserves (P1) by the end of 2022 amounted to 179 million boe, 14% higher than the 157 million boe recorded by the end of 2021. The higher shale reserve quantification from the Vaca Muerta formation mainly explains this increase, essentially driven by the performance of pilot wells at El Mangrullo and Sierra Chata blocks. During 2022, we tripled the certified shale volume, reaching 44 million boe, comprising 24% of Pampa’s P1 reserves (vs. 14 million boe or 9% of the 2021 P1 reserves). The tight gas addition is mainly from El Mangrullo and, to a lesser extent, from Río Neuquén.
Considering the production levels and additional reserves achieved in 2022, the replacement ratio amounted to 2.0, and the average reserve life was approximately 8.0 years. Moreover, 94% of the reserves are natural gas and 6% oil.
Pampa’s total proven reserves As of December 31, 2022 100% = 179 million boe 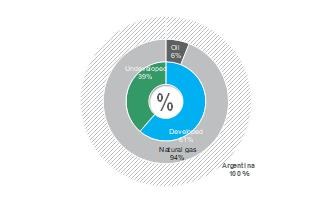 | Evolution of Pampa’s certified proven reserves In million boe
|
Net operating costs in Q4 22, excluding depreciation, amortization and Plan Gas.Ar compensation grew 10% vs. Q4 21, mainly because of the higher activity (treatment and transportation), royalties, levies and taxes from higher price and volume sold, as well as increased costs in labor, partially offset by the reclassification of PPE made in Q4 21 well repair campaign to production cost. Compared to Q3 22, net operating expenses decreased by 12%, mainly due to seasonality (royalties and lower activity) and oil stock consumption in Q3 22, partially offset by the higher transportation cost of exported gas. As a result, lifting cost reached US$7.0/boe produced in Q4 22 (-3% vs. Q4 21 but +5% vs. Q3 22).
Financial results in Q4 22 recorded a net loss of US$33 million (+27% vs. Q4 21), mainly due to higher losses from devaluation over receivables and the Plan Gas.Ar’s subsidy component, in addition to the increased interests from the higher stock of AR$-debt, partially offset by gains from holding financial securities.
Our oil and gas adjusted EBITDA amounted to US$72 million in Q4 22 (+57% vs. Q4 21), mainly explained by the increased deliveries under Plan Gas.Ar, gas exports to Chile and better oil production and prices. These effects were partially offset by higher expenses related to the growing activity and increased royalties and payroll. The adjusted EBITDA of Q4 22 excludes the impairment of inventories.
Finally, in Q4 22, capital expenditures amounted to US$114 million (+70% vs. Q4 22), mainly driven by the growing commitments under Plan Gas.Ar.
| Pampa Energía ● Earnings release Q4 22 ● 15 |
| |
| 3.4 | Analysis of the petrochemicals segment |
| Petrochemicals segment, consolidated Figures in US$ million | Fiscal year | Fourth quarter | ||||||
| 2022 | 2021 | ∆% | 2022 | 2021 | ∆% | |||
| Sales revenue | 617 | 490 | +26% | 154 | 144 | +7% | ||
| Local market sales | 425 | 310 | +37% | 117 | 95 | +23% | ||
| Foreign market sales | 192 | 180 | +7% | 37 | 49 | -25% | ||
| Cost of sales | (536) | (424) | +26% | (131) | (130) | +1% | ||
| Gross profit | 81 | 66 | +23% | 23 | 14 | +64% | ||
| Selling expenses | (17) | (13) | +31% | (5) | (4) | +25% | ||
| Administrative expenses | (5) | (4) | +25% | (1) | (1) | - | ||
| Other operating income | 1 | 1 | - | 1 | - | NA | ||
| Other operating expenses | (6) | (3) | +100% | (4) | (1) | +300% | ||
| Impairment of inventories | (2) | (2) | - | (2) | (2) | - | ||
| Operating income (loss) | 52 | 45 | +16% | 12 | 6 | +100% | ||
| Finance costs | (3) | (3) | - | (1) | (1) | - | ||
| Other financial results | 6 | (2) | NA | 1 | - | NA | ||
| Financial results, net | 3 | (5) | NA | - | (1) | -100% | ||
| Profit (loss) before tax | 55 | 40 | +38% | 12 | 5 | +140% | ||
| Income tax | (15) | (12) | +25% | (10) | (1) | NA | ||
| Net income (loss) for the period | 40 | 28 | +43% | 2 | 4 | -50% | ||
| Adjusted EBITDA | 59 | 50 | +18% | 15 | 9 | +68% | ||
| Increases in PPE | 7 | 6 | +17% | 2 | 1 | +100% | ||
| Depreciation and amortization | 5 | 3 | +67% | 1 | 1 | - | ||
The petrochemicals segment’s adjusted EBITDA reached US$15 million in Q4 22 (+68% vs. Q4 21), mainly explained by the rise in local price and demand of reforming products, in addition to the lower costs of virgin naphtha and higher domestic sales of polystyrene, partially offset by lower margin and demand of styrene and SBR. The adjusted EBITDA excludes the impairment of inventories. The adjusted EBITDA fell 21% quarter-on-quarter, mainly due to lower reforming prices and decreased SBR volume sold, partially offset by off-peak gas costs.
Total volume sold grew 5% vs. Q4 21 to 120 thousand ton, mainly explained by local demand hike of octane bases associated with the recovery in gasoline consumption, offset by lower export of gasoline and sales of styrene products. Moreover, in Q4 21, 6 thousand ton of bases and gasoline were dispatched as toll processing, which was not recorded as volume sold.
| Pampa Energía ● Earnings release Q4 22 ● 16 |
| |
| Petrochemicals' key performance indicators | Products | Total | ||||
| Styrene & polystyrene1 | SBR | Reforming | ||||
| Fiscal year | ||||||
| Volume sold 2022 (thousand ton) | 114 | 46 | 262 | 421 | ||
| Volume sold 2021 (thousand ton) | 114 | 49 | 254 | 417 | ||
| Variation 2022 vs. 2021 | -1% | -7% | +3% | +1% | ||
| Average price 2022 (US$/ton) | 2,093 | 2,310 | 1,044 | 1,464 | ||
| Average price 2021 (US$/ton) | 1,778 | 2,003 | 740 | 1,174 | ||
| Variation 2022 vs. 2021 | +18% | +15% | +41% | +25% | ||
| Fourth quarter | ||||||
| Volume sold Q4 22 (thousand ton) | 30 | 10 | 81 | 120 | ||
| Volume sold Q4 21 (thousand ton) | 33 | 11 | 70 | 114 | ||
| Variation Q4 22 vs. Q4 21 | -9% | -13% | +15% | +5% | ||
| Average price Q4 22 (US$/ton) | 1,939 | 2,282 | 926 | 1,285 | ||
| Average price Q4 21 (US$/ton) | 1,846 | 2,318 | 831 | 1,266 | ||
| Variation Q4 22 vs. Q4 21 | +5% | -2% | +11% | +2% | ||
Note: 1 Includes Propylene.
In Q4 22, no financial results were recorded. In Q4 21, a US$1 million net loss was recorded, explained by higher gains from AR$ devaluation over certain raw material suppliers, partially offset by higher losses from holding financial securities.
Capital expenditures reached US$2 million in Q4 22 vs. US$1 million in Q4 21.
| 3.5 | Analysis of the holding and others segment |
| Holding and others segment, consolidated Figures in US$ million | Fiscal year | Fourth quarter | ||||||
| 2022 | 2021 | ∆% | 2022 | 2021 | ∆% | |||
| Sales revenue | 20 | 22 | -9% | 4 | 7 | -43% | ||
| Local market sales | 20 | 22 | -9% | 4 | 7 | -43% | ||
| Foreign market sales | - | - | NA | - | - | NA | ||
| Gross profit | 20 | 22 | -9% | 4 | 7 | -43% | ||
| Administrative expenses | (34) | (18) | +89% | (10) | (7) | +43% | ||
| Other operating income | 44 | 4 | NA | 38 | 1 | NA | ||
| Other operating expenses | (9) | (22) | -59% | (3) | (4) | -25% | ||
| Impairment of financial assets | (6) | (2) | +200% | (2) | - | NA | ||
| Impairment of intangible assets | (6) | - | NA | (1) | - | NA | ||
| Results for participation in joint businesses | 40 | 70 | -43% | 7 | 17 | -59% | ||
| Operating income (loss) | 49 | 54 | -9% | 33 | 14 | +136% | ||
| Finance income | 9 | 4 | +125% | 1 | 2 | -50% | ||
| Finance costs | (36) | (34) | +6% | (15) | (3) | NA | ||
| Other financial results | 116 | 18 | NA | 58 | (6) | NA | ||
| Financial results, net | 89 | (12) | NA | 44 | (7) | NA | ||
| Profit (loss) before tax | 138 | 42 | +229% | 77 | 7 | NA | ||
| Income tax | (20) | 2 | NA | (14) | 2 | NA | ||
| Net income for the period | 118 | 44 | +168% | 63 | 9 | NA | ||
| Adjusted EBITDA | 107 | 127 | -16% | 10 | 38 | -74% | ||
| Increases in PPE and intangible assets | 5 | 2 | +127% | 2 | 1 | +100% | ||
| Depreciation and amortization | - | - | NA | - | - | NA | ||
| Pampa Energía ● Earnings release Q4 22 ● 17 |
| |
The holding and others segment, without considering the affiliates’ equity income (Transener and TGS), posted a US$27 million operating profit, while in Q4 21, it was a US$3 million loss, mainly explained by the arbitration award obtained in Ecuador for US$37 million, in addition to lower fees to third parties, partially offset by the updated executive compensation and lower accrued fees.
In Q4 22, financial results reached a net gain of US$44 million, while in Q4 21, it was a net loss of US$7 million, mainly due to FX difference gains over tax debt, partially offset by higher tax interests.
The adjusted EBITDA of our holding and others segment decreased by 74%, recording US$10 million in Q4 22. The adjusted EBITDA excludes the equity income from our participation in TGS and Transener. In turn, it adds the EBITDA adjusted by equity ownership in these businesses. Besides, it excludes the impairment of intangible assets and Ecuador’s award in Q4 22.
In TGS, the EBITDA adjusted by our stake was US$22 million in Q4 22 vs. US$39 million in Q4 21. The decline in the total adjusted EBITDA was mainly due to lower international reference prices and regulated income (although tariffs were increased in March 2022, they failed to offset the evolution of AR$ devaluation), in addition to the higher cost of gas in US$, used to replace thermal reduction at Cerri. However, these effects were partially offset by ethane price hikes, higher dispatched liquid volume and lower maintenance costs.
In Transener, the EBITDA adjusted by our stake recorded a loss of US$2 million in Q4 22 vs. a gain of US$2 million in Q4 21, mainly because the AR$ devaluation outnumbered the tariff increase.
| Pampa Energía ● Earnings release Q4 22 ● 18 |
| |
| 3.6 | Analysis of the fiscal year, by subsidiary and segment |
| Subsidiary In US$ million | Fiscal year 2022 | Fiscal year 2021 | |||||||
| % Pampa | Adjusted EBITDA | Net debt2 | Net income3 | % Pampa | Adjusted EBITDA | Net debt2 | Net income3 | ||
| Power generation segment | |||||||||
| Diamante | 61.0% | 3 | (0) | 1 | 61.0% | 4 | (6) | 4 | |
| Los Nihuiles | 52.0% | 0 | (0) | 1 | 52.0% | (3) | (5) | (1) | |
| Greenwind4 | 13 | - | 2 | 22 | 72 | (4) | |||
| Non-controlling stake adjustment | (7) | - | (1) | (11) | (36) | 2 | |||
| Subtotal Greenwind adjusted by ownership | 50.0% | 7 | - | 1 | 50.0% | 11 | 36 | (2) | |
| CTBSA | 67 | 278 | 82 | 156 | 220 | 98 | |||
| Non-controlling stake adjustment | (33) | (139) | (41) | (78) | (110) | (49) | |||
| Subtotal CTBSA adjusted by ownership | 50.0% | 33 | 139 | 41 | 50.0% | 78 | 110 | 49 | |
| Pampa stand-alone, other companies, adjs. & deletions1 | 100.0% | 352 | 161 | 209 | 100% | 378 | 167 | 168 | |
| Subtotal power generation | 395 | 300 | 253 | 467 | 302 | 218 | |||
| Oil & gas segment | |||||||||
| Pampa Energía | 100.0% | 347 | 753 | 45 | 100.0% | 255 | 801 | 22 | |
| Subtotal oil & gas | 347 | 753 | 45 | 255 | 801 | 22 | |||
| Petrochemicals segment | |||||||||
| Pampa Energía | 100.0% | 59 | - | 40 | 100.0% | 50 | - | 28 | |
| Subtotal petrochemicals | 59 | - | 40 | 50 | - | 28 | |||
| Holding & others segment | |||||||||
| Transener | 41 | (32) | 10 | 54 | (31) | (13) | |||
| Non-controlling stake adjustment | (30) | 24 | (7) | (40) | 22 | 9 | |||
| Subtotal Transener adjusted by ownership | 26.3% | 11 | (8) | 3 | 26.3% | 14 | (8) | (3) | |
| TGS | 407 | 271 | 182 | 425 | 310 | 204 | |||
| Non-controlling stake adjustment | (288) | (192) | (129) | (302) | (220) | (145) | |||
| Subtotal TGS adjusted by ownership | 29.3% | 119 | 79 | 53 | 29.2% | 123 | 90 | 59 | |
| Pampa stand-alone, other companies, adjs. & deletions1 | 100.0% | (23) | (0) | 62 | 100% | (11) | (91) | (12) | |
| Subtotal holding & others | 107 | 71 | 118 | 127 | (9) | 44 | |||
| Deletions | 100% | - | (210) | - | 100% | - | (229) | - | |
| Total consolidated from continuing operations | 908 | 913 | 456 | 899 | 866 | 312 | |||
| At our share ownership | 906 | 1,127 | 456 | 899 | 1,099 | 312 | |||
Note: 1 The deletion corresponds to other companies, inter-companies or debt repurchases. 2 Net debt includes holding companies.
3 Attributable to the Company’s shareholders. 4 Consolidated in Pampa’s FS since August 12, 2022.
| Pampa Energía ● Earnings release Q4 22 ● 19 |
| |
| 3.7 | Analysis of the quarter, by subsidiary and segment |
| Subsidiary In US$ million | Q4 22 | Q4 21 | |||||||
| % Pampa | Adjusted EBITDA | Net debt2 | Net income3 | % Pampa | Adjusted EBITDA | Net debt2 | Net income3 | ||
| Power generation segment | |||||||||
| Diamante | 61.0% | 0 | (0) | (1) | 61.0% | 1 | (6) | 1 | |
| Los Nihuiles | 52.0% | (0) | (0) | (3) | 52.0% | (2) | (5) | (3) | |
| Greenwind4 | - | - | - | 5 | 72 | 0 | |||
| Non-controlling stake adjustment | - | - | - | (3) | (36) | (0) | |||
| Subtotal Greenwind adjusted by ownership | 0.0% | - | - | - | 50.0% | 3 | 36 | 0 | |
| CTBSA | 4 | 278 | (3) | 38 | 220 | 31 | |||
| Non-controlling stake adjustment | (2) | (139) | 2 | (19) | (110) | (15) | |||
| Subtotal CTBSA adjusted by ownership | 50.0% | 2 | 139 | (2) | 50.0% | 19 | 110 | 15 | |
| Pampa stand-alone, other companies, adjs. & deletions1 | 100.0% | 84 | 161 | 60 | 100% | 85 | 167 | 18 | |
| Subtotal power generation | 86 | 300 | 55 | 105 | 302 | 31 | |||
| Oil & gas segment | |||||||||
| Pampa Energía | 100.0% | 72 | 753 | (8) | 100.0% | 46 | 801 | (5) | |
| Subtotal oil & gas | 72 | 753 | (8) | 46 | 801 | (5) | |||
| Petrochemicals segment | |||||||||
| Pampa Energía | 100.0% | 15 | - | 2 | 100.0% | 9 | - | 4 | |
| Subtotal petrochemicals | 15 | - | 2 | 9 | - | 4 | |||
| Holding & others segment | |||||||||
| Transener | (6) | (32) | (5) | 8 | (31) | (3) | |||
| Non-controlling stake adjustment | 5 | 24 | 4 | (6) | 22 | 2 | |||
| Subtotal Transener adjusted by ownership | 26.3% | (2) | (8) | (1) | 26.3% | 2 | (8) | (1) | |
| TGS | 75 | 271 | 26 | 133 | 310 | 73 | |||
| Non-controlling stake adjustment | (53) | (192) | (19) | (94) | (220) | (52) | |||
| Subtotal TGS adjusted by ownership | 29.3% | 22 | 79 | 8 | 29.2% | 39 | 90 | 21 | |
| Pampa stand-alone, other companies, adjs. & deletions1 | 100.0% | (10) | (0) | 57 | 100% | (3) | (91) | (12) | |
| Subtotal holding & others | 10 | 71 | 63 | 38 | (9) | 9 | |||
| Deletions | 100% | 1 | (210) | 1 | 100% | - | (229) | - | |
| Total consolidated from continuing operations | 183 | 913 | 113 | 198 | 866 | 39 | |||
| At our share ownership | 183 | 1,127 | 113 | 198 | 1,099 | 39 | |||
Note: 1 The deletion corresponds to other companies, inter-companies or debt repurchases. 2 Net debt includes holding companies.
3 Attributable to the Company’s shareholders. 4 Consolidated in Pampa’s FS since August 12, 2022.
| Pampa Energía ● Earnings release Q4 22 ● 20 |
| |
| 4. | Appendix |
| 4.1 | Power generation’s main operational KPIs |
| Power generation's key performance indicators | Hydroelectric | Wind | Subtotal hydro +wind | Thermal | Total | ||||||||||||||||||
| HINISA | HIDISA | HPPL | PEMC1 | PEPE2 | PEPE 3-42 | PEA3 | CTLL | CTG | CTP | CPB | CTPP | CTIW | CTGEBA | Eco- Energía | CTEB4 | Subtotal | |||||||
| Installed capacity (MW) | 265 | 388 | 285 | 100 | 53 | 71 | 100 | 1,262 | 780 | 361 | 30 | 620 | 100 | 100 | 1,253 | 14 | 567 | 3,826 | 5,088 | ||||
| New capacity (MW) | - | - | - | 100 | 53 | 71 | 100 | 324 | 184 | 100 | - | - | 100 | 100 | 565 | 14 | - | 1,064 | 1,388 | ||||
| Market share | 0.6% | 0.9% | 0.7% | 0.2% | 0.1% | 0.2% | 0.2% | 2.9% | 1.8% | 0.8% | 0.1% | 1.4% | 0.2% | 0.2% | 2.9% | 0.03% | 1.3% | 8.9% | 11.9% | ||||
| Fiscal year | |||||||||||||||||||||||
| Net generation 2022 (GWh) | 428 | 303 | 707 | 391 | 231 | 250 | 17 | 2,326 | 5,103 | 225 | 52 | 1,209 | 321 | 308 | 7,746 | 73 | 948 | 15,985 | 18,311 | ||||
| Market share | 0.3% | 0.2% | 0.5% | 0.3% | 0.2% | 0.2% | 0.01% | 1.7% | 3.7% | 0.2% | 0.0% | 0.9% | 0.2% | 0.2% | 5.6% | 0.1% | 0.7% | 11.6% | 13.3% | ||||
| Sales 2022 (GWh) | 428 | 303 | 707 | 391 | 256 | 250 | - | 2,335 | 5,103 | 469 | 52 | 1,209 | 321 | 308 | 8,571 | 152 | 948 | 17,133 | 19,468 | ||||
| Net generation 2021 (GWh) | 467 | 325 | 550 | 367 | 215 | 256 | - | 2,181 | 4,682 | 392 | 53 | 312 | 299 | 301 | 8,594 | 75 | 546 | 15,252 | 17,433 | ||||
| Variation 2022 vs. 2021 | -8% | -7% | +29% | +6% | +7% | -2% | na | +7% | +9% | -43% | -1% | na | +7% | +2% | -10% | -3% | +74% | +5% | +5% | ||||
| Sales 2021 (GWh) | 467 | 325 | 550 | 367 | 247 | 256 | - | 2,212 | 4,692 | 624 | 53 | 313 | 299 | 300 | 9,266 | 153 | 546 | 16,246 | 18,458 | ||||
| Avg. price 2022 (US$/MWh) | 23 | 38 | 15 | 69 | 74 | 66 | na | 41 | 19 | 77 | 41 | 33 | 118 | 99 | 39 | 40 | 90 | 39 | 39 | ||||
| Avg. price 2021 (US$/MWh) | 18 | 34 | 18 | 71 | 73 | 67 | na | 41 | 31 | 45 | 84 | 75 | 126 | 100 | 34 | 33 | na | 47 | 46 | ||||
| Avg. gross margin 2022 (US$/MWh) | 3 | 12 | 6 | 60 | 54 | 58 | na | 26 | 12 | 25 | 12 | 11 | 94 | 73 | 21 | 17 | 70 | 23 | 23 | ||||
| Avg. gross margin 2021 (US$/MWh) | (6) | 12 | 7 | 61 | 55 | 58 | na | 25 | 26 | 10 | 41 | 12 | 103 | 78 | 17 | 12 | na | 31 | 30 | ||||
| Fourth quarter | |||||||||||||||||||||||
| Net generation Q4 22 (GWh) | 171 | 101 | 278 | 101 | 56 | 59 | 17 | 783 | 1,215 | 27 | 18 | 386 | 41 | 55 | 2,173 | 18 | 459 | 4,391 | 5,175 | ||||
| Market share | 0.5% | 0.3% | 0.8% | 0.3% | 0.2% | 0.2% | 0.05% | 2.2% | 3.5% | 0.1% | 0.1% | 1.1% | 0.1% | 0.2% | 6.2% | 0.1% | 1.3% | 12.6% | 14.8% | ||||
| Sales Q4 22 (GWh) | 171 | 101 | 278 | 101 | 63 | 59 | - | 773 | 1,215 | 100 | 18 | 387 | 41 | 55 | 2,389 | 35 | 459 | 4,696 | 5,470 | ||||
| Net generation Q4 21 (GWh) | 200 | 104 | 116 | 86 | 52 | 58 | - | 615 | 1,061 | 222 | 22 | 152 | 62 | 77 | 2,182 | 16 | 260 | 4,055 | 4,670 | ||||
| Variation Q4 22 vs. Q4 21 | -14% | -3% | #### | +17% | +9% | +3% | na | +27% | +14% | -88% | -17% | na | -34% | -29% | -0% | +15% | +76% | +8% | +11% | ||||
| Sales Q4 21 (GWh) | 200 | 104 | 116 | 86 | 59 | 58 | - | 623 | 1,071 | 290 | 22 | 152 | 62 | 77 | 2,440 | 30 | 261 | 4,405 | 5,028 | ||||
| Avg. price Q4 22 (US$/MWh) | 15 | 28 | 12 | 70 | 72 | 66 | na | 31 | 18 | 88 | 29 | 26 | na | 131 | 34 | 33 | 21 | 31 | 31 | ||||
| Avg. price Q4 21 (US$/MWh) | 12 | 26 | 20 | 72 | 74 | 67 | na | 35 | 25 | 31 | 26 | 52 | 149 | 97 | 31 | 43 | na | 42 | 41 | ||||
| Avg. gross margin Q4 22 (US$/MWh) | (1) | 1 | 5 | 61 | 54 | 57 | na | 19 | 12 | 14 | 4 | 7 | na | 94 | 19 | 12 | 10 | 17 | 17 | ||||
| Avg. gross margin Q4 21 (US$/MWh) | (11) | 2 | 6 | 61 | 54 | 56 | na | 17 | 17 | 10 | (1) | 18 | 120 | 75 | 18 | 18 | na | 27 | 26 | ||||
Note: Gross margin before amortization and depreciation 1 Fully owned by Pampa since August 12, 2022. Before, it was operated by Pampa with a 50% of equity stake. 2 On December 29, 2022, 18 MW of PEPE IV was commissioned, plus another 18 MW on February 25, 2023. 3 Acquired on December 16, 2022. 4 Operated by Pampa (50% equity stake)
| Pampa Energía ● Earnings release Q4 22 ● 21 |
| |
| Pampa Energía ● Earnings release Q4 22 ● 22 |
| |
| 4.2 | Oil and gas production in the main areas |
| In kboe/day at ownership | Fiscal year | Fourth quarter | ||||||
| 2022 | 2021 | Variation | 2022 | 2021 | Variation | |||
| Gas | ||||||||
| El Mangrullo | 41.9 | 32.6 | +28% | 40.3 | 37.0 | +9% | ||
| Río Neuquén | 8.8 | 7.2 | +23% | 9.1 | 9.1 | -0% | ||
| Sierra Chata | 3.9 | 3.1 | +23% | 3.3 | 3.3 | +2% | ||
| Rincón del Mangrullo1 | 2.0 | 3.1 | -34% | 1.8 | 2.4 | -25% | ||
| Others | 1.2 | 1.1 | +7% | 1.3 | 1.1 | +18% | ||
| Total gas at O/S | 57.7 | 47.1 | +23% | 55.9 | 52.9 | +6% | ||
| Oil | ||||||||
| El Tordillo2 | 2.6 | 2.5 | +5% | 2.7 | 2.9 | -7% | ||
| Gobernador Ayala | 1.1 | 0.9 | +17% | 1.2 | 1.0 | +28% | ||
| Associated oil3 | 1.1 | 0.9 | +12% | 1.2 | 1.0 | +18% | ||
| Others | 0.5 | 0.3 | +82% | 0.6 | 0.4 | +65% | ||
| Total oil at O/S | 5.3 | 4.7 | +14% | 5.7 | 5.2 | +10% | ||
| Total | 63.1 | 51.8 | +22% | 61.6 | 58.1 | +6% | ||
Note: Production in Argentina 1 It does not include shale formation. 2 It includes La Tapera – Puesto Quiroga block. 3 From gas fields.
| 5. | Glossary of terms |
| Term | Definition |
| ADR/ADS | American Depositary Receipt |
| AR$ | Argentine Pesos |
| Bbl | Barrel |
| Boe | Barrels of oil equivalent |
| CAMMESA | Compañía Administradora del Mercado Mayorista Eléctrico S.A.(Argentine Wholesale Electricity Market Clearing Company) |
| CB | Corporate Bonds |
| CCGT | Combined Cycle |
| CPB | Piedra Buena Thermal Power Plant |
| CTBSA | CT Barragán S.A. |
| CTEB | Ensenada Barragán Thermal Power Plant |
| CTG | Güemes Thermal Power Plant |
| CTGEBA | Genelba Thermal Power Plant |
| CTIW | Ingeniero White Thermal Power Plant |
| CTLL | Loma De La Lata Thermal Power Plant |
| CTP | Piquirenda Thermal Power Plant |
| CTPP | Parque Pilar Thermal Power Plant |
| DIGO | Guaranteed Availability Commitments |
| DoP | Deliver or Pay |
| E&P | Exploration and Production |
| EBITDA | Earnings before interest, tax, depreciation and amortization |
| EcoEnergía | EcoEnergía Co-Generation Power Plant |
| ENARGAS | Ente Nacional Regulador del Gas (National Gas Regulatory Entity) |
| ENARSA | Energía Argentina S.A. (former Integración Energética Argentina S.A.) |
| Energía Plus | Energía Plus Program, SE Res. No. 1,281/06 |
| Pampa Energía ● Earnings release Q4 22 ● 23 |
| |
| ENRE | Ente Nacional Regulador de la Electricidad (National Electricity Regulatory Entity) |
| FS | Financial Statements |
| FV | Face value |
| FX | Nominal exchange rate |
| Greenwind | Greenwind S.A. |
| GT | Gas turbine |
| GWh | Gigawatt-hour |
| HIDISA | Diamante Hydro Power Plant |
| HINISA | Los Nihuiles Hydro Power Plant |
| HMRT | Horas de Alto Requerimiento Térmico del Mes (Hours of the month with high thermal demand) |
| HPPL | Pichi Picún Leufú Hydro Power Plant |
| IFRS | International Financial Reporting Standards |
| Kbbl/kboe | Thousands of barrels/thousands of barrels of oil equivalent |
| M3 | Cubic meters |
| MAT ER | Term Market from Renewable Energy Sources |
| MBTU | Million British Thermal Units |
| MULC | Mercado Único y Libre de Cambios (Free and Single Exchange Market) |
| MW/MWh | Megawatt/Megawatt-hour |
| N.a. | Not applicable |
| Pampa / The Company | Pampa Energía S.A. |
| Pampa Group | Pampa Energía S.A. and its subsidiaries |
| PEA | Arauco Wind Farm, stage 1 and 2 |
| PEMC | Ingeniero Mario Cebreiro Wind Farm |
| PEN | Poder Ejecutivo Nacional (National Executive Branch) |
| PEPE | Pampa Energía Wind Farm |
| Plan Gas.Ar | Re-assurance and Strengthening of the Federal Hydrocarbon Production through Self-Supply, Exports, Replacement of Imports and the Expansion of the Transportation System to All the Country’s Hydrocarbon Basins 2023 – 2028 Plan (Executive Order No. 730/22) and the Argentine Natural Gas Production Promotion Plan – 2020 – 2024 Supply and Demand Scheme (Emergency Executive Order No. 892/20 and supplementary provisions) |
| PPA | Power Purchase Agreement |
| PPE | Property, Plant and Equipment |
| Q3 22/Q3 21 | Third quarter of 2022/ Third quarter of 2021 |
| Q4 22/Q4 21 | Fourth quarter of 2022/Fourth quarter of 2021 |
| Res. | Resolution/Resolutions |
| SE | Secretariat of Energy |
| SEE | Under Secretariat of Electric Energy (former Secretariat of Electric Energy) |
| ST | Steam turbine |
| TGS | Transportadora de Gas del Sur S.A. |
| Ton | Metric ton |
| ToP | Take or Pay |
| Transba | Empresa de Transporte de Energía Eléctrica por Distribución Troncal de la Provincia de Buenos Aires Transba S.A. |
| Transener | Compañía de Transporte de Energía Eléctrica en Alta Tensión Transener S.A. |
| US$ | U.S. Dollars |
| VAR | Vientos de Arauco Renovables S.A.U. |