Pampa Energía, an independent company with active participation in Argentina’s electricity and gas value chain, announces the results for the quarter ended on March 31, 2023. |
Buenos Aires, May 10, 2023
Stock information 
Share capital net of repurchases and reductions
as of May 9, 2023
1,363.5 million common shares/
54.5 million ADS Market capitalization:
AR$854.0 billion/US$1,880 million Information about the videoconference Date and time: Thursday May 11
10 AM Eastern Standard Time
11 AM Buenos Aires Time Access link: bit.ly/Pampa1Q2023VC For further information about Pampa · Email: investor@pampaenergia.com · Website for investors: ri.pampaenergia.com · Argentina’s Securities and Exchange Commission: www.argentina.gob.ar/cnv · Securities and Exchange Commission: sec.gov | | Basis of presentation Pampa’s financial information adopts US$ as functional currency, expressed in AR$ at transactional FX. However, our affiliates, Transener and TGS, report in local currency. Hence, their figures are adjusted by inflation as of March 31, 2023, except for previous periods already reported. Main results from the quarter[1] 5% year-on-year increase in sales, recording US$431 million[2] in Q1 23, explained by better natural gas and spot energy prices, higher electricity, reforming and styrene volume sold, and the incorporation of PEA and PEMC, partially offset by lower gas production due to soft residential demand and bottlenecks in the main gas pipelines. Operating performance led by thermal power dispatch and reforming: |
| | Pampa's main operational KPIs | Q1 23 | Q1 22 | Variation |
| | Power | Generation (GWh) | 5,760 | 4,892 | +18% |
| | | Gross margin (US$/MWh) | 20.8 | 28.9 | -28% |
| | | | | | |
| | Oil and gas | Production (k boe/day) | 57.6 | 57,5 | +0% |
| | | Gas over total production | 91% | 91% | -0% |
| | | Average gas price (US$/MBTU) | 4.0 | 3.5 | +11% |
| | | Average oil price (US$/bbl) | 67.7 | 69.0 | -2% |
| | | | | | |
| | Petrochemicals | Volume sold (k ton) | 103 | 91 | +13% |
| | | Average price (US$/ton) | 1,219 | 1,385 | -12% |
| | | | | | |
| | 8% year-on-year decrease in the adjusted EBITDA[3], recording US$206 million in Q1 23, explained by reductions of 29% in holding and others and 11% in power generation, partially offset by increases of 16% in petrochemicals and 10% in oil and gas. Profit attributable to the Company’s shareholders of US$141 million (+42% vs. Q1 22), mainly due to gains from holding financial securities and nominal depreciation over the passive net monetary position in AR$, partially offset by increased financial interests from the higher stock of AR$-debt. Net debt continued decreasing, reaching US$903 million, with a net leverage ratio of 1.2x. |
[1] The information is based on FS prepared according to IFRS in force in Argentina.
[2] It does not include sales from the affiliates CTBSA, Transener and TGS, which at our ownership account for US$94 million. Under IFRS, affiliates are not consolidated in Pampa, thus shown as ‘Results for participation in joint businesses and associates’.
[3] Consolidated adjusted EBITDA represents the results before financial results, income tax, depreciations and amortizations, extraordinary and non-cash income and expense, equity income and other adjustments from the IFRS implementation, and includes affiliates’ EBITDA at our ownership. For further information, see section 3 of this Earnings release.
Table of contents
| |
| Pampa Energía ● Earnings release Q1 23 ● 2 |
| 1.1 | Power generation segment |
Amendment of differential remuneration for legacy/spot CCGTs
Through Note No. NO-2023-28679610-APN-SE#MEC issued on March 15, 2023, the SE established the main conditions to implement the differential pricing under SE Res. No. 59/23: (i) CCGTs that are partially committed under a PPA may adhere to this pricing scheme - self-generators with associated industrial or commercial demand are excluded; (ii) the scheme’s term cannot begin after January 1, 2024, and extend beyond May 31, 2028; and (iii) power producers may request the termination, subject to the SE’s approval.
Under this scheme, Pampa signed on CTLL, CTGEBA CCGTs (1,239 MW total gross capacity) and CTEB’s GTs that are part of the CCGT commissioned in February 2023 (567 MW gross capacity). The differential remuneration applies from March 1, 2023, until February 29, 2028.
Additional commissioning in PEPE IV and new expansion project in PEPE VI
On April 4, 2023, two 4.5 MW Vestas wind turbines were commissioned. Hence, the remaining eight wind turbines will be fully online by the second quarter of 2023 for 36 MW. On the other hand, on May 2023, ten 4.5 MW wind turbines were added for the PEPE VI’s expansion project, increasing the total capacity to 140 MW. Therefore, the commissioning is estimated as follows: 95 MW by Q3 24 and 45 MW by Q4 24. The wind farm will sell energy in the MAT ER under US$-PPA with private parties.
Permits to export gas
In May 2023, the SE approved additional export volumes to Chile on a firm basis for 0.9 million m3/day, to be delivered between the winter months of May and June 2023. Considering this permit, the total exportable volume for said period on a firm basis amounts to 2.2 million m3/day.
Termination of our working interest in Estación Fernández Oro block
On March 14, 2023, Pampa accepted YPF’s offer to terminate our 15% share in Estación Fernández Oro wells, effective January 1, 2023. During 2022, this block represented 0.07% of Pampa’s oil and gas production.
Tariff situation in TGS, Transener and Transba regulated business
Through PEN Executive Order No. 250/23 and ENARGAS Res. No. 186/23, TGS’s tariff scheme was incremented by 95%, applicable to March 2022 schedules and effective April 29, 2023. Moreover, dividends are allowed upon the Ministry of Economy’s approval.
Moreover, as of June 1, 2023, the ENRE started a new Comprehensive Tariff Review process for power transmission utility companies under national jurisdiction, including Transener and Transba (Res. No. 364/23).
| |
| Pampa Energía ● Earnings release Q1 23 ● 3 |
Board’s appointments
The shareholders’ meeting of Pampa, dated April 26, 2023, approved the tenure renewal of Gustavo Mariani and Ricardo Alejandro Torres as non-independent and Silvana Wasersztrom as independent board members. Hence, 50% of Pampa’s Board continues to be independent, and female directors hold 4 out of 10 positions.
Share capital reduction
The shareholders’ meeting of Pampa, dated April 26, 2023, approved canceling 20.1 million shares (or 0.8 million ADR) held in treasury by Pampa and its subsidiaries. As of today, said cancellation is pending authorization by the applicable authority[4].
| 1.4 | Redemption of the 2023 notes and issuance of Pampa’s second green bond |
On May 5, 2023, Pampa announced the redemption of the 2023 Notes at a 7.375% rate, originally due on July 21, 2023, and which outstanding amounted to US$92.9 million. The redemption will occur on June 8, 2023, at 100% of the FV. Moreover, Pampa will pay accrued and unpaid interest to (but not including) the redemption date and Additional Amounts, if any, as defined in the bond’s Indenture[5].
Moreover, seeking to finance the expansion project of PEPE VI, on May 4, 2023, Pampa issued its second Green Bond (Series XVII CB) for AR$5,980 million at a variable interest rate of Badlar plus 2%, maturing on May 2024. Said issuance gathered AR$852 million as payment in kind from the first Green Bond (Series VIII CB) and the remaining in cash. As our first Green Bond, this security was rated (BV1) by Fix Ratings, an affiliate of Fitch Ratings, and joined the SGS Bonds Panel of the ByMA.
[4] For further information, see Ownership Breakdown.
[5] For further information, click here.
| |
| Pampa Energía ● Earnings release Q1 23 ● 4 |
| 2.1 | Consolidated balance sheet |
| Figures in million | | As of 03.31.2023 | | As of 12.31.2022 |
| | AR$ | US$ FX 209,01 | | AR$ | US$ FX 177,16 |
| ASSETS | | | | | | |
| Property, plant and equipment | | 478,125 | 2,288 | | 383,464 | 2,165 |
| Intangible assets | | 27,048 | 129 | | 24,364 | 138 |
| Right-of-use assets | | 1,652 | 8 | | 1,521 | 9 |
| Deferred tax asset | | 9,185 | 44 | | 6,326 | 36 |
| Investments in joint ventures and associates | | 195,096 | 933 | | 159,833 | 902 |
| Financial assets at amortized cost | | 21,038 | 101 | | 18,000 | 102 |
| Financial assets at fair value through profit and loss | | 5,742 | 27 | | 4,867 | 27 |
| Other assets | | 103 | 0 | | 91 | 1 |
| Trade and other receivables | | 5,823 | 28 | | 3,415 | 19 |
| Total non-current assets | | 743,812 | 3,559 | | 601,881 | 3,397 |
| | | | | | | |
| Inventories | | 40,092 | 192 | | 30,724 | 173 |
| Financial assets at amortized cost | | 3,485 | 17 | | 1,357 | 8 |
| Financial assets at fair value through profit and loss | | 130,780 | 626 | | 103,856 | 586 |
| Derivative financial instruments | | 187 | 1 | | 161 | 1 |
| Trade and other receivables | | 100,683 | 482 | | 83,328 | 470 |
| Cash and cash equivalents | | 26,298 | 126 | | 18,757 | 106 |
| Total current assets | | 301,525 | 1,443 | | 238,183 | 1,344 |
| | | | | | | |
| Total assets | | 1,045,337 | 5,001 | | 840,064 | 4,742 |
| | | | | | | |
| EQUITY | | | | | | |
| Equity attributable to owners of the company | | 509,572 | 2,438 | | 403,463 | 2,277 |
| | | | | | | |
| Non-controlling interest | | 1,397 | 7 | | 1,157 | 7 |
| | | | | | | |
| Total equity | | 510,969 | 2,445 | | 404,620 | 2,284 |
| | | | | | | |
| LIABILITIES | | | | | | |
| Provisions | | 30,907 | 148 | | 26,062 | 147 |
| Income tax and presumed minimum income tax liabilities | | 35,719 | 171 | | 31,728 | 179 |
| Deferred tax liabilities | | 23,590 | 113 | | 19,854 | 112 |
| Defined benefit plans | | 6,650 | 32 | | 4,908 | 28 |
| Borrowings | | 281,374 | 1,346 | | 237,437 | 1,340 |
| Trade and other payables | | 5,813 | 28 | | 3,757 | 21 |
| Total non-current liabilities | | 384,053 | 1,837 | | 323,746 | 1,827 |
| | | | | | | |
| Provisions | | 909 | 4 | | 779 | 4 |
| Income tax liabilities | | 506 | 2 | | 927 | 5 |
| Taxes payables | | 6,026 | 29 | | 4,966 | 28 |
| Defined benefit plans | | 984 | 5 | | 1,021 | 6 |
| Salaries and social security payable | | 4,502 | 22 | | 5,627 | 32 |
| Derivative financial instruments | | 371 | 2 | | 318 | 2 |
| Borrowings | | 67,982 | 325 | | 48,329 | 273 |
| Trade and other payables | | 69,035 | 330 | | 49,731 | 281 |
| Total current liabilities | | 150,315 | 719 | | 111,698 | 630 |
| | | | | | | |
| Total liabilities | | 534,368 | 2,557 | | 435,444 | 2,458 |
| | | | | | | |
| Total liabilities and equity | | 1,045,337 | 5,001 | | 840,064 | 4,742 |
| |
| Pampa Energía ● Earnings release Q1 23 ● 5 |
| 2.2 | Consolidated income statement |
| | | First quarter |
| Figures in million | | 2023 | | 2022 |
| | | AR$ | US$ | | AR$ | US$ |
| Sales revenue | | 83,915 | 431 | | 44,011 | 412 |
| Local market sales | | 67,409 | 345 | | 33,709 | 316 |
| Foreign market sales | | 16,506 | 86 | | 10,302 | 96 |
| Cost of sales | | (50,538) | (265) | | (26,244) | (247) |
| | | | | | | |
| Gross profit | | 33,377 | 166 | | 17,767 | 165 |
| | | | | | | |
| Selling expenses | | (3,193) | (16) | | (2,063) | (20) |
| Administrative expenses | | (8,310) | (41) | | (3,529) | (32) |
| Exploration expenses | | (48) | - | | (8) | - |
| Other operating income | | 4,859 | 16 | | 1,300 | 11 |
| Other operating expenses | | (3,845) | (13) | | (1,668) | (15) |
| Impairment of financial assets | | (291) | - | | (127) | (1) |
| Rec. of imp. (impairment) of int. assets & inventories | | 411 | 2 | | (9) | - |
| Results for part. in joint businesses & associates | | 3,200 | 15 | | 2,682 | 25 |
| | | | | | | |
| Operating income | | 26,160 | 129 | | 14,345 | 133 |
| | | | | | | |
| Financial income | | 193 | 0 | | 246 | 3 |
| Financial costs | | (14,711) | (76) | | (4,195) | (39) |
| Other financial results | | 14,643 | 84 | | (289) | (2) |
| Financial results, net | | 125 | 8 | | (4,238) | (38) |
| | | | | | | |
| Profit before tax | | 26,285 | 137 | | 10,107 | 95 |
| | | | | | | |
| Income tax | | 643 | 4 | | 347 | 5 |
| | | | | | | |
| Net income for the period | | 26,928 | 141 | | 10,454 | 100 |
| Attributable to the owners of the Company | | 26,918 | 141 | | 10,304 | 99 |
| Attributable to the non-controlling interests | | 10 | - | | 150 | 1 |
| | | | | | | |
| Net income per share to shareholders | | 19.51 | 0.10 | | 7.46 | 0.07 |
| Net income per ADR to shareholders | | 487.65 | 2.56 | | 186.40 | 1.79 |
| | | | | | | |
| Average outstanding common shares1 | | 1,380 | | | 1,382 | |
| Outstanding shares by the end of period1 | | 1,380 | | | 1,382 | |
Note: 1 It nets shares from the Employee stock-based compensation plan, which as of March 31, 2023 and 2022 amounted to 3.9 million common shares.
| |
| Pampa Energía ● Earnings release Q1 23 ● 6 |
| 2.3 | Cash and financial borrowings |
As of March 31, 2023,
in US$ million | | Cash1 | | Financial debt | | Net debt |
| | Consolidated
in FS | Ownership adjusted | | Consolidated
in FS | Ownership adjusted | | Consolidated
in FS | Ownership adjusted |
| Power generation | | 599 | 596 | | 676 | 676 | | 76 | 79 |
| Petrochemicals | | - | - | | - | - | | - | - |
| Holding and others | | 0 | 0 | | - | - | | (0) | (0) |
| Oil and gas | | 168 | 168 | | 996 | 996 | | 827 | 827 |
| Total under IFRS/Restricted Group | | 768 | 765 | | 1,671 | 1,671 | | 903 | 906 |
| Affiliates at O/S2 | | 135 | 135 | | 307 | 307 | | 172 | 172 |
| Total with affiliates | | 904 | 901 | | 1,979 | 1,979 | | 1,075 | 1,078 |
Note: Financial debt includes accrued interest. 1 It includes cash and cash equivalents, financial assets at fair value with changing results, and investments at amortized cost. 2 Under IFRS, the affiliates CTBSA, Transener and TGS are not consolidated in Pampa.
Debt transactions
Pampa’s financial debt at the consolidated level under IFRS increased to US$1,671 million as of March 31, 2023, slightly higher than the end of 2022. However, the net debt remained similar, reaching US$903 million. The average interest rate for US$-bearing indebtedness was 8.5%, in which 81% of the Company’s gross debt is denominated, mainly at a fixed rate. US$-link indebtedness rate was 0%, and the AR$ average interest rate was 73.4%. Pampa’s consolidated financial debt averaged 3.4 years. The chart below shows the principal maturity profile, net of repurchases, in US$ million by the end of Q1 23:
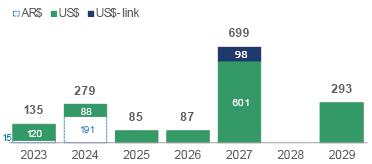 | Note: It only considers Pampa consolidated under IFRS; it does not include affiliates TGS, Transener, and CTBSA. |
During Q1 23, Pampa issued the Series XV CB for AR$18,264 million[6] at a Private Badlar plus 2% floating rate, maturing on July 2024 and re-opened the Series XIII US$-link CB, issuing US$48.2 million at a 0% rate, maturing on December 2027. Pampa took net import pre-financing facilities for US$1.6 million and paid bank debt for AR$10,065 million.
After the quarter’s closing, Pampa announced the redemption of the 2023 Notes outstanding for US$93 million. Moreover, aiming to finance PEPE VI’s expansion, Pampa issued its second Green Bond (Series XVII CB) for AR$5,980 million at a Private Badlar plus 2% floating rate maturing in one year, receiving AR$852 million of our first Green Bond (Series VIII CB), which is still outstanding AR$2,283 million[7]. Additionally, Pampa issued Series XVI CB in US$-MEP for US$55.7 million at a 4.99% rate maturing on November 2025, took short-term bank debt for AR$36,168 million and paid import pre-financing for US$5.6 million.
[6] Two issuances in 2023: January 11 (AR$10,379 million) and March 6 (AR$7,885 million)
[7] For further information, see section 1.4 of this Earnings release
| |
| Pampa Energía ● Earnings release Q1 23 ● 7 |
Regarding our affiliates, TGS took import pre-financing for US$0.3 million in Q1 23, while Transener took net financing for AR$535 million. After the quarter’s closing, CTEB issued Series IX US$-link CB for US$50 million at a 0% rate, maturing on April 2026. US$2.2 million where exchanged with Series I CB, with an outstanding of US$30 million. Additionally, TGS took net import pre-financing for US$0.3 million, while Transener settled net borrowings for AR$178 million.
As of this Earnings Release issuance, the Company complies with the covenants established in its debt agreements.
Summary of debt securities
Company
In million | Security | Maturity | Amount issued | Amount
net of repurchases | Coupon |
| In US$ | | | | | |
| Pampa | CB Series T at discount & fixed rate2 | 2023 | 500 | 93 | 7.375% |
| CB Series IX at par & fixed rate | 2026 | 293 | 179 | 9.5% |
| CB Series I at discount & fixed rate | 2027 | 750 | 597 | 7.5% |
| CB Series III at discount & fixed rate | 2029 | 300 | 293 | 9.125% |
| TGS1 | CB at discount at fixed rate | 2025 | 500 | 470 | 6.75% |
| | | | | | |
| In US$-link | | | | | |
| Pampa | CB Series XIII | 2027 | 98 | 98 | 0% |
| CTEB1 | CB Series I | 2023 | 30 | 30 | 4% |
| CB Series IV | 2024 | 96 | 96 | 0% |
| CB Series VI | 2025 | 84 | 84 | 0% |
| CB Series IX3 | 2026 | 50 | 50 | 0% |
| | | | | | |
| In US$-MEP | | | | | |
| Pampa | CB Series XVI3 | 2025 | 56 | 56 | 4.99% |
| | | | | | |
| In AR$ | | | | | |
| Pampa | CB Series VIII (Green Bond)4 | 2023 | 2,283 | 2,283 | Badlar Privada +2% |
| CB Series XI | 2024 | 21,655 | 21,655 | Badlar Privada +0% |
| CB Series XV | 2024 | 18,264 | 18,264 | Badlar Privada +2% |
| CB Series XVII (Green Bond)3 | 2024 | 5,980 | 5,980 | Badlar Privada +2% |
| CTEB1 | CB Series VII | 2023 | 1,754 | 1,754 | Badlar Privada +2.98% |
| CB Series VIII | 2024 | 4,236 | 4,236 | Badlar Privada +1% |
| | | | | | |
| In UVA | | | | | |
| CTEB1 | CB Series II | 2024 | 65 | 65 | 4% |
Note: 1 According to IFRS, affiliates are not consolidated in Pampa’s FS. 2 Full redemption was announced on May 5, 2023.
3 Issued post-Q1 23. 4 Includes partial cancelation (US$825 million) post-Q1 23.
| |
| Pampa Energía ● Earnings release Q1 23 ● 8 |
Credit rating
On March 2023, S&P downgraded from “CCC+” to “CCC-” Pampa and TGS’s global ratings, mainly due to the sovereign debt downgrade. However, Pampa’s stand-alone rating remained at “b-.” Moreover, on April 2023, FitchRatings upgraded Pampa’s long-term local rating from “AA” to “AA+” due to better predictability in the E&P’s operating flow, thanks to the Plan Gas.Ar’s extension and higher output.
The following table shows the Pampa Group’s ratings:
| Company | Agency | Rating |
| Global | Local |
| Pampa | S&P | b-1 | na |
| Moody's | Caa3 | na |
| FitchRatings2 | B- | AA+ (long-term)
A1+ (short-term) |
| TGS | S&P | CCC- | na |
| Moody's | Caa3 | na |
| Transener | FitchRatings2 | na | A+ (long-term) |
| CTEB | FitchRatings2 | na | A+ |
Note: 1 Stand-alone. 2 Local ratings issued by FIX SCR.
| |
| Pampa Energía ● Earnings release Q1 23 ● 9 |
| 3. | Analysis of the Q1 23 results |
Breakdown by segment
Figures in US$ million | Q1 23 | Q1 22 | Variation |
| Sales | Adjusted EBITDA | Net Income | Sales | Adjusted EBITDA | Net Income | Sales | Adjusted EBITDA | Net Income |
| | | | | | | | | | |
| Power generation | 173 | 108 | 96 | 166 | 121 | 97 | +4% | -11% | -1% |
| Oil and Gas | 154 | 62 | (1) | 137 | 56 | (4) | +12% | +10% | -75% |
| Petrochemicals | 125 | 7 | 5 | 126 | 6 | 5 | -1% | +16% | - |
| Holding and Others | 4 | 29 | 41 | 7 | 41 | 1 | -43% | -29% | NA |
| Eliminations | (25) | - | - | (24) | - | - | +4% | NA | NA |
| | | | | | | | | | |
| Total | 431 | 206 | 141 | 412 | 225 | 99 | +5% | -8% | +42% |
Note: Net income attributable to the Company’s shareholders.
| 3.1 | Reconciliation of consolidated adjusted EBITDA |
Reconciliation of adjusted EBITDA,
in US$ million | | First quarter |
| | 2023 | 2022 |
| Consolidated operating income | | 129 | 133 |
| Consolidated depreciations and amortizations | | 59 | 50 |
| EBITDA | | 188 | 183 |
| | | | |
| Adjustments from generation segment | | (2) | 2 |
| Deletion of equity income | | (2) | (22) |
| Deletion of gain from commercial interests | | (11) | (4) |
| Deletion of PPE activation in operating expenses | | 1 | 4 |
| Deletion of provision in hydros | | 4 | - |
| Greenwind's EBITDA adjusted by ownership | | - | 3 |
| CTBSA's EBITDA adjusted by ownership | | 7 | 21 |
| Adjustments from oil and gas segment | | (2) | (0) |
| Deletion of gain from commercial interests | | (2) | (0) |
| Adjustments from holding & others segment | | 22 | 39 |
| Deletion of equity income | | (13) | (3) |
| Deletion of rec. of intang. assets' impairment | | (2) | - |
| TGS's EBITDA adjusted by ownership | | 28 | 40 |
| Transener's EBITDA adjusted by ownership | | 10 | 2 |
| | | | |
| Consolidated adjusted EBITDA | | 206 | 225 |
| At our ownership | | 201 | 224 |
| |
| Pampa Energía ● Earnings release Q1 23 ● 10 |
| 3.2 | Analysis of the power generation segment |
Power generation segment, consolidated
Figures in US$ million | | First quarter |
| | 2023 | 2022 | ∆% |
| Sales revenue | | 173 | 166 | +4% |
| Local market sales | | 173 | 166 | +4% |
| Cost of sales | | (84) | (84) | - |
| | | | | |
| Gross profit | | 89 | 82 | +9% |
| | | | | |
| Selling expenses | | (1) | (1) | - |
| Administrative expenses | | (12) | (9) | +33% |
| Other operating income | | 11 | 4 | +175% |
| Other operating expenses | | (5) | (1) | NA |
| Results for participation in joint businesses | | 2 | 22 | -91% |
| | | | | |
| Operating income | | 84 | 97 | -13% |
| | | | | |
| Finance income | | - | 1 | -100% |
| Finance costs | | (25) | (13) | +92% |
| Other financial results | | 34 | 9 | +278% |
| Financial results, net | | 9 | (3) | NA |
| | | | | |
| Profit before tax | | 93 | 94 | -1% |
| | | | | |
| Income tax | | 3 | 4 | -25% |
| | | | | |
| Net income for the period | | 96 | 98 | -2% |
| Attributable to owners of the Company | | 96 | 97 | -1% |
| Attributable to non-controlling interests | | - | 1 | -100% |
| | | | | |
| Adjusted EBITDA | | 108 | 121 | -11% |
| Adjusted EBITDA at our share ownership | | 103 | 120 | -14% |
| | | | | |
| Increases in PPE | | 93 | 10 | NA |
| Depreciation and amortization | | 26 | 22 | +18% |
The 4% increase in power generation sales during Q1 23 is mainly explained by the acquisition of PEA by the end of 2022 and PEMC’s consolidation, in which Pampa holds full ownership. In addition to the increased power generation year-on-year, legacy energy prices improved in US$ terms, mainly due to the differential pricing for CCGTs under the spot segment[8] and, to a lower extent, the 25% increase in AR$ from February 2023. Legacy energy represented 69% of the 5,378 MW operated by Pampa[9], but represented just 33% of the Q1 23 segment’s sales. The capacity remuneration for our thermal legacy units was US$4.9 thousand/MW-month (+7% vs. Q1 22) and US$2.2 thousand/MW-month for hydros (similar to Q1 22).
Those effects were partially offset by incidents in CTLL’s GT05, CPB and CTG (all back on service during Q1 23) and the programmed overhaul in CTGEBA’s CCGT, selling lesser volumes under Energía Plus and gas assigned to CAMMESA. It is worth highlighting that fuel income only applies to PPAs under Energía Plus and CTGEBA’s new CCGT (SEE Res. No. 287/17), by which gas is procured from our E&P business. CAMMESA provides fuel for the remaining thermal units without earning sales or accruing costs.
In operating terms, Pampa’s operated power generation grew 18% vs. Q1 22, far exceeding the Argentine power grid’s 8% increase because of the high demand caused by the historical hot wave. The higher dispatch mainly came from the commissioning of CTEB’s CCGT (+523 GWh), greater gas availability in CPB and CTIW and fuel oil in CTPP (+255 GWh), PEA and PEPE IV’s incorporation (+107 GWh), higher dispatch in CTGEBA and CTLL (+75 GWh) and at Mendoza hydros as required by CAMMESA (+74 GWh). However, these increases were partially offset by programmed and forced outages mentioned before, plus the Bolivian gas depletion that impacted CTG (-128 GWh) and lower wind resources (-43 GWh).
[8] For further information, see “Amendment of differential remuneration for legacy/spot CCGTs” in section 1.1 of this Earnings release.
[9] Under IFRS, we do not consolidate CTEB (567 MW) in our financial statements since it is an affiliate. However, it is an asset operated by Pampa and its EBITDA is incorporated to our shareholding to the total adjusted EBITDA.
| |
| Pampa Energía ● Earnings release Q1 23 ● 11 |
The availability of Pampa’s operated units reached 93.0% in Q1 23 (-484 basis points vs. Q1 22’s 97.9%), mainly due to thermal outages mentioned above, the programmed maintenance in CTGEBA and CTLL’s CCGT, as well as the commissioning of tests run at CTEB’s CCGT. Therefore, a 91.0% thermal availability rate was registered in Q1 23 (-624 basis points vs. 97.2% from Q1 22).
Power generation's
key performance indicators | | 2023 | | 2022 | | Variation |
| Hydro | Wind | Thermal | Total | Hydro | Wind | Thermal | Total | Hydro | Wind | Thermal | Total |
| Installed capacity (MW) | | 938 | 342 | 4,097 | 5,378 | | 938 | 206 | 3,826 | 4,970 | | - | +66% | +7% | +8% |
| New capacity (%) | | - | 100% | 33% | 31% | | - | 100% | 43% | 37% | | - | - | -10% | -6% |
| Market share (%) | | 2.2% | 0.8% | 9.5% | 12.4% | | 2.2% | 0.5% | 8.9% | 11.6% | | -0% | +0% | +1% | +1% |
| | | | | | | | | | | | | | | | |
| First quarter | | | | | | | | | | | | | | | |
| Net generation (GWh) | | 447 | 292 | 5,021 | 5,760 | | 372 | 227 | 4,293 | 4,892 | | +20% | +28% | +17% | +18% |
| Volume sold (GWh) | | 448 | 292 | 5,299 | 6,038 | | 372 | 235 | 4,603 | 5,210 | | +20% | +24% | +15% | +16% |
| | | | | | | | | | | | | | | | |
| Average price (US$/MWh) | | 20 | 73 | 31 | 32 | | 24 | 69 | 42 | 42 | | -18% | +5% | -27% | -24% |
| Average gross margin (US$/MWh) | | 8 | 64 | 20 | 21 | | 11 | 57 | 29 | 29 | | -30% | +11% | -32% | -28% |
Note: Gross margin before amortization and depreciation. It includes CTEB, operated by Pampa (50% equity stake).
Without depreciation and amortizations, net operating costs decreased 6% vs. Q1 22 and 11% vs. Q4 22, mainly due to increased delays in collections from CAMMESA, leading to accruing higher commercial interests, and lower gas and power purchases, partially offset by wage increases that outpaced the AR$ devaluation, the provision for the end of Mendoza hydro’s concession in 2024, and higher consumption of spare materials from PEA, PEMC, and the thermal outages mentioned before.
Financial results from Q1 23 reached a net profit of US$9 million, while a net loss of US$3 million was recorded in Q1 22, mainly due to gains from the holding of financial instruments, partially offset by higher foreign exchange losses on receivables and increased financial interests due to higher stock of AR$-debt and the consolidation of PEMC.
Adjusted EBITDA from the power generation segment reached US$108 million in Q1 23 (-11% vs. Q1 22), mainly due to CTEB’s GT PPA maturity, out-of-service in certain thermal units and a rise of labor costs in US$, partially offset by the incorporation of PEA and PEMC, the commissioning of CTEB’s CCGT in February 2023, and a rise in legacy energy prices. In addition, adjusted EBITDA considers CTEB (CTBSA)’s 50% ownership (US$7 million in Q1 23 vs. US$21 million in Q1 22) and PEMC (Greenwind)’s 50% share capital for US$3 million in Q1 22[10]. Adjusted EBITDA excludes items such as the commercial interests for delayed collections, mainly charged to CAMMESA, contingency provision for the concession’s termination at Mendoza hydros and accrual of PPE’s expenses as operating costs.
Finally, without CTEB, capital investments registered US$93 million in Q1 23 (vs. US$10 million in Q1 22), mainly explained by the PEPE VI project to add a 140 MW wind farm by 2024. The following table shows the expansion projects in power generation:
| Project | MW | Marketing | Currency | Awarded price | | Estimated capex in
US$ million1 | Date of
commissioning |
Capacity per
MW-month | Variable
per MWh | Total
per MWh | | Budget | % Executed
@3/31/23 |
| Thermal | | | | | | | | | | |
Closing to CC Ensenada2 | 281 | PPA for 10 years | US$ | 23,962 | 10.5 | 43 | | 253 | 98% | 22-Feb-23 |
| Renewable | | | | | | | | | | |
| Pampa Energía IV3 | 45 | MAT ER | US$ | na | na | 58(4) | | 128 | 89% | Q2 2023 (est.) |
| Pampa Energía VI | 139.5 | MAT ER | US$ | na | na | 62(4) | | 265 | 0% | Q4 2024 (est.) |
Note: 1 Without value-added tax. 2 Capacity increased from 272 MW to 281 MW on April 26, 2023. 3 Total 81 MW: 18 MW commissioned on December 29, 2022, and 18 MW on February 25, 2023. Besides, 9 MW commissioned on April 4, 2023. 4 Estimated average.
[10] As of August 12, 2022, PEMC is consolidated into Pampa’s financial statements.
| |
| Pampa Energía ● Earnings release Q1 23 ● 12 |
| 3.3 | Analysis of the oil and gas segment |
Oil & gas segment, consolidated
Figures in US$ million | | First quarter |
| | 2023 | 2022 | ∆% |
| Sales revenue | | 154 | 137 | +12% |
| Local market sales | | 104 | 82 | +27% |
| Foreign market sales | | 50 | 55 | -9% |
| Cost of sales | | (92) | (71) | +30% |
| | | | | |
| Gross profit | | 62 | 66 | -6% |
| | | | | |
| Selling expenses | | (12) | (15) | -20% |
| Administrative expenses | | (18) | (14) | +29% |
| Other operating income | | 5 | 4 | +25% |
| Other operating expenses | | (5) | (12) | -58% |
| | | | | |
| Operating income | | 32 | 29 | +10% |
| | | | | |
| Finance income | | - | 1 | -100% |
| Finance costs | | (38) | (24) | +58% |
| Other financial results | | 5 | (12) | NA |
| Financial results, net | | (33) | (35) | -6% |
| | | | | |
| Loss before tax | | (1) | (6) | -83% |
| | | | | |
| Income tax | | - | 2 | -100% |
| | | | | |
| Net loss for the period | | (1) | (4) | -75% |
| | | | | |
| Adjusted EBITDA | | 62 | 56 | +10% |
| | | | | |
| Increases in PPE and right-of-use assets | | 88 | 63 | +40% |
| Depreciation and amortization | | 32 | 27 | +19% |
In Q1 23, sales from the oil and gas segment grew 12% vs. Q1 22, mainly due to the high gas export prices to Chile and gas prices for industries, in addition to an increased domestic oil demand, partially offset by lower volume of gas sold to Chile and industries due to the growing commitments under Plan Gas.Ar.
Oil and gas'
key performance indicators | | 2023 | | 2022 | | Variation |
| Oil | Gas | Total | Oil | Gas | Total | Oil | Gas | Total |
| First quarter | | | | | | | | | | | | |
| Volume | | | | | | | | | | | | |
| Production | | | | | | | | | | | | |
| In thousand m3/day | | 0.8 | 8,903 | | | 0.8 | 8,913 | | | +2% | -0% | +0% |
| In million cubic feet/day | | | 314 | | | | 315 | | |
| In thousand boe/day | | 5.2 | 52.4 | 57.6 | | 5.1 | 52.5 | 57.5 | |
| Sales | | | | | | | | | | | | |
| In thousand m3/day | | 0.9 | 8,968 | | | 0.8 | 8,979 | | | +14% | -0% | +1% |
| In million cubic feet/day | | | 317 | | | | 317 | | |
| In thousand boe/day | | 6.0 | 52.8 | 58.8 | | 5.2 | 52.8 | 58.1 | |
| | | | | | | | | | | | | |
| Average Price | | | | | | | | | | | | |
| In US$/bbl | | 67.7 | | | | 69.0 | | | | -2% | +11% | |
| In US$/MBTU | | | 4.0 | | | | 3.5 | | | |
Note: Net production in Argentina. Gas volume is standardized at 9,300 kilocalories (kCal).
| |
| Pampa Energía ● Earnings release Q1 23 ● 13 |
In operating terms, total production reached 57.6 kboe/day in Q1 23 (similar to Q1 22 but -7% vs. Q4 22). Gas production reached 8.9 million m3/day (similar to Q1 22 but -6% vs. Q4 22), explained by commercial reasons: lesser retail demand vs. commitment under Plan Gas.Ar, lower exports to Chile due to limited permits and soft deliveries to industries due to pipeline bottlenecks. Analyzing by block, El Mangrullo curtailed its production in response to the weak demand and recorded 5.7 million m3/day (-6% vs. Q1 22 and -16% vs. Q4 22), comprising 65% of our total gas output. Rincón del Mangrullo continues the lower activity and natural depletion (0.3 million m3/day, -33% vs. Q1 22 and -15% vs. Q4 22). Instead, due to shale activity, Sierra Chata reached 1.2 million m3/day (+69% vs. Q1 22 and +113% vs. Q4 22). Río Neuquén remained at 1.5 million m3/day production.
Our gas price in Q1 23 was US$4.0/MBTU (+11% vs. Q1 22 and similar to Q4 22), mainly driven by better export prices that are higher than the local market and, to a lower extent, a slight increase in the industrial segment.
In Q1 23, our gas deliveries were allocated as follows: 27% to CAMMESA, 27% procured to our thermal power units[11] and petchem plants, 21% to the industrial/spot market, 15% was exported, and 11% to the retail segment. On the other hand, in Q1 22, 30% of our gas deliveries were sold to the industrial/spot market, 30% exported, 28% was fired at our thermal and petrochemicals plants, 12% supplied the retail, and the rest was sold directly to CAMMESA.
Oil production reached 5.2 kbbl/day in Q1 23 (similar to Q1 22 but -10% vs. Q4 22 due to stock consumption) due to higher output at Los Blancos, Gobernador Ayala and Río Neuquén (+0.5 kbbl/day vs. Q1 22), partially offset by a drop of 0.3 kbbl/day at El Tordillo. Moreover, considering Q4 22 0.8 kbbl/day stock sold in Q1 23, 80% of the volume sold was destined for the local market in Q1 23 vs. 76% in Q1 22.
Our oil price in Q1 23 was similar to Q1 22, reaching US$67.7/barrel, mainly explained by the lower export prices offset by higher local demand.
By the end of Q1 23, we accounted for 812 productive wells vs. 895 as of the end of 2022.
Net operating costs in Q1 23, excluding depreciation, amortization and Plan Gas.Ar compensation grew 9% vs. Q1 22, mainly due to increased labor expenses in US$ terms, activity (treatment and maintenance), royalties, levies and taxes (linked to higher sales), in addition to oil stock consumption, partially offset by lower transportation cost related with lesser exported gas and, to a lower extent, higher days of sales outstanding from CAMMESA. As a result, the lifting cost reached US$7.1/boe produced in Q1 23 (+23% vs. Q1 22 and similar to Q4 22).
Financial results in Q1 23 recorded a net loss of US$33 million, an improvement of 6% vs. Q1 22, mainly because of the gains from holding financial securities, partially offset by the increased interests from the higher stock of AR$-debt and losses from devaluation over receivables.
Our oil and gas adjusted EBITDA amounted to US$62 million in Q1 23 (+10% vs. Q1 22), mainly explained by higher gas export prices and domestic oil demand, partially offset by lower gas retail deliveries vs. commitments under Plan Gas.Ar, lower volumes of gas exported and sold to industries due to pipeline bottlenecks, higher labor costs, and growing activity. In addition, the adjusted EBITDA of Q1 23 excludes commercial interests for late collection, mainly charged to CAMMESA.
Finally, in Q1 23, capital expenditures amounted to US$88 million (+40% vs. Q1 22), mainly driven by the shale gas wells drilling and completion campaign to comply with the growing commitments under Plan Gas.Ar.
[11] Energía Plus and SEE Res. No. 287/17.
| |
| Pampa Energía ● Earnings release Q1 23 ● 14 |
| 3.4 | Analysis of the petrochemicals segment |
Petrochemicals segment, consolidated
Figures in US$ million | | First quarter |
| | 2023 | 2022 | ∆% |
| Sales revenue | | 125 | 126 | -1% |
| Local market sales | | 89 | 85 | +5% |
| Foreign market sales | | 36 | 41 | -12% |
| Cost of sales | | (114) | (116) | -2% |
| | | | | |
| Gross profit | | 11 | 10 | +10% |
| | | | | |
| Selling expenses | | (3) | (4) | -25% |
| Administrative expenses | | (2) | (1) | +100% |
| | | | | |
| Operating income | | 6 | 5 | +20% |
| | | | | |
| Finance costs | | (1) | (1) | - |
| Other financial results | | - | 1 | -100% |
| Financial results, net | | (1) | - | NA |
| | | | | |
| Profit before tax | | 5 | 5 | - |
| | | | | |
| Income tax | | - | - | NA |
| | | | | |
| Net income for the period | | 5 | 5 | - |
| | | | | |
| Adjusted EBITDA | | 7 | 6 | +16% |
| | | | | |
| Increases in PPE | | 2 | - | NA |
| Depreciation and amortization | | 1 | 1 | - |
The petrochemicals segment’s adjusted EBITDA reached US$7 million in Q1 23 (+16% vs. Q1 22), mainly explained by the rise in styrene and polystyrene sales and lower cost of propane, offset by a drop in SBR and polystyrene exports, and increased labor costs. On the other hand, the adjusted EBITDA fell US$8 million quarter-on-quarter, mainly due to a drop in reforming sales due to lower raw gasoline availability and lower margin on gasoline exports.
Total volume sold grew 13% vs. Q1 22 to 103 thousand ton, mainly explained by higher reforming products. In Q1 22, 14 thousand ton of bases and gasoline were dispatched as toll processing, not volume sold. Moreover, styrene sales recovered after reduced production in January 2022. However, these effects were partially offset by lower SBR foreign demand.
Petrochemicals'
key performance indicators | | Products | | Total |
| | Styrene & polystyrene1 | SBR | Reforming & others | |
| First quarter | | | | | | |
| Volume sold Q1 23 (thousand ton) | | 29 | 9 | 66 | | 103 |
| Volume sold Q1 22 (thousand ton) | | 27 | 11 | 53 | | 91 |
| Variation Q1 23 vs. Q1 22 | | +4% | -20% | +24% | | +13% |
| | | | | | | |
| Average price Q1 23 (US$/ton) | | 1,857 | 1,938 | 846 | | 1,219 |
| Average price Q1 22 (US$/ton) | | 1,910 | 2,047 | 977 | | 1,385 |
| Variation Q1 23 vs. Q1 22 | | -3% | -5% | -13% | | -12% |
Note: 1 Includes Propylene.
In Q1 23, financial results reached a net loss of US$1 million, while in Q1 22, no financial results were recorded, explained by higher losses from holding financial securities.
Capital expenditures reached US$2 million in Q1 23, while in Q1 22, no capital expenditures were recorded.
| |
| Pampa Energía ● Earnings release Q1 23 ● 15 |
| 3.5 | Analysis of the holding and others segment |
Holding and others segment, consolidated
Figures in US$ million | | First quarter |
| | 2023 | 2022 | ∆% |
| Sales revenue | | 4 | 7 | -43% |
| Local market sales | | 4 | 7 | -43% |
| | | | | |
| Gross profit | | 4 | 7 | -43% |
| | | | | |
| Administrative expenses | | (9) | (8) | +13% |
| Other operating income | | - | 3 | -100% |
| Other operating expenses | | (3) | (2) | +50% |
| Impairment of financial assets | | - | (1) | -100% |
| Recovery from impairment of intangible assets | | 2 | - | NA |
| Results for participation in joint businesses | | 13 | 3 | NA |
| | | | | |
| Operating income | | 7 | 2 | +250% |
| | | | | |
| Finance income | | 2 | 3 | -33% |
| Finance costs | | (14) | (3) | NA |
| Other financial results | | 45 | - | NA |
| Financial results, net | | 33 | - | NA |
| | | | | |
| Profit before tax | | 40 | 2 | NA |
| | | | | |
| Income tax | | 1 | (1) | NA |
| | | | | |
| Net income for the period | | 41 | 1 | NA |
| | | | | |
| Adjusted EBITDA | | 29 | 41 | -29% |
| | | | | |
| Increases in PPE and intangible assets | | 2 | 1 | +100% |
| Depreciation and amortization | | - | - | NA |
The holding and others segment, without considering the affiliates’ equity income (Transener and TGS), posted an US$8 million operating loss, while in Q1 22, it was a US$1 million loss, mainly explained by lower accrued fees, higher labor costs and provision of contingencies, partially offset by lower third-party expenses.
In Q1 23, financial results reached a net gain of US$33 million, while in Q1 22, no financial results had been recorded, mainly due to FX difference gains over tax debt, partially offset by higher tax interests.
The adjusted EBITDA of our holding and others segment decreased by 29%, recording US$29 million in Q1 23. The adjusted EBITDA excludes the equity income from our participation in TGS and Transener. In turn, it adds the EBITDA adjusted by equity ownership in these businesses. Besides, it excludes the impairment of intangible assets in Q1 23.
In TGS, the EBITDA adjusted by our stake was US$28 million in Q1 23 vs. US$40 million in Q1 22. The decline was mainly due to lower international NGL prices and regulated income, whose tariff was increased after Q1 23[12], in addition to the higher labor expenses and an increase in the cost of gas in US$ used for thermal reduction replacement at Cerri (offset by lower consumption). However, these effects were partially offset by increased ethane price and higher midstream revenues due to growing activity at Vaca Muerta.
In Transener, the EBITDA adjusted by our stake recorded US$10 million in Q1 23 vs. US$2 million in Q1 22, mainly due to the tariff increase as of January 1, 2023 (155% Transener and 154% Transba).
[12] For further information, see ‘Tariff situation in TGS…’ of the section 1.3 of this Earnings release.
| |
| Pampa Energía ● Earnings release Q1 23 ● 16 |
| 3.6 | Analysis of the quarter, by subsidiary and segment |
Subsidiary
In US$ million | Q1 23 | | Q1 22 |
| % Pampa | Adjusted EBITDA | Net debt2 | Net income (loss)3 | | % Pampa | Adjusted EBITDA | Net debt2 | Net income (loss)3 |
| |
| Power generation segment | | | | | | | | | |
| Diamante | 61.0% | (1) | (0) | 0 | | 61.0% | 2 | (6) | 1 |
| Los Nihuiles | 52.0% | (0) | (0) | 0 | | 52.0% | 0 | (4) | 2 |
| VAR4 | 100.0% | 5 | 0 | 3 | | - | - | - | - |
| | | | | | | | | | |
| Greenwind5 | | 5 | 56 | 1 | | | 6 | 69 | 1 |
| Non-controlling stake adjustment | | - | - | - | | | (3) | (35) | (0) |
| Subtotal Greenwind adjusted by ownership | 100.0% | 5 | 56 | 1 | | 50.0% | 3 | 35 | 0 |
| | | | | | | | | | |
| CTBSA | | 13 | 297 | 5 | | | 43 | 188 | 43 |
| Non-controlling stake adjustment | | (7) | (148) | (2) | | | (21) | (94) | (22) |
| Subtotal CTBSA adjusted by ownership | 50.0% | 7 | 148 | 2 | | 50.0% | 21 | 94 | 22 |
| | | | | | | | | | |
| Pampa stand-alone, other companies, adjs. & deletions1 | | 92 | 20 | 88 | | | 95 | 158 | 72 |
| Subtotal power generation | | 108 | 225 | 96 | | | 121 | 277 | 97 |
| | | | | | | | | | |
| Oil & gas segment | | | | | | | | | |
| Pampa Energía | 100.0% | 62 | 827 | (1) | | 100.0% | 56 | 802 | (4) |
| Subtotal oil & gas | | 62 | 827 | (1) | | | 56 | 802 | (4) |
| | | | | | | | | | |
| Petrochemicals segment | | | | | | | | | |
| Pampa Energía | 100.0% | 7 | - | 5 | | 100.0% | 6 | - | 5 |
| Subtotal petrochemicals | | 7 | - | 5 | | | 6 | - | 5 |
| | | | | | | | | | |
| Holding & others segment | | | | | | | | | |
| Transener | | 38 | (3) | 21 | | | 9 | (14) | 1 |
| Non-controlling stake adjustment | | (28) | 2 | (15) | | | (7) | 10 | (1) |
| Subtotal Transener adjusted by ownership | 26.3% | 10 | (1) | 5 | | 26.3% | 2 | (4) | 0 |
| | | | | | | | | | |
| TGS | | 95 | 84 | 27 | | | 137 | 235 | 74 |
| Non-controlling stake adjustment | | (67) | (59) | (19) | | | (97) | (166) | (145) |
| Subtotal TGS adjusted by ownership | 29.1% | 28 | 24 | 8 | | 29.3% | 40 | 69 | (71) |
| | | | | | | | | | |
| Pampa stand-alone, other companies, adjs. & deletions1 | | (8) | (0) | 28 | | | (1) | (106) | 72 |
| Subtotal holding & others | | 29 | 23 | 41 | | | 41 | (41) | 1 |
| | | | | | | | | | |
| Deletions | | - | (172) | - | | | - | (194) | - |
| Total consolidated | | 206 | 903 | 141 | | | 225 | 845 | 99 |
| At our share ownership | | 201 | 1,075 | 141 | | | 224 | 1,039 | 99 |
Note: 1 The deletion corresponds to other companies, inter-companies or debt repurchases. 2 Net debt includes holding companies.
3 Attributable to the Company’s shareholders. 4 Acquired on December 16, 2022. 5 Consolidated in Pampa’s FS since August 12, 2022.
| |
| Pampa Energía ● Earnings release Q1 23 ● 17 |
| 4.1 | Power generation’s main operational KPIs |
Power generation's
key performance indicators | | Hydroelectric | | Wind | | Subtotal
hydro
+wind | Thermal | | Total |
| | HINISA | HIDISA | HPPL | | PEMC1 | PEPE2 | PEPE
3-42 | PEA3 | | CTLL | CTG | CTP | CPB | CTPP | CTIW | CTGEBA | Eco-
Energía | CTEB4 | Subtotal
thermal | |
| Installed capacity (MW) | | 265 | 388 | 285 | | 100 | 53 | 89 | 100 | | 1,280 | 780 | 361 | 30 | 620 | 100 | 100 | 1,253 | 14 | 839 | 4,097 | | 5,378 |
| New capacity (MW) | | - | - | - | | 100 | 53 | 89 | 100 | | 342 | 184 | 100 | - | - | 100 | 100 | 565 | 14 | 272 | 1,336 | | 1,678 |
| Market share | | 0.6% | 0.9% | 0.7% | | 0.2% | 0.1% | 0.2% | 0.2% | | 3.0% | 1.8% | 0.8% | 0.1% | 1.4% | 0.2% | 0.2% | 2.9% | 0.03% | 1.9% | 9.5% | | 12.4% |
| | | | | | | | | | | | | | | | | | | | | | | | |
| First quarter | | | | | | | | | | | | | | | | | | | | | | | |
| Net generation Q1 23 (GWh) | | 176 | 97 | 175 | | 83 | 49 | 79 | 80 | | 739 | 1,282 | 38 | 23 | 482 | 108 | 109 | 2,177 | 19 | 783 | 5,021 | | 5,760 |
| Market share | | 0.5% | 0.3% | 0.5% | | 0.2% | 0.1% | 0.2% | 0.21% | | 1.9% | 3.3% | 0.1% | 0.1% | 1.3% | 0.3% | 0.3% | 5.7% | 0.0% | 2.0% | 13.1% | | 15.0% |
| Sales Q1 23 (GWh) | | 176 | 97 | 175 | | 83 | 49 | 79 | 80 | | 740 | 1,282 | 154 | 23 | 482 | 108 | 109 | 2,322 | 37 | 783 | 5,299 | | 6,038 |
| | | | | | | | | | | | | | | | | | | | | | | | |
| Net generation Q1 22 (GWh) | | 117 | 81 | 174 | | 101 | 62 | 64 | - | | 599 | 1,266 | 166 | 20 | 295 | 81 | 68 | 2,118 | 18 | 260 | 4,293 | | 4,892 |
| Variation Q1 23 vs. Q1 22 | | +50% | +20% | +1% | | -18% | -21% | +24% | na | | +23% | +1% | -77% | +15% | +64% | +33% | +60% | +3% | +3% | na | +17% | | +18% |
| Sales Q1 22 (GWh) | | 117 | 81 | 174 | | 101 | 70 | 64 | - | | 607 | 1,266 | 225 | 20 | 295 | 81 | 68 | 2,347 | 40 | 260 | 4,603 | | 5,210 |
| | | | | | | | | | | | | | | | | | | | | | | | |
| Avg. price Q1 23 (US$/MWh) | | 16 | 34 | 16 | | 70 | 79 | 66 | 79 | | 41 | 20 | 75 | 25 | 20 | 92 | 72 | 33 | 37 | 25 | 31 | | 32 |
| Avg. price Q1 22 (US$/MWh) | | 23 | 40 | 18 | | 69 | 72 | 68 | na | | 42 | 21 | 42 | 32 | 34 | 116 | 108 | 35 | 38 | na | 42 | | 42 |
| Avg. gross margin Q1 23 (US$/MWh) | 7 | 11 | 7 | | 60 | 64 | 62 | 68 | | 30 | 17 | 33 | 7 | 8 | 72 | 54 | 20 | 14 | 16 | 20 | | 21 |
| Avg. gross margin Q1 22 (US$/MWh) | | 5 | 24 | 9 | | 59 | 54 | 58 | na | | 29 | 16 | 20 | 14 | 16 | 93 | 80 | 20 | 16 | na | 29 | | 29 |
Note: Gross margin before amortization and depreciation 1 Fully owned by Pampa since August 12, 2022. Before, it was operated by Pampa with a 50% of equity stake. 2 PEPE IV: 18 MW commissioned on December 29, 2022, 18 MW on February 25, 2023, and 9 MW on April 4, 2023. 3 Acquired on December 16, 2022. 4 Operated by Pampa (50% equity stake). 272 MW ST commissioned on February 22, 2023, increased to 281 MW from April 26, 2023.
| |
| Pampa Energía ● Earnings release Q1 23 ● 18 |
| 4.2 | Oil and gas production in the main areas |
| In kboe/day at ownership | | First quarter |
| 2023 | 2022 | Variation |
| Gas | | | | |
| El Mangrullo | | 33.8 | 36.2 | -6% |
| Río Neuquén | | 8.7 | 8.6 | +1% |
| Sierra Chata | | 7.1 | 4.2 | +69% |
| Rincón del Mangrullo1 | | 1.5 | 2.3 | -33% |
| Others | | 1.2 | 1.1 | +4% |
| Total gas at O/S | | 52.4 | 52.5 | -0% |
| | | | | |
| Oil | | | | |
| El Tordillo2 | | 2.4 | 2.7 | -13% |
| Gobernador Ayala | | 1.2 | 1.0 | +14% |
| Associated oil3 | | 1.0 | 0.9 | +8% |
| Others | | 0.6 | 0.4 | +52% |
| Total oil at O/S | | 5.2 | 5.1 | +2% |
| | | | | |
| Total | | 57.6 | 57.5 | +0% |
Note: Production in Argentina. 1 It does not include shale formation.
2 It includes La Tapera – Puesto Quiroga block. 3 From gas fields.
| Term | Definition |
| ADR/ADS | American Depositary Receipt |
| AR$ | Argentine Pesos |
| Bbl | Barrel |
| Boe | Barrels of oil equivalent |
| ByMA | Bolsas y Mercados Argentinos (Buenos Aires Stock Exchange) |
| CAMMESA | Compañía Administradora del Mercado Mayorista Eléctrico S.A.(Argentine Wholesale Electricity Market Clearing Company) |
| CB | Corporate Bonds |
| CCGT | Combined Cycle |
| CPB | Piedra Buena Thermal Power Plant |
| CTBSA | CT Barragán S.A. |
| CTEB | Ensenada Barragán Thermal Power Plant |
| CTG | Güemes Thermal Power Plant |
| CTGEBA | Genelba Thermal Power Plant |
| CTIW | Ingeniero White Thermal Power Plant |
| CTLL | Loma De La Lata Thermal Power Plant |
| CTP | Piquirenda Thermal Power Plant |
| CTPP | Parque Pilar Thermal Power Plant |
| E&P | Exploration and Production |
| EBITDA | Earnings before interest, tax, depreciation and amortization |
| EcoEnergía | EcoEnergía Co-Generation Power Plant |
| ENARGAS | Ente Nacional Regulador del Gas (National Gas Regulatory Entity) |
| Energía Plus | Energía Plus Program, SE Res. No. 1,281/06 |
| ENRE | Ente Nacional Regulador de la Electricidad (National Electricity Regulatory Entity) |
| |
| Pampa Energía ● Earnings release Q1 23 ● 19 |
| FS | Financial Statements |
| FV | Face value |
| FX | Nominal exchange rate |
| Greenwind | Greenwind S.A. |
| GT | Gas turbine |
| GWh | Gigawatt-hour |
| HIDISA | Diamante Hydro Power Plant |
| HINISA | Los Nihuiles Hydro Power Plant |
| HPPL | Pichi Picún Leufú Hydro Power Plant |
| IFRS | International Financial Reporting Standards |
| Kbbl/kboe | Thousands of barrels/thousands of barrels of oil equivalent |
| M3 | Cubic meters |
| MAT ER | Term Market from Renewable Energy Sources |
| MBTU | Million British Thermal Units |
| MW/MWh | Megawatt/Megawatt-hour |
| N.a. | Not applicable |
| NGL | Natural gas liquids |
| Pampa / The Company | Pampa Energía S.A. |
| Pampa Group | Pampa Energía S.A. and its subsidiaries |
| PEA | Arauco Wind Farm, stage 1 and 2 |
| PEMC | Ingeniero Mario Cebreiro Wind Farm |
| PEN | Poder Ejecutivo Nacional (National Executive Branch) |
| PEPE | Pampa Energía Wind Farm |
| Plan Gas.Ar | Re-assurance and Strengthening of the Federal Hydrocarbon Production through Self-Supply, Exports, Replacement of Imports and the Expansion of the Transportation System to All the Country’s Hydrocarbon Basins 2023 – 2028 Plan (Executive Order No. 730/22) and the Argentine Natural Gas Production Promotion Plan – 2020 – 2024 Supply and Demand Scheme (Emergency Executive Order No. 892/20 and supplementary provisions) |
| PPA | Power Purchase Agreement |
| PPE | Property, Plant and Equipment |
| Q1 23/Q1 22 | First quarter of 2023/First quarter of 2022 |
| Q4 22 | Fourth quarter of 2022 |
| Res. | Resolution/Resolutions |
| SE | Secretariat of Energy |
| SEE | Under Secretariat of Electric Energy (former Secretariat of Electric Energy) |
| ST | Steam turbine |
| TGS | Transportadora de Gas del Sur S.A. |
| Ton | Metric ton |
| Transba | Empresa de Transporte de Energía Eléctrica por Distribución Troncal de la Provincia de Buenos Aires Transba S.A. |
| Transener | Compañía de Transporte de Energía Eléctrica en Alta Tensión Transener S.A. |
| US$ | U.S. Dollars |
| YPF | Yacimientos Petrolíferos Fiscales S.A. |
| |
| Pampa Energía ● Earnings release Q1 23 ● 20 |
