Pampa Energía, an independent company with active participation in the Argentine electricity and gas value chain, announces the results for the quarter ended on March 31, 2024. |
Stock information 
Share capital
as of May 6, 2024
1,363.5 million common shares/
54.5 million ADS Market capitalization
AR$3,010 billion/
US$2,705 million Information about the videoconference Date and time
Wednesday May 8
10 AM Eastern Standard Time
11 AM Buenos Aires Time Access link
bit.ly/Pampa1Q2024VC For further information about Pampa Email
investor@pampa.com Website for investors
ri.pampa.com Argentina’s Securities and Exchange Commission
www.argentina.gob.ar/cnv Securities and
Exchange Commission
sec.gov | | Basis of presentation Pampa’s financial information adopts US$ as functional currency, converted into AR$ at transactional FX. However, Transener and TGS adjust their figures for inflation as of March 31, 2024, which are expressed in US$ at the period’s closing FX. The previously reported figures remain unchanged. Q1 24 main results[1] 7% year-on-year sales decrease, recording US$401 million[2] in Q1 24, explained by a drop in spot energy and petrochemical prices and lower gas exports and crude oil sales, partially offset by higher domestic gas sales due to better demand and the commissioning of GPNK. Operating performance highlighted by growing gas production: 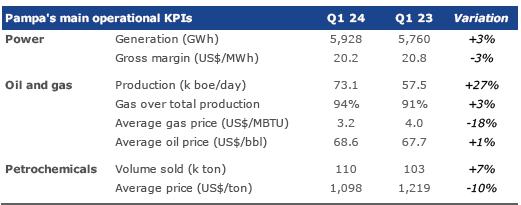
Adjusted EBITDA[3] reached US$189 million in Q1 24, an 8% decrease compared to Q1 23, mainly explained by a 22% reduction in power generation due to credit impairment on the January invoice to CAMMESA and a 22% reduction in holding and others, offset by improvements of 14% in oil and gas and 58% in petrochemicals. Net profit attributable to the Company’s shareholders of US$267 million, 89% higher than in Q1 23, mainly explained by higher non-cash credit on deferred income tax due to higher inflation than AR$ devaluation, also positively impacted our affiliates’ equity income. These effects were offset by the impairment of CAMMESA receivables and lower sales and devaluation profit from AR$ debt. Net debt increased to US$718 million, resulting in a net leverage ratio of 1.1x, mainly due to the substantial delays in the payment collections from CAMMESA.
|
[1] The information is based on FS prepared according to IFRS in force in Argentina.
[2] Sales from the affiliates CTBSA, Transener and TGS are excluded, shown as ‘Results for participation in joint businesses and associates.’
[3] Consolidated adjusted EBITDA represents the flows before financial items, income tax, depreciations and amortizations, extraordinary and non-cash income and expense, equity income, and includes affiliates’ EBITDA at our ownership. Further information on section 3.1.
| |
| Pampa Energía ● Earnings release Q1 24 ● 1 |
| 1.1 | Increased delays in the payments from CAMMESA and on-time changes in the settlement of certain past transactions |
Since February 2024, CAMMESA has slowed down payments for our electricity and natural gas sales. As of today, transactions from December 2023, January and February 2024 are pending payment, totaling over AR$140 billion, including accrued interests and Value-Added Tax. The days of sales outstanding have risen to more than 120 days, whereas CAMMESA’s procedures stipulate 42 days.
The Company has learned that the SE would instruct CAMMESA to make a one-time change over the settlement of the December 2023 and January 2024 transactions by paying the outstanding due with sovereign bonds at face value. In light of this development and considering the fair market value of said debt security, Pampa has recorded a US$34 million impairment loss over CAMMESA receivables.
Pampa is analyzing the possible course of action and the legal measures against this resolution. It is important to highlight that the inability of CAMMESA to pay could substantially impact the Company’s cash flow, operating results and financial position. Nonetheless, Pampa has enough solvency to meet its operational and financial obligations as of the FS issuance date.
| 1.2 | New permits to export natural gas |
In February 2024, the SE approved additional gas export volumes to Chile on a ToP basis for 0.6 million m3/day, valid from October to December 2024. In summary:
| Period | Volume in million m3/day |
| Authorized | Traded |
| January 2024 – April 2024 | 1.5 | 0.8 |
| May 2024 – September 2024 | 0.6 | n.a. |
| October – December 2024 | 0.6 | n.a. |
| 1.3 | Increases in regulated tariffs |
Update on the natural gas price
On March 26, 2024, the SE set new PIST values for natural gas, denominated in US$, applicable seasonally from April 2024 to residential users “N1” (high income) and productive sectors (businesses and industries) (Res. SE No. 41/24), resulting in[4]:
| · | April: Between US$2.79 and US$2.95 per MBTU, depending on the utility company |
| · | May – September (winter period): Between US$4.26 and 4.49 per MBTU, depending on the utility company |
| · | October – December (summer period): Between US$2.79 and 2.85 per MBTU, depending on the utility company. |
As of March 2024, the small businesses segment paid in AR$, equivalent to US$0.3 per MBTU and the residential N1 segment paid in AR$, equivalent to US$1 per MBTU.
The PIST increase will not be seasonal for residential users “N2” (low income/social tariff) and “N3” (middle income):
[4] PIST ranges depend on the area and type of user.
| |
| Pampa Energía ● Earnings release Q1 24 ● 2 |
| · | N2: From an equivalent of US$0.3 (denominated in AR$), to 0.74 and 0.78 per MBTU |
| · | N3: From an equivalent of US$0.4 (denominated in AR$), to 1.12 and 1.17 per MBTU. |
Furthermore, ENARGAS was instructed to issue tariff schemes reflecting monthly variations in the FX on PIST values (Res. ENARGAS No. 112 to 123/24).
This price adjustment increases the amount of Pampa’s sales to be charged directly to the utility distribution companies, decreasing the Plan Gas.Ar subsidy contribution.
Tariff increase granted to TGS
On March 27, 2024, ENARGAS authorized a 675% increase in natural gas transportation tariff schemes, effective between April 3, 2024 and any time before December 31, 2024, when a new Comprehensive Tariff Review is approved. Moreover, it includes a monthly adjustment formula (Res. No. 112/24). However, as of today, ENARGAS has not issued the corresponding May 2024 tariff schedules reflecting said monthly increase.
TGS commits to disburse and/or accrue in 2024 an AR$27,690 million investment plan, adjustable by the formula mentioned before, and focused on infrastructure works, as well as the system’s safety and reliability.
Changes in CAMMESA’s payment priority order
On March 15, 2024, Res. SE No. 34/24 modified the payment priority order of CAMMESA’s transactions, ranking senior providers of high-voltage power transmission and main distribution services over power generation companies.
Power transmission Comprehensive Tariff Review
On April 15, 2024, the ENRE, through Res. No. 223/24 approved the 2024 power transmission tariff review program. The companies involved, including Transener and Transba, must submit their proposals before July 31, 2024, and the ENRE must approve the new tariff schedules before December 31, 2024. The approved proposals will be in force for five years from January 1, 2025.
Board’s appointments
The shareholders’ meeting of Pampa, dated April 29, 2024, approved the tenure renewal of Marcelo Mindlin, Damián Mindlin and María Carolina Sigwald as executive members, Mauricio Penta as an executive alternate member and Clarisa Vittone as independent alternate member. Furthermore, it appointed Julia Sofía Pomares in replacement of Darío Epstein, and Lucas Sebastián Amado in replacement of María Renata Scafati as independent members. Finally, María Vázquez and Veronica Cheja were appointed in replacement of Diana Mondino and Emilse Juárez, respectively, as independent alternate members.
| |
| Pampa Energía ● Earnings release Q1 24 ● 3 |
Arbitration with POSA
On April 3, 2024, the International Chamber of Commerce Court notified the Final Award to the international arbitration brought by POSA against Pampa. In said award, all POSA’s claims were dismissed, except for ordering Pampa to pay 33.60% of the income received and to be obtained under the Leasing Contract with TGS in Río Neuquén block. Likewise, the Court grants Pampa’s counterclaim. The awarded amount, net of Pampa’s awarded counterclaim, was US$25 million plus interests. Having provisioned US$9 million before, US$16 million was accrued in Q1 24.
However, on April 10, 2024, Pampa filed a partial annulment appeal against the Final Award. Consequently, the payment was halted until further ruling.
| |
| Pampa Energía ● Earnings release Q1 24 ● 4 |
| 2.1 | Consolidated balance sheet |
| Figures in million | | As of 03.31.2024 | | As of 12.31.2023 |
| | AR$ | US$ FX 858 | | AR$ | US$ FX 808.45 |
| ASSETS | | | | | | |
| Property, plant and equipment | | 2,218,134 | 2,585 | | 2,056,974 | 2,544 |
| Intangible assets | | 82,049 | 96 | | 77,898 | 96 |
| Right-of-use assets | | 22,319 | 26 | | 17,259 | 21 |
| Deferred tax asset | | 13,015 | 15 | | 2 | 0 |
| Investments in joint ventures and associates | | 744,633 | 868 | | 542,978 | 672 |
| Financial assets at fair value through profit and loss | | 29,758 | 35 | | 28,040 | 35 |
| Other assets | | 353 | 0 | | 349 | 0 |
| Trade and other receivables | | 17,136 | 20 | | 14,524 | 18 |
| Total non-current assets | | 3,127,397 | 3,645 | | 2,738,024 | 3,387 |
| | | | | | | |
| Inventories | | 188,184 | 219 | | 166,023 | 205 |
| Financial assets at amortized cost | | 89,312 | 104 | | 84,749 | 105 |
| Financial assets at fair value through profit and loss | | 464,380 | 541 | | 451,883 | 559 |
| Derivative financial instruments | | 265 | 0 | | 250 | 0 |
| Trade and other receivables | | 428,589 | 500 | | 238,294 | 295 |
| Cash and cash equivalents | | 171,577 | 200 | | 137,973 | 171 |
| Total current assets | | 1,342,307 | 1,564 | | 1,079,172 | 1,335 |
| | | | | | | |
| Total assets | | 4,469,704 | 5,209 | | 3,817,196 | 4,722 |
| | | | | | | |
| EQUITY | | | | | | |
| Equity attributable to owners of the company | | 2,437,711 | 2,841 | | 1,943,736 | 2,404 |
| | | | | | | |
| Total equity | | 2,445,850 | 2,851 | | 1,950,696 | 2,413 |
| | | | | | | |
| LIABILITIES | | | | | | |
| Provisions | | 150,318 | 175 | | 119,863 | 148 |
| Income tax and presumed minimum income tax liabilities | | 101,955 | 119 | | 44,614 | 55 |
| Deferred tax liabilities | | 90,868 | 106 | | 240,686 | 298 |
| Defined benefit plans | | 19,173 | 22 | | 13,172 | 16 |
| Borrowings | | 1,110,787 | 1,295 | | 989,182 | 1,224 |
| Trade and other payables | | 40,313 | 47 | | 37,301 | 46 |
| Total non-current liabilities | | 1,513,414 | 1,764 | | 1,444,818 | 1,787 |
| | | | | | | |
| Provisions | | 6,186 | 7 | | 4,649 | 6 |
| Income tax liabilities | | 14,009 | 16 | | 14,026 | 17 |
| Taxes payables | | 21,848 | 25 | | 11,427 | 14 |
| Defined benefit plans | | 2,624 | 3 | | 2,695 | 3 |
| Salaries and social security payable | | 13,573 | 16 | | 15,537 | 19 |
| Derivative financial instruments | | 110 | 0 | | 191 | 0 |
| Borrowings | | 230,254 | 268 | | 181,357 | 224 |
| Trade and other payables | | 221,836 | 259 | | 191,800 | 237 |
| Total current liabilities | | 510,440 | 595 | | 421,682 | 522 |
| | | | | | | |
| Total liabilities | | 2,023,854 | 2,359 | | 1,866,500 | 2,309 |
| | | | | | | |
| Total liabilities and equity | | 4,469,704 | 5,209 | | 3,817,196 | 4,722 |
| |
| Pampa Energía ● Earnings release Q1 24 ● 5 |
| 2.2 | Consolidated income statement |
| | | First quarter |
| Figures in million | | 2024 | | 2023 |
| | | AR$ | US$ | | AR$ | US$ |
| Sales revenue | | 337,376 | 401 | | 83,915 | 431 |
| Domestic sales | | 274,579 | 326 | | 67,409 | 345 |
| Foreign market sales | | 62,797 | 75 | | 16,506 | 86 |
| Cost of sales | | (215,183) | (258) | | (50,538) | (265) |
| | | | | | | |
| Gross profit | | 122,193 | 143 | | 33,377 | 166 |
| | | | | | | |
| Selling expenses | | (13,580) | (16) | | (3,193) | (16) |
| Administrative expenses | | (34,238) | (41) | | (8,521) | (41) |
| Exploration expenses | | (82) | - | | (48) | - |
| Other operating income | | 28,992 | 35 | | 4,859 | 23 |
| Other operating expenses | | (26,385) | (31) | | (3,845) | (20) |
| Impairment of financial assets | | (29,830) | (34) | | (80) | - |
| Recovery/(accrual) of impairment on int. assets & inventories | | (32) | - | | 411 | 2 |
| Results for part. in joint businesses & associates | | 51,416 | 61 | | 3,200 | 15 |
| Income from the sale of associates | | 1,458 | 2 | | - | - |
| | | | | | | |
| Operating income | | 99,912 | 119 | | 26,160 | 129 |
| | | | | | | |
| Financial income | | 1,347 | 2 | | 193 | - |
| Financial costs | | (43,955) | (53) | | (14,711) | (76) |
| Other financial results | | 43,805 | 52 | | 14,643 | 84 |
| Financial results, net | | 1,197 | 1 | | 125 | 8 |
| | | | | | | |
| Profit before tax | | 101,109 | 120 | | 26,285 | 137 |
| | | | | | | |
| Income tax | | 122,687 | 148 | | 643 | 4 |
| | | | | | | |
| Net income for the period | | 223,796 | 268 | | 26,928 | 141 |
| Attributable to the owners of the Company | | 223,099 | 267 | | 26,918 | 141 |
| Attributable to the non-controlling int. | | 697 | 1 | | 10 | - |
| | | | | | | |
| Net income per share to shareholders | | 164.0 | 0.2 | | 19.5 | 0.1 |
| Net income per ADR to shareholders | | 4,101.1 | 4.9 | | 487.6 | 2.6 |
| | | | | | | |
| Average outstanding common shares1 | | 1,360 | | | 1,380 | |
| Outstanding shares by the end of period1 | | 1,360 | | | 1,380 | |
Note: 1 It considers the Employee stock-based compensation plan shares, which amounted to 3.9 million common shares as of March 31, 2023 and 2024.
| |
| Pampa Energía ● Earnings release Q1 24 ● 6 |
| 2.3 | Cash and financial borrowings |
As of March 31, 2024,
in US$ million | | Cash1 | | Financial debt | | Net debt |
| | Consolidated
in FS | Ownership adjusted | | Consolidated
in FS | Ownership adjusted | | Consolidated
in FS | Ownership adjusted |
| Power generation | | 816 | 815 | | 578 | 578 | | (238) | (237) |
| Petrochemicals | | - | - | | - | - | | - | - |
| Holding and others | | 0 | 0 | | - | - | | (0) | (0) |
| Oil and gas | | 29 | 28 | | 985 | 985 | | 956 | 956 |
| Total under IFRS/Restricted Group | | 845 | 844 | | 1,563 | 1,563 | | 718 | 719 |
| Affiliates at O/S2 | | 165 | 165 | | 277 | 277 | | 112 | 112 |
| Total with affiliates | | 1,010 | 1,009 | | 1,840 | 1,840 | | 830 | 831 |
Note: Financial debt includes accrued interest. 1 It includes cash and cash equivalents, financial assets at fair value with changing results, and investments at amortized cost. 2 Under IFRS, the affiliates CTBSA, Transener and TGS are not consolidated in Pampa.
Debt transactions
As of March 31, 2024, Pampa’s financial debt at the consolidated level under IFRS amounted to US$1,563 million, slightly higher than the end of 2023, mainly explained by the increased delays in CAMMESA’s payments, which rose from 73 to 89 days. Debt issuances were carried out to manage the increased working capital, partially offset by debt repayments. In this sense, net debt amounted to US$718 million, 17% higher than December 2023 but 21% lower year-on-year. The table below shows the gross debt principal breakdown:
| Currency | Type of issuance | Amount in million US$ | Legislation | % over total gross debt | Avg coupon |
| US$ | US$1 | 1,092 | Foreign | 73% | 8.4%, primarily fixed |
| US$ Cable | 105 | Argentine | 7% | 11.6% |
| US$ MEP | 128 | Argentine | 9% | 5% |
| AR$ | AR$ | 73 | Argentine | 5% | 89.5%, variable |
| US$-link | 98 | Argentine | 7% | 0% |
The financial debt had an average life of 2.8 years. The chart below shows the principal maturity profile, net of repurchases, in US$ million by the end of Q1 24:
| |
| Pampa Energía ● Earnings release Q1 24 ● 7 |
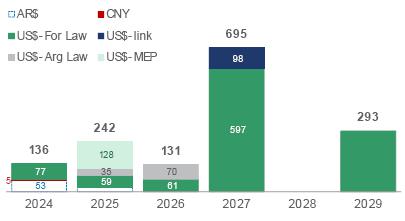 | Note: The chart only considers Pampa consolidated under IFRS. It does not include affiliates TGS, Transener, and CTBSA. |
During Q1 24, Pampa issued the Series 20 CB for US$55.2 million under Argentine law at a 6% rate maturing in March 2026. Moreover, Pampa paid net import financing for US$4 million, short-term bank borrowings for AR$900 million and took bank borrowing for US$50 million. After the quarter’s closing, Pampa borrowed from banks for US$40 million and paid net short-term bank borrowings for AR$25.5 billion and US$5 million in import financing.
Regarding our affiliates, in Q1 24, TGS paid net import financing for US$4 million and short-term bank borrowings for US$18 million. In contrast, Transener paid borrowings for AR$83 million. CTEB paid Series 8 CB for AR$4,236 million. After the quarter’s closing, TGS took import financing for US$2 million, Transener settled borrowings for AR$56 million and CTEB paid short-term bank debt for AR$27,066.
As of today, the Company complies with the covenants established in its debt agreements.
| |
| Pampa Energía ● Earnings release Q1 24 ● 8 |
Summary of debt securities
Company
In million | Security | Maturity | Amount issued | Amount
net of repurchases | Coupon |
| In US$-Foreign Law | | | | | |
| Pampa | CB Series 9 at par & fixed rate | 2026 | 293 | 179 | 9.5% |
| CB Series 1 at discount & fixed rate | 2027 | 750 | 597 | 7.5% |
| CB Series 3 at discount & fixed rate | 2029 | 300 | 293 | 9.125% |
| TGS1 | CB at discount at fixed rate | 2025 | 500 | 470 | 6.75% |
| | | | | | |
| In US$-Argentine Law | | | | | |
| Pampa | CB Series 20 | 2026 | 55.2 | 55.2 | 6.00% |
| | | | | | |
| In US$-link | | | | | |
| Pampa | CB Series 13 | 2027 | 98 | 98 | 0% |
| CTEB1 | CB Series 4 | 2024 | 96 | 96 | 0% |
| CB Series 6 | 2025 | 84 | 84 | 0% |
| CB Series 9 | 2026 | 50 | 50 | 0% |
| | | | | | |
| In US$-MEP | | | | | |
| Pampa | CB Series 16 | 2025 | 55.7 | 55.7 | 4.99% |
| CB Series 18 | 2025 | 72.1 | 72.1 | 5.00% |
| In AR$ | | | | | |
| Pampa | CB Series 15 | 2024 | 18,264 | 18,264 | Badlar Privada +2% |
| CB Series 19 | 2025 | 17,131 | 17,131 | Badlar Privada -1% |
Notes: 1 According to IFRS, affiliates are not consolidated in Pampa’s FS.
| |
| Pampa Energía ● Earnings release Q1 24 ● 9 |
Credit ratings
In April 2024, S&P upgraded CTEB’s local scale rating from “A+” to “AA-” due to its low operational risk and its co-controlling companies’ operational robustness, in addition to a solid debt structure. Pampa holds 50% equity stake in CTBSA, a company whose only asset is CTEB. Moreover, due to the sovereign debt upgrade, S&P moved from “CCC-” to “CCC” Pampa and TGS’s global ratings. The table below shows the risk ratings for Pampa and its subsidiaries:
| Company | Agency | Rating |
| Global | Local |
| Pampa | S&P | b-1 | na |
| Moody's | Caa3 | na |
| FitchRatings2 | B- | AA+ (long-term)
A1+ (short-term) |
| TGS | S&P | CCC | na |
| Moody's | Caa3 | na |
| Transener | FitchRatings2 | na | A+ (long-term) |
| CTEB | FitchRatings2 | na | AA- |
Note: 1 Stand-alone. 2 Local ratings issued by FIX SCR.
| |
| Pampa Energía ● Earnings release Q1 24 ● 10 |
| 3. | Analysis of the Q1 24 results |
Breakdown by segment
Figures in US$ million | Q1 24 | Q1 23 | Variation |
| Sales | Adjusted EBITDA | Net Income | Sales | Adjusted EBITDA | Net Income | Sales | Adjusted EBITDA | Net Income |
| | | | | | | | | | |
| Power generation | 154 | 85 | 197 | 173 | 108 | 96 | -11% | -22% | +105% |
| Oil and Gas | 150 | 70 | 48 | 154 | 62 | (1) | -3% | +14% | NA |
| Petrochemicals | 120 | 11 | 11 | 125 | 7 | 5 | -4% | +58% | +120% |
| Holding and Others | 3 | 23 | 11 | 4 | 29 | 41 | -25% | -22% | -73% |
| Eliminations | (26) | - | - | (25) | - | - | +4% | NA | NA |
| | | | | | | | | | |
| Total | 401 | 189 | 267 | 431 | 206 | 141 | -7% | -8% | +89% |
Note: Net income attributable to the Company’s shareholders.
| 3.1 | Reconciliation of consolidated adjusted EBITDA |
Reconciliation of adjusted EBITDA,
in US$ million | | First quarter |
| | 2024 | 2023 |
| Consolidated operating income | | 119 | 129 |
| Consolidated depreciations and amortizations | | 68 | 59 |
| EBITDA | | 187 | 188 |
| | | | |
| Adjustments from generation segment | | 1 | (2) |
| Deletion of equity income | | (21) | (2) |
| Deletion of gain from commercial interests | | (13) | (11) |
| Deletion of CAMMESA's debt impairment | | 17 | - |
| Deletion of PPE activation in operating expenses | | 1 | 1 |
| Deletion of provision in hydros | | 1 | 4 |
| CTBSA's EBITDA adjusted by ownership | | 16 | 7 |
| Adjustments from oil and gas segment | | (6) | (2) |
| Deletion of gain from commercial interests | | (6) | (2) |
| Adjustments from holding & others segment | | 7 | 22 |
| Deletion of equity income | | (40) | (13) |
| Deletion of gain from commercial interests | | (0) | (0) |
| Deletion of contigencies provision | | 16 | - |
| Deletion of intang. assets' impairment/(recovery) | | - | (2) |
| Deletion of the sale of associates | | (2) | - |
| TGS's EBITDA adjusted by ownership | | 27 | 28 |
| Transener's EBITDA adjusted by ownership | | 6 | 10 |
| | | | |
| Consolidated adjusted EBITDA | | 189 | 206 |
| At our ownership | | 185 | 202 |
| |
| Pampa Energía ● Earnings release Q1 24 ● 11 |
| 3.2 | Analysis of the power generation segment |
Power generation segment, consolidated
Figures in US$ million | | First quarter |
| | 2024 | 2023 | ∆% |
| Sales revenue | | 154 | 173 | -11% |
| Domestic sales | | 154 | 173 | -11% |
| Cost of sales | | (77) | (84) | -8% |
| | | | | |
| Gross profit | | 77 | 89 | -13% |
| | | | | |
| Selling expenses | | (1) | (1) | - |
| Administrative expenses | | (13) | (12) | +8% |
| Other operating income | | 17 | 18 | -6% |
| Other operating expenses | | (3) | (12) | -75% |
| Impairment of financial assets | | (34) | - | NA |
| Results for participation in joint businesses | | 21 | 2 | NA |
| | | | | |
| Operating income | | 64 | 84 | -24% |
| | | | | |
| Finance income | | 1 | - | NA |
| Finance costs | | (17) | (25) | -32% |
| Other financial results | | 53 | 34 | +56% |
| Financial results, net | | 37 | 9 | NA |
| | | | | |
| Profit before tax | | 101 | 93 | +9% |
| | | | | |
| Income tax | | 97 | 3 | NA |
| | | | | |
| Net income for the period | | 198 | 96 | +106% |
| Attributable to owners of the Company | | 197 | 96 | +105% |
| Attributable to non-controlling interests | | 1 | - | NA |
| | | | | |
| Adjusted EBITDA | | 85 | 108 | -22% |
| Adjusted EBITDA at our share ownership | | 81 | 104 | -22% |
| | | | | |
| Increases in PPE | | 24 | 93 | -74% |
| Depreciation and amortization | | 20 | 26 | -23% |
Power generation sales during Q1 24 recorded a decrease of 11% in comparison with Q1 23, mainly explained by lower spot/legacy energy sales, where the sharp AR$ devaluation in December 2023 affected its prices, partially offset by the 74% increase granted from February 2024. Although legacy energy represents 69% of the 5,332 MW operated by Pampa[5], in Q1 24, it only comprised 31% of the segment’s sales. The decrease caused by the FX jump was particularly visible in the capacity remuneration: the thermal conventional units (GT and ST) were priced at US$3.5 thousand per MW-month (-23% vs. Q1 23 and -4% vs. Q4 23), US$1.6 thousand per MW-month for hydro (-25% vs. Q1 23 and -17% vs. Q4 23), and US$4.5 thousand per MW-month for CCGTs (-30% year-on-year and -1% vs. Q4 23). Only CCGTs benefit from the differential income in US$ (Res. No. 59/2023).
In addition to PEMC’s divestment in Q3 23, sales under contracts were affected by the CTLL TG05’s outage (resumed service in late January), lower dispatch with fuel oil and lower Energía Plus prices. The commissioning of PEPE IV partially offset these effects. Compared to Q4 23, sales increased by 9% due to higher thermal demand after El Niño affected our dispatch through increased water levels and mild weather conditions.
[5] Under IFRS the results of the affiliated CTEB (567 MW) are not consolidated in the FS. However, it is an asset co-operated by Pampa, and its EBITDA is incorporated at our ownership in the adjusted EBITDA.
| |
| Pampa Energía ● Earnings release Q1 24 ● 12 |
In operating terms, Pampa’s operated power generation increased by 3% vs. Q1 23, in line with the 2% increase in the Argentine power grid. This increase is mainly explained by the commissioning of CTEB’s CCGT in February 2023 (+467 GWh), higher water and irrigation in HINISA and HIDISA due to El Niño effect (+247 GWh), higher dispatch in CTG, CTP and CTGEBA in response to the increased demand (+193 GWh), in addition to the commissioning of PEPE IV (+52 GWh). These increases were partially offset by lower dispatch in CPB, CTPP and CTIW (-516 GWh), CTLL’s outage mentioned before (-162 GWh), and the divestment of PEMC (-83 GWh).
The availability of Pampa’s operated units reached 96.2% in Q1 24, a 353-basis points improvement vs. Q1 23’s 92.6%, mainly due to CTLL, CTG and CPB’s outages in Q1 23. Therefore, a 95.2% thermal availability rate was registered in Q1 24, 470 basis points more than 90.5% from Q1 23.
Power generation's
key performance indicators | | 2024 | | 2023 | | Variation |
| Hydro | Wind | Thermal | Total | Hydro | Wind | Thermal | Total | Hydro | Wind | Thermal | Total |
| Installed capacity (MW) | | 938 | 287 | 4,107 | 5,332 | | 938 | 342 | 4,097 | 5,378 | | - | -16% | +0% | -1% |
| New capacity (%) | | - | 100% | 33% | 31% | | - | 100% | 33% | 31% | | - | - | +0% | -1% |
| Market share (%) | | 2.1% | 0.7% | 9.4% | 12.2% | | 2.2% | 0.8% | 9.5% | 12.4% | | -0% | -0% | -0% | -0% |
| | | | | | | | | | | | | | | | |
| First quarter | | | | | | | | | | | | | | | |
| Net generation (GWh) | | 683 | 244 | 5,002 | 5,928 | | 447 | 292 | 5,021 | 5,760 | | +53% | -16% | -0% | +3% |
| Volume sold (GWh) | | 683 | 246 | 5,215 | 6,144 | | 448 | 292 | 5,299 | 6,038 | | +52% | -16% | -2% | +2% |
| | | | | | | | | | | | | | | | |
| Average price (US$/MWh) | | 11 | 72 | 31 | 31 | | 20 | 73 | 31 | 32 | | -44% | -2% | +2% | -4% |
| Average gross margin (US$/MWh) | | 3 | 64 | 20 | 20 | | 8 | 64 | 20 | 21 | | -60% | +0% | +5% | -3% |
Note: Gross margin before amortization and depreciation. It includes CTEB, operated by Pampa (co-operated by Pampa, 50% equity stake). PEMC was de-consolidated in August 2023.
Without depreciation and amortizations, net operating costs decreased to US$57 million, 12% lower than Q1 23, mainly explained by lower labor, maintenance and power and gas transportation costs in AR$, in addition to higher interests from CAMMESA, due to increase in rate and delays. These effects were partially offset by higher insurance policies and contractors’ costs. Compared to Q4 23, operating costs rose 19%, due to lower electricity purchases to cover contracts in Q4 23 and CAMMESA’s payments were slower.
To reflect the on-time changes in the settlement of CAMMESA’s past transactions described before, we recorded a US$34 million impairment over trade receivables in Q1 24, of which US$17 million corresponds to the January 2024 transaction invoiced to CAMMESA.
Financial results from Q1 24 reached a net profit of US$38 million, higher than the US$9 million profit recorded in Q1 23, mainly due to gains from holding financial instruments and lower financial interests due to the repayment of AR$-denominated CBs.
Adjusted EBITDA from the power generation segment reached US$85 million, a 22% decrease year-on-year, mainly due to payment haircut on CAMMESA’s January 2024 invoice described above, lower sales associated with the reduction of spot energy prices and, to a lesser extent, Energía Plus prices, in addition to CTLL TG05’s outage and PEMC’s divestment. These effects were partially offset by lower operating expenditures, higher gas-fired power dispatch and the commissioning of PEPE IV. Adjusted EBITDA considers CTEB’s 50% ownership, which accrued US$16 million in Q1 24 vs. US$7 million in Q1 23, explained by the CCGT’s PPA. It excludes commercial interests for delayed collections, accrual of PPE’s expenses as operating expenditures, contingency provisions for the concession’s termination at Mendoza hydros and the impairment on CAMMESA’s December 2023 invoice for US$17 million.
Finally, without CTEB, capital expenditures registered US$24 million in Q1 24 vs. US$93 million in Q1 23, explained by the commissioning of PEPE IV in 2023 and the last disbursements of PEPE VI, which is estimated to be fully commissioned by October 2024. The following table shows the expansion projects in power generation:
| Project | MW | Marketing | Currency | Awarded price | | Estimated capex in
US$ million1 | Date of
commissioning |
Capacity per
MW-month | Variable
per MWh | Total
per MWh | | Budget | % Executed
@03/31/24 |
| Renewable | | | | | | | | | | |
| Pampa Energía VI | 139.5 | MAT ER | US$ | na | na | 62(2) | | 269 | 60% | Q4 2024 (est.) |
Note: 1 Without value-added tax. 2 Estimated average.
| |
| Pampa Energía ● Earnings release Q1 24 ● 13 |
| 3.3 | Analysis of the oil and gas segment |
Oil & gas segment, consolidated
Figures in US$ million | | First quarter |
| | 2024 | 2023 | ∆% |
| Sales revenue | | 150 | 154 | -3% |
| Domestic sales | | 119 | 104 | +14% |
| Foreign market sales | | 31 | 50 | -38% |
| Cost of sales | | (99) | (92) | +8% |
| | | | | |
| Gross profit | | 51 | 62 | -18% |
| | | | | |
| Selling expenses | | (13) | (12) | +8% |
| Administrative expenses | | (18) | (18) | - |
| Other operating income | | 14 | 5 | +180% |
| Other operating expenses | | (5) | (5) | - |
| | | | | |
| Operating income | | 29 | 32 | -9% |
| | | | | |
| Finance costs | | (26) | (38) | -32% |
| Other financial results | | (3) | 5 | NA |
| Financial results, net | | (29) | (33) | -12% |
| | | | | |
| Loss before tax | | - | (1) | -100% |
| | | | | |
| Income tax | | 49 | - | NA |
| | | | | |
| Net loss for the period | | 49 | (1) | NA |
| | | | | |
| Adjusted EBITDA | | 70 | 62 | +14% |
| | | | | |
| Increases in PPE and right-of-use assets | | 87 | 88 | -1% |
| Depreciation and amortization | | 47 | 32 | +47% |
The slight decrease in Q1 24 sales from the oil and gas segment is mainly due to lower gas exports to Chile and crude oil sales, offset by higher gas sales in the domestic market, in line with the increased power demand and Plan Gas.Ar awarded volumes.
Oil and gas'
key performance indicators | | 2024 | | 2023 | | Variation |
| Oil | Gas | Total | Oil | Gas | Total | Oil | Gas | Total |
| First quarter | | | | | | | | | | | | |
| Volume | | | | | | | | | | | | |
| Production | | | | | | | | | | | | |
| In thousand m3/day | | 0.7 | 11,684 | | | 0.8 | 8,898 | | | -16% | +31% | +27% |
| In million cubic feet/day | | | 413 | | | | 314 | | |
| In thousand boe/day | | 4.3 | 68.8 | 73.1 | | 5.1 | 52.4 | 57.5 | |
| Sales | | | | | | | | | | | | |
| In thousand m3/day | | 0.6 | 11,807 | | | 0.9 | 8,968 | | | -34% | +32% | +25% |
| In million cubic feet/day | | | 417 | | | | 317 | | |
| In thousand boe/day | | 3.9 | 69.5 | 73.4 | | 6.0 | 52.8 | 58.8 | |
| | | | | | | | | | | | | |
| Average Price | | | | | | | | | | | | |
| In US$/bbl | | 68.6 | | | | 67.7 | | | | +1% | -18% | |
| In US$/MBTU | | | 3.2 | | | | 4.0 | | | |
Note: The net production in Argentina. The gas volume is standardized at 9,300 kilocalories (kCal).
| |
| Pampa Energía ● Earnings release Q1 24 ● 14 |
In operating terms, total production reached 73.1 kboe per day in Q1 24 (+27% vs. Q1 23 and +30% vs. Q4 23). Gas production recorded 11.7 million m3 per day (+31% vs. Q1 23 and +32% vs. Q4 23) mainly explained by the higher volumes awarded under Plan Gas.Ar, thanks to the commissioning of GPNK in August 2023, lightening bottlenecks in the main gas pipelines. Moreover, the demand from power thermal plants increased due to higher temperatures.
Analyzing the gas output by block, 64% of our total output in Q1 24 came from El Mangrullo, which recorded 7.4 million m3 per day (+29% vs. Q1 23 and +58% vs. Q4 23). In Sierra Chata, the production increased to 2.4 million m3 per day (+94% vs. Q1 23 and +8% vs. Q4 23) due to the outstanding productivity of its shale wells. At non-operated blocks, Río Neuquén remained at 1.5 million m3 per day (similar to Q1 23 and Q4 23), while Rincón del Mangrullo continued the natural depletion, contributing 0.2 million m3 per day (-5% vs. Q1 23 but similar to Q4 23).
Our gas price in Q1 24 was US$3.2 per MBTU (-18% vs. Q1 23 but similar to Q4 23), explained by lower volumes and prices exported to Chile. It is worth noting that in Q1 23, a sharp drought affected Chile and Argentina, shooting up the gas demand. Compared to Q4 23, foreign demand recovered substantially, reaching ToP levels stipulated in contracts.
Regarding our gas deliveries, during Q1 24, 66% was destined for thermal power generation and 9% for the retail segment, both under Plan Gas.Ar framework. Moreover, 14% was sold to the industrial/spot market, 8% was exported, and the remaining was sold as raw material to our petchem plants. In contrast, in Q1 23, 49% supplied thermal power units, 21% to the industrial/spot market, 15% was exported, 11% to the retail segment and the remaining was sold to our petchem plants.
Oil production reached 4.3 kbbl per day in Q1 24 (-16% vs. Q1 23 and -4% vs. Q4 23), explained by year-on-year drops of 0.8 kbbl per day at El Tordillo due to its natural depletion and 0.5 kbbl per day at Los Blancos due to temporary well shut-in, partially offset by associated crude oil from Sierra Chata and the completion in March of a shale oil well in Rincón de Aranda (+0.6 kbbl per day).
Our oil price in Q1 24 was slightly higher than in Q1 23, reaching US$69.9 per bbl, being domestic and foreign prices very close. 69% of our sales were destined to the domestic market vs. 80% in Q1 23.
By the end of Q1 24, we accounted for 804 productive wells vs. 813 as of 2023.
Net operating costs in Q1 24, excluding depreciation, amortization, Plan Gas.Ar compensation and the gains from the settlement of exports at a differential FX decreased 11% vs. Q1 23 to US$82 million but remained stable vs. Q4 23, mainly due to variations in the crude oil stock, higher commercial interests due to increased collection delays from CAMMESA and lower labor costs, partially offset by higher maintenance, treatment and gas transportation costs due to increased gas activity.
The lifting cost per boe decreased, reaching US$5.8 per boe produced in Q1 24 (-19% vs. Q1 23 and -22% vs. Q4 23), mainly explained by larger production volumes.
Plan Gas.Ar compensation and gains from exporting at a differential FX reached US$7 million and US$1 million in Q1 24, respectively—a sharp three-time increase in Plan Gas.Ar is due to the AR$ devaluation impacting the regulated PIST gas price, making wider the difference with the contracted price in US$. The differential FX income decreased vs. Q4 23 because of the shrinking gap between official FX and CCL.
Financial results in Q1 24 recorded net losses of US$29 million, a 12% improvement vs. Q1 23, mainly explained by lower financial interests due to the decrease in AR$-debt stock. Lower gains from holding financial securities partially offset these effects.
| |
| Pampa Energía ● Earnings release Q1 24 ● 15 |
Our oil and gas adjusted EBITDA amounted to US$70 million in Q1 24 (+14% vs. Q1 23), mainly explained by higher gas sales in the domestic market, partially offset by lower exports to Chile and crude oil sales. The adjusted EBITDA of Q1 24 excludes commercial interests for late collection, mainly charged to CAMMESA.
Finally, capital expenditures amounted to US$88 million in Q1 24 (similar to Q1 23), mainly driven by the beginning of the shale oil pilot plan in Rincón de Aranda, partially offset by the shale gas ramp-up activity during 2023.
| 3.4 | Analysis of the petrochemicals segment |
Petrochemicals segment, consolidated
Figures in US$ million | | First quarter |
| | 2024 | 2023 | ∆% |
| Sales revenue | | 120 | 125 | -4% |
| Domestic sales | | 76 | 89 | -15% |
| Foreign market sales | | 44 | 36 | +22% |
| Cost of sales | | (108) | (114) | -5% |
| | | | | |
| Gross profit | | 12 | 11 | +9% |
| | | | | |
| Selling expenses | | (2) | (3) | -33% |
| Administrative expenses | | (2) | (2) | - |
| Other operating income | | 3 | - | NA |
| | | | | |
| Operating income | | 10 | 6 | +67% |
| | | | | |
| Finance costs | | (1) | (1) | - |
| Financial results, net | | (1) | (1) | - |
| | | | | |
| Profit before tax | | 9 | 5 | +80% |
| | | | | |
| Income tax | | 2 | - | NA |
| | | | | |
| Net income for the period | | 11 | 5 | +120% |
| | | | | |
| Adjusted EBITDA | | 11 | 7 | +58% |
| | | | | |
| Increases in PPE | | 1 | 2 | -50% |
| Depreciation and amortization | | 1 | 1 | - |
The petrochemicals segment’s adjusted EBITDA reached US$11 million in Q1 24, a 58% increase vs. Q1 23, mainly explained by higher sales of reforming products, both in local and foreign markets, and, to a lesser extent, higher SBR exports. In addition, lower operating costs related to the FX variation and the profit from the settlement of exports at a differential FX were recorded, reaching US$3 million. The drop in international reference prices partially offset these effects and, except for the reforming, lower dispatch of all the segment’s products in the domestic market, correlated with the lower economic activity.
Total volume sold increased by 7% vs. Q1 23, reaching 110 thousand tons, mainly explained by higher octane basis sales in the local market and higher exports of naphtha, in line with the increased processing of virgin naphtha. Lower local demand for styrene, polystyrene, and SBR partially offset these effects.
| |
| Pampa Energía ● Earnings release Q1 24 ● 16 |
Petrochemicals'
key performance indicators | | Products | | Total |
| | Styrene & polystyrene1 | SBR | Reforming & others | |
| First quarter | | | | | | |
| Volume sold Q1 24 (thousand ton) | | 23 | 10 | 77 | | 110 |
| Volume sold Q1 23 (thousand ton) | | 29 | 9 | 66 | | 103 |
| Variation Q1 24 vs. Q1 23 | | -21% | +19% | +17% | | +7% |
| | | | | | | |
| Average price Q1 24 (US$/ton) | | 1,711 | 1,639 | 845 | | 1,098 |
| Average price Q1 23 (US$/ton) | | 1,857 | 1,938 | 846 | | 1,219 |
| Variation Q1 24 vs. Q1 23 | | -8% | -15% | -0% | | -10% |
Note: 1 Includes Propylene.
In Q1 24, financial results reached a net loss of US$1 million, similar to Q1 23, mainly explained by lower net gains from the AR$ devaluation over payables, partially offset by lower losses from holding financial securities.
| 3.5 | Analysis of the holding and others segment |
Holding and others segment, consolidated
Figures in US$ million | | First quarter |
| | 2024 | 2023 | ∆% |
| Sales revenue | | 3 | 4 | -25% |
| Domestic sales | | 3 | 4 | -25% |
| | | | | |
| Gross profit | | 3 | 4 | -25% |
| | | | | |
| Administrative expenses | | (8) | (9) | -11% |
| Other operating income | | 1 | - | NA |
| Other operating expenses | | (22) | (3) | NA |
| Recovery from impair. (Impairment) of intangible assets | | - | 2 | -100% |
| Income from the sale of associates | | 2 | - | NA |
| Results for participation in joint businesses | | 40 | 13 | +208% |
| | | | | |
| Operating income | | 16 | 7 | +129% |
| | | | | |
| Finance income | | 2 | 2 | - |
| Finance costs | | (10) | (14) | -29% |
| Other financial results | | 3 | 45 | -93% |
| Financial results, net | | (5) | 33 | NA |
| | | | | |
| Profit before tax | | 11 | 40 | -73% |
| | | | | |
| Income tax | | - | 1 | -100% |
| | | | | |
| Net income for the period | | 11 | 41 | -73% |
| | | | | |
| Adjusted EBITDA | | 23 | 29 | -22% |
| | | | | |
| Increases in PPE | | 1 | 2 | -50% |
| Depreciation and amortization | | - | - | NA |
The holding and others segment, excluding the affiliates’ equity income (Transener and TGS), posted a US$24 million operating loss in Q1 24, while it was a US$6 million loss in Q1 23, mainly explained by the provision for the arbitration award result with POSA for US$16 million, along with other requirements for contingencies, partially offset by lower labor costs.
In Q1 24, financial results reached a net loss of US$7 million, while it was a US$33 million net gain in Q1 23, mainly due to lower FX profit from the dilution of fiscal liabilities.
| |
| Pampa Energía ● Earnings release Q1 24 ● 17 |
The adjusted EBITDA of our holding and others segment decreased by 22% year-on-year, reaching US$23 million in Q1 24. The adjusted EBITDA excludes the equity income from our participation in TGS and Transener. In turn, it adds the EBITDA adjusted by equity ownership in these businesses.
In TGS, the EBITDA adjusted by our stake was US$27 million in Q1 24, similar to Q1 23, mainly explained by higher US$-denominated sales, due to the inflation evolution that resulted higher than the AR$ devaluation. In addition, the midstream segment also increased its sales, mainly because of higher transportation and conditioning services for natural gas in Vaca Muerta, and the operation and maintenance of the GPNK. Furthermore, the liquids segment’s EBITDA grew because of a decrease in US$-denominated gas costs, partially offset by lower traded volumes of gasoline and ethane, the latter due to client operational restrictions. However, the regulated business continues to perform below inflation, as the tariff increase set in Res. ENARGAS No. 112/24 will be applicable from April 2024.
In Transener, the EBITDA adjusted by our stake was US$6 million loss in Q1 24 vs. a US$10 million loss in Q1 23, mainly due to the tariff increase applicable from February 2024 (179.7% Transener and 191.1% Transba). The EBITDA excludes insurance collection for the failure of synchronous compensators at Ezeiza transformer station, which amounted to US$3 million in Q1 24.
| |
| Pampa Energía ● Earnings release Q1 24 ● 18 |
| 3.6 | Analysis of the quarter, by subsidiary and segment |
Subsidiary
In US$ million | First quarter 2024 | | First quarter 2023 |
| % Pampa | Adjusted EBITDA | Net debt2 | Net income3 | | % Pampa | Adjusted EBITDA | Net debt2 | Net income3 |
| |
| Power generation segment | | | | | | | | | |
| Diamante | 61.0% | 0 | (0) | 1 | | 61.0% | (1) | (0) | 0 |
| Los Nihuiles | 52.0% | (0) | (0) | 2 | | 52.0% | (1) | (0) | 0 |
| VAR | 100.0% | 4 | 0 | 4 | | 1.00 | 5 | - | 3 |
| | | | | | | | | | |
| Greenwind | | - | - | - | | | 5 | 56 | 1 |
| Subtotal Greenwind adjusted by ownership | 0.0% | - | - | - | | 100.0% | 5 | 56 | 1 |
| | | | | | | | | | |
| CTBSA | | 32 | 219 | 49 | | | 13 | 297 | 5 |
| Non-controlling stake adjustment | | (16) | (109) | (25) | | | (7) | (148) | (2) |
| Subtotal CTBSA adjusted by ownership | 50.0% | 16 | 109 | 25 | | 50.0% | 7 | 148 | 2 |
| | | | | | | | | | |
| Pampa stand-alone, other companies, & adj.1 | | 65 | (238) | 166 | | | 93 | 20 | 88 |
| Subtotal power generation | | 85 | (129) | 197 | | | 108 | 225 | 96 |
| | | | | | | | | | |
| Oil & gas segment | | | | | | | | | |
| Pampa Energía | 100.0% | 70 | 956 | 48 | | 100.0% | 62 | 827 | (1) |
| Subtotal oil & gas | | 70 | 956 | 48 | | | 62 | 827 | (1) |
| | | | | | | | | | |
| Petrochemicals segment | | | | | | | | | |
| Pampa Energía | 100.0% | 11 | - | 11 | | 100.0% | 7 | - | 5 |
| Subtotal petrochemicals | | 11 | - | 11 | | | 7 | - | 5 |
| | | | | | | | | | |
| Holding & others segment | | | | | | | | | |
| Transener | | 21 | (28) | 12 | | | 38 | (3) | 21 |
| Non-controlling stake adjustment | | (16) | 20 | (9) | | | (28) | 2 | (15) |
| Subtotal Transener adjusted by ownership | 26.3% | 6 | (7) | 3 | | 26.3% | 10 | (1) | 5 |
| | | | | | | | | | |
| TGS | | 103 | 39 | 65 | | | 95 | 84 | 27 |
| Non-controlling stake adjustment | | (76) | (29) | (48) | | | (67) | (59) | (19) |
| Subtotal TGS adjusted by ownership | 26.2% | 27 | 10 | 17 | | 29.1% | 28 | 24 | 8 |
| | | | | | | | | | |
| Pampa stand-alone, other companies, & adj.1 | | (10) | (0) | (9) | | | (8) | (0) | 28 |
| Subtotal holding & others | | 23 | 3 | 11 | | | 29 | 23 | 41 |
| | | | | | | | | | |
| Deletions | | - | (112) | - | | | - | (172) | - |
| Total consolidated | | 189 | 718 | 267 | | | 206 | 903 | 141 |
| At our share ownership | | 185 | 830 | 267 | | | 202 | 1,075 | 141 |
Note: 1 The deletion corresponds to other companies or inter-companies. 2 Net debt includes holding companies. 3 Attributable to the Company’s shareholders.
| |
| Pampa Energía ● Earnings release Q1 24 ● 19 |
| 4.1 | Power generation’s main operational KPIs by plant |
Power generation's
key performance indicators | | Hydroelectric | | Wind | | Subtotal
hydro
+wind | Thermal | | Total |
| | HINISA | HIDISA | HPPL | | PEMC1 | PEPE2 | PEPE3 | PEPE4 | PEA | | CTLL | CTG | CTP | CPB | CTPP | CTIW | CTGEBA | Eco-
Energía | CTEB2 | Subtotal
thermal | |
| Installed capacity (MW) | | 265 | 388 | 285 | | - | 53 | 53 | 81 | 100 | | 1,225 | 780 | 361 | 30 | 620 | 100 | 100 | 1,253 | 14 | 848 | 4,107 | | 5,332 |
| New capacity (MW) | | - | - | - | | - | 53 | 53 | 81 | 100 | | 287 | 184 | 100 | - | - | 100 | 100 | 565 | 14 | 279 | 1,343 | | 1,630 |
| Market share | | 0.6% | 0.9% | 0.6% | | 0.0% | 0.1% | 0.1% | 0.2% | 0.2% | | 2.8% | 1.8% | 0.8% | 0.1% | 1.4% | 0.2% | 0.2% | 2.9% | 0.03% | 1.9% | 9.4% | | 12% |
| | | | | | | | | | | | | | | | | | | | | | | | | |
| First quarter | | | | | | | | | | | | | | | | | | | | | | | | |
| Net generation Q1 24 (GWh) | | 311 | 208 | 164 | | - | 38 | 45 | 79 | 82 | | 926 | 1,121 | 135 | 28 | 102 | 44 | 37 | 2,267 | 17 | 1,251 | 5,002 | | 5,928 |
| Market share | | 0.8% | 0.5% | 0.4% | | 0.0% | 0.1% | 0.1% | 0.2% | 0.21% | | 2.4% | 2.9% | 0.3% | 0.1% | 0.3% | 0.1% | 0.1% | 5.8% | 0.0% | 3.2% | 12.8% | | 15.1% |
| Sales Q1 24 (GWh) | | 311 | 208 | 164 | | - | 41 | 45 | 79 | 82 | | 929 | 1,091 | 229 | 28 | 102 | 44 | 37 | 2,394 | 38 | 1,251 | 5,215 | | 6,144 |
| | | | | | | | | | | | | | | | | | | | | | | | | |
| Net generation Q1 23 (GWh) | | 176 | 97 | 175 | | 83 | 49 | 52 | 27 | 80 | | 739 | 1,282 | 38 | 23 | 482 | 108 | 109 | 2,177 | 19 | 783 | 5,021 | | 5,760 |
| Variation Q1 24 vs. Q1 23 | | +77% | +116% | -7% | | -100% | -22% | -14% | na | +2% | | +25% | -13% | na | +26% | -79% | -60% | -66% | +4% | -10% | +60% | -0% | | +3% |
| Sales Q1 23 (GWh) | | 176 | 97 | 175 | | 83 | 49 | 52 | 27 | 80 | | 740 | 1,282 | 154 | 23 | 482 | 108 | 109 | 2,322 | 37 | 783 | 5,299 | | 6,038 |
| | | | | | | | | | | | | | | | | | | | | | | | | |
| Avg. price Q1 24 (US$/MWh) | | 9 | 14 | 12 | | na | 76 | 64 | 64 | 80 | | 27 | 20 | 34 | 13 | 66 | na | na | 31 | 39 | 28 | 31 | | 31 |
| Avg. price Q1 23 (US$/MWh) | | 16 | 34 | 16 | | 70 | 79 | 66 | 66 | 79 | | 41 | 20 | 75 | 25 | 20 | 92 | 72 | 33 | 37 | 25 | 31 | | 32 |
| Avg. gross margin Q1 24 (US$/MWh) | 3 | 3 | 2 | | na | 58 | 72 | 72 | 55 | | 19 | 16 | 13 | (3) | 9 | na | 145 | 18 | 18 | 23 | 20 | | 20 |
| Avg. gross margin Q1 23 (US$/MWh) | 7 | 11 | 7 | | 60 | 64 | 62 | 62 | 68 | | 30 | 17 | 33 | 7 | 8 | 72 | 54 | 20 | 14 | 16 | 20 | | 21 |
Note: Gross margin before amortization and depreciation 1 Fully owned by Pampa from August 2022 to July 2023. 2 Operated by Pampa (50% equity stake).
| |
| Pampa Energía ● Earnings release Q1 24 ● 20 |
| 4.2 | Production in the main oil and gas blocks |
| In kboe/day at ownership | | First quarter |
| 2024 | 2023 | Variation |
| Gas | | | | |
| El Mangrullo | | 43.7 | 33.8 | +29% |
| Río Neuquén | | 8.9 | 8.7 | +2% |
| Sierra Chata | | 13.8 | 7.1 | +94% |
| Rincón del Mangrullo1 | | 1.5 | 1.5 | -5% |
| Others | | 0.9 | 1.1 | -25% |
| Total gas at working interest | | 68.8 | 52.4 | +31% |
| | | | | |
| Oil | | | | |
| El Tordillo2 | | 1.6 | 2.3 | -31% |
| Gobernador Ayala | | 1.1 | 1.2 | -10% |
| Associated oil3 | | 1.3 | 1.0 | #VALOR! |
| Others | | 0.4 | 0.6 | -41% |
| Total gas at working interest | | 4.3 | 5.1 | -16% |
| | | | | |
| Total | | 73.1 | 57.5 | +27% |
Note: Production in Argentina. 1 It does not include shale formation. 2 It includes the La Tapera – Puesto Quiroga block. 3 From gas fields.
| |
| Pampa Energía ● Earnings release Q1 24 ● 21 |
| Term | Definition |
| ADR/ADS | American Depositary Receipt |
| AR$ | Argentine Pesos |
| Bbl | Barrel |
| BCRA | Banco Central de la República Argentina (Argentina Central Bank) |
| Boe | Barrels of oil equivalent |
| ByMA | Bolsas y Mercados Argentinos (Buenos Aires Stock Exchange) |
| CAMMESA | Compañía Administradora del Mercado Mayorista Eléctrico S.A. (Argentine Wholesale Electricity Market Clearing Company) |
| CB | Corporate Bonds |
| CCGT | Combined Cycle |
| CCL | An AR$ security settled in foreign markets |
| CNY | Renminbi Chinese currency |
| CPB | Piedra Buena Thermal Power Plant |
| CTBSA | CT Barragán S.A. |
| CTEB | Ensenada Barragán Thermal Power Plant |
| CTG | Güemes Thermal Power Plant |
| CTGEBA | Genelba Thermal Power Plant |
| CTIW | Ingeniero White Thermal Power Plant |
| CTLL | Loma De La Lata Thermal Power Plant |
| CTP | Piquirenda Thermal Power Plant |
| CTPP | Parque Pilar Thermal Power Plant |
| E&P | Exploration and Production |
| EBITDA | Earnings before interest, tax, depreciation and amortization |
| EcoEnergía | EcoEnergía Co-Generation Power Plant |
| ENARGAS | Ente Nacional Regulador del Gas (National Gas Regulatory Entity) |
| ENRE | Ente Nacional Regulador de la Electricidad (National Electricity Regulatory Entity) |
| FS | Financial Statements |
| FX | Nominal exchange rate |
| GPNK | Presidente Néstor Kirchner Gas Pipeline |
| GT | Gas turbine |
| GWh | Gigawatt-hour |
| HIDISA | Diamante Hydro Power Plant |
| HINISA | Los Nihuiles Hydro Power Plant |
| HPPL | Pichi Picun Leufu Hydro Power Plant |
| IFRS | International Financial Reporting Standards |
| Kbbl/kboe | Thousands of barrels/thousands of barrels of oil equivalent |
| M3 | Cubic meter |
| MBTU | Million British Thermal Units |
| MW/MWh | Megawatt/Megawatt-hour |
| N.a. | Not applicable |
| O/S | Share ownership |
| Pampa / The Company | Pampa Energía S.A. |
| |
| Pampa Energía ● Earnings release Q1 24 ● 22 |
| PEA | Arauco II Wind Farm, stage 1 and 2 |
| PEMC | Ingeniero Mario Cebreiro Wind Farm |
| PEPE | Pampa Energía Wind Farm |
| PIST | Punto de Ingreso al Sistema de Transporte (System Entry Point for Transportation) |
| Plan Gas.Ar | Re-assurance and Strengthening of the Federal Hydrocarbon Production through Self-Supply, Exports, Replacement of Imports and the Expansion of the Transportation System to All the Country’s Hydrocarbon Basins 2023 – 2028 Plan (Executive Order No. 730/22) and the Argentine Natural Gas Production Promotion Plan – 2020 – 2024 Supply and Demand Scheme (Emergency Executive Order No. 892/20 and supplementary provisions) |
| POSA | Petrobras Operaciones S.A. |
| PPA | Power Purchase Agreement |
| PPE | Property, Plant and Equipment |
| Q4 23 | Fourth quarter of 2023 |
| Q1 24/Q1 23 | First quarter of 2024/First quarter of 2023 |
| Res. | Resolution/Resolutions |
| RTI | Comprehensive tariff review |
| SE | Secretariat of Energy |
| ST | Steam turbine |
| TGS | Transportadora de Gas del Sur S.A. |
| Ton | Metric ton |
| ToP | Take or pay |
| Transba | Empresa de Transporte de Energía Eléctrica por Distribución Troncal de la Provincia de Buenos Aires Transba S.A. |
| Transener | Compañía de Transporte de Energía Eléctrica en Alta Tensión Transener S.A. |
| US$ | U.S. Dollars |
| US$-link | A security in which the underlying is linked to US$ wholesale exchange rate |
| US$-MEP | A security in which the settlement uses US$ in the domestic market |
| |
| Pampa Energía ● Earnings release Q1 24 ● 23 |
