
Pampa Energía, an independent company with active participation in the Argentine electricity, oil and gas value chain, announces the results for the fiscal year and quarter ended on December 31, 2024. |
Buenos Aires, March 5, 2025
Stock information
Share capital Market capitalization Information about the videoconference Date and time Access link For further information Email Website for investors Argentina’s Securities and Exchange Commission Securities and | Basis of presentation Pampa’s financial information adopts US$ as functional currency, converted into AR$ at transactional FX. However, Transener and TGS adjust their figures for inflation as of December 31, 2024, which are expressed in US$ at the period’s close FX. The previously reported figures remain unchanged. Q4 24 main results1 20% year-on-year sales increase, reaching US$435 million in Q4 242, driven by higher gas demand for power generation and crude oil volumes sold, as well as improved operating performance at PPA units, PEPE 6 and the reformer. These effects were partially offset by lower gas sales to industries and Chile, and petchem prices. During Q4 24, gas production and thermal availability stood out:
Adjusted EBITDA3 was US$182 million in Q4 24, up 60% from Q4 23, mainly explained by tariff increases and AR$ real appreciation in TGS and Transener, higher deliveries under Plan Gas and the contributions from PEPE 6 and PPAs, offset by higher operating and development costs, along with lower gains from export settlements at a differential FX. US$106 million profit to the Company’s shareholders vs. a US$155 million loss in Q4 23, due to lower non-cash deferred income tax and higher sales and equity income from affiliates, offset by increased operating costs and lower gains from holding financial securities. Net debt continued to decline, closing at US$410 million, the lowest amount and ratio since 2016, explained by the strong operating cash flows from core businesses and improved days sales outstanding. |
1 The information is based on FS prepared according to IFRS in force in Argentina.
2 Sales from the affiliates CTBSA, Transener and TGS are excluded, shown as ‘Results for participation in joint businesses and associates.’
3 Consolidated adjusted EBITDA represents the flows before financial items, income tax, depreciations and amortizations, extraordinary and non-cash income and expense, equity income, and includes affiliates’ EBITDA at our ownership. Further information on section 3.1.
 |
| 1. | Relevant Events |
| 1.1 | International placement of 2034 Notes and redemption of 2027 Notes |
On December 10, 2024, Pampa issued a US$360 million international bond maturing in December 2034, securing a highly competitive 7.875% annual rate, reflecting strong interest from leading institutional investors. With the proceeds, on January 24, 2025, Pampa fully redeemed the 2027 Notes, paying US$353 million in principal plus accrued interests. This transaction enhances Pampa’s debt profile, extending its average life to 4.2 years and strengthening its financial position to pave the way for strategic investments in Vaca Muerta, especially in the development of the Rincón de Aranda shale oil block.
| 1.2 | Oil and gas |
Participation in the Vaca Muerta Sur Project
On December 16, 2024, Pampa confirmed its participation in the VMOS Project alongside YPF, Vista, PAE and Pluspetrol. Pampa holds a 14% stake in VMOS S.A., the company managing the project. This stake may dilute as new shareholders join.
VMOS aims to build and operate a 437 km oil pipeline connecting Allen to Punta Colorada, Río Negro, with a capacity of up to 550 kbpd, expandable to 700 kbpd. In addition to the oil pipeline, VMOS also features a loading and unloading terminal, single-buoy moorings, a tank farm and other associated facilities to export crude oil and liquids via very large crude carriers, known as VLCCs.
The project will demand an estimated investment of US$3 billion, funded through shareholders’ contributions and external financing. Pampa has secured a take-or-pay transportation contract for 50 kbpd, including storage and dispatch capacity. On November 15, 2024, VMOS applied for the RIGI, meeting the eligibility requirements outlined in the Ley Bases and Executive Order No. 749/24.
VMOS will streamline crude oil evacuation and exports from Vaca Muerta, particularly from Rincón de Aranda, reduce logistics costs, broaden market access for Argentine oil, increase foreign currency inflows, create employment opportunities and expand Pampa’s firm transportation capacity by nine times.
Participation in the FLNG Project to export natural gas
On November 29, 2024, Pampa announced its participation in the pioneer LNG in Argentina, with a 20% stake in SESA, the company that will manage the project, alongside PAE, Harbour Energy, YPF and Golar. Pampa has committed to supplying natural gas.
The project involves installing floating liquefaction facilities in the San Matías Gulf, Río Negro province, along with the construction of supporting infrastructure. Operations are expected to begin by 2027. SESA has also applied for the RIGI scheme, meeting the criteria under Ley Bases and Executive Order No. 749/24 as a “Long-Term Strategic Export Project.”
The FLNG Project is strategic to monetizing Pampa’s Vaca Muerta reserves, positioning Argentina in the global LNG market, and boosting foreign currency inflows, job creation, and the domestic supply chain.
New gas export permits
In December 2024, the SE approved additional ToP gas export volumes to Chile for 0.9 mcmpd, valid between January 2025 and December 2026.
| Pampa Energía ● Earnings release Q4 24 ● 2 |
| |
| 1.3 | Power generation |
Regulatory changes in the electricity market
On January 28, 2025, the SE issued Res. No. 21/25, introducing regulatory changes in the MAT and MEM. Implementation will require further rulemaking and/or clarifications. The most relevant aspects include:
| · | Thermal, hydro and nuclear units commissioned from January 1, 2025, as well as generators procuring their fuel through new infrastructure, are exempt from the contracting suspension in the MAT. |
| · | As of October 31, 2025, new or renewed Energía Plus contracts will not be allowed. Existing contracts remain valid until expiration, after which Energía Plus will be discontinued. Power plants under this scheme must then operate under market mechanisms defined by the SE as part of the MEM normalization process. |
| · | The electricity dispatch and gas allocation scheme for power generation, established by Res. SE No. 354/20, was repealed as of February 1, 2025. This scheme prioritized dispatch based on ENARSA’s contract obligations with Bolivia and the Plan Gas. In note NO-2025-16900682-APN-SE#MEC, sent by the SE to CAMMESA on February 19, 2025, a new dispatch criteria takes effect on March 1, 2025, allowing generators that choose to procure their fuel to compete based on declared variable costs once CAMMESA has allocated the ToP volumes under Plan Gas. This change may impact the balance between ToP and DoP commitments under Plan Gas. |
| · | Starting March 1, 2025, generators selling spot energy can supply their fuel, with recognized costs based on declared and accepted reference prices and variable costs, including freight, transportation, natural gas distribution, and taxes. CAMMESA will continue centralizing fuel procurement for PPAs under Res. SE No. 220/07, 21/17, and 287/17, acting as the fuel supplier of last resort. |
Also, on January 28, 2025, the SE instructed CAMMESA to publish guidelines for the MEM’s evolution, including structural adjustments and changes to power remuneration schemes (Note NO-2025-09628437-APN-SE#MEC). CAMMESA posted these reports on its website, granting 30 days for MEM Agent Associations to submit feedback. Then, CAMMESA will assess the impact of the modifications and submit its recommendations to the SE, which will define transitional regulations for adapting the MEM. These changes are expected to take effect on November 1, 2025, at the start of the 2025-2026 summer period.
Pampa is assessing these regulatory developments and awaiting further clarifications from the SE.
Spot remuneration updates
| Effective as of: | Spot remuneration | |
| Increase | Resolution | |
| Dec-24 | 5% | SE No. 387/24 |
| Jan-25 | 4% | SE No. 603/24 |
| Feb-25 | 4% | SE No. 27/25 |
| Mar-25 | 1.5% | SE No. 113/25 |
In 2024, the spot remuneration accumulated an increase of 169%.
Extension of HINISA’s concession transition period
On November 29, 2024, the SE extended for 6 months the transition period for HINISA license granted by the National Government. Hence, the new expiration date will be June 1, 2025.
| Pampa Energía ● Earnings release Q4 24 ● 3 |
| |
PEPE 6 final commissioning
On November 21, 2024, the final 6 wind turbines of PEPE 6 were commissioned, reaching a total installed capacity of 139.5 MW. With an estimated investment of US$250 million, Pampa has 427 MW of installed wind power capacity, ranking as one of the country’s leading renewable power producers.
| 1.4 | Transener and TGS |
Tariff review and public hearing
Executive order No. 1,023, issued on November 19, 2024, extended the energy emergency until July 9, 2025. In this sense, on January 7, 2025, the ENRE announced the updated schedule for the RQT of regulated electricity companies. The process includes submitting the proposed annual remuneration, the public hearing on February 25, 2025, and the implementation of new tariff schedules before April 1, 2025 (Res. No. 7/25). On January 10, 2025, the ENRE set a real post-tax rate of return (WACC) of 6.10% (ENRE Res. No. 28/25).
Regarding TGS, on January 14, 2025, the ENARGAS called for a public hearing on February 6, 2025, to discuss the RQT and the tariff adjustment methodology, among other matters. TGS submitted its 2025-2029 expenditure and investment plan, its capital base, and a proposed WACC. Additionally, TGS presented two periodic tariff adjustment methodologies: one based on the IPIM (Wholesale Price Index) and another formula composed of 30% IPIM, 40% wage index, and 30% construction cost index. As of today, the ENARGAS has not issued the resolution concluding the RQT but has proposed a real post-tax WACC of 7.18% and a periodic tariff adjustment of 50% CPI and 50% IPIM.
Cost variations
| Effective as of: | Transener | TGS | |||
| Increase | Resolution | Increase | Resolution | ||
| Dec-24 | 5% | ENRE No. 1,016 and 1,015/24 | 3% | ENARGAS No. 815/24 | |
| Jan-25 | 4% | ENRE No. 1,065 and 1,066/24 | 2.5% | ENARGAS No. 915/24 | |
| Feb-25 | 4% | ENRE No. 85 and 87/25 | 1.5% | ENARGAS No. 51/25 | |
| Mar-25 | 2% | ENRE No. 158 and 154/25 | |||
In 2024, Transener and Transba saw cumulative tariff increases of 259.2% and 273.9%, respectively, while TGS recorded a 791.3% increase.
| 1.5 | Organizational and Board of Directors changes |
On December 24, 2024, Pampa’s Board of Directors approved the appointment of Adolfo Zuberbühler as CFO, effective January 1, 2025. Born in 1978, he joined Pampa in 2007 as a financial analyst, became investment portfolio manager in 2010 and was promoted to director of financial operations in 2017, later incorporating corporate finance in 2023. Mr. Zuberbühler holds an undergraduate degree in business economics and a master’s degree in applied economics, both from Torcuato Di Tella University.
Moreover, Nicolás Mindlin and Horacio Turri joined Pampa’s Executive Committee. Mr. Mindlin was appointed executive vice president, while Mr. Turri incorporated the role of executive vice president alongside his existing position as executive director of E&P.
Finally, on March 5, 2025, Maria Carolina Sigwald resigned as a regular Board member. Her replacement will be appointed at Pampa’s next shareholders’ meeting.
| Pampa Energía ● Earnings release Q4 24 ● 4 |
| |
| 2. | Financial highlights |
| 2.1 | Consolidated balance sheet |
| Figures in million | As of 12.31.2024 | As of 12.31.2023 | ||||
| AR$ | US$ FX 1032 | AR$ | US$ FX 808,45 | |||
| ASSETS | ||||||
| Property, plant and equipment | 2,690,533 | 2,607 | 2,056,974 | 2,544 | ||
| Intangible assets | 99,170 | 95 | 77,898 | 96 | ||
| Right-of-use assets | 11,330 | 11 | 17,259 | 21 | ||
| Deferred tax asset | 161,694 | 157 | 2 | 0 | ||
| Investments in joint ventures and associates | 1,024,769 | 993 | 542,978 | 672 | ||
| Financial assets at fair value through profit and loss | 28,127 | 27 | 28,040 | 35 | ||
| Other assets | 366 | 0 | 349 | 0 | ||
| Trade and other receivables | 76,798 | 75 | 14,524 | 18 | ||
| Total non-current assets | 4,092,787 | 3,965 | 2,738,024 | 3,387 | ||
| Inventories | 230,095 | 223 | 166,023 | 205 | ||
| Financial assets at amortized cost | 82,628 | 80 | 84,749 | 105 | ||
| Financial assets at fair value through profit and loss | 877,623 | 850 | 451,883 | 559 | ||
| Derivative financial instruments | 979 | 1 | 250 | 0 | ||
| Trade and other receivables | 503,529 | 488 | 238,294 | 295 | ||
| Cash and cash equivalents | 761,231 | 738 | 137,973 | 171 | ||
| Total current assets | 2,456,085 | 2,380 | 1,079,172 | 1,335 | ||
| Total assets | 6,548,872 | 6,345 | 3,817,196 | 4,722 | ||
| EQUITY | ||||||
| Equity attributable to owners of the company | 3,391,127 | 3,286 | 1,943,736 | 2,404 | ||
| Non-controlling interest | 9,167 | 9 | 6,960 | 9 | ||
| Total equity | 3,400,294 | 3,295 | 1,950,696 | 2,413 | ||
| LIABILITIES | ||||||
| Provisions | 141,436 | 137 | 119,863 | 148 | ||
| Income tax and presumed minimum income tax liabilities | 77,284 | 75 | 44,614 | 55 | ||
| Deferred tax liabilities | 50,223 | 49 | 240,686 | 298 | ||
| Defined benefit plans | 31,293 | 30 | 13,172 | 16 | ||
| Borrowings | 1,416,917 | 1,373 | 989,182 | 1,224 | ||
| Trade and other payables | 87,992 | 84 | 37,301 | 46 | ||
| Total non-current liabilities | 1,805,145 | 1,748 | 1,444,818 | 1,787 | ||
| Provisions | 10,725 | 10 | 4,649 | 6 | ||
| Income tax liabilities | 265,008 | 257 | 14,026 | 17 | ||
| Taxes payables | 30,989 | 30 | 11,427 | 14 | ||
| Defined benefit plans | 7,077 | 7 | 2,695 | 3 | ||
| Salaries and social security payable | 40,035 | 39 | 15,537 | 19 | ||
| Derivative financial instruments | 2 | 0 | 191 | 0 | ||
| Borrowings | 728,096 | 706 | 181,357 | 224 | ||
| Trade and other payables | 261,501 | 253 | 191,800 | 237 | ||
| Total current liabilities | 1,343,433 | 1,302 | 421,682 | 522 | ||
| Total liabilities | 3,148,578 | 3,050 | 1,866,500 | 2,309 | ||
| Total liabilities and equity | 6,548,872 | 6,345 | 3,817,196 | 4,722 | ||
| Pampa Energía ● Earnings release Q4 24 ● 5 |
| |
| 2.2 | Consolidated income statement |
| Fiscal year | Fourth quarter | |||||||||||
| Figures in million | 2024 | 2023 | 2024 | 2023 | ||||||||
| AR$ | US$ | AR$ | US$ | AR$ | US$ | AR$ | US$ | |||||
| Sales revenue | 1,732,901 | 1,876 | 513,727 | 1,732 | 438,407 | 435 | 166,770 | 362 | ||||
| Domestic sales | 1,457,480 | 1,575 | 429,205 | 1,423 | 371,138 | 368 | 143,313 | 306 | ||||
| Foreign market sales | 275,421 | 301 | 84,522 | 309 | 67,269 | 67 | 23,457 | 56 | ||||
| Cost of sales | (1,181,132) | (1,279) | (320,124) | (1,107) | (349,413) | (349) | (110,171) | (257) | ||||
| Gross profit | 551,769 | 597 | 193,603 | 625 | 88,994 | 86 | 56,599 | 105 | ||||
| Selling expenses | (68,713) | (74) | (19,338) | (66) | (17,333) | (17) | (6,005) | (15) | ||||
| Administrative expenses | (225,718) | (239) | (62,721) | (185) | (100,878) | (100) | (28,092) | (52) | ||||
| Exploration expenses | (20,711) | (21) | (1,859) | (7) | (20,455) | (21) | (87) | - | ||||
| Other operating income | 161,789 | 175 | 57,141 | 177 | 59,073 | 59 | 25,514 | 62 | ||||
| Other operating expenses | (80,822) | (88) | (29,374) | (88) | (16,856) | (16) | (11,295) | (20) | ||||
| Impairment of financial assets | (48,932) | (56) | 283 | - | (20) | - | 698 | 4 | ||||
| Impairment on PPE, int. assets & inventories | (34,058) | (34) | (30,784) | (39) | (15,480) | (15) | (30,460) | (38) | ||||
| Results for part. in joint businesses & associates | 145,570 | 146 | 4,541 | (2) | 51,239 | 45 | (9,503) | (44) | ||||
| Income from the sale of associates | 33,128 | 34 | 6,262 | 9 | 27,363 | 27 | 5,776 | 8 | ||||
| Operating income | 413,302 | 440 | 117,754 | 424 | 55,647 | 48 | 3,145 | 10 | ||||
| Financial income | 31,780 | 32 | 1,764 | 5 | 27,685 | 28 | 674 | 1 | ||||
| Financial costs | (168,927) | (185) | (105,359) | (364) | (47,995) | (48) | (34,263) | (81) | ||||
| Other financial results | 198,477 | 211 | 155,089 | 558 | 98,671 | 97 | 59,295 | 166 | ||||
| Financial results, net | 61,330 | 58 | 51,494 | 199 | 78,361 | 77 | 25,706 | 86 | ||||
| Profit before tax | 474,632 | 498 | 169,248 | 623 | 134,008 | 125 | 28,851 | 96 | ||||
| Income tax | 90,158 | 121 | (132,557) | (318) | (21,557) | (19) | (112,120) | (249) | ||||
| Net income for the period | 564,790 | 619 | 36,691 | 305 | 112,451 | 106 | (83,269) | (153) | ||||
| Attributable to the owners of the Company | 564,587 | 619 | 34,488 | 302 | 111,957 | 106 | (85,220) | (155) | ||||
| Attributable to the non-controlling interest | 203 | - | 2,203 | 3 | 494 | - | 1,951 | 2 | ||||
| Net income per share to shareholders | 415.1 | 0.5 | 25.2 | 0.2 | 82.3 | 0.1 | (62.7) | (0.1) | ||||
| Net income per ADR to shareholders | 10,378.4 | 11.4 | 631.2 | 5.5 | 2,058.0 | 1.9 | (1,566.5) | (2.9) | ||||
| Average outstanding common shares1 | 1,360 | 1,360 | 1,366 | 1,366 | 1,360 | 1,360 | 1,360 | 1,360.0 | ||||
| Outstanding shares by the end of period1 | 1,360 | 1,360 | 1,360 | 1,360 | 1,360 | 1,360 | 1,360 | 1,360.0 | ||||
Note: 1 It considers the Employee stock-based compensation plan shares, which amounted to 3.9 million common shares as of December 31, 2023 and 2024.
| Pampa Energía ● Earnings release Q4 24 ● 6 |
| |
| 2.3 | Cash and financial borrowings |
| As of December 31, 2024, in US$ million | Cash1 | Financial debt | Net debt | ||||||
| Consolidated in FS | Ownership adjusted | Consolidated in FS | Ownership adjusted | Consolidated in FS | Ownership adjusted | ||||
| Power generation | 1,264 | 1,258 | 674 | 674 | (590) | (584) | |||
| Petrochemicals | - | - | - | - | - | - | |||
| Holding and others | 1 | 1 | 14 | 14 | 13 | 13 | |||
| Oil and gas | 403 | 403 | 1,390 | 1,390 | 987 | 987 | |||
| Total under IFRS/Restricted Group | 1,668 | 1,662 | 2,079 | 2,079 | 410 | 416 | |||
| Affiliates at O/S2 | 236 | 236 | 172 | 172 | (63) | (63) | |||
| Total with affiliates | 1,904 | 1,898 | 2,251 | 2,251 | 347 | 353 | |||
Note: Financial debt includes accrued interest. 1 It includes cash and cash equivalents, financial assets at fair value with changing results, and investments at amortized cost. 2 Under IFRS, the affiliates CTBSA, Transener and TGS are not consolidated in Pampa.
Debt transactions
As of December 31, 2024, Pampa’s financial debt under IFRS amounted to US$2,079 million, 44% higher than the end of 2023, mainly due to the international issuance of the 2031 and 2034 Notes, partially offset by the full redemption of the 2027 Notes, a repurchase approved by the Board of Directors on August 26, 2024, and completed in January 2025.
Despite the higher gross debt, net debt dropped to US$410 million, the lowest level in nine years, due to the strong cash inflow from power generation and E&P operations, along with improved collections from CAMMESA and ENARSA. The gross debt principal breakdown is shown below:
| Currency | Type of issuance | Amount in million US$ | Legislation | % over total gross debt | Avg coupon |
| US$ | US$1 | 1,535 | Foreign | 75% | 8.2% |
| US$ Cable | 183 | Argentine | 9% | 4.4% | |
| US$ MEP | 208 | Argentine | 10% | 5.3% | |
| AR$ | AR$ | 17 | Argentine | 1% | 30.9%, variable |
| US$-link | 98 | Argentine | 5% | 0% |
With the successful issuance of the 2031 and 2034 Notes at highly competitive rates, Pampa significantly enhanced its debt maturity profile, extending the average life to 4.2 years. The chart below shows the principal maturity profile, net of repurchases, in US$ million by the end of Q4 24:
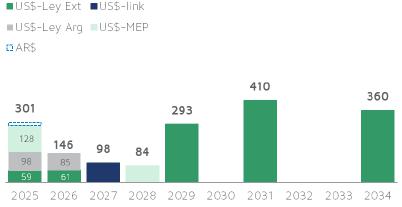 | Note: The chart only considers Pampa consolidated |
| Pampa Energía ● Earnings release Q4 24 ● 7 |
| |
In addition to the issuance of the 2034 Notes (Series 23) for US$360 million at a 7.875% interest rate and maturing in December 2034, during Q4 24, Pampa also issued the CB Series 22 for US$84 million at a 5.75% interest rate, maturing in October 2028. Moreover, Pampa canceled US$47 million from its CB Series 20, leaving an outstanding balance of US$60 million and made the first amortization payment of US$97 million on the 2026 Notes. Furthermore, Pampa paid short-term bank debt for the equivalent of US$45 million and completed the final US$4 million payment to FINNVERA. After the quarter’s close, Pampa took on net bank debt for US$31 million, canceled its CB Series 19 for AR$17,131 million and used proceeds from the 2034 Notes to fully redeem the remaining 2027 Notes (Series 1) for a face value of US$353 million.
Regarding our affiliates, in Q4 24, CTEB repaid AR$4 billion in bank borrowings, took short-term bank debt for US$57 million and canceled CB Series 4 for US$96 million. After the quarter’s close, CTEB took US$75 million in net borrowings, paid AR$6 billion in short-term bank debt and repurchased CB Series 6 for US$18 million.
As of this report’s release, Pampa remains fully compliant with all debt covenants.
Summary of debt securities
| Company In million | Security | Maturity | Amount issued | Amount net of repurchases | Coupon |
| In US$-Foreign Law | |||||
| Pampa | CB Series 9 at par & fixed rate | 2026 | 293 | 120 | 9.5% |
| CB Series 1 at par & fixed rate2 | 2027 | 750 | 353 | 7.5% | |
| CB Series 3 at discount & fixed rate | 2029 | 300 | 293 | 9.125% | |
| CB Series 21 at discount & fixed rate | 2031 | 410 | 410 | 7.95% | |
| CB Series 23 at discount & fixed rate | 2034 | 360 | 360 | 7.875% | |
| TGS1 | CB at discount at fixed rate | 2031 | 490 | 490 | 8.5% |
| In US$-Argentine Law | |||||
| Pampa | CB Series 20 | 2026 | 108 | 54 | 6% |
| In US$-link | |||||
| Pampa | CB Series 13 | 2027 | 98 | 98 | 0% |
| CTEB1 | CB Series 63 | 2025 | 84 | 66 | 0% |
| CB Series 9 | 2026 | 50 | 50 | 0% | |
| In US$-MEP | |||||
| Pampa | CB Series 16 | 2025 | 56 | 56 | 4.99% |
| CB Series 18 | 2025 | 72 | 68 | 5% | |
| CB Series 22 | 2028 | 84 | 84 | 5.75% | |
| In AR$ | |||||
| Pampa | CB Series 194 | 2025 | 17,131 | 17,131 | Badlar Privada -1% |
Notes: 1 Under IFRS, affiliates are not consolidated in Pampa’s FS. 2 Pampa’s Series 1 CB (2027 Notes) was redeemed in January 2025. 3 US$18 million were repurchased after the quarter’s close. 4 Pampa’s CB Series 19 was redeemed after the quarter’s close.
| Pampa Energía ● Earnings release Q4 24 ● 8 |
| |
Credit ratings
In November 2024, FitchRatings upgraded Pampa’s local credit rating from ‘AA+’ to ‘AAA’ with a stable outlook, reflecting strong cash flow generation from power and gas operations and expansion into shale oil in Rincón de Aranda, lowering reliance on regulated businesses and increasing Pampa’s exports. Moreover, due to Argentina’s improvement in foreign currency, Moody’s upgraded Pampa and TGS from ‘Caa3’ to ‘Caa1’ in January 2025. Finally, in February 2025, S&P improved Pampa & TGS credit ratings to ‘B-,’ and FIX SCR upgraded CTEB’s local rating to ‘AA+.’
The table below shows the risk ratings for Pampa and its subsidiaries:
| Company | Agency | Rating | |
| Global | Local | ||
| Pampa | S&P | B- | na |
| Moody's | Caa1 | na | |
| FitchRatings1 | B- | AAA (long-term) A1+ (short-term) | |
| TGS | S&P | B- | na |
| Moody's | Caa1 | na | |
| FitchRatings | B- | na | |
| Transener | FitchRatings1 | na | A+ (long-term) |
| CTEB | FitchRatings1 | na | AA+ |
Note: 1 Local rating issued by FIX SCR.
| Pampa Energía ● Earnings release Q4 24 ● 9 |
| |
| 3. | Analysis of the Q4 24 results |
| Breakdown by segment Figures in US$ million | Q4 24 | Q4 23 | Variation | ||||||
| Sales | Adjusted EBITDA | Net Income | Sales | Adjusted EBITDA | Net Income | Sales | Adjusted EBITDA | Net Income | |
| Oil and Gas | 134 | 36 | (76) | 118 | 49 | (63) | +14% | -26% | +21% |
| Power generation | 167 | 86 | 133 | 141 | 80 | (103) | +18% | +7% | NA |
| Petrochemicals | 122 | (7) | 39 | 118 | 20 | 4 | +3% | NA | NA |
| Holding and Others | 36 | 67 | 10 | 3 | (36) | 7 | NA | NA | +43% |
| Eliminations | (24) | - | - | (18) | - | - | +33% | NA | NA |
| Total | 435 | 182 | 106 | 362 | 114 | (155) | +20% | +60% | NA |
Note: Net income attributable to the Company’s shareholders.
| 3.1 | Reconciliation of consolidated adjusted EBITDA |
| Reconciliation of adjusted EBITDA, in US$ million | Fiscal year | Fourth quarter | ||||
| 2024 | 2023 | 2024 | 2023 | |||
| Consolidated operating income | 440 | 424 | 48 | 10 | ||
| Consolidated depreciations and amortizations | 342 | 267 | 85 | 64 | ||
| Reporting EBITDA | 782 | 691 | 133 | 74 | ||
| Adjustments from oil and gas segment | 40 | 34 | 35 | 34 | ||
| Adjustments from generation segment | 86 | 9 | 6 | 14 | ||
| Adjustments from petrochemicals segment | (27) | 3 | (27) | (0) | ||
| Adjustments from holding & others segment | 55 | 49 | 35 | (9) | ||
| Consolidated adjusted EBITDA | 937 | 786 | 182 | 114 | ||
| At our ownership | 935 | 787 | 181 | 113 | ||
| Pampa Energía ● Earnings release Q4 24 ● 10 |
| |
| 3.2 | Analysis of the oil and gas segment |
| Oil & gas segment, consolidated Figures in US$ million | Fiscal year | Fourth quarter | ||||||
| 2024 | 2023 | ∆% | 2024 | 2023 | ∆% | |||
| Sales revenue | 730 | 666 | +10% | 134 | 118 | +14% | ||
| Domestic sales | 622 | 505 | +23% | 110 | 95 | +16% | ||
| Foreign market sales | 108 | 161 | -33% | 24 | 24 | +1% | ||
| Cost of sales | (515) | (412) | +25% | (128) | (93) | +38% | ||
| Gross profit | 215 | 254 | -15% | 6 | 25 | -76% | ||
| Selling expenses | (58) | (49) | +18% | (12) | (11) | +9% | ||
| Administrative expenses | (82) | (74) | +11% | (25) | (18) | +39% | ||
| Exploration expenses | (21) | (7) | +200% | (21) | - | NA | ||
| Other operating income | 87 | 86 | +1% | 20 | 22 | -9% | ||
| Other operating expenses | (28) | (32) | -13% | (6) | (6) | - | ||
| Impairment of financial assets | (10) | - | NA | - | - | NA | ||
| Impairment of PPE | (34) | (38) | -11% | (15) | (38) | -61% | ||
| Operating income | 69 | 140 | -51% | (53) | (26) | +104% | ||
| Finance income | 2 | 2 | - | 1 | - | NA | ||
| Finance costs | (96) | (203) | -53% | (25) | (46) | -46% | ||
| Other financial results | (11) | (15) | -27% | 6 | (22) | NA | ||
| Financial results, net | (105) | (216) | -51% | (18) | (68) | -74% | ||
| Loss before tax | (36) | (76) | -53% | (71) | (94) | -24% | ||
| Income tax | 31 | 29 | +7% | (5) | 31 | NA | ||
| Net loss for the period | (5) | (47) | -89% | (76) | (63) | +21% | ||
| Adjusted EBITDA | 346 | 340 | +2% | 36 | 49 | -26% | ||
| Increases in PPE and right-of-use assets | 354 | 556 | -36% | 111 | 172 | -35% | ||
| Depreciation and amortization | 237 | 166 | +43% | 54 | 41 | +32% | ||
| Lifting cost | (180) | (156) | +15% | (49) | (38) | +28% | ||
| Lifting cost per boe | (6) | (7) | -4% | (9) | (7) | +18% | ||
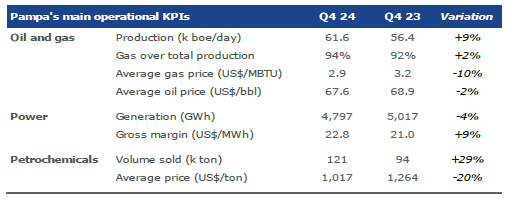
In Q4 24, sales from the oil and gas segment grew by 14% vs. Q4 23, mainly driven by the increased gas production for thermal power dispatch, higher crude oil sales and, to a lesser extent, better gas prices to distribution companies due to successive tariff hikes. Lower gas prices and volumes sold to large users and Chile, as well as a slight decrease in crude oil prices, partially offset these effects.
Regarding operating performance, total production in Q4 24 averaged 61.6 kboepd (+9% vs. Q4 23, -30% vs. Q3 24 due to seasonality), boosted by an increase in gas production to 9.8 mcmpd (+11% vs. Q4 23, -30% vs. Q3 24), explained by CAMMESA’s higher demand for thermal power, in line with the higher temperatures and lower hydro generation. Soft retail gas demand due to climate conditions, exports to Chile and sales to large users offset these effects.
Analyzing the gas output by block, El Mangrullo block represented 54% of total gas production in Q4 24, with 5.2 mcmpd (+12% vs. Q4 23, -34% vs. Q3 24), followed by Sierra Chata with 30% of the production, reaching 2.9 mcmpd (+34% vs. Q4 23, -27% vs. Q3 24). At non-operated blocks, Río Neuquén maintained a steady 1.3 mcmpd (-16% vs. Q4 23, -23% Q3 24), while Rincón del Mangrullo continued declining, producing 0.2 mcmpd (-22% vs. Q4 23, +4% vs. Q3 24).
| Pampa Energía ● Earnings release Q4 24 ● 11 |
| |
| Oil and gas' key performance indicators | 2024 | 2023 | Variation | |||||||||
| Oil | Gas | Total | Oil | Gas | Total | Oil | Gas | Total | ||||
| Fiscal year | ||||||||||||
| Volume | ||||||||||||
| Production | ||||||||||||
| In thousand m3/day | 0.8 | 12,478 | 0.8 | 10,296 | -1% | +21% | +20% | |||||
| In million cubic feet/day | 441 | 364 | ||||||||||
| In thousand boe/day | 4.8 | 73.4 | 78.2 | 4.8 | 60.6 | 65.4 | ||||||
| Sales | ||||||||||||
| In thousand m3/day | 0.8 | 12,468 | 0.8 | 10,274 | -1% | +21% | +20% | |||||
| In million cubic feet/day | 440 | 363 | ||||||||||
| In thousand boe/day | 5.0 | 73.4 | 78.3 | 5.0 | 60.5 | 65.5 | ||||||
| Average Price | ||||||||||||
| In US$/bbl | 70.2 | 66.2 | +6% | -12% | ||||||||
| In US$/MBTU | 3.7 | 4.2 | ||||||||||
| Fourth quarter | ||||||||||||
| Volume | ||||||||||||
| Production | ||||||||||||
| In thousand m3/day | 0.6 | 9,785 | 0.7 | 8,821 | -11% | +11% | +9% | |||||
| In million cubic feet/day | 346 | 312 | ||||||||||
| In thousand boe/day | 4.0 | 57.6 | 61.6 | 4.5 | 51.9 | 56.4 | ||||||
| Sales | ||||||||||||
| In thousand m3/day | 0.9 | 9,897 | 0.6 | 8,634 | +33% | +15% | +16% | |||||
| In million cubic feet/day | 350 | 305 | ||||||||||
| In thousand boe/day | 5.4 | 58.3 | 63.7 | 4.1 | 50.8 | 54.9 | ||||||
| Average Price | ||||||||||||
| In US$/bbl | 67.6 | 68.9 | -2% | -10% | ||||||||
| In US$/MBTU | 2.9 | 3.2 | ||||||||||
Note: The net production in Argentina. The gas volume is standardized at 9,300 kilocalories (kCal).
Our gas price in Q4 24 averaged US$2.9 per MBTU (-10% vs. Q4 23, -35% vs. Q3 24 due to seasonality), primarily explained by the lower export prices to Chile (increased hydro generation and competition with LNG) and to large users (soft demand and higher spot supply). These effects were partially offset by higher retail prices, which were in line with the tariff increases. As a result, Plan Gas compensation fell 76% vs. Q4 23 to US$2 million.
Regarding our gas deliveries, during Q4 24, 68% was destined for thermal power generation and 13% to distribution companies, both under Plan Gas. 12% supplied the industrial/spot market, 3% was exported, and the 4% remaining was sold to our petchem plants as raw material. Compared to Q4 23, 55% was destined for thermal power units, 20% supplied the retail segment, 15% was sold to the industrial/spot market, 5% was exported, and the remaining 4% was sold to our petchem plants.
Oil production reached 4.0 kbpd in Q4 24 (-11% vs. Q4 23, -27% vs. Q3 24), explained by the sale of our non-operator stake at Gobernador Ayala in October 2024 (-0.7 kbpd), in addition to year-on-year decreases in El Tordillo (-0.3 kbpd) and Los Blancos (-0.4 kbpd). The rising shale oil production at Rincón de Aranda (+1.0 kbpd) partially offset these effects.
Our oil price in Q4 24 decreased by 2% year-on-year to US$67.6 per barrel, mainly explained by lower export prices. 59% of our sales volume was destined for the domestic market, similar to Q4 23.
By the end of Q4 24, we accounted for 688 productive wells vs. 813 as of the end of 2023. The divestment of our stake at Gobernador Ayala and the derecognition of unproductive wells at Rincón del Mangrullo explain the decrease.
| Pampa Energía ● Earnings release Q4 24 ● 12 |
| |
Pampa’s proven reserves (P1) amounted to 231 mboe by the end of fiscal year 2024, 16% higher than the 199 mboe recorded by the end of 2023. The higher shale reserve quantification from the Vaca Muerta formation mainly explains this increase, boosted by drilling and completion activity in Sierra Chata (+40%/+19 mboe vs. Dec-23) and El Mangrullo (+9%/+8 mboe vs. Dec-23), in addition to the testing results in Rincón de Aranda (5.7x/+10 mboe vs. Dec-23). As a result, certified shale volume surged 60% in 2024 to 132 mboe, representing 57% of Pampa’s P1 reserves (vs. 42% of the 2023 P1 reserves). 91% of shale reserves are natural gas.
Given the increased output and the reserve additions, the reserve replacement ratio reached 2.2x, with an average reserve life of approximately 8.6 years. 93% of proven reserves correspond to natural gas, while 7% are crude oil.

The lifting cost4 recorded US$49 million in Q4 24 (+28% vs. Q4 23, similar to Q3 24), explained by the beginning of shale oil development in Rincón de Aranda and programmed overhauls in El Mangrullo, Sierra Chata and El Tordillo. The lifting cost per boe rose 18% to US$8.7 per boe produced in Q4 24 vs. US$7.4 per boe in Q4 23, mainly due to Rincón de Aranda development, and a 45% increase vs. Q3 24 due to seasonal production variations.
Other operating costs in Q4 24, excluding depreciation and amortizations, included the derecognition of unproductive wells in Rincón del Mangrullo, higher costs from sales of crude oil stock and, to a lesser extent, increased labor, benefits and transportation costs.
About other operating income and expenses, in Q4 24, we recorded lower revenue from export settlements at a differential FX, from US$12 million to US$1 million, explained by the narrowing gap between official and financial FX, and a 76% year-on-year decrease in Plan Gas compensation to US$2 million, due to higher prices for distribution companies, leading to increased retail sales.
Financial results in Q4 24 recorded net losses of US$18 million, a 74% improvement vs. Q4 23, mainly explained by lower FX losses due to reduced devaluation impact on AR$ trade receivables and lower financial interests reflecting smaller AR$-debt stock and a drop in US$ rates. Lower gains from holding financial securities partially offset these effects.
4 It only considers maintenance, treatment, internal transportation and wellhead staff costs. It does not include amortizations and depreciations.
| Pampa Energía ● Earnings release Q4 24 ● 13 |
| |
| Reconciliation of adjusted EBITDA from oil & gas, in US$ million | Fiscal year | Fourth quarter | ||||
| 2024 | 2023 | 2024 | 2023 | |||
| Consolidated operating income | 69 | 140 | (53) | (26) | ||
| Consolidated depreciations and amortizations | 237 | 166 | 54 | 41 | ||
| Reporting EBITDA | 306 | 306 | 1 | 15 | ||
| Deletion of PPE & inventories' impairment | 34 | 38 | 15 | 38 | ||
| Deletion of gain from commercial interests | (21) | (11) | (3) | (4) | ||
| Deletion of provision for well closing | 1 | 8 | 1 | 1 | ||
| Deletion of CAMMESA's receivable impairment | 4 | (1) | - | (1) | ||
| Deletion of Rincón del Mangrullo's unproductive wells | 20 | - | 20 | - | ||
| Deletion of deferred executive compensation payment | 3 | - | 3 | - | ||
| Adjusted EBITDA from oil & gas | 346 | 340 | 36 | 49 | ||
Our oil and gas adjusted EBITDA amounted to US$36 million in Q4 24 (-26% vs. Q4 23), mainly explained by lower income from the FX settlement of exports, sales to industries and exports, and higher operating costs related to the development of Rincón de Aranda. Higher Plan Gas deliveries, in line with the increased demand for thermal power, partially offset these effects. The adjusted EBITDA excludes non-recurring and non-cash income and expenses, as well as overdue interests, which are mainly charged to CAMMESA.
Finally, capital expenditures amounted to US$111 million in Q4 24 (-35% vs. Q4 23), mainly because of the shale gas deployment during 2023, partially offset by the beginning of the shale oil development in Rincón de Aranda.
| Pampa Energía ● Earnings release Q4 24 ● 14 |
| |
| 3.3 | Analysis of the power generation segment |
| Power generation segment, consolidated Figures in US$ million | Fiscal year | Fourth quarter | ||||||
| 2024 | 2023 | ∆% | 2024 | 2023 | ∆% | |||
| Sales revenue | 672 | 648 | +4% | 167 | 141 | +18% | ||
| Cost of sales | (367) | (354) | +4% | (107) | (79) | +35% | ||
| Gross profit | 305 | 294 | +4% | 60 | 62 | -3% | ||
| Selling expenses | (3) | (2) | +50% | (1) | (1) | - | ||
| Administrative expenses | (52) | (50) | +4% | (13) | (12) | +8% | ||
| Other operating income | 35 | 75 | -53% | 1 | 25 | -96% | ||
| Other operating expenses | (14) | (27) | -48% | (3) | (3) | - | ||
| Impairment of financial assets | (46) | - | NA | - | - | NA | ||
| Results for participation in joint businesses | (21) | (18) | +17% | 7 | (27) | NA | ||
| Operating income | 204 | 272 | -25% | 51 | 44 | +16% | ||
| Finance income | 8 | 2 | +300% | 5 | - | NA | ||
| Finance costs | (53) | (119) | -55% | (14) | (27) | -48% | ||
| Other financial results | 183 | 280 | -35% | 81 | 59 | +37% | ||
| Financial results, net | 138 | 163 | -15% | 72 | 32 | +125% | ||
| Profit before tax | 342 | 435 | -21% | 123 | 76 | +62% | ||
| Income tax | 119 | (225) | NA | 10 | (177) | NA | ||
| Net income for the period | 461 | 210 | +120% | 133 | (101) | NA | ||
| Attributable to owners of the Company | 461 | 207 | +123% | 133 | (103) | NA | ||
| Attributable to non-controlling interests | - | 3 | -100% | - | 2 | -100% | ||
| Adjusted EBITDA | 390 | 377 | +4% | 86 | 80 | +7% | ||
| Adjusted EBITDA at our share ownership | 389 | 378 | +3% | 85 | 80 | +7% | ||
| Increases in PPE | 105 | 259 | -59% | 38 | 66 | -42% | ||
| Depreciation and amortization | 100 | 96 | +4% | 29 | 22 | +32% | ||
During Q4 24, power generation sales increased by 18% year-on-year, mainly due to the gradual commissioning of PEPE 6, which reached 140 MW of total installed capacity in November 2024, in addition to the operational improvements in our PPAs with CAMMESA and higher spot energy prices, supported by successive increases that outpaced the inflation and devaluation. For open cycles (GT and ST), capacity payment averaged US$5.1 thousand per MW-month (+41% vs. Q4 23, +6% vs. Q3 24), also benefitted with the additional remuneration under the Contingency Plan effective from December 2024 to March 2026 (Res. SE No. 294/24). Hydros earned US$2.4 thousand per MW-month (+21% vs Q4 23, +6% vs. Q3 24). CCGTs invoiced US$3.5 thousand per MW-month (-23% vs. Q4 23, -34% vs. Q3 24) due to programmed overhauls at CTLL and the life extension in CTGEBA. CCGTs are the only units under the legacy pricing scheme with a partial income in US$ (Res. SE No. 59/23).
Higher recognition of fuel costs and gas and electricity transportation tariffs resulted from increased thermal demand, offset by associated costs.
A slight drop in legacy and Energía Plus dispatches partially offset increased sales. Compared to Q3 24, the 9% decrease in sales was driven by lower thermal generation and seasonally lower legacy energy prices.
The operating performance of Pampa’s operated power generation decreased by 4% vs. Q4 23, which is in line with the 2% year-on-year drop in national generation. This decrease was mainly attributed to a major overhaul in CTGEBA for life extension (-725 GWh) and lower water inflows at HPPL (-103 GWh). These effects were partially offset by increased availability at CTLL following the GT05 outage during Q4 23 (+340 GWh), the full commissioning of PEPE 6 (+125 GWh) and improved hydrological conditions at HINISA and HIDISA (+111 GWh).
| Pampa Energía ● Earnings release Q4 24 ● 15 |
| |
The availability of Pampa’s operated units improved 79 basis points, reaching 94.2% in Q4 24, compared to Q4 23’s 93.4%, explained by Q4 23’s failure in GT05 and scheduled overhauls in GT02 and GT04 at CTLL, in addition to outages in CTG. These effects were partially offset by the life extension overhaul in CTGEBA’s legacy CCGT. Thermal availability rate remained stable at 92.4% during Q4 24.
| Power generation's key performance indicators | 2024 | 2023 | Variation | ||||||||||||
| Wind | Hydro | Thermal | Total | Wind | Hydro | Thermal | Total | Wind | Hydro | Thermal | Total | ||||
| Installed capacity (MW) | 427 | 938 | 4,107 | 5,472 | 287 | 938 | 4,107 | 5,332 | +49% | - | - | +3% | |||
| New capacity (%) | 100% | - | 33% | 32% | 100% | - | 33% | 31% | - | - | - | +2% | |||
| Market share (%) | 1.0% | 2.2% | 9.5% | 12.6% | 0.7% | 2.1% | 9.4% | 12.2% | +0% | +0% | +0% | +0% | |||
| Fiscal year | |||||||||||||||
| Net generation (GWh) | 1,270 | 2,363 | 18,111 | 21,743 | 1,206 | 1,964 | 17,809 | 20,979 | +5% | +20% | +2% | +4% | |||
| Volume sold (GWh) | 1,280 | 2,363 | 18,914 | 22,557 | 1,223 | 1,964 | 18,842 | 22,029 | +5% | +20% | +0% | +2% | |||
| Average price (US$/MWh) | 71 | 15 | 36 | 36 | 71 | 16 | 35 | 35 | -0% | -7% | +4% | +2% | |||
| Average gross margin (US$/MWh) | 58 | 6 | 22 | 23 | 61 | 4 | 21 | 22 | -5% | +62% | +5% | +3% | |||
| Fourth quarter | |||||||||||||||
| Net generation (GWh) | 431 | 722 | 3,644 | 4,797 | 293 | 715 | 4,009 | 5,017 | +47% | +1% | -9% | -4% | |||
| Volume sold (GWh) | 436 | 722 | 3,859 | 5,018 | 310 | 715 | 4,187 | 5,211 | +41% | +1% | -8% | -4% | |||
| Average price (US$/MWh) | 71 | 15 | 41 | 40 | 69 | 12 | 35 | 34 | +3% | +30% | +18% | +19% | |||
| Average gross margin (US$/MWh) | 50 | 7 | 23 | 23 | 58 | 1 | 22 | 21 | -14% | na | +5% | +9% | |||
Note: Gross margin before amortization and depreciation. It includes CTEB (co-operated by Pampa, 50% equity stake). PEMC was de-consolidated in August 2023.
Excluding depreciation and amortizations, net operating costs increased by 96% to US$94 million in Q4 24, mainly explained by lower overdue interests from CAMMESA due to declining rates and days sales outstanding, higher raw material and maintenance costs in thermal units and increased labor costs. Moreover, higher gas purchases and gas and electricity transportation costs were offset by the revenue recognition mentioned before. Lower insurance costs partially offset these increases. Compared to Q3 24, operating costs rose by 7% due to increased maintenance, raw material and labor expenses, partially offset by reduced purchases to cover contracts.
Financial results in Q4 24 reached a net profit of US$72 million, compared to US$32 million in Q4 23, mainly due to lower FX losses on AR$ trade receivables and reduced financial interests because of lower AR$-debt and declining US$ rates, partially offset by lesser gains from holding financial instruments.
| Reconciliation of adjusted EBITDA from power generation, in US$ million | Fiscal year | Fourth quarter | ||||
| 2024 | 2023 | 2024 | 2023 | |||
| Consolidated operating income | 204 | 272 | 51 | 44 | ||
| Consolidated depreciations and amortizations | 100 | 96 | 29 | 22 | ||
| Reporting EBITDA | 304 | 368 | 80 | 66 | ||
| Deletion of CTEB's equity income | 21 | 18 | (7) | 27 | ||
| Deletion of commercial interests to CAMMESA | (29) | (59) | (1) | (18) | ||
| Deletion of CAMMESA's receivable impairment | 32 | (12) | - | (12) | ||
| Deletion of PPE activation in operating expenses | 3 | 4 | 1 | 2 | ||
| Deletion of provision in hydros | 6 | 6 | 1 | 1 | ||
| CTEB's EBITDA, at our 50% ownership | 53 | 51 | 13 | 14 | ||
| Adjusted EBITDA from power generation | 390 | 377 | 86 | 80 | ||
Adjusted EBITDA from the power generation segment was US$86 million, a 7% increase year-on-year, mainly due to the impairment of CAMMESA trade receivables recorded in Q4 23, the full commissioning of PEPE 6, the operating improvement in our PPAs with CAMMESA and higher spot prices. Increased operating costs in line with the AR$ real appreciation partially offset these effects. Adjusted EBITDA excludes non-operating, non-recurrent and non-cash items and considers CTEB’s 50% ownership, which posted US$13 million in Q4 24, 10% lower than in Q4 23.
| Pampa Energía ● Earnings release Q4 24 ● 16 |
| |
Finally, excluding CTEB, capital expenditures registered US$38 million in Q4 24 vs. US$66 million in Q4 23, explained by the completion of works at PEPE 4 (commissioned in Q4 23), partially offset by the final disbursements for PEPE 6. The PEPE 6 project is detailed below:
| Project | MW | Equipment Provider | Market | Currency | Investment in US$ million1 | Commercial operations date | ||
| Budget | % Executed @ 12/31/24 | |||||||
| Renewable | ||||||||
| Pampa Energía 6 | 139.5 | Vestas | MAT ER | US$ | 250 | 82% | November 21, 2024 | |
Note: 1 Without value-added tax.
| 3.4 | Analysis of the petrochemicals segment |
| Petrochemicals segment, consolidated Figures in US$ million | Fiscal year | Fourth quarter | ||||||
| 2024 | 2023 | ∆% | 2024 | 2023 | ∆% | |||
| Sales revenue | 516 | 507 | +2% | 122 | 118 | +3% | ||
| Domestic sales | 326 | 359 | -9% | 80 | 86 | -8% | ||
| Foreign market sales | 190 | 148 | +28% | 43 | 32 | +34% | ||
| Cost of sales | (487) | (444) | +10% | (126) | (103) | +22% | ||
| Gross profit | 29 | 63 | -54% | (4) | 15 | NA | ||
| Selling expenses | (13) | (15) | -13% | (4) | (3) | +33% | ||
| Administrative expenses | (7) | (6) | +17% | (2) | (1) | +100% | ||
| Other operating income | 41 | 13 | +215% | 30 | 13 | +131% | ||
| Other operating expenses | (7) | (7) | - | (2) | (5) | -60% | ||
| Impairment of inventories | - | (3) | -100% | - | - | NA | ||
| Operating income | 43 | 45 | -4% | 18 | 19 | -5% | ||
| Finance income | 21 | - | NA | 21 | - | NA | ||
| Finance costs | (3) | (3) | - | - | (1) | -100% | ||
| Other financial results | 7 | 15 | -53% | 3 | 8 | -63% | ||
| Financial results, net | 25 | 12 | +108% | 24 | 7 | +243% | ||
| Profit before tax | 68 | 57 | +19% | 42 | 26 | +62% | ||
| Income tax | 4 | (27) | NA | (3) | (22) | -86% | ||
| Net income for the period | 72 | 30 | +140% | 39 | 4 | NA | ||
| Adjusted EBITDA | 21 | 53 | -61% | (7) | 20 | NA | ||
| Increases in PPE | 6 | 7 | -14% | 2 | 3 | -33% | ||
| Depreciation and amortization | 5 | 5 | - | 2 | 1 | +100% | ||
| Reconciliation of adjusted EBITDA from petrochemicals, in US$ million | Fiscal year | Fourth quarter | ||||
| 2024 | 2023 | 2024 | 2023 | |||
| Consolidated operating income | 43 | 45 | 18 | 19 | ||
| Consolidated depreciations and amortizations | 5 | 5 | 2 | 1 | ||
| Reporting EBITDA | 48 | 50 | 20 | 20 | ||
| Deletion of inventory impairment | - | 3 | - | - | ||
| Deletion of gain from commercial interests | (0) | (0) | 0 | (0) | ||
| Deletion of contingencies adjustment | (27) | - | (27) | - | ||
| Adjusted EBITDA from petrochemicals | 21 | 53 | (7) | 20 | ||
The adjusted EBITDA for the petrochemicals segment reported a loss of US$7 million in Q4 24, compared to US$20 million gain in Q4 23, mainly due to lower income from export settlements at a differential FX, which fell to US$2 million in Q4 24 compared to US$12 million during Q4 23, increased operating costs in line with the real AR$ appreciation, higher raw materials prices and lower styrenics and reformer prices. These effects were partially offset by higher dispatched volumes of reformer products and increased SBR exports and prices.
| Pampa Energía ● Earnings release Q4 24 ● 17 |
| |
Total volume sold increased by 29% vs. Q4 23, reaching 121 thousand tons, driven by stronger demand for octane and solvents in the domestic market, as well as higher exports of isomerized naphtha and SBR. However, soft industry activity impacted the local demand.
In Q4 24, financial results from the petrochemicals segment reached a profit of US$24 million, compared to US$7 million in Q4 23, mainly explained by lower contingencies.
| Petrochemicals' key performance indicators | Products | Total | ||||
| Styrene & polystyrene1 | SBR | Reforming & others | ||||
| Fiscal year | ||||||
| Volume sold 2024 (thousand ton) | 88 | 45 | 336 | 469 | ||
| Volume sold 2023 (thousand ton) | 112 | 43 | 250 | 405 | ||
| Variation 2024 vs. 2023 | -21% | +4% | +35% | +16% | ||
| Average price 2024 (US$/ton) | 1,744 | 1,843 | 832 | 1,100 | ||
| Average price 2023 (US$/ton) | 1,886 | 1,796 | 874 | 1,251 | ||
| Variation 2024 vs. 2023 | -8% | +3% | -5% | -12% | ||
| Fourth quarter | ||||||
| Volume sold Q4 24 (thousand ton) | 24 | 12 | 85 | 121 | ||
| Volume sold Q4 23 (thousand ton) | 28 | 11 | 55 | 94 | ||
| Variation Q4 24 vs. Q4 23 | -13% | +4% | +55% | +29% | ||
| Average price Q4 24 (US$/ton) | 1,584 | 1,851 | 743 | 1,017 | ||
| Average price Q4 23 (US$/ton) | 1,966 | 1,744 | 812 | 1,264 | ||
| Variation Q4 24 vs. Q4 23 | -19% | +6% | -8% | -20% | ||
Note: 1 Includes Propylene.
| Pampa Energía ● Earnings release Q4 24 ● 18 |
| |
| 3.5 | Analysis of the holding and others segment |
| Holding and others segment, consolidated Figures in US$ million | Fiscal year | Fourth quarter | ||||||
| 2024 | 2023 | ∆% | 2024 | 2023 | ∆% | |||
| Sales revenue | 65 | 14 | NA | 36 | 3 | NA | ||
| Cost of sales | (17) | - | NA | (12) | - | NA | ||
| Gross profit | 48 | 14 | +243% | 24 | 3 | NA | ||
| Administrative expenses | (98) | (55) | +78% | (60) | (21) | +186% | ||
| Other operating income | 12 | 3 | +300% | 8 | 2 | +300% | ||
| Other operating expenses | (39) | (22) | +77% | (5) | (6) | -17% | ||
| Impairment of financial assets | - | - | NA | - | 4 | -100% | ||
| Recovery/(accrual) of impairment on intangible assets | - | 2 | -100% | - | - | NA | ||
| Income from the sale of associates | 34 | 9 | +278% | 27 | 8 | +238% | ||
| Results for participation in joint businesses | 167 | 16 | NA | 38 | (17) | NA | ||
| Operating income | 124 | (33) | NA | 32 | (27) | NA | ||
| Finance income | 1 | 7 | -86% | 1 | 2 | -50% | ||
| Finance costs | (33) | (45) | -27% | (9) | (8) | +13% | ||
| Other financial results | 32 | 278 | -88% | 7 | 121 | -94% | ||
| Financial results, net | - | 240 | -100% | (1) | 115 | NA | ||
| Profit before tax | 124 | 207 | -40% | 31 | 88 | -65% | ||
| Income tax | (33) | (95) | -65% | (21) | (81) | -74% | ||
| Net income for the period | 91 | 112 | -19% | 10 | 7 | +43% | ||
| Adjusted EBITDA | 179 | 16 | NA | 67 | (36) | NA | ||
| Increases in PPE | 7 | 5 | +40% | 3 | 1 | +200% | ||
| Depreciation and amortization | - | - | NA | - | - | NA | ||
The holding and others segment, excluding equity income from affiliates TGS and Transener, posted a lower loss on operating margin of US$6 million in Q4 24 vs. US$10 million in Q4 23, mainly explained by OCP’s sales recorded until the end of the concession and higher fees, partially offset by increased executive compensation accrual due to share price outperformance, in addition to a rise in labor costs and personal asset taxes.
In Q4 24, financial results showed a net loss of US$1 million vs. US$115 million profit in Q4 23, mainly explained by lower FX gains on tax payables, partially offset by reduced losses from holding financial instruments.
| Pampa Energía ● Earnings release Q4 24 ● 19 |
| |
| Reconciliation of adjusted EBITDA from holding and others, in US$ million | Fiscal year | Fourth quarter | ||||
| 2024 | 2023 | 2024 | 2023 | |||
| Consolidated operating income | 124 | (33) | 32 | (27) | ||
| Consolidated depreciations and amortizations | - | - | - | - | ||
| Reporting EBITDA | 124 | (33) | 32 | (27) | ||
| Deletion of equity income | (167) | (16) | (38) | 17 | ||
| Deletion of gain from commercial interests | (0) | (0) | (0) | (0) | ||
| Deletion of contigencies provision | 16 | - | - | - | ||
| Deletion of intang. assets' impairment/(recovery) | - | (2) | - | - | ||
| Deletion of deferred executive compensation payment | 43 | - | 43 | - | ||
| Deletion of the sale of associates | (34) | (9) | (27) | (8) | ||
| Deletion of gain from the end of the concession in OCP | (4) | - | (4) | - | ||
| TGS's EBITDA adjusted by ownership | 163 | 63 | 49 | (10) | ||
| Transener's EBITDA adjusted by ownership | 38 | 13 | 11 | (8) | ||
| Adjusted EBITDA from holding and others | 179 | 16 | 67 | (36) | ||
The adjusted EBITDA from our holding and others segment reached a US$67 million profit in Q4 24, compared to a US$36 million loss in Q4 23. This calculation excludes non-operating, non-recurring and non-cash items and includes the EBITDA adjusted by equity ownership in TGS and Transener.
In TGS, the EBITDA adjusted by our stake was US$49 million in Q4 24, compared to a US$10 million loss in Q4 23, mainly explained by the tariff increases in the regulated transportation business, the outperformance in the midstream segment, higher dispatched volumes of propane and butane and improved liquids prices, in addition to the lag between the sharp AR$ devaluation and average inflation in Q4 23.
In Transener, the EBITDA adjusted by our stake was US$11 million in Q4 24 vs. a US$8 million loss recorded in Q4 23, mainly due to tariff hikes and, like TGS, the impact of the steep AR$ devaluation on Q4 23’s results.
| Pampa Energía ● Earnings release Q4 24 ● 20 |
| |
| 3.6 | Analysis of the fiscal year, by subsidiary and segment |
| Subsidiary In US$ million | Fiscal year 2024 | Fiscal year 2023 | |||||||
| % Pampa | Adjusted EBITDA | Net debt3 | Net income4 | % Pampa | Adjusted EBITDA | Net debt3 | Net income4 | ||
| Oil & gas segment | |||||||||
| Pampa Energía | 100.0% | 346 | 987 | (5) | 100.0% | 340 | 884 | (47) | |
| Subtotal oil & gas | 346 | 987 | (5) | 340 | 884 | (47) | |||
| Power generation segment | |||||||||
| Diamante | 61.0% | 3 | (0) | 1 | 61.0% | 1 | (0) | 2 | |
| Los Nihuiles | 52.0% | (0) | (0) | (0) | 52.0% | (3) | (0) | 6 | |
| VAR | 100.0% | 22 | (0) | 15 | 100.0% | 22 | 0 | 8 | |
| Greenwind1 | 0.0% | - | - | - | 100.0% | 11 | - | 3 | |
| CTBSA | 107 | 33 | (41) | 102 | 117 | (36) | |||
| Non-controlling stake adjustment | (53) | (16) | 21 | (51) | (58) | 18 | |||
| Subtotal CTBSA adjusted by ownership | 50.0% | 53 | 16 | (21) | 50.0% | 51 | 58 | (18) | |
| Pampa stand-alone, other companies, & adj.2 | 312 | (590) | 465 | 295 | (270) | 205 | |||
| Subtotal power generation | 390 | (573) | 461 | 377 | (211) | 207 | |||
| Petrochemicals segment | |||||||||
| Pampa Energía | 100.0% | 21 | - | 72 | 100.0% | 53 | - | 30 | |
| Subtotal petrochemicals | 21 | - | 72 | 53 | - | 30 | |||
| Holding & others segment | |||||||||
| Transener | 143 | (97) | 68 | 48 | (20) | 8 | |||
| Non-controlling stake adjustment | (105) | 72 | (50) | (36) | 15 | (6) | |||
| Subtotal Transener adjusted by ownership | 26.3% | 38 | (26) | 18 | 26.3% | 13 | (5) | 2 | |
| TGS | 630 | (210) | 359 | 219 | 155 | 29 | |||
| Non-controlling stake adjustment | (467) | 155 | (266) | (156) | (114) | (21) | |||
| Subtotal TGS adjusted by ownership | 25.9% | 163 | (54) | 93 | 26.5% | 63 | 41 | 8 | |
| Pampa stand-alone, other companies, & adj.2 | (21) | 13 | (20) | (60) | (0) | 102 | |||
| Subtotal holding & others | 179 | (67) | 91 | 16 | 35 | 112 | |||
| Deletions | - | 63 | - | - | (94) | - | |||
| Total consolidated | 937 | 410 | 619 | 786 | 613 | 302 | |||
| At our share ownership | 935 | 347 | 619 | 787 | 708 | 302 | |||
Note: 1 Divested in August 2023. 2 The deletion corresponds to other companies or inter-companies. 3 Net debt includes holding companies. 4 Attributable to the Company’s shareholders.
| Pampa Energía ● Earnings release Q4 24 ● 21 |
| |
| 3.7 | Analysis of the quarter, by subsidiary and segment |
| Subsidiary In US$ million | Q4 24 | Q4 23 | |||||||
| % Pampa | Adjusted EBITDA | Net debt3 | Net income4 | % Pampa | Adjusted EBITDA | Net debt3 | Net income4 | ||
| Oil & gas segment | |||||||||
| Pampa Energía | 100.0% | 36 | 987 | (76) | 100.0% | 49 | 884 | (63) | |
| Subtotal oil & gas | 36 | 987 | (76) | 49 | 884 | (63) | |||
| Power generation segment | |||||||||
| Diamante | 61.0% | 1 | (0) | 1 | 61.0% | (0) | (0) | 0 | |
| Los Nihuiles | 52.0% | 1 | (0) | 1 | 52.0% | 1 | (0) | 6 | |
| VAR | 100.0% | 7 | (0) | 6 | 100.0% | 7 | 0 | (1) | |
| CTBSA | 25 | 33 | 15 | 28 | 117 | (53) | |||
| Non-controlling stake adjustment | (13) | (16) | (8) | (14) | (58) | 27 | |||
| Subtotal CTBSA adjusted by ownership | 50.0% | 13 | 16 | 8 | 50.0% | 14 | 58 | (27) | |
| Pampa stand-alone, other companies, & adj.2 | 64 | (590) | 118 | 58 | (270) | (82) | |||
| Subtotal power generation | 86 | (573) | 133 | 80 | (211) | (103) | |||
| Petrochemicals segment | |||||||||
| Pampa Energía | 100.0% | (7) | - | 39 | 100.0% | 20 | - | 4 | |
| Subtotal petrochemicals | (7) | - | 39 | 20 | - | 4 | |||
| Holding & others segment | |||||||||
| Transener | 43 | (97) | 21 | (30) | (20) | (27) | |||
| Non-controlling stake adjustment | (32) | 72 | (16) | 22 | 15 | 20 | |||
| Subtotal Transener adjusted by ownership | 26.3% | 11 | (26) | 6 | 26.3% | (8) | (5) | (7) | |
| TGS | 194 | (210) | 129 | (38) | 155 | (58) | |||
| Non-controlling stake adjustment | (145) | 155 | (96) | 28 | (114) | 43 | |||
| Subtotal TGS adjusted by ownership | 25.5% | 49 | (54) | 33 | 26.5% | (10) | 41 | (16) | |
| Pampa stand-alone, other companies, & adj.2 | 6 | 13 | (29) | (18) | (0) | 30 | |||
| Subtotal holding & others | 67 | (67) | 10 | (36) | 35 | 7 | |||
| Deletions | - | 63 | - | - | (94) | - | |||
| Total consolidated | 182 | 410 | 106 | 114 | 613 | (155) | |||
| At our share ownership | 181 | 347 | 106 | 113 | 708 | (155) | |||
Note: 1 Divested in August 2023. 2 The deletion corresponds to other companies or inter-companies. 3 Net debt includes holding companies. 4 Attributable to the Company’s shareholders.
| Pampa Energía ● Earnings release Q4 24 ● 22 |
| |
| 4. | Appendix |
| 4.1 | Power generation’s main operational KPIs by plant |
| Power generation's key performance indicators | Wind | Hydroelectric | Subtotal hydro +wind | Thermal | Total | ||||||||||||||||||||
| PEMC1 | PEPE2 | PEPE3 | PEPE4 | PEA | PEPE62 | HINISA | HIDISA | HPPL | CTLL | CTG | CTP | CPB | CTPP | CTIW | CTGEBA | Eco- Energía | CTEB3 | Subtotal thermal | |||||||
| Installed capacity (MW) | - | 53 | 53 | 81 | 100 | 140 | 265 | 388 | 285 | 1,366 | 780 | 361 | 30 | 620 | 100 | 100 | 1,253 | 14 | 848 | 4,107 | 5,472 | ||||
| New capacity (MW) | - | 53 | 53 | 81 | 100 | 140 | - | - | - | 428 | 184 | 100 | - | - | 100 | 100 | 565 | 14 | 279 | 1,343 | 1,770 | ||||
| Market share | 0.0% | 0.1% | 0.1% | 0.2% | 0.2% | 0.3% | 0.6% | 0.9% | 0.7% | 3.2% | 1.8% | 0.8% | 0.1% | 1.4% | 0.2% | 0.2% | 2.9% | 0.03% | 2.0% | 9.5% | 13% | ||||
| Fiscal year | |||||||||||||||||||||||||
| Net generation 2024 (GWh) | - | 188 | 202 | 341 | 343 | 197 | 857 | 616 | 890 | 3,633 | 4,754 | 303 | 59 | 262 | 192 | 145 | 7,584 | 70 | 4,741 | 18,111 | 21,743 | ||||
| Market share | - | 0.1% | 0.1% | 0.2% | 0.24% | 0.14% | 0.6% | 0.4% | 0.6% | 2.6% | 3.4% | 0.2% | 0.0% | 0.2% | 0.1% | 0.1% | 5.4% | 0.0% | 3.3% | 12.8% | 15.4% | ||||
| Sales 2024 (GWh) | - | 201 | 202 | 341 | 343 | 195 | 857 | 616 | 890 | 3,643 | 4,705 | 625 | 59 | 262 | 192 | 145 | 8,043 | 150 | 4,733 | 18,914 | 22,557 | ||||
| Net generation 2023 (GWh) | 193 | 209 | 204 | 274 | 326 | - | 543 | 361 | 1,060 | 3,170 | 4,512 | 225 | 75 | 606 | 274 | 265 | 7,548 | 68 | 4,236 | 17,809 | 20,979 | ||||
| Variation 2024 vs. 2023 | -100% | -10% | -1% | +24% | +5% | na | +58% | +71% | -16% | +15% | +5% | +34% | -22% | -57% | -30% | -45% | +0% | +4% | +12% | +2% | +4% | ||||
| Sales 2023 (GWh) | 193 | 213 | 217 | 274 | 326 | - | 544 | 361 | 1,060 | 3,187 | 4,470 | 547 | 75 | 606 | 274 | 265 | 8,224 | 146 | 4,236 | 18,842 | 22,029 | ||||
| Avg. price 2024 (US$/MWh) | na | 81 | 64 | 64 | 82 | 64 | 13 | 21 | 13 | 35 | 20 | 54 | 30 | 124 | na | na | 38 | 36 | 30 | 36 | 36 | ||||
| Avg. price 2023 (US$/MWh) | 70 | 74 | 65 | 65 | 80 | na | 17 | 31 | 11 | 38 | 19 | 65 | 24 | 49 | 135 | 110 | 37 | 39 | 30 | 35 | 35 | ||||
| Avg. gross margin 2024 (US$/MWh) | na | 49 | 57 | 57 | 64 | 59 | 5 | 10 | 5 | 24 | 17 | 21 | 3 | 24 | na | 142 | 19 | 10 | 24 | 22 | 23 | ||||
| Avg. gross margin 2023 (US$/MWh) | 59 | 55 | 60 | 60 | 69 | na | 1 | 8 | 4 | 26 | 15 | 20 | 4 | 6 | 107 | 86 | 20 | 13 | 23 | 21 | 22 | ||||
| Fourth quarter | |||||||||||||||||||||||||
| Net generation Q4 24 (GWh) | - | 48 | 57 | 88 | 112 | 125 | 288 | 203 | 231 | 1,153 | 975 | 84 | 15 | 22 | 67 | 42 | 1,260 | 16 | 1,162 | 3,644 | 4,797 | ||||
| Market share | - | 0.1% | 0.2% | 0.3% | 0.33% | 0.37% | 0.8% | 0.6% | 0.7% | 3.4% | 2.9% | 0.2% | 0.0% | 0.1% | 0.2% | 0.1% | 3.7% | 0.0% | 3.4% | 10.7% | 14.1% | ||||
| Sales Q4 24 (GWh) | - | 54 | 57 | 88 | 112 | 125 | 288 | 203 | 231 | 1,159 | 973 | 152 | 15 | 22 | 67 | 42 | 1,399 | 35 | 1,154 | 3,859 | 5,018 | ||||
| Net generation Q4 23 (GWh) | - | 49 | 42 | 95 | 107 | - | 257 | 123 | 334 | 1,008 | 630 | 106 | 29 | 23 | 23 | 21 | 1,986 | 15 | 1,176 | 4,009 | 5,017 | ||||
| Variation Q4 24 vs. Q4 23 | na | -2% | +37% | -7% | +5% | na | +12% | +65% | -31% | +14% | +55% | -21% | -47% | -5% | na | +98% | -37% | +7% | -1% | -9% | -4% | ||||
| Sales Q4 23 (GWh) | - | 53 | 55 | 95 | 107 | - | 257 | 123 | 334 | 1,024 | 588 | 173 | 29 | 23 | 23 | 21 | 2,118 | 36 | 1,176 | 4,187 | 5,211 | ||||
| Avg. price Q4 24 (US$/MWh) | na | 83 | 63 | 63 | 82 | 63 | 13 | 20 | 15 | 36 | 21 | 62 | 36 | na | 135 | na | 48 | 31 | 30 | 41 | 40 | ||||
| Avg. price Q4 23 (US$/MWh) | na | 71 | 60 | 60 | 80 | na | 11 | 19 | 10 | 29 | 24 | 41 | 15 | na | na | na | 31 | 37 | 30 | 35 | 34 | ||||
| Avg. gross margin Q4 24 (US$/MWh) | na | 32 | 37 | 37 | 68 | 58 | 5 | 10 | 7 | 23 | 15 | 23 | 9 | 74 | 115 | 117 | 20 | 8 | 23 | 23 | 23 | ||||
| Avg. gross margin Q4 23 (US$/MWh) | na | 52 | 52 | 52 | 71 | na | 2 | (4) | 4 | 19 | 15 | 6 | 2 | 0 | na | na | 19 | 13 | 24 | 22 | 21 | ||||
Note: Gross margin before amortization and depreciation 1 Fully owned by Pampa from August 2022 to July 2023. 2 Progressive commissioning: 45 MW (Jul-24), 36 MW (Aug-24), 13,5 MW (Sep-24), 18 MW (Oct-24) and 27 MW (Nov-24). 3 Co-operated by Pampa (50% equity stake).
| Pampa Energía ● Earnings release Q4 24 ● 23 |
| |
| 4.2 | Production in the main oil and gas blocks |
| In kboe/day at ownership | Fiscal year | Fourth quarter | ||||||
| 2024 | 2023 | Variation | 2024 | 2023 | Variation | |||
| Gas | ||||||||
| El Mangrullo | 43.9 | 35.7 | +23% | 30.9 | 27.7 | +12% | ||
| Río Neuquén | 9.0 | 9.2 | -2% | 7.6 | 9.0 | -16% | ||
| Sierra Chata | 18.5 | 13.2 | +40% | 17.1 | 12.8 | +34% | ||
| Rincón del Mangrullo1 | 1.2 | 1.5 | -16% | 1.1 | 1.5 | -22% | ||
| Others | 0.8 | 1.1 | -25% | 0.9 | 0.9 | -6% | ||
| Total gas at working interest | 73.4 | 60.6 | +21% | 57.6 | 51.9 | +11% | ||
| Oil | ||||||||
| El Tordillo2 | 1.6 | 2.0 | -21% | 1.5 | 1.7 | -15% | ||
| Gobernador Ayala3 | 0.9 | 1.1 | -23% | 0.4 | 1.1 | -68% | ||
| Rincón de Aranda | 0.9 | - | na | 1.0 | - | na | ||
| Associated oil4 | 1.2 | 1.1 | +13% | 1.0 | 1.1 | -10% | ||
| Others | 0.2 | 0.6 | -72% | 0.1 | 0.5 | -78% | ||
| Total oil at working interest | 4.8 | 4.8 | -1% | 4.0 | 4.5 | -11% | ||
| Total | 78.2 | 65.4 | +20% | 61.6 | 56.4 | +9% | ||
Note: Production in Argentina. 1 It does not include shale formation. 2 It includes the La Tapera – Puesto Quiroga block. 3 On October 21, 2024, Pampa transferred its 22.51% stake in the concession at the Gobernador Ayala to Pluspetrol. 4 From gas fields.
| 4.3 | Proven reserves (P1), by block and hydrocarbon |
| In million boe | Oil | Natural gas | Total | Variation vs. 2023 |
| El Mangrullo | 0.1 | 89.9 | 90.0 | +9% |
| Sierra Chata | 0.2 | 67.9 | 68.1 | +40% |
| Río Neuquen | 3.0 | 52.0 | 55.0 | -1% |
| Rincón de Aranda | 11.6 | 0.8 | 12.4 | +572% |
| Agüaragüe | 0.2 | 1.8 | 2.0 | -5% |
| El Tordillo | 1.4 | 0.2 | 1.6 | -41% |
| Rincón del Mangrullo | - | 1.4 | 1.4 | -36% |
| Los Blancos | 0.7 | - | 0.7 | -10% |
| Gobernador Ayala | - | - | - | -100% |
| Total as of December 31, 2024 | 17.2 | 214.0 | 231.2 | +16% |
| Pampa Energía ● Earnings release Q4 24 ● 24 |
| |
| 5. | Glossary of terms |
| Term | Definition |
| ADR/ADS | American Depositary Receipt |
| AR$ | Argentine Pesos |
| Bbl | Barrel |
| BCRA | Banco Central de la República Argentina or Argentina’s Central Bank |
| Boe | Barrels of oil equivalent |
| ByMA | Bolsas y Mercados Argentinos or Buenos Aires Stock Exchange |
| CAMMESA | Compañía Administradora del Mercado Mayorista Eléctrico S.A. or Argentine Wholesale Electricity Market Clearing Company |
| CB | Corporate Bonds |
| 2027 CB | Corporate Bonds maturing in 2027 |
| 2031 CB | Corporate Bonds maturing in 2031 |
| 2034 CB | Corporate Bonds maturing in 2034 |
| CCGT | Combined Cycle |
| CNY | Renminbi Chinese currency |
| CPB | Piedra Buena Thermal Power Plant |
| CTBSA | CT Barragán S.A. |
| CTEB | Ensenada Barragán Thermal Power Plant |
| CTG | Güemes Thermal Power Plant |
| CTGEBA | Genelba Thermal Power Plant |
| CTIW | Ingeniero White Thermal Power Plant |
| CTLL | Loma De La Lata Thermal Power Plant |
| CTP | Piquirenda Thermal Power Plant |
| CTPP | Parque Pilar Thermal Power Plant |
| E&P | Exploration and Production |
| EBITDA | Earnings before interest, tax, depreciation and amortization |
| EcoEnergía | EcoEnergía Co-Generation Power Plant |
| ENARGAS | Ente Nacional Regulador del Gas or National Gas Regulatory Entity |
| ENARSA | Energía Argentina S.A. |
| ENRE | Ente Nacional Regulador de la Electricidad or National Electricity Regulatory Entity |
| FLNG | Floating liquefaction of natural gas |
| FS | Financial Statements |
| FX | Nominal exchange rate |
| GPM, former GPNK | Francisco Pascasio Moreno Gas Pipeline, formerly President Nestor Kirchner |
| GT | Gas turbine |
| GWh | Gigawatt-hour |
| HIDISA | Diamante Hydro Power Plant |
| HINISA | Los Nihuiles Hydro Power Plant |
| HPPL | Pichi Picun Leufu Hydro Power Plant |
| IFRS | International Financial Reporting Standards |
| Kb/kboe | Thousands of barrels/thousands of barrels of oil equivalent |
| Kbpd/kboepd | Thousands of barrels per day/thousands of barrels of oil equivalent per day |
| M3 | Cubic meter |
| MAT | Business-to-business market |
| Pampa Energía ● Earnings release Q4 24 ● 25 |
| |
| Term | Definition |
| Mboe | Million barrels of oil equivalent |
| MBTU | Million British Thermal Units |
| Mcmpd | Million cubic meters per day |
| MEM | Wholesale electricity market |
| MW/MWh | Megawatt/Megawatt-hour |
| N.a. | Not applicable |
| O/S | Share ownership |
| OCP Ecuador | Oleoducto de Crudos Pesados S.A. |
| Pampa / The Company | Pampa Energía S.A. |
| PEA | Arauco II Wind Farm, stage 1 and 2 |
| PEMC | Ingeniero Mario Cebreiro Wind Farm |
| PEPE | Pampa Energía Wind Farm |
| PIST | Punto de Ingreso al Sistema de Transporte or System Entry Point for Transportation |
| Plan Gas | Argentine Natural Gas Production Promotion Plan – 2020 – 2024 Supply and Demand Scheme (Executive Order No. 892/20, 730/22 and supplementary provisions) |
| POSA | Petrobras Operaciones S.A. |
| PPA | Power Purchase Agreement |
| PPE | Property, Plant and Equipment |
| Q3 24 | Third quarter of 2024 |
| Q4 24/Q4 23 | Fourth quarter of 2024/Fourth quarter of 2023 |
| Res. | Resolution/Resolutions |
| RIGI | Régimen de Incentivo para Grandes Inversiones or Incentive Regime for Large Investments |
| RQI | Five-year tariff review |
| SACDE | Sociedad Argentina de Construcción y Desarrollo Estratégico |
| SCEyM | Secretariat of Energy and Mining Coordination |
| SE | Secretariat of Energy |
| SESA | Southern Energy S.A. |
| SSEE | Undersecretariat of Electric Power |
| ST | Steam turbine |
| TGS | Transportadora de Gas del Sur S.A. |
| Ton | Metric ton |
| Transba | Empresa de Transporte de Energía Eléctrica por Distribución Troncal de la Provincia de Buenos Aires Transba S.A. |
| Transener | Compañía de Transporte de Energía Eléctrica en Alta Tensión Transener S.A. |
| US$ | U.S. Dollars |
| US$-link | A security in which the underlying is linked to a US$ wholesale exchange rate |
| US$-MEP | A security in which the settlement uses US$ in the domestic market |
| VMOS | Vaca Muerta Oil Sur |
| Pampa Energía ● Earnings release Q4 24 ● 26 |