PRELIMINARY & CONFIDENTIAL
Discussion Materials Regarding
Alaska Alternatives
Goldman, Sachs & Co.
September 4, 2012
Goldman Sachs does not provide accounting, tax, or legal advice. Notwithstanding anything in this document to the contrary, and except as required to enable compliance with applicable securities law, you (and each of your employees, representatives, and other agents) may disclose to any and all persons the US federal income and state tax treatment and tax structure of the transaction and all materials of any kind (including tax opinions and other tax analyses) that are provided to you relating to such tax treatment and tax structure, without Goldman Sachs imposing any limitation of any kind.
PRELIMINARY & CONFIDENTIAL
Setting the Context & Scope
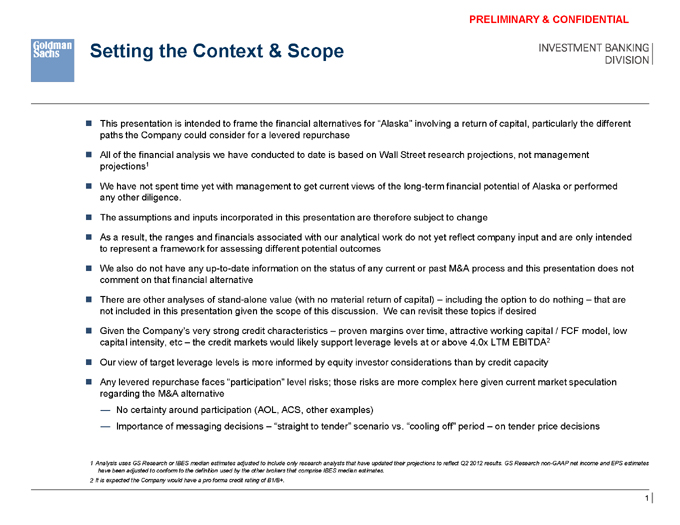
This presentation is intended to frame the financial alternatives for “Alaska” involving a return of capital, particularly the different paths the Company could consider for a levered repurchase
All of the financial analysis we have conducted to date is based on Wall Street research projections, not management projections1
We have not spent time yet with management to get current views of the long-term financial potential of Alaska or performed any other diligence.
The assumptions and inputs incorporated in this presentation are therefore subject to change
As a result, the ranges and financials associated with our analytical work do not yet reflect company input and are only intended to represent a framework for assessing different potential outcomes
We also do not have any up-to-date information on the status of any current or past M&A process and this presentation does not comment on that financial alternative
There are other analyses of stand-alone value (with no material return of capital) – including the option to do nothing – that are not included in this presentation given the scope of this discussion. We can revisit these topics if desired
Given the Company’s very strong credit characteristics – proven margins over time, attractive working capital / FCF model, low capital intensity, etc – the credit markets would likely support leverage levels at or above 4.0x LTM EBITDA2
Our view of target leverage levels is more informed by equity investor considerations than by credit capacity
Any levered repurchase faces “participation” level risks; those risks are more complex here given current market speculation regarding the M&A alternative
— No certainty around participation (AOL, ACS, other examples)
— Importance of messaging decisions – “straight to tender” scenario vs. “cooling off” period – on tender price decisions
1 Analysis uses GS Research or IBES median estimates adjusted to include only research analysts that have updated their projections to reflect Q2 2012 results. GS Research non-GAAP net income and EPS estimates have been adjusted to conform to the definition used by the other brokers that comprise IBES median estimates.
2 It is expected the Company would have a pro forma credit rating of B1/B+.
1
PRELIMINARY & CONFIDENTIAL
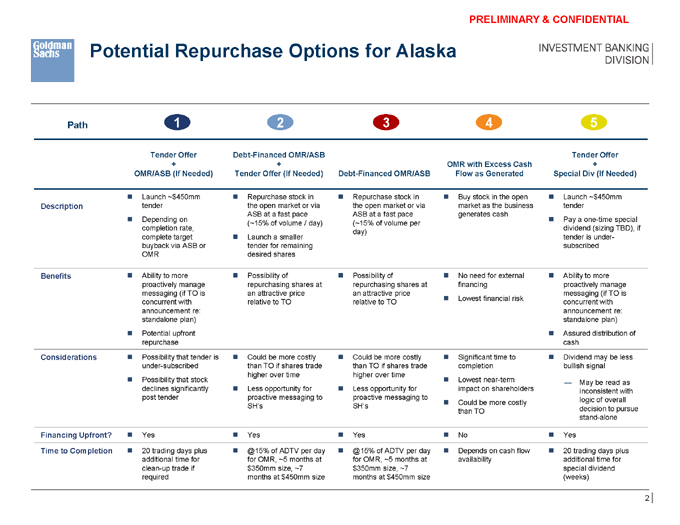
Potential Repurchase Options for Alaska
Path 1 2 3 4 5
Tender Offer Debt-Financed OMR/ASB Tender Offer
+ + OMR with Excess Cash +
OMR/ASB (If Needed) Tender Offer (If Needed) Debt-Financed OMR/ASB Flow as Generated Special Div (If Needed)
Launch ~$450mm Repurchase stock in Repurchase stock in Buy stock in the open Launch ~$450mm Description tender the open market or via the open market or via market as the business tender ASB at a fast pace ASB at a fast pace generates cash Depending on Pay a one-time special (~15% of volume / day) (~15% of volume per completion rate, dividend (sizing TBD), if day) complete target Launch a smaller tender is under-buyback via ASB or tender for remaining subscribed OMR desired shares
Benefits Ability to more Possibility of Possibility of No need for external Ability to more proactively manage repurchasing shares at repurchasing shares at financing proactively manage messaging (if TO is an attractive price an attractive price messaging (if TO is Lowest financial risk concurrent with relative to TO relative to TO concurrent with announcement re: announcement re: standalone plan) standalone plan) Potential upfront Assured distribution of repurchase cash
Considerations Possibility that tender is Could be more costly Could be more costly Significant time to Dividend may be less under-subscribed than TO if shares trade than TO if shares trade completion bullish signal higher over time higher over time Possibility that stock Lowest near-term — May be read as declines significantly Less opportunity for Less opportunity for impact on shareholders inconsistent with post tender proactive messaging to proactive messaging to logic of overall Could be more costly SH’s SH’s decision to pursue than TO stand-alone
Financing Upfront? Yes Yes Yes No Yes
Time to Completion 20 trading days plus @15% of ADTV per day @15% of ADTV per day Depends on cash flow 20 trading days plus additional time for for OMR, ~5 months at for OMR, ~5 months at availability additional time for clean-up trade if $350mm size, ~7 $350mm size, ~7 special dividend required months at $450mm size months at $450mm size (weeks)
2
PRELIMINARY & CONFIDENTIAL
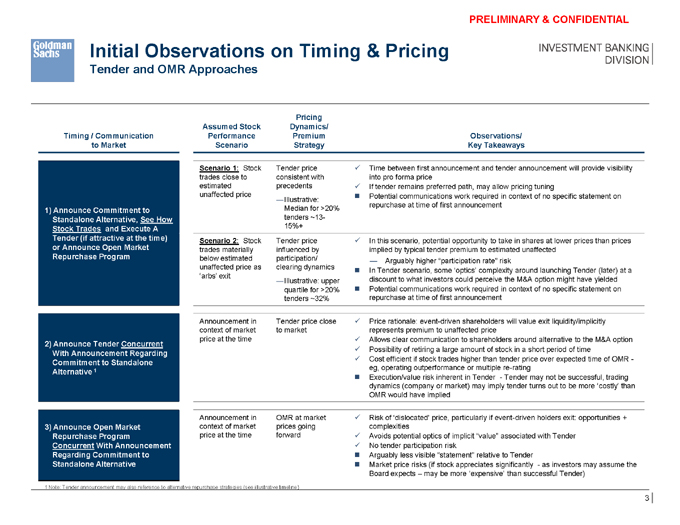
Initial Observations on Timing & Pricing
Tender and OMR Approaches
Pricing Assumed Stock Dynamics/
Timing / Communication Performance Premium Observations/ to Market Scenario Strategy Key Takeaways
Scenario 1: Stock Tender price ü Time between first announcement and tender announcement will provide visibility trades close to consistent with into pro forma price estimated precedents ü If tender remains preferred path, may allow pricing tuning unaffected price n Potential communications work required in context of no specific statement on
—Illustrative: repurchase at time of first announcement
1) Announce Commitment to Median for >20% Standalone Alternative, See How tenders ~13-Stock Trades and Execute A 15%+
Tender (if attractive at the time) Scenario 2: Stock Tender price ü In this scenario, potential opportunity to take in shares at lower prices than prices or Announce Open Market trades materially influenced by implied by typical tender premium to estimated unaffected Repurchase Program below estimated participation/ unaffected price as clearing dynamics — Arguably higher “participation rate” risk n In Tender scenario, some ‘optics’ complexity around launching Tender (later) at a ‘arbs’ exit
—Illustrative: upper discount to what investors could perceive the M&A option might have yielded quartile for >20% n Potential communications work required in context of no specific statement on tenders ~32% repurchase at time of first announcement
Announcement in Tender price close ü Price rationale: event-driven shareholders will value exit liquidity/implicitly context of market to market represents premium to unaffected price price at the time ü Allows clear communication to shareholders around alternative to the M&A option
2) Announce Tender Concurrent
ü Possibility of retiring a large amount of stock in a short period of time
With Announcement Regarding
ü Cost efficient if stock trades higher than tender price over expected time of OMR -
Commitment to Standalone
1 eg, operating outperformance or multiple re-rating
Alternative
n Execution/value risk inherent in Tender - Tender may not be successful, trading dynamics (company or market) may imply tender turns out to be more ‘costly’ than
OMR would have implied
Announcement in OMR at market ü Risk of ‘dislocated’ price, particularly if event-driven holders exit: opportunities +
3) Announce Open Market context of market prices going complexities
Repurchase Program price at the time forward ü Avoids potential optics of implicit “value” associated with Tender
Concurrent With Announcement ü No tender participation risk
Regarding Commitment to n Arguably less visible “statement” relative to Tender
Standalone Alternative n Market price risks (if stock appreciates significantly - as investors may assume the
Board expects – may be more ‘expensive’ than successful Tender)
1 Note: Tender announcement may also reference to alternative repurchase strategies (see illustrative timeline)
3
PRELIMINARY & CONFIDENTIAL
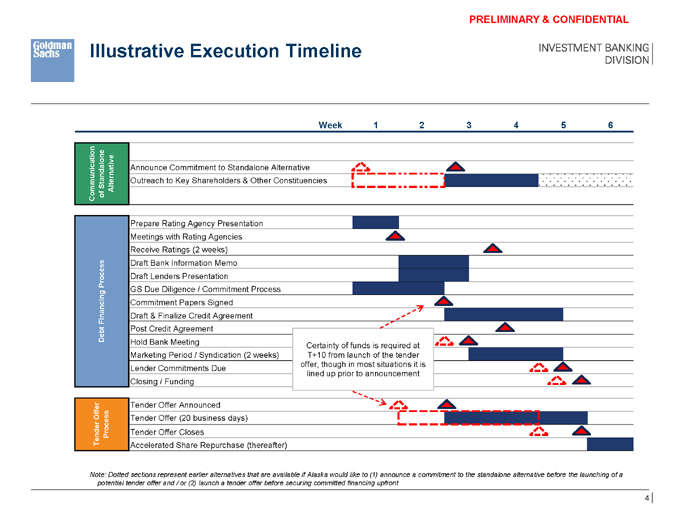
Illustrative Execution Timeline
Week 1 2 3 4 5 6
ion at Announce Commitment to Standalone Alternative Standalone Outreach to Key Shareholders & Other Constituencies
Communic of Alternative
Prepare Rating Agency Presentation Meetings with Rating Agencies Receive Ratings (2 weeks) Draft Bank Information Memo Process Draft Lenders Presentation GS Due Diligence / Commitment Process Commitment Papers Signed Financing Draft & Finalize Credit Agreement Debt Post Credit Agreement
Hold Bank Meeting Certainty of funds is required at Marketing Period / Syndication (2 weeks) T+10 from launch of the tender offer, though in most situations it is Lender Commitments Due lined up prior to announcement Closing / Funding
Offer Tender Offer Announced
Tender Offer (20 business days) Tender Process Tender Offer Closes
Accelerated Share Repurchase (thereafter)
Note: Dotted sections represent earlier alternatives that are available if Alaska would like to (1) announce a commitment to the standalone alternative before the launching of a potential tender offer and / or (2) launch a tender offer before securing committed financing upfront
4
PRELIMINARY & CONFIDENTIAL
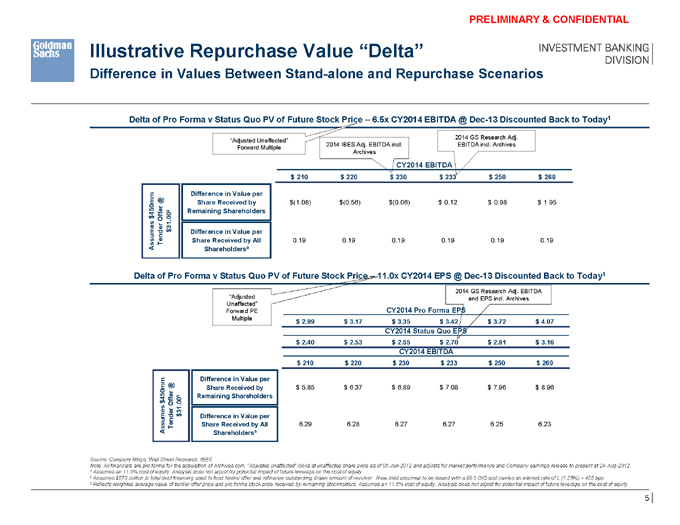
Illustrative Repurchase Value “Delta”
Difference in Values Between Stand-alone and Repurchase Scenarios
Delta of Pro Forma v Status Quo PV of Future Stock Price – 6.5x CY2014 EBITDA @ Dec-13 Discounted Back to Today1
2014 GS Research Adj.
“Adjusted Unaffected”
2014 IBES Adj. EBITDA incl. EBITDA incl. Archives Forward Multiple Archives
CY2014 EBITDA $ 210 $ 220 $ 230 $ 233 $ 250 $ 269
Difference in Value per m @
Share Received by $(1.08) $(0.56) $(0.06) $ 0.12 $ 0.98 $ 1.95
450m ffer Remaining Shareholders $ O es 31.00² nder $ Difference in Value per
Assum Te Share Received by All 0.19 0.19 0.19 0.19 0.19 0.19 Shareholders³
Delta of Pro Forma v Status Quo PV of Future Stock Price – 11.0x CY2014 EPS @ Dec-13 Discounted Back to Today1
“Adjusted 2014 GS Research Adj. EBITDA Unaffected” and EPS incl. Archives
Forward PE CY2014 Pro Forma EPS
Multiple $ 2.99 $ 3.17 $ 3.35 $ 3.42 $ 3.72 $ 4.07
CY2014 Status Quo EPS $ 2.40 $ 2.53 $ 2.65 $ 2.70 $ 2.91 $ 3.16
CY2014 EBITDA $ 210 $ 220 $ 230 $ 233 $ 250 $ 269
Difference in Value per @
Share Received by $ 5.85 $ 6.37 $ 6.89 $ 7.08 $ 7.96 $ 8.96 r 450mm ffe ² Remaining Shareholders $ O
31.00 $ Difference in Value per
Assumes Tender Share Received by All 6.29 6.28 6.27 6.27 6.25 6.23 Shareholders³
Source: Company filings; Wall Street Research; IBES
Note: All financials are pro forma for the acquisition of Archives.com. “Adjusted unaffected” looks at unaffected share price as of 05-Jun-2012 and adjusts for market performance and Company earnings release to present at 24-Aug-2012.
1 Assumes an 11.5% cost of equity. Analysis does not adjust for potential impact of future leverage on the cost of equity.
2 Assumes $570 million in total debt financing used to fund tender offer and refinance outstanding drawn amount of revolver. New debt assumed to be issued with a 99.0 OID and carries an interest rate of L (1.25%) + 425 bps.
3 Reflects weighted average value of tender offer price and pro forma stock price received by remaining stockholders. Assumes an 11.5% cost of equity. Analysis does not adjust for potential impact of future leverage on the cost of equity.
5
PRELIMINARY & CONFIDENTIAL
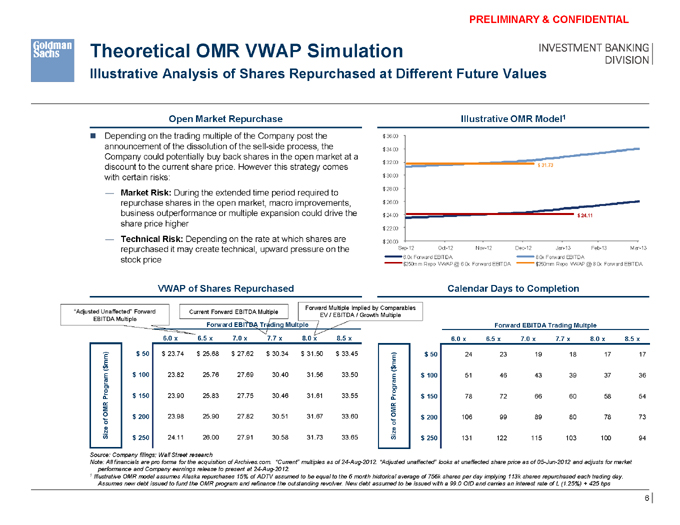
Theoretical OMR VWAP Simulation
Illustrative Analysis of Shares Repurchased at Different Future Values
Open Market Repurchase Illustrative OMR Model1
Depending on the trading multiple of the Company post the $ 36.00 announcement of the dissolution of the sell-side process, the $ 34.00 Company could potentially buy back shares in the open market at a $ 32.00 discount to the current share price. However this strategy comes $ 31.73 with certain risks: $ 30.00
— Market Risk: During the extended time period required to $ 28.00 repurchase shares in the open market, macro improvements, $ 26.00 business outperformance or multiple expansion could drive the $ 24.00 $ 24.11 share price higher
$ 22.00
— Technical Risk: Depending on the rate at which shares are $ 20.00 repurchased it may create technical, upward pressure on the Sep-12 Oct-12 Nov-12 Dec-12 Jan-13 Feb-13 Mar-13
stock price 6.0x Forward EBITDA 8.0x Forward EBITDA $250mm Repo VWAP @ 6.0x Forward EBITDA $250mm Repo VWAP @ 8.0x Forward EBITDA
VWAP of Shares Repurchased Calendar Days to Completion
Forward Multiple Implied by Comparables “Adjusted Unaffected” Forward Current Forward EBITDA Multiple EV / EBITDA / Growth Multiple
EBITDA Multiple Forward EBITDA Trading Multple
Forward EBITDA Trading Multple
$ 23.98 6.0 x 6.5 x 7.0 x 7.7 x 8.0 x 8.5 x $ 106.00 6.0 x 6.5 x 7.0 x 7.7 x 8.0 x 8.5 x mm) $ 50 $ 23.74 $ 25.68 $ 27.62 $ 30.34 $ 31.50 $ 33.45 m) $ 50 24 23 19 18 17 17 m
( $ $ ( m $ 100 23.82 25.76 27.69 30.40 31.56 33.50 $ 100 51 46 43 39 37 36 Progra $ 150 23.90 25.83 27.75 30.46 31.61 33.55 Program $ 150 78 72 66 60 58 54
OMR OMR $ 200 23.98 25.90 27.82 30.51 31.67 33.60 $ 200 106 99 89 80 78 73 of o f Size $ 250 24.11 26.00 27.91 30.58 31.73 33.65 Size $ 250 131 122 115 103 100 94
Source: Company filings; Wall Street research
Note: All financials are pro forma for the acquisition of Archives.com. “Current” multiples as of 24-Aug-2012. “Adjusted unaffected” looks at unaffected share price as of 05-Jun-2012 and adjusts for market performance and Company earnings release to present at 24-Aug-2012.
1 Illustrative OMR model assumes Alaska repurchases 15% of ADTV assumed to be equal to the 6 month historical average of 756k shares per day implying 113k shares repurchased each trading day.
Assumes new debt issued to fund the OMR program and refinance the outstanding revolver. New debt assumed to be issued with a 99.0 OID and carries an interest rate of L (1.25%) + 425 bps
6
PRELIMINARY & CONFIDENTIAL
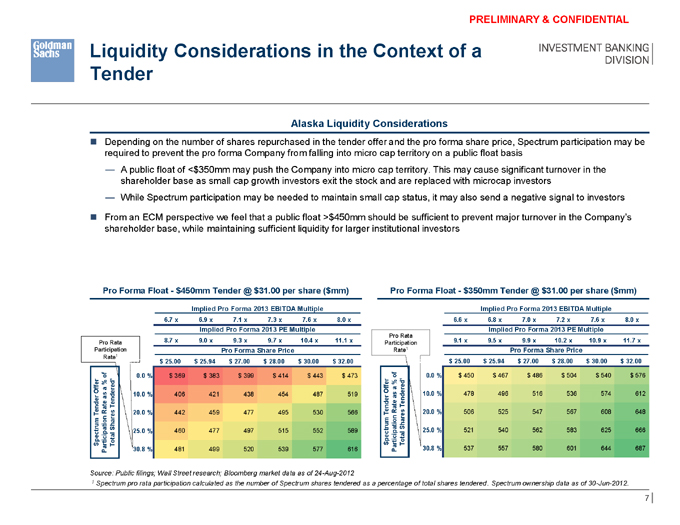
Liquidity Considerations in the Context of a Tender
Alaska Liquidity Considerations
Depending on the number of shares repurchased in the tender offer and the pro forma share price, Spectrum participation may be required to prevent the pro forma Company from falling into micro cap territory on a public float basis
— A public float of <$350mm may push the Company into micro cap territory. This may cause significant turnover in the shareholder base as small cap growth investors exit the stock and are replaced with microcap investors
— While Spectrum participation may be needed to maintain small cap status, it may also send a negative signal to investors
From an ECM perspective we feel that a public float >$450mm should be sufficient to prevent major turnover in the Company’s shareholder base, while maintaining sufficient liquidity for larger institutional investors
Pro Forma Float - $450mm Tender @ $31.00 per share ($mm) Pro Forma Float - $350mm Tender @ $31.00 per share ($mm)
Implied Pro Forma 2013 EBITDA Multiple Implied Pro Forma 2013 EBITDA Multiple
6.7 x 6.9 x 7.1 x 7.3 x 7.6 x 8.0 x 6.6 x 6.8 x 7.0 x 7.2 x 7.6 x 8.0 x
Implied Pro Forma 2013 PE Multiple Implied Pro Forma 2013 PE Multiple
8.7 x 9.0 x 9.3 x 9.7 x 10.4 x 11.1 x Pro Rata 9.1 x 9.5 x 9.9 x 10.2 x 10.9 x 11.7 x
Pro Rata Participation
Participation Pro Forma Share Price Rate1 Pro Forma Share Price
Rate1 $552.04 $ 25.00 $ 25.94 $ 27.00 $ 28.00 $ 30.00 $ 32.00 $624.61 $ 25.00 $ 25.94 $ 27.00 $ 28.00 $ 30.00 $ 32.00 of of 0.0 % $ 369 $ 383 $ 399 $ 414 $ 443 $ 473 0.0 % $ 450 $ 467 $ 486 $ 504 $ 540 $ 576
¹ r % % red¹ ffer a red a Offe e O s
10.0 % 406 421 438 454 487 519 10.0 % 478 496 516 536 574 612 r as a Tend Tende Rate Rate 20.0 % 442 459 477 495 530 566 20.0 % 506 525 547 567 608 648
Tende Tender n n res tio Shares tio Sha
25.0 % 460 477 497 515 552 589 ctrumtal 25.0 % 521 540 562 583 625 666 rticipa tal Spe Spectrum To To Pa 30.8 % 481 499 520 539 577 616 Participa 30.8 % 537 557 580 601 644 687
Source: Public filings; Wall Street research; Bloomberg market data as of 24-Aug-2012
1 Spectrum pro rata participation calculated as the number of Spectrum shares tendered as a percentage of total shares tendered. Spectrum ownership data as of 30-Jun-2012.
7
PRELIMINARY & CONFIDENTIAL
Tender Precedents
Overview of Select Precedents Involving Repurchase of >20% of SO
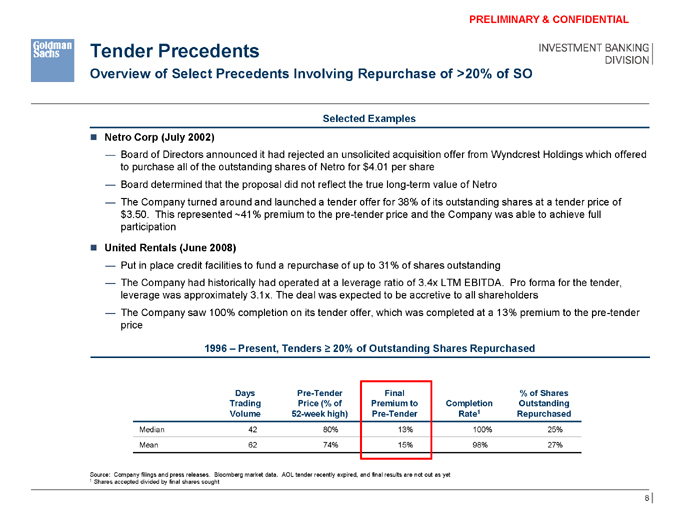
Selected Examples n Netro Corp (July 2002)
— Board of Directors announced it had rejected an unsolicited acquisition offer from Wyndcrest Holdings which offered to purchase all of the outstanding shares of Netro for $4.01 per share
— Board determined that the proposal did not reflect the true long-term value of Netro
— The Company turned around and launched a tender offer for 38% of its outstanding shares at a tender price of $3.50. This represented ~41% premium to the pre-tender price and the Company was able to achieve full participation
n United Rentals (June 2008)
— Put in place credit facilities to fund a repurchase of up to 31% of shares outstanding
— The Company had historically had operated at a leverage ratio of 3.4x LTM EBITDA. Pro forma for the tender, leverage was approximately 3.1x. The deal was expected to be accretive to all shareholders
— The Company saw 100% completion on its tender offer, which was completed at a 13% premium to the pre-tender price
1996 – Present, Tenders = 20% of Outstanding Shares Repurchased
Days Pre-Tender Final % of Shares Trading Price (% of Premium to Completion Outstanding Volume 52-week high) Pre-Tender Rate1 Repurchased
Median 42 80% 13% 100% 25%
Mean 62 74% 15% 98% 27%
Source: Company filings and press releases. Bloomberg market data. AOL tender recently expired, and final results are not out as yet
1 Shares accepted divided by final shares sought
8
PRELIMINARY & CONFIDENTIAL
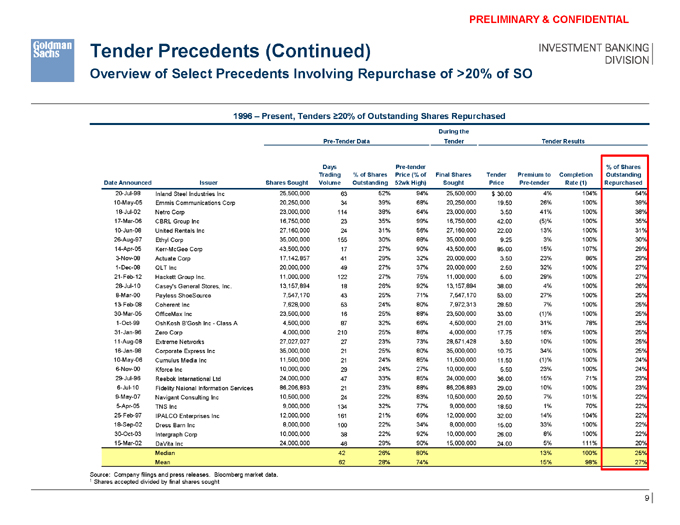
Tender Precedents (Continued)
Overview of Select Precedents Involving Repurchase of >20% of SO
1996 – Present, Tenders 20% of Outstanding Shares Repurchased
During the
Pre-Tender Data Tender Tender Results
Days Pre-tender % of Shares Trading % of Shares Price (% of Final Shares Tender Premium to Completion Outstanding Date Announced Issuer Shares Sought Volume Outstanding 52wk High) Sought Price Pre-tender Rate (1) Repurchased
20-Jul-98 Inland Steel Industries Inc 25,500,000 63 52% 94% 25,500,000 $ 30.00 4% 104% 54% 10-May-05 Emmis Communications Corp 20,250,000 34 39% 68% 20,250,000 19.50 26% 100% 39% 18-Jul-02 Netro Corp 23,000,000 114 38% 64% 23,000,000 3.50 41% 100% 38% 17-Mar-06 CBRL Group Inc 16,750,000 23 35% 99% 16,750,000 42.00 (5)% 100% 35% 10-Jun-08 United Rentals Inc 27,160,000 24 31% 56% 27,160,000 22.00 13% 100% 31% 26-Aug-97 Ethyl Corp 35,000,000 155 30% 88% 35,000,000 9.25 3% 100% 30% 14-Apr-05 Kerr-McGee Corp 43,500,000 17 27% 90% 43,500,000 85.00 15% 107% 29% 3-Nov-08 Actuate Corp 17,142,857 41 29% 32% 20,000,000 3.50 23% 86% 29% 1-Dec-08 QLT Inc 20,000,000 49 27% 37% 20,000,000 2.50 32% 100% 27% 21-Feb-12 Hackett Group Inc. 11,000,000 122 27% 75% 11,000,000 5.00 29% 100% 27% 28-Jul-10 Casey’s General Stores, Inc. 13,157,894 18 26% 92% 13,157,894 38.00 4% 100% 26% 8-Mar-00 Payless ShoeSource 7,547,170 43 25% 71% 7,547,170 53.00 27% 100% 25% 13-Feb-08 Coherent Inc 7,628,000 53 24% 80% 7,972,313 28.50 7% 100% 25% 30-Mar-05 OfficeMax Inc 23,500,000 16 25% 88% 23,500,000 33.00 (1)% 100% 25% 1-Oct-99 OshKosh B’Gosh Inc - Class A 4,500,000 87 32% 66% 4,500,000 21.00 31% 78% 25% 31-Jan-96 Zero Corp 4,000,000 210 25% 86% 4,000,000 17.75 16% 100% 25% 11-Aug-08 Extreme Networks 27,027,027 27 23% 73% 28,571,428 3.50 10% 100% 25% 16-Jan-98 Corporate Express Inc 35,000,000 21 25% 80% 35,000,000 10.75 34% 100% 25% 10-May-06 Cumulus Media Inc 11,500,000 21 24% 85% 11,500,000 11.50 (1)% 100% 24% 6-Nov-00 Kforce Inc 10,000,000 29 24% 27% 10,000,000 5.50 23% 100% 24% 29-Jul-96 Reebok International Ltd 24,000,000 47 33% 85% 24,000,000 36.00 15% 71% 23% 6-Jul-10 Fidelity Naional Information Services 86,206,893 21 23% 88% 86,206,893 29.00 10% 100% 23% 9-May-07 Navigant Consulting Inc 10,500,000 24 22% 83% 10,500,000 20.50 7% 101% 22% 5-Apr-05 TNS Inc 9,000,000 134 32% 77% 9,000,000 18.50 1% 70% 22% 25-Feb-97 IPALCO Enterprises Inc 12,000,000 161 21% 69% 12,000,000 32.00 14% 104% 22% 18-Sep-02 Dress Barn Inc 8,000,000 100 22% 34% 8,000,000 15.00 33% 100% 22% 30-Oct-03 Intergraph Corp 10,000,000 38 22% 92% 10,000,000 26.00 8% 100% 22% 15-Mar-02 DaVita Inc 24,000,000 46 29% 90% 15,000,000 24.00 5% 111% 20% Median 42 26% 80% 13% 100% 25% Mean 62 28% 74% 15% 98% 27%
Source: Company filings and press releases. Bloomberg market data.
1 Shares accepted divided by final shares sought
9
PRELIMINARY & CONFIDENTIAL
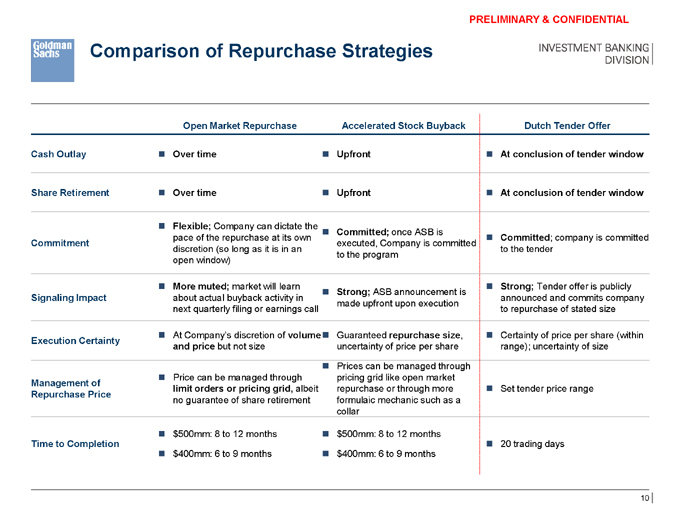
Comparison of Repurchase Strategies
Open Market Repurchase Accelerated Stock Buyback Dutch Tender Offer
Cash Outlay Over time Upfront At conclusion of tender window
Share Retirement Over time Upfront At conclusion of tender window
Flexible; Company can dictate the
Committed; once ASB is pace of the repurchase at its own Committed; company is committed Commitment executed, Company is committed discretion (so long as it is in an to the tender to the program open window)
More muted; market will learn Strong; Tender offer is publicly Strong; ASB announcement is Signaling Impact about actual buyback activity in announced and commits company made upfront upon execution next quarterly filing or earnings call to repurchase of stated size
At Company’s discretion of volume Guaranteed repurchase size, Certainty of price per share (within
Execution Certainty and price but not size uncertainty of price per share range); uncertainty of size
Prices can be managed through Price can be managed through pricing grid like open market
Management of limit orders or pricing grid, albeit repurchase or through more Set tender price range
Repurchase Price no guarantee of share retirement formulaic mechanic such as a collar
$500mm: 8 to 12 months $500mm: 8 to 12 months
Time to Completion 20 trading days
$400mm: 6 to 9 months $400mm: 6 to 9 months
10
PRELIMINARY & CONFIDENTIAL
Appendix A: Additional Materials
PRELIMINARY & CONFIDENTIAL
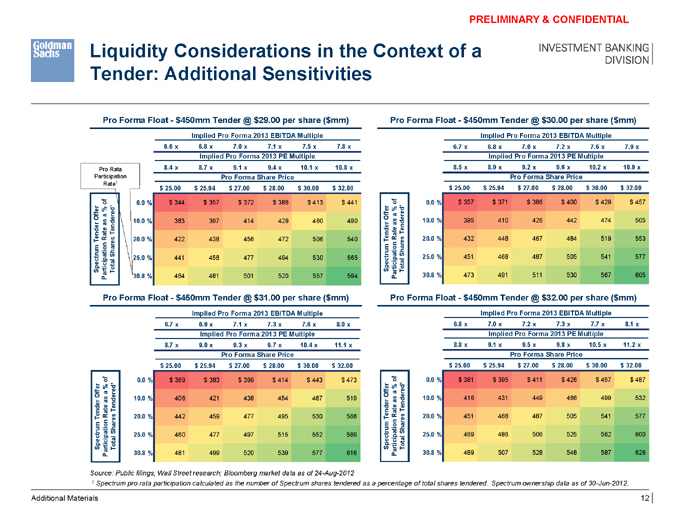
Liquidity Considerations in the Context of a Tender: Additional Sensitivities
Pro Forma Float - $450mm Tender @ $29.00 per share ($mm) Pro Forma Float - $450mm Tender @ $30.00 per share ($mm)
Implied Pro Forma 2013 EBITDA Multiple Implied Pro Forma 2013 EBITDA Multiple
6.6 x 6.8 x 7.0 x 7.1 x 7.5 x 7.8 x 6.7 x 6.8 x 7.0 x 7.2 x 7.6 x 7.9 x
Implied Pro Forma 2013 PE Multiple Implied Pro Forma 2013 PE Multiple
Pro Rata 8.4 x 8.7 x 9.1 x 9.4 x 10.1 x 10.8 x 8.5 x 8.9 x 9.2 x 9.6 x 10.2 x 10.9 x
Participation Pro Forma Share Price Pro Forma Share Price
Rate1 $529.52 $ 25.00 $ 25.94 $ 27.00 $ 28.00 $ 30.00 $ 32.00 $541.16 $ 25.00 $ 25.94 $ 27.00 $ 28.00 $ 30.00 $ 32.00 of of 0.0 % $ 344 $ 357 $ 372 $ 386 $ 413 $ 441 0.0 % $ 357 $ 371 $ 386 $ 400 $ 429 $ 457
¹ r % % red¹ ffer a red a Offe e O s
10.0 % 383 397 414 429 460 490 10.0 % 395 410 426 442 474 505 r as a Tend Tende Rate Rate 20.0 % 422 438 456 472 506 540 20.0 % 432 448 467 484 519 553
Tende Tender n n res tio Shares tio Sha
25.0 % 441 458 477 494 530 565 ctrumtal 25.0 % 451 468 487 505 541 577 rticipa tal Spe Spectrum To To Pa 30.8 % 464 481 501 520 557 594 Participa 30.8 % 473 491 511 530 567 605
Pro Forma Float - $450mm Tender @ $31.00 per share ($mm) Pro Forma Float - $450mm Tender @ $32.00 per share ($mm)
Implied Pro Forma 2013 EBITDA Multiple Implied Pro Forma 2013 EBITDA Multiple
6.7 x 6.9 x 7.1 x 7.3 x 7.6 x 8.0 x 6.8 x 7.0 x 7.2 x 7.3 x 7.7 x 8.1 x
Implied Pro Forma 2013 PE Multiple Implied Pro Forma 2013 PE Multiple
8.7 x 9.0 x 9.3 x 9.7 x 10.4 x 11.1 x 8.8 x 9.1 x 9.5 x 9.8 x 10.5 x 11.2 x
Pro Forma Share Price Pro Forma Share Price $552.04 $ 25.00 $ 25.94 $ 27.00 $ 28.00 $ 30.00 $ 32.00 $562.25 $ 25.00 $ 25.94 $ 27.00 $ 28.00 $ 30.00 $ 32.00 of of 0.0 % $ 369 $ 383 $ 399 $ 414 $ 443 $ 473 0.0 % $ 381 $ 395 $ 411 $ 426 $ 457 $ 487
% % ¹ a ffer a red Offer ered¹ O s as 10.0 % 406 421 438 454 487 519 a 10.0 % 416 431 449 466 499 532 nder Tend Tende e Rate 20.0 % 442 459 477 495 530 566 Rate 20.0 % 451 468 487 505 541 577
T Tender res n res trum Sha tio Sha ipation 25.0 % 460 477 497 515 552 589 ctrumtal 25.0 % 469 486 506 525 562 600 Spec rtic Total Spe To 30.8 % 489 507 528 548 587 626 Pa 30.8 % 481 499 520 539 577 616 Participa
Source: Public filings; Wall Street research; Bloomberg market data as of 24-Aug-2012
1 Spectrum pro rata participation calculated as the number of Spectrum shares tendered as a percentage of total shares tendered. Spectrum ownership data as of 30-Jun-2012.
Additional Materials 12
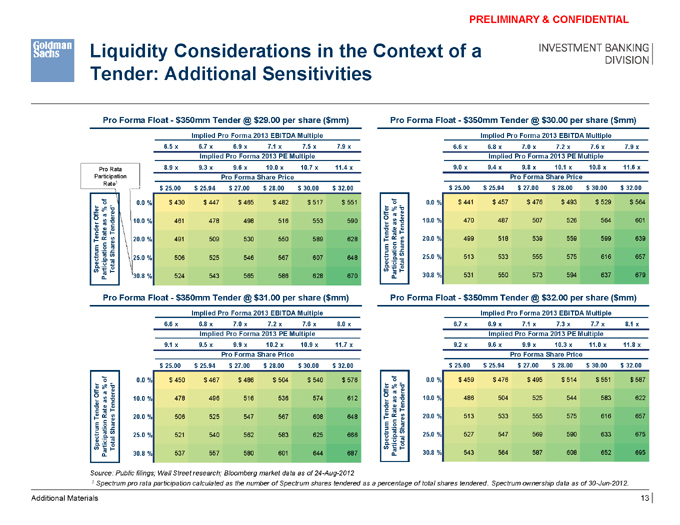
Liquidity Considerations in the Context of a Tender: Additional Sensitivities
Pro Forma Float - $350mm Tender @ $29.00 per share ($mm) Pro Forma Float - $350mm Tender @ $30.00 per share ($mm)
Implied Pro Forma 2013 EBITDA Multiple Implied Pro Forma 2013 EBITDA Multiple
6.5 x 6.7 x 6.9 x 7.1 x 7.5 x 7.9 x 6.6 x 6.8 x 7.0 x 7.2 x 7.6 x 7.9 x
Implied Pro Forma 2013 PE Multiple Implied Pro Forma 2013 PE Multiple
Pro Rata 8.9 x 9.3 x 9.6 x 10.0 x 10.7 x 11.4 x 9.0 x 9.4 x 9.8 x 10.1 x 10.8 x 11.6 x
Participation Pro Forma Share Price Pro Forma Share Price
Rate1 $607.10 $ 25.00 $ 25.94 $ 27.00 $ 28.00 $ 30.00 $ 32.00 $616.15 $ 25.00 $ 25.94 $ 27.00 $ 28.00 $ 30.00 $ 32.00 of of 0.0 % $ 430 $ 447 $ 465 $ 482 $ 517 $ 551 0.0 % $ 441 $ 457 $ 476 $ 493 $ 529 $ 564
¹ r % % red¹ ffer a red a Offe e O s
10.0 % 461 478 498 516 553 590 10.0 % 470 487 507 526 564 601 r as a Tend Tende Rate Rate 20.0 % 491 509 530 550 589 628 20.0 % 499 518 539 559 599 639
Tende Tender n n res tio Shares tio Sha
25.0 % 506 525 546 567 607 648 ctrumtal 25.0 % 513 533 555 575 616 657 rticipa tal Spe Spectrum To To Pa 30.8 % 524 543 565 586 628 670 Participa 30.8 % 531 550 573 594 637 679
Pro Forma Float - $350mm Tender @ $31.00 per share ($mm) Pro Forma Float - $350mm Tender @ $32.00 per share ($mm)
Implied Pro Forma 2013 EBITDA Multiple Implied Pro Forma 2013 EBITDA Multiple
6.6 x 6.8 x 7.0 x 7.2 x 7.6 x 8.0 x 6.7 x 6.9 x 7.1 x 7.3 x 7.7 x 8.1 x
Implied Pro Forma 2013 PE Multiple Implied Pro Forma 2013 PE Multiple
9.1 x 9.5 x 9.9 x 10.2 x 10.9 x 11.7 x 9.2 x 9.6 x 9.9 x 10.3 x 11.0 x 11.8 x
Pro Forma Share Price Pro Forma Share Price $624.61 $ 25.00 $ 25.94 $ 27.00 $ 28.00 $ 30.00 $ 32.00 $632.55 $ 25.00 $ 25.94 $ 27.00 $ 28.00 $ 30.00 $ 32.00 of of 0.0 % $ 450 $ 467 $ 486 $ 504 $ 540 $ 576 0.0 % $ 459 $ 476 $ 495 $ 514 $ 551 $ 587
% % ¹ ffer a red a Offer O s as 10.0 % 478 496 516 536 574 612 a 10.0 % 486 504 525 544 583 622
Tendered¹ Tende Rate Rate
20.0 % 506 525 547 567 608 648 20.0 % 513 533 555 575 616 657
Tender Tender n res tion tio Sha a Shares
25.0 % 521 540 562 583 625 666 ctrumtal 25.0 % 527 547 569 590 633 675 tal Spe Spectrum To To Particip 30.8 % 537 557 580 601 644 687 Participa 30.8 % 543 564 587 608 652 695
Source: Public filings; Wall Street research; Bloomberg market data as of 24-Aug-2012
1 Spectrum pro rata participation calculated as the number of Spectrum shares tendered as a percentage of total shares tendered. Spectrum ownership data as of 30-Jun-2012.
Additional Materials 13
PRELIMINARY & CONFIDENTIAL
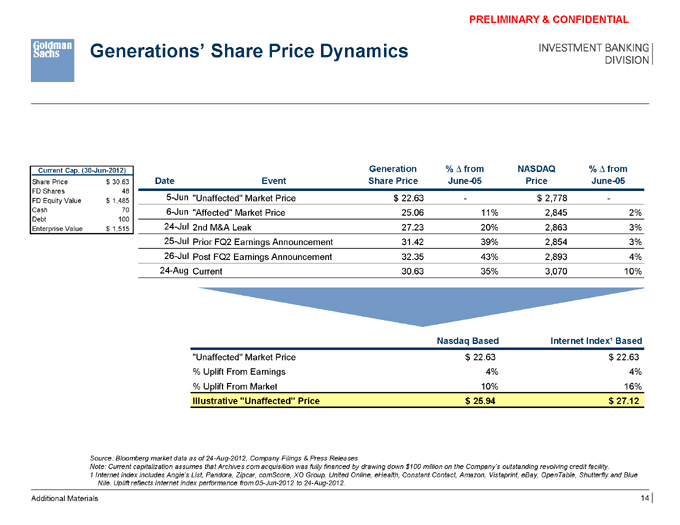
Generations’ Share Price Dynamics
Current Cap. (30-Jun-2012) Generation % ? from NASDAQ % ? from
Share Price $ 30.63 Date Event Share Price June-05 Price June-05
FD Shares 48
FD Equity Value $ 1,485 5-Jun “Unaffected” Market Price $ 22.63 - $ 2,778 -
Cash 70 6-Jun “Affected” Market Price 25.06 11% 2,845 2%
Debt 100 24-Jul
Enterprise Value $ 1,515 2nd M&A Leak 27.23 20% 2,863 3% 25-Jul Prior FQ2 Earnings Announcement 31.42 39% 2,854 3% 26-Jul Post FQ2 Earnings Announcement 32.35 43% 2,893 4% 24-Aug Current 30.63 35% 3,070 10%
Nasdaq Based Internet Index¹ Based
“Unaffected” Market Price $ 22.63 $ 22.63
% Uplift From Earnings 4% 4%
% Uplift From Market 10% 16%
Illustrative “Unaffected” Price $ 25.94 $ 27.12
Source: Bloomberg market data as of 24-Aug-2012, Company Filings & Press Releases
Note: Current capitalization assumes that Archives.com acquisition was fully financed by drawing down $100 million on the Company’s outstanding revolving credit facility.
1 Internet index includes Angie’s List, Pandora, Zipcar, comScore, XO Group, United Online, eHealth, Constant Contact, Amazon, Vistaprint, eBay, OpenTable, Shutterfly and Blue Nile. Uplift reflects Internet index performance from 05-Jun-2012 to 24-Aug-2012.
Additional Materials 14
PRELIMINARY & CONFIDENTIAL
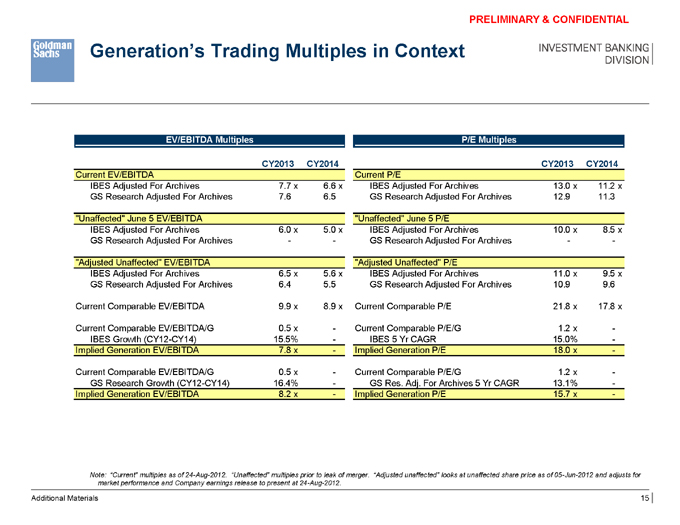
Generation’s Trading Multiples in Context
EV/EBITDA Multiples P/E Multiples
CY2013 CY2014 CY2013 CY2014
Current EV/EBITDA Current P/E
IBES Adjusted For Archives 7.7 x 6.6 x IBES Adjusted For Archives 13.0 x 11.2 x GS Research Adjusted For Archives 7.6 6.5 GS Research Adjusted For Archives 12.9 11.3
“Unaffected” June 5 EV/EBITDA “Unaffected” June 5 P/E
IBES Adjusted For Archives 6.0 x 5.0 x IBES Adjusted For Archives 10.0 x 8.5 x GS Research Adjusted For Archives - - GS Research Adjusted For Archives - -
“Adjusted Unaffected” EV/EBITDA “Adjusted Unaffected” P/E
IBES Adjusted For Archives 6.5 x 5.6 x IBES Adjusted For Archives 11.0 x 9.5 x GS Research Adjusted For Archives 6.4 5.5 GS Research Adjusted For Archives 10.9 9.6
Current Comparable EV/EBITDA 9.9 x 8.9 x Current Comparable P/E 21.8 x 17.8 x
Current Comparable EV/EBITDA/G 0.5 x - Current Comparable P/E/G 1.2 x -IBES Growth (CY12-CY14) 15.5% - IBES 5 Yr CAGR 15.0% -Implied Generation EV/EBITDA 7.8 x - Implied Generation P/E 18.0 x -
Current Comparable EV/EBITDA/G 0.5 x - Current Comparable P/E/G 1.2 x -GS Research Growth (CY12-CY14) 16.4% - GS Res. Adj. For Archives 5 Yr CAGR 13.1% -Implied Generation EV/EBITDA 8.2 x - Implied Generation P/E 15.7 x -
Note: “Current” multiples as of 24-Aug-2012. “Unaffected” multiples prior to leak of merger. “Adjusted unaffected” looks at unaffected share price as of 05-Jun-2012 and adjusts for market performance and Company earnings release to present at 24-Aug-2012.
Additional Materials 15
PRELIMINARY & CONFIDENTIAL
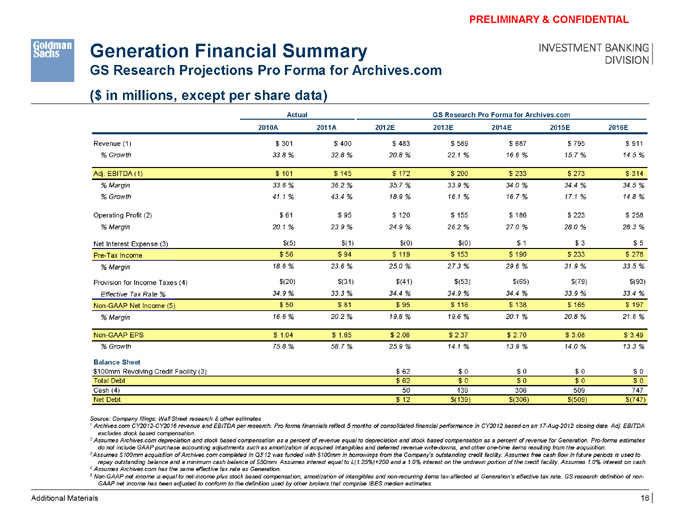
Generation Financial Summary
GS Research Projections Pro Forma for Archives.com ($ in millions, except per share data)
Actual GS Research Pro Forma for Archives.com
2010A 2011A 2012E 2013E 2014E 2015E 2016E
Revenue (1) $ 301 $ 400 $ 483 $ 589 $ 687 $ 795 $ 911
% Growth 33.8 % 32.8 % 20.8 % 22.1 % 16.6 % 15.7 % 14.5 %
Adj. EBITDA (1) $ 101 $ 145 $ 172 $ 200 $ 233 $ 273 $ 314
% Margin 33.6 % 36.2 % 35.7 % 33.9 % 34.0 % 34.4 % 34.5 %
% Growth 41.1 % 43.4 % 18.9 % 16.1 % 16.7 % 17.1 % 14.8 %
Operating Profit (2) $ 61 $ 95 $ 120 $ 155 $ 186 $ 223 $ 258
% Margin 20.1 % 23.9 % 24.9 % 26.2 % 27.0 % 28.0 % 28.3 %
Net Interest Expense (3) $(5) $(1) $(0) $(0) $ 1 $ 3 $ 5 Pre-Tax Income $ 56 $ 94 $ 119 $ 153 $ 190 $ 233 $ 278
% Margin 18.6 % 23.6 % 25.0 % 27.3 % 29.6 % 31.9 % 33.5 %
Provision for Income Taxes (4) $(20) $(31) $(41) $(53) $(65) $(79) $(93)
Effective Tax Rate % 34.9 % 33.3 % 34.4 % 34.9 % 34.4 % 33.9 % 33.4 %
Non-GAAP Net Income (5) $ 50 $ 81 $ 95 $ 116 $ 138 $ 165 $ 197
% Margin 16.6 % 20.2 % 19.8 % 19.6 % 20.1 % 20.8 % 21.6 %
Non-GAAP EPS $ 1.04 $ 1.65 $ 2.08 $ 2.37 $ 2.70 $ 3.08 $ 3.49
% Growth 75.8 % 58.7 % 25.9 % 14.1 % 13.9 % 14.0 % 13.3 %
Balance Sheet $100mm Revolving Credit Facility (3) $ 62 $ 0 $ 0 $ 0 $ 0 Total Debt $ 62 $ 0 $ 0 $ 0 $ 0 Cash (4) 50 139 306 509 747 Net Debt $ 12 $(139) $(306) $(509) $(747)
Source: Company filings; Wall Street research & other estimates
1 Archives.com CY2012-CY2016 revenue and EBITDA per research. Pro forma financials reflect 5 months of consolidated financial performance in CY2012 based on an 17-Aug-2012 closing date. Adj. EBITDA excludes stock based compensation.
2 Assumes Archives.com depreciation and stock based compensation as a percent of revenue equal to depreciation and stock based compensation as a percent of revenue for Generation. Pro-forma estimates do not include GAAP purchase accounting adjustments such as amortization of acquired intangibles and deferred revenue write-downs, and other one-time items resulting from the acquisition.
3 Assumes $100mm acquisition of Archives.com completed in Q3’12 was funded with $100mm in borrowings from the Company’s outstanding credit facility. Assumes free cash flow in future periods is used to repay outstanding balance and a minimum cash balance of $50mm. Assumes interest equal to L(1.25%)+200 and a 1.0% interest on the undrawn portion of the credit facility. Assumes 1.0% interest on cash.
4 Assumes Archives.com has the same effective tax rate as Generation.
5 Non-GAAP net income is equal to net-income plus stock based compensation, amortization of intangibles and non-recurring items tax-affected at Generation’s effective tax rate. GS research definition of non-GAAP net income has been adjusted to conform to the definition used by other brokers that comprise IBES median estimates.
Additional Materials 16
PRELIMINARY & CONFIDENTIAL
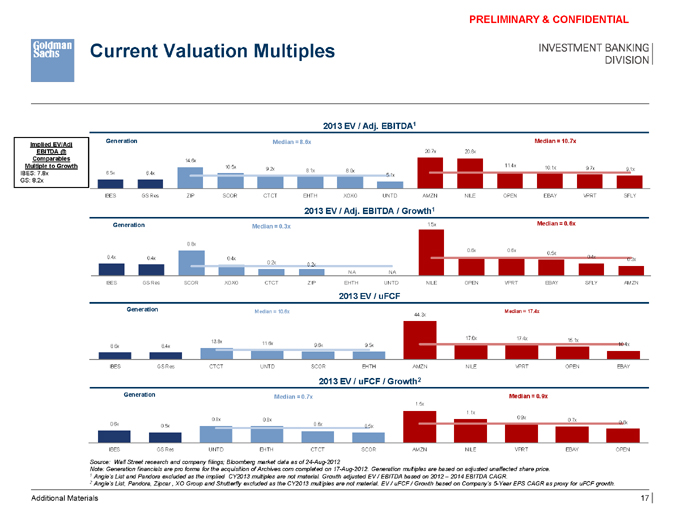
Current Valuation Multiples
2013 EV / Adj. EBITDA1
Generation Median = 8.6x Median = 10.7x
Implied EV/Adj
EBITDA @ 20.7x 20.6x
Comparables 14.6x
Multiple to Growth 10.5x 11.4x 10.1x
9.2x 9.7x 9.1x
8.1x 8.0x
IBES: 7.8x 6.5x 6.4x 5.1x
GS: 8.2x
IBES GS Res ZIP SCOR CTCT EHTH XOXO UNTD AMZN NILE OPEN EBAY VPRT SFLY
2013 EV / Adj. EBITDA / Growth1
Generation 1.5x Median = 0.6x Median = 0.3x
0.8x
0.6x 0.6x
0.5x
0.4x 0.4x 0.4x 0.4x
0.3x
0.2x 0.2x
NA NA
IBES GS Res SCOR XOXO CTCT ZIP EHTH UNTD NILE OPEN VPRT EBAY SFLY AMZN
2013 EV / uFCF
Generation Median = 10.6x 44.3x Median = 17.4x
17.6x 17.4x 15.1x 13.8x 11.6x
8.6x 8.4x 9.6x 9.5x 10.4x
IBES GS Res CTCT UNTD SCOR EHTH AMZN NILE VPRT OPEN EBAY
2013 EV / uFCF / Growth2
Generation Median = 0.7x Median = 0.9x
1.5x
1.1x 0.9x
0.8x 0.8x 0.7x
0.6x 0.6x 0.6x
0.5x 0.5x
IBES GS Res UNTD EHTH CTCT SCOR AMZN NILE VPRT EBAY OPEN
Source: Wall Street research and company filings; Bloomberg market data as of 24-Aug-2012
Note: Generation financials are pro forma for the acquisition of Archives.com completed on 17-Aug-2012. Generation multiples are based on adjusted unaffected share price.
1 Angie’s List and Pandora excluded as the implied CY2013 multiples are not material. Growth adjusted EV / EBITDA based on 2012 – 2014 EBITDA CAGR.
2 Angie’s List, Pandora, Zipcar , XO Group and Shutterfly excluded as the CY2013 multiples are not material. EV / uFCF / Growth based on Company’s 5-Year EPS CAGR as proxy for uFCF growth.
Additional Materials 17
PRELIMINARY & CONFIDENTIAL
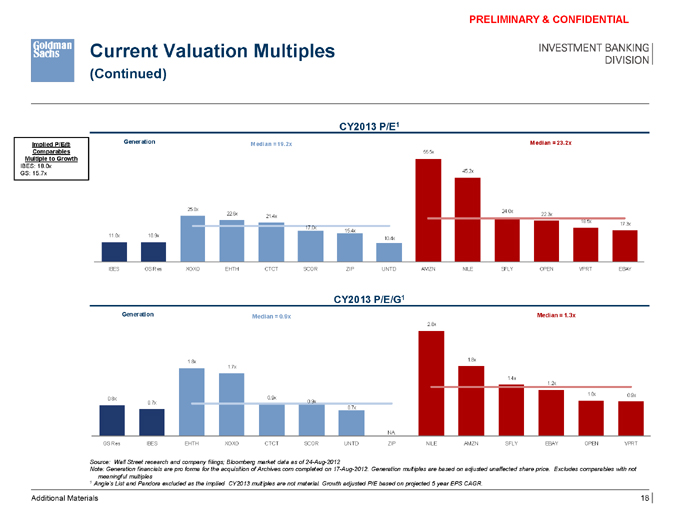
Current Valuation Multiples
(Continued)
CY2013 P/E1
Implied P/E@ Generation Median = 19.2x Median = 23.2x
Comparables 55.5x Multiple to Growth
IBES: 18.0x 45.2x GS: 15.7x
25.0x 22.6x 24.0x
21.4x 22.3x
18.5x
17.3x 17.0x 15.4x 11.0x 10.9x 10.4x
IBES GS Res XOXO EHTH CTCT SCOR ZIP UNTD AMZN NILE SFLY OPEN VPRT EBAY
CY2013 P/E/G1
Generation Median = 0.9x Median = 1.3x
2.8x
1.8x 1.8x
1.7x
1.4x
1.2x
1.0x 0.9x
0.8x 0.9x
0.7x 0.9x
0.7x
NA
GS Res IBES EHTH XOXO CTCT SCOR UNTD ZIP NILE AMZN SFLY EBAY OPEN VPRT
Source: Wall Street research and company filings; Bloomberg market data as of 24-Aug-2012
Note: Generation financials are pro forma for the acquisition of Archives.com completed on 17-Aug-2012. Generation multiples are based on adjusted unaffected share price. Excludes comparables with not meaningful multiples
1 Angie’s List and Pandora excluded as the implied CY2013 multiples are not material. Growth adjusted P/E based on projected 5 year EPS CAGR.
Additional Materials 18
PRELIMINARY & CONFIDENTIAL
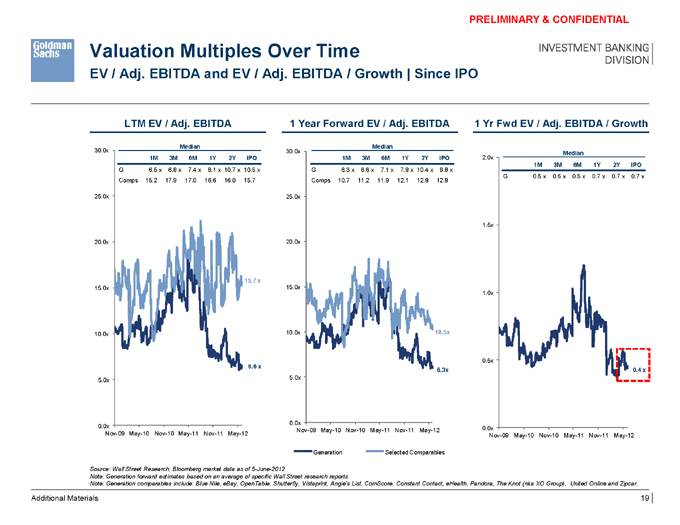
Valuation Multiples Over Time
EV / Adj. EBITDA and EV / Adj. EBITDA / Growth | Since IPO
LTM EV / Adj. EBITDA 1 Year Forward EV / Adj. EBITDA 1 Yr Fwd EV / Adj. EBITDA / Growth
Median Median
30.0x 30.0x
Median
1M 3M 6M 1Y 2Y IPO 1M 3M 6M 1Y 2Y IPO 2.0x
G 6.5 x 6.8 x 7.4 x 8.1 x 10.7 x 10.5 x G 6.3 x 6.6 x 7.1 x 7.8 x 10.4 x 9.8 x 1M 3M 6M 1Y 2Y IPO G 0.5 x 0.5 x 0.5 x 0.7 x 0.7 x 0.7 x Comps 15.2 17.9 17.0 16.6 16.0 15.7 Comps 10.7 11.2 11.9 12.1 12.8 12.8
25.0x 25.0x
1.5x 20.0x 20.0x
15.7 x
15.0x 15.0x
1.0x
10.0x 10.0x 10.5x
0.5x
6.6 x
6.3x 0.4 x
5.0x 5.0x
0.0x
0.0x 0.0x Nov-09 May-10 Nov-10 May-11 Nov-11 May-12
Nov-09 May-10 Nov-10 May-11 Nov-11 May-12 Nov-09 May-10 Nov-10 May-11 Nov-11 May-12
Generation Selected Comparables
Source: Wall Street Research; Bloomberg market data as of 5-June-2012
Note: Generation forward estimates based on an average of specific Wall Street research reports.
Note: Generation comparables include: Blue Nile, eBay, OpenTable, Shutterfly, Vistaprint, Angie’s List, ComScore, Constant Contact, eHealth, Pandora, The Knot (nka XO Group), United Online and Zipcar.
Additional Materials 19
PRELIMINARY & CONFIDENTIAL
Credit Capacity
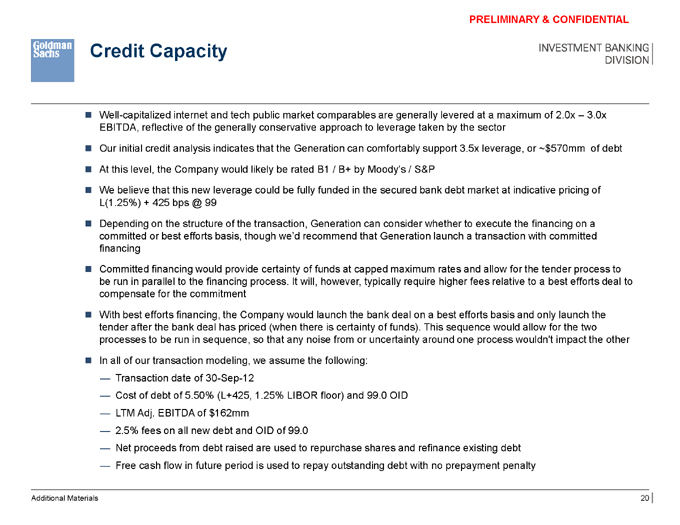
Well-capitalized internet and tech public market comparables are generally levered at a maximum of 2.0x – 3.0x EBITDA, reflective of the generally conservative approach to leverage taken by the sector
Our initial credit analysis indicates that the Generation can comfortably support 3.5x leverage, or ~$570mm of debt
At this level, the Company would likely be rated B1 / B+ by Moody’s / S&P
We believe that this new leverage could be fully funded in the secured bank debt market at indicative pricing of L(1.25%) + 425 bps @ 99
Depending on the structure of the transaction, Generation can consider whether to execute the financing on a committed or best efforts basis, though we’d recommend that Generation launch a transaction with committed financing
Committed financing would provide certainty of funds at capped maximum rates and allow for the tender process to be run in parallel to the financing process. It will, however, typically require higher fees relative to a best efforts deal to compensate for the commitment
With best efforts financing, the Company would launch the bank deal on a best efforts basis and only launch the tender after the bank deal has priced (when there is certainty of funds). This sequence would allow for the two processes to be run in sequence, so that any noise from or uncertainty around one process wouldn’t impact the other
In all of our transaction modeling, we assume the following:
— Transaction date of 30-Sep-12
— Cost of debt of 5.50% (L+425, 1.25% LIBOR floor) and 99.0 OID
— LTM Adj. EBITDA of $162mm
— 2.5% fees on all new debt and OID of 99.0
— Net proceeds from debt raised are used to repurchase shares and refinance existing debt
— Free cash flow in future period is used to repay outstanding debt with no prepayment penalty
Additional Materials 20
PRELIMINARY & CONFIDENTIAL
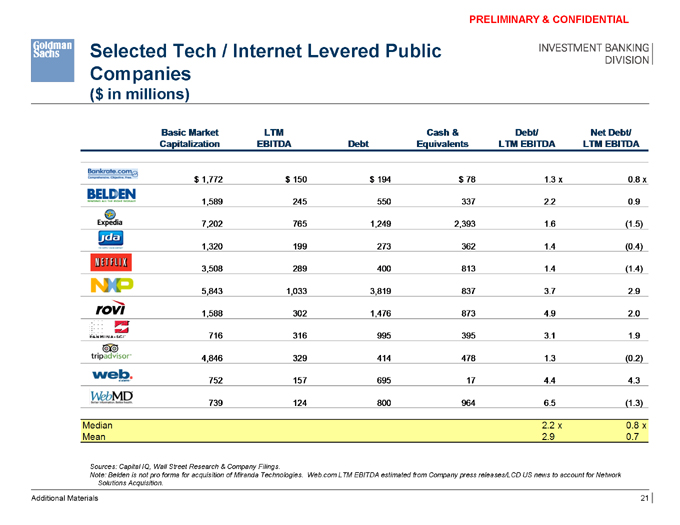
Selected Tech / Internet Levered Public Companies
($ in millions)
Sources: Capital IQ, Wall Street Research & Company Filings.
Note: Belden is not pro forma for acquisition of Miranda Technologies. Web.com LTM EBITDA estimated from Company press releases/LCD US news to account for Network Solutions Acquisition.
Additional Materials 21
PRELIMINARY & CONFIDENTIAL
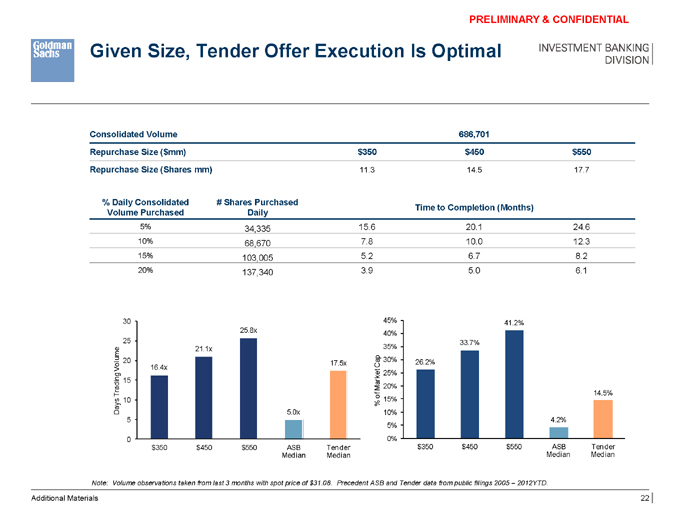
Given Size, Tender Offer Execution Is Optimal
Consolidated Volume 686,701
Repurchase Size ($mm) $350 $450 $550
Repurchase Size (Shares mm) 11.3 14.5 17.7
% Daily Consolidated # Shares Purchased
Time to Completion (Months) Volume Purchased Daily
5% 34,335 15.6 20.1 24.6 10% 68,670 7.8 10.0 12.3 15% 103,005 5.2 6.7 8.2 20% 137,340 3.9 5.0 6.1
30 45% 41.2%
25.8x
40%
25 33.7% 21.1x 35% 20 ap 30% 26.2% olume 17.5x C
V 16.4x t e 25% 15 ar k M 20% rading 14.5% T
10of 15% % Days 5.0x 10%
5 4.2%
5%
0 0% $350 $450 $550 ASB Tender $350 $450 $550 ASB Tender Median Median Median Median
Note: Volume observations taken from last 3 months with spot price of $31.08. Precedent ASB and Tender data from public filings 2005 – 2012YTD.
Additional Materials 22
PRELIMINARY & CONFIDENTIAL
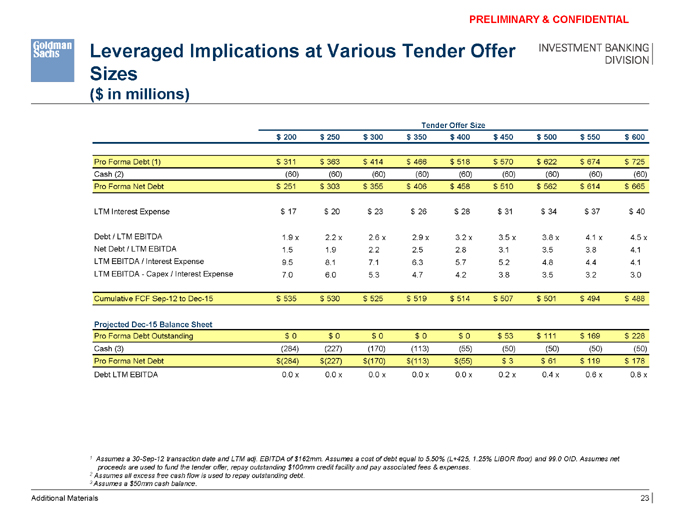
Leveraged Implications at Various Tender Offer Sizes
($ in millions)
Tender Offer Size $ 200 $ 250 $ 300 $ 350 $ 400 $ 450 $ 500 $ 550 $ 600
Pro Forma Debt (1) $ 311 $ 363 $ 414 $ 466 $ 518 $ 570 $ 622 $ 674 $ 725 Cash (2) (60) (60) (60) (60) (60) (60) (60) (60) (60) Pro Forma Net Debt $ 251 $ 303 $ 355 $ 406 $ 458 $ 510 $ 562 $ 614 $ 665
LTM Interest Expense $ 17 $ 20 $ 23 $ 26 $ 28 $ 31 $ 34 $ 37 $ 40
Debt / LTM EBITDA 1.9 x 2.2 x 2.6 x 2.9 x 3.2 x 3.5 x 3.8 x 4.1 x 4.5 x Net Debt / LTM EBITDA 1.5 1.9 2.2 2.5 2.8 3.1 3.5 3.8 4.1 LTM EBITDA / Interest Expense 9.5 8.1 7.1 6.3 5.7 5.2 4.8 4.4 4.1 LTM EBITDA - Capex / Interest Expense 7.0 6.0 5.3 4.7 4.2 3.8 3.5 3.2 3.0
Cumulative FCF Sep-12 to Dec-15 $ 535 $ 530 $ 525 $ 519 $ 514 $ 507 $ 501 $ 494 $ 488
Projected Dec-15 Balance Sheet
Pro Forma Debt Outstanding $ 0 $ 0 $ 0 $ 0 $ 0 $ 53 $ 111 $ 169 $ 228 Cash (3) (284) (227) (170) (113) (55) (50) (50) (50) (50) Pro Forma Net Debt $(284) $(227) $(170) $(113) $(55) $ 3 $ 61 $ 119 $ 178 Debt LTM EBITDA 0.0 x 0.0 x 0.0 x 0.0 x 0.0 x 0.2 x 0.4 x 0.6 x 0.8 x
1 Assumes a 30-Sep-12 transaction date and LTM adj. EBITDA of $162mm. Assumes a cost of debt equal to 5.50% (L+425, 1.25% LIBOR floor) and 99.0 OID. Assumes net proceeds are used to fund the tender offer, repay outstanding $100mm credit facility and pay associated fees & expenses.
2 Assumes all excess free cash flow is used to repay outstanding debt.
3 Assumes a $50mm cash balance.
Additional Materials 23
PRELIMINARY & CONFIDENTIAL
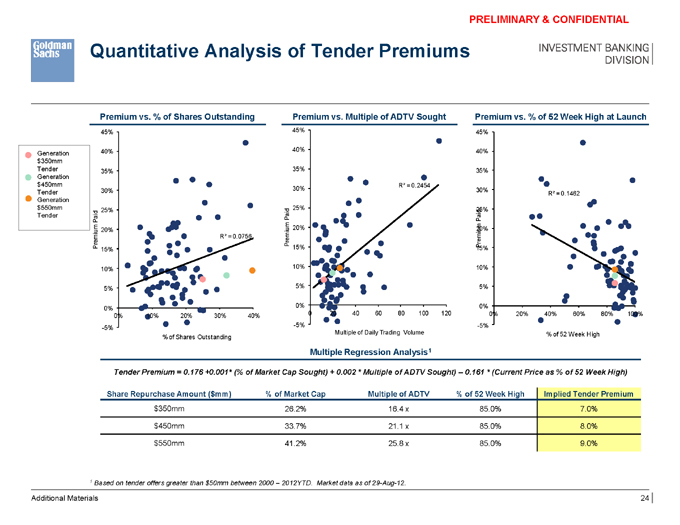
Quantitative Analysis of Tender Premiums
Premium vs. % of Shares Outstanding Premium vs. Multiple of ADTV Sought Premium vs. % of 52 Week High at Launch
45% 45% 45%
40% 40% 40%
Generation $350mm
Tender 35% 35% 35%
Generation $450mm R² = 0.2454
30% 30% 30%
Tender R² = 0.1462
Generation $550mm 25% 25% 25% Tender id Paid Paid Pa m 20% 20% 20% Premium R² = 0.0756 Premium iu Prem 15% 15% 15%
10% 10% 10%
5% 5% 5%
0% 0% 0%
0% 10% 20% 30% 40% 0 20 40 60 80 100 120 0% 20% 40% 60% 80% 100% -5% -5% -5% Multiple of Daily Trading Volume % of 52 Week High % of Shares Outstanding
Multiple Regression Analysis1
Tender Premium = 0.176 +0.001* (% of Market Cap Sought) + 0.002 * Multiple of ADTV Sought) – 0.161 * (Current Price as % of 52 Week High)
Share Repurchase Amount ($mm) % of Market Cap Multiple of ADTV % of 52 Week High Implied Tender Premium $350mm 26.2% 16.4 x 85.0% 7.0%
$450mm 33.7% 21.1 x 85.0% 8.0%
$550mm 41.2% 25.8 x 85.0% 9.0%
1 Based on tender offers greater than $50mm between 2000 – 2012YTD. Market data as of 29-Aug-12.
Additional Materials 24
PRELIMINARY & CONFIDENTIAL
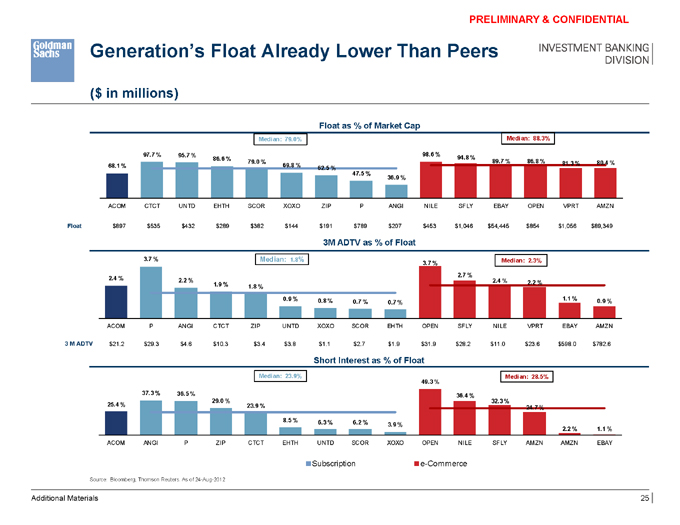
Generation’s Float Already Lower Than Peers
($ in millions)
Float as % of Market Cap
Median: 79.0% Median: 88.3%
97.7 % 95.7 % 98.6 %
86.6 % 94.8 %
79.0 % 89.7 % 86.8 % 81.3 % 80.4 % 68.1 % 69.8 % 62.5 % 47.5 % 36.9 %
ACOM CTCT UNTD EHTH SCOR XOXO ZIP P ANGI NILE SFLY EBAY OPEN VPRT AMZN
Float $897 $535 $432 $289 $382 $144 $191 $789 $207 $453 $1,046 $54,445 $854 $1,056 $89,349
3M ADTV as % of Float
3.7 % Median: 1.8% Median: 2.3%
3.7 %
2.7 %
2.4 % 2.2 %
2.4 % 2.2 %
1.9 % 1.8 %
0.9 % 0.8 % 1.1 % 0.9 %
0.7 % 0.7 %
ACOM P ANGI CTCT ZIP UNTD XOXO SCOR EHTH OPEN SFLY NILE VPRT EBAY AMZN
3 M ADTV $21.2 $29.3 $4.6 $10.3 $3.4 $3.8 $1.1 $2.7 $1.9 $31.9 $28.2 $11.0 $23.6 $598.0 $782.6
Short Interest as % of Float
Median: 23.9% Median: 28.5% 49.3 % 37.3 % 36.5 % 29.0 % 36.4 % 32.3 % 25.4 % 23.9 % 24.7 %
8.5 % 6.3 % 6.2 %
3.9 %
2.2 % 1.1 %
ACOM ANGI P ZIP CTCT EHTH UNTD SCOR XOXO OPEN NILE SFLY AMZN AMZN EBAY
Subscription e-Commerce
Source: Bloomberg, Thomson Reuters. As of 24-Aug-2012
Additional Materials 25