Exhibit (c)-(2)
April 2015 Project Shengxia CONFIDENTIAL Discussion Material Prepared for Meeting with the Special Committee of the Board of Directors of Shanda Games
“Bank of America Merrill Lynch” is the marketing name for the global banking and global markets businesses of Bank of America Co rporation. Lending, derivatives, and other commercial banking activities are performed globally by banking affiliates of Bank of America Corporation, including Bank of America, N.A., member FDIC. Securities, strategic adviso ry, and other investment banking activities are performed globally by investment banking affiliates of Bank of America Corporation (“Investment Banking Affiliates”), including, in the United States, Merrill Lynch, Pierce, Fenner & Smith Incorporated and Merrill Lynch Professional Clearing Corp., which are both registered broker dealers and members of FINRA and SIPC, and, in other jurisdictions, by locally registered entities. Investment products offered by Investment Banking Affiliates: Are Not FDIC Insured * May Lose Value * Are Not Bank Guarantee d. These materials have been prepared by one or more subsidiaries of Bank of America Corporation for the client or potential cli ent to whom such materials are directly addressed and delivered (the “Company”) in connection with an actual or potential mandate or engagement and may not be used or relied upon for any purpose other than as specifically conte mpl ated by a written agreement with us. These materials are based on information provided by or on behalf of the Company and/or other potential transaction participants, from public sources or otherwise reviewed by us. We a ssu me no responsibility for independent investigation or verification of such information (including, without limitation, data from third party suppliers) and have relied on such information being complete and accurate in all m ate rial respects. To the extent such information includes estimates and forecasts of future financial performance prepared by or reviewed with the managements of the Company and/or other potential transaction participants or ob tai ned from public sources, we have assumed that such estimates and forecasts have been reasonably prepared on bases reflecting the best currently available estimates and judgments of such managements (or, with re spe ct to estimates and forecasts obtained from public sources, represent reasonable estimates). No representation or warranty, express or implied, is made as to the accuracy or completeness of such information and nothing co nta ined herein is, or shall be relied upon as, a representation, whether as to the past, the present or the future. These materials were designed for use by specific persons familiar with the business and affairs of the Company and are being furnished and should be considered only in connection with other information, oral or written, being provided by us in connection herewith. These materials are not intended to provide the sole basis for evaluating, and sho uld not be considered a recommendation with respect to, any transaction or other matter. These materials do not constitute an offer or solicitation to sell or purchase any securities and are not a commitment by Bank of A mer ica Corporation or any of its affiliates to provide or arrange any financing for any transaction or to purchase any security in connection therewith. These materials are for discussion purposes only and are subject to our revie w a nd assessment from a legal, compliance, accounting policy and risk perspective, as appropriate, following our discussion with the Company. We assume no obligation to update or otherwise revise these materials. These mat eri als have not been prepared with a view toward public disclosure under applicable securities laws or otherwise, are intended for the benefit and use of the Company, and may not be reproduced, disseminated, quoted or referred t o, in whole or in part, without our prior written consent. These materials may not reflect information known to other professionals in other business areas of Bank of America Corporation and its affiliates. Bank of America Corporation and its affiliates (collectively, the “BAC Group”) comprise a full service securities firm and co mme rcial bank engaged in securities, commodities and derivatives trading, foreign exchange and other brokerage activities, and principal investing as well as providing investment, corporate and private banking, asset and inves tme nt management, financing and strategic advisory services and other commercial services and products to a wide range of corporations, governments and individuals, domestically and offshore, from which conflicting interests or dut ies, or a perception thereof, may arise. In the ordinary course of these activities, parts of the BAC Group at any time may invest on a principal basis or manage funds that invest, make or hold long or short positions, finance pos itions or trade or otherwise effect transactions, for their own accounts or the accounts of customers, in debt, equity or other securities or financial instruments (including derivatives, bank loans or other obligations) of the Com pan y, potential counterparties or any other company that may be involved in a transaction. Products and services that may be referenced in the accompanying materials may be provided through one or more affiliates of Bank of Ameri ca Corporation. We have adopted policies and guidelines designed to preserve the independence of our research analysts. The BAC Group prohibits employees from, directly or indirectly, offering a favorable research rating o r s pecific price target, or offering to change a rating or price target to a subject company as consideration or inducement for the receipt of business or for compensation and the BAC Group prohibits research analysts from being direct ly compensated for involvement in investment banking transactions. The views expressed herein are the views solely of Global Corporate and Investment Banking, and no inference should be made that the views expressed represe nt the view of the firm’s research department. We are required to obtain, verify and record certain information that identifies the Company, which information includes the name and address of the Company and other information th at will allow us to identify the Company in accordance, as applicable, with the USA Patriot Act (Title III of Pub. L. 107 - 56 (signed into law October 26, 2001)) and such other laws, rules and regulations as applicable within and outside the United States. We do not provide legal, compliance, tax or accounting advice. Accordingly, any statements contained herein as to tax matter s w ere neither written nor intended by us to be used and cannot be used by any taxpayer for the purpose of avoiding tax penalties that may be imposed on such taxpayer. If any person uses or refers to any such tax statemen t i n promoting, marketing or recommending a partnership or other entity, investment plan or arrangement to any taxpayer, then the statement expressed herein is being delivered to support the promotion or marketing of the transaction or matter addressed and the recipient should seek advice based on its particular circumstances from an independent tax advisor. Notwithstanding anything that may appear herein or in other materials to the con trary, the Company shall be permitted to disclose the tax treatment and tax structure of a transaction (including any materials, opinions or analyses relating to such tax treatment or tax structure, but without discl osu re of identifying information or, except to the extent relating to such tax structure or tax treatment, any nonpublic commercial or financial information) on and after the earliest to occur of the date of ( i ) public announcement of discussions relating to such transaction, (ii) public announcement of such transaction or (iii) execution of a definitive agreement (with or without conditions) to enter into such transaction; provided, however, that if s uch transaction is not consummated for any reason, the provisions of this sentence shall cease to apply. Copyright 2015 Bank of America Corporation. Confidential Notice to Recipient
1. Transaction Overview 1 2. Valuation Analysis 6 Table of Contents Meeting with the Special Committee of the Board of Directors of Shanda Games Project Shengxia
1. Transaction Overview
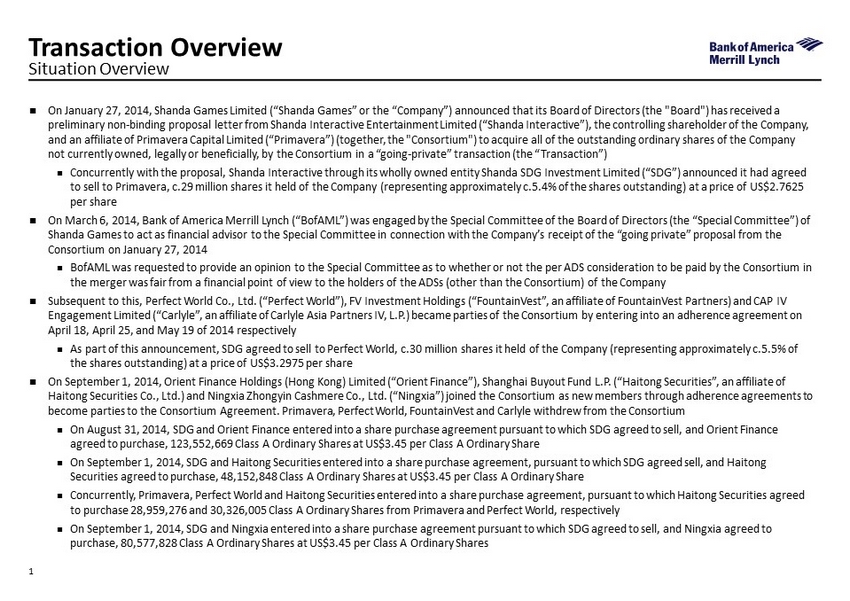
; On January 27, 2014, Shanda Games Limited (“Shanda Games” or the “Company”) announced that its Board of Directors (the "Board ") has received a preliminary non - binding proposal letter from Shanda Interactive Entertainment Limited (“Shanda Interactive”), the controlling sh areholder of the Company, and an affiliate of Primavera Capital Limited (“Primavera”) (together, the "Consortium") to acquire all of the outstanding or din ary shares of the Company not currently owned, legally or beneficially, by the Consortium in a “going - private” transaction (the “Transaction”) ; Concurrently with the proposal, Shanda Interactive through its wholly owned entity Shanda SDG Investment Limited (“SDG”) anno unc ed it had agreed to sell to Primavera, c.29 million shares it held of the Company (representing approximately c.5.4% of the shares outstanding ) a t a price of US$2.7625 per share ; On March 6, 2014, Bank of America Merrill Lynch (“ BofAML ”) was engaged by the Special Committee of the Board of Directors (the “Special Committee”) of Shanda Games to act as financial advisor to the Special Committee in connection with the Company’s receipt of the “going priv ate ” proposal from the Consortium on January 27, 2014 ; BofAML was requested to provide an opinion to the Special Committee as to whether or not the per ADS consideration to be paid by the C onsortium in the merger was fair from a financial point of view to the holders of the ADSs (other than the Consortium) of the Company ; Subsequent to this, Perfect World Co., Ltd. (“Perfect World”), FV Investment Holdings (“ FountainVest ”, an affiliate of FountainVest Partners) and CAP IV Engagement Limited (“Carlyle”, an affiliate of Carlyle Asia Partners IV, L.P.) became parties of the Consortium by entering i nto an adherence agreement on April 18, April 25, and May 19 of 2014 respectively ; As part of this announcement, SDG agreed to sell to Perfect World, c.30 million shares it held of the Company (representing a ppr oximately c.5.5% of the shares outstanding) at a price of US$3.2975 per share ; On September 1, 2014, Orient Finance Holdings (Hong Kong) Limited (“Orient Finance”), Shanghai Buyout Fund L.P. (“ Haitong Securities”, an affiliate of Haitong Securities Co., Ltd.) and Ningxia Zhongyin Cashmere Co., Ltd. (“Ningxia”) joined the Consortium as new members through adherence agreements to become parties to the Consortium Agreement. Primavera, Perfect World, FountainVest and Carlyle withdrew from the Consortium ; On August 31, 2014, SDG and Orient Finance entered into a share purchase agreement pursuant to which SDG agreed to sell, and Ori ent Finance agreed to purchase, 123,552,669 Class A Ordinary Shares at US$3.45 per Class A Ordinary Share ; On September 1, 2014, SDG and Haitong Securities entered into a share purchase agreement, pursuant to which SDG agreed sell, and Haitong Securities agreed to purchase, 48,152,848 Class A Ordinary Shares at US$3.45 per Class A Ordinary Share ; Concurrently, Primavera, Perfect World and Haitong Securities entered into a share purchase agreement, pursuant to which Haitong Securities agreed to purchase 28,959,276 and 30,326,005 Class A Ordinary Shares from Primavera and Perfect World, respectively ; On September 1, 2014, SDG and Ningxia entered into a share purchase agreement pursuant to which SDG agreed to sell, and Ningx ia agreed to purchase, 80,577,828 Class A Ordinary Shares at US$3.45 per Class A Ordinary Shares 1 Situation Overview Transaction Overview
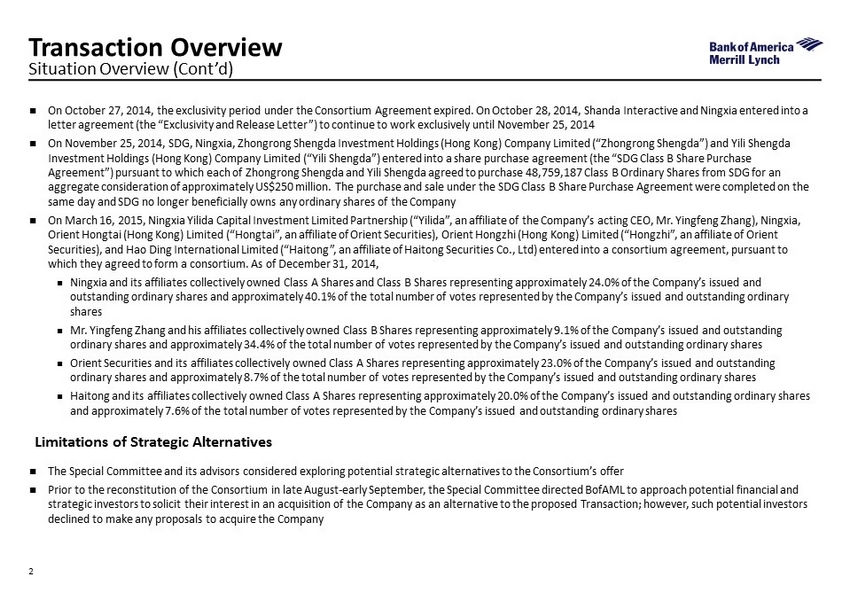
2 Situation Overview (Cont’d) Transaction Overview Limitations of Strategic Alternatives ; On October 27, 2014, the exclusivity period under the Consortium Agreement expired. On October 28, 2014, Shanda Interactive a nd Ningxia entered into a letter agreement (the “Exclusivity and Release Letter”) to continue to work exclusively until November 25, 2014 ; On November 25, 2014, SDG, Ningxia, Zhongrong Shengda Investment Holdings (Hong Kong) Company Limited (“ Zhongrong Shengda ”) and Yili Shengda Investment Holdings (Hong Kong) Company Limited (“ Yili Shengda ”) entered into a share purchase agreement (the “SDG Class B Share Purchase Agreement”) pursuant to which each of Zhongrong Shengda and Yili Shengda agreed to purchase 48,759,187 Class B Ordinary Shares from SDG for an aggregate consideration of approximately US$250 million. The purchase and sale under the SDG Class B Share Purchase Agreement we re completed on the same day and SDG no longer beneficially owns any ordinary shares of the Company ; On March 16, 2015, Ningxia Yilida Capital Investment Limited Partnership (“ Yilida ”, an affiliate of the Company’s acting CEO, Mr. Yingfeng Zhang), Ningxia, Orient Hongtai (Hong Kong) Limited (“ Hongtai ”, an affiliate of Orient Securities), Orient Hongzhi (Hong Kong) Limited (“ Hongzhi ”, an affiliate of Orient Securities), and Hao Ding International Limited (“ Haitong ”, an affiliate of Haitong Securities Co., Ltd) entered into a consortium agreement, pursuant to which they agreed to form a consortium . As of December 31, 2014, ; Ningxia and its affiliates collectively owned Class A Shares and Class B Shares representing approximately 24.0% of the Compa ny’ s issued and outstanding ordinary shares and approximately 40.1% of the total number of votes represented by the Company’s issued and outs tan ding ordinary shares ; Mr. Yingfeng Zhang and his affiliates collectively owned Class B Shares representing approximately 9.1% of the Company’s issued and outsta nd ing ordinary shares and approximately 34.4% of the total number of votes represented by the Company’s issued and outstanding ordi nar y shares ; Orient Securities and its affiliates collectively owned Class A Shares representing approximately 23.0% of the Company’s issu ed and outstanding ordinary shares and approximately 8.7% of the total number of votes represented by the Company’s issued and outstanding ordin ary shares ; Haitong and its affiliates collectively owned Class A Shares representing approximately 20.0% of the Company’s issued and outstanding o rdinary shares and approximately 7.6% of the total number of votes represented by the Company’s issued and outstanding ordinary shares ; The Special Committee and its advisors considered exploring potential strategic alternatives to the Consortium’s offer ; Prior to the reconstitution of the Consortium in late August - early September, the Special Committee directed BofAML to approach potential financial and strategic investors to solicit their interest in an acquisition of the Company as an alternative to the proposed Transaction; ho wever, such potential investors declined to make any proposals to acquire the Company
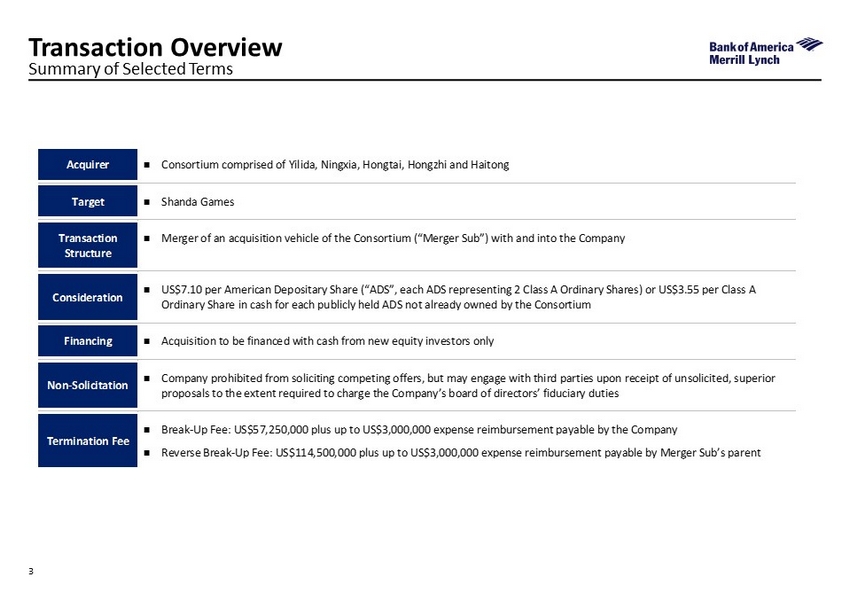
Acquirer ; Consortium comprised of Yilida, Ningxia, Hongtai, Hongzhi and Haitong Target ; Shanda Games Transaction Structure ; Merger of an acquisition vehicle of the Consortium (“Merger Sub”) with and into the Company Consideration ; US$7.10 per American Depositary Share (“ADS”, each ADS representing 2 Class A Ordinary Shares) or US$3.55 per Class A Ordinary Share in cash for each publicly held ADS not already owned by the Consortium Financing ; Acquisition to be financed with cash from new equity investors only Non-Solicitation ; Company prohibited from soliciting competing offers, but may engage with third parties upon receipt of unsolicited, superior proposals to the extent required to charge the Company’s board of directors’ fiduciary duties Termination Fee ; Break-Up Fee: US$57,250,000 plus up to US$3,000,000 expense reimbursement payable by the Company ; Reverse Break-Up Fee: US$114,500,000 plus up to US$3,000,000 expense reimbursement payable by Merger Sub’s parent 3 Summary of Selected Terms Transaction Overview

First FConsortium Offer Revised Consortium Offer Offer Price US$6.90 US$7.10 Price (US$) Offer Price Premium / (Discount) Current (3/27/2015) 6.48 6.5% 9.6% VWAP (Before 01/27/2014) (5) 1-Day 5.71 20.8% 24.3% 5-Day 5.26 31.1% 34.9% 30-Day 4.85 42.4% 46.5% 3-Month 4.60 49.9% 54.2% 6-Month 4.53 52.3% 56.7% 12-Month 4.33 59.5% 64.1% 4 Implied Premiums to Historical Stock Prices (4) Summary of Transaction Value (Amounts in US$ millions except per share data) Transaction Summary Transaction Overview ____________________ Source: FactSet , Bloomberg, Company SEC filings, Company model (1) Based on fully diluted number of shares from Management as of December 31, 2014. 537,832,318 ordinary shares outstanding, 14 ,953,191 vested but not exercised options outstanding and unvested options outstanding @ US$2.1/share average exercise price, and 915,730 unvested restricted s har es. Options have been treated on an as - converted basis using Treasury Stock Method (2) Includes short - term borrowings, long - term borrowings, dividend payable and other payables to related parties as of December 31, 2014 (3) Includes cash, cash equivalents, restricted cash, short - term investments and time deposits with maturity over one year as of December 31, 2014 ____________________ (4) Represents number of trading days and calendar months respectively. The time frame of VWAP refers to calendar month or the p revious trading day if the date falls on a weekend or public holiday (5) Source: VWAP based on FactSet (6) Represents FactSet consensus as of January 24, 2014 from Wall Street research estimates Offer price per ADS $6.90 $7.10 Total ADS outstanding (mm) (1) 272.3 272.4 Implied Equity Value (1) $1,878.9 $1,934.2 Adjustment for net debt: Debt (2) 13.7 13.7 Cash (3) (130.8) (130.8) Non-controlling interests 46.7 46.7 Implied Enterprise Value $1,808.4 $1,863.8 Implied Transaction Multiples Amount Multiple Multiple 2014A Net Earnings per ADS 0.63 11.0x 11.3x Broker Consensus (6) 2015E Net Earnings per ADS 0.82 8.4x 8.6x 2016E Net Earnings per ADS n.a. n.a. n.a. Management Projections 2015E Net Earnings per ADS 0.74 9.3x 9.6x 2016E Net Earnings per ADS 0.88 7.8x 8.1x
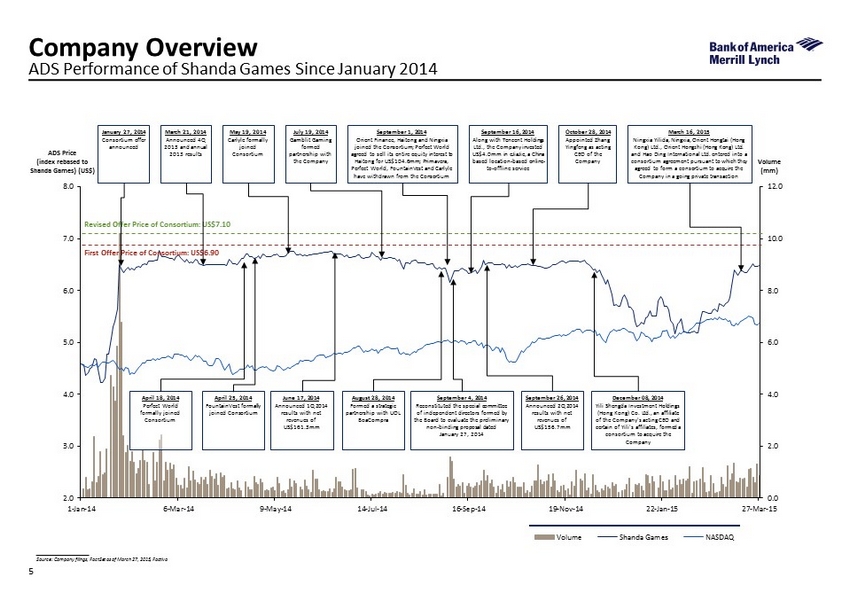
0.0 2.0 4.0 6.0 8.0 10.0 12.0 2.0 3.0 4.0 5.0 6.0 7.0 8.0 1-Jan-14 6-Mar-14 9-May-14 14-Jul-14 16-Sep-14 19-Nov-14 22-Jan-15 27-Mar-15 Volume Shanda Games NASDAQ 5 ADS Performance of Shanda Games Since January 2014 Company Overview ____________________ Source: Company filings, FactSet as of March 27, 2015, Factiva ADS Price (index rebased to Shanda Games) (US$) Volume (mm) First Offer Price of Consortium: US$6.90 Revised Offer Price of Consortium: US$7.10 April 18, 2014 Perfect World formally joined Consortium January 27, 2014 Consortium offer announced July 19, 2014 Gamblit Gaming formed partnership with the Company September 1, 2014 Orient Finance, Haitong and Ningxia joined the Consortium; Perfect World agreed to sell its entire equity interest to Haitong for US$104.6mm; Primavera, Perfect World, FountainVest and Carlyle have withdrawn from the Consortium September 4, 2014 Reconstituted the special committee of independent directors formed by the Board to evaluate the preliminary non - binding proposal dated January 27, 2014 May 19, 2014 Carlyle formally joined Consortium June 17, 2014 Announced 1Q 2014 results with net revenues of US$161.3mm April 25, 2014 FountainVest formally joined Consortium March 21, 2014 Announced 4Q 2013 and annual 2013 results August 28, 2014 Formed a strategic partnership with UOL BoaCompra September 26, 2014 Announced 2Q 2014 results with net revenues of US$156.7mm September 16, 2014 Along with Tencent Holdings Ltd., the Company invested US$4.0mm in eJiaJie, a China based location - based online - to - offline service October 28, 2014 Appointed Zhang Yingfeng as acting CEO of the Company December 08, 2014 Yili Shengda Investment Holdings (Hong Kong) Co. Ltd., an affiliate of the Company's acting CEO and certain of Yili's affiliates, formed a consortium to acquire the Company March 16, 2015 Ningxia Yilida, Ningxia, Orient Hongtai (Hong Kong) Ltd., Orient Hongzhi (Hong Kong) Ltd. and Hao Ding International Ltd. entered into a consortium agreement pursuant to which they agreed to form a consortium to acquire the Company in a going private transaction
2. Valuation Analysis
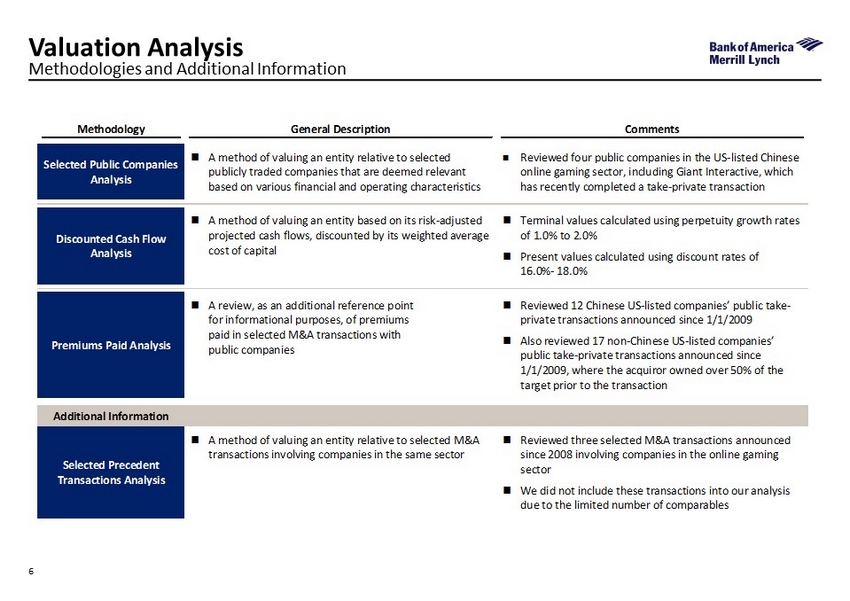
6 Methodology General Description Comments Selected Public Companies Analysis ; A method of valuing an entity relative to selected publicly traded companies that are deemed relevant based on various financial and operating characteristics ; Reviewed four public companies in the US-listed Chinese online gaming sector, including Giant Interactive, which has recently completed a take-private transaction Discounted Cash Flow Analysis ; A method of valuing an entity based on its risk-adjusted projected cash flows, discounted by its weighted average cost of capital ; Terminal values calculated using perpetuity growth rates of 1.0% to 2.0% ; Present values calculated using discount rates of 16.0%- 18.0% Premiums Paid Analysis ; A review, as an additional reference point for informational purposes, of premiums paid in selected M&A transactions with public companies ; Reviewed 12 Chinese US-listed companies’ public take- private transactions announced since 1/1/2009 ; Also reviewed 17 non-Chinese US-listed companies’ public take-private transactions announced since 1/1/2009, where the acquiror owned over 50% of the target prior to the transaction Additional Information Selected Precedent Transactions Analysis ; A method of valuing an entity relative to selected M&A transactions involving companies in the same sector ; Reviewed three selected M&A transactions announced since 2008 involving companies in the online gaming sector ; We did not include these transactions into our analysis due to the limited number of comparables Valuation Analysis Methodologies and Additional Information
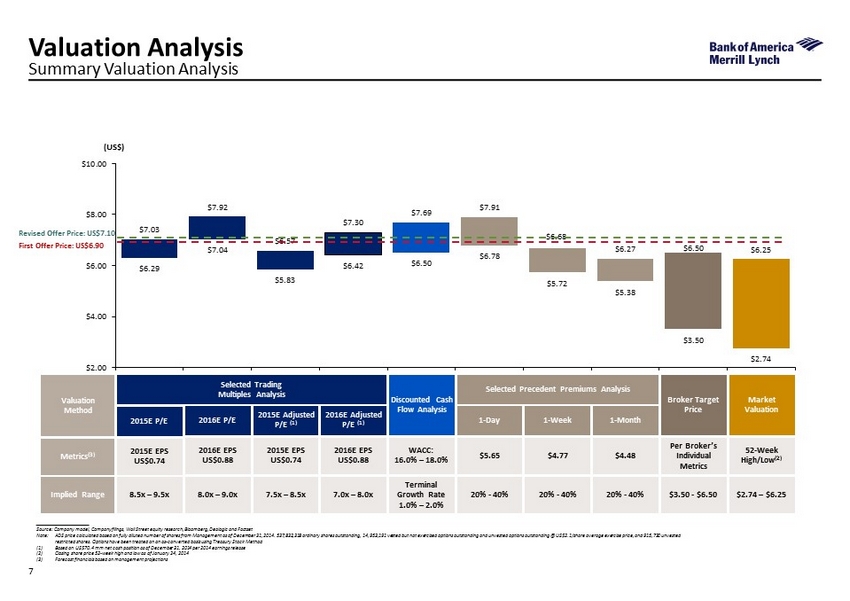
7 Valuation Analysis Summary Valuation Analysis ____________________ Source: Company model, Company filings , Wall Street equity research, Bloomberg, Dealogic and Factset Note: ADS price calculated based on fully diluted number of shares from Management as of December 31, 2014. 537,832,318 ordinary shares outstanding, 14,953,191 vested but not exercised options outstanding and unvested options outstan din g @ US$2.1/share average exercise price, and 915,730 unvested restricted shares. Options have been treated on an as - converted basis using Treasury Stock Method (1) Based on US$70.4 mm net cash position as of December 31, 2014 per 2014 earnings release (2) Closing share price 52 - week high and low as of January 24, 2014 (3) Forecast financials based on management projections $6.29 $7.04 $5.83 $6.42 $6.50 $6.78 $5.72 $5.38 $3.50 $2.74 $7.03 $7.92 $6.57 $7.30 $7.69 $7.91 $6.68 $6.27 $6.50 $6.25 $2.00 $4.00 $6.00 $8.00 $10.00 (US$) Valuation Method Metrics (3) Implied Range Selected Precedent Premiums Analysis 1 - Week 1 - Day $5.65 $4.77 20% - 40 % 20% - 40 % 1 - Month $4.48 20% - 40 % Market Valuation 52 - Week High/Low (2) $2.74 – $6.25 Broker Target Price Per Broker’s Individual Metrics $3.50 - $6.50 Selected Trading Multiples Analysis 2016E P/E 2015E P/E 2015E EPS US$0.74 8.5x – 9.5x 2016E EPS US$0.88 8.0x – 9.0x 2016E Adjusted P/E (1) 2015E Adjusted P/E (1) 2015E EPS US$0.74 7.5x – 8.5x 2016E EPS US$0.88 7.0x – 8.0x Discounted Cash Flow Analysis WACC: 16.0% – 18.0% Terminal Growth Rate 1.0% – 2.0% Revised Offer Price: US$7.10 First Offer Price: US$ 6 . 9 0
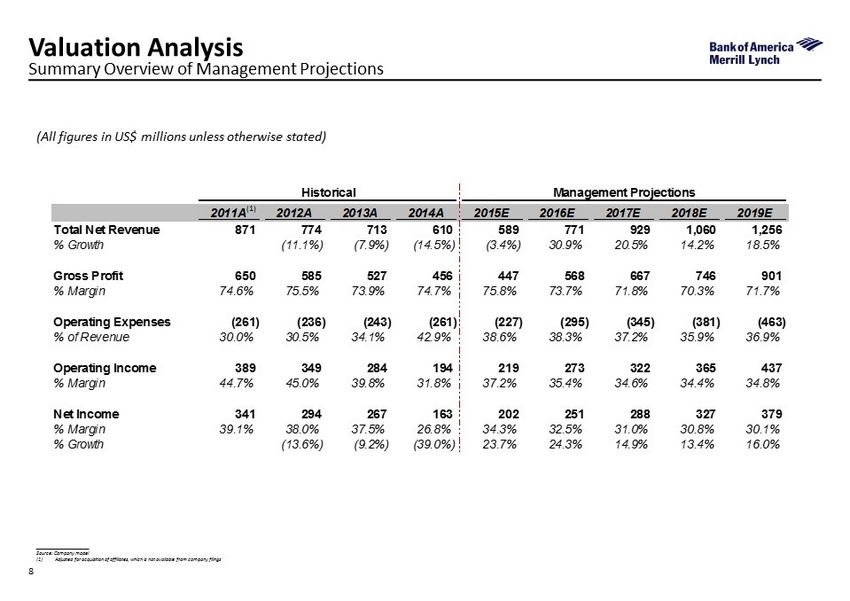
Historical Management Projections 2011A 2012A 2013A 2014A 2015E 2016E 2017E 2018E 2019E Total Net Revenue 871 774 713 610 589 771 929 1,060 1,256 % Growth (11.1%) (7.9%) (14.5%) (3.4%) 30.9% 20.5% 14.2% 18.5% Gross Profit 650 585 527 456 447 568 667 746 901 % Margin 74.6% 75.5% 73.9% 74.7% 75.8% 73.7% 71.8% 70.3% 71.7% Operating Expenses (261) (236) (243) (261) (227) (295) (345) (381) (463) % of Revenue 30.0% 30.5% 34.1% 42.9% 38.6% 38.3% 37.2% 35.9% 36.9% Operating Income 389 349 284 194 219 273 322 365 437 % Margin 44.7% 45.0% 39.8% 31.8% 37.2% 35.4% 34.6% 34.4% 34.8% Net Income 341 294 267 163 202 251 288 327 379 % Margin 39.1% 38.0% 37.5% 26.8% 34.3% 32.5% 31.0% 30.8% 30.1% % Growth (13.6%) (9.2%) (39.0%) 23.7% 24.3% 14.9% 13.4% 16.0% 8 (All figures in US$ millions unless otherwise stated) Summary Overview of Management Projections Valuation Analysis ____________________ Source: Company model (1) Adjusted for acquisition of affiliates, which is not available from company filings (1)
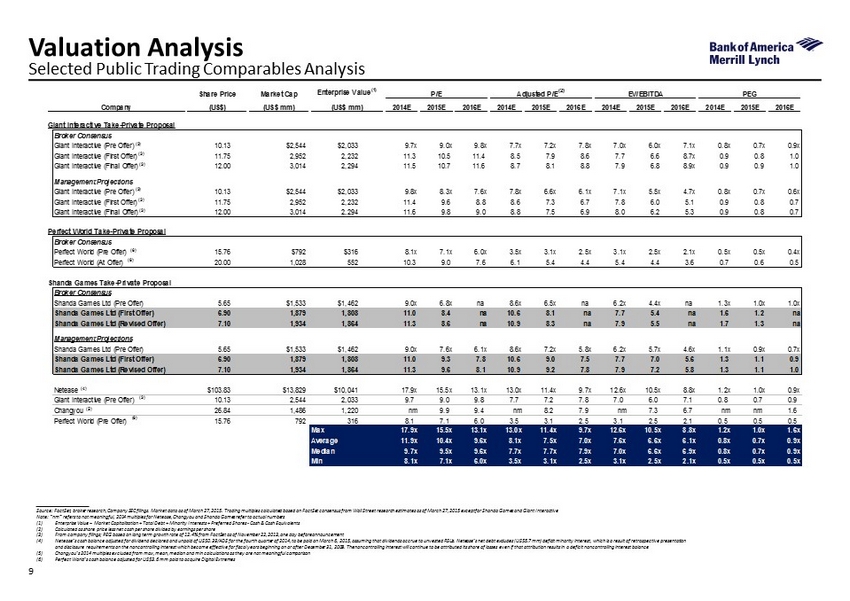
9 Selected Public Trading Comparables Analysis Valuation Analysis ____________________ Source: FactSet, broker research, Company SEC filings. Market data as of March 27, 2015. Trading multiples calculated based o n F actSet consensus from Wall Street research estimates as of March 27, 2015 except for Shanda Games and Giant Interactive Note: “nm” refers to not meaningful, 2014 multiples for Netease , Changyou and Shanda Games refer to actual numbers (1) Enterprise Value = Market Capitalization + Total Debt + Minority Interests + Preferred Shares - Cash & Cash Equivalents (2) Calculated as share price less net cash per share divided by earnings per share (3) From company filings; PEG based on long term growth rate of 12.4% from FactSet as of November 22, 2013, one day before announ cem ent (4) Netease’s cash balance adjusted for dividend declared and unpaid of US$0.39/ADS for the fourth quarter of 2014, to be paid on March 6, 20 15, assuming that dividends accrue to unvested RSUs. Netease’s net debt excludes (US$5.7 mm) deficit minority interest, which is a result of retrospective presentation and disclosure requirements on the noncontrolling interest which became effective for fiscal years beginning on or after December 31, 2008. The noncontrolling interest will continue to be attributed its share of losses even if that attribution results in a deficit noncontrolling interest balance (5) Changyou’s 2014 multiples excluded from max, mean, median and min calculations as they are not meaningful comparison (6) Perfect World’s cash balance adjusted for US$3.6 mm paid to acquire Digital Extremes Share Price Market Cap Enterprise Value (1) Company (US$) (US$ mm) (US$ mm) 2014E 2015E 2016E 2014E 2015E 2016E 2014E 2015E 2016E 2014E 2015E 2016E Giant Interactive Take-Private Proposal Broker Consensus Giant Interactive (Pre Offer) 10.13 $2,544 $2,033 9.7x 9.0x 9.8x 7.7x 7.2x 7.8x 7.0x 6.0x 7.1x 0.8x 0.7x 0.9x Giant Interactive (First Offer) 11.75 2,952 2,232 11.3 10.5 11.4 8.5 7.9 8.6 7.7 6.6 8.7x 0.9 0.8 1.0 Giant Interactive (Final Offer) 12.00 3,014 2,294 11.5 10.7 11.6 8.7 8.1 8.8 7.9 6.8 8.9x 0.9 0.9 1.0 Management Projections Giant Interactive (Pre Offer) 10.13 $2,544 $2,033 9.8x 8.3x 7.6x 7.8x 6.6x 6.1x 7.1x 5.5x 4.7x 0.8x 0.7x 0.6x Giant Interactive (First Offer) 11.75 2,952 2,232 11.4 9.6 8.8 8.6 7.3 6.7 7.8 6.0 5.1 0.9 0.8 0.7 Giant Interactive (Final Offer) 12.00 3,014 2,294 11.6 9.8 9.0 8.8 7.5 6.9 8.0 6.2 5.3 0.9 0.8 0.7 Perfect World Take-Private Proposal Broker Consensus Perfect World (Pre Offer) 15.76 $792 $316 8.1x 7.1x 6.0x 3.5x 3.1x 2.5x 3.1x 2.5x 2.1x 0.5x 0.5x 0.4x Perfect World (At Offer) 20.00 1,028 552 10.3 9.0 7.6 6.1 5.4 4.4 5.4 4.4 3.6 0.7 0.6 0.5 Shanda Games Take-Private Proposal Broker Consensus Shanda Games Ltd (Pre Offer) 5.65 $1,533 $1,462 9.0x 6.8x na 8.6x 6.5x na 6.2x 4.4x na 1.3x 1.0x 1.0x Shanda Games Ltd (First Offer) 6.90 1,879 1,808 11.0 8.4 na 10.6 8.1 na 7.7 5.4 na 1.6 1.2 na Shanda Games Ltd (Revised Offer) 7.10 1,934 1,864 11.3 8.6 na 10.9 8.3 na 7.9 5.5 na 1.7 1.3 na Management Projections Shanda Games Ltd (Pre Offer) 5.65 $1,533 $1,462 9.0x 7.6x 6.1x 8.6x 7.2x 5.8x 6.2x 5.7x 4.6x 1.1x 0.9x 0.7x Shanda Games Ltd (First Offer) 6.90 1,879 1,808 11.0 9.3 7.8 10.6 9.0 7.5 7.7 7.0 5.6 1.3 1.1 0.9 Shanda Games Ltd (Revised Offer) 7.10 1,934 1,864 11.3 9.6 8.1 10.9 9.2 7.8 7.9 7.2 5.8 1.3 1.1 1.0 Netease $103.83 $13,829 $10,041 17.9x 15.5x 13.1x 13.0x 11.4x 9.7x 12.6x 10.5x 8.8x 1.2x 1.0x 0.9x Giant Interactive (Pre Offer) 10.13 2,544 2,033 9.7 9.0 9.8 7.7 7.2 7.8 7.0 6.0 7.1 0.8 0.7 0.9 Changyou 26.84 1,486 1,220 nm 9.9 9.4 nm 8.2 7.9 nm 7.3 6.7 nm nm 1.6 Perfect World (Pre Offer) 15.76 792 316 8.1 7.1 6.0 3.5 3.1 2.5 3.1 2.5 2.1 0.5 0.5 0.5 Max 17.9x 15.5x 13.1x 13.0x 11.4x 9.7x 12.6x 10.5x 8.8x 1.2x 1.0x 1.6x Average 11.9x 10.4x 9.6x 8.1x 7.5x 7.0x 7.6x 6.6x 6.1x 0.8x 0.7x 0.9x Median 9.7x 9.5x 9.6x 7.7x 7.7x 7.9x 7.0x 6.6x 6.9x 0.8x 0.7x 0.9x Min 8.1x 7.1x 6.0x 3.5x 3.1x 2.5x 3.1x 2.5x 2.1x 0.5x 0.5x 0.5x P/E Adjusted P/E (2) EV/EBITDA PEG (3) (3) (4) (3) (3) (3) (3) (5) (6) (3) (6) (6)
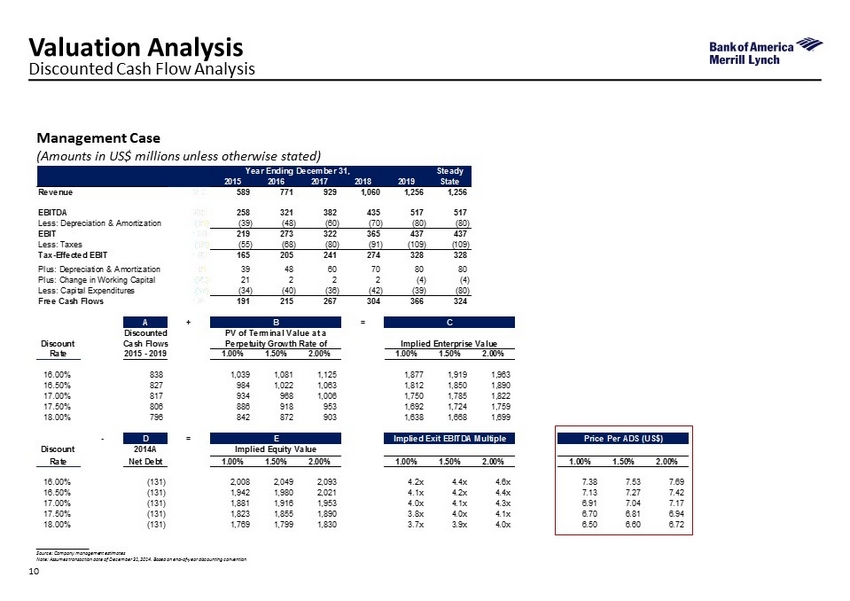
10 Management Case (Amounts in US$ millions unless otherwise stated) Discounted Cash Flow Analysis Valuation Analysis ____________________ Source: Company management estimates Note: Assumes transaction date of December 31, 2014. Based on end - of - year discounting convention Year Ending December 31, Steady 2013 2014 2015 2016 2017 2018 2019 State Revenue 610 589 771 929 1,060 1,256 1,256 EBITDA 235 258 321 382 435 517 517 Less: Depreciation & Amortization (41) (39) (48) (60) (70) (80) (80) EBIT 194 219 273 322 365 437 437 Less: Taxes (49) (55) (68) (80) (91) (109) (109) Tax-Effected EBIT 146 165 205 241 274 328 328 Plus: Depreciation & Amortization 41 39 48 60 70 80 80 Plus: Change in Working Capital (28) 21 2 2 2 (4) (4) Less: Capital Expenditures (37) (34) (40) (36) (42) (39) (80) Free Cash Flows 121 191 215 267 304 366 324 A + B = C Discounted PV of Terminal Value at a Discount Cash Flows Perpetuity Growth Rate of Implied Enterprise Value Rate 2015 - 2019 1.00% 1.50% 2.00% 1.00% 1.50% 2.00% 16.00% 838 1,039 1,081 1,125 1,877 1,919 1,963 16.50% 827 984 1,022 1,063 1,812 1,850 1,890 17.00% 817 934 968 1,006 1,750 1,785 1,822 17.50% 806 886 918 953 1,692 1,724 1,759 18.00% 796 842 872 903 1,638 1,668 1,699 - D = E Implied Exit EBITDA Multiple Price Per ADS (US$) Discount 2014A Implied Equity Value Rate Net Debt 1.00% 1.50% 2.00% 1.00% 1.50% 2.00% 1.00% 1.50% 2.00% 16.00% (131) 2,008 2,049 2,093 4.2x 4.4x 4.6x 7.38 7.53 7.69 16.50% (131) 1,942 1,980 2,021 4.1x 4.2x 4.4x 7.13 7.27 7.42 17.00% (131) 1,881 1,916 1,953 4.0x 4.1x 4.3x 6.91 7.04 7.17 17.50% (131) 1,823 1,855 1,890 3.8x 4.0x 4.1x 6.70 6.81 6.94 18.00% (131) 1,769 1,799 1,830 3.7x 3.9x 4.0x 6.50 6.60 6.72

0.04 0.36 0.75 (0.04) (0.36) (0.69) (1.00) (0.50) 0.00 0.50 1.00 (1.11) (0.74) (0.37) (1.50) (1.00) (0.50) 0.00 ____________________ Source: Company management Note: Assumes valuation date as of December 31, 2014. DCF uses end of year convention (1) Calculated by sensitizing selected metric while maintaining management case assumptions for all other metrics (2) Based on WACC assumption of 17.0% and terminal growth rate of 1.5% 11 Pipeline Games Revenue Sensitivity (1) Financial Sensitivities Analysis (1) Discounted Cash Flow Analysis (Sensitivities) Valuation Analysis Value Driver Changes Considered Annually Impact on DCF Value Revenue Growth (2015 – 2019) EBITDA Margin (2015 – 2019) Capex Increase (2015 – 2019) – /+ 2.0% – /+ 2.0% +/ – 10.0% Change in Price per ADS (US$) Mid - point Implied Price per ADS: US$7.04 (2) US$6.35 US$6.68 US$6.99 US$7.78 US$7.40 US$7.08 Scenario Impact on DCF Value 10% Downside Case on Pipeline Games Revenue Between 2015 - 2019 20% Downside Case on Pipeline Games Revenue Between 2015 - 2019 30% Downside Case on Pipeline Games Revenue Between 2015 - 2019 Change in Price per ADS (US$) Mid - point Implied Price per ADS: US$7.04 (2) US$6.66 US$6.29 US$5.92

12 Selected Precedent Privatization Premiums Analysis Valuation Analysis ____________________ Source: Dealogic Note: Represents 100% acquisitions with “grossed up” deal value (i.e. inclusive of acquiror stake) between US$100 mm and US$3 bn in which the acquiror’s initial stake was above 50% (1) Represents “grossed up” deal value (i.e. inclusive of acquiror stake) (2) Represents premium over the closing price as of the trading day, 1 week and 1 month prior to announcement date ; Since 2009, a number of US - listed companies have been taken private in comparable going - private transactions ; The median premiums paid over the trading price at announcement in the selected precedent transactions involving Chinese US - listed companies have been in the 25% - 30% range ; The Consortium’s offer for Shanda (US$7.10/ADS) represented a 1 - day, 1 - week and 1 - month premium of 25.7%, 48.8% and 57.6%, respectively Selected Going - Private Transactions since January 1, 2009 with US - Listed Targets Date Deal Value (1) Final Offer Premium Prior to Announcment (2) Announced Acquiror Target (US$mm) 1 Day (%) 1 Week (%) 1 Month (%) Chinese U.S. Listed Companies 2-Jan-15 Existing Management (Michael Yufeng Chi) Perfect World Co Ltd 1,028 26.9% 26.3% 22.9% 24-Dec-13 Private Investor (Xu Dong, Tang Benguo, Wang Xiaotong); Morgan Stanley Private Equity Asia Noah Education Holdings 105 24.4% 22.3% 16.2% 30-Sep-13 Existing Management (He Dang); China Media Capital Charm Communications 198 17.2% 7.3% 17.2% 6-Jul-12 Existing Management (Mr Michael Xin Hui); TPG Ventures ShangPharma Corp 172 30.8% 32.2% 48.5% 9-May-12 Private Investor (Mr Baizhong Xue) China Nuokang Bio-Pharmaceutical 115 56.8% 57.6% 59.8% 2-Apr-12 Existing Management (Mr Jiangquan Li) Winner Medical Group 112 32.3% 42.9% 21.6% 28-Oct-11 E-House (China) Holdings China Real Estate Information Corp 956 25.3% 35.9% 37.0% 17-Oct-11 Existing Management (Tianqiao Chen, Qianqian Luo & Danian Chen) Shanda Interactive Entertainment 2,285 23.5% 27.7% 16.7% 24-Jun-11 TIENS (USA) Investment Holdings Group Overseas Tiens Biotech Group (USA) 123 67.0% 63.8% 30.2% 25-Mar-11 PAG Asia Capital; Existing Management; ARC Capital Holdings Funtalk China Holdings 460 17.1% 25.7% 43.1% 11-Nov-10 Primavera Capital Management Chemspec International 293 28.2% 22.2% 30.6% 8-Apr-10 Hanmax Investment Ltd; Shanghai Fosun Pharmaceutical (Group) Tongjitang Chinese Medicines 125 19.0% 20.3% 17.8% Mean 30.7% 32.0% 30.1% Median 26.1% 27.0% 26.6% Non-Chinese U.S. Listed Companies 23-Oct-14 Brookfield Asset Management Inc Brookfield Residential Properties Inc 2,894 27.5% 33.5% 23.6% 27-Aug-13 Plains All American Pipeline PAA Natural Gas Storage 1,988 9.1% 10.8% 3.9% 7-May-13 Pioneer Natural Resources Pioneer Southwest Energy Partners 1,112 19.4% 18.5% 24.5% 20-Feb-13 Chiesi Farmaceutici Cornerstone Therapeutics 262 72.7% 76.6% 70.3% 7-May-13 BFC Financial Corp BBX Capital Corp 197 (8.8%) (3.4%) 40.6% 15-Nov-12 BFC Financial Corp Bluegreen Corp 320 73.6% 71.8% 58.7% 31-Jan-12 Ayala Corp; Ares Management LLC; Providence Equity Partners Stream Global Services 249 1.6% (0.9%) (1.8%) 29-Aug-11 Private Investor (Timothy M. Marquez) Venoco 806 39.2% 45.5% (1.7%) 16-Jun-11 Angelo Gordon & Co C&D Technologies 148 18.3% 17.5% 22.3% 23-Feb-11 Enterprise Products Partners Duncan Energy Partners 1,353 (32.2%) (32.2%) (31.3%) 19-Jan-11 ACF Industries Holding Corp XO Holdings 255 84.2% 93.1% 102.9% 3-Dec-10 Sun Pharmaceutical Industries Caraco Pharmaceutical Laboratories 208 16.4% 18.2% 19.3% 1-Nov-10 Loews Corp CNA Surety Corp 1,205 37.9% 37.7% 46.9% 26-Apr-10 SembCorp Industries; SembCorp Utilities Cascal NV 206 (11.3%) (7.0%) 0.2% 3-Nov-09 Private Investor (Tilman J Fertitta) Landry's Restaurants 424 127.7% 116.0% 138.3% 29-Jul-09 Overseas Shipholding Group OSG America 308 41.4% 56.5% 54.1% 23-Mar-09 Cox Enterprises Cox Radio 386 45.5% 47.7% (6.3%) Mean 33.1% 35.3% 33.2% Median 27.5% 33.5% 23.6% Global Mean 32.1% 33.9% 31.9% Global Median 26.9% 27.7% 23.6% 27-Jan-14 Old Consortium @US$6.90 Shanda Games Ltd 1,879 22.1% 44.6% 53.2% 22-Sep-14 New Consortium @US$7.10 Shanda Games Ltd 1,934 25.7% 48.8% 57.6% First Offer Premium / (Discount) to China Median (4.0%) 17.6% 26.6% First Premium / (Discount) to Global Median (4.8%) 16.9% 29.5% Revised Offer Premium / (Discount) to China Median (0.4%) 21.8% 31.0% Revised Premium / (Discount) to Global Median (1.2%) 21.1% 34.0%

13 Selected Precedent Privatization Premiums Analysis (Cont’d) Valuation Analysis ____________________ Source: Dealogic, Bloomberg (1) Represents premium over the closing price as of the trading day, 1 week and 1 month prior to January 27, 2014 (2) Based on 29 selected acquisitions (as indicated on page 9) since January 2009 with “grossed up” deal value between US$100 mm and US$3 bn involving US - listed companies in which the acquiror’s initial stake was above 50% 1 - Day Premium (1) 1 - Week Premium (1) 1 - Month Premium (1) % of Deals (2) Mean: 32.1% Median: 26.9% Consortium’s Offer: 25.7% Mean: 33.9% Median: 33.5% Consortium’s Offer: 48.8% Mean: 31.9% Median: 23.6% Consortium’s Offer: 57.6% % of Deals (2) % of Deals (2) 20.0% 6.7% 13.3% 23.3% 20.0% 16.7% <10% 10%-20% 20%-30% 30%-40% 40%-50% >50% 23.3% 10.0% 13.3% 23.3% 13.3% 16.7% <10% 10%-20% 20%-30% 30%-40% 40%-50% >50% 20.0% 13.3% 10.0% 20.0% 16.7% 20.0% <10% 10%-20% 20%-30% 30%-40% 40%-50% >50%
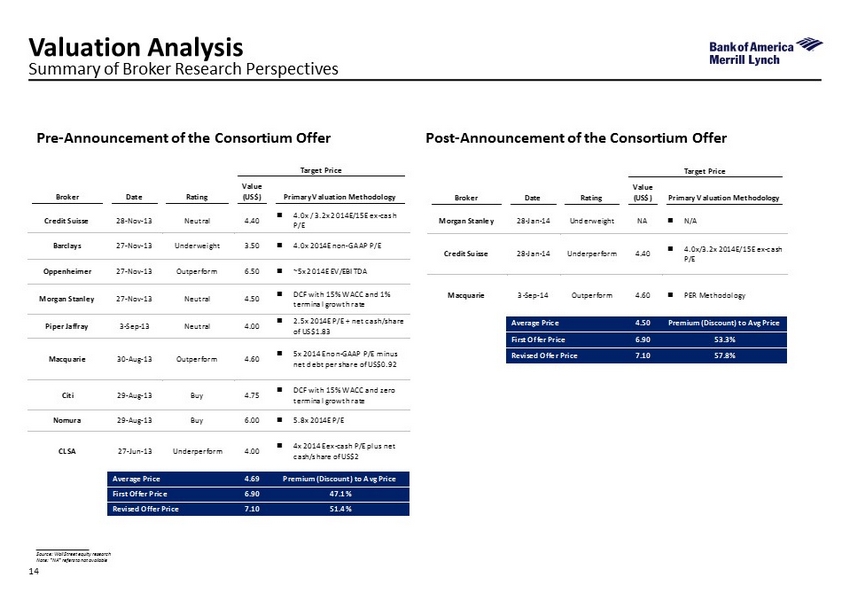
Target Price Broker Date Rating Value (US$) Primary Valuation Methodology Morgan Stanley 28-Jan-14 Underweight NA ; N/A Credit Suisse 28-Jan-14 Underperform 4.40 ; 4.0x/3.2x 2014E/15E ex-cash P/E Macquarie 3-Sep-14 Outperform 4.60 ; PER Methodology Average Price 4.50 Premium (Discount) to Avg Price First Offer Price 6.90 53.3% Revised Offer Price 7.10 57.8% 14 Summary of Broker Research Perspectives Valuation Analysis ____________________ Source: Wall Street equity research Note: “ NA ” refers to not available Post - Announcement of the Consortium Offer Pre - Announcement of the Consortium Offer Target Price Broker Date Rating Value (US$) Primary Valuation Methodology Credit Suisse 28-Nov-13 Neutral 4.40 ; 4.0x / 3.2x 2014E/15E ex-cash P/E Barclays 27-Nov-13 Underweight 3.50 ; 4.0x 2014E non-GAAP P/E Oppenheimer 27-Nov-13 Outperform 6.50 ; ~5x 2014E EV/EBITDA Morgan Stanley 27-Nov-13 Neutral 4.50 ; DCF with 15% WACC and 1% terminal growth rate Piper Jaffray 3-Sep-13 Neutral 4.00 ; 2.5x 2014E P/E + net cash/share of US$1.83 Macquarie 30-Aug-13 Outperform 4.60 ; 5x 2014E non-GAAP P/E minus net debt per share of US$0.92 Citi 29-Aug-13 Buy 4.75 ; DCF with 15% WACC and zero terminal growth rate Nomura 29-Aug-13 Buy 6.00 ; 5.8x 2014E P/E CLSA 27-Jun-13 Underperform 4.00 ; 4x 2014E ex-cash P/E plus net cash/share of US$2 Average Price 4.69 Premium (Discount) to Avg Price First Offer Price 6.90 47.1% Revised Offer Price 7.10 51.4%
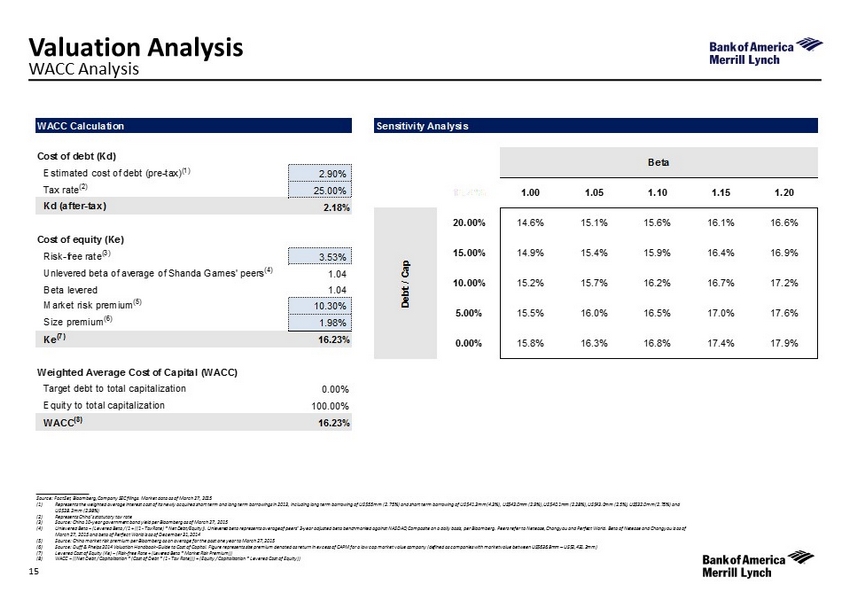
15 WACC Analysis Valuation Analysis ____________________ Source: FactSet , Bloomberg, Company SEC filings. Market data as of March 27 , 201 5 (1) Represents the weighted average interest cost of its newly acquired short term and long term borrowings in 2013, including lo ng term borrowing of US$55mm (2.75%) and short term borrowing of US$41.3mm (4.3%), US$43.0mm (2.9%), US$40.1mm (2.28%), US$43.0m m ( 2.5%), US$32.0mm (2.75%) and US$28.2mm (2.98%) (2) Represents China’s statutory tax rate (3) Source: China 10 - year government bond yield per Bloomberg as of March 27, 2015 (4) Unlevered Beta = (Levered Beta / (1 + ((1 - Tax Rate) * Net Debt/Equity)). Unlevered beta represents average of peers’ 3 - year ad justed beta benchmarked against NASDAQ Composite on a daily basis, per Bloomberg. Peers refer to Netease , Changyou and Perfect World. Beta of Netease and Changyou is as of March 27, 2015 and beta of Perfect World is as of December 31, 2014 (5) Source: China market risk premium per Bloomberg as an average for the past one year to March 27, 2015 (6) Source: Duff & Phelps 2014 Valuation Handbook - Guide to Cost of Capital. Figure represents size premium denoted as return in exce ss of CAPM for a low cap market value company (defined as companies with market value between US$636.8mm – US$2,431.2mm) (7) Levered Cost of Equity ( Ke ) = (Risk - free Rate + (Levered Beta * Market Risk Premium)) (8) WACC = ((Net Debt / Capitalization * (Cost of Debt * (1 - Tax Rate))) + (Equity / Capitalization * Levered Cost of Equity)) WACC Calculation Cost of debt (Kd) Estimated cost of debt (pre-tax) (1) 2.90% Tax rate (2) 25.00% Kd (after-tax) 2.18% Cost of equity (Ke) Risk-free rate (3) 3.53% Unlevered beta of average of Shanda Games' peers (4) 1.04 Beta levered 1.04 Market risk premium (5) 10.30% Size premium (6) 1.98% Ke (7) 16.23% Weighted Average Cost of Capital (WACC) Target debt to total capitalization 0.00% Equity to total capitalization 100.00% WACC (8) 16.23% Sensitivity Analysis Beta 16.23% 1.00 1.05 1.10 1.15 1.20 20.00% 14.6% 15.1% 15.6% 16.1% 16.6% 15.00% 14.9% 15.4% 15.9% 16.4% 16.9% 10.00% 15.2% 15.7% 16.2% 16.7% 17.2% 5.00% 15.5% 16.0% 16.5% 17.0% 17.6% 0.00% 15.8% 16.3% 16.8% 17.4% 17.9% Debt / Cap