Filed by Towers Watson & Co.
Pursuant to Rule 425 under the
Securities Act of 1933, as amended,
and deemed filed pursuant to Rule 14a-6(b)
of the Securities Exchange Act of 1934, as amended
Subject Company:
Towers Watson & Co. (Commission File No. 001-34594)
The following slide presentation was prepared by Towers Watson & Co. (“Towers Watson”) regarding the proposed merger of Towers Watson and Willis Group Holdings plc. Towers Watson first made these materials available on October 26, 2015.
 1 Creating a Leading Global Advisory, Broking and Solutions Firm October 2015 |
 2 Executive Summary |
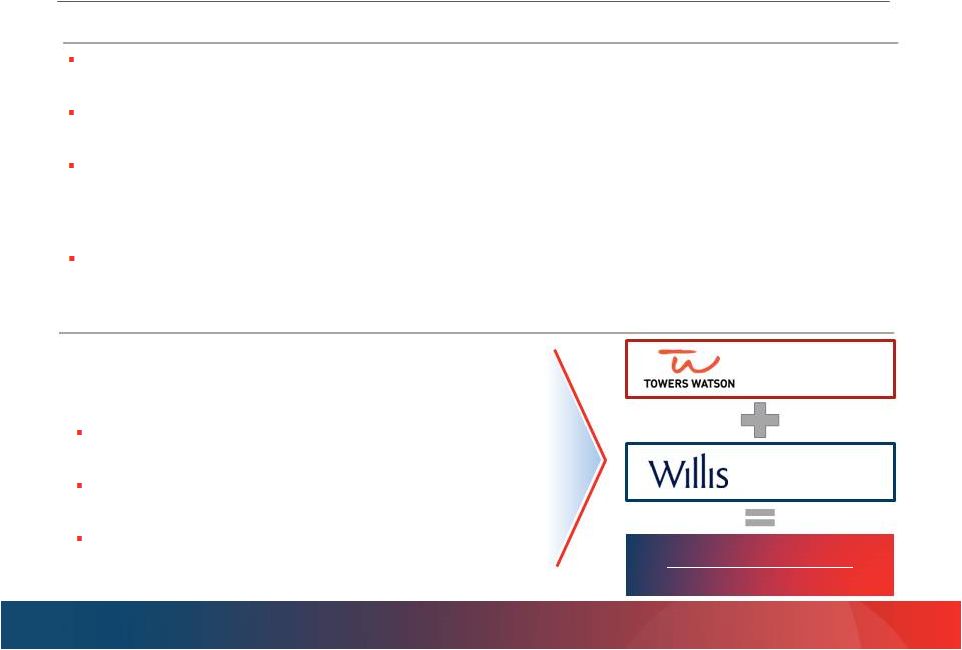
 3 Combination of highly complementary businesses accelerates long-term growth strategy Conducted extensive shareholder outreach following announcement Merger of equals structure provides the unique ability to leverage and enhance the strengths of both companies while preserving our most critical assets – people and clients Board of Directors conducted a thorough evaluation process and negotiated a favorable transaction Management has a proven track record of delivering substantial shareholder value through a transformative transaction Strategic Merger of Equals Positioned to Create Value for Shareholders |
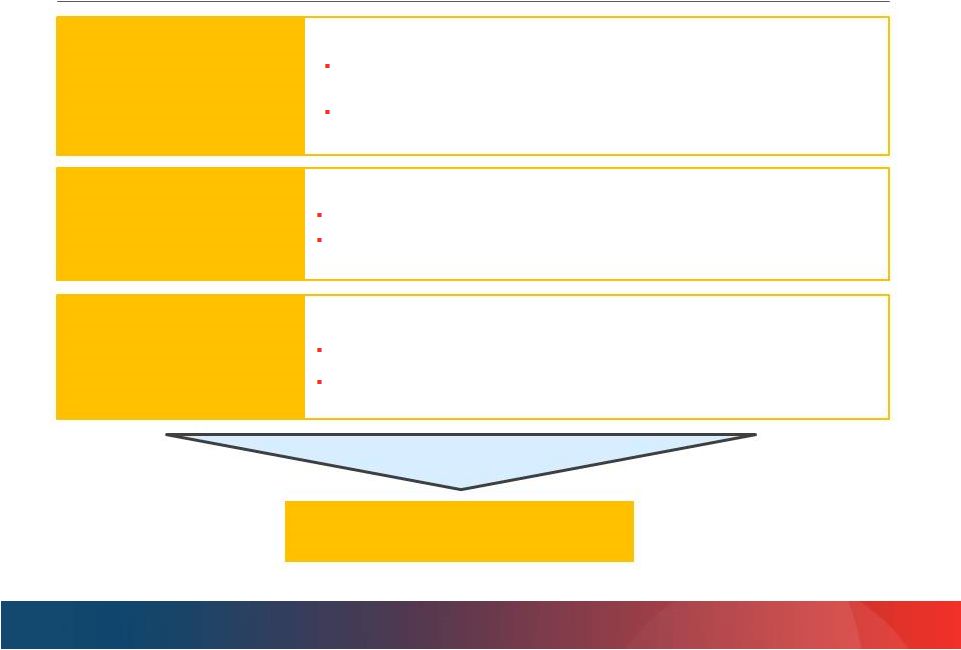
 4 A Highly Complementary, Strategic Combination A leading global distribution platform with highly complementary offerings Comprehensive advice, analytics, specialty capabilities and solutions Enhanced OneExchange growth opportunity Additional benefits across Property and Casualty (P&C) brokerage and Global Health and Group Benefits Broad coverage of both large and middle-market clients Highly achievable synergies and tax benefits based on the following expectations: $375 - $675 million in revenue synergy opportunity $100 - $125 million in clearly defined cost synergies Maintain Irish domicile; achieve effective tax rate in mid-20 percent range vs. current mid-30 percent range Significantly accretive to Towers Watson Adjusted EBITDA and Cash Net Income based on standalone forecasts and clearly identified synergies Estimated Cash Net Income accretion to Towers Watson shareholders of 25%+ for CY 2016, increasing to 45%+ for CY 2018 Strong continuing management team increases the likelihood of successfully integrating and capturing synergies POWERFUL CLIENT PROPOSITION ESTIMATED $4.7 BILLION IN INCREMENTAL VALUE FOR SHAREHOLDERS A leading global advisory, broking and solutions firm » » » » |
 5 Right Partner, Right Structure Complementary solutions-focused product offerings » Adds additional product offerings Acceleration of TW’s existing long-term strategy » Increased penetration in growth / emerging markets » Higher percentage of products / solutions » Stronger platform for innovation Expanded direct access to Willis’ leading U.S. middle- market client base » Supports TW’s goal of capturing a 25% share of the growing active employee exchange market Global platform across 120+ countries, expanding TW’s reach by 80+ countries » Leverages Willis’ strong relationships with large companies internationally Cultures aligned around shared values Clearly identified cost efficiencies » Willis Operational Improvement Program » Incremental transaction cost synergies » Irish domicile WILLIS IS THE IDEAL PARTNER FOR TOWERS WATSON Unique opportunity to accelerate Towers Watson’s long-term strategy MOE provides unique ability to leverage and enhance strengths of both companies and mitigate transaction risks » Enables retention of our most important assets – human capital and client relationships TW has a proven record of surpassing synergy estimates in precedent MOE transaction » Towers Watson shares up 198% since announcement of highly successful Towers Perrin/Watson Wyatt MOE TW shareholders (including many employees) to participate in upside as 49.9% owners of combined entity TW shareholders to receive additional value through special dividend Terms reflect relative value brought by both companies STRUCTURE MAXIMIZES VALUE FOR SHAREHOLDERS (1) Time period covering June 28, 2009 through October 23, 2015. 1 |
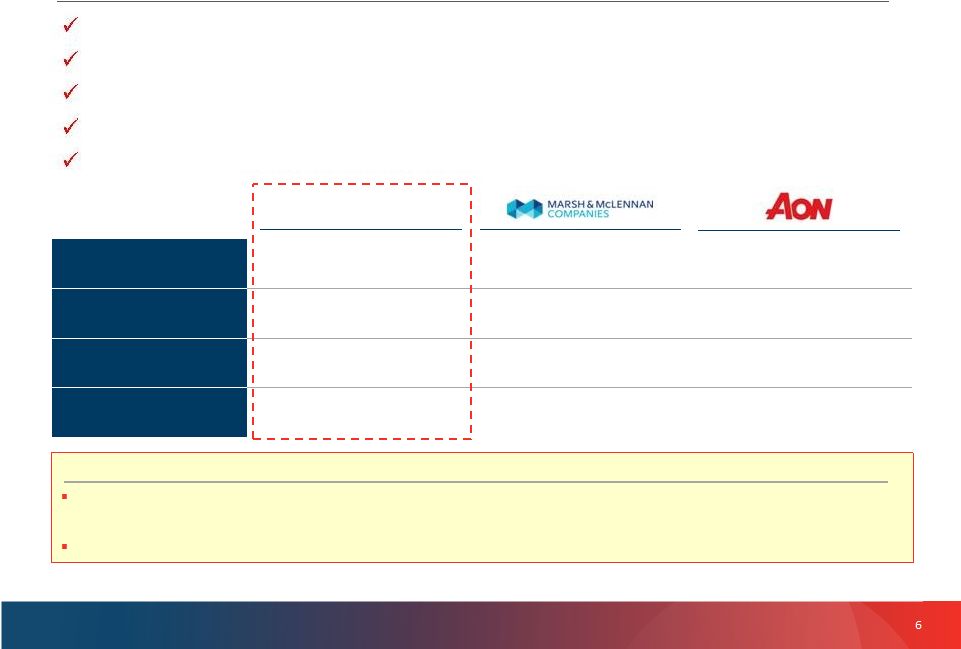 6 Enhances Overall Competitive Position in Principal Marketplace Source: Public filings, Company website. (1) Time period covering October 1, 2010 through October 23, 2015. Ability to serve a broader range of clients Extensive offering of products and solutions Retention and recruitment of key talent Capital investment Technology and innovation Transaction creates another large player that also offers a diverse suite of both consulting and brokerage services Parallel strategy by Aon over past 5 years has delivered over 135% (1) stock appreciation PF CY2014A Revenue $8.2BN $13.0BN $12.0BN PF CY2014A EBITDA $1.7BN $2.7BN $2.6BN Effective Tax Rate Mid-20% (expected) 28.5% (FY14A) 18.9% (FY14A) Countries of Operation 120+ 130+ 120+ Willis Towers Watson GLOBAL PLATFORM WELL-POSITIONED FOR THE FUTURE |
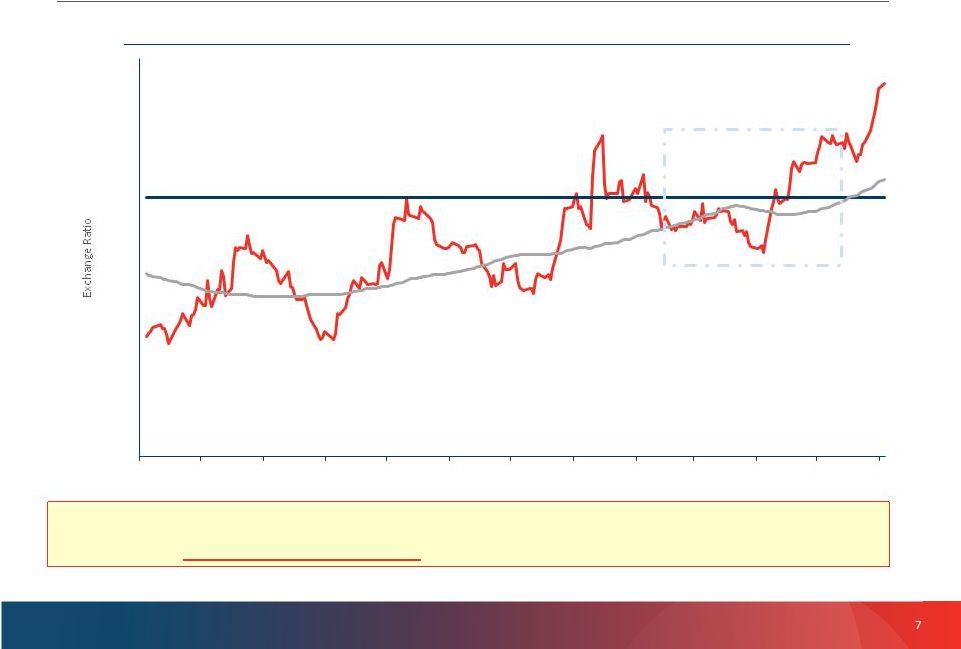 7 Exchange Ratio Determined by Relative Market Cap Ratio of Towers Watson stock price to Willis stock price adjusted for special dividend Merger Exchange Ratio = 2.6490 Exchange ratio calculated based on a 60-day average (preliminary agreement to terms on June 10 served as basis for final negotiations) Spot Rate (1) 60 Day VWAP (2) Source: FactSet (1) Based on daily volume-weighted average share price with Towers Watson’s price reduced by $4.87 to adjust for the special dividend. (2) Represents trailing 60-day average ratio, based on daily volume-weighted average share prices, with Towers Watson’s price reduced by $4.87 to adjust for the special dividend. Merger Exchange Ratio more favorable to Towers Watson than if calculated across any other 60 day period prior to the measurement period 2.0x 2.1x 2.2x 2.3x 2.4x 2.5x 2.6x 2.7x 2.8x 2.9x 3.0x Jun-14 Jul-14 Aug-14 Sep-14 Oct-14 Nov-14 Dec-14 Jan-15 Feb-15 Mar-15 Apr-15 May-15 Jun-15 |
 8 Transaction Was the Result of Thorough, Independent Board Process BOARD REGULARLY REVIEWS THE LONG-TERM STRATEGIC PLAN WITH THE OBJECTIVE OF ENHANCING SHAREHOLDER VALUE Board extensively reviewed the assumptions underlying the value-creation thesis of the Willis transaction, including internal and external perspectives on revenue, cost and tax synergies Board concluded the potential value of the combined company is more compelling than standalone plan and retains future strategic optionality INDEPENDENT DIRECTORS PLAYED A SIGNIFICANT ROLE IN EVALUATING TRANSACTION TW’s independent directors conducted multiple meetings and executive sessions through the course of the evaluation and negotiation MERGER OF EQUALS WITH WILLIS IS A UNIQUE OPPORTUNITY THAT LEVERAGES STRENGTHS OF BOTH COMPANIES The transaction with Willis provides a unique opportunity for TW to benefit from the upside created through broadened product offerings, client reach and geographic scope Board considered alternative transaction structures, but a MOE with Willis was determined to be optimal A business combination with Willis was considered by the Board in 2013, but demand for solutions and evolution of exchange business were not sufficiently advanced BOARD WILL PURSUE THE COURSE OF ACTION THAT WILL BEST DRIVE SHAREHOLDER VALUE MOE is structured to provide TW with strategic optionality if a competing transaction arises |
 9 Constructive Shareholder Engagement Towers Watson conducted comprehensive investor outreach Discussions resulted in greater understanding of strategic benefits, synergy potential, and earnings accretion Company continues to actively engage with shareholder base including shareholders who invested in TW post merger announcement Selected Market Commentary (1) “The Willis merger represents a catalyst for upside in exchange revenue growth given increased penetration of the middle market channel. Additionally, we expect the deal to generate run-rate pre-tax cost synergies of $125M and tax synergies of $60M. Finally, we believe Towers’ management team can bring enhanced execution to Willis, driving a positive turnaround in the insurance business.” - Piper Jaffray, August 11, 2015 “Further Analyzing TW’s “Merger of Equals” with WSH — In the ~10 weeks since TW announced its “merger of equals” with Willis on 6/30, we have had numerous opportunities to conduct our diligence on the merits of the proposed deal. Our conclusion is that while the deal was a negative surprise for investors and TW’s initial messaging around the deal was not as crisp as we might have liked, the combination of the deal benefits and stock reaction makes TW one of our better overall Buy ideas today. We note that although the stock retreated ~15% initially, it has consolidated in the $118-$122 range in the past ~4 weeks and we have begun to see new (and well- justified) interest in the stock. Buy TW.” -Citi, September 17, 2015 “Although management commented on large companies comprising a higher percentage of 2017 private exchange RFPs, Towers continues to believe small and middle-market sized companies will comprise the majority of new private exchange enrollees on January 1, 2017. We agree with this view and this is the primary reason why we are convinced the Willis (WSH, Buy, $46.07, $53 PT) / Towers Watson merger is an excellent strategic move by both companies. Willis’ has the country’s most extensive broker distribution network concentrating on small and mid-sized organizations in the country.” - MKM Partners, August 12, 2015 “Towers Watson management has an appropriate perspective on the value that will emerge at Willis as it executes on its Operational Improvement Program. The market clearly didn't see this in the immediate aftermath of the announcement, but it reflects good long-term thinking.” - Keefe, Bruyette & Woods, October 9, 2015 “Over the 15 years we have followed TW there have been a number of acquisitions that CEO John Haley has stewarded that were initially underappreciated -- including the key Towers Perrin merger and Extend Health acquisition to enter the private exchange space.” -Baird Equity Research, June 30, 2015 Investor Discussions (1) Permission to used quoted material was neither sought nor obtained. 9 |
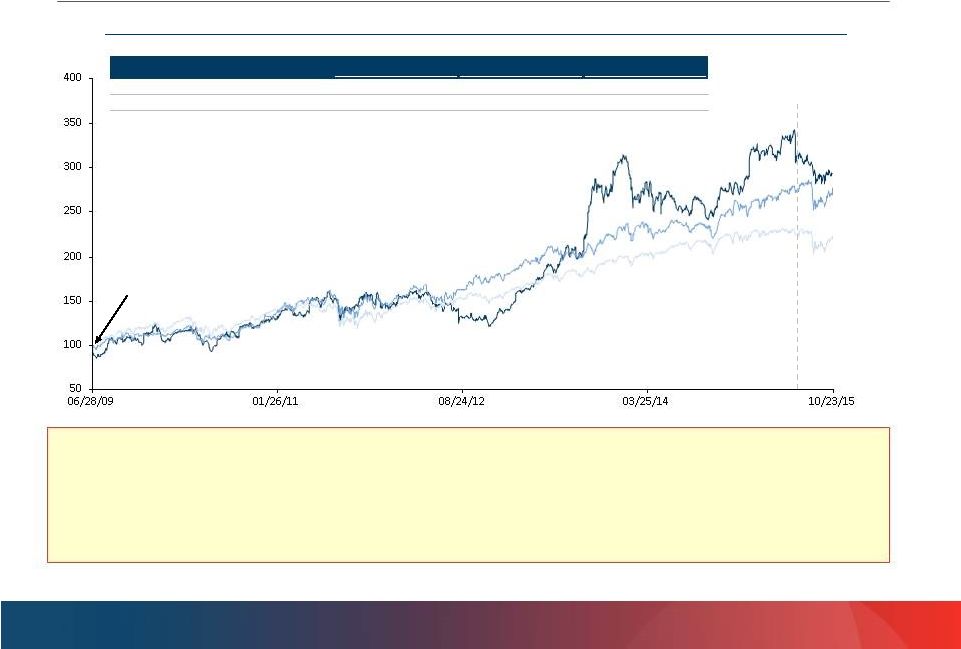 10 TW’s Proven Track Record of Delivering Value in MOEs (Indexed to 100) 6/30/15: Announced merger with Willis Towers Watson +197.9% Towers Watson Peers (1) +178.7% Note: Market Data as of October 23, 2015. (1) Towers Watson comparable companies include Aon, Marsh & McLennan, Accenture, CEB, Advisory Board Company, FTI Consulting and Huron Consulting. S&P 500 +125.8% Share price performance since announcement of Watson Wyatt/Towers Perrin merger Watson Wyatt/ Towers Perrin Merger Announced • TW team drove significant shareholder value since the TW MOE. Willis Towers Watson will benefit from the key elements that drove the success of the Watson Wyatt/Towers Perrin merger: – Transition of management team and Board members – Robust integration discipline (achieved $110 million of cost synergies against $80 million goal) – Properly aligned management incentives with shareholder’s interest Share Price Performance (%) Towers Watson Towers Watson Peers (1) S&P 500 Last 10 Years 369% 184% 76% 6/28/2009 to 10/23/2015 198% 179% 126% Extend Health Close to Date (6/29/2012) 105% 78% 52% |
 11 We ask you to vote FOR the merger of Towers Watson and Willis Group at the November 18 Special Meeting Compelling strategic rationale Rigorous Board evaluation of merger Significant value creation from clearly-identified cost, tax and revenue synergies Favorable MOE transaction structure Strong continuing leadership, with proven MOE execution and integration experience 11 |
 12 Towers Watson + Willis: A Leading Global Advisory, Broking and Solutions Firm |
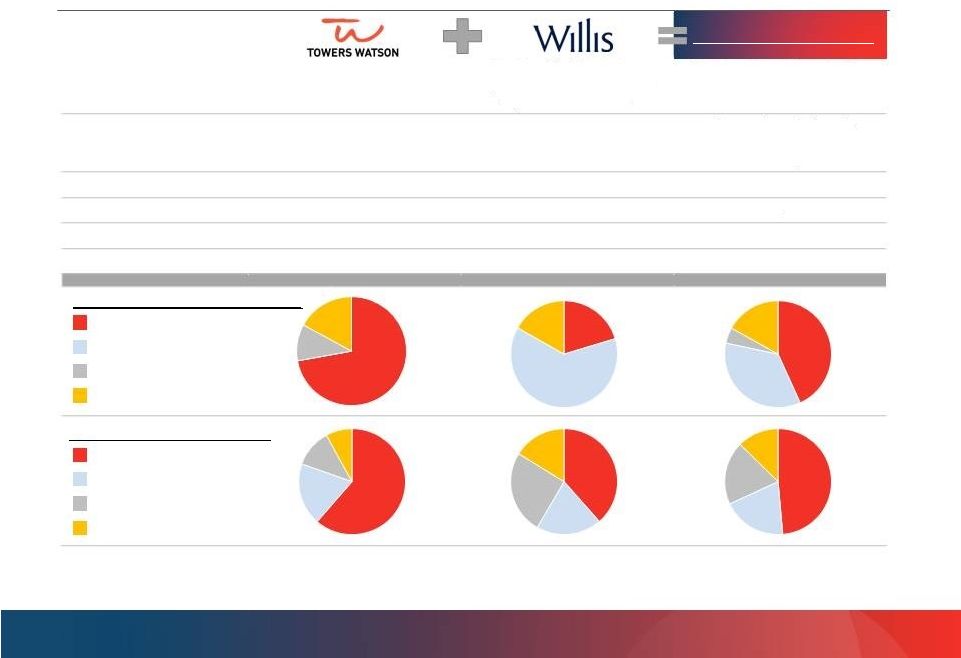 13 = Human Capital & Benefits = Investment, Risk & Reinsurance = Corporate Risk & Broking = Exchange Solutions = North America = Rest of World = Great Britain = Western Europe Transaction Combines Complementary Businesses Source: Public filings, Company website and FactSet. (1) As of June 29, 2015. (2) Financials based on calendar year 2014 results, pro forma for the merger, completion of Willis’ acquisitions of Miller and Gras Savoye (pending), and full year run rate contributions for Willis’ acquisitions of IFG, Max Matthiessen and Charles Monat. (3) Consists of Towers Watson Adjusted EBITDA and Willis Underlying EBITDA. See Willis and Towers Watson non-GAAP measures for definitions 13 Overview A leading provider of advisory services and solutions Client Base Deep penetration across large market clients – Fortune 1000 companies Countries Market Cap FY’14 Revenue FY’14 EBITDA A leading global risk advisory, re/insurance broking, and human capital and benefits firm Strong relationships with U.S. middle-market and international large-market companies (1) 37 countries 120+ countries $9.7 billion $8.4 billion $3.5 billion $3.8 billion $670 million Adjusted EBITDA $829 million Underlying EBITDA A leading global advisory, broking and solutions firm Substantial growth through expanded client reach and increased market penetration 120+ countries $8.2 billion $1.7 billion - (3) Revenue by Business Segment (FY Dec-14) (2) Revenue by Geography (FY Dec-14) (2) 61% 19% 12% 8% 72% 11% 17% 20% 63% 17% 38% 20% 25% 16% 43% 35% 5% 17% 48% 20% 19% 13% Willis Towers Watson (2) including over 800 |
 14 Accelerating Towers Watson’s Long Term Strategy EXPANDS CLIENT REACH – ACROSS ATTRACTIVE MARKETS Leverages mutual distribution strength to enhance market penetration across middle and large markets Significantly enhances ability to capture the exchange solutions opportunity » Provides direct access to Willis’ 20,000 U.S. middle-market relationships » Supports Towers Watson’s goal of capturing a 25% share of the growing active employee exchange market Expanded client reach provides opportunity to realize growth across other areas, such as large market P&C brokerage and Global Health and Group Benefits EXPANDS CLIENT REACH – INTO BROADER GEOGRAPHIES Willis’ distribution network and broad global platform facilitates expanded reach to a greater number of multinational companies Expands Towers Watson’s reach by 80+ countries Internationalizes Towers Watson’s Global Health and Group Benefits solutions and exchange platform OPTIMAL MIX OF CLIENT OFFERINGS, WITH HIGHER PERCENTAGE OF SOLUTIONS Clients are demanding a comprehensive portfolio of products and solutions The transaction creates a comprehensive portfolio of advisory services, solutions and technology STRONGER PLATFORM FOR INNOVATION TO CONTINUE TO MEET CLIENTS’ EVOLVING NEEDS Brings together the best talent in the industry while enhancing our ability to invest in innovation A natural fit delivering profitable long-term growth |
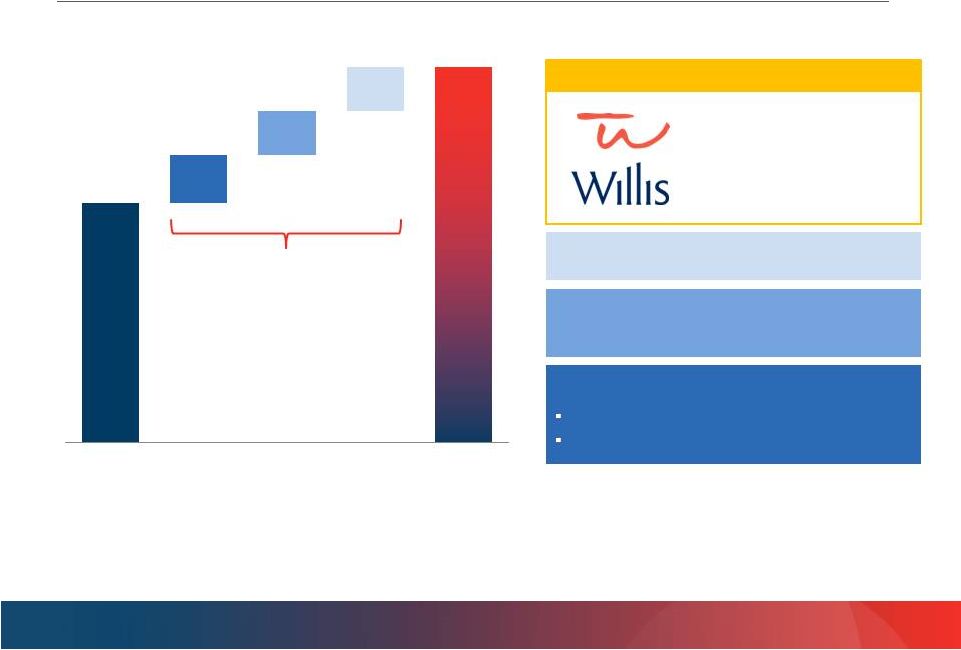
 15 As healthcare costs continue to rise in the U.S., employers are exploring every option for offering health benefits to their employees and retirees in the most cost-effective way possible Towers Watson’s OneExchange platform provides outstanding exchange and administration solutions to employers Enormous growth potential in exchange: » 120 million employees received healthcare from employers through the active market » 12 million people received retiree medical from former employers Towers Watson well positioned in the large market, but needs mid-market distribution Significantly Expands OneExchange Growth Opportunity Middle-market client segment (~40M employees) represents an attractive growth opportunity Towers Watson provides best-in-class OneExchange platform Willis provides enhanced direct access to fast growing middle-market client base Continued focus on channel partner distribution As a combined company, Towers Watson shareholders will realize benefits from enhanced market penetration of the OneExchange platform OneExchange platform positioned to catalyze growth Willis Towers Watson Major player in active exchange market Technology Distribution |
 16 Towers Watson + Willis: Creating Financial Value for Shareholders |
 17 Clearly Identified Cost and Tax Synergies Proven track record of identifying and capturing synergies Cost savings expected to be fully realized within three years post close Corporate costs Economies of scale Incremental to current cost saving and operational improvement initiative Non-recurring costs to achieve synergies of approximately 1.25 times savings Boston Consulting Group retained to conduct due diligence and validate synergy estimates EXPECTED RUN RATE COST SYNERGIES OF $100-$125 MILLION TAX EFFICIENCIES Expected effective tax rate in mid-20 percent range compared to status quo effective rate of mid-30 percent range » Status quo effective tax rate would be in high-30 percent range if offshore earnings repatriated Post-merger, Towers Watson will be able to access its foreign cash $75 million annual tax benefit |
 18 Estimated Annual Revenue Opportunity by Year 3: $375-$675 Million $100-$400 million ~$200 million ~$75-135 million incremental operating income (1) MIDDLE MARKET EXCHANGE Segment includes 40+ million employees and has a higher adoption rate than large-market segment Willis’ 20,000 mid-market U.S. relationships supports TW’s goal of capturing a 25% share of the growing active employee exchange market LARGE MARKET P&C BROKERAGE Willis has a ~3.5% share of $10+ billion U.S. large P&C corporate market Towers Watson has existing relationships with 80% of the companies in the market, best-in-class insurance analytics and a strong brand GLOBAL HEALTH AND GROUP BENEFITS Willis provides expanded distribution network of more than 120 countries Increases global reach of Towers Watson’s health benefits offerings which are enabled by the Liazon platform ~$75 million (1) Assumes 20% EBIT margin. |
 19 Estimated $4.7 Billion in Total Incremental Value ~$1.5 billion in value from revenue synergies (3) ~$1.65 billion in value from cost synergies (5) $100-125 million of run-rate cost synergies Incremental to Operational Improvement Program ~$1.5 billion in value from tax savings (2016) on existing Towers Watson earnings (4) $18.15 $1.65 $1.5 $1.5 $22.8 (1) (1) $22.8 billion is pre-dividend. $22.5 billion is ex-dividend. The combined market capitalization of $18.1 billion is as of June 29, 2015. (2) Calculated as (A) 49.9% pro forma ownership (ex-special one-time dividend) plus (B) special one-time dividend of $337 million. (3) ~$525mm of annual run-rate revenue synergies capitalized based on Towers Watson’s average P/E of ~20x and Willis’ average P/E of ~17x (6-month average NTM P/E preceding announcement). (4) Illustratively represents ~$75 million of annual savings at Towers Watson capitalized at Towers Watson calendar year 2016E cash P/E multiple of 20.3x as of June 29, 2015. (5) $125 million of run-rate synergies capitalized based on Towers Watson’s average P/E of ~20x and Willis’ average P/E of ~17x (6-month average NTM P/E preceding announcement). Pro Forma Market Capitalization as of June 29, 2015 (Pre-Announcement) Illustrative Pro Forma Equity Value $ USD billions $4.7B in value attributable to merger which is 26% of pre-announcement market capitalization $11.5 billion (including $337 million special dividend) (2) $11.3 billion Estimated Value to Shareholders |
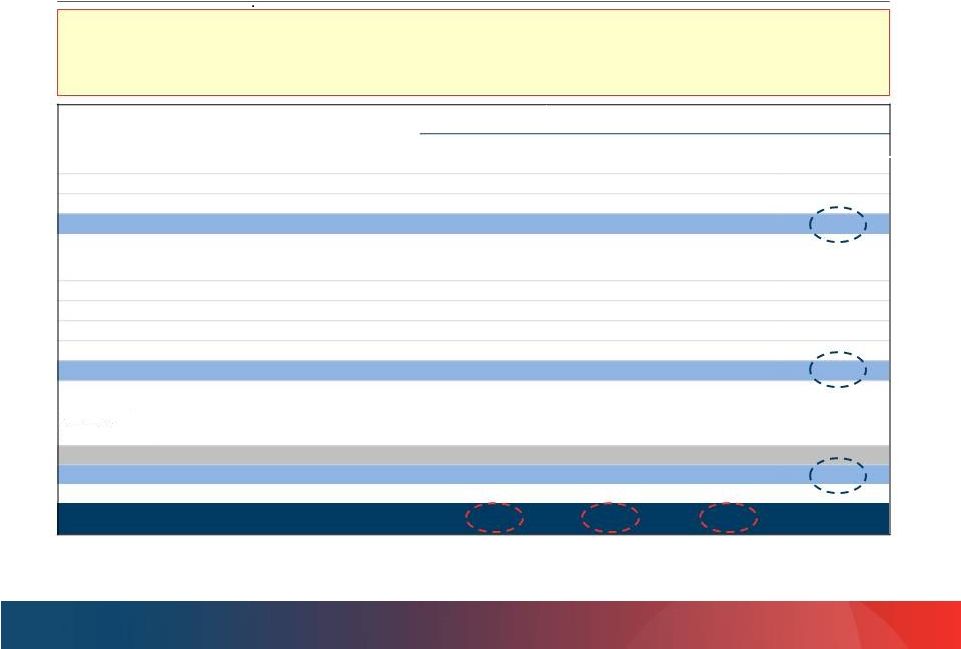 20 Significantly Accretive to Towers Watson Shareholders Source: Towers Watson and Willis Group standalone projections per S-4 filing. Synergies and other estimates from public filings and management estimates. Note: Dollars in millions. Assumes cost and revenue are after-tax at a pro forma tax rate of ~25%. Assumes revenue and cost synergies are phased in 33.3% in 2016E, 66.6% in 2017E and achieve run-rate in 2018E. Illustratively assumes ~$75 million of annual tax savings. (1) Revenue synergies assumed to be $525 million, the midpoint of the range, with a 20% EBIT margin. (2) Consists of Willis Underlying EBITDA. See Willis non-GAAP measures for definition. (3) Assumes $125 million of cost synergies, excludes one-time costs to achieve. Merger enhances Towers Watson revenue, Adjusted EBITDA and Cash Net Income growth; the transaction is accretive to TW Cash Net Income by 2018 even if none of the contemplated synergies are achieved CY2016E CY2017E CY2018E CAGR Revenue Tower s Watson - Standalone $3,954 $4,282 $4,644 8% Willis - Standalone 4,522 4,785 5,078 6% Revenue Synergies (1) 175 350 525 Pro Forma $8,651 $9,417 $10,247 9% Adj. EBITDA Tower s Watson - Standalone $830 $900 $977 8% Towers Watson - Standalone Margin 21% 21% 21% Willis - Standalone (2) 1,051 1,193 1,309 12% Cost Syner gies (3) 42 83 125 35 70 105 Pro Forma $1,958 $2,246 $2,516 13% Pro Forma Margin 23% 24% 25% Cash Net Income Tower s Watson - Standalone $470 $508 $549 8% Pro Forma 1,208 1,406 1,590 Towers Watson Share (49.9%) $603 $702 793 15% Towers Watson Accretion Versus 28% 38% 45% Standalone - % Revenue Synergies (1) |
 21 Roadmap for Successful Integration to Achieve Synergies Update to Integration Planning In July 2015 retained Bain & Co. as an integration advisor Joint operating committee commenced integration work in late July 12 integration workstreams formed across client-facing and functional areas to ensure go-to-market effectiveness on Day 1 Joint integration team Well-defined integration process Strongest combination of talent and practices Commitment to communicate with and engage talent Unwavering focus on client service and current growth and operational improvement opportunities Realize full benefits of combination |
 22 Board Process and Governance |
 23 The Board Conducted a Thorough Process A potential business combination with Willis was preliminarily discussed by TW’s Board in 2013, but the Board determined that the timing was not right and directed management not to pursue a potential transaction Independent Towers Watson directors were extensively involved and included multiple reviews in executive session The Board conducted a detailed review of the strategic and financial implications of the transaction, including the perspectives of the internal team and external advisors, and evaluated potential alternative structures Exchange ratio based on market capitalization, which is more favorable than alternative mechanisms proposed by Willis, and was agreed to in principle at a ratio more favorable than at any time prior to that date After extensive review, the Board, including all independent directors, unanimously approved the transaction |
 24 TW Board Structures Compensation to Align Management with Shareholders TW’S STRONG COMPENSATION PRACTICES PAY AND PERFORMANCE ALIGNMENT (5 YEAR CAGR) Over past 5 years Total Shareholder Return of ~190% (1) 97% average support on say-on-pay vote TW EXECUTIVES’ INTERESTS WILL REMAIN ALIGNED WITH LONG-TERM SHAREHOLDERS Significant portion of CEO’s assets remain held in TW stock and equity awards (performance-based or at- risk) – well in excess of our ownership requirement Double-trigger change in control – equity awards for CEO, CFO and all continuing executives will remain outstanding Stock options– TW stock options will be converted into options of the combined company (not monetized) Conservative pay practices » Total direct compensation is between 25 th and 50 th percentile of peers Majority of executive pay is variable and linked to financial performance » 80% of CEO comp in 2014 was performance-based » All long-term incentives are performance-based equity Rigorous stock ownership guidelines » Share ownership of 5x base salary required for CEO Double-trigger change in control provisions Robust clawback policy Anti-hedging and anti-pledging policies No tax gross-ups and no golden parachutes 24% 7% TSR (1) CEO Pay (2) (1) Indexed TSR based on 5 fiscal year period ending FY2014 (2) CEO pay based on salary, bonus, stock awards, options and other compensation; excludes change in pension value and non-equity nonqualified deferred compensation earnings |
 25 Pro Forma Management Structure Continuing management team has a history of successfully integrating transactions and surpassing market expectations CEO John Haley Towers Watson President and Deputy CEO Dominic Casserley Willis Board of Directors Will Consist of 12 Board Members – 6 members nominated by Towers Watson including John Haley – 6 members nominated by Willis including James McCann, who will serve as Chairman, and Dominic Casserley Senior Executive Team with Significant Continuity from Both Companies Four business lines – 2 led by TW executives and 2 led by Willis executives Five regions – 3 led by TW executives and 2 led by Willis executives Senior corporate executives – 2 from TW and 2 from Willis Board will balance long- term perspectives from both TW and WSH Ongoing involvement of CEOs structured to best facilitate integration while clearly defining roles Balanced senior executive team selected to ensure maximum continuity of leadership in key business lines and regions |
 26 Conclusion |
 27 We ask you to vote FOR the merger of Towers Watson and Willis Group at the November 18 Special Meeting Compelling strategic rationale Rigorous Board evaluation of merger Significant value creation from clearly-identified cost, tax and revenue synergies Favorable MOE transaction structure Strong continuing leadership, with proven MOE execution and integration experience |
 28 Supplemental Information |
 29 Overview of Consideration and Ownership Towers Watson Shareholders Willis Shareholders Receive 49.9% of the fully diluted pro forma equity Receive $4.87 cash dividend per share If the Willis reverse split is approved (1) , each Towers Watson share exchanged for 1 share of the combined company Receive 50.1% of the fully diluted pro forma equity Willis will implement a reverse stock split, so that one Willis share will be converted into 0.3775 shares of the combined company (1) (1) Subject to Willis shareholder approval. If not approved each Towers Watson share will receive a cash dividend of $4.87 per share and 2.6490 shares of Willis Towers Watson for each Towers Watson share. Willis shareholders will continue to own their existing number of shares. The merger is not conditioned on approval of the reverse stock split. TOWERS WATSON WILLIS 49.9% 50.1% |
 30 The Board and Management Team Conducted a Thorough Analysis to Maximize Shareholder Value January 26, 2015: TW and WSH CEOs meet to discuss existing commercial arrangements; a potential business combination is discussed. April 2015: TW and WSH discuss the potential benefits of a business combination but do not discuss financial terms. May 4, 2015: TW Board appoints a special committee of 4 independent directors to initially assess matters relating to the transaction. May 11, 2015: TW CEO proposes that pro forma ownership be determined based on market capitalization. WSH CEO and Chairman suggest ownership be based on relative contribution of several financial metrics which would result in WSH shareholders owning a significantly larger percentage of the company. May 14, 2015: TW’s lead independent director discusses the leadership of the combined company with WSH’s Chairman. May 15, 2015: TW Board and management discuss the potential transaction, after which management is excused and the independent directors continue the discussion in executive session. May 20, 2015: The parties agree to consider several alternative transaction structures. May 29, 2015: TW CEO and WSH CEO discuss preliminary terms for the combination. A pre-closing dividend is discussed as a method to obtain the desired ownership percentages of the surviving company despite the fact that TW had a larger market capitalization at the time. June 10, 2015: The parties agree that the exchange ratio be based on 60 day weighted average prices as of June 5 th and include a special dividend to TW shareholders to reduce pro forma TW ownership below 50%. June 20, 2015: TW Board holds an in-person special meeting and discusses with management the proposed transaction. After the TW CEO leaves the meeting, the discussion is continued by the independent directors in executive session. June 27, 2015: The exchange ratio and amount of the special dividend are calculated based on the previous agreement that they be based on the 60 day weighted average as of June 5. June 29, 2015: The TW Board unanimously determines to approve the merger. June 30, 2015: The Towers Watson / Willis transaction is announced. May 2013: As part of a regular strategic review, TW Board discusses potential business combination with Willis, which is not pursued further. |
 31 Where You Can Find Additional Information In connection with the proposed merger of Towers Watson and Willis Group, Willis Group filed a registration statement on Form S-4 with the Securities and Exchange Commission (the “Commission”) that contains a joint proxy statement/prospectus and other relevant documents concerning the proposed transaction. The registration statement on Form S-4 was declared effective by the SEC on October 13, 2015. Each of Towers Watson and Willis Group mailed the joint proxy statement/prospectus to its respective stockholders on or around October 13, 2015. YOU ARE URGED TO READ THE JOINT PROXY STATEMENT/PROSPECTUS AND THE OTHER RELEVANT DOCUMENTS THAT HAVE BEEN OR WILL BE FILED WITH THE COMMISSION AS THEY BECOME AVAILABLE BECAUSE THEY CONTAIN OR WILL CONTAIN IMPORTANT INFORMATION ABOUT TOWERS WATSON, WILLIS GROUP AND THE PROPOSED TRANSACTION. You may obtain the joint proxy statement/prospectus and the other documents filed with the Commission free of charge at the Commission’s website, www.sec.gov. In addition, you may obtain free copies of the joint proxy statement/prospectus and the other documents filed by Towers Watson and Willis Group with the Commission by requesting them in writing from Towers Watson, 901 N. Glebe Road, Arlington, VA 22203, Attention: Investor Relations, or by telephone at (703) 258-8000, or from Willis Group, Brookfield Place, 200 Liberty Street, 7th Floor, New York, NY 10281-1003, Attention: Matt Rohrman, Investor Relations, or by telephone at (212) 915-8084. |
 32 Forward Looking Statements This document contains “forward-looking statements” within the meaning of the Private Securities Litigation Reform Act of 1995. You can identify these statements and other forward-looking statements in this document by words such as “may”, “will”, “would”, “expect”, “anticipate”, “believe”, “estimate”, “plan”, “intend”, “continue”, or similar words, expressions or the negative of such terms or other comparable terminology. These statements include, but are not limited to, the benefits of the business combination transaction involving Towers Watson and Willis Group, including the combined company’s future financial and operating results, plans, objectives, expectations and intentions and other statements that are not historical facts. Such statements are based upon the current beliefs and expectations of Towers Watson’s and Willis Group’s management and are subject to significant risks and uncertainties. Actual results may differ from those set forth in the forward-looking statements. The following factors, among others, could cause actual results to differ from those set forth in the forward-looking statements: the ability to obtain governmental approvals of the transaction on the proposed terms and schedule; the failure of Towers Watson stockholders and Willis Group shareholders to approve the transaction; the failure of the transaction to close for any reason; the risk that the businesses will not be integrated successfully; the risk that anticipated cost savings and any other synergies from the transaction may not be fully realized or may take longer to realize than expected; the potential impact of the announcement or consummation of the proposed transaction on relationships, including with employees, suppliers, customers and competitors; changes in general economic, business and political conditions, including changes in the financial markets; significant competition; compliance with extensive government regulation; the combined company’s ability to make acquisitions and its ability to integrate or manage such acquired businesses. Additional risks and factors are identified under “Risk Factors” in Towers Watson’s Annual Report on Form 10-K filed on August 14, 2015, which is on file with the Commission, and under “Risk Factors” in the joint proxy statement/prospectus. You should not rely upon forward-looking statements as predictions of future events because these statements are based on assumptions that may not come true and are speculative by their nature. Neither Towers Watson or Willis Group undertakes an obligation to update any of the forward-looking information included in this document, whether as a result of new information, future events, changed expectations or otherwise. |
 33 Towers Watson Non-GAAP Measures Adjusted EBITDA – Net income (attributable to common stockholders) adjusted for discontinued operations, net of tax, provision for income taxes, interest, net, depreciation and amortization, transaction and integration expenses, and other non-operating income excluding income from variable interest entity. Free Cash Flow – Cash Flows from Operating Activities less cash used to purchase Fixed Assets and Software for Internal Use. These non-U.S. GAAP measures are not defined in the same manner by all companies and may not be comparable to other similarly titled measures of other companies. Non-U.S. GAAP measures should be considered in addition to, and not as a substitute for, the information contained within our financial statements. |
 34 Willis Non-GAAP Measures Underlying EBITDA – Net income (attributable to Willis Group Holdings) adjusted for net income attributable to non-controlling interests, interest in earnings of associates, net of tax, income tax charges, interest expense, restructuring charges, depreciation, amortization and other non-operating income. Free Cash Flow – Net Cash provided by Operating Activities less additions to Fixed Assets. These non-U.S. GAAP measures are not defined in the same manner by all companies and may not be comparable to other similarly titled measures of other companies. Non-U.S. GAAP measures should be considered in addition to, and not as a substitute for, the information contained within our financial statements. |