
Investor Day October 29, 2015
Under the private securities litigation reform act of 1995 This presentation contains certain forward-looking statements and expectations regarding the company’s future performance and the performance of its brands. Such statements are subject to various risks and uncertainties that could cause actual results to differ materially. These risks include (i) changing consumer demands, which may be influenced by consumers' disposable income, which in turn can be influenced by general economic conditions; (ii) rapidly changing fashion trends and purchasing patterns; (iii) intense competition within the footwear industry; (iv) political and economic conditions or other threats to the continued and uninterrupted flow of inventory from China and other countries, where the Company relies heavily on third-party manufacturing facilities for a significant amount of its inventory; (v) the ability to accurately forecast sales and manage inventory levels; (vi) cybersecurity threats or other major disruption to the Company’s information technology systems; (vii) customer concentration and increased consolidation in the retail industry; (viii) a disruption in the Company’s distribution centers; (ix) the ability to recruit and retain senior management and other key associates; (x) foreign currency fluctuations; (xi) compliance with applicable laws and standards with respect to labor, trade and product safety issues; (xii) the ability to secure/exit leases on favorable terms; (xiii) the ability to attract, retain, and maintain good relationships with licensors and protect intellectual property rights; and (xiv) the ability to maintain relationships with current suppliers. The company's reports to the Securities and Exchange Commission contain detailed information relating to such factors, including, without limitation, the information under the caption Risk Factors in Item 1A of the company’s Annual Report on Form 10-K for the year ended January 31, 2015, which information is incorporated by reference herein and updated by the company’s Quarterly Reports on Form 10-Q. The company does not undertake any obligation or plan to update these forward-looking statements, even though its situation may change. In this presentation, the company’s financial results are provided both in accordance with generally accepted accounting principles (GAAP) and using certain non-GAAP financial measures. In particular, the company provides historic and estimated future, operating earnings and earnings per diluted share adjusted to exclude certain gains, charges and recoveries, which are non-GAAP financial measures. These results are included as a complement to results provided in accordance with GAAP because management believes these non-GAAP financial measures help identify underlying trends in the company’s business and provide useful information to both management and investors by excluding certain items that may not be indicative of the company’s core operating results. These measures should not be considered a substitute for or superior to GAAP results. Reconciliations to the applicable GAAP financial measures have been included in this presentation. All references in this document, unless otherwise noted, related to diluted earnings per common share attributable to Caleres, Inc. shareholders, are presented as earnings per diluted share, respectively. Safe harbor statement 2
Agenda Opening Remarks Financials Famous Footwear Brand Portfolio Sam Edelman Q&A Diane Sullivan CEO, President and Chairman Ken Hannah Senior Vice President and CFO Rick Ausick President Jay Schmidt President Sam Edelman President Executive Team 3
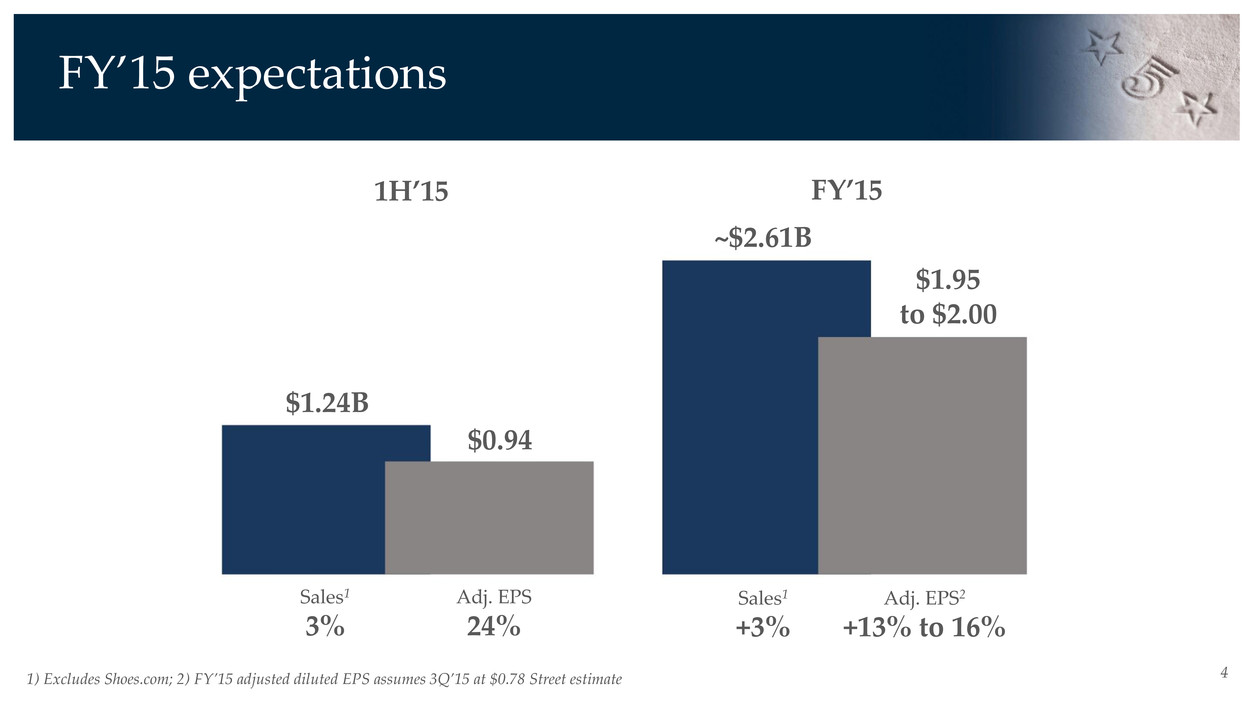
41) Excludes Shoes.com; 2) FY’15 adjusted diluted EPS assumes 3Q’15 at $0.78 Street estimate $1.24B $0.94 ~$2.61B $1.95 to $2.00 FY’15 expectations Sales1 3% Adj. EPS 24% Sales1 +3% Adj. EPS2 +13% to 16% 1H’15 FY’15
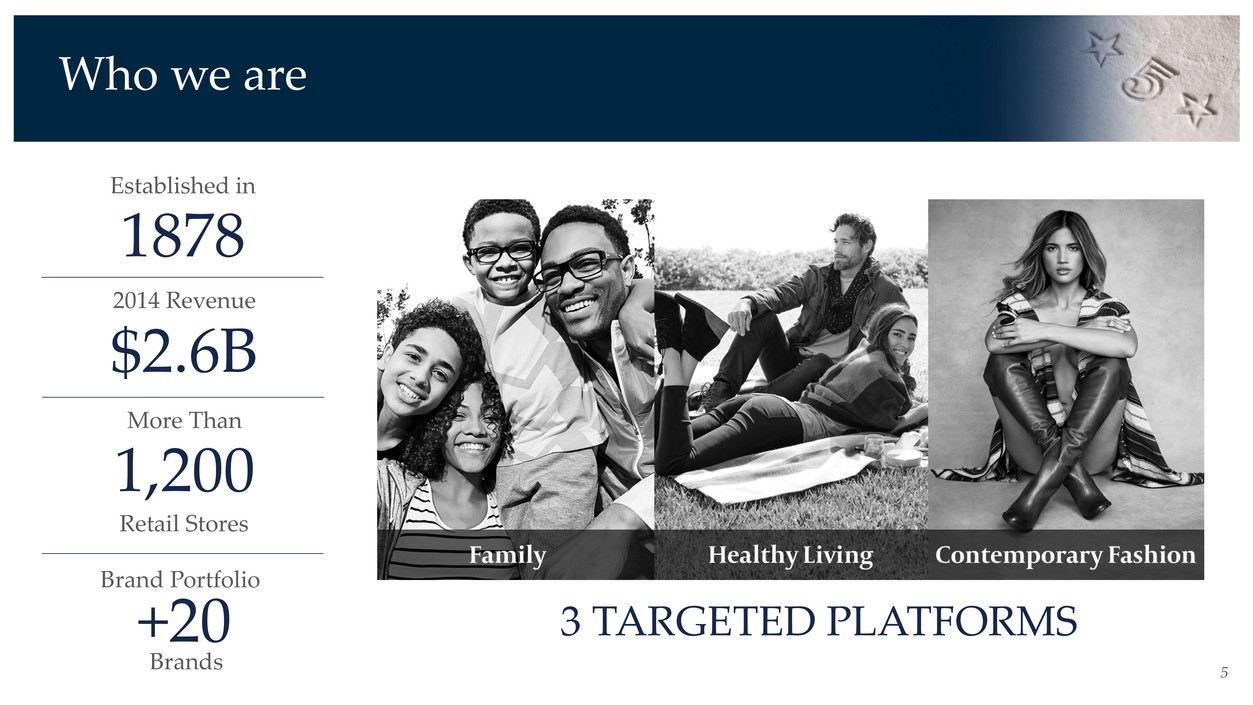
5 Established in 1878 2014 Revenue $2.6B More Than 1,200 Retail Stores +20 Brand Portfolio Brands 3 TARGETED PLATFORMS Who we are
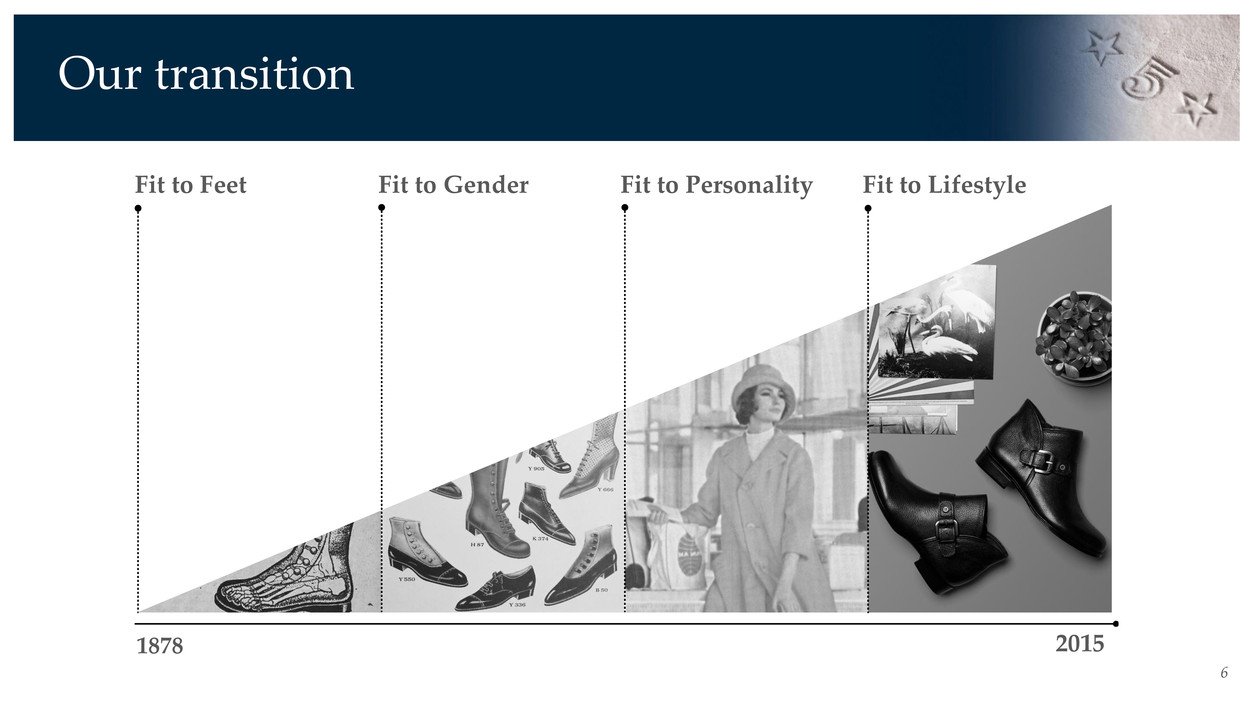
6 Our transition Fit to Feet Fit to Gender Fit to Personality Fit to Lifestyle 1879 20158

7

8 MISSION Inspire people to Feel good… Feet First! VALUES Passion Accountability Curiosity Creativity Caring BRAND ETHOS Be ferocious about fit BUSINESS STRATEGY We build a diverse portfolio of global brands with broad appeal REASON TO BELIEVE We leverage over 135 years of expertise to provide the right fit for the body, times, personality and lifestyle Our vision
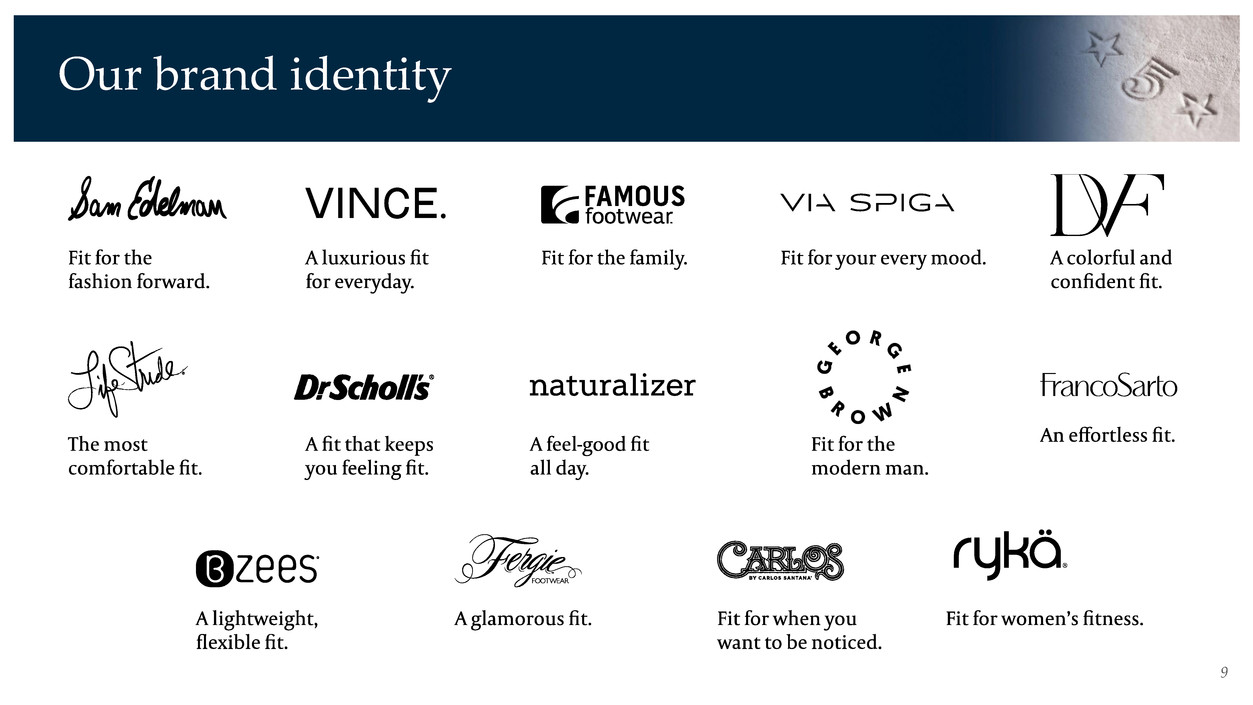
9 Our brand identity

10
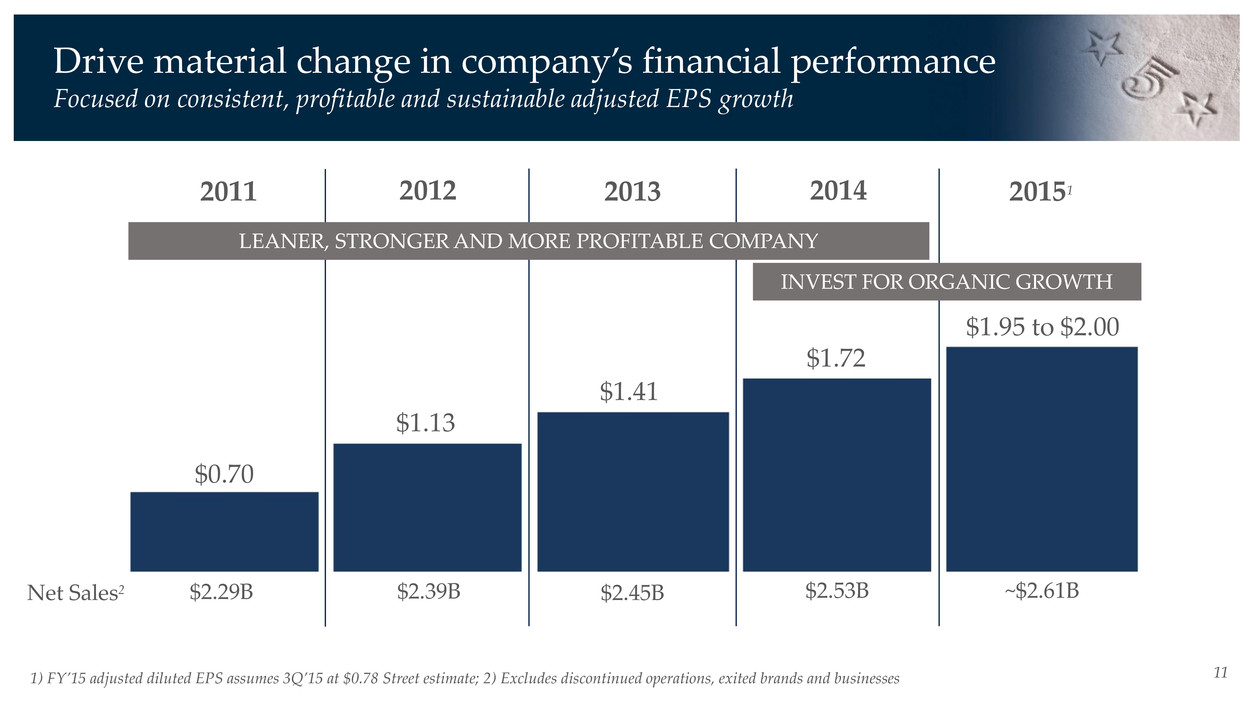
11 Drive material change in company’s financial performance Focused on consistent, profitable and sustainable adjusted EPS growth LEANER, STRONGER AND MORE PROFITABLE COMPANY INVEST FOR ORGANIC GROWTH 2011 2012 2013 2014 20151 $0.70 $1.13 $1.41 $1.72 $1.95 to $2.00 $2.29B $2.39B $2.45B $2.53B ~$2.61BNet Sales2 1) FY’15 adjusted diluted EPS assumes 3Q’15 at $0.78 Street estimate; 2) Excludes discontinued operations, exited brands and businesses

12 Drive material change in company’s financial performance Focused on consistent, profitable and sustainable adjusted EPS growth LEANER, STRONGER AND MORE PROFITABLE COMPANY 2011 2012 2013 2014 $0.70 $1.13 $1.41 $1.72 Net Sales1 Sold AND 1 Closed Sun Prairie DC Licensed and exited unaligned brands Closed Sikeston DC Accelerated closure of underperforming stores Exited Etienne Aigner Sold Avia and Nevados Sold China factories Exited Vera Wang Sold Shoes.com 1) Excludes discontinued operations, exited brands and businesses $2.29B $2.39B $2.45B $2.53B
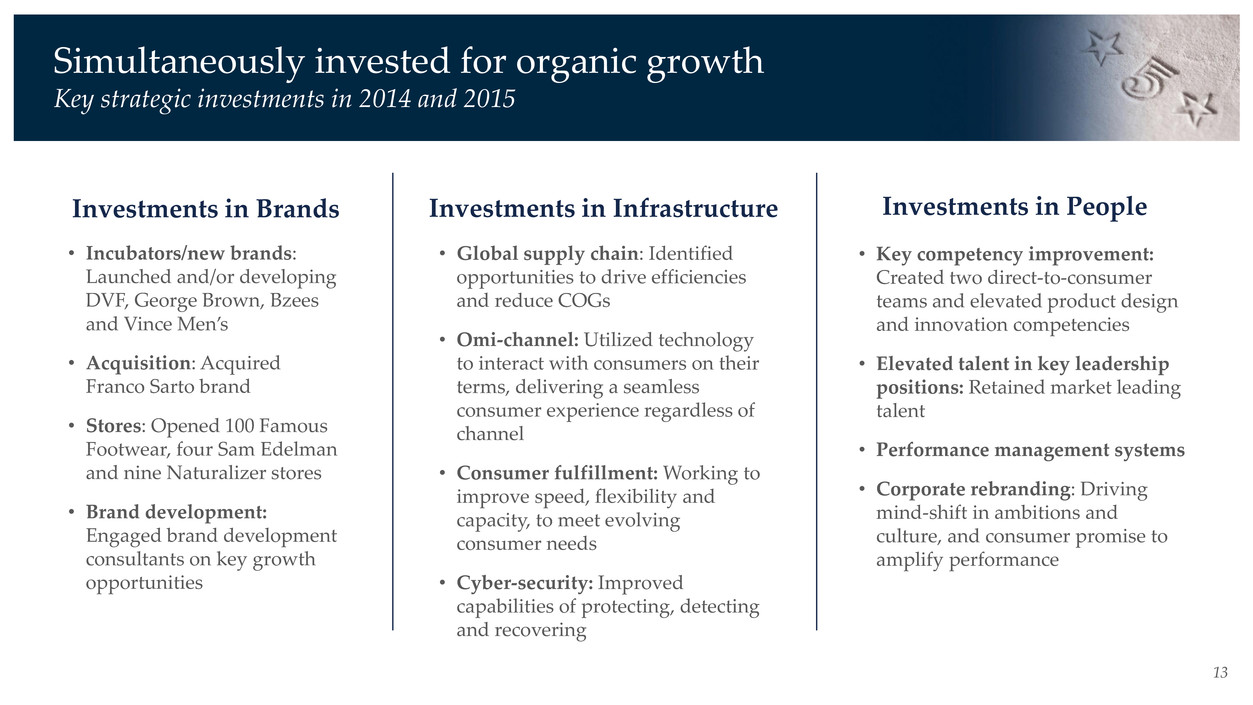
13 • Incubators/new brands: Launched and/or developing DVF, George Brown, Bzees and Vince Men’s • Acquisition: Acquired Franco Sarto brand • Stores: Opened 100 Famous Footwear, four Sam Edelman and nine Naturalizer stores • Brand development: Engaged brand development consultants on key growth opportunities • Global supply chain: Identified opportunities to drive efficiencies and reduce COGs • Omi-channel: Utilized technology to interact with consumers on their terms, delivering a seamless consumer experience regardless of channel • Consumer fulfillment: Working to improve speed, flexibility and capacity, to meet evolving consumer needs • Cyber-security: Improved capabilities of protecting, detecting and recovering • Key competency improvement: Created two direct-to-consumer teams and elevated product design and innovation competencies • Elevated talent in key leadership positions: Retained market leading talent • Performance management systems • Corporate rebranding: Driving mind-shift in ambitions and culture, and consumer promise to amplify performance Simultaneously invested for organic growth Key strategic investments in 2014 and 2015 Investments in Brands Investments in Infrastructure Investments in People
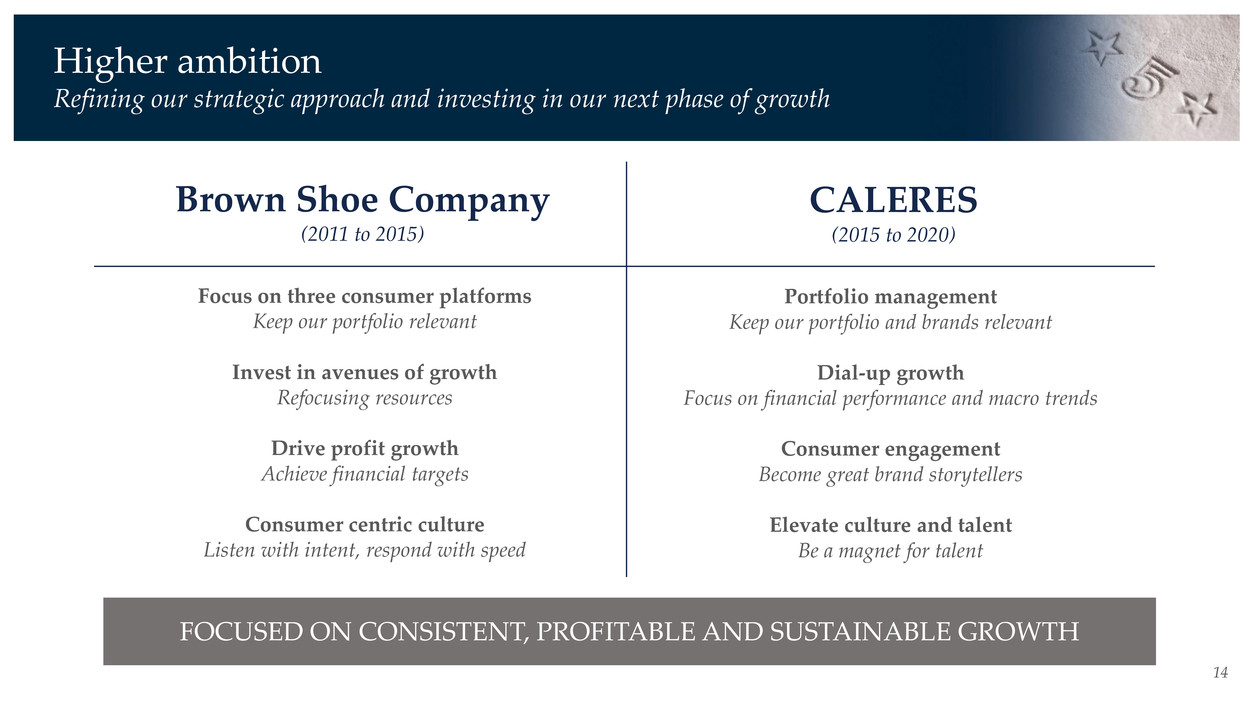
14 Higher ambition Refining our strategic approach and investing in our next phase of growth Brown Shoe Company (2011 to 2015) Focus on three consumer platforms Keep our portfolio relevant Invest in avenues of growth Refocusing resources Drive profit growth Achieve financial targets Consumer centric culture Listen with intent, respond with speed CALERES (2015 to 2020) Portfolio management Keep our portfolio and brands relevant Dial-up growth Focus on financial performance and macro trends Consumer engagement Become great brand storytellers Elevate culture and talent Be a magnet for talent FOCUSED ON CONSISTENT, PROFITABLE AND SUSTAINABLE GROWTH
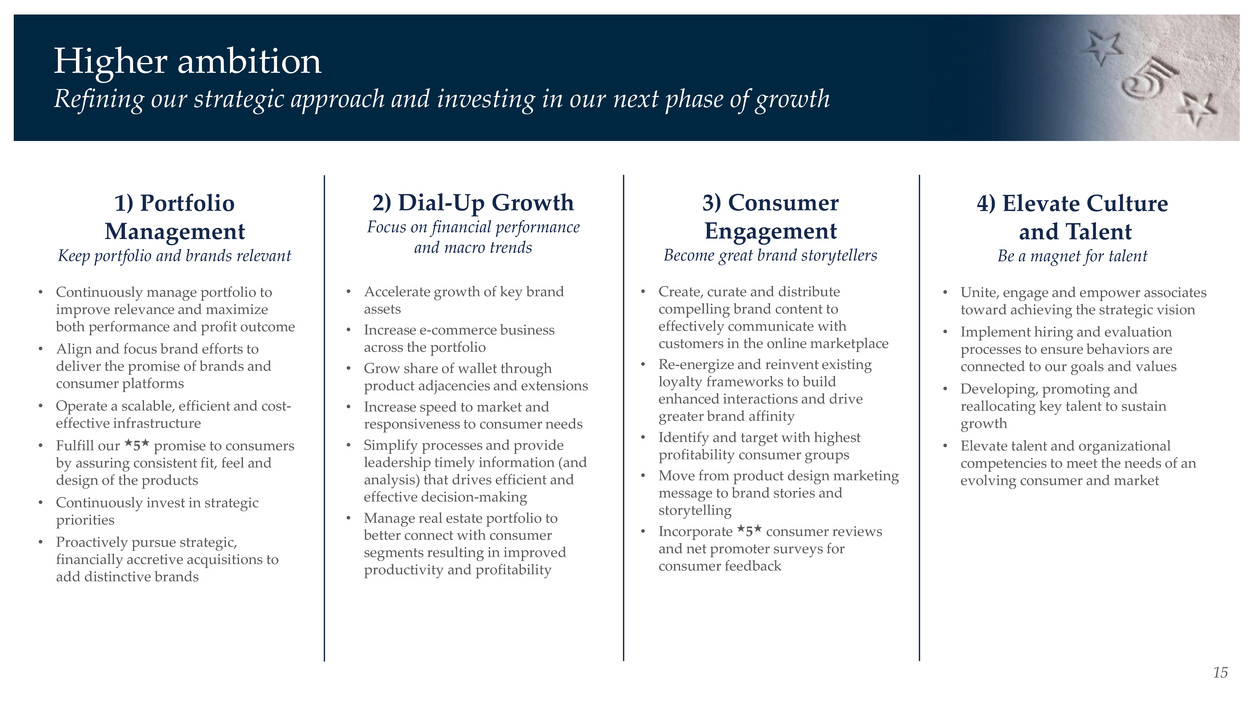
15 Higher ambition Refining our strategic approach and investing in our next phase of growth • Continuously manage portfolio to improve relevance and maximize both performance and profit outcome • Align and focus brand efforts to deliver the promise of brands and consumer platforms • Operate a scalable, efficient and cost- effective infrastructure • Fulfill our ★5★ promise to consumers by assuring consistent fit, feel and design of the products • Continuously invest in strategic priorities • Proactively pursue strategic, financially accretive acquisitions to add distinctive brands 1) Portfolio Management Keep portfolio and brands relevant • Accelerate growth of key brand assets • Increase e-commerce business across the portfolio • Grow share of wallet through product adjacencies and extensions • Increase speed to market and responsiveness to consumer needs • Simplify processes and provide leadership timely information (and analysis) that drives efficient and effective decision-making • Manage real estate portfolio to better connect with consumer segments resulting in improved productivity and profitability 2) Dial-Up Growth Focus on financial performance and macro trends • Create, curate and distribute compelling brand content to effectively communicate with customers in the online marketplace • Re-energize and reinvent existing loyalty frameworks to build enhanced interactions and drive greater brand affinity • Identify and target with highest profitability consumer groups • Move from product design marketing message to brand stories and storytelling • Incorporate ★5★ consumer reviews and net promoter surveys for consumer feedback 3) Consumer Engagement Become great brand storytellers • Unite, engage and empower associates toward achieving the strategic vision • Implement hiring and evaluation processes to ensure behaviors are connected to our goals and values • Developing, promoting and reallocating key talent to sustain growth • Elevate talent and organizational competencies to meet the needs of an evolving consumer and market 4) Elevate Culture and Talent Be a magnet for talent
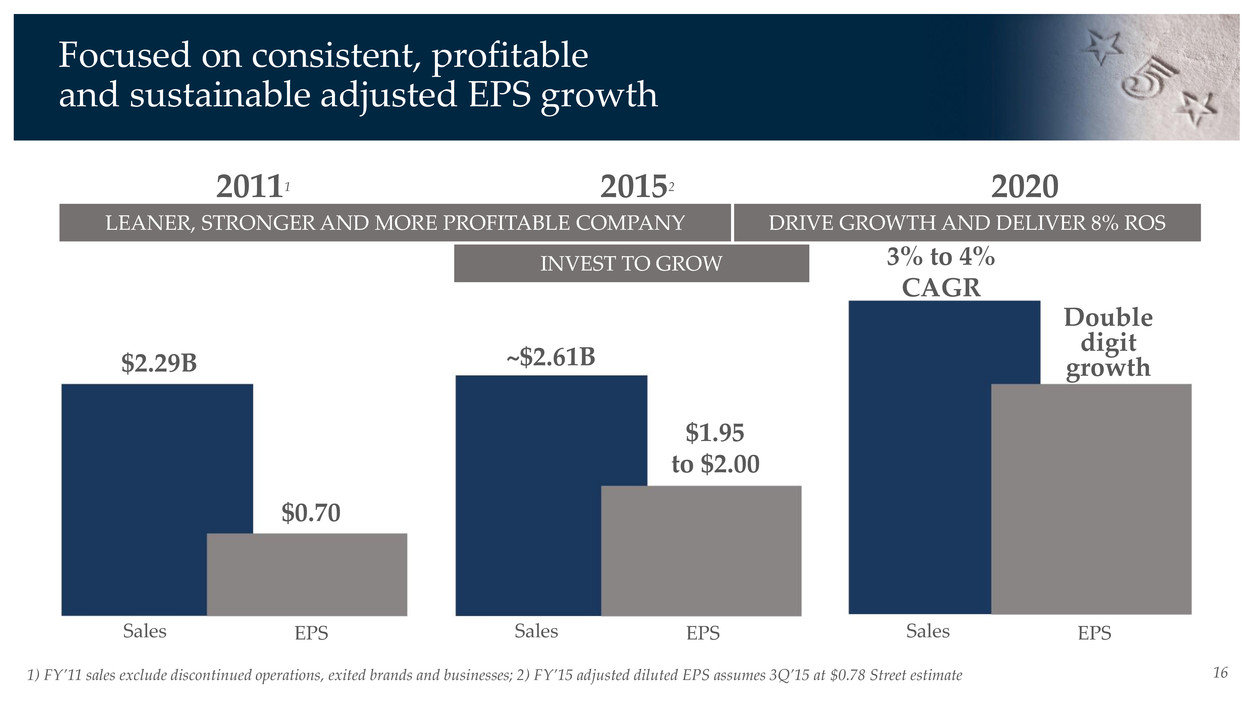
16 ~$2.61B $1.95 to $2.00 Double digit growth Focused on consistent, profitable and sustainable adjusted EPS growth INVEST TO GROW 20152 DRIVE GROWTH AND DELIVER 8% ROS Sales EPS 3% to 4% CAGR 2020 $2.29B $0.70 Sales EPSSales EPS 20111 LEANER, STRONGER AND MORE PROFITABLE COMPANY 1) FY’11 sales exclude discontinued operations, exited brands and businesses; 2) FY’15 adjusted diluted EPS assumes 3Q’15 at $0.78 Street estimate

Ken Hannah Senior Vice President and CFO
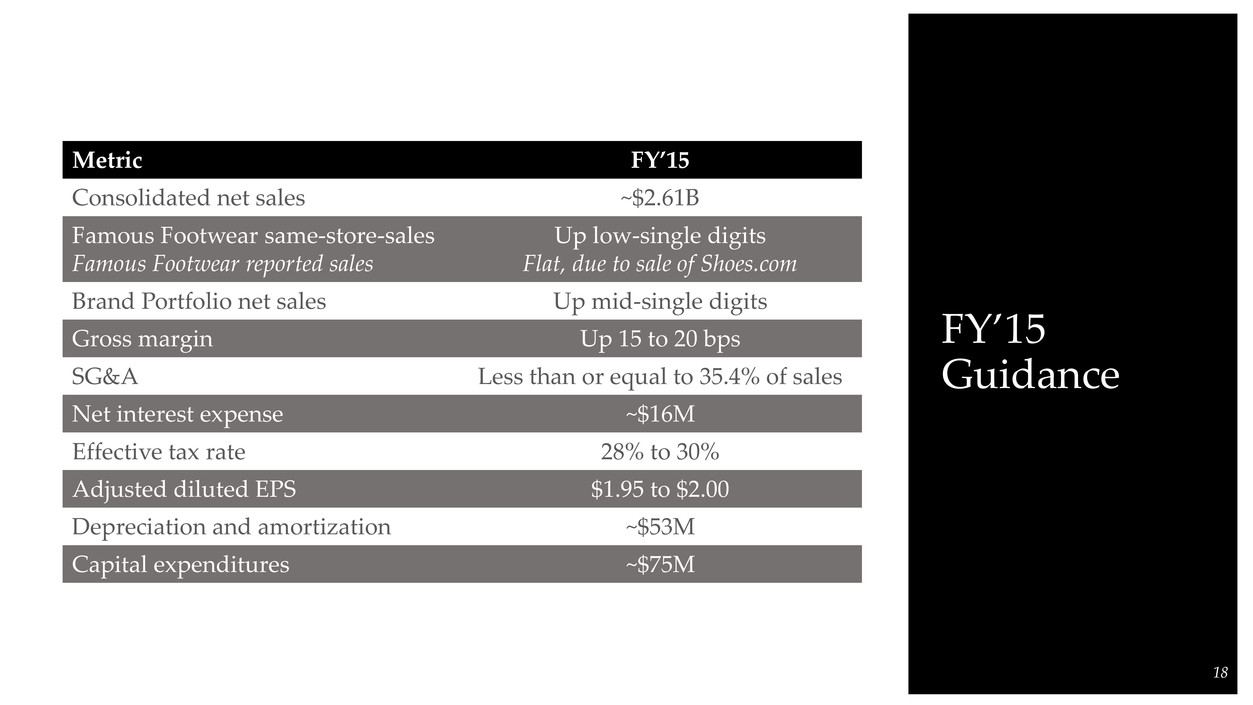
FY’15 Guidance 18 Metric FY’15 Consolidated net sales ~$2.61B Famous Footwear same-store-sales Famous Footwear reported sales Up low-single digits Flat, due to sale of Shoes.com Brand Portfolio net sales Up mid-single digits Gross margin Up 15 to 20 bps SG&A Less than or equal to 35.4% of sales Net interest expense ~$16M Effective tax rate 28% to 30% Adjusted diluted EPS $1.95 to $2.00 Depreciation and amortization ~$53M Capital expenditures ~$75M
Delivering consistent, profitable, sustainable growth Maintaining financial flexibility to execute plans Investing in infrastructure to enhance performance Creating a compelling consumer experience Offering differentiated product and distinctive brands Business Model 1. 2. 3. 4. 5. 3
Delivering consistent, profitable, sustainable growth Business Model 1. 4
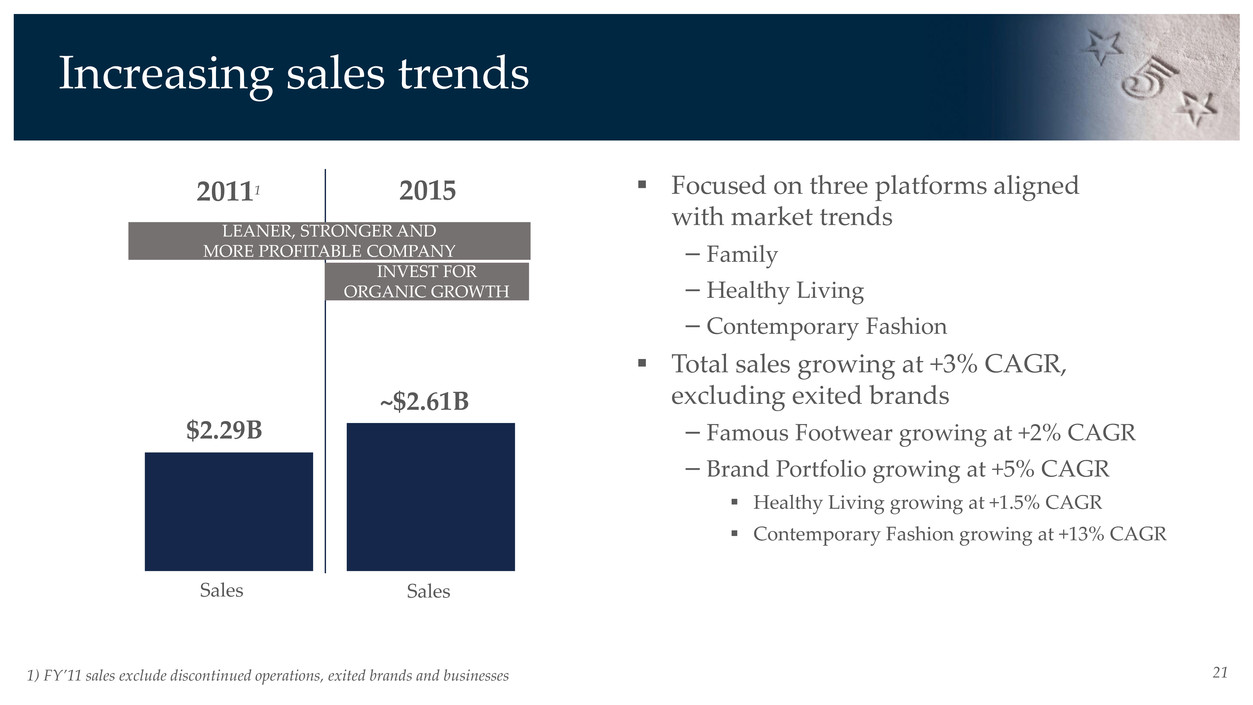
21 Focused on three platforms aligned with market trends − Family − Healthy Living −Contemporary Fashion Total sales growing at +3% CAGR, excluding exited brands − Famous Footwear growing at +2% CAGR − Brand Portfolio growing at +5% CAGR Healthy Living growing at +1.5% CAGR Contemporary Fashion growing at +13% CAGR 1) FY’11 sales exclude discontinued operations, exited brands and businesses Increasing sales trends $2.29B ~$2.61B 20111 2015 LEANER, STRONGER AND MORE PROFITABLE COMPANY INVEST FOR ORGANIC GROWTH Sales Sales
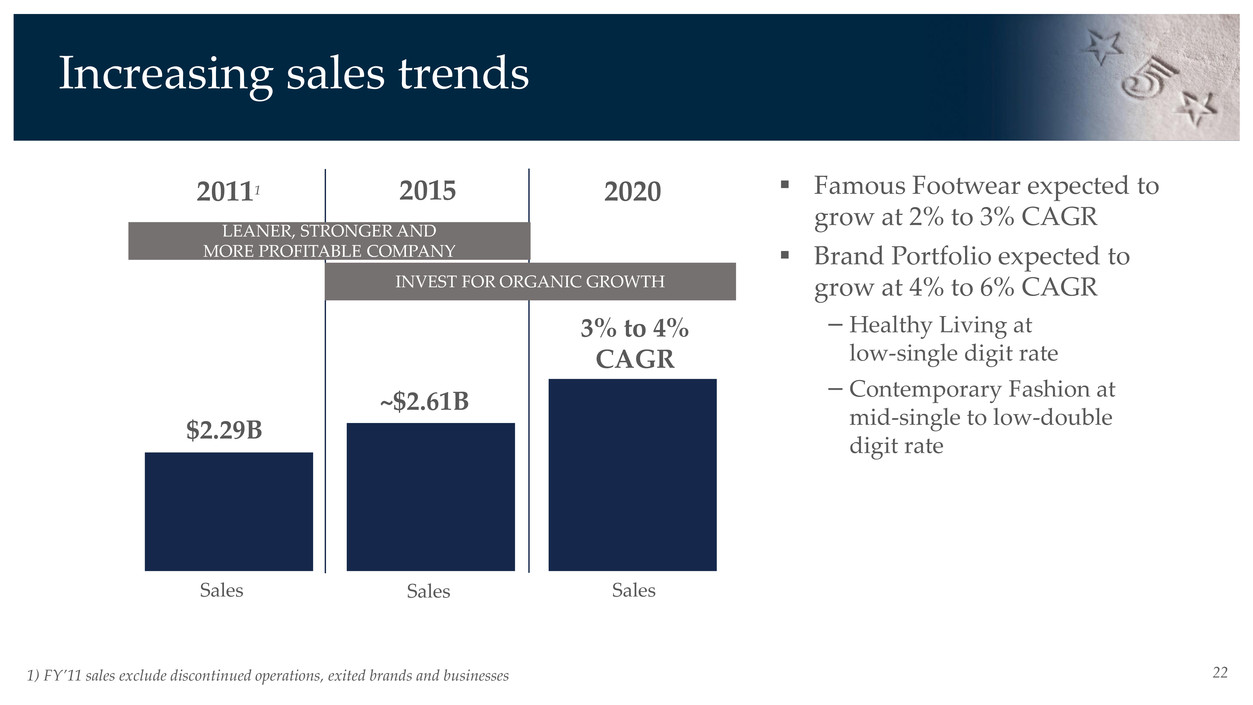
221) FY’11 sales exclude discontinued operations, exited brands and businesses $2.29B ~$2.61B 3% to 4% CAGR Increasing sales trends 2015 2020 LEANER, STRONGER AND MORE PROFITABLE COMPANY INVEST FOR ORGANIC GROWTH 20111 Sales Sales Sales Famous Footwear expected to grow at 2% to 3% CAGR Brand Portfolio expected to grow at 4% to 6% CAGR − Healthy Living at low-single digit rate −Contemporary Fashion at mid-single to low-double digit rate
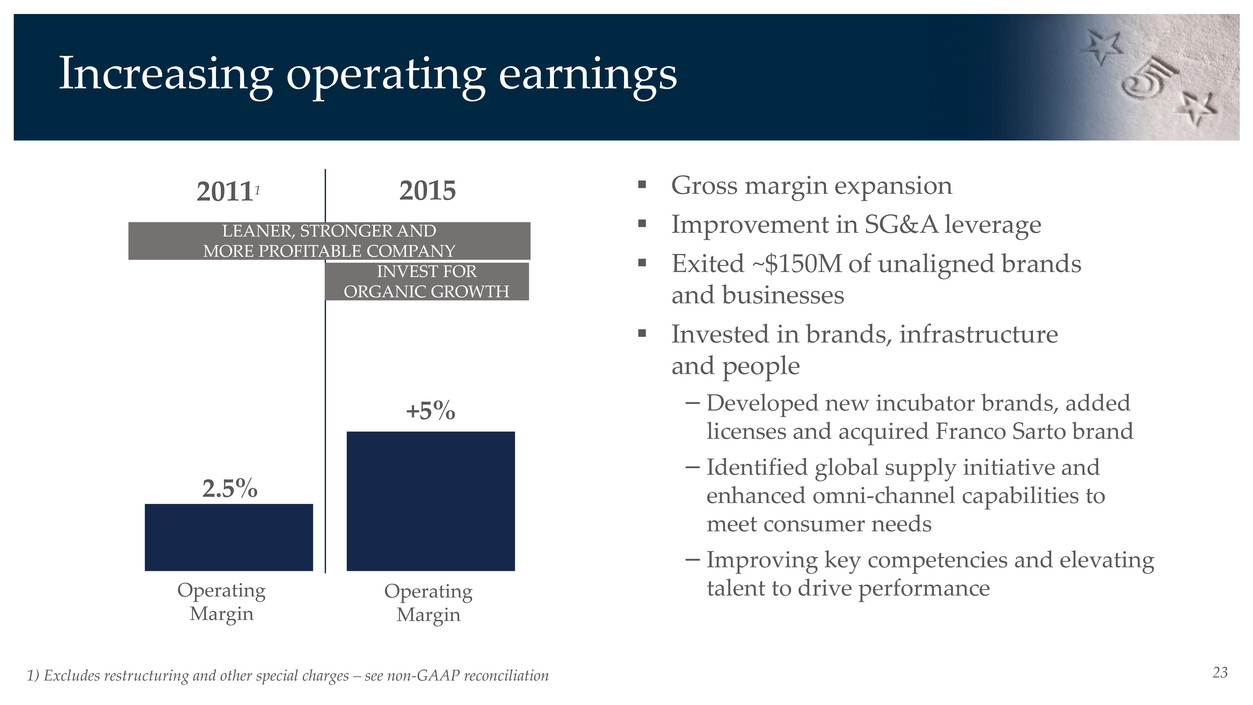
23 2.5% +5% Increasing operating earnings LEANER, STRONGER AND MORE PROFITABLE COMPANY INVEST FOR ORGANIC GROWTH 20111 2015 Gross margin expansion Improvement in SG&A leverage Exited ~$150M of unaligned brands and businesses Invested in brands, infrastructure and people −Developed new incubator brands, added licenses and acquired Franco Sarto brand − Identified global supply initiative and enhanced omni-channel capabilities to meet consumer needs −Improving key competencies and elevating talent to drive performanceOperating Margin Operating Margin 1) Excludes restructuring and other special charges – see non-GAAP reconciliation
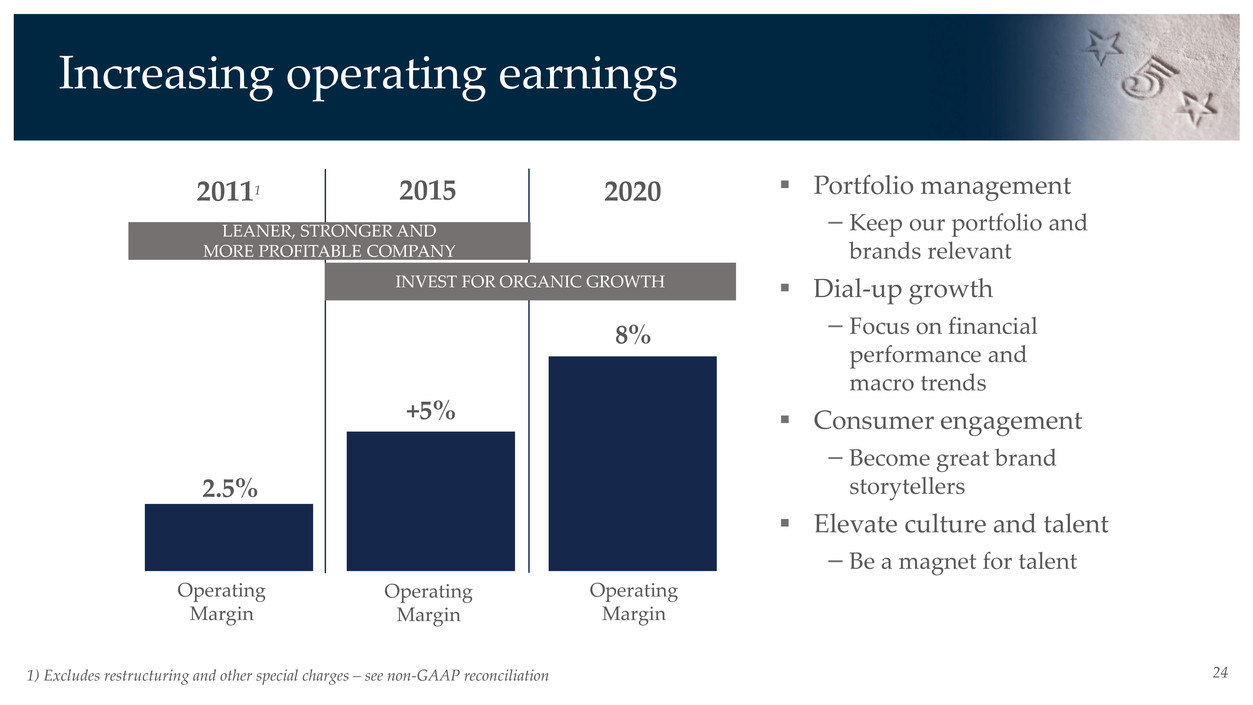
24 8% Increasing operating earnings LEANER, STRONGER AND MORE PROFITABLE COMPANY INVEST FOR ORGANIC GROWTH 2015 2020 Operating Margin Operating Margin Operating Margin Portfolio management − Keep our portfolio and brands relevant Dial-up growth − Focus on financial performance and macro trends Consumer engagement −Become great brand storytellers Elevate culture and talent − Be a magnet for talent 2.5% +5% 1) Excludes restructuring and other special charges – see non-GAAP reconciliation 20111
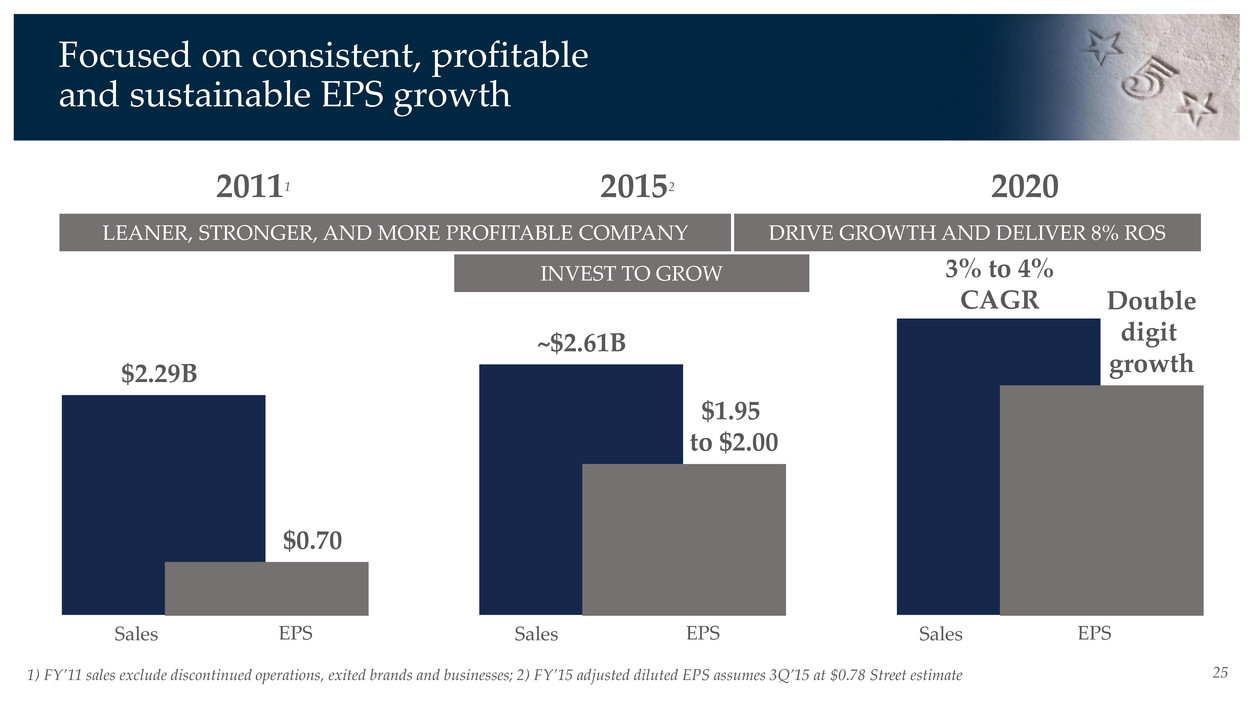
25 Focused on consistent, profitable and sustainable EPS growth Sales EPSSales EPSSales EPS $2.29B ~$2.61B 3% to 4% CAGR $0.70 $1.95 to $2.00 Double digit growth INVEST TO GROW 20152 DRIVE GROWTH AND DELIVER 8% ROS 202020111 LEANER, STRONGER, AND MORE PROFITABLE COMPANY 1) FY’11 sales exclude discontinued operations, exited brands and businesses; 2) FY’15 adjusted diluted EPS assumes 3Q’15 at $0.78 Street estimate
Delivering consistent, profitable, sustainable growth Maintaining financial flexibility to execute plans Business Model 1. 2. 10
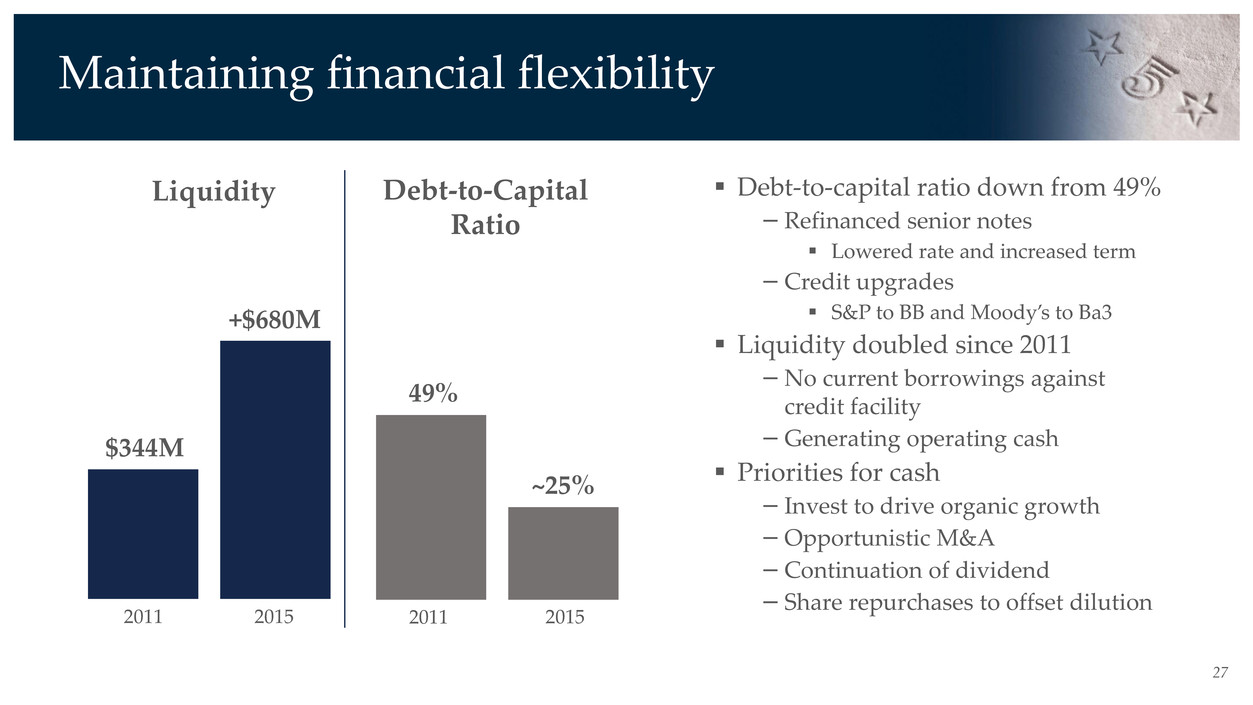
27 $344M +$680M Debt-to-capital ratio down from 49% − Refinanced senior notes Lowered rate and increased term −Credit upgrades S&P to BB and Moody’s to Ba3 Liquidity doubled since 2011 −No current borrowings against credit facility −Generating operating cash Priorities for cash − Invest to drive organic growth − Opportunistic M&A −Continuation of dividend − Share repurchases to offset dilution 49% ~25% 2011 20112015 2015 Maintaining financial flexibility Liquidity Debt-to-Capital Ratio
Delivering consistent, profitable, sustainable growth Maintaining financial flexibility to execute plans Investing in infrastructure to enhance performance Business Model 1. 2. 3. 12
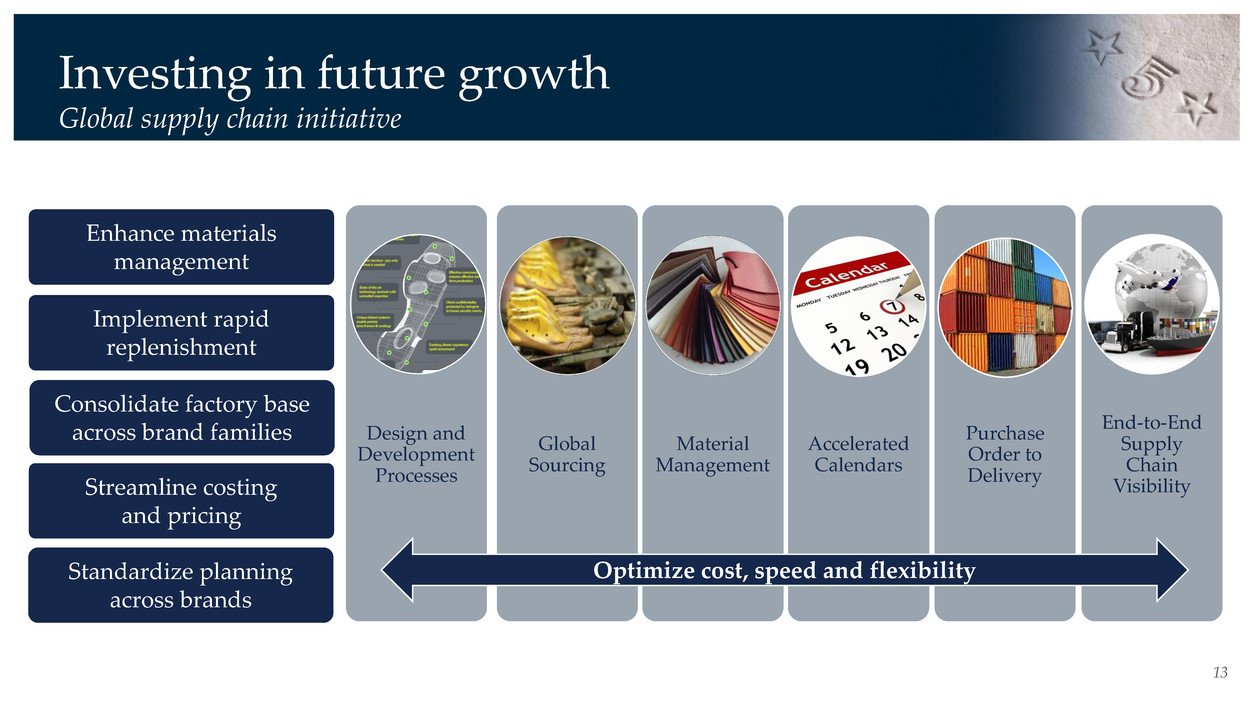
Material Management Global Sourcing Design and Development Processes Accelerated Calendars Purchase Order to Delivery End-to-End Supply Chain Visibility Optimize cost, speed and flexibility Investing in future growth Global supply chain initiative Enhance materials management Implement rapid replenishment Consolidate factory base across brand families Streamline costing and pricing Standardize planning across brands 13
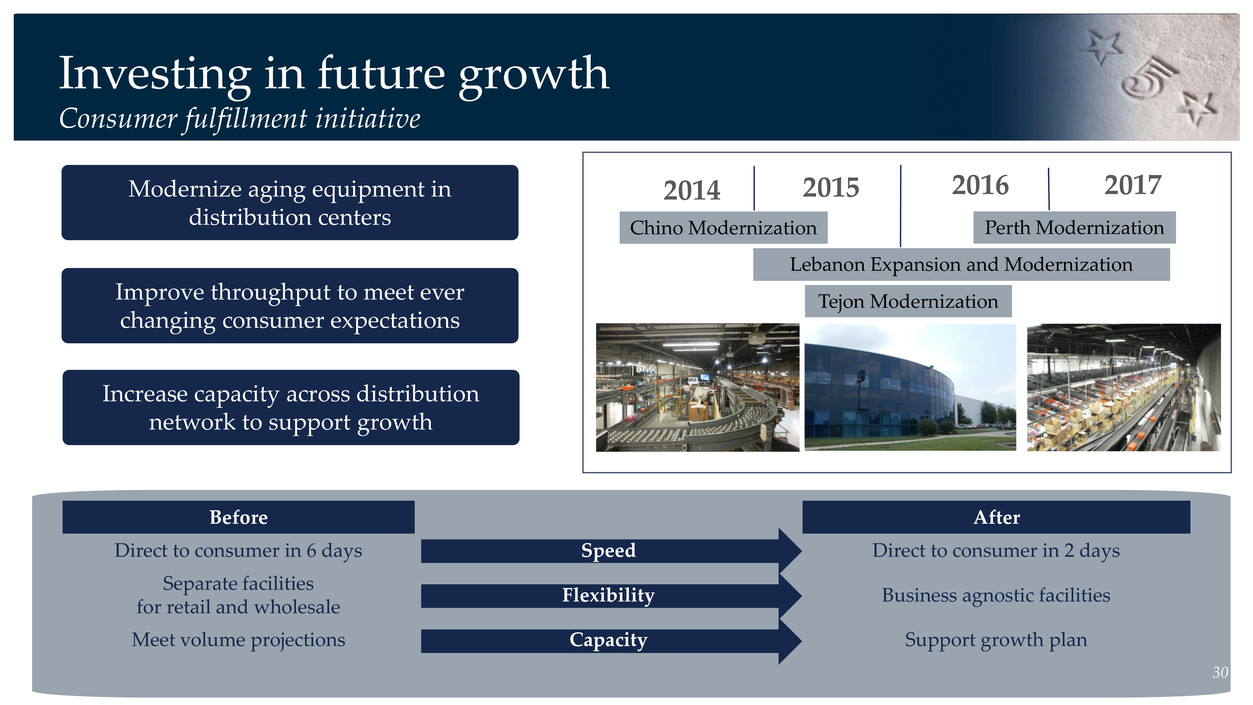
Before After Direct to consumer in 6 days Speed Direct to consumer in 2 days Separate facilities for retail and wholesale Flexibility Business agnostic facilities Meet volume projections Capacity Support growth plan 2015 2016 20172014 30 Tejon Modernization Lebanon Expansion and Modernization Perth ModernizationChino Modernization Investing in future growth Consumer fulfillment initiative Modernize aging equipment in distribution centers Improve throughput to meet ever changing consumer expectations Increase capacity across distribution network to support growth
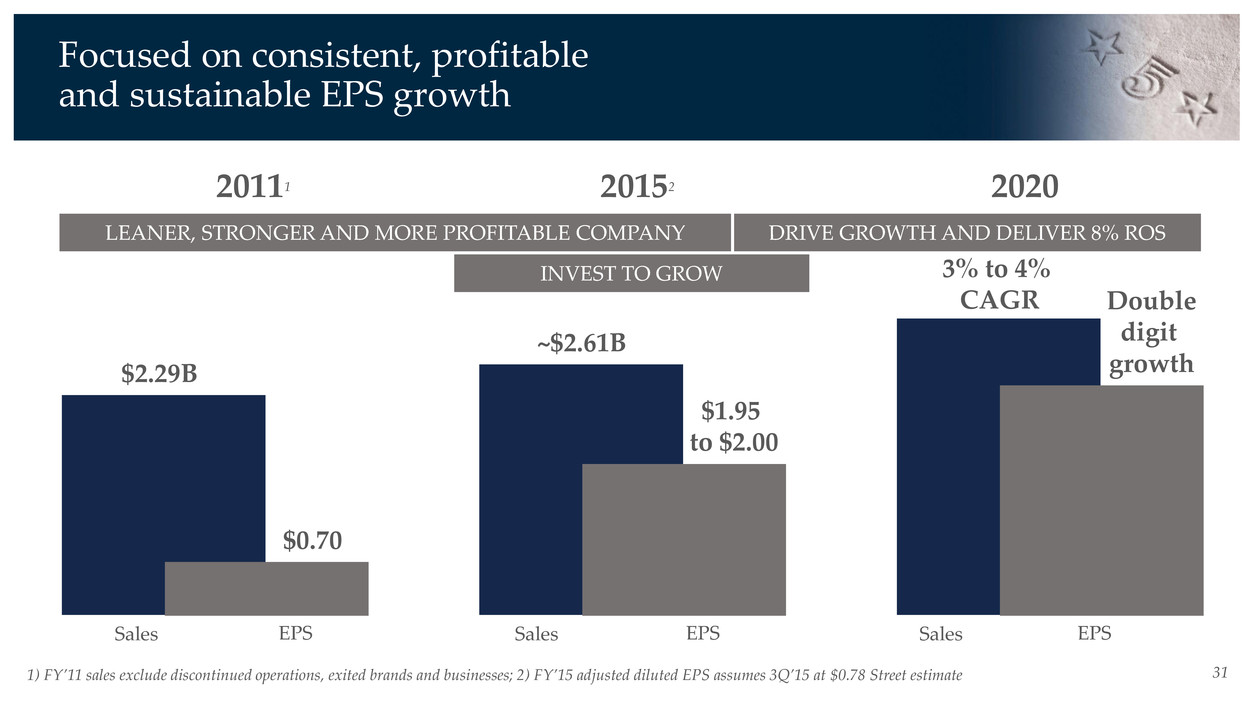
31 Focused on consistent, profitable and sustainable EPS growth Sales EPSSales EPSSales EPS $2.29B ~$2.61B 3% to 4% CAGR $0.70 $1.95 to $2.00 Double digit growth INVEST TO GROW 20152 DRIVE GROWTH AND DELIVER 8% ROS 202020111 LEANER, STRONGER AND MORE PROFITABLE COMPANY 1) FY’11 sales exclude discontinued operations, exited brands and businesses; 2) FY’15 adjusted diluted EPS assumes 3Q’15 at $0.78 Street estimate
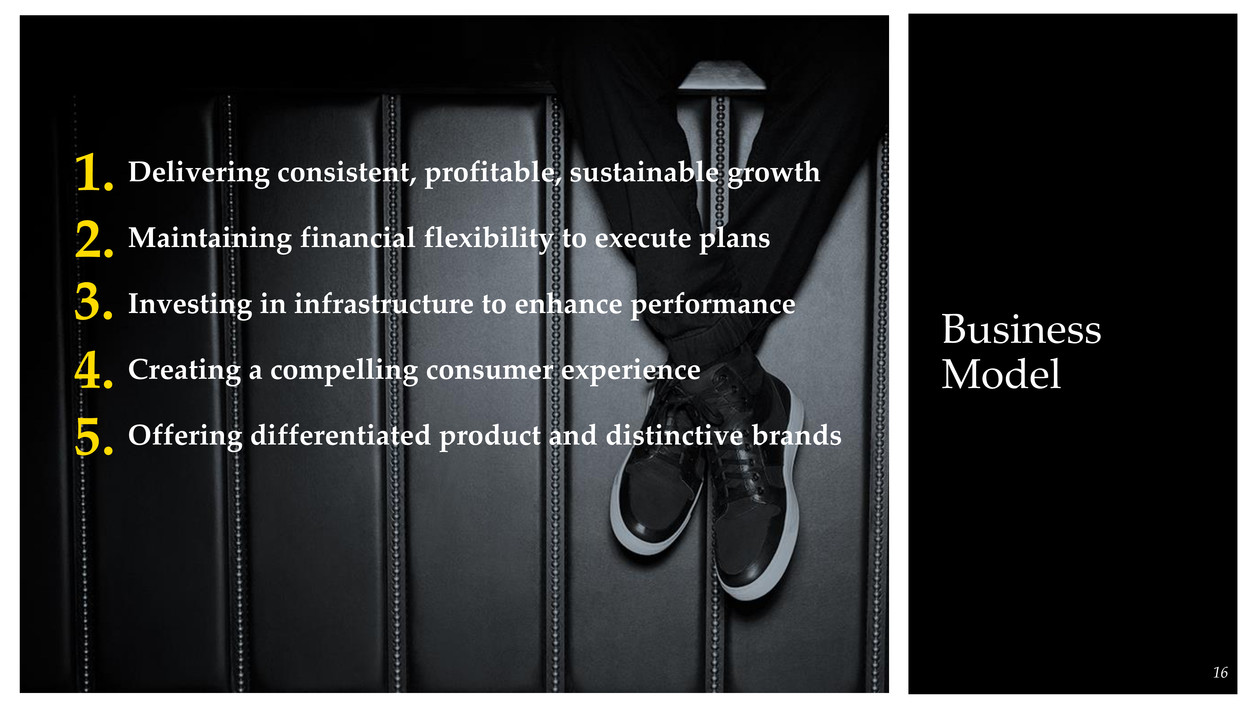
Delivering consistent, profitable, sustainable growth Maintaining financial flexibility to execute plans Investing in infrastructure to enhance performance Creating a compelling consumer experience Offering differentiated product and distinctive brands Business Model 1. 2. 3. 4. 5. 16
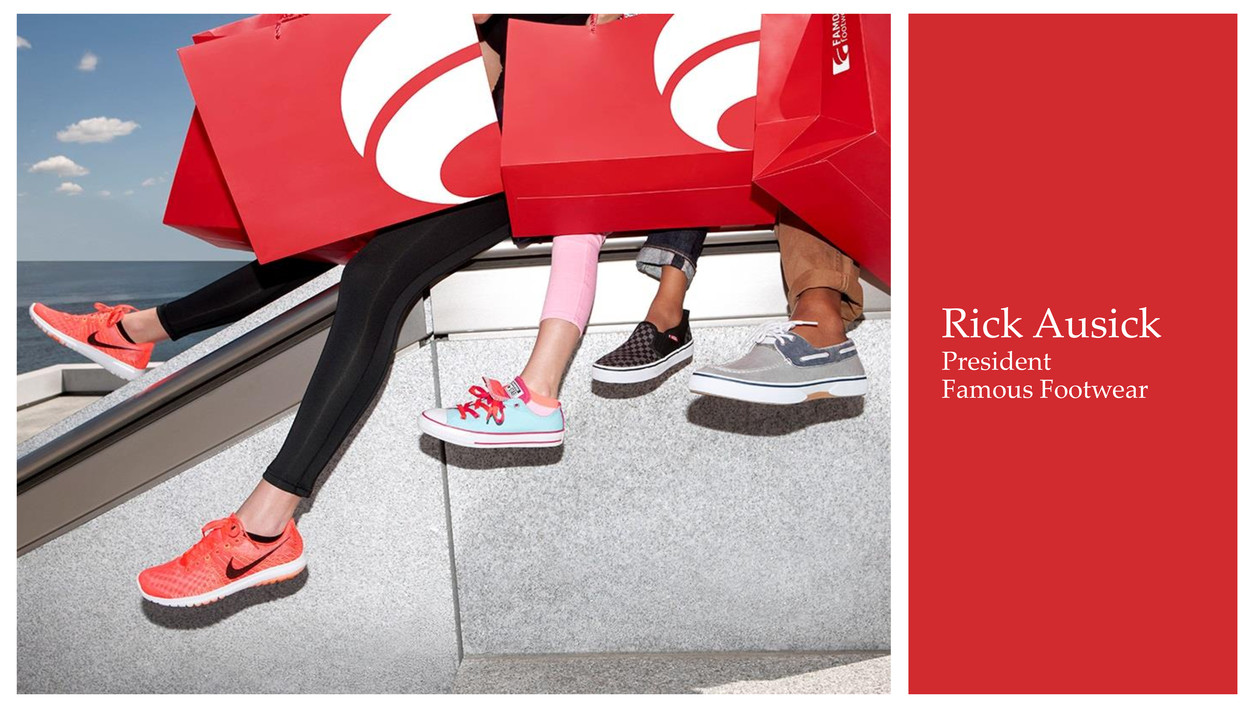
Rick Ausick President Famous Footwear
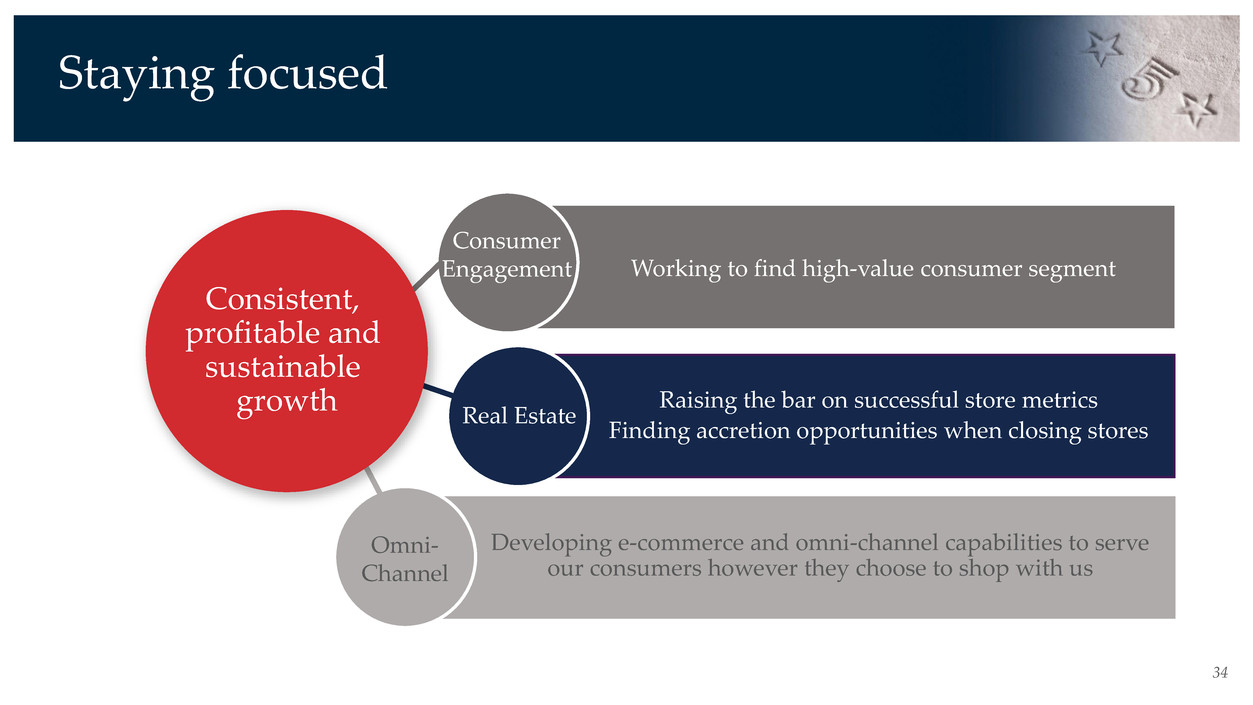
Staying focused 34 Working to find high-value consumer segment Raising the bar on successful store metrics Finding accretion opportunities when closing stores Developing e-commerce and omni-channel capabilities to serve our consumers however they choose to shop with us Consistent, profitable and sustainable growth Consumer Engagement Real Estate Omni- Channel
35 Identified high-value consumer segment... has strong emotional connection to footwear and is predisposed to shop with us Shop more often Buy more pairs Spend more per pair More loyal Greater lifetime value Digitally connected but like store experience Consumer engagement
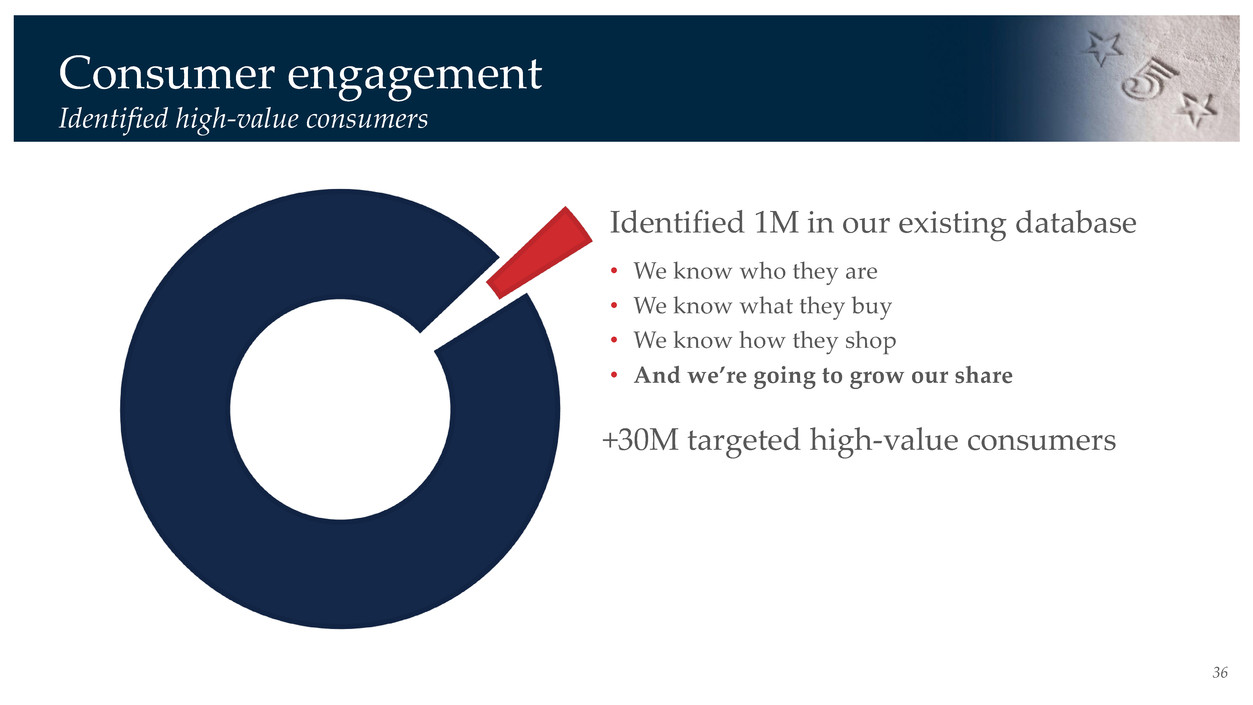
36 Identified 1M in our existing database • We know who they are • We know what they buy • We know how they shop • And we’re going to grow our share +30M targeted high-value consumers Consumer engagement Identified high-value consumers

37 Direct correlation between stores with greater concentrations of high-value consumers and... • Higher volume • Higher sales per sq. ft. • Higher gross margin • Higher operating profit • Better traffic trends Real estate portfolio Identified stores with greater concentrations of high-value consumers
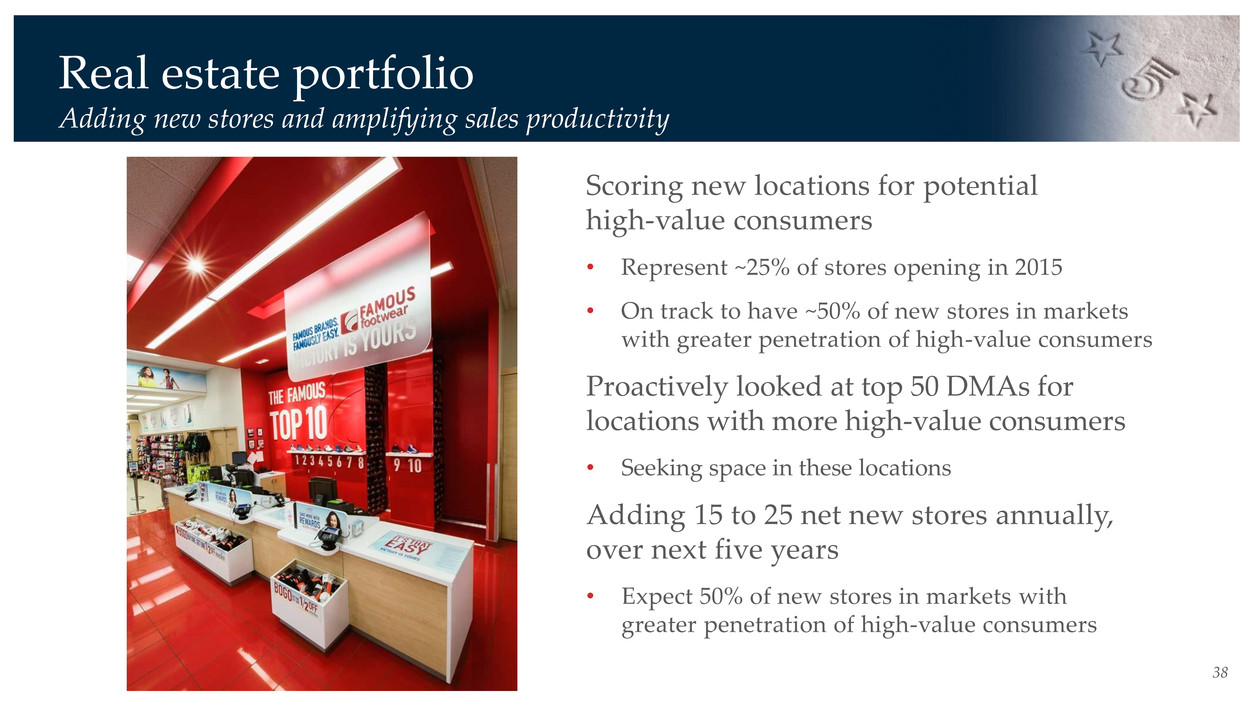
38 Scoring new locations for potential high-value consumers • Represent ~25% of stores opening in 2015 • On track to have ~50% of new stores in markets with greater penetration of high-value consumers Proactively looked at top 50 DMAs for locations with more high-value consumers • Seeking space in these locations Adding 15 to 25 net new stores annually, over next five years • Expect 50% of new stores in markets with greater penetration of high-value consumers Real estate portfolio Adding new stores and amplifying sales productivity
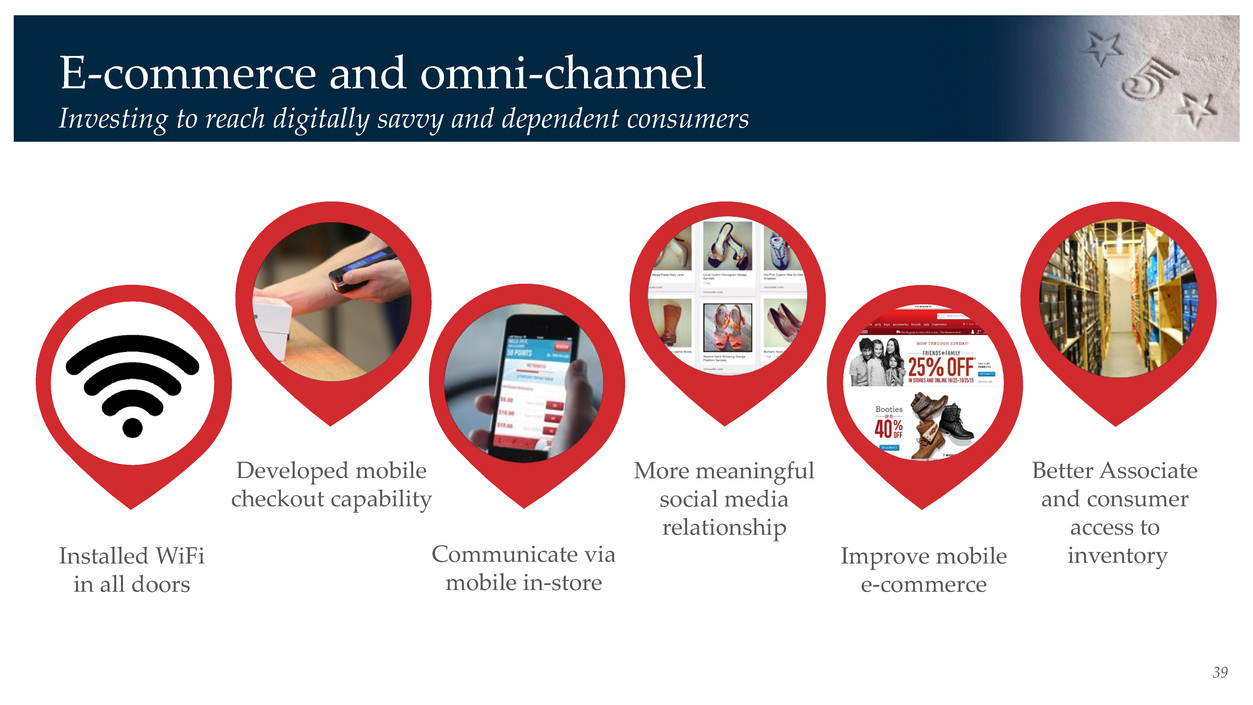
39 Installed WiFi in all doors Developed mobile checkout capability Communicate via mobile in-store More meaningful social media relationship Improve mobile e-commerce Better Associate and consumer access to inventory E-commerce and omni-channel Investing to reach digitally savvy and dependent consumers

40 Strong positions in coveted categories and brands Adjusting assortments to provide more comprehensive offering Engaging high-value consumers in digital environments they frequent Messaging tailored to their strong emotional connection Revamping program to provide more meaningful interaction for earning and using points Continued robust and successful e-mail program Making more conducive to drive high-value consumers’ emotional triggers New selling model encourages Associates to make a connection, with stronger interaction Investing in endless aisle opportunity and more entertaining experience Know how to reach these consumers Testing variety of marketing initiatives in 2016 and intensifying digital marketing presence Aggressively deploying initiatives to capture more profitable sales and gain more insights ASSORTMENT DIGITALREWARDS STORES REACH Consumer engagement Taking aggressive efforts to acquire and retain high-value consumers
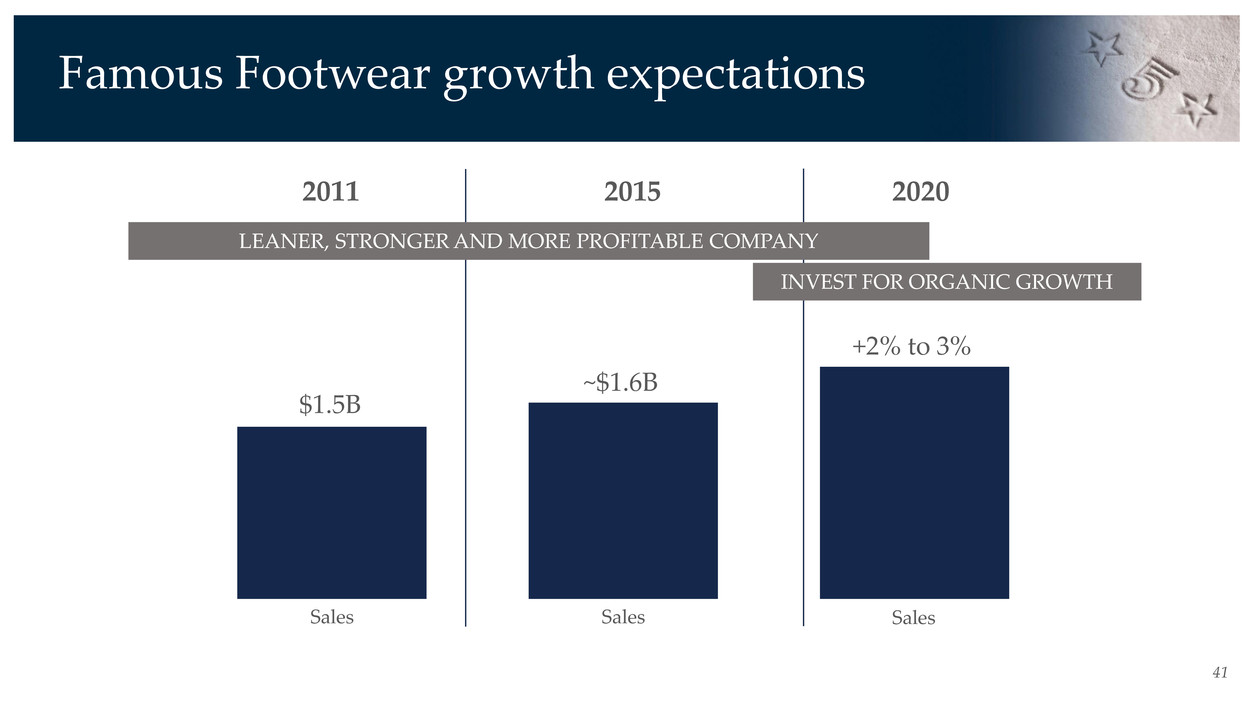
41 Famous Footwear growth expectations $1.5B ~$1.6B +2% to 3% LEANER, STRONGER AND MORE PROFITABLE COMPANY INVEST FOR ORGANIC GROWTH 2011 2015 2020 Sales Sales Sales

Jay Schmidt President Brand Portfolio
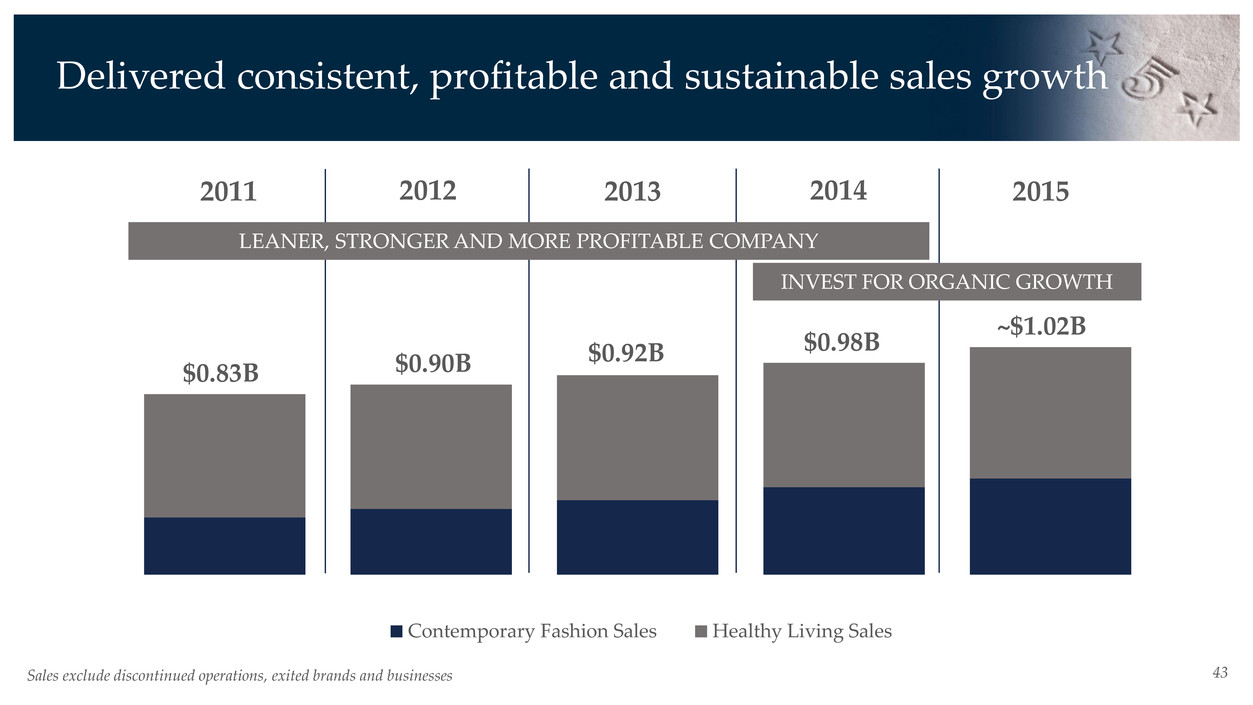
Contemporary Fashion Sales Healthy Living Sales Delivered consistent, profitable and sustainable sales growth 43 $0.90B$0.83B $0.92B $0.98B ~$1.02B Sales exclude discontinued operations, exited brands and businesses LEANER, STRONGER AND MORE PROFITABLE COMPANY INVEST FOR ORGANIC GROWTH 2011 2012 2013 2014 2015
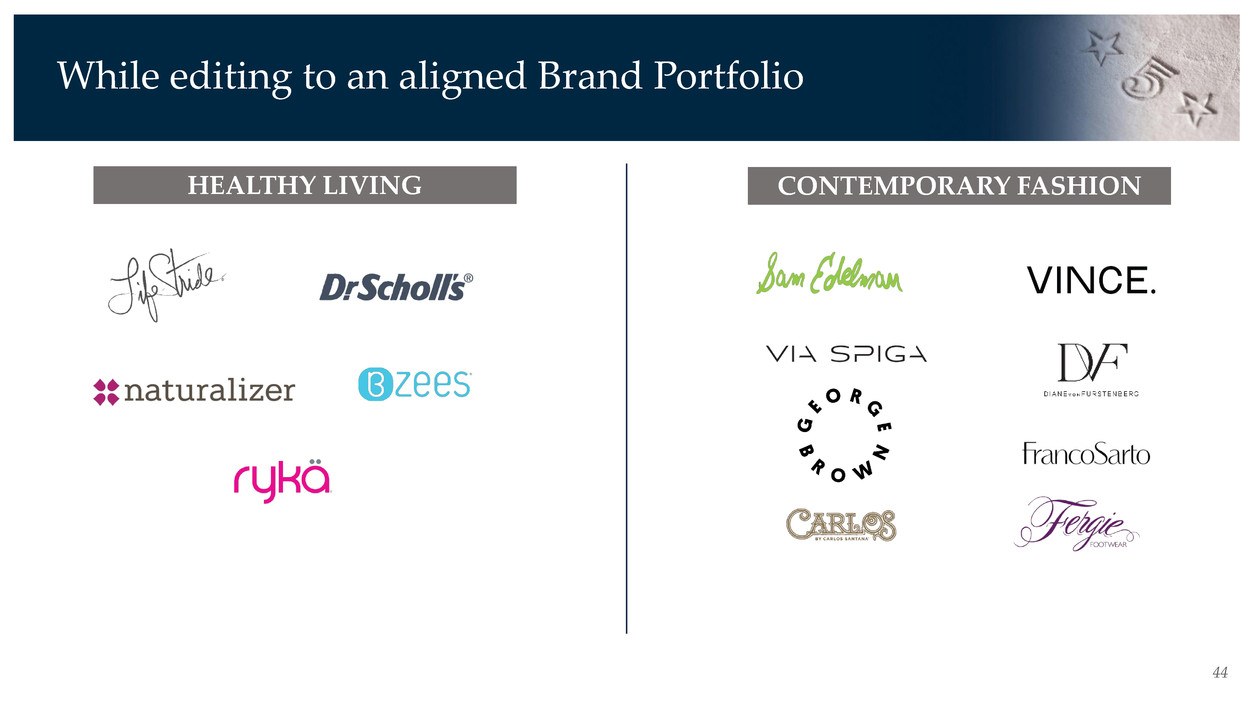
44 While editing to an aligned Brand Portfolio HEALTHY LIVING CONTEMPORARY FASHION
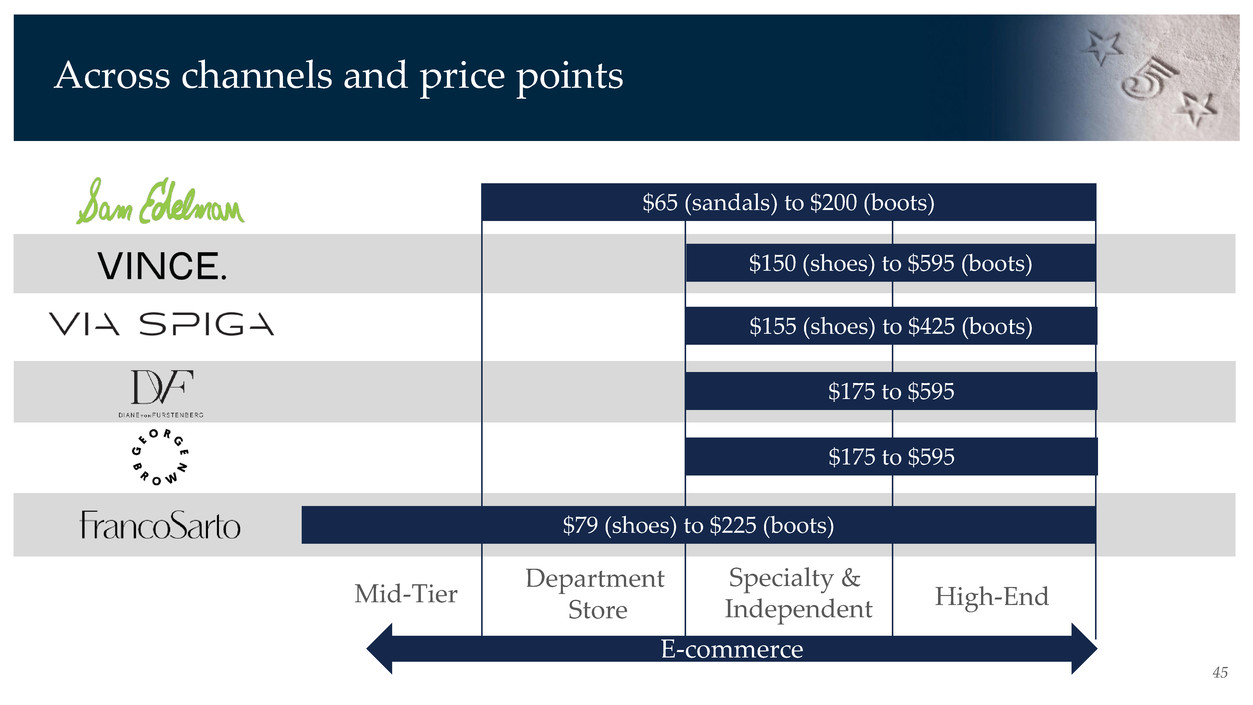
Across channels and price points 45 $65 (sandals) to $200 (boots) $150 (shoes) to $595 (boots) $155 (shoes) to $425 (boots) $175 to $595 $79 (shoes) to $225 (boots) $175 to $595 Specialty & Independent High-End Mid-Tier Department Store E-commerce
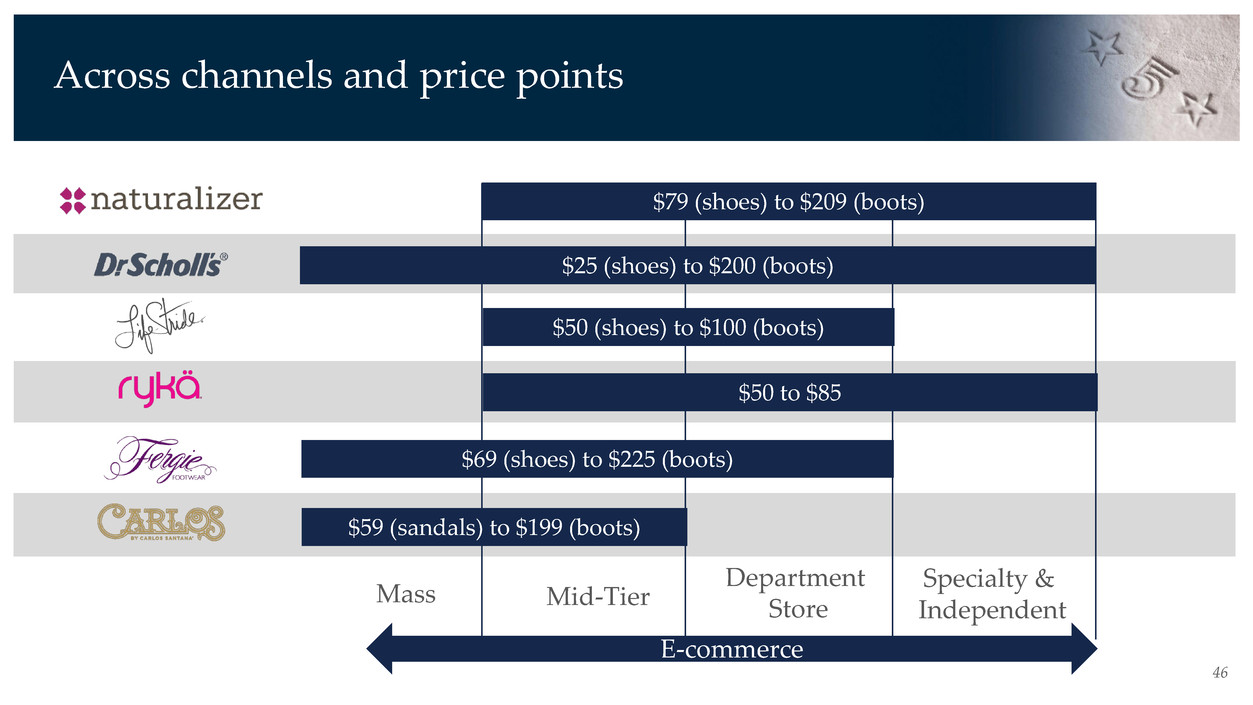
Across channels and price points 46 Department Store Specialty & Independent $79 (shoes) to $209 (boots) $25 (shoes) to $200 (boots) $50 (shoes) to $100 (boots) $50 to $85 Mass Mid-Tier E-commerce $69 (shoes) to $225 (boots) $59 (sandals) to $199 (boots)

As we amplify our brand storytelling 47
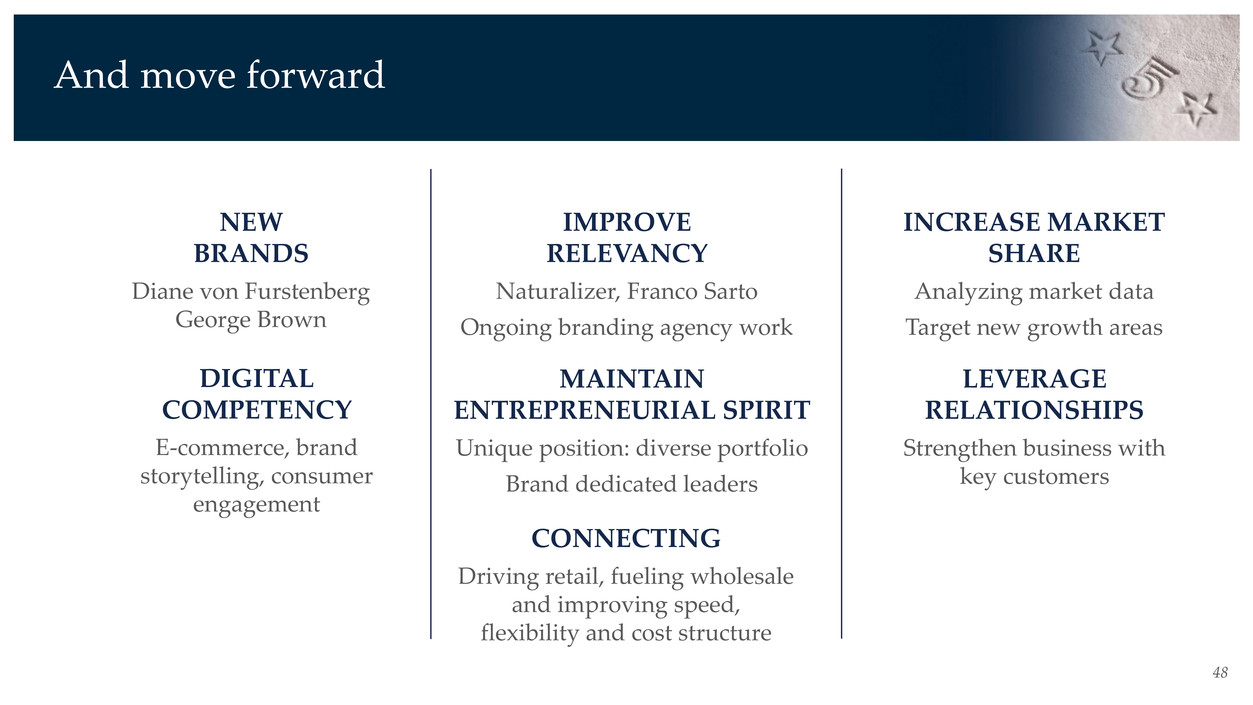
NEW BRANDS Diane von Furstenberg George Brown 48 IMPROVE RELEVANCY Naturalizer, Franco Sarto Ongoing branding agency work INCREASE MARKET SHARE Analyzing market data Target new growth areas DIGITAL COMPETENCY E-commerce, brand storytelling, consumer engagement MAINTAIN ENTREPRENEURIAL SPIRIT Unique position: diverse portfolio Brand dedicated leaders LEVERAGE RELATIONSHIPS Strengthen business with key customers CONNECTING Driving retail, fueling wholesale and improving speed, flexibility and cost structure And move forward
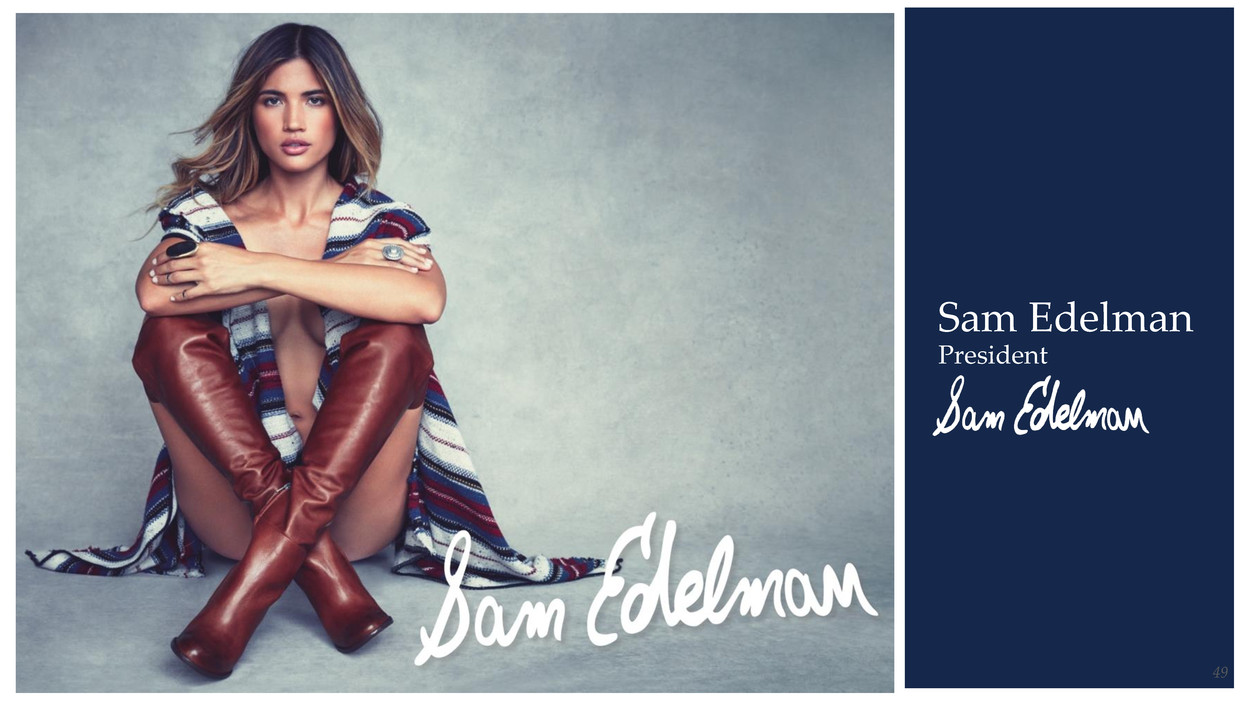
Sam Edelman President 49

50
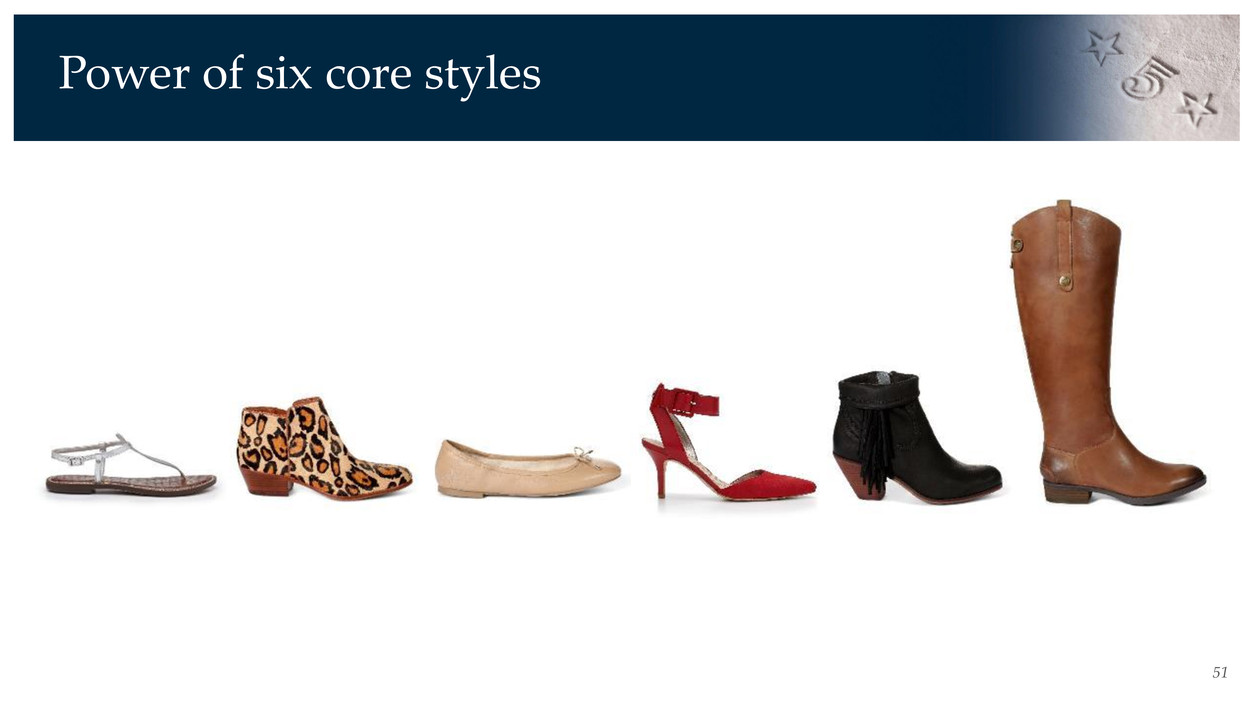
51 Power of six core styles

52

53
54
55
56
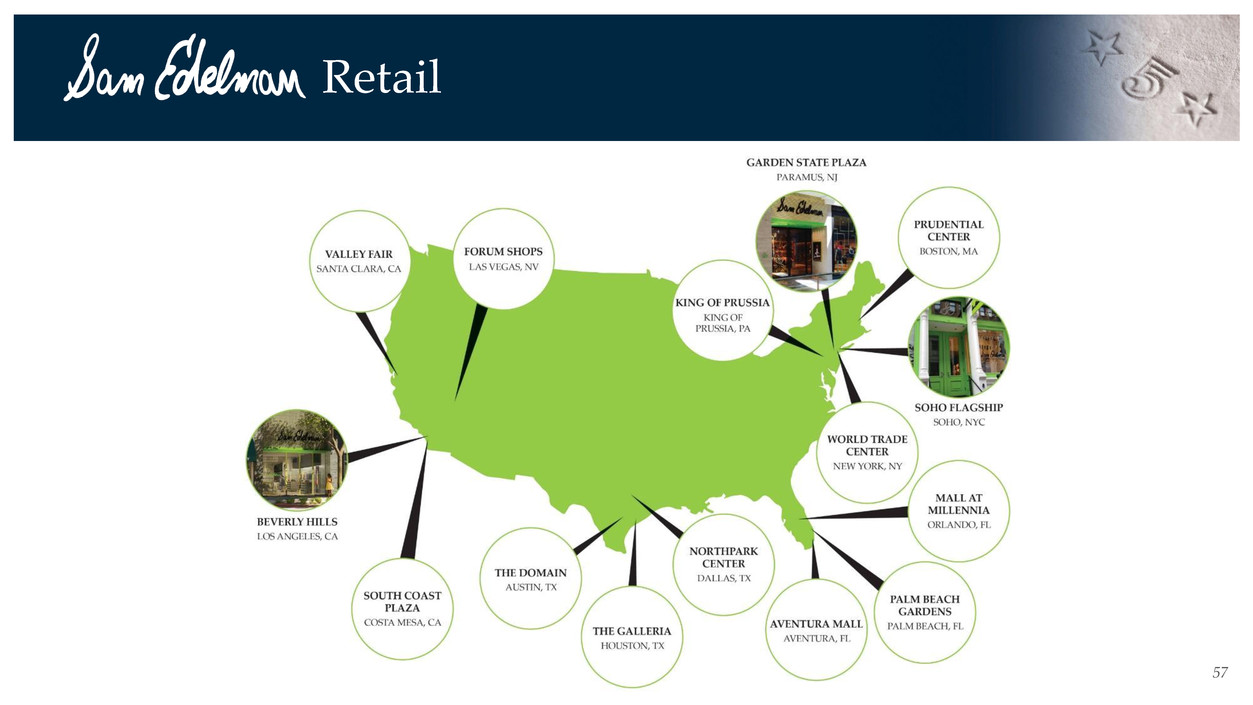
57 Retail
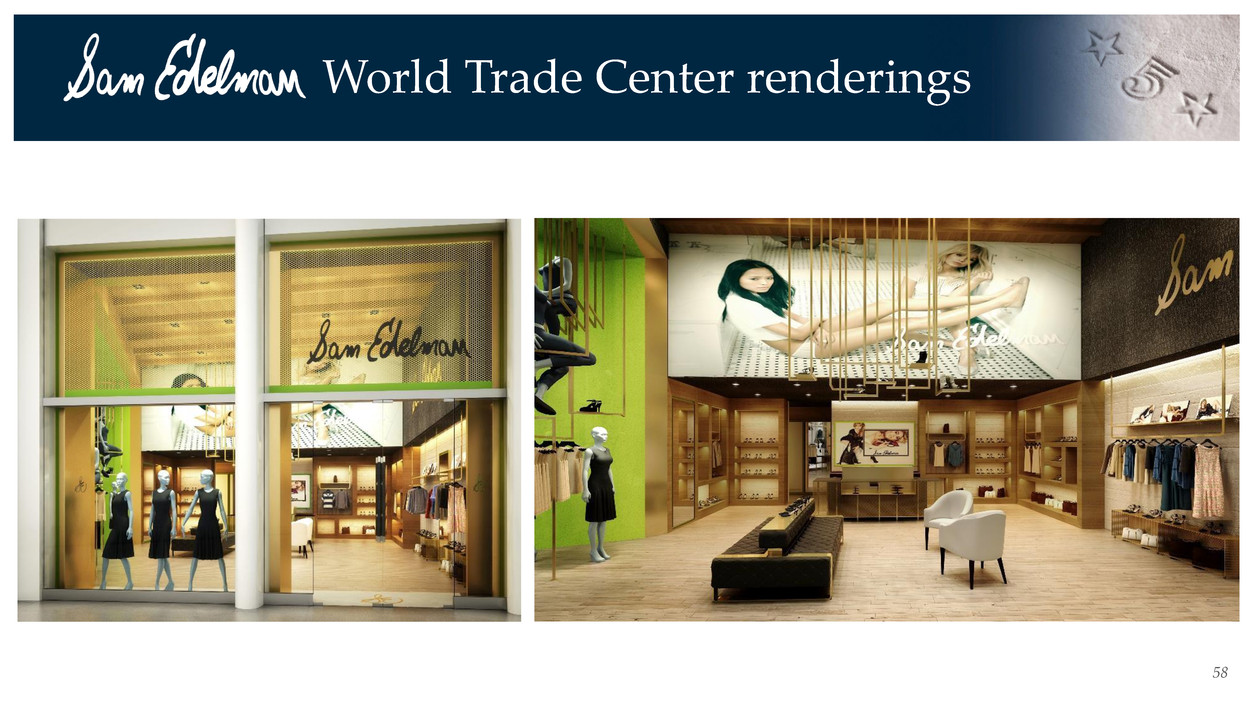
58 World Trade Center renderings
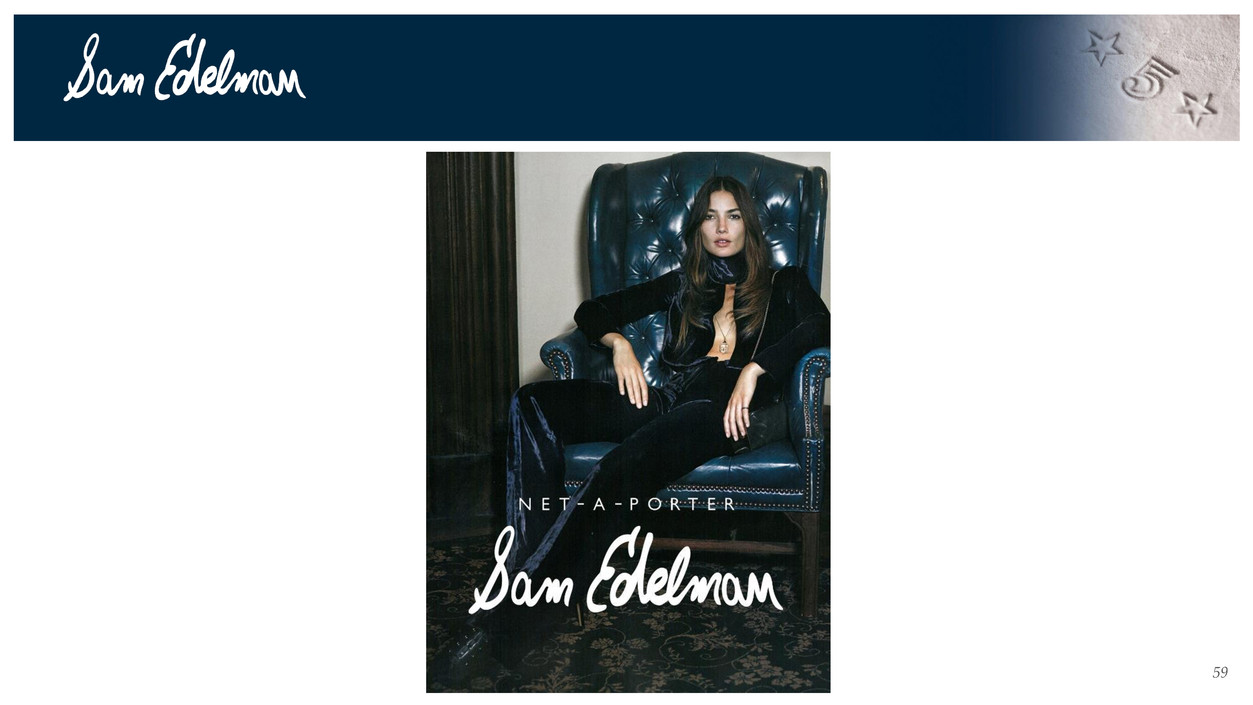
59

60

Investor Day October 29, 2015
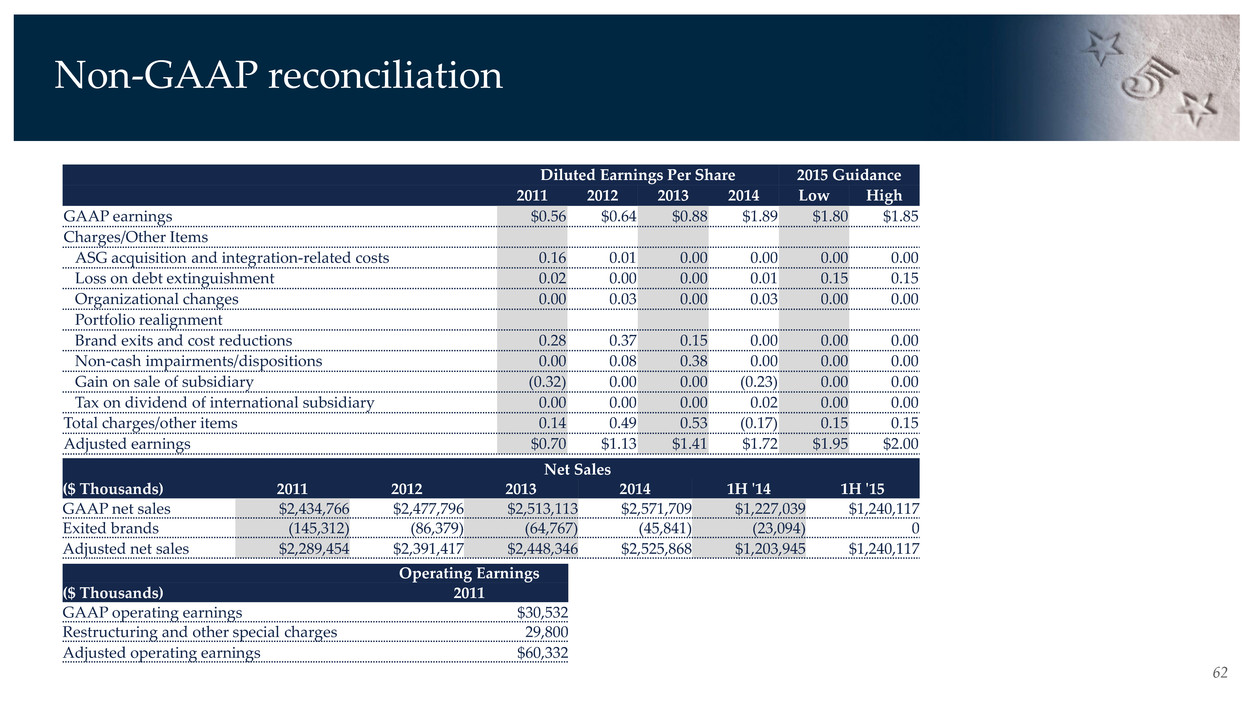
62 Non-GAAP reconciliation Diluted Earnings Per Share 2015 Guidance 2011 2012 2013 2014 Low High GAAP earnings $0.56 $0.64 $0.88 $1.89 $1.80 $1.85 Charges/Other Items ASG acquisition and integration-related costs 0.16 0.01 0.00 0.00 0.00 0.00 Loss on debt extinguishment 0.02 0.00 0.00 0.01 0.15 0.15 Organizational changes 0.00 0.03 0.00 0.03 0.00 0.00 Portfolio realignment Brand exits and cost reductions 0.28 0.37 0.15 0.00 0.00 0.00 Non-cash impairments/dispositions 0.00 0.08 0.38 0.00 0.00 0.00 Gain on sale of subsidiary (0.32) 0.00 0.00 (0.23) 0.00 0.00 Tax on dividend of international subsidiary 0.00 0.00 0.00 0.02 0.00 0.00 Total charges/other items 0.14 0.49 0.53 (0.17) 0.15 0.15 Adjusted earnings $0.70 $1.13 $1.41 $1.72 $1.95 $2.00 Net Sales ($ Thousands) 2011 2012 2013 2014 1H '14 1H '15 GAAP net sales $2,434,766 $2,477,796 $2,513,113 $2,571,709 $1,227,039 $1,240,117 Exited brands (145,312) (86,379) (64,767) (45,841) (23,094) 0 Adjusted net sales $2,289,454 $2,391,417 $2,448,346 $2,525,868 $1,203,945 $1,240,117 Operating Earnings ($ Thousands) 2011 GAAP operating earnings $30,532 Restructuring and other special charges 29,800 Adjusted operating earnings $60,332


