UNITED STATES
SECURITIES AND EXCHANGE COMMISSION
Washington, D.C. 20549
_________________________
FORM 20-F
(Mark One)
| ☐ | REGISTRATION STATEMENT PURSUANT TO SECTION 12(b) OR (g) OF THE SECURITIES
EXCHANGE ACT OF 1934 |
OR
| ☒ | ANNUAL REPORT PURSUANT TO SECTION 13 OR 15(d) OF THE SECURITIES EXCHANGE
ACT OF 1934
For the fiscal year ended December 31, 2017 |
OR
| ☐ | TRANSITION REPORT PURSUANT TO SECTION 13 OR 15(d) OF THE SECURITIES EXCHANGE
ACT OF 1934
For the transition period from to . |
OR
| ☐ | SHELL COMPANY REPORT PURSUANT TO SECTION 13 OR 15(d) OF THE SECURITIES
EXCHANGE ACT OF 1934
Date of event requiring this shell company report |
Commission file number: 001-34476
BANCO SANTANDER (Brasil) S.A.
(Exact name of Registrant as specified in its charter)
SANTANDER (BRAZIL) BANK
(Translation of Registrant’s name into English)
Federative Republic of Brazil
(Jurisdiction of incorporation)
Avenida Presidente Juscelino Kubitschek, 2,041 and 2,235 – Bloco A
Vila Olímpia
São Paulo, SP 04543-011
Federative Republic of Brazil
(Address of principal executive offices)
Mercedes Pacheco, Managing Director – Senior Legal Counsel
Banco Santander, S.A.
New York Branch
45 E. 53rd Street
New York, New York 10022
Tel: (212) 407-0953
(Name, Telephone, E-mail and/or Facsimile number and Address of Company Contact Person)
Securities registered or to be registered pursuant to Section 12(b) of the Act:
Title of each class | Name of each exchange on which registered |
| Units, each composed of 1 common share, no par value, and 1 preferred share, no par value | New York Stock Exchange* |
| Common Shares, no par value | New York Stock Exchange* |
| Preferred Shares, no par value | New York Stock Exchange* |
| American Depositary Shares, each representing one unit (or a right to receive one unit) which is composed of 1 common share, no par value, and 1 preferred share, no par value, of Banco Santander (Brasil) S.A. | New York Stock Exchange |
| * | Not for trading purposes, but only in connection with the listing of American Depositary Shares pursuant to the requirements of the Securities and Exchange Commission. |
Securities registered or to be registered pursuant to Section 12(g) of the Act:
None
(Title of Class)
Securities for which there is a reporting obligation pursuant to Section 15(d) of the Act:
Title of each class |
| 7.375% Tier 1 Subordinated Perpetual Notes | |
| 6.000% Tier 2 Subordinated Notes due 2024 | |
Indicate the number of outstanding shares of each of the issuer’s classes of capital or common stock as of the close of the period covered by the annual report.
Title of Class | Number of Shares Outstanding |
| Common shares | 3,818,695,031 |
| Preferred shares | 3,679,836,020 |
Indicate by check mark if the registrant is a well-known seasoned issuer, as defined in Rule 405 of the Securities Act.
If this report is an annual or transition report, indicate by check mark if the registrant is not required to file reports pursuant to Section 13 or 15(d) of the Securities Exchange Act of 1934.
Indicate by check mark whether the registrant (1) has filed all reports required to be filed by Section 13 or 15(d) of the Securities Exchange Act of 1934 during the preceding 12 months (or for such shorter period that the registrant was required to file such reports), and (2) has been subject to such filing requirements for the past 90 days.
Indicate by check mark whether the registrant has submitted electronically and posted on its corporate Web site, if any, every Interactive Data File required to be submitted and posted pursuant to Rule 405 of Regulation S-T during the preceding 12 months (or for such shorter period that the registrant was required to submit and post such files).
Indicate by check mark whether the registrant is a large accelerated filer, an accelerated filer, a non-accelerated filer, or an emerging growth company. See the definitions of “large accelerated filer,” “accelerated filers,” and “emerging growth company” in Rule 12b-2 of the Exchange Act. (Check one):
| Large Accelerated Filer ☒ | Accelerated Filer ☐ | Non-accelerated Filer ☐ | Emerging growth company☐ |
If an emerging growth company that prepares its financial statements in accordance with U.S. GAAP, indicate by check mark if the registrant has elected not to use the extended transition period for complying with any new or revised financial accounting standards† provided pursuant to Section 13(a) of the Exchange Act.☐
† The term “new or revised financial accounting standard” refers to any update issued by the Financial Accounting Standards Board to its Accounting Standards Codification after April 5, 2012.
Indicate by check mark which basis of accounting the registrant has used to prepare the financial statements included in this filing:
| ☒ | International Financial Reporting Standards as issued by the International Accounting Standards Board |
If “Other” has been checked in response to the previous question, indicate by check mark which financial statement item the registrant has elected to follow.
If this is an annual report, indicate by check mark whether the registrant is a shell company (as defined in Rule 12b-2 of the Exchange Act).
table of contents
Page
Presentation of Financial and Other Information
General
In this annual report, the terms “Santander Brasil,” the “Bank,” “we,” “us,” “our,” “our company” and “our organization” mean Banco Santander (Brasil) S.A. and its consolidated subsidiaries, unless otherwise indicated. References to “Banco Real” mean Banco ABN AMRO Real S.A. and ABN AMRO Brasil Dois Participações S.A. and their respective consolidated subsidiaries, unless otherwise indicated. References to “Banespa” mean Banco do Estado de São Paulo S.A. – Banespa, one of our predecessor entities. The term “Santander Spain” means Banco Santander, S.A. References to “Santander Group” mean the worldwide operations of the Santander Spain conglomerate, as indirectly controlled by Santander Spain and its consolidated subsidiaries, including Santander Brasil.
All references herein to the “real,” “reais” or “R$” are to the Brazilianreal, the official currency of Brazil. All references to “U.S. dollars,” “dollars” or “U.S.$” are to United States (or “U.S.”) dollars. All references to “euro,” “euros” or “€” are to the common legal currency of the member states participating in the European Economic and Monetary Union. References to “CI$” are to Cayman Islands dollars. References to “£” are to United Kingdom pounds sterling. See “Item 3. Key Information—A. Selected Financial Data—Exchange Rates” for information regarding exchange rates for the Brazilian currency.
Solely for the convenience of the reader, we have translated certain amounts included in “Item 3. Key Information—A. Selected Financial Data” and elsewhere in this annual report fromreais into U.S. dollars using the exchange rate as reported by the Brazilian Central Bank (Banco Central do Brasil), or the “Brazilian Central Bank,” as of December 31, 2017, which was R$3.3080 to U.S.$1.00, or on the indicated dates (subject, on any applicable date, to rounding adjustments). We make no representation that thereal or U.S. dollar amounts actually represent or could have been or could be converted into U.S. dollars at the rates indicated, at any particular exchange rate or at all.
Certain figures included in this annual report have been subject to rounding adjustments. Accordingly, figures shown as totals in certain tables may not be an arithmetic aggregation of the figures that precede them.
Consolidated Financial Statements
We maintain our books and records inreais, our functional currency and the presentation currency for our consolidated financial statements.
This annual report contains our consolidated financial statements as of December 31, 2017, 2016 and 2015, and for the years ended December 31, 2017, 2016 and 2015. Such consolidated financial statements have been prepared in accordance with International Financial Reporting Standards (“IFRS”), as issued by the International Accounting Standards Board (“IASB”) and interpretations issued by the IFRS Interpretation Committee (“IFRIC”). Our consolidated financial statements as of December 31, 2017 and 2016 and for the year ended December 31, 2017 and 2016 have been audited by PricewaterhouseCoopers Auditores Independentes, or “PwC.” Our consolidated financial statements as of December 31, 2015 and for the year ended December 31, 2015 have been audited by Deloitte Touche Tohmatsu Auditores Independentes, or “Deloitte.” PwC and Deloitte are independent registered public accounting firms, whose reports are included herein.
IFRS differs in certain significant aspects in comparison with the generally accepted accounting principles in the United States (“U.S. GAAP”). IFRS also differs in certain significant aspects in comparison with the Brazilian GAAP (as defined below). Appendix I to our audited consolidated financial statements for the years ended December 31, 2017, 2016 and 2015, included herein, contains information relating to certain differences between IFRS and Brazilian GAAP.
Under Brazilian law, we are required by the Brazilian Central Bank to prepare consolidated financial statements according to IFRS. However, we will also continue to prepare statutory financial statements in accordance with accounting practices established by the Law 6,404, dated December 15, 1976, as amended by Law 11,638 (“Brazilian Corporate Law”) and standards established by the National Monetary Council (Conselho Monetário Nacional), or “CMN,” the Brazilian Central Bank and document template provided in the Accounting Chart for
National Financial System Institutions (Plano Contábil das Instituições do Sistema Financeiro Nacional), and the Brazilian Securities and Exchange Commission (Comissão de Valores Mobiliários), or “CVM,” to the extent such practices do not conflict with the rules of the Brazilian Central Bank, the Accounting Pronouncements Committee (Comitê de Pronunciamentos Contábeis), to the extent approved by the Brazilian Central Bank, the National Council of Private Insurance (Conselho Nacional de Seguros Privados), and the Superintendence of Private Insurance (Superintendência de Seguros Privados), or “SUSEP.” We refer to such Brazilian accounting practices as “Brazilian GAAP.” See “Item 4. Information on the Company—B. Business Overview—Regulation and Supervision—Other Applicable Laws and Regulations—Auditing Requirements.”
Market Share and Other Information
We obtained the market and competitive position data, including market forecasts, used throughout this annual report from internal surveys, market research, publicly available information and industry publications. This data is updated to the latest available information, as of the date of this annual report. We have made these statements on the basis of information from third-party sources that we believe are reliable, such as the Brazilian association of savings and mortgage financing entities (Associação Brasileira das Entidades de Crédito Imobiliário e Poupança) or “ABECIP”; the Brazilian association of credit card companies (Associação Brasileira de Empresas de Cartões de Crédito e Serviços) or “ABECS”; the Brazilian association of leasing companies (Associação Brasileira de Empresas de Leasing); the national association of financial and capital markets entities (Associação Brasileira das Entidades dos Mercados Financeiro e de Capitais) or “ANBIMA”; the Brazilian Central Bank; the Brazilian social and economic development bank (Banco Nacional de Desenvolvimento Econômico e Social) or “BNDES”; the Brazilian Institute of Geography and Statistics (Instituto Brasileiro de Geografia e Estatística) or the “IBGE”; the Brazilian bank federation (Federação Brasileira de Bancos), or “FEBRABAN”; the national federation of private retirement and life insurance (Federação Nacional de Previdência Privada e Vida); the Getúlio Vargas Foundation (Fundação Getúlio Vargas) or “FGV”; the Brazilian Central Bank system (Sistema do Banco Central); the SUSEP; and the CVM, among others.
Forward-Looking Statements
This annual report contains estimates and forward-looking statements subject to risks and uncertainties, principally in “Item 3. Key Information—D. Risk Factors,” “Item 5. Operating and Financial Review and Prospects” and “Item 4. Information on the Company—B. Business Overview.” Some of the matters discussed concerning our business operations and financial performance include estimates and forward-looking statements within the meaning of the U.S. Private Securities Litigation Reform Act of 1995.
Our estimates and forward-looking statements are based mainly on our current expectations and estimates or projections of future events and trends, which affect or may affect our businesses and results of operations. Although we believe that these estimates and forward-looking statements are based upon reasonable assumptions, they are subject to certain risks and uncertainties and are made in light of information currently available to us. Our estimates and forward-looking statements may be influenced by the following factors, among others:
| · | general economic, political, social and business conditions in Brazil, including the impact of the current international economic environment and the macroeconomic conditions in Brazil; |
| · | exposure to various types of inflation and interest rate risks, and Brazilian government efforts to control inflation and interest rates; |
| · | exposure to the sovereign debt of Brazil; |
| · | the effect of interest rate fluctuations on our obligations under employee pension funds; |
| · | exchange rate volatility; |
| · | infrastructure and labor force deficiencies in Brazil; |
| · | economic developments and perception of risk in other countries; |
| · | increasing competition and consolidation in the Brazilian financial services industry; |
| · | extensive regulation by the Brazilian government and the Brazilian Central Bank, among others; |
| · | changes in reserve requirements; |
| · | changes in taxes or other fiscal assessments; |
| · | potential losses associated with non-performing loans or non-performance by counterparties to other types of financial instruments; |
| · | a decrease in the rate of growth of our loan portfolio; |
| · | potential prepayment of our loan and investment portfolio; |
| · | potential increase in our cost of funding, in particular with relation to short-term deposits; |
| · | a default on, or a ratings downgrade of, the sovereign debt of Brazil or of our controlling shareholder; |
| · | restrictions on the distributions of dividends to holders of our shares and ADSs; |
| · | the effectiveness of our credit risk management policies; |
| · | our ability to adequately manage market and operational risks; |
| · | potential deterioration in the value of the collateral securing our loan portfolio; |
| · | failure to adequately protect ourselves against risks relating to cybersecurity; |
| · | our dependence on the proper functioning of information technology systems; |
| · | our ability to protect personal data; |
| · | our ability to protect our reputation; |
| · | our ability to detect and prevent money laundering and other illegal activities; |
| · | our ability to manage the growth of our operations; |
| · | our ability to successfully and effectively integrate acquisitions or to evaluate risks arising from asset acquisitions; and |
| · | other risk factors as set forth under “Item 3. Key Information—D. Risk Factors” in this annual report. |
The words “believe,” “may,” “will,” “aim,” “estimate,” “continue,” “anticipate,” “intend,” “expect,” “forecast,” and similar words are intended to identify estimates and forward-looking statements. Estimates and forward-looking statements are intended to be accurate only as of the date they were made, and we undertake no obligation to update or to review any estimate and/or forward-looking statement because of new information, future events or other factors. Estimates and forward-looking statements involve risks and uncertainties and are not guarantees of future performance. Our future results may differ materially from those expressed in these estimates and forward-looking statements. You should therefore not make any investment decision based on these estimates and forward-looking statements.
The forward-looking statements contained in this report speak only as of the date of this report. We do not undertake to update any forward-looking statement to reflect events or circumstances after that date or to reflect the occurrence of unanticipated events.
PART I
ITEM 1. IDENTITY OF DIRECTORS, SENIOR MANAGEMENT AND ADVISERS
1A. Directors and Senior Management
Not applicable.
1B. Advisers
Not applicable.
1C. Auditors
Not applicable.
ITEM 2. OFFER STATISTICS AND EXPECTED TIMETABLE
2A. Offer Statistics
Not applicable.
2B. Method and Expected Timetable
Not applicable.
ITEM 3. KEY INFORMATION
3A. Selected Financial Data
Financial information for Santander Brasil at and for the years ended December 31, 2017, 2016, 2015, 2014 and 2013 has been derived from our audited consolidated financial statements prepared in accordance with IFRS as issued by the IASB. See “Item 18. Financial Statements.” This financial information should be read in conjunction with our audited consolidated financial statements and the related notes and “Item 5. Operating and Financial Review and Prospects” included elsewhere in this annual report.
Income Statement Data
| | | For the year ended December 31, |
| | | 2017 | | 2017 | | 2016 | | 2015 | | 2014 | | 2013 |
| | | (in millions of U.S.$)(1) | | (in millions of R$) |
| Interest and similar income | | | 21,589 | | | | 71,418 | | | | 77,146 | | | | 69,870 | | | | 58,924 | | | | 51,217 | |
| Interest expense and similar charges | | | (11,025 | ) | | | (36,472 | ) | | | (46,560 | ) | | | (38,533 | ) | | | (31,695 | ) | | | (22,738 | ) |
| Net interest income | | | 10,564 | | | | 34,946 | | | | 30,586 | | | | 31,337 | | | | 27,229 | | | | 28,479 | |
| Income from equity instruments | | | 25 | | | | 83 | | | | 259 | | | | 143 | | | | 222 | | | | 81 | |
| Income from companies accounted for by the equity method | | | 22 | | | | 72 | | | | 48 | | | | 116 | | | | 91 | | | | 91 | |
| Fee and commission income | | | 4,781 | | | | 15,816 | | | | 13,548 | | | | 11,797 | | | | 11,368 | | | | 10,742 | |
| Fee and commission expense | | | (935 | ) | | | (3,094 | ) | | | (2,571 | ) | | | (2,314 | ) | | | (2,602 | ) | | | (2,641 | ) |
| Gains (losses) on financial assets and liabilities (net) | | | 293 | | | | 969 | | | | 3,016 | | | | (20,002 | ) | | | 2,748 | | | | (1,146 | ) |
| Exchange differences (net) | | | 183 | | | | 605 | | | | 4,575 | | | | 10,084 | | | | (3,636 | ) | | | 551 | |
| Other operating income (expenses) | | | (203 | ) | | | (672 | ) | | | (625 | ) | | | (347 | ) | | | (470 | ) | | | (445 | ) |
| Total income | | | 14,729 | | | | 48,725 | | | | 48,837 | | | | 30,814 | | | | 34,950 | | | | 35,712 | |
| Administrative expenses | | | (4,873 | ) | | | (16,121 | ) | | | (14,920 | ) | | | (14,515 | ) | | | (13,942 | ) | | | (13,850 | ) |
| Depreciation and amortization | | | (502 | ) | | | (1,662 | ) | | | (1,483 | ) | | | (1,490 | ) | | | (1,362 | ) | | | (1,252 | ) |
| Provisions (net)(2) | | | (1,000 | ) | | | (3,309 | ) | | | (2,725 | ) | | | (4,001 | ) | | | (2,036 | ) | | | (2,692 | ) |
| Impairment losses on financial assets (net)(3) | | | (3,730 | ) | | | (12,338 | ) | | | (13,301 | ) | | | (13,634 | ) | | | (11,272 | ) | | | (14,118 | ) |
| Impairment losses on other assets (net) | | | (138 | ) | | | (457 | ) | | | (114 | ) | | | (1,221 | ) | | | 4 | | | | (345 | ) |
| Gains (losses) on disposal of assets not classified as non-current assets held for sale | | | (19 | ) | | | (64 | ) | | | 4 | | | | 781 | | | | 87 | | | | 460 | |
| Gains (losses) on non-current assets held for sale not classified as discontinued operations | | | (79 | ) | | | (260 | ) | | | 87 | | | | 50 | | | | 15 | | | | 103 | |
| Operating profit before tax | | | 4,388 | | | | 14,514 | | | | 16,384 | | | | (3,216 | ) | | | 6,443 | | | | 4,018 | |
| Income taxes | | | (1,625 | ) | | | (5,376 | ) | | | (8,919 | ) | | | 13,050 | | | | (736 | ) | | | (233 | ) |
| Net Profit from Continuing Operations | | | 2,762 | | | | 9,138 | | | | 7,465 | | | | 9,834 | | | | 5,708 | | | | 3,785 | |
| Discontinued Operations(4) | | | — | | | | — | | | | — | | | | — | | | | — | | | | 2,063 | |
| Consolidated Profit for the Year | | | 2,762 | | | | 9,138 | | | | 7,465 | | | | 9,834 | | | | 5,708 | | | | 5,848 | |
| (1) | Translated for convenience only using the selling rate as reported by the Brazilian Central Bank as of December 31, 2017, forreais into U.S. dollars of R$3.3080 to U.S.$1.00. |
| (2) | Mainly provisions for tax risks and legal obligations, and judicial and administrative proceedings of labor and civil lawsuits. For further discussion, see notes 23 and 24 to our consolidated financial statements. |
| (3) | Net provisions to the credit loss allowance less recovery of loans previously written off. |
| (4) | On December 17, 2013, we concluded the sale of our asset management business, by way of disposal of all of the shares of Santander Brasil Asset Management Distribuidora de Títulos e Valores Mobiliários S.A. The gains/losses from our disposal of Santander Brasil Asset Management Distribuidora de Títulos e Valores Mobiliários S.A. are recorded in “Discontinued Operations” pursuant to IFRS 5 – Discontinued Operations. |
Earnings and Dividend per Share Information
| | | For the year ended December 31, |
| | | 2017 | | 2016 | | 2015 | | 2014 | | 2013 |
| Basic and Diluted Earnings per 1,000 shares | | | | | | | | | | | | | | | | | | | | |
| From continuing and discontinued operations(1) | | | | | | | | | | | | | | | | | | | | |
| Basic Earnings per shares (reais) | | | | | | | | | | | | | | | | | | | | |
| Common Shares | | | 1,133.43 | | | | 929.93 | | | | 1,236.96 | | | | 709.69 | | | | 719.89 | |
| Preferred Shares | | | 1,246.77 | | | | 1,022.92 | | | | 1,360.66 | | | | 780.66 | | | | 791.87 | |
| Diluted Earnings per shares (reais) | | | | | | | | | | | | | | | | | | | | |
| Common Shares | | | 1,132.44 | | | | 929.03 | | | | 1,235.79 | | | | 709.40 | | | | 719.60 | |
| Preferred Shares | | | 1,245.69 | | | | 1,021.93 | | | | 1,359.36 | | | | 780.34 | | | | 791.56 | |
| Basic Earnings per shares (U.S. dollars) (2) | | | | | | | | | | | | | | | | | | | | |
| Common Shares | | | 342.63 | | | | 285.34 | | | | | | | | | | | | | |
| Preferred Shares | | | 376.90 | | | | 313.87 | | | | | | | | | | | | | |
| Diluted Earnings per shares (U.S. dollars) (2) | | | | | | | | | | | | | | | | | | | | |
| Common Shares | | | 342.33 | | | | 285.06 | | | | | | | | | | | | | |
| Preferred Shares | | | 376.57 | | | | 313.57 | | | | | | | | | | | | | |
| From continuing operations | | | | | | | | | | | | | | | | | | | | |
| Basic Earnings per shares (reais) | | | | | | | | | | | | | | | | | | | | |
| Common Shares | | | 1,133.43 | | | | 929.93 | | | | 1,236.96 | | | | 709.69 | | | | 460.35 | |
| Preferred Shares | | | 1,246.77 | | | | 1,022.92 | | | | 1,360.66 | | | | 780.66 | | | | 506.38 | |
| Diluted Earnings per shares (reais) | | | | | | | | | | | | | | | | | | | | |
| Common Shares | | | 1,132.44 | | | | 929.03 | | | | 1,235.79 | | | | 709.40 | | | | 460.16 | |
| Preferred Shares | | | 1,245.69 | | | | 1,021.93 | | | | 1,359.36 | | | | 780.34 | | | | 506.18 | |
| Basic Earnings per shares (U.S. dollars) (2) | | | | | | | | | | | | | | | | | | | | |
| Common Shares | | | 342.63 | | | | 285.34 | | | | | | | | | | | | | |
| Preferred Shares | | | 376.90 | | | | 313.87 | | | | | | | | | | | | | |
| Diluted Earnings per shares (U.S. dollars) (2) | | | | | | | | | | | | | | | | | | | | |
| Common Shares | | | 342.33 | | | | 285.06 | | | | | | | | | | | | | |
| Preferred Shares | | | 376.57 | | | | 313.57 | | | | | | | | | | | | | |
| From discontinued operations | | | | | | | | | | | | | | | | | | | | |
| Basic Earnings per shares (reais) | | | | | | | | | | | | | | | | | | | | |
| Common Shares | | | — | | | | — | | | | — | | | | — | | | | 259.54 | |
| Preferred Shares | | | — | | | | — | | | | — | | | | — | | | | 285.49 | |
| Diluted Earnings per shares (reais) | | | | | | | | | | | | | | | | | | | | |
| Common Shares | | | — | | | | — | | | | — | | | | — | | | | 259.43 | |
| Preferred Shares | | | — | | | | — | | | | — | | | | — | | | | 285.38 | |
| Basic Earnings per shares (U.S. dollars) (2) | | | | | | | | | | | | | | | | | | | | |
| Common Shares | | | — | | | | — | | | | — | | | | — | | | | | |
| Preferred Shares | | | — | | | | — | | | | — | | | | — | | | | | |
| Diluted Earnings per shares (U.S. dollars) (2) | | | | | | | | | | | | | | | | | | | | |
| Common Shares | | | — | | | | — | | | | — | | | | — | | | | | |
| Preferred Shares | | | — | | | | — | | | | — | | | | — | | | | | |
| Dividends and interest on capital per 1,000 shares (undiluted) | | | | | | | | | | | | | | | | | | | | |
| Common Shares (reais) | | | 801.63 | | | | 666.21 | | | | 784.90 | | | | 193.26 | | | | 305.15 | |
| Preferred Shares (reais) | | | 881.80 | | | | 732.83 | | | | 863.39 | | | | 212.59 | | | | 332.36 | |
| Common Shares (U.S. dollars)(2) | | | 242.33 | | | | 204.42 | | | | 201.01 | | | | 72.76 | | | | 128.98 | |
| Preferred Shares (U.S. dollars)(2) | | | 266.57 | | | | 224.86 | | | | 221.11 | | | | 80.03 | | | | 141.88 | |
| Weighted average share outstanding (in thousands) – basic | | | | | | | | | | | | | | | | | | | | |
| Common Shares | | | 3,822,057 | | | | 3,828,555 | | | | 3,839,159 | | | | 3,851,278 | | | | 3,858,717 | |
| Preferred Shares | | | 3,683,145 | | | | 3,689,696 | | | | 3,700,299 | | | | 3,710,746 | | | | 3,719,858 | |
| Weighted average shares outstanding (in thousands) – diluted(3) | | | | | | | | | | | | | | | | | | | | |
| Common Shares | | | 3,825,313 | | | | 3,832,211 | | | | 3,842,744 | | | | 3,852,823 | | | | 3,860,239 | |
| Preferred Shares | | | 3,686,401 | | | | 3,693,352 | | | | 3,703,884 | | | | 3,712,291 | | | | 3,721,380 | |
| (1) | Per share amounts reflect the effects of the bonus share issue and reverse share split for each period presented. |
| (2) | Translated for convenience only using the selling rate as reported by the Brazilian Central Bank as of December 31, 2017, forreais into U.S. dollars of R$3.3080 to U.S.$1.00. |
| (3) | Average annual balance sheet data has been calculated based upon the average of the monthly balances at 13 dates: as of December 31 of the prior year and each of the month-end balances of the 12 subsequent months. |
Balance Sheet Data
| | | As of December 31, |
| | | 2017 | | 2017 | | 2016 | | 2015 | | 2014 | | 2013 |
| | | (in millions of U.S.$)(1) | | (in millions of R$) |
| Assets | | | | | | | | | | | | |
| Cash and balances with the Brazilian Central Bank | | | 30,492 | | | | 100,866 | | | | 110,605 | | | | 89,143 | | | | 55,904 | | | | 51,714 | |
| Financial assets held for trading | | | 15,852 | | | | 52,440 | | | | 84,874 | | | | 50,537 | | | | 56,014 | | | | 30,219 | |
| Other financial assets at fair value through profit or loss | | | 511 | | | | 1,692 | | | | 1,711 | | | | 2,080 | | | | 997 | | | | 1,298 | |
| Available-for-sale financial assets | | | 25,944 | | | | 85,823 | | | | 57,815 | | | | 68,265 | | | | 75,164 | | | | 46,287 | |
| Held to maturity investments | | | 3,088 | | | | 10,214 | | | | 10,048 | | | | 10,098 | | | | — | | | | — | |
| Loans and receivables | | | 97,442 | | | | 322,337 | | | | 296,049 | | | | 306,269 | | | | 264,608 | | | | 258,778 | |
| Hedging derivatives | | | 58 | | | | 193 | | | | 223 | | | | 1,312 | | | | 213 | | | | 323 | |
| Non-current assets held for sale | | | 349 | | | | 1,155 | | | | 1,338 | | | | 1,237 | | | | 930 | | | | 275 | |
| Investments in associates and joint ventures | | | 262 | | | | 867 | | | | 990 | | | | 1,061 | | | | 1,023 | | | | 1,064 | |
| Tax assets | | | 8,714 | | | | 28,826 | | | | 28,753 | | | | 34,770 | | | | 23,020 | | | | 22,060 | |
| Other assets | | | 1,384 | | | | 4,578 | | | | 5,104 | | | | 3,802 | | | | 5,067 | | | | 5,085 | |
| Tangible assets | | | 1,968 | | | | 6,510 | | | | 6,646 | | | | 7,006 | | | | 7,071 | | | | 6,886 | |
| Intangible assets | | | 9,130 | | | | 30,202 | | | | 30,237 | | | | 29,814 | | | | 30,221 | | | | 29,064 | |
| Total assets | | | 195,194 | | | | 645,703 | | | | 634,393 | | | | 605,395 | | | | 520,231 | | | | 453,053 | |
| Average total assets* | | | 192,718 | | | | 637,511 | | | | 605,646 | | | | 571,918 | | | | 478,560 | | | | 435,286 | |
| Liabilities | | | | | | | | | | | | | | | | | | | | | | | | |
| Financial liabilities held for trading | | | 14,910 | | | | 49,323 | | | | 51,620 | | | | 42,388 | | | | 19,570 | | | | 13,554 | |
| Financial liabilities at amortized cost | | | 144,764 | | | | 478,881 | | | | 471,579 | | | | 457,282 | | | | 392,186 | | | | 329,701 | |
| Deposits from the Brazilian Central Bank and deposits from credit institutions | | | 23,995 | | | | 79,375 | | | | 78,634 | | | | 69,451 | | | | 63,674 | | | | 34,032 | |
| Customer deposits | | | 83,447 | | | | 276,042 | | | | 247,445 | | | | 243,043 | | | | 220,644 | | | | 200,156 | |
| Marketable debt securities | | | 21,235 | | | | 70,247 | | | | 99,843 | | | | 94,658 | | | | 70,355 | | | | 65,301 | |
| Subordinated debts | | | 157 | | | | 519 | | | | 466 | | | | 8,097 | | | | 7,294 | | | | 8,906 | |
| Debt Instruments Eligible to Compose Capital | | | 2,550 | | | | 8,437 | | | | 8,312 | | | | 9,959 | | | | 6,773 | | | | — | |
| Other financial liabilities | | | 13,380 | | | | 44,261 | | | | 36,879 | | | | 32,073 | | | | 23,446 | | | | 21,306 | |
| Hedging derivatives | | | 49 | | | | 163 | | | | 311 | | | | 2,377 | | | | 894 | | | | 629 | |
| Provisions(2) | | | 4,228 | | | | 13,987 | | | | 11,776 | | | | 11,410 | | | | 11,127 | | | | 10,892 | |
| Tax liabilities | | | 2,493 | | | | 8,248 | | | | 6,095 | | | | 5,253 | | | | 12,423 | | | | 11,693 | |
| Other liabilities | | | 2,423 | | | | 8,014 | | | | 8,199 | | | | 6,850 | | | | 5,346 | | | | 4,928 | |
| Total liabilities | | | 168,868 | | | | 558,615 | | | | 549,581 | | | | 525,559 | | | | 441,548 | | | | 371,397 | |
| Stockholders’ equity | | | 26,428 | | | | 87,425 | | | | 85,435 | | | | 83,532 | | | | 80,105 | | | | 83,340 | |
| Other Comprehensive Income | | | (234 | ) | | | (774 | ) | | | (1,348 | ) | | | (4,132 | ) | | | (1,802 | ) | | | (1,973 | ) |
| Non-controlling interests | | | 132 | | | | 437 | | | | 726 | | | | 435 | | | | 380 | | | | 289 | |
| Total Stockholders’ Equity | | | 26,326 | | | | 87,088 | | | | 84,812 | | | | 79,835 | | | | 78,683 | | | | 81,655 | |
| Total liabilities and stockholders’ equity | | | 195,194 | | | | 645,703 | | | | 634,393 | | | | 605,395 | | | | 520,231 | | | | 453,053 | |
| Average interest-bearing liabilities* | | | 126,002 | | | | 416,816 | | | | 408,067 | | | | 400,008 | | | | 318,639 | | | | 287,382 | |
| Average total stockholders’ equity* | | | 26,562 | | | | 87,868 | | | | 84,283 | | | | 81,475 | | | | 78,818 | | | | 80,916 | |
| * | The average annual balance sheet data has been calculated based upon the average of the monthly balances at 13 dates: at December 31 of the prior year and for each of the month-end balances of the 12 subsequent months. |
| (1) | Translated for convenience only using the selling rate as reported by the Brazilian Central Bank as of December 31, 2017, forreais into U.S. dollars of R$3.3080 to U.S.$1.00. |
| (2) | Mainly provisions for tax risks and legal obligations, and judicial and administrative proceedings of labor and civil lawsuits. |
Selected Consolidated Ratios (*)
| | | At and for the Year Ended December 31, |
| | | 2017 | | 2016 | | 2015 | | 2014 | | 2013 |
| | | in (%) |
| Profitability and performance | | | | | | | | | | | | | | | | | | | | |
| Return on average total assets | | | 1.4 | | | | 1.2 | | | | 1.7 | | | | 1.2 | | | | 1.3 | |
| Asset quality | | | | | | | | | | | | | | | | | | | | |
| Impaired assets as a percentage of loans and advances to customers (gross)(1) | | | 6.7 | | | | 7.0 | | | | 7.0 | | | | 5.6 | | | | 6.2 | |
| Impaired assets as a percentage of total assets(1) | | | 3.0 | | | | 3.0 | | | | 3.1 | | | | 2.7 | | | | 3.1 | |
| Impairment losses to customers as a percentage of impaired assets(1) (4) | | | 80.5 | | | | 87.0 | | | | 81.9 | | | | 95.8 | | | | 96.1 | |
| Impairment losses to customers as a percentage of loans and advances to customers (gross) (5) | | | 5.4 | | | | 6.1 | | | | 5.7 | | | | 5.4 | | | | 6.0 | |
| Derecognized assets as a percentage of loans and advances to customers (gross) | | | 4.7 | | | | 4.3 | | | | 4.4 | | | | 4.9 | | | | 6.5 | |
| Impaired assets as a percentage of stockholders’ equity(1) | | | 22.0 | | | | 22.3 | | | | 23.3 | | | | 17.8 | | | | 17.2 | |
| Capital adequacy | | | | | | | | | | | | | | | | | | | | |
| Basel capital adequacy ratio(2) | | | 15.8 | | | | 16.3 | | | | 15.7 | | | | 17.5 | | | | 19.2 | |
| Efficiency | | | | | | | | | | | | | | | | | | | | |
| Efficiency ratio(3) | | | 33.1 | | | | 30.6 | | | | 47.1 | | | | 39.9 | | | | 38.8 | |
| * | The average annual balance sheet data has been calculated based upon the average of the monthly balances at 13 dates: at December 31 of the prior year and for each of the month-end balances of the 12 subsequent months. |
| (1) | Impaired assets include all loans and advances past due by more than 90 days and other doubtful credits. For further information, see “Item 4. Information on the Company—B. Business Overview—Selected Statistical Information—Assets—Impaired Assets.” |
| (2) | Basel capital adequacy ratio as measured pursuant to Brazilian Central Bank rules in effect as from December 31, 2014. This ratio is subject to a phased-in implementation schedule established by the Brazilian Central Bank, which is expected to be completed by 2019. The Basel III framework applies to all commercial banks operating in Brazil and covers, among other things, minimum capital requirements, capital buffers, risk-based capital measures, liquidity standards, net stable funding ratio, leverage ratio, exposures to central counterparties, as well as the definition of consolidated enterprise level (conglomerado prudencial). Since the enactment of the initial Basel III framework in 2013, the authorities have been implementing additional regulations and some important amendments to the existing framework. For more information, see “Item 4. Information on the Company—B. Business Overview—Regulation and Supervision—Capital Adequacy and Leverage – Basel.” |
| (3) | Efficiency ratio is determined by taking administrative expenses divided by total income. |
| (4) | In 2017, including the debt instruments accounted for in the loans and receivables, the ratio is 95.0%. For 2016 the ratio was 95.2%. The debt instruments amount was not material in prior years. |
| (5) | In 2017, including the debt instruments accounted for in the loans and receivables the ratio is 5.3%. For 2016 the ratio was 6.3%. The debt instruments amount was not material in prior years. |
Selected Consolidated Ratios, Including Non-GAAP Ratios (*)
| | | At and for the Year Ended December 31, |
| | | 2017 | | 2016 | | 2015 | | 2014 | | 2013 |
| | | in (%) |
| Profitability and performance | | | | | | | | | | | | | | | | | | | | |
| Net yield(1) | | | 6.4 | | | | 6.2 | | | | 6.6 | | | | 6.9 | | | | 8.1 | |
| Return on average stockholders’ equity(2) | | | 10.4 | | | | 8.9 | | | | 12.1 | | | | 7.3 | | | | 7.3 | |
| Adjusted return on average stockholders’ equity(2) | | | 15.4 | | | | 13.3 | | | | 18.5 | | | | 11.3 | | | | 10.9 | |
| Average stockholders’ equity as a percentage of average total assets(2)(*) | | | 13.8 | | | | 13.9 | | | | 14.2 | | | | 16.4 | | | | 18.5 | |
| Average stockholders’ equity excluding goodwill as a percentage of average total assets excluding goodwill(2)(*) | | | 9.8 | | | | 9.7 | | | | 9.8 | | | | 11.3 | | | | 13.1 | |
| Asset quality | | | | | | | | | | | | | | | | | | | | |
| Impaired assets as a percentage of credit risk exposure (3) | | | 5.8 | | | | 6.3 | | | | 6.0 | | | | 4.8 | | | | 5.4 | |
| Impaired assets as a percentage of stockholders’ equity excluding goodwill(2)(3) | | | 32.6 | | | | 33.5 | | | | 36.1 | | | | 27.5 | | | | 25.9 | |
| Liquidity | | | | | | | | | | | | | | | | | | | | |
| Loans and advances to customers, net as a percentage of total funding(4) | | | 62.7 | | | | 58.0 | | | | 59.3 | | | | 63.9 | | | | 69.0 | |
| Efficiency | | | | | | | | | | | | | | | | | | | | |
| Adjusted efficiency ratio(5) | | | 32.5 | | | | 34.9 | | | | 34.8 | | | | 38.1 | | | | 36.4 | |
| (*) | The average annual balance sheet data has been calculated based upon the average of the monthly balances at 13 dates: at December 31 of the prior year and for each of the month-end balances of the 12 subsequent months. |
| (1) | “Net yield” is defined as net interest income (including dividends on equity securities) divided by average interest earning assets. |
| (2) | “Adjusted return on average stockholders’ equity,” “Average stockholders’ equity excluding goodwill as a percentage of average total assets excluding goodwill” and “Impaired assets as a percentage of stockholders’ equity excluding goodwill” are non-GAAP financial measures which adjust “Return on average stockholders’ equity,” “Average stockholders’ equity as a percentage of average total assets” and “Impaired assets as a percentage of stockholders’ equity,” to exclude the goodwill arising from the acquisition of Banco Real in 2008, Getnet Adquirência e Serviços para Meios de Pagamento S.A. (“GetNet”) and Super Pagamentos e Administração de Meios Eletrônicos Ltda. (“Super”), both in 2014, Banco Olé Bonsucesso Consignado S.A. (current name of Banco Bonsucesso Consignado S.A.) in 2015, and BW Guirapá I S.A. in 2016. Our calculation of these non-GAAP financial measures may differ from the calculation of similarly titled measures used by other companies. We believe that these non-GAAP financial measures supplement the GAAP information provided to investors regarding the substantial impact of the R$27 billion goodwill arising from the acquisition of Banco Real during the year ended December 31, 2008, the R$1.1 billion goodwill arising from the acquisition of GetNet and Super both during 2014, the acquisition of an interest in Banco Bonsucesso Consignado S.A. (currently known as Banco Olé Bonsucesso Consignado S.A.) in 2015. Accordingly, we believe that the non-GAAP financial measures presented are useful to investors. The limitation associated with the exclusion of goodwill from stockholders’ equity is that it has the effect of excluding a portion of the total investment in our assets. We compensate for this limitation by also considering stockholders’ equity including goodwill. |
| (3) | Credit risk exposure is the sum of the amortized cost amounts of loans and advances to customers (including impaired assets), guarantees and documentary credits. We include off-balance sheet information in this measure to better demonstrate our total managed credit risk. The reconciliation of the measure to the most comparable IFRS measure is disclosed in the table of non-GAAP financial measures presented immediately after these notes. |
| (4) | Total funding is the sum of financial liabilities at amortized cost, excluding other financial liabilities. For a breakdown of the components of total funding, see “Item 5. Operating and Financial Review and Prospects—B. Liquidity and Capital Resources—Liquidity and Funding.” |
| (5) | Adjusted efficiency ratio excludes the effect of the hedge for investments held abroad. This exclusion affects the income tax, gains (losses) on financial assets and liabilities and exchange rate differences line items but does not affect the “Net profit from continuing operations” line item because the adjustment to gains (losses) on financial assets and liabilities and exchange rate difference is offset by the adjustment to income tax. Our management believes that the adjusted efficiency ratio provides a more consistent framework for evaluating and conducting business, as a result of excluding from our revenues the effect of the volatility caused by possible gains and losses on our hedging strategies for tax purposes. For more details, see the table below. |
| | | For the year ended December 31, |
| | | 2017 | | 2016 | | 2015 | | 2014 | | 2013 |
| | | (in millions of R$, except percentages) |
| Effects of the hedge for investments held abroad | | | 810 | | | | (6,140 | ) | | | 10,919 | | | | 1,668 | | | | 2,367 | |
| Efficiency ratio | | | 33.1 | % | | | 30.6 | % | | | 47.1 | % | | | 39.9 | % | | | 38.8 | % |
| Adjusted efficiency ratio | | | 32.5 | % | | | 34.9 | % | | | 34.8 | % | | | 38.1 | % | | | 36.4 | % |
Reconciliation of Non-GAAP Measures and Ratios to Their Most Directly Comparable IFRS Financial Measures
Reconciliation of Non-GAAP Ratios to Their Most Directly Comparable IFRS Financial Measures
The information in the table below presents the calculation of specified non-GAAP financial measures from each of their most directly comparable IFRS financial measures. Our calculation of these non-GAAP financial measures may differ from the calculation of similarly titled measures used by other companies. We believe that these non-GAAP financial measures supplement the GAAP information provided to investors regarding the substantial impact of the R$1.1 billion goodwill arising from the acquisition of GetNet and Super both during 2014, the acquisition of Banco Bonsucesso S.A. in 2015 and the significance of other factors affecting stockholders’ equity and the related ratios. See “Item 4. Information on the Company—4A. History and Development of the Company—Important Events.” The limitation associated with the exclusion of goodwill from stockholders’ equity is that it has the effect of excluding a portion of the total investment in our assets. We compensate for this limitation by also considering stockholders’ equity including goodwill, as set forth in the above tables. Accordingly, while we believe that the non-GAAP financial measures presented are useful to investors and support their analysis, the non-GAAP financial measures have important limitations as analytical tools, and investors should not consider them in isolation or as substitutes for analysis of our results as reported under GAAP measures including under IFRS.
| | | At and for the year ended December 31, |
| | | 2017 | | 2016 | | 2015 | | 2014 | | 2013 |
| | | (in millions of R$, except as otherwise indicated) |
| Return on average stockholders’ equity: | | | | | | | | | | | | | | | | | | | | |
| Consolidated profit for the year | | | 9,138 | | | | 7,465 | | | | 9,834 | | | | 5,708 | | | | 5,848 | |
| Average stockholders’ equity(*) | | | 87,868 | | | | 84,283 | | | | 81,475 | | | | 78,818 | | | | 80,916 | |
| Return on average stockholders’ equity(*) | | | 10.4 | % | | | 8.9 | % | | | 12.1 | % | | | 7.3 | % | | | 7.3 | % |
| Adjusted return on average stockholders’ equity(*): | | | | | | | | | | | | | | | | | | | | |
| Consolidated profit for the year | | | 9,138 | | | | 7,465 | | | | 9,834 | | | | 5,708 | | | | 5,848 | |
| Average stockholders’ equity(*) | | | 87,868 | | | | 84,283 | | | | 81,475 | | | | 78,818 | | | | 80,916 | |
| Average goodwill(*) | | | 28,360 | | | | 28,343 | | | | 28,376 | | | | 27,747 | | | | 27,218 | |
| Average stockholders’ equity excluding goodwill(*) | | | 59,508 | | | | 55,940 | | | | 53,130 | | | | 51,071 | | | | 53,698 | |
| Adjusted return on average stockholders’ equity(*) | | | 15.4 | % | | | 13.3 | % | | | 18.5 | % | | | 11.3 | % | | | 10.9 | % |
| Average stockholders’ equity as a percentage of average total assets(*): | | | | | | | | | | | | | | | | | | | | |
| Average stockholders’ equity(*) | | | 87,868 | | | | 84,283 | | | | 81,475 | | | | 78,818 | | | | 80,916 | |
| Average total assets(*) | | | 637,511 | | | | 605,646 | | | | 571,860 | | | | 478,560 | | | | 435,283 | |
| Average stockholders’ equity as a percentage of average total assets(*) | | | 13.8 | % | | | 13.9 | % | | | 14.2 | % | | | 16.5 | % | | | 18.5 | % |
| Average stockholders’ equity excluding goodwill as a percentage of average total assets excluding goodwill(*): | | | | | | | | | | | | | | | | | | | | |
| Average stockholders’ equity(*) | | | 87,868 | | | | 84,283 | | | | 81,475 | | | | 78,818 | | | | 80,916 | |
| Average goodwill(*) | | | 28,360 | | | | 28,343 | | | | 28,376 | | | | 27,747 | | | | 27,218 | |
| Average stockholders’ equity excluding goodwill(*) | | | 59,508 | | | | 55,940 | | | | 53,130 | | | | 51,071 | | | | 53,698 | |
| Average total assets(*) | | | 637,511 | | | | 605,646 | | | | 571,860 | | | | 478,560 | | | | 435,283 | |
| Average goodwill(*) | | | 28,360 | | | | 28,343 | | | | 28,376 | | | | 27,747 | | | | 27,218 | |
| Average total assets excluding goodwill(*) | | | 609,151 | | | | 577,303 | | | | 543,515 | | | | 450,813 | | | | 408,065 | |
| Average stockholders’ equity excluding goodwill as a percentage of average total assets excluding goodwill(*) | | | 9.8 | % | | | 9.7 | % | | | 9.8 | % | | | 11.3 | % | | | 13.1 | % |
| Impaired assets as a percentage of stockholders’ equity: | | | | | | | | | | | | | | | | | | | | |
| Impaired assets | | | 19,145 | | | | 18,887 | | | | 18,599 | | | | 14,011 | | | | 14,022 | |
| Stockholders’ equity | | | 87,088 | | | | 84,813 | | | | 79,835 | | | | 78,683 | | | | 81,655 | |
| Impaired assets as a percentage of stockholders’ equity | | | 22.0 | % | | | 22.3 | % | | | 23.3 | % | | | 17.8 | % | | | 17.2 | % |
| Impaired assets as a percentage of stockholders’ equity excluding goodwill: | | | | | | | | | | | | | | | | | | | | |
| Impaired assets | | | 19,145 | | | | 18,887 | | | | 18,599 | | | | 14,011 | | | | 14,022 | |
| Stockholders’ equity | | | 87,088 | | | | 84,813 | | | | 79,835 | | | | 78,683 | | | | 81,655 | |
| Goodwill | | | 28,364 | | | | 28,355 | | | | 28,333 | | | | 28,271 | | | | 27,218 | |
| Stockholders’ equity excluding goodwill | | | 58,723 | | | | 56,458 | | | | 51,502 | | | | 50,412 | | | | 54,437 | |
| Impaired assets as a percentage of stockholders’ equity excluding goodwill | | | 32.6 | % | | | 33.5 | % | | | 36.1 | % | | | 27.8 | % | | | 25.9 | % |
| Impaired assets as a percentage of loans and receivables: | | | | | | | | | | | | | | | | | | | | |
| Loans and advances to customers, gross | | | 287,829 | | | | 268,438 | | | | 267,266 | | | | 249,110 | | | | 226,206 | |
| Impaired assets | | | 19,145 | | | | 18,887 | | | | 18,599 | | | | 14,011 | | | | 14,022 | |
| Impaired assets as a percentage of loans and receivables | | | 6.7 | % | | | 7.0 | % | | | 7.0 | % | | | 5.6 | % | | | 6.2 | % |
| Impaired assets as a percentage of credit risk exposure: | | | | | | | | | | | | | | | | | | | | |
| Loans and advances to customers, gross | | | 287,829 | | | | 268,438 | | | | 267,266 | | | | 249,110 | | | | 226,206 | |
| Guarantees | | | 42,645 | | | | 33,265 | | | | 43,611 | | | | 39,334 | | | | 31,150 | |
| Credit risk exposure | | | 330,474 | | | | 301,703 | | | | 310,877 | | | | 288,445 | | | | 257,357 | |
| Impaired assets | | | 19,145 | | | | 18,887 | | | | 18,599 | | | | 14,011 | | | | 14,022 | |
| Impaired assets as a percentage of credit risk exposure | | | 5.8 | % | | | 6.3 | % | | | 6.0 | % | | | 4.9 | % | | | 5.4 | % |
| Loans and advances to customers, net as a percentage of total funding: | | | | | | | | | | | | | | | | | | | | |
| Loans and advances to customers, gross | | | 287,829 | | | | 268,438 | | | | 267,266 | | | | 249,110 | | | | 226,206 | |
| Impairment losses(1) | | | 15,409 | | | | 16,435 | | | | 15,233 | | | | 13,421 | | | | 13,472 | |
| Total Funding(2) | | | 434,620 | | | | 434,700 | | | | 425,209 | | | | 368,741 | | | | 308,395 | |
| Loans and advances to customers, net as a percentage of total funding(2) | | | 62.7 | % | | | 58.0 | % | | | 59.3 | % | | | 63.9 | % | | | 69.0 | % |
| (*) | The average annual balance sheet data has been calculated based upon the average of the monthly balances at 13 dates: at December 31 of the prior year and for each of the month-end balances of the 12 subsequent months. |
| (1) | Provision for impairment losses of loans and advances to customers. |
| (2) | Total funding is the sum of financial liabilities at amortized cost, excluding the other financial liabilities. |
The table below presents the reconciliation of our adjusted efficiency ratio to the most directly comparable IFRS financial measures for each of the periods presented.
| | | At and for the year ended December 31, |
| | | 2017 | | 2016 | | 2015 | | 2014 | | 2013 |
| | | (in millions of R$, except as otherwise indicated) |
| Efficiency ratio | | | | | | | | | | | | | | | | | | | | |
| Administrative expenses | | | 16,121 | | | | 14,920 | | | | 14,515 | | | | 13,942 | | | | 13,850 | |
| Total income | | | 48,725 | | | | 48,837 | | | | 30,814 | | | | 34,950 | | | | 35,712 | |
| of which: | | | | | | | | | | | | | | | | | | | | |
| Gains (losses) on financial assets and liabilities (net) and exchange differences (net) | | | 1,574 | | | | 7,591 | | | | (9,918 | ) | | | (888 | ) | | | (595 | ) |
| Efficiency ratio | | | 33.1 | % | | | 30.6 | % | | | 47.1 | % | | | 39.9 | % | | | 38.8 | % |
| Total Income | | | 48,725 | | | | 48,837 | | | | 30,814 | | | | 34,950 | | | | 35,712 | |
| Effects of the hedge for investments held abroad | | | (810 | ) | | | 6,140 | | | | (10,919 | ) | | | (1,668 | ) | | | (2,367 | ) |
| Total income excluding effects of the hedge for investments held abroad | | | 49,535 | | | | 42,697 | | | | 41,733 | | | | 36,618 | | | | 38,079 | |
| Administrative expenses | | | 16,121 | | | | 14,920 | | | | 14,515 | | | | 13,942 | | | | 13,850 | |
| Efficiency ratio adjusted for effects of the hedge for investments held abroad | | | 32.5 | % | | | 34.9 | % | | | 34.8 | % | | | 38.1 | % | | | 36.4 | % |
Reconciliation of Non-GAAP Measures to Their Most Directly Comparable IFRS Financial Measures
The information in the table below presents the calculation of specified non-GAAP financial measures from each of their most directly comparable IFRS financial measures. Our calculation of these non-GAAP financial measures may differ from the calculation of similarly titled measures used by other companies. We believe that these non-GAAP financial measures supplement the GAAP information provided to investors regarding effects of the hedge for investments held abroad. The limitation associated with the exclusion of effects of the hedge for investments held abroad is that it has the effect of excluding a portion of gains/losses on financial assets and liabilities (net) plus exchange differences (net) line item which is offset by excluding a portion in Income tax line item. Accordingly, while we believe that the non-GAAP financial measures presented are useful to investors and support their analysis, the non-GAAP financial measures have important limitations as analytical tools, and investors should not consider them in isolation or as substitutes for analysis of our results as reported under GAAP measures including under IFRS.
| | | At and for the year ended December 31, |
| | | 2017 | | 2016 | | 2015 | | 2014 | | 2013 |
| | | (in millions of R$, except as otherwise indicated) |
| | | | | | | | | | | |
| Gains/losses on financial assets and liabilities (net) plus exchange differences (net) | | | 1,574 | | | | 7,591 | | | | (9,918 | ) | | | (888 | ) | | | (595 | ) |
| Effects on hedge for investment held abroad | | | (810 | ) | | | 6,140 | | | | (10,919 | ) | | | (1,668 | ) | | | (2,367 | ) |
| Adjusted Gains/losses on financial assets and liabilities (net) plus exchange differences (net) | | | 2,384 | | | | 1,451 | | | | 1,001 | | | | 780 | | | | 1,772 | |
| Total Income | | | 48,725 | | | | 48,837 | | | | 30,814 | | | | 34,950 | | | | 35,712 | |
| Effects on hedge for investment held abroad | | | (810 | ) | | | 6,140 | | | | (10,919 | ) | | | (1,668 | ) | | | (2,367 | ) |
| Adjusted Total Income | | | 49,535 | | | | 42,697 | | | | 41,733 | | | | 36,618 | | | | 38,079 | |
| Operating profit before tax | | | 14,514 | | | | 16,384 | | | | (3,216 | ) | | | 6,443 | | | | 4,018 | |
| Effects on hedge for investment held abroad | | | (810 | ) | | | 6,140 | | | | (10,919 | ) | | | (1,668 | ) | | | (2,367 | ) |
| Adjusted Operating profit before tax | | | 15,324 | | | | 10,244 | | | | 7,703 | | | | 8,111 | | | | 6,385 | |
| Income Tax | | | (5,376 | ) | | | (8,919 | ) | | | 13,050 | | | | (736 | ) | | | (233 | ) |
| Effects on hedge for investment held abroad | | | 810 | | | | (6,140 | ) | | | 10,919 | | | | 1,668 | | | | 2,367 | |
| Adjusted Income tax | | | (6,186 | ) | | | (2,779 | ) | | | 2,130 | | | | (2,404 | ) | | | (2,600 | ) |
| Operating profit before tax – Commercial Banking | | | 11,220 | | | | 12,652 | | | | (5,565 | ) | | | 4,231 | | | | 1,510 | |
| Effects on hedge for investment held abroad | | | (810 | ) | | | 6,140 | | | | (10,919 | ) | | | (1,668 | ) | | | (2,367 | ) |
| Adjusted Operating Profit before tax – Commercial Banking | | | 12,030 | | | | 6,512 | | | | 5,354 | | | | 5,899 | | | | 3,877 | |
Exchange Rates
The Brazilian foreign exchange system allows the purchase and sale of foreign currency and the international transfer ofreais by any person or legal entity, regardless of the amount, subject to certain regulatory procedures.
Since 1999, the Brazilian Central Bank has allowed thereal/U.S. dollar exchange rate to float freely, which resulted in increasing exchange rate volatility. Until early 2003, thereal declined against the U.S. dollar. Between 2004 and 2008, thereal strengthened against the U.S. dollar, except in the most severe periods of the global economic crisis. Given the turmoil in international markets and the current Brazilian macroeconomic outlook, thereal depreciated against the U.S. dollar from mid-2011 to early 2016. Beginning in early 2016 through the end of 2016, thereal appreciated against the U.S. dollar, primarily as a result of Brazil’s changing political conditions. In 2017 to the date of this annual report, thereal has continued to appreciate against the U.S. dollar due to optimism about economic recovery in Brazil and the improved political climate. In the past, the Brazilian Central Bank has intervened occasionally to control high volatility in the foreign exchange rates. We cannot predict whether the Brazilian Central Bank or the Brazilian government will continue to permit thereal to float freely or will intervene in the exchange rate market through the return of a currency band system or otherwise. In the future, thereal may fluctuate substantially against the U.S. dollar.
Furthermore, Brazilian law provides that, whenever there is a serious imbalance in Brazil’s balance of payments or there are compelling reasons to foresee a serious imbalance, temporary restrictions may be imposed on remittances of foreign capital abroad. Any such restrictions on remittances of foreign capital abroad may limit our ability to make distributions to holders of our ADRs. We cannot assure you that such measures will not be taken by the Brazilian government in the future. Exchange rate fluctuations will affect the U.S. dollar equivalent of the price of our shares inreais on the São Paulo Stock Exchange, B3 S.A. – Brasil, Bolsa, Balcão, or “B3” (the current corporate name of BM&FBOVESPA S.A. – Bolsa de Valores, Mercadorias e Futuros) as well as the U.S. dollar equivalent of any distributions we make with respect to our shares, which will be made exclusively inreais. Exchange rate fluctuations may also adversely affect our financial condition. For further information on these risks, see “—D. Risk Factors—Risks Relating to Brazil and Macroeconomic Conditions in Brazil and Globally—Exchange rate volatility may have a material adverse effect on the Brazilian economy and on our business.”
The following tables set forth the selling rate, expressed inreais per U.S. dollar (R$/U.S.$), for the periods indicated:
| | Period-end | Average(1) | Low | High |
| | (per U.S. dollar) |
| Year: | | | | |
| 2013 | 2.34 | 2.16 | 1.95 | 2.45 |
| 2014 | 2.66 | 2.36 | 2.19 | 2.74 |
| 2015 | 3.90 | 3.34 | 2.57 | 4.19 |
| 2016 | 3.26 | 3.48 | 3.12 | 4.16 |
| 2017 | 3.31 | 3.19 | 3.05 | 3.38 |
| Month Ended: | | | | |
| September 2017 | 3.17 | 3.13 | 3.08 | 3.19 |
| October 2017 | 3.28 | 3.19 | 3.13 | 3.28 |
| November 2017 | 3.26 | 3.26 | 3.21 | 3.29 |
| December 2017 | 3.31 | 3.29 | 3.23 | 3.33 |
| January 2018 | 3.16 | 3.21 | 3.14 | 3.31 |
| February 2018 | 3.25 | 3.24 | 3.17 | 3.28 |
| March 2018 | 3.32 | 3.28 | 3.22 | 3.34 |
Source: Brazilian Central Bank.
| (1) | Represents the average of the exchange rates at the close of each business day during the period. |
Our parent company, Santander Spain, reports its financial condition and results of operations in euros. As of December 31, 2017, the exchange rate foreuro toreal was R$3.9693 per €1.00.
3B. Capitalization and Indebtedness
Not applicable.
3C. Reasons for the Offer and Use of Proceeds
Not applicable.
3D. Risk Factors
Our business, financial condition and results of operations could be materially and adversely affected if any of the risks described below occur. As a result, the market price of our units and the American Depositary Receipts (“ADRs”) could decline, and you could lose all or part of your investment.
Risks Relating to Brazil and Macroeconomic and Political Conditions in Brazil and Globally
The Brazilian government has exercised significant influence over the Brazilian economy. The Brazilian government’s macroeconomic management strategies, as well as Brazilian political and economic conditions, could adversely affect us and the trading price of our securities.
The Brazilian government has frequently intervened in the Brazilian economy and has on occasion made significant changes in policy and regulations. In the past, the Brazilian government has adopted measures, including, among others, changes in regulations, price controls, capital controls, changes in the exchange rate regime and limitations on imports, which have affected Brazilian asset prices. Recently, the Brazilian government has adopted measures, including changes in tax policies and constraints that have affected Brazilian asset prices and the trading price of our securities.
We and the trading price of our securities may be adversely affected by changes in policy, laws, or regulations at the federal, state and municipal levels involving or affecting factors such as:
| · | liquidity of capital and lending markets; |
| · | the regulatory framework governing our industry; |
| · | exchange rate controls and restrictions on remittances abroad; and |
| · | other political, social and economic developments in or affecting Brazil. |
Uncertainty over whether the Brazilian government will implement changes in policy or regulation creates instability in the Brazilian economy, increasing the volatility of the Brazilian securities markets, which may have an adverse effect on us and our securities. Recent economic and political instability has led to a negative perception of the Brazilian economy and higher volatility in the Brazilian securities markets, which also may adversely affect us and our securities. The overall trend of the Brazilian political and economic arenas may also affect the business of the Brazilian financial industry.
We are not able to fully estimate the impact of global and Brazilian political and macroeconomic developments and economic regulatory policy changes on our business and lending activity, nor are we able to predict how current or future measures implemented by regulatory policy-makers may impact our business. In addition, due to the current political instability, there exists substantial uncertainty regarding future economic policies and we cannot predict what policies will be adopted by the Brazilian government and whether these policies will negatively affect the economy or our business or financial performance. Any changes in regulatory capital requirements for lending, reserve requirements, or product and service regulations, among others, or continued political uncertainty may materially adversely affect our business.
Political instability in Brazil may adversely affect Brazil’s economy and investment levels, and have a material adverse effect on us.
Brazil’s political environment has historically influenced, and continues to influence, the performance of the country’s economy. Political crises have affected and continue to affect the confidence of investors and the general public, and have historically resulted in economic deceleration and heightened volatility in the securities issued by Brazilian companies.
The recent economic instability in Brazil has contributed to a decline in market confidence in the Brazilian economy as well as to a deteriorating political environment. Despite the ongoing recovery of the Brazilian economy, weak macroeconomic conditions in Brazil are expected to continue in 2018. In addition, various ongoing investigations into allegations of money laundering and corruption being conducted by the Office of the Brazilian Federal Prosecutor, including the largest such investigation known as “Lava Jato,” have negatively impacted the Brazilian economy and political environment.
In August 2016, the Brazilian Senate approved the removal of Brazil’s then-President from office, after completion of the legal and administrative process for impeachment, for infringing budgetary laws. The former Vice-President, who had previously assumed the interim presidency of Brazil in a caretaker role since the former President’s suspension in May, was sworn in by the Brazilian Senate to serve out the remainder of the presidential term until December 2018 (the next general election is in October 2018). There was an ongoing proceeding before the Brazilian Higher Electoral Court (Tribunal Superior Eleitoral) against the electoral alliance between the former President and the current one (former Vice-President) in connection with the 2014 elections. On June 9, 2017, the Brazilian Higher Electoral Court absolved the former Vice-President (current President of Brazil) of wrongdoing, however, he remains under investigation in connection with the ongoing “Lava Jato” investigations. See “—Ongoing investigations relating to corruption and diversion of public funds that are being conducted by the Brazilian federal police as well as other Brazilian and non-Brazilian regulators and law enforcement officials may adversely affect the growth of the Brazilian economy and could have a material adverse effect on us.” We cannot predict which policies the current President of Brazil may adopt or change during his mandate or the effect that any such policies might have on our business and on the Brazilian economy. Any such new policies or changes to current policies may have a material adverse effect on us.
Presidential elections are to be held in Brazil in October 2018. We cannot predict the outcome of those elections, including whether any successor to the current President of Brazil will adopt policies or changes to current policies, which may have a material adverse effect on us. Furthermore, the political uncertainty resulting from the presidential elections may have an adverse effect on our business, results of operations and financial condition.
For the last few years, political demonstrations in Brazil have also affected the development of the Brazilian economy and investors’ perception about Brazil. For example, street protests, which started in mid-2013 and continued through 2016, demonstrated the public’s dissatisfaction with the worsening Brazilian economic condition (including an increase in inflation and fuel prices as well as rising unemployment) and the perception of widespread corruption. Additionally, the “Lava Jato” investigations involving certain oil and gas, energy, construction and infrastructure companies, as well as public agents and politicians, have raised investors’ risk aversion with regard to Brazil.
Furthermore, the Brazilian economy has experienced a sharp downturn in recent years until showing signs of recovery in late 2017 and early 2018 due, in part, to political uncertainty and the economic and monetary policies of the Brazilian government and the global drop in commodities prices. Uncertainty over whether the acting Brazilian government will implement changes in policy or regulation in the future may contribute to economic uncertainty in Brazil and to heightened volatility in the securities issued abroad by Brazilian companies.
Ongoing investigations relating to corruption and diversion of public funds that are being conducted by the Brazilian federal police as well as other Brazilian and non-Brazilian regulators and law enforcement officials may adversely affect the growth of the Brazilian economy and could have a material adverse effect on us.
Certain Brazilian companies active in the oil and gas, energy, construction and infrastructure sectors are facing investigations by the CVM, the U.S. Securities and Exchange Commission (the “SEC”), the U.S. Department of Justice, the Brazilian Federal Police and the Brazilian Federal Prosecutor’s Office, the Comptroller General of Brazil and other relevant governmental authorities, in connection with corruption allegations (the so called “Lava Jato” investigations). The Brazilian federal police is also investigating allegations of improper payments made by Brazilian companies to officials of the Board of Tax Appeals (Conselho Administrativo de Recursos Fiscais), or CARF, a tax appeals tribunal (the so-called “Operação Zelotes”). It is alleged that the purpose of such improper payments was to induce those officials to reduce or waive certain tax-related penalties imposed by the Brazilian federal revenue authority, which were under appeal in the CARF. Such investigations involve several companies and individuals, including representatives of various companies, politicians and third parties. Certain of these individuals are being investigated by the Brazilian Federal Police and others were formally charged and are facing criminal proceedings and/or have already been convicted by the Brazilian Federal Courts.
Depending on the duration and outcome of such investigations, the companies involved may face a reduction in their revenues, downgrades from rating agencies or funding restrictions, among other negative effects. Given the significance of the companies cited in these investigations in the Brazilian economy, the investigations and their fallout have had an adverse effect on Brazil’s economic growth prospects in the near short to medium term. Furthermore, the negative effects on such companies and others may also impact the level of investments in infrastructure in Brazil, which may lead to lower economic growth or contraction in the near to medium term (according to data from the IBGE, the Brazilian economy’s gross domestic product (“GDP”) contracted by 3.5% in 2015 and 3.5% in 2016 but increased by 1.0% in 2017). In addition, although we have reduced our exposure to companies involved in the “Lava Jato” and other government investigations, we cannot assure you that new investigations will not be launched or that additional persons will not become subject to investigation. To the extent that the repayment ability of these companies is hampered by any fines and/or other sanctions that may be imposed upon them or reputational or commercial damage as a result of the “Lava Jato” investigations, we may also be materially adversely affected.
As a result of the allegations under the “Lava Jato” investigations and the economic downturn, Brazil was downgraded to non-investment grade status by S&P in September 2015, by Fitch Ratings in December 2015, by Moody’s in February 2016 and downgraded again by Fitch in May 2016. In addition, Brazil was further downgraded by S&P to BB- with a stable outlook in January 2018 as a result of the failure of the current Brazilian government to approve certain pension reforms. Various major Brazilian companies were also downgraded. Such downgrades have further worsened the conditions of the Brazilian economy and the condition of Brazilian companies, especially those relying on foreign investments over 2016 and 2017. More recently, the “Lava Jato” investigations have also reached members of the executive and legislative branches of the Brazilian government, which has caused considerable political instability, and as a result, persistently poor economic conditions in Brazil could have a material adverse effect on us. It is difficult to predict the effects of such political instability.
Government efforts to control inflation and changes in interest rates may hinder the growth of the Brazilian economy and could have an adverse effect on us.
Brazil has experienced extremely high rates of inflation in the past and has therefore implemented monetary policies that have resulted in one of the highest interest rates in the world. Since the establishment of thePlano Real (a set of measures designed to stabilize the Brazilian economy) in 1994 and until 2015, Brazil’s annual consumer price inflation levels were below 10%. However, in 2015, consumer price inflation increased above 10%, to 10.7%, while in 2016 and 2017 consumer price inflation decreased to 6.3% and 2.9%, respectively. The Brazilian government’s measures to fight inflation, principally through the Brazilian Central Bank, have had and may in the future have significant effects on the Brazilian economy and our business. Tight monetary policies with high interest rates and high compulsory reserve requirements may restrict Brazil’s growth and the availability of credit, reduce our loan volumes and increase our loan loss provisions. Conversely, less strict government and Brazilian Central Bank policies and interest rate decreases may trigger increases in inflation, and, consequently, growth volatility and the need for sudden and significant interest rate increases, which could negatively affect our spreads.
In March 2015, the SELIC rate was increased to 12.75%, due to continuing inflation pressures and was further increased to 13.25% in April 2015, to 13.75% in June 2015, and to 14.25% in July 2015. In December 2016, the SELIC rate was lowered to 13.75%, and in January 2017 the SELIC rate was further lowered to 13.0%, and to 12.25% in February 2017. In May 2017, the Monetary Policy Committee (Comitê de Política Monetária) of the Brazilian Central Bank, or COPOM, decided to lower the SELIC rate to 10.25%, lowering it to 9.25% in July 2017 and to 7.50% in October 2017, and to 7.0% in December 2017. In February 2018, the COPOM lowered the SELIC rate to 6.75% and then to 6.50% in March 2018.
The majority of our income, expenses, assets and liabilities are directly tied to interest rates. Therefore, our results of operations and financial condition are significantly affected by inflation, interest rate fluctuations and related government monetary policies, all of which may materially and adversely affect the growth of the Brazilian economy, our loan portfolios, our cost of funding and our income from credit operations. We estimate that in 2017, a 1.0% increase or decrease in the base interest rate would have resulted in a decrease or increase, respectively, in our net interest income of R$378 million. Any changes in interest rates may negatively impact our business, financial condition and results of operations. In addition, increases in base interest rates may adversely affect us by reducing the demand for our credit and investment products, increasing funding costs and increasing in the short run the risk of default by our customers.
Inflation adversely affects our personnel and other administrative expenses that are directly or indirectly tied to inflation indexes, generally the consumer price index (Índice de Preços ao Consumidor – Amplo), or “IPCA,” and the general index of market prices (Índice Geral de Preços-Mercado), or “IGPM.” For example, considering the amounts in 2017, each additional percentage point change in inflation, would impact our personnel and other administrative expenses by approximately R$84 million and R$65 million, respectively.
Despite the Brazilian Central Bank’s repeated cuts of the SELIC rate, inflation has continued to decline until recently, reaching 2.95% for the twelve-month period ending December 31, 2017, and decreasing to 2.84% for the period ending February 28, 2018.
Inflation, government measures to curb inflation and speculation related to possible measures regarding inflation may significantly contribute to uncertainty regarding the Brazilian economy and weaken investors’ confidence in Brazil. Future Brazilian governmental actions, including interest rate increases or decreases, intervention in the foreign exchange market and actions to adjust or fix the value of thereal, may trigger increases in inflation and adversely affect the performance of the Brazilian economy as a whole. Any of the aforementioned developments may adversely affect our asset quality. Furthermore, Brazil’s high rate of inflation, compounded by high and increasing interest rates, declining consumer spending and increasing unemployment, may have a material adverse impact on the Brazilian economy as a whole, as well as on us.
Exposure to Brazilian federal government debt could have a material adverse effect on us.
We invest in Brazilian government sovereign bonds. As of December 31, 2017, approximately 19.0% of our total assets, and 82.1% of our securities portfolio, was comprised of debt securities issued by the Brazilian government. Any failure by the Brazilian government to make timely payments under the terms of these securities, or a significant decrease in their market value, will have a material adverse effect on us.
Fluctuations in interest rates and other factors may affect our obligations under legacy employee pension funds.
We sponsor certain defined benefit pension plans and a health care plan that benefit certain of our former and current employees, most of which were inherited from Banespa (though we discontinued the use of defined benefit pension plans for our employees in 2005).
In order to determine the funded status of each legacy defined benefit pension plan and, consequently, the carried reserves necessary to pay future beneficiaries, we use certain actuarial techniques and assumptions, which are inherently uncertain and involve the exercise of significant judgment, including with respect to interest rates, which are a key assumption in determining our current obligations under the legacy pension plans as interest rates are used to calculate the present value of such obligations. For further information, see note 23 to our consolidated financial statements.
Changes in the present value of our obligations under our legacy defined benefit pension plans could cause us to have to increase contributions to reduce or satisfy the deficits, which would divert resources from use in other areas of our business. Any such increase may be due to factors over which we have no or limited control. Increases in our pension liabilities and obligations could have a material adverse effect on our business, financial condition and results of operations.
Decreases in interest rates can increase the present value of obligations under our legacy defined benefit pension plans, and may materially and adversely affect the funded status of our legacy defined benefit plans and require us to make additional contributions to these plans to meet our pension funding obligations.
Exchange rate volatility may have a material adverse effect on the Brazilian economy and on us.
The Brazilian currency has, during past decades, experienced frequent and substantial variations in relation to the U.S. dollar and other foreign currencies. From 2013 to 2014, thereal continued to depreciate due to a decrease in commodities prices and a recovery of the U.S. economy, reaching R$2.34 per U.S.$1.00 on December 31, 2013 and R$2.65 per U.S.$1.00 on December 31, 2014.
During 2015, due to the poor economic conditions in Brazil, including as a result of political instability, thereal devalued at a much higher rate than in previous years. On September 24, 2015, thereal fell to the lowest level since the introduction of the currency, at R$4.20 per U.S.$1.00. Overall in 2015, thereal depreciated 47%, reaching R$3.91 per U.S.$1.00 on December 31, 2015. In 2016, thereal faced continuing fluctuations, primarily as a result of Brazil’s political instability, but had appreciated 17.0% year-over-year against the U.S. dollar as of December 31, 2016 to R$3.26 per U.S.$1.00. In 2017, therealremained relatively stable against the U.S. dollar, with an exchange rate of 3.31 per U.S.$1.00 as of December 31, 2017. On March 28, 2018, the exchange rate was R$3.32 per U.S.$1.00. There can be no assurance that thereal will not substantially depreciate or appreciate further against the U.S. dollar.
In the year ended December 31, 2017, a variation of 1.0% in the exchange rate ofreais to U.S. dollars would have resulted in a variation of income on our net foreign exchange position denominated in U.S. dollars of R$2 million.
Depreciation of thereal relative to the U.S. dollar has created additional inflationary pressures in Brazil, which have led to increases in interest rates, limited Brazilian companies’ access to foreign financial markets and prompted the adoption of recessionary policies by the Brazilian government. Depreciation of thereal may also, in the context of an economic slowdown, lead to decreased consumer spending, deflationary pressures and reduced growth of the Brazilian economy as a whole, and thereby harm our asset base, financial condition and results of operations. Additionally, depreciation of thereal could make our foreign currency-linked obligations and funding more expensive, negatively affect the market price of our securities portfolios and have similar consequences for our borrowers. Conversely, appreciation of thereal relative to the U.S. dollar and other foreign currencies could lead to a deterioration of the Brazilian foreign exchange currency accounts, as well as dampen export-driven growth. Depending on the circumstances, either depreciation or appreciation of thereal could materially and adversely affect the growth of the Brazilian economy and our business, financial condition and results of operations.
Infrastructure and workforce deficiency in Brazil may impact economic growth and have a material adverse effect on us.
Our performance depends on the overall health and growth of the Brazilian economy. Brazilian GDP growth has fluctuated over the past few years, with contractions of 3.5% and 3.5% in 2015 and 2016 and growth of 1.0% in 2017. Growth is limited by inadequate infrastructure, including potential energy shortages and deficient transportation, logistics and telecommunication sectors, the lack of a qualified labor force, and the lack of private and public investments in these areas, which limit productivity and efficiency. Any of these factors could lead to labor market volatility and generally impact income, purchasing power and consumption levels, which could limit growth, increase delinquency rates and ultimately have a material adverse effect on us.
Developments and the perception of risk in other countries may adversely affect the Brazilian economy and market price of Brazilian issuers’ securities.
The market value of securities of Brazilian issuers is affected by economic and market conditions in other countries, including the United States, European countries (including Spain, where Santander Spain, our controlling shareholder, is based) and in other Latin American and emerging market countries. Although economic conditions in
Europe and in the United States may differ significantly from economic conditions in Brazil; investors’ reactions to developments in these other countries may have an adverse effect on the market value of securities of Brazilian issuers. In particular, investor perceptions of the risks associated with our securities may be affected by perception of risk conditions in Spain. Additionally, crises in other emerging market countries may diminish investor interest in securities of Brazilian issuers, including our securities. This could adversely affect the market price of our securities, restrict our access to capital markets and compromise our ability to finance our operations in the future on favorable terms, or at all.
In 2015, 2016 and 2017, there was an increase in volatility in all Brazilian markets due to, among other factors, uncertainties about how monetary policy adjustments in the United States would affect the international financial markets, the increasing risk aversion to emerging market countries, and the uncertainties regarding Brazilian macroeconomic and political conditions. These uncertainties adversely affected us and the market value of our securities.
In addition, we continue to be exposed to disruptions and volatility in the global financial markets because of their effects on the financial and economic environment, particularly in Brazil, such as a slowdown in the economy, an increase in the unemployment rate, a decrease in the purchasing power of consumers and the lack of credit availability. We lend primarily to Brazilian borrowers, and these effects could materially and adversely affect our customers and increase our non-performing loans, resulting in increased risk associated with our lending activity and requiring us to make corresponding revisions to our risk management and loan loss reserve models.
Disruption or volatility in the global financial markets could further increase negative effects on the financial and economic environment in Brazil, which could have a material adverse effect on us.
Risks Relating to the Brazilian Financial Services Industry and Our Business
The strong competitive environment in the Brazilian financial services market may adversely affect us, including our business prospects.
The Brazilian financial markets, including the banking, insurance and asset management sectors, are highly competitive. We face significant competition in all of our main areas of operation from other Brazilian and international banks, as well as state-owned institutions. In recent years, the competition has increased in the banking and insurance sectors.
Non-traditional providers of banking services, such as Internet based e-commerce providers, mobile telephone companies and Internet search engines as well as the increase in the availability of payment services using cryptocurrencies and/or blockchain technologies may offer and/or increase their offerings of financial products and services directly to customers. These non-traditional providers of banking services currently have an advantage over traditional providers because they are not subject to banking regulation. Several of these competitors may have long operating histories, large customer bases, strong brand recognition and significant financial, marketing and other resources. They may adopt more aggressive pricing and rates and devote more resources to technology, infrastructure and marketing.
New competitors may enter the market or existing competitors may adjust their services with unique product or service offerings or approaches to providing banking services. If we are unable to successfully compete with current and new competitors, or if we are unable to anticipate and adapt our offerings to changing banking industry trends, including technological changes, our business may be adversely affected. In addition, our failure to effectively anticipate or adapt to emerging technologies or changes in customer behavior, including among younger customers, could delay or prevent our access to new digital-based markets which would in turn have an adverse effect on us. Furthermore, the widespread adoption of new technologies, including cryptocurrencies and payment systems, could require substantial expenditures to modify or adapt our existing products and services as we continue to grow our internet and mobile banking capabilities. Our customers may choose to conduct business or offer products in areas that may be considered speculative or risky. Such new technologies and mobile banking platforms by financial services customers in recent years could negatively impact our investments in traditional bank premises, equipment and personnel for our branch network. The persistence or acceleration of this shift in the demand for financial services towards Internet and mobile banking may require changes to our retail distribution strategy. Our failure to swiftly and effectively implement such changes could have an adverse effect on our competitive position, particularly if our traditional competitors adapt more quickly than we to these shifts in demand.
Increasing competition could also require that we increase our rates offered on deposits or lower the rates we charge on loans, which could also have a material adverse effect on us, including our profitability. It may also negatively affect our business results and prospects by, among other things, limiting our ability to increase our customer base and expand our operations and increasing competition for investment opportunities.
In addition, if our customer service levels were perceived by the market to be materially below those of our competitor financial institutions, we could lose existing and potential business. If we are not successful in retaining and strengthening customer relationships, we may lose market share, incur losses on some or all of our activities or fail to attract new deposits or retain existing deposits, which could have a material adverse effect on us.
We are subject to substantial regulation and regulatory and governmental oversight, which could adversely affect us.
The Brazilian financial markets are subject to extensive and continuous regulatory control by the Brazilian government, principally by the Brazilian Central Bank, the CVM and CMN, which, in each case, materially affects our business. We have no control over the issuance of new regulations that may affect our operations, including in respect of:
| · | minimum capital requirements; |
| · | reserve and compulsory deposit requirements; |
| · | limits on investments in fixed assets; |
| · | lending limits and other credit restrictions, including compulsory allocations; |
| · | limits and other restrictions on fees; |
| · | limits on the amount of interest banks can charge or the period for capitalizing interest; and |
| · | accounting and statistical requirements. |
The regulation governing Brazilian financial institutions is continuously evolving, and the Brazilian Central Bank has reacted actively and extensively to developments in our industry.
Changes in regulations in Brazil and international markets may expose us to increased compliance costs and limitations on our ability to pursue certain business opportunities and provide certain products and services. Brazilian regulators are constantly updating prudential standards in accordance with the recommendations of the Basel Committee on Banking Supervision, in particular with respect to capital and liquidity, which could impose additional significant regulatory burdens on us. For example, future liquidity standards could require us to maintain a greater proportion of our assets in highly liquid but lower-yielding financial instruments, which would negatively affect our net interest margin. There can be no assurance that future changes in regulations or in their interpretation or application will not have a material adverse effect on us.
As some of the banking laws and regulations have been recently issued or become effective, the manner in which those laws and related regulations are applied to the operations of financial institutions is still evolving. Moreover, to the extent that these recently adopted regulations are implemented inconsistently in Brazil, we may face higher compliance costs. The measures of the Brazilian Central Bank and the amendment of existing laws and regulations, or the adoption of new laws or regulations could adversely affect our ability to provide loans, make investments or render certain financial services. No assurance can be given generally that laws or regulations will be adopted, enforced or interpreted in a manner that will not have a material adverse effect on our business and results of operations. Furthermore, regulatory authorities have substantial discretion in how to regulate banks, and this discretion, and the regulatory mechanisms available to the regulators, have been increasing during recent years. Regulation may be imposed on an ad hoc basis by governments and regulators in response to a crisis, and these may especially affect financial institutions such as us that may be deemed to be systemically important. In addition, the volume, granularity, frequency and scale of regulatory and other reporting requirements require a clear data strategy to enable consistent data aggregation, reporting and management. Inadequate management information systems or processes, including those relating to risk data aggregation and risk reporting, could lead to a failure to meet regulatory reporting requirements or other internal or external information demands and we may face supervisory measures as a result.
We may also be subject to potential impacts relating to regulatory changes affecting our controlling shareholder, Santander Spain, due to continued significant financial regulatory reform in jurisdictions outside of Brazil that directly or indirectly affect Santander Spain’s businesses, including Spain, the European Union, the United States, and other jurisdictions. Changes to current legislation and their implementation through regulation (including additional capital, leverage, funding, liquidity and tax requirements), policies (including fiscal and monetary policies established by central banks and financial regulators, and changes to global trade policies), and other legal and regulatory actions may impose additional regulatory burdens on Santander Group, including Santander Brasil, in these jurisdictions. In the European Union, these reforms could include changes relating to capital requirements, liquidity and funding or others measures, implemented as a result of the unification of the European banking system under a European Banking Union. In the United States, many changes have occurred as a result of the Dodd-Frank Wall Street Reform and Consumer Protection Act (the “Dodd-Frank Act”) and its implementing regulations, most of which are now in place. More recently, the President of the United States issued an executive order in 2017 that sets forth principles for financial regulatory and legislative reform, and the Republican majority in Congress has also suggested an agenda for financial legislative reform. The impact of these reforms on our operations is currently uncertain. See “Item 4. Information on the Company—B. Business Overview—Regulation and Supervision—Other Applicable Laws and Regulations—U.S. Banking Regulation.” We cannot predict the final outcome of any financial regulatory reform in the European Banking Union, the United States or elsewhere and we cannot yet determine their effects on Santander Spain and, consequently, their effects on us, but regulatory changes may result in additional costs for us.
We are subject to potential intervention by any of our regulators or supervisors.
Our business and operations are subject to increasingly significant rules and regulations set by the Brazilian Central Bank, the CVM and CMN, that are required to conduct banking and financial services business. These apply to business operations, affect financial returns, and include reserve and reporting requirements, and conduct of business regulations.
In their supervisory roles, the Brazilian Central Bank, the CVM and CMN seek to maintain the safety and soundness of financial institutions with the aim of strengthening the protection of customers and the financial system. Their continuing supervision of financial institutions is conducted through a variety of regulatory tools, including the collection of information by way of prudential returns, reports obtained from skilled persons, visits to firms and regular meetings with management to discuss issues such as performance, risk management and strategy. As a result, we face increased supervisory scrutiny (resulting in increasing internal compliance costs and supervision fees), and in the event of a breach of our regulatory obligations we are likely to face more stringent regulatory fines.
Increases in reserve, compulsory deposit and minimum capital requirements may have a material adverse effect on us.
The Brazilian Central Bank has periodically changed the level of reserves and compulsory deposits that financial institutions in Brazil are required to maintain with the Brazilian Central Bank, as well as determined compulsory allocation requirements to finance government programs. The Brazilian Central Bank may increase the reserve and compulsory deposit or allocation requirements in the future or impose new requirements. Increases in reserve and compulsory deposit or allocation requirements reduce our liquidity to fund our loan portfolio and other investments and, as a result, may have a material adverse effect on us.
Compulsory deposits and allocations generally do not yield the same return as other investments and deposits because a portion of compulsory deposits and allocations:
| · | must be held in Brazilian federal government securities; and |
| · | must be used to finance government programs, including a federal housing program and rural sector subsidies. |
In recent years, the CMN and Brazilian Central Bank published several rules to implement Basel III in Brazil. This new set of regulations covers the revised definition of capital, capital requirements, capital buffers, credit valuation adjustments, exposures to central counterparties, leverage and liquidity coverage ratios, and treatment of systemically important financial institutions. No assurance can be given that the Basel III rules will be adopted, enforced or interpreted in a manner that will not have an adverse effect on us. Furthermore, in January 2017, the CMN issued a new rule by means of which the Brazilian Central Bank established the terms for segmentation for financial institutions, financial institution groups, and other institutions authorized to operate by the Brazilian Central Bank for proportional application of the prudential regulation, considering the size, international activity and risk profile of members of each segment. In February 2017, the Brazilian Central Bank published the initial categorization of financial institutions in the different segments according to the terms set forth in the new resolution. We have been categorized by the Brazilian Central Bank in segment 1, the highest level for application of regulation for banks in Brazil.
For more information on the rules implementing Basel III, see “Item 4. Information on the Company—B. Business Overview—Regulation and Supervision—Capital Adequacy and Leverage—Basel” and “Item 5. Operating and Financial Review and Prospects—B. Liquidity and Capital Resources—Capital Management.”
We may not be able to detect or prevent money laundering and other criminal activities fully or on a timely basis, which could expose us to additional liability and could have a material adverse effect on us.
We are required to comply with applicable anti-money laundering (“AML”), anti-terrorism, anti-bribery and corruption, sanctions and other laws and regulations applicable to us. These laws and regulations require us, among other things, to conduct full customer due diligence (including sanctions and politically-exposed person screening) and keep our customer, account and transaction information up to date. We have implemented financial crime policies and procedures detailing what is required from those responsible. We are also required to conduct AML training for our employees and to report suspicious transactions and activity to appropriate law enforcement following full investigation by the Special Incidents area.
Financial crime has become the subject of enhanced regulatory scrutiny and supervision by regulators globally. AML, anti-bribery and corruption and sanctions laws and regulations are increasingly complex and detailed. Compliance with these laws and regulations requires automated systems, sophisticated monitoring and skilled compliance personnel.
We have developed policies and procedures aimed at detecting and preventing the use of our banking network for money laundering and other financial crime related activities. However, emerging technologies, such as cryptocurrencies and blockchain, could limit our ability to track the movement of funds. Our ability to comply with the legal requirements depends on our ability to improve detection and reporting capabilities and reduce variation in control processes and oversight accountability. These require implementation and embedding within our business effective controls and monitoring, which in turn requires ongoing changes to systems and operational activities. Financial crime is continually evolving and, as noted, is subject to increasingly stringent regulatory oversight and focus. This requires proactive and adaptable responses from us so that we are able to deter threats and criminality effectively. Even known threats can never be fully eliminated, and there will be instances where we may be used by other parties to engage in money laundering and other illegal or improper activities. In addition, we rely heavily on our employees to assist us by spotting such activities and reporting them, and our employees have varying degrees of experience in recognizing criminal tactics and understanding the level of sophistication of criminal organizations. Where we outsource any of our customer due diligence, customer screening or anti-financial crime operations, we remain responsible and accountable for full compliance and any breaches. If we are unable to apply the necessary scrutiny and oversight of third parties to whom we outsource certain tasks and processes, there remains a risk of regulatory breach.
Additionally, in 2015 and in early 2016, pursuant to a new resolution issued by the United Nations Security Council, as well as a recently enacted law and regulations issued by the Brazilian Central Bank for the implementation of the aforementioned resolution in Brazil, additional compliance requirements were imposed on us and other financial institutions operating in Brazil, which relate to the local enforcement of sanctions imposed by the United Nations Security Council resulting from certain resolutions. We believe we already have the control and compliance procedures in place to satisfy such additional compliance requirements. However, we continue to evaluate their impact on our control and compliance procedures and whether adjustments will need to be made to our control and compliance procedures as a result.
If we are unable to fully comply with applicable laws, regulations and expectations, our regulators and relevant law enforcement agencies have the ability and authority to impose significant fines and other penalties on us, including requiring a complete review of our business systems, day-to-day supervision by external consultants and ultimately the revocation of licenses.
The reputational damage to our business and global brand would be severe if we were found to have breached AML, anti-bribery and corruption or sanctions requirements. Our reputation could also suffer if we are unable to protect our customers’ data and bank products and services from being accessed or used for illegal or improper purposes.
In addition, while we review our relevant counterparties’ internal policies and procedures with respect to such matters, to a large degree we rely upon our relevant counterparties to maintain and properly apply their own appropriate compliance measures, procedures and internal policies. Such measures, procedures and internal policies may not be completely effective in preventing third parties from using our (and our relevant counterparties’) services as a conduit for illicit purposes (including illegal cash operations) without our (or our relevant counterparties’) knowledge. If we are associated with, or even accused of having breached AML, anti-terrorism, or sanctions requirements, our reputation could suffer and/or we could become subject to fines, sanctions and/or legal enforcement (including being added to “black lists” that would prohibit certain parties from engaging in transactions with us), any one of which could have a material adverse effect on our operating results, financial condition and prospects.
We are exposed to risk of loss from legal and regulatory proceedings.
We face risk of loss from legal and regulatory proceedings, including tax proceedings, that could subject us to monetary judgments, regulatory proceedings, fines and penalties. The current regulatory and tax enforcement environment in Brazil reflects an increased supervisory focus on enforcement, combined with uncertainty about the evolution of the regulatory regime, and may lead to material operational and compliance costs.
We are from time to time subject to certain claims and party to certain legal proceedings incidental to the normal course of our business, including in connection with conflicts of interest, lending activities, relationships with our employees, economic plans and other commercial or tax matters. In view of the inherent difficulty of predicting the outcome of legal matters, particularly where the claimants seek very large or indeterminate damages, or where the cases present novel legal theories, involve a large number of parties or are in the early stages of discovery, we cannot state with confidence what the eventual outcome of these pending matters will be or what the eventual loss, fines or penalties related to each pending matter may be. The amount of our reserves in respect of these matters is substantially less than the total amount of the claims asserted against us, and, in light of the uncertainties involved in such claims and proceedings, there is no assurance that the ultimate resolution of these matters will not significantly exceed the reserves currently accrued by us. As a result, the outcome of a particular matter may be material to our operating results.
We are subject to review by taxing authorities, and an incorrect interpretation by us of tax laws and regulations may have a material adverse effect on us.
The preparation of our tax returns requires the use of estimates and interpretations of complex tax laws and regulations and is subject to review by taxing authorities. We are subject to the income tax laws of Brazil. These tax laws are complex and subject to different interpretations by the taxpayer and relevant governmental taxing authorities, leading to disputes which are sometimes subject to prolonged evaluation periods until a final resolution is reached. In establishing a provision for income tax expense and filing returns, we must make judgments and interpretations about the application of these inherently complex tax laws. If the judgment, estimates and assumptions we use in preparing our tax returns are subsequently found to be incorrect, there could be a material adverse effect on us. The interpretations of Brazilian taxing authorities are unpredictable and frequently involve litigation, which introduces further uncertainty and risk as to tax expense.
Changes in taxes and other fiscal assessments may adversely affect us.
The Brazilian government regularly enacts reforms to the tax and other assessment regimes to which we and our customers are subject. Such reforms include changes in tax rates and, occasionally, enactment of temporary levies, the proceeds of which are earmarked for designated governmental purposes. The effects of these changes and any other changes that result from enactment of additional tax reforms cannot be quantified and there can be no assurance that any such reforms would not have an adverse effect upon our business. Furthermore, such changes may produce uncertainty in the financial system, increasing the cost of borrowing and contributing to the increase in our non-performing credit portfolio.
Changes in tax policy, including the creation of new taxes, may occur with relative frequency and such changes could have an adverse effect on our financial position or operating results. For example, in 2011, the Brazilian government established the Tax on Financial Transactions (the “IOF Tax”). It applied at a rate of 1.0% per day on the notional value of increased foreign exchange exposure, but has currently reduced the rate to zero with respect to foreign exchange. The IOF Tax rates applicable to local loans to individuals and legal entities have been frequently adjusted (both increases and decreases) in recent years. The currently applicable IOF Tax rates applicable to local loans are approximately 1.5% for legal entities and 3.0% for individuals, but could change in the future. We cannot estimate the impact that a change in tax laws or tax policy could have on our operations. For example, the IOF Tax is a tool used by the Brazilian government to regulate economic activity, which does not directly impact our results of operations, though changes in the IOF Tax can impact our business volumes generally.
Also, the Brazilian Congress may discuss broad tax reforms in Brazil to improve the efficiency of allocation of the economic resources, as proposed by the executive branch of the Brazilian federal government. Major tax reforms in Brazil have been discussed over the last few years. We cannot predict if tax reforms will be implemented in the future. The effects of these changes, if enacted, and any other changes that could result from the enactment of additional tax reforms, cannot be quantified.
Our loan and investment portfolios are subject to risk of prepayment, which could have a material adverse effect on us.
Our fixed rate loan and investment portfolios are subject to prepayment risk, which results from the ability of a borrower or issuer to pay a debt obligation prior to maturity. Generally, in a low interest rate environment, prepayment activity increases, which reduces the weighted average lives of our earning assets and could have a material adverse effect on us. We would also be required to amortize net premiums or commissions into income over a shorter period of time, thereby reducing the corresponding asset yield and net interest income. Prepayment risk also has a significant adverse impact on credit card and collateralized mortgage loans, since prepayments could shorten the weighted average life of these assets, which may result in a mismatch in our funding obligations and reinvestment at lower yields. Prepayment risk is inherent to our commercial activity and an increase in prepayments could have a material adverse effect on us.
The credit quality of our loan portfolio may deteriorate and our loan losses reserves could be insufficient to cover our actual loan losses, which could have a material adverse effect on us.
Risks arising from changes in credit quality and the recoverability of loans and amounts due from counterparties are inherent in a wide range of our businesses. Non-performing or low credit quality loans have in the past negatively impacted our results of operations and could do so in the future. In particular, the amount of our reported non-performing loans may increase in the future as a result of growth in our total loan portfolio, including as a result of loan portfolios that we may acquire in the future (the credit quality of which may turn out to be worse than we had anticipated), or other factors, including factors beyond our control, such as adverse changes in the credit quality of our borrowers and counterparties or a general deterioration in economic conditions in Brazil and globally. If we were unable to control the level of our non-performing or poor credit quality loans, this could have a material adverse effect on us.
Our provisions for impairment losses are based on our current assessment of and expectations concerning various factors affecting the quality of our loan portfolio. These factors include, among other things, our borrowers’ financial condition, repayment abilities and repayment intentions, the realizable value of any collateral, the prospects for support from any guarantor, government macroeconomic policies, interest rates and the legal and regulatory environment. Because many of these factors are beyond our control and there is no precise method for predicting loan and credit losses, we cannot assure you that our current or future provisions for impairment losses will be sufficient to cover actual losses. If our assessment of and expectations concerning the abovementioned factors differ from actual developments, if the quality of our total loan portfolio deteriorates, for any reason, or if the future actual losses exceed our estimates of incurred losses, we may be required to increase our provisions for impairment losses, which may adversely affect us. If we were unable to control or reduce the level of our non-performing or poor credit quality loans, this could have a material adverse effect on us.
Economic uncertainty may lead to a contraction in our loan portfolio.
The recent slow growth rate of the Brazilian economy experienced in 2017 and recession in 2015 and 2016, a slowdown in the growth of customer demand, an increase in market competition, changes in governmental regulation and an increase of the SELIC rate in 2015 and 2016 have adversely affected the rate of growth of our loan portfolio in recent years. Ongoing economic uncertainty could adversely affect the liquidity, businesses and financial condition of our customers, as well as lead to a general decline in consumer spending, a rise in unemployment and an increase in household indebtedness. All of this could lead to a decrease in demand for borrowings in general, which could have a material adverse effect on our business.
Liquidity and funding risks are inherent in our business and since our principal sources of funds are short-term deposits, a sudden shortage of funds could cause an increase in costs of funding and an adverse effect on our revenues and our liquidity levels.
Liquidity risk is the risk that we either do not have available sufficient financial resources to meet our obligations as they fall due or can secure them only at excessive cost. This risk is inherent in any retail and commercial banking business and can be heightened by a number of enterprise-specific factors, including over-reliance on a particular source of funding, changes in credit ratings or market-wide phenomena such as market dislocation. Continued constraints in the supply of liquidity, including in inter-bank lending, has affected and may materially and adversely affect the cost of funding our business, and extreme liquidity constraints may affect our current operations and our ability to fulfill regulatory liquidity requirements, as well as limit growth possibilities.
Our cost of obtaining funds is directly related to prevailing interest rates and to our credit spreads. Increases in interest rates and our credit spreads can significantly increase the cost of our funding. Changes in our credit spreads are market-driven and may be influenced by market perceptions of our creditworthiness. Changes to interest rates and our credit spreads occur continuously and may be unpredictable and highly volatile.
Disruption and volatility in the global financial markets could have a material adverse effect on our ability to access capital and liquidity on financial terms acceptable to us. If wholesale markets financing ceases to become available, or becomes excessively expensive, we may be forced to raise the rates we pay on deposits, with a view to attracting more customers, and/or to sell assets, potentially at depressed prices. The persistence or worsening of these adverse market conditions or an increase in base interest rates could have a material adverse effect on our ability to access liquidity and cost of funding.
We rely, and will continue to rely, primarily on commercial deposits as our main source of funding. As of December 31, 2017, 78% of our customer deposits had remaining maturities of one year or less, or were payable on demand, while 22% of our assets have maturities of one year or more, resulting in a mismatch between the maturities of liabilities and the maturities of assets. The ongoing availability of this type of funding is sensitive to a variety of factors outside our control, such as general economic conditions and the confidence of commercial depositors in the economy and in the financial services industry, and the availability and extent of deposit guarantees, as well as competition between banks or with other products, such as mutual funds, for deposits. Any of these factors could significantly increase the amount of commercial deposit withdrawals in a short period of time, thereby reducing our ability to access commercial deposit funding on economically appropriate and reasonable terms, or at all, in the future. If these circumstances were to arise, this could have a material adverse effect on our operating results, financial condition and prospects.
If current facilities were rapidly removed or significantly reduced, this could have a material adverse effect on our ability to access liquidity and on our funding costs.
Our ability to manage our funding base may also be affected by changes to the regulation on compulsory reserve requirements in Brazil. For more information on the rules on compulsory reserve requirements, see “Item 4. Information on the Company—B. Business Overview—Regulation and Supervision—Other Applicable Laws and Regulations—Compulsory Reserve Requirements.”
We cannot assure you that in the event of a sudden or unexpected shortage of funds in the banking system, we will be able to maintain levels of funding without incurring high funding costs, a reduction in the term of funding instruments or the liquidation of certain assets. If this were to happen, we could be materially adversely affected.
Our cost of funding is affected by our credit ratings and any risks may have an adverse effect on our credit ratings and our cost of funds. Any downgrade in Brazil’s, our controlling shareholder’s, or our credit rating, would likely increase our cost of funding, requiring us to post additional collateral under some of our derivative contracts and adversely affect our interest margins and results of operations.
Credit ratings affect the cost and other terms upon which we are able to obtain funding. Rating agencies regularly evaluate us and their ratings of our long-term debt are based on a number of factors, including our financial strength, conditions that generally affect the financial services industry and the economic environment in which we operate. In addition, due to the methodology of the main rating agencies, our credit rating is affected by the rating of Brazilian sovereign debt and the rating of our controlling shareholders. If Brazil’s sovereign debt or the debt of our controlling shareholder is downgraded, our credit rating would also likely be downgraded similarly.
Any downgrade in Brazil’s sovereign credit ratings, those of our controlling shareholder, or in our ratings, would likely increase our borrowing costs. For example, a ratings downgrade could adversely affect our ability to sell or market certain of our products, such as subordinated securities, engage in certain longer-term and derivatives transactions, and retain our customers, particularly customers who need a minimum rating threshold in order to invest. In addition, under the terms of certain of our derivative contracts and other financial commitments, we may be required to maintain a minimum credit rating or terminate such contracts or require the posting of collateral. Any of these results of a ratings downgrade could reduce our liquidity and have an adverse effect on us, including our operating results and financial condition.
While certain potential impacts of these downgrades are contractual and quantifiable, the full consequences of a credit rating downgrade are inherently uncertain, as they depend upon numerous dynamic, complex and inter-related factors and assumptions, including market conditions at the time of any downgrade, whether any downgrade of our long-term credit rating precipitates downgrades to our short-term credit rating, and assumptions about the potential behaviors of various customers, investors and counterparties. Actual outflows could be higher or lower than any hypothetical examples, depending upon certain factors including which credit rating agency downgrades our credit rating, any management or restructuring actions that could be taken to reduce cash outflows and the potential liquidity impact from loss of unsecured funding (such as from money market funds) or loss of secured funding capacity. Although unsecured and secured funding stresses are included in our stress testing scenarios and a portion of our total liquid assets is held against these risks, a credit rating downgrade could still have a material adverse effect on us.
On October 2, 2015, S&P upgraded Spain’s sovereign rating to BBB+ from BBB with a stable outlook. In February 2016, Moody’s revised Spain’s sovereign outlook to stable from positive with rating at Baa2. Santander Spain’s long-term debt is currently rated investment grade by the major rating agencies, such credit ratings currently being: A3 with a stable outlook by Moody’s and A- with a stable outlook by Fitch Ratings and S&P.
S&P lowered Brazil’s credit rating in September 2015 from BBB- to BB+ (a non-investment grade rating), and then again in mid-February 2016 from BB+ to BB with a negative outlook, mainly due to the continuing weak economic conditions of Brazil, political instability, the ongoing “Lava Jato” investigations and uncertainty as to whether the Brazilian government will enact reforms in the 2016 federal budget to improve the country’s fiscal accounts and economic situation. In addition, Brazil was further downgraded by S&P to BB- with a stable outlook in January 2018 as a result of the failure of the current Brazilian government to approve certain pension reforms. Fitch Ratings also lowered Brazil’s credit rating in December 2015 from BBB to BB+ (a non-investment grade rating), and then again in May 2016 from BB+ to BB, citing Brazil’s worsening economic outlook and growing political crisis as reasons for downgrading the country. In February 2018 Fitch further downgraded Brazil to BB-. Moody’s lowered Brazil’s credit rating from Baa2 to Baa3 (the lowest investment grade rating) in August 2015 and then to Ba2 (a non-investment grade rating) with a negative outlook in February 2016. Brazil’s sovereign rating is currently rated by the three major risk rating agencies as follows: BB- by S&P and Fitch Ratings and Ba2 by Moody’s. Any further downgrade in Brazil’s sovereign rating would likely increase our funding costs and adversely affect us, including our asset quality.
As a result of the lowering of Brazil’s sovereign credit rating, our long-term foreign currency credit rating was lowered during the course of 2015 and in early 2016: on August 12, 2015, Moody’s lowered our credit rating from Baa2 to Baa3, lowering it again on February 25, 2016 to Ba3 and on March and May 2017 it affirmed the rating at Ba3. On September 10, 2015, S&P lowered our credit rating from BBB- to BB+ (a non-investment grade rating), lowering it again on February 17, 2016 to BB and maintaining the rating at BB in August 2017 while changing the
outlook to negative. In January 2018 Santander Brasil was downgraded by S&P to BB- with a stable outlook from BB with a negative outlook. We are currently rated as follows: BB- by S&P and Ba3 by Moody’s, both with a stable outlook. Any further downgrade in our long-term debt in foreign currency would likely increase our funding costs and adversely affect our interest margins and results of operations.
We cannot assure you that the rating agencies will maintain their current ratings or outlooks, or with regard to those rating agencies that have a negative outlook with respect to us or our controlling shareholder, there can be no assurances that such agencies will revise such outlooks upward. Our failure to maintain favorable ratings and outlooks would likely increase our cost of funding and adversely affect our interest margins and results of operations.
The effectiveness of our credit risk management is affected by the quality and scope of information available in Brazil.
In assessing customers’ creditworthiness, we rely largely on the credit information available from our own internal databases, certain publicly available customer credit information, information relating to credit contracted, which is provided by the Brazilian Central Bank and other sources. Due to limitations in the availability of information and the developing information infrastructure in Brazil, our assessment of credit risk associated with a particular customer may not be based on complete, accurate or reliable information. In addition, we cannot assure you that our credit scoring systems collect complete or accurate information reflecting the actual behavior of customers or that their credit risk can be assessed correctly. Without complete, accurate and reliable information, we have to rely on other publicly available resources and our internal resources, which may not be effective. As a result, our ability to effectively manage our credit risk and subsequently our allowances for impairment losses may be materially adversely affected.
Social and environmental risks may have a material adverse effect on us.
As part of the risk analysis we undertake with respect to our customers, we take into account environmental factors (such as soil and water contamination, vegetation suppression or lack of environmental authorizations) as well as social factors (such as the existence of working conditions akin to slavery). Any failure by us to identify and accurately assess these factors and the potential risks to us before entering into proposed transactions with our customers may result in damage to our image and reputation as well as have a material adverse effect on our business, results of operations and financial condition.
The value of the collateral securing our loans may not be sufficient, and we may be unable to realize the full value of the collateral securing our loan portfolio.
The value of the collateral securing our loan portfolio may fluctuate or decline due to factors beyond our control, including, among others, macroeconomic factors globally and in Brazil, as well as force majeure events. We may also not have sufficiently recent information on the value of collateral, which may result in an inaccurate assessment for impairment losses of our loans secured by such collateral. If any of the above were to occur, we may need to make additional provisions to cover actual impairment losses of our loans, which may materially and adversely affect our results of operations and financial condition.
We are subject to market, operational and other related risks associated with our derivative transactions and our investment positions that could have a material adverse effect on us.
We enter into derivative transactions for trading purposes, as well as for hedging purposes. We are subject to market, credit and operational risks associated with these transactions, including basis risk (the risk of loss associated with variations in the spread between the asset yield and the funding and/or hedge cost) and credit or default risk (the risk of insolvency or other inability of the counterparty to a particular transaction to perform its obligations thereunder, including providing sufficient collateral). We also hold securities in our own portfolio as part of our investment and hedging strategies.
Financial instruments, including derivative instruments and securities represented 23.3% of our total assets as of December 31, 2017. Any realized or unrealized future gains or losses from these investments or hedging strategies could have a significant impact on our income. These gains and losses, which we account for when we sell or mark to market investments in financial instruments, can vary considerably from one period to another. If, for example, we enter into derivatives transactions to protect ourselves against decreases in the value of thereal or in interest
rates and thereal instead increases in value or interest rates increase, we may incur financial losses. We cannot forecast the amount of gains or losses in any future period, and the variations experienced from one period to another do not necessarily provide a meaningful forward-looking reference point. Gains or losses in our investment portfolio may create volatility in net revenue levels, and we may not earn a return on our consolidated investment portfolio, or on a part of the portfolio in the future. Any losses on our securities and derivative financial instruments could materially and adversely affect our operating income and financial condition. In addition, any decrease in the value of these securities and derivatives portfolios may result in a decrease in our capital ratios, which could impair our ability to engage in lending activity at the levels we currently anticipate.
The execution and performance of these transactions depend on our ability to maintain adequate control and administration systems. Our ability to adequately monitor, analyze and report derivative transactions continues to depend, largely, on our information technology systems. These factors further increase the risks associated with these transactions and could have a material adverse effect on us.
Failure to successfully implement and continue to improve our risk management policies, procedures and methods, including our credit risk management system, could materially and adversely affect us, and we may be exposed to unidentified or unanticipated risks.
The management of risk is an integral part of our activities. We seek to monitor and manage our risk exposure through a variety of separate but complementary financial, credit, market, operational, compliance and legal reporting systems. We employ a broad and diversified set of risk monitoring and risk mitigation techniques, which may not be fully effective in mitigating our risk exposure in all economic market environments or against all types of risk, including risks that we fail to identify or anticipate.
We use certain qualitative tools and metrics for managing market risk, including our use of value at risk, or “VaR,” and statistical modeling tools, which are based upon our use of observed historical market behavior. We apply statistical and other tools to these observations to arrive at quantifications of our risk exposures. These qualitative tools and metrics may fail to predict future risk exposures. These risk exposures could, for example, arise from factors we did not anticipate or correctly evaluate in our statistical models. This would limit our ability to manage our risks. Our losses thus could be significantly greater than the historical measures indicate. In addition, our quantified modeling does not take all risks into account. Our more qualitative approach to managing those risks could prove insufficient, exposing us to material unanticipated losses. We could face adverse consequences as a result of decisions, which may lead to actions by management, based on models that are poorly developed, implemented or used, or as a result of the modeled outcome being misunderstood or the use of such information for purposes for which it was not designed. In addition, if existing or potential customers or counterparties believe our risk management is inadequate, they could take their business elsewhere or seek to limit their transactions with us. This could have a material adverse effect on our reputation, as well as our revenues and profits. We also face risks from operational losses that may occur due to inadequate processes, people and systems failures or even from external events like natural disasters, terrorism, robbery and vandalism. Despite the operational risk management process supported by the Board and the internal audit tests, the internal controls and procedures effectiveness may not be fully adequate or sufficient to avoid all the known and unknown operational risks. We have suffered losses from operational risk in the past, including losses related to the migration of customer accounts in connection with acquisitions, phishing scams perpetuated by third parties, and information system platform upgrades. There can be no assurance that we will not suffer material losses from operational risk in the future, including losses related to security breaches.
As a commercial bank, one of the main types of risks inherent in our business is credit risk. For example, an important feature of our credit risk management system is to employ an internal credit rating system to assess the particular risk profile of a customer. As this process involves detailed analyses of the customer, taking into account both quantitative and qualitative factors, it is subject to human or IT systems errors. In exercising their judgment on current or future credit risk behavior of our customers, our employees may not always be able to assign an accurate credit rating, which may result in our exposure to higher credit risks than indicated by our risk rating system.
Failure to effectively implement, consistently monitor or continuously refine our credit risk management system may result in an increase in the level of non-performing loans and a higher risk exposure for us, which could have a material adverse effect on us.
Failure to adequately protect ourselves against risks relating to cyber-security could materially and adversely affect us.
We face various cyber-security risks, including but not limited to: penetration of our information technology systems and platforms by ill-intentioned third parties, infiltration of malware (such as computer viruses) into our systems, contamination (whether intentional or accidental) of our networks and systems by third parties with whom we exchange data, unauthorized access to confidential customer and/or proprietary data by persons inside or outside of our organization, and cyber-attacks causing systems degradation or service unavailability that may result in business losses.
We may not be able to successfully protect our information technology systems and platforms against such threats. We have seen in recent years computer systems of companies and organizations being targeted, not only by cyber criminals, but also by activists and rogue states. We have been and continue to be subject to a range of cyber-attacks, such as denial of service, malware and phishing. Cyber-attacks could give rise to the loss of significant amounts of customer data and other sensitive information, as well as significant levels of liquid assets (including cash). In addition, cyber-attacks could give rise to the disablement of our information technology systems used to service our customers. As attempted attacks continue to evolve in scope and sophistication, we may incur significant costs in our attempt to modify or enhance our protective measures against such attacks, or to investigate or remediate any vulnerability or resulting breach, or in communicating cyber-attacks to our customers.
We are also subject to regulation governing cybersecurity risks that is fragmented and constantly evolving. Although currently there are no specific rules in effect regulating cybersecurity policies and requirements for data processing, storage and cloud computing services contracted by financial institutions and other entities. In late 2017 the Brazilian Central Bank submitted a draft of the regulation on cybersecurity for financial institutions to public consultation, and a final rule is expected to be issued during 2018. A failure to implement all or some of these new global and local regulations, that in some cases have severe sanctions regimes, could have a material adverse effect on us. If we fail to effectively manage our cyber security risk, for example, by failing to update our systems and processes in response to new threats, this could harm our reputation and adversely affect our operating results, financial condition and prospects through the payment of customer compensation, regulatory penalties and fines and/or through the loss of assets. In addition, we may also be subject to cyber-attacks against critical infrastructures of Brazil. Our information technology systems are dependent on such critical infrastructure and any cyber-attack against such critical infrastructure could negatively affect our ability to service our customers. As we do not operate such critical infrastructure, we have limited ability to protect our information technology systems from the adverse effects of such a cyber-attack. See “Item 4. Information on the Company—B. Business Overview—Technology and Commercial Transformation.”
We are subject to counterparty risk in our business.
We are exposed to counterparty risk in addition to credit risks associated with lending activities. Counterparty risk may arise from, for example, investing in securities of third parties, entering into derivative contracts under which counterparties have obligations to make payments to us, or executing securities, futures, currency or commodity trades from proprietary trading activities that fail to settle at the required time due to non-delivery by the counterparty or systems failure by clearing agents, clearing houses or other financial intermediaries.
We routinely transact with counterparties in the financial services industry, including brokers and dealers, commercial banks, investment banks, mutual funds, hedge funds and other institutional customers. Defaults by, and even rumors or questions about the solvency of, certain financial institutions and the financial services industry generally have led to market-wide liquidity problems and could lead to losses or defaults by other institutions. Many of the routine transactions we enter into expose us to significant credit risk in the event of default by one of our significant counterparties.
If these risks give rise to losses, this could materially and adversely affect us. We have a diversified loan portfolio, with no specific concentration exceeding 10% of total loans. Furthermore, currently, 1.2% of our loan portfolio is allocated to our largest debtor and 7.6% to our next 10 largest debtors. However, we cannot assure this will continue to be the case. If counterparty risks give rise to losses, this could materially and adversely affect our results of operations and financial condition.
The financial problems faced by our customers could adversely affect us.
Market turmoil and economic recession could materially and adversely affect the liquidity, credit ratings, businesses and/or financial conditions of our borrowers, which could in turn increase our non-performing loan ratios, impair our loan and other financial assets and result in decreased demand for borrowings in general. We have credit exposure to borrowers which have entered or may shortly enter into bankruptcy or similar proceedings. We may experience material losses from this exposure.
In addition, our customers may further significantly decrease their risk tolerance to non-deposit investments such as stocks, bonds and mutual funds, which would adversely affect our fee and commission income. We may also be adversely affected by the negative effects of the heightened regulatory environment on our customers due to the high costs associated with regulatory compliance and proceedings. Any of the conditions described above could have a material adverse effect on us.
We engage in transactions with related parties that others may not consider to be on an arm’s length basis.
We and our affiliates have entered into a number of services agreements pursuant to which we render and/or receive services, such as administrative, accounting, finance, treasury, legal services and others from (or provide such services to) related parties. We are likely to continue to engage in transactions with such related parties (including our controlling shareholder) that others may not consider to be on an arm’s length basis. Future conflicts of interests between us and any of our affiliates, or among our affiliates, may arise, which conflicts may not be resolved in our favor. See “Item 7. Major Shareholders and Related Party Transactions.”
Changes in accounting standards could impact reported earnings.
The accounting standard setters and other regulatory bodies periodically change the financial accounting and reporting standards that govern the preparation of our consolidated financial statements. These changes can materially impact how we record and report our financial condition and results of operations. In some cases, we could be required to apply a new or revised standard retroactively, resulting in the restatement of prior period financial statements.
Our financial statements are based in part on assumptions and estimates which, if inaccurate, could cause material misstatement of the results of our operations and financial position.
The preparation of financial statements requires management to make judgments, estimates and assumptions that affect the reported amounts of assets, liabilities, income and expenses. Due to the inherent uncertainty in making estimates, actual results reported in future periods may be based upon amounts which differ from those estimates. Estimates, judgments and assumptions are continually evaluated and are based on historical experience and other factors, including expectations of future events that are believed to be reasonable under the circumstances. Revisions to accounting estimates are recognized in the period in which the estimate is revised and in any future periods affected. The accounting policies deemed critical to our results and financial position, based upon materiality and significant judgments and estimates, include impairment of loans and advances, goodwill impairment, valuation of financial instruments, impairment of available-for-sale financial assets, deferred tax assets provision and pension obligation for liabilities.
If the judgment, estimates and assumptions we use in preparing our consolidated financial statements are subsequently found to be incorrect, there could be a material effect on our results of operations and a corresponding effect on our funding requirements and capital ratios.
Our business is highly dependent on the proper functioning of information technology systems.
Our business is highly dependent on the ability of our information technology systems to accurately process a large number of transactions across numerous and diverse markets and products in a timely manner, and on our ability to rely on our digital technologies, computer and email services, software and networks, as well as on the secure processing, storage and transmission of confidential data and other information in our computer systems and networks. The proper functioning of our financial control, risk management, accounting, customer service and other data processing systems is critical to our business and our ability to compete effectively.
We do not operate all of our redundant systems on a real-time basis and cannot assure you that our business activities would not be materially disrupted if there were a partial or complete failure of any of these primary information technology systems or communication networks. Such failures could be caused by, among other things, major natural catastrophes, software bugs, computer virus attacks or conversion errors due to system upgrading. Such failures could be caused by, among other things, major natural catastrophes, software bugs, computer virus attacks, conversion errors due to system upgrading, security breaches caused by unauthorized access to information or systems, or intentional malfunctions or loss or corruption of data, software, hardware or other computer equipment. Any such failures could disrupt our business and impair our ability to provide our services and products effectively to our customers, which could adversely affect our reputation as well as our business, results of operations and financial condition.
Our ability to remain competitive and achieve further growth will depend in part on our ability to upgrade our information technology systems and increase our capacity on a timely and cost effective basis. We must continually make significant investments and improvements in our information technology infrastructure in order to remain competitive. We cannot assure you that in the future we will be able to maintain the level of capital expenditures necessary to support the improvement or upgrading of our information technology infrastructure. Any substantial failure to improve or upgrade our information technology systems effectively or on a timely basis could materially and adversely affect us.
Failure to protect personal information could adversely affect us.
We manage and hold confidential personal information of customers, including sensitive personal data, in the ordinary course of our banking operations. Although we have procedures and controls to safeguard personal information in our possession, unauthorized disclosures or security breaches could subject us to legal actions and administrative sanctions as well as damages that could materially and adversely affect our operating results, financial condition and prospects. Further, our business is exposed to risk from potential non-compliance with policies, employee misconduct or negligence and fraud, which could result in regulatory sanctions and serious reputational or financial harm. It is not always possible to deter or prevent employee misconduct, and the precautions we take to detect and prevent this activity may not always be effective. We also face the risk that the design of our controls and procedures prove to be inadequate or are circumvented such that the data we hold is incomplete, not recoverable or not securely stored. In addition, we may be required to report events related to information security issues (including any cyber security issues), events where customer information may be compromised, unauthorized access and other security breaches, to the relevant regulatory authorities. Any material disruption or slowdown of our systems could cause information, including data related to customer requests, to be lost or to be delivered to our customers with delays or errors, which could reduce demand for our services and products and could materially and adversely affect us. In addition, if we cannot maintain an effective and secure electronic data and information management system or we fail to maintain complete physical and electronic records, this could result in regulatory sanctions and serious reputational and financial harm to us.
Damage to our reputation could cause harm to us.
Maintaining a positive reputation is critical to our attracting and maintaining customers, investors and employees. Damage to our reputation can therefore cause significant harm to our business and prospects. Harm to our reputation can arise from numerous sources, including, among others, employee misconduct, including the possibility of fraud perpetrated by our employees, litigation or regulatory outcomes, failure to deliver minimum standards of service and quality, compliance failures, unethical behavior, failures of our information technology systems and the activities of customers and counterparties. Further, negative publicity regarding us, whether or not true, may result in harm to us.
Actions by the financial services industry generally or by certain members of, or individuals in, the industry can also affect our reputation. For example, the role played by financial services firms in the financial crisis and the seeming shift toward increasing regulatory supervision and enforcement has caused public perception of us and others in the financial services industry to decline.
We could suffer significant reputational harm if we fail to identify and manage potential conflicts of interest properly. The failure, or perceived failure, to adequately address conflicts of interest could affect the willingness of customers to deal with us, or give rise to litigation or enforcement actions against us. Therefore, there can be no assurance that conflicts of interest will not arise in the future that could cause material harm to us.
We plan to continue to expand our operations and we may not be able to manage such growth effectively, which could have an adverse impact on us, including our profitability.
We allocate management and planning resources to develop strategic plans for organic growth and to identify possible acquisitions and disposals and areas for restructuring our businesses. From time to time, we evaluate acquisition and partnership opportunities that we believe offer additional value to our shareholders and are consistent with our business strategy. We cannot provide assurance that we will, in all cases, be able to manage our growth effectively or deliver our strategic growth objectives. Challenges that may result from our strategic growth decisions include our ability to:
| · | manage efficiently the operations and employees of expanding businesses; |
| · | maintain or grow our existing customer base; |
| · | assess the value, strengths and weaknesses of investment or acquisition candidates, including local regulation that can reduce or eliminate expected synergies; |
| · | finance and integrate strategic investments or acquisitions; |
| · | align our current information technology systems adequately with those of an enlarged group; |
| · | apply our risk management policy effectively to an enlarged group; and |
| · | manage a growing number of entities without over-committing management or losing key personnel. |
Any failure to manage growth effectively could have a material adverse effect on our operating results, financial condition and prospects.
In addition, any acquisition or venture could result in the loss of key employees and inconsistencies in standards, controls, procedures and policies.
Moreover, the success of the acquisition or venture will at least in part be subject to a number of political, economic and other factors that are beyond our control. Any of these factors, individually or collectively, could have a material adverse effect on us.
Risks Relating to Our Controlling Shareholder, Our Units and American Depositary Receipts (ADRs)
Our ultimate controlling shareholder has a great deal of influence over our business and its interests could conflict with ours.
Santander Spain, our ultimate controlling shareholder, currently owns, directly and indirectly, approximately 89.5% of our total capital (not including the shares held by Banco Madesant – Sociedade Unipessoal). Due to its share ownership, our controlling shareholder has the power to control us and our subsidiaries, including the power to:
| · | elect a majority of our directors that appoint our executive officers, set our management policies and exercise overall control over our company and subsidiaries; |
| · | influence the appointment of our principal officers; |
| · | declare the payment of any dividends; |
| · | agree to sell or otherwise transfer its controlling stake in our company; and |
| · | determine the outcome of substantially all actions requiring shareholder approval, including amendments of our by-laws, transactions with related parties, corporate reorganizations, acquisitions and dispositions of assets, and dividends. |
In December 2012, primarily in response to the requirements of the European Banking Authority, Santander Spain adopted a corporate governance framework (Marco de Gobierno Interno del Grupo Santander) to organize and standardize the corporate governance practices of certain companies of Santander Group (including us). We adopted this corporate governance framework in May 2013, subject to the precedence of applicable Brazilian laws, regulations and limitations, such as banking secrecy laws, as well as our corporate governance practices, including our policies for related party transactions and for disclosure of material acts and facts. See “Item 16G. Corporate Governance.”
On July 27, 2015, as a result of the new requirements of the European Central Bank, the Bank of Spain and the regulators in different jurisdictions, our parent, Santander Spain established a new corporate governance model for its subsidiaries, with the purpose of setting forth a clear and transparent conceptual framework to govern their relationship. Our Board of Directors approved the new corporate governance model on January 26, 2016.
We operate as a stand-alone subsidiary within the Santander Group. Our controlling shareholder has no liability for our banking operations, except for the amount of its holdings of our capital stock and for other specific limited circumstances under Brazilian law. The interests of Santander Spain may differ from the interests of our other shareholders, and the concentration of control in Santander Spain will limit other stockholders’ ability to influence corporate matters. As a result, we may take actions that our other shareholders do not view as beneficial.
Our status as a controlled company and a foreign private issuer exempts us from certain of the corporate governance standards of the New York Stock Exchange (“NYSE”), limiting the protections afforded to investors.
We are a “controlled company” and a “foreign private issuer” within the meaning of the NYSE corporate governance standards. Under the NYSE rules, a controlled company is exempt from certain NYSE corporate governance requirements. In addition, a foreign private issuer may elect to comply with the practice of its home country and not to comply with certain NYSE corporate governance requirements, including the requirements that (i) a majority of the board of directors consists of independent directors, (ii) a nominating and corporate governance committee be established that is composed entirely of independent directors and has a written charter addressing the committee’s purpose and responsibilities, (iii) a compensation committee be established that is composed entirely of independent directors and has a written charter addressing the committee’s purpose and responsibilities and (iv) an annual performance evaluation of the nominating and corporate governance and compensation committees be undertaken. Although we have similar practices, they do not entirely conform to the NYSE requirements, therefore we currently use these exemptions and intend to continue using them. Accordingly, you will not have the same protections afforded to shareholders of companies that are subject to all NYSE corporate governance requirements.
The liquidity and market prices of the units and the ADRs may be adversely affected by the cancelation of units or substantial sale of units and shares in the market.
Holders of units may present these units or some of these units for cancellation in Brazil in exchange for the common shares and preferred shares underlying these units. If unit holders present a significant number of units for cancellation in exchange for the underlying common shares and preferred shares, the liquidity and price of the units and ADRs may be materially and adversely affected.
Also, sales of a substantial number of our units or our common shares or preferred shares in the future, or the anticipation of such sales, could negatively affect the market prices of our units and ADRs. If, in the future, substantial sales of units or common shares or preferred shares are made by existing or future holders, the market prices of the ADRs may decrease significantly. As a result, holders of ADRs may not be able to sell their ADRs at or above the price they paid for them.
The relative volatility and limited liquidity of the Brazilian securities markets may negatively affect the liquidity and market prices of the units and the ADRs.
The B3 is significantly less liquid than the NYSE or other major exchanges in the world. As of December 31, 2017, the aggregate market capitalization of the B3 was equivalent to approximately R$3.2 trillion (U.S.$955.6 billion) and the top ten stocks in terms of trading volume accounted for approximately 44% of all shares traded on B3 in the year ended December 31, 2017. In contrast, as of December 31, 2017, the aggregate market capitalization of the NYSE was approximately U.S.$19.6 trillion. Although any of the outstanding shares of a listed company may trade on the B3, in most cases fewer than half of the listed shares are actually available for trading by the public, the
remainder being held by small groups of controlling persons, government entities or a principal shareholder. The relative volatility and limited liquidity of the Brazilian securities markets may substantially limit your ability to sell the units or ADRs at the time and price you desire and, as a result, could negatively impact the market price of these securities.
If securities analysts do not publish research or reports about our business or if they downgrade our ADRs or shares or our sector, the price of our ADRs and/or our shares price and trading volume could decline.
The trading market for our ADRs and our shares has been affected in part by the research and reports that industry and financial analysts publish about us or our business. We do not control these analysts. Furthermore, if one or more of the analysts who cover us downgrade our ADRs, our shares or our industry, change their views regarding the shares of any of our competitors, or other companies in our sector, or publish inaccurate or unfavorable research about our business, the market price of our ADRs and/or shares could decline. If one or more of these analysts ceases coverage of us or fails to publish reports on us regularly, we could lose visibility in the market, which in turn could cause our ADR and/or share price or trading volume to decline.
The economic value of your investment may be diluted.
We may, from time to time, need additional funds and we may issue additional units or shares. Any additional funds obtained by such a capital increase may dilute your interest in our company.
Discontinuation of the current corporate governance practices may negatively affect the price of our ADRs and units.
After completion of the voluntary exchange offers by Santander Spain in Brazil and in the United States (respectively, the “Brazilian Exchange Offer” and the “U.S. Exchange Offer”) for the acquisition of up to the totality of our shares that were not held by the Santander Group at that time, we are no longer subject to the obligations of the special listing segment of B3 known as Corporate Governance Level 2 (the “Level 2 Segment”). Currently, we voluntarily comply with certain of the corporate governance requirements for companies listed on the Level 2 Segment.
Discontinuation, in whole or in part, of our existing corporate governance practices or minimum protections may adversely affect your rights as a security holder and may result in a decrease of the price of our shares, units and ADRs.
Holders of our units and our ADRs may not receive any dividends or interest on stockholders’ equity.
According to our By-Laws, we must generally pay our shareholders at least 25.0% of our annual net income as dividends or interest on stockholders’ equity, as calculated and adjusted under Brazilian Corporate Law (“adjusted net income”), which may differ significantly from our net income as determined under IFRS. This adjusted net income may be used to increase capital, used to absorb losses or otherwise retained as allowed under Brazilian Corporate Law and may not be available to be paid as dividends or interest on stockholders’ equity. Additionally, Brazilian Corporate Law allows a publicly traded company, like ours, to suspend the mandatory distribution of dividends and interest on stockholders’ equity in any particular year if our board of directors informs our shareholders that such distributions would be inadvisable in view of our financial condition or cash availability. We paid R$6.2 billion, R$5.3 billion and R$6.3 billion (R$1.65, R$1.40 and R$1.68 per unit, respectively) as dividends and interest on stockholders’ equity (considering gross value) in 2015, 2016 and 2017, respectively, in accordance with our dividend policy, but there can be no assurance that dividends and interest on stockholders’ equity will be paid in future. We are also subject to Brazilian banking regulations that may limit the payment of dividends or interest on stockholders’ equity. See “Item 8. Financial Information—A. Consolidated Statements and Other Financial Information—History of Payment of Dividends and Interest Attributable to Stockholders’ Equity.”
Holders of ADRs may find it difficult to exercise voting rights at our stockholders’ meetings.
Holders of ADRs will not be our direct shareholders and will be unable to enforce directly the rights of shareholders under our By-Laws and Brazilian Corporate Law. Holders of ADRs may exercise voting rights with respect to the units represented by ADRs only in accordance with the deposit agreement governing the ADRs. Holders of ADRs will face practical limitations in exercising their voting rights because of the additional steps involved in our communications with ADR holders. For example, we are required to publish a notice of our
stockholders’ meetings in specified newspapers in Brazil. Holders of our units will be able to exercise their voting rights by attending a stockholders’ meeting in person or voting by proxy. By contrast, holders of ADRs will receive notice of a stockholders’ meeting by mail from the ADRs depositary following our notice to the depositary requesting the depository to do so. To exercise their voting rights, holders of ADRs must instruct the ADR depositary on a timely basis on how they wish to vote. This voting process necessarily will take longer for holders of ADRs than for holders of our units or shares. If the ADR depositary fails to receive timely voting instructions for all or part of the ADRs, the depositary will assume that the holders of those ADRs are instructing it to give a discretionary proxy to a person designated by us to vote their ADRs, except in limited circumstances.
Holders of ADRs also may not receive the voting materials in time to instruct the depositary to vote the units underlying their ADRs. In addition, the depositary and its agents are not responsible for failing to carry out voting instructions of the holders of ADRs or for the manner of carrying out those voting instructions. Accordingly, holders of ADRs may not be able to exercise voting rights, and they will have little, if any, recourse if the units underlying their ADRs are not voted as requested.
Holders of ADRs could be subject to Brazilian income tax on capital gains from sales of ADRs.
Law 10,833 of December 29, 2003 provides that the disposal of assets located in Brazil by a non-resident to either a Brazilian resident or a non-resident is subject to taxation in Brazil, regardless of whether the disposal occurs outside or within Brazil. This provision results in the imposition of income tax on the gains arising from a disposal of our units by a non-resident of Brazil to another non-resident of Brazil. It is unclear whether ADRs representing our units, which are issued by the ADR depositary outside Brazil, will be deemed to be “property located in Brazil” for purposes of this law. We believe ADRs do not qualify as property located in Brazil and, thus, should not be subject to Brazilian income tax. Nevertheless, there is no judicial guidance as to the application of Law 10,833 of December 29, 2003 and, accordingly, we are unable to predict whether Brazilian courts may decide that it applies to dispositions of our ADRs between non-residents of Brazil. However, in the event that the disposition of assets is interpreted to include a disposition of our ADRs, this tax law would accordingly impose withholding taxes on the disposition of our ADRs by a non-resident of Brazil to another non-resident of Brazil. See “Item 10. Additional Information—E. Taxation—Brazilian Tax Considerations.”
Any gain or loss recognized by a U.S. taxpayer will generally be treated as U.S. source gain or loss. A U.S. taxpayer would not be able to credit any Brazilian tax imposed on the disposition of our units or ADRs against such person’s U.S. federal income tax liability, unless such credit can be applied (subject to applicable limitations) against tax due on other income of such person from foreign sources.
Our corporate disclosure may differ from disclosure regularly published by issuers of securities in other countries, including the United States.
Issuers of securities in Brazil are required to make public disclosures that are different from, and that may be reported under presentations that are not consistent with, disclosures required in other countries, including the United States. In particular, for regulatory purposes, we currently prepare and will continue to prepare and make available to our shareholders statutory financial statements in accordance with IFRS as issued by the IASB and Brazilian GAAP, both of which differ from U.S. GAAP in a number of respects. In addition, as a foreign private issuer, we are not subject to the same disclosure requirements in the United States as a domestic U.S. registrant under the Securities Exchange Act of 1934, as amended (the “Exchange Act”), including the requirements to prepare and issue quarterly reports, the proxy rules applicable to domestic U.S. registrants under Section 14 of the Exchange Act or the insider reporting and short-swing profit rules under Section 16 of the Exchange Act. Accordingly, the information about us available to you will not be the same as the information available to shareholders of a U.S. company and may be reported in a manner with which you are not familiar.
Investors may find it difficult to enforce civil liabilities against us or our directors and officers.
The majority of our directors and officers reside outside of the United States. In addition, all or a substantial portion of our assets and the assets of our directors and officers are located outside of the United States. Although we have appointed an agent for service of process in any action against us in the United States with respect to our ADRs, none of our directors or officers has consented to service of process in the United States or to the jurisdiction of any United States court. As a result, it may be difficult for investors to effect service of process within the United States on such persons.
Judgments of Brazilian courts with respect to our units or ADRs will be payable only in reais.
Our By-Laws provide that we, our shareholders, our directors and officers and the members of our fiscal council shall submit to arbitration any and all disputes or controversies that may arise amongst ourselves relating to, or originating from, the application, validity, effectiveness, interpretation, violations and effects of violations of the provisions of Brazilian Corporate Law, our By-Laws, the rules and regulations of the CMN, the Brazilian Central Bank and the CVM, as well as other rules and regulations applicable to the Brazilian capital markets and the rules and regulations of the Arbitration Regulation of the Market Arbitration Chamber. However, in specific situations, including whenever precautionary motions are needed for protection of rights, the dispute or controversy may have to be brought to a Brazilian court. If proceedings are brought in the courts of Brazil seeking to enforce our obligations in respect of the units or ADRs, we will not be required to discharge our obligations in a currency other thanreais. Under Brazilian exchange control limitations and according to Brazilian laws, an obligation in Brazil to pay amounts denominated in a currency other thanreais may be satisfied in Brazilian currency only at the exchange rate, as determined by the Brazilian Central Bank or competent court, in effect on the date the judgment is obtained, and such amounts are then adjusted to reflect exchange rate variations through the effective payment date. The then prevailing exchange rate may not afford non-Brazilian investors with full compensation for any claim arising out of or related to our obligations under the units or ADRs.
Holders of ADRs may be unable to exercise preemptive rights with respect to our units underlying the ADRs.
Holders of ADRs will be unable to exercise the preemptive rights relating to our units underlying ADRs unless a registration statement under the Securities Act is effective with respect to the shares for which those rights are exercisable or an exemption from the registration requirements of the Securities Act is available. We are not obligated to file a registration statement with respect to the shares relating to these preemptive rights or to take any other action to make preemptive rights available to holders of units or ADRs. We may decide, at our discretion, not to file any such registration statement. If we do not file a registration statement or if we and the ADR depositary decide not to make preemptive rights available to holders of units or ADRs, those holders may receive only the net proceeds from the sale of their preemptive rights by the depositary, or if they are not sold, their preemptive rights will be allowed to lapse.
As a holder of ADRs you will have different shareholders’ rights than do shareholders of companies incorporated in the United States and certain other jurisdictions.
Our corporate affairs are governed by our By-Laws and by Brazilian Corporate Law, which may differ from the legal principles that would apply if we were incorporated in a jurisdiction in the United States or in certain other jurisdictions outside Brazil.
Under Brazilian Corporate Law, holders of the ADRs are not our direct shareholders and will have to exercise their voting rights through the depositary. Therefore, holders of ADRs may have fewer and less well-defined rights to protect their interests relative to actions taken by our board of directors or the holders of our common shares than under the laws of other jurisdictions outside Brazil.
Although Brazilian Corporate Law imposes restrictions on insider trading and price manipulation, the form of these regulations and the manner of their enforcement may differ from that in the U.S. securities markets or markets in certain other jurisdictions. In addition, in Brazil, self-dealing and the preservation of shareholder interests may be regulated differently, which could potentially disadvantage you as a holder of the preferred shares underlying ADRs.
ITEM 4. INFORMATION ON THE COMPANY
4A. History and Development of the Company
General
We are a publicly held corporation (sociedade anônima) of indefinite term, incorporated under Brazilian law on August 9, 1985. Our corporate name is Banco Santander (Brasil) S.A. and our commercial name is Banco Santander. Our headquarters are located in Brazil, in the city of São Paulo, state of São Paulo, at Avenida Presidente Juscelino Kubitschek, 2,041 and 2,235, Bloco A, Vila Olímpia, 04543-011. Our telephone number is 55-11-3553-3300. Documentation of our incorporation is duly registered with the Commercial Registry of the State of São Paulo (Junta Comercial do Estado de São Paulo or JUCESP), under NIRE (Registry Number) 35300332067.
Our agent for service is Mercedes Pacheco, Managing Director – Senior Legal Counsel, Banco Santander, S.A., New York Branch, 45 E. 53rd Street New York, New York 10022.
History
The following figure summarizes the key milestones of our history in Brazil.
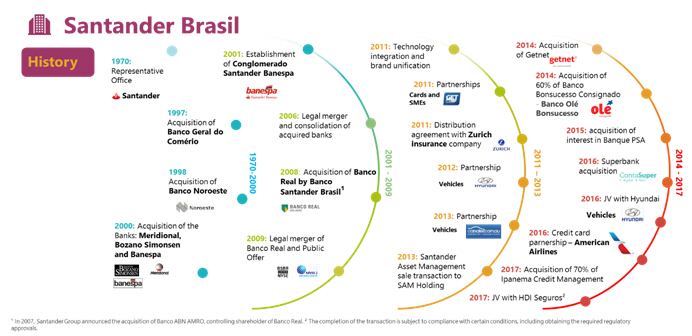
The Santander Group was founded in Spain in 1857 and has expanded globally through a number of acquisitions and the integration of acquired businesses.
In 1957, the Santander Group first entered the Brazilian market through an operating agreement with Banco Intercontinental do Brasil S.A. Since the 1990s, the Santander Group has sought to establish its presence in Latin America, particularly in Brazil. In 1970, the Santander Group opened a representative office in Brazil, followed by its first branch in 1982. We have continued to pursue this strategy through organic growth, as well as acquisitions, among which the most notable are the following:
| · | In November 2000, the Santander Group acquired Banespa, a bank owned by the State of São Paulo, and became one of Brazil’s largest financial groups. |
| · | On July 24, 2008, Santander Spain took indirect share control of Banco Real, which it then absorbed into the Santander Group to further consolidate its investments in Brazil. On August 29, 2008, the acquisition by Santander Brasil of Banco Real’s share capital was approved through a share exchange transaction (incorporação de ações), and Banco Real became a wholly-owned subsidiary of Santander Brasil, before being merged into Santander Brasil on April 30, 2009. |
Since October 7, 2009, our Units, common and preferred shares have been listed and traded on the B3 and our ADRs representing American Depositary Shares (“ADSs”) registered with the SEC under the Securities Act have been listed and traded on the NYSE. For further information, see “Item 9. The Offer and Listing—A. Offering and Listing Details.”
In recent years, we have acquired companies complementary to our business, such as: (i) Getnet Adquirência e Serviços para Meios de Pagamento S.A. (“GetNet”), a technology company specialized in electronic payment solutions; (ii) we formed a joint-venture in the payroll loan and payroll credit card loan segments known as Banco Olé Bonsucesso Consignado; (iii) we entered into a partnership with Banque PSA Finance (associated with the Peugeot, Citroën and DS automotive brands) as well as a joint venture with Hyundai Capital Services, Inc.; (iv) we launched “ContaSuper,” a pre-paid card system which allows users to manage their daily financial activities entirely online; and (v) we also entered into an agreement with American Airlines Inc. for the marketing and issuance of co-branded credit cards, with the purpose of offering AAdvantage® miles to their respective customers as a result of their daily purchases.
In 2017, we acquired a 70% equity interest in Ipanema Empreendimentos e Participações S.A. (“Ipanema Credit Management”), a company that actively manages overdue loan portfolios and which we believe will further expand our expertise in credit recovery. During the course of 2017, we also announced a joint venture with HDI Seguros S.A. (“HDI Seguros”) in the field of car insurance. We have also continued to expand our customer offering during 2017. For example, we launched Superdigital, an evolution of ContaSuper, which enables customers to manage their finances in a different and dynamic way through a prepaid account.
Important Events
Sale of Santander Securities Services Brasil DTVM S.A.
On June 19, 2014, we executed preliminary documents containing the main terms and conditions relating to the sale of our qualified custody business operations, and of all of the shares issued by Santander Securities Services Brasil DTVM S.A. (“SSS DTVM”), one of our subsidiaries that was engaged in the rendering of third-party fund administration services. The transaction was completed on August 31, 2015, once all regulatory approvals applicable in Brazil had been obtained. Santander Securities Services Brasil Participações S.A. (“Santander Securities Brasil”), which is indirectly controlled by Santander Spain, became the owner of shares representing 100% of the total share capital of SSS DTVM, and SSS DTVM acquired the qualified custody business from Santander Brasil. The purchase price for the shares was R$859 million. The transaction generated capital gains of approximately R$450 million after taxes.
Investment Agreement between Santander Brasil and Banco Bonsucesso S.A.
On July 30, 2014, we, through our controlled company Aymoré Crédito, Financiamento e Investimento S.A. (“Aymoré CFI”), and Banco Bonsucesso S.A. (“Banco Bonsucesso”) agreed to form a joint venture in the payroll credit card loan and payroll loan segments, currently known as Banco Olé Bonsucesso Consignado S.A., or “Banco Olé Bonsucesso Consignado.”
On February 10, 2015, with the approval of the Brazilian Central Bank, the transaction was completed and Santander Brasil, through Aymoré CFI, became the controlling shareholder of Banco Olé Bonsucesso Consignado, holding 60% of the share capital of the entity. Banco Bonsucesso owns the remaining portion of Banco Olé Bonsucesso Consignado’s share capital (i.e., a 40% interest).
The transaction involved the transfer to Banco Olé Bonsucesso Consignado of the payroll loan business and payroll credit card loans of Banco Bonsucesso, and our investment, through Aymoré CFI, of R$460 million in Banco Olé Bonsucesso Consignado.
Banco Olé Bonsucesso Consignado became the exclusive vehicle of Banco Bonsucesso and its subsidiaries for the offer of payroll loans in Brazil. We also continue to originate payroll loan transactions through our own independent channels.
Investment in Super Pagamentos e Administração de Meios Eletrônicos S.A.
On December 12, 2014, we, through Aymoré CFI, acquired shares issued by Super Pagamentos e Administração de Meios Eletrônicos S.A. (“Super”) representing 50% of Super’s total and voting capital. Super is a Brazilian digital service provider that offers online payment accounts, prepaid cards and access to simplified financial services.
On January 4, 2016, Aymoré CFI informed the sellers of its decision to exercise the call option for the shares representing the remaining 50% of Super’s total voting capital owned by the sellers, for a value of approximately R$113 million. The transaction was completed on March 10, 2016, following receipt of approval from the Brazilian Central Bank.
Buyback Program
On November 1, 2017, our board of directors approved, in continuation of the buyback program that expired on November 3, 2017, the buyback program of units and ADRs issued by us, directly or through our branch in the Cayman Islands, to be held in treasury or subsequently sold. The buyback program will cover the acquisition of up to 38,717,204 units or ADRs, representing 38,717,204 common shares and 38,717,204 preferred shares, corresponding to approximately 1.03% of our share capital. The term of the buyback program is up to 12 months starting from November 6, 2017.
Financial Cooperation and Joint Venture with Banque PSA Finance
On July 24, 2015, and in furtherance of the partnership in Europe between Banque PSA Finance (“Banque PSA”) and Santander Consumer Finance for the joint operation of the vehicle financing business related to PSA Peugeot Citroën (“PSA”) brands (which include Peugeot, Citroën and DS), we entered into binding agreements for a joint venture in Brazil with Banque PSA to offer financial and insurance products to consumers and distributors of PSA brands in Brazil.
After the fulfilment of the applicable conditions precedent, which included obtaining the appropriate regulatory authorizations, the joint venture began its operations on August 1, 2016.
The principal entity around which the partnership is formed in Brazil is Banco PSA Finance Brasil S.A., 50% of which is held by our wholly-owned subsidiary, Aymoré CFI, and 50% of which is owned by Banque PSA. The transaction also contemplates the acquisition by Santander Brasil of 100% of PSA Finance Arrendamento Mercantil S.A. and 50% of PSA Corretora de Seguros e Serviços Ltda., an entity of the PSA group dedicated to the distribution of insurance products in Brazil.
The joint venture adds the network of PSA Group’s distributors in Brazil to the distribution channels of Santander Brasil for the offering of financial and insurance products, especially in the vehicle-financing sector.
Establishment of Credit Intelligence Bureau
On January 20, 2016, we entered into a non-binding memorandum of understanding with Banco Bradesco S.A., Banco do Brasil S.A., Caixa Econômica Federal and Itaú Unibanco S.A., for the creation of a credit intelligence bureau, Gestora de Inteligência de Crédito S.A. (“CIB”). The CIB will be structured as a corporation and each of Santander Brasil, Banco Bradesco S.A., Banco do Brasil S.A., Caixa Econômica Federal and Itaú Unibanco S.A. will have a 20% ownership stake in the corporation.
The purpose of the CIB will be to develop a database that, in conformity with applicable laws, will collect, reconcile and handle the credit information of individuals and legal entities that register with the CIB and expressly authorize the inclusion of their credit information on the CIB’s database. We believe this initiative will lead to an increased degree of efficiency and improvement of our credit management activities, and will also facilitate the disbursement of long- and medium-term lines of credit to participants in the Brazilian Financial System and to other corporate entities.
On April 14, 2017, the definitive documents were signed by the shareholders. The necessary regulatory authorizations, including by the Brazilian Central Bank and the Brazilian Anti-Trust Authority (Conselho Administrativo de Defesa Econômica), or “CADE,” have already been granted. We estimate that the CIB will become fully operational in 2019.
Joint Venture with Hyundai Capital Services, Inc.
On April 28, 2016, our wholly-owned subsidiary Aymoré CFI entered into a joint venture with Hyundai Capital Services, Inc. (“Hyundai Capital”), for the incorporation of (i) Banco Hyundai Capital Brasil S.A. and (ii) an insurance brokerage company, in order to provide, respectively, auto finance and insurance brokerage services and products to consumers and Hyundai dealerships in Brazil.
Aymoré CFI will own a 50% equity stake in the joint venture entities while Hyundai Capital will have an equity stake of 50% in the joint venture entities.
The incorporation of Banco Hyundai Capital Brasil S.A. and of the insurance brokerage company is subject to certain regulatory approvals, including, in the case of Banco Hyundai Capital Brasil S.A., obtaining the Brazilian Central Bank’s authorization to operate as a banking entity. The Presidential Decree required under Brazilian law has been obtained. We are currently working on the development of the administrative, operational and organizational structures for the joint venture in compliance with applicable legislation.
Partnership with American Airlines Inc.
On December 9, 2016, Santander Brasil and American Airlines Inc. entered into a 10-year commercial participation agreement for the marketing and issuance of co-branded credit cards, with the purpose of offering AAdvantage® miles to their respective customers as a result of their daily purchases.
Opening of the branch in Luxembourg
On June 9, 2017, we received authorization from the Brazilian Central Bank to establish a branch in Luxembourg, with a capital in an amount equivalent to U.S.$1 billion. The purpose of this branch is to offer international financial services to corporate clients with overseas operations. The branch was authorized by the Minister of Finance of Luxembourg on March 5, 2018.
Acquisition of equity stake of Ipanema Empreendimentos e Participações S.A. and Gestora de Investimentos Ipanema S.A.
On October 16, 2017, Santander Brasil, through its wholly-owned subsidiary Atual Companhia Securitizadora de Créditos Financeiros, acquired a direct equity interest in Ipanema Empreendimentos e Participações S.A. (“Ipanema Credit Management”) and an indirect equity interest in Gestora de Investimentos Ipanema S.A. (“Ipanema Asset” jointly with Ipanema Credit Management, the “Ipanema Entities”), corresponding to 70% of Ipanema Entities’ share capital.
The Ipanema Entities are active in the credit recovery intelligence sector, providing services such as credit portfolio evaluation and pricing, collection, management and recovery of non-performing loans. Ipanema Credit Management focuses on portfolio pricing, collection and credit recovery management while Ipanema Asset, as an authorized asset manager duly licensed by the CVM, is responsible for the management of credit funds in which the portfolios of the Ipanema Entities’ customers are concentrated.
We intend to increase our recovery indicators with regards to non-performing loans by using the know-how of the Ipanema Entities. We also intend for the Ipanema Entities to continue to provide non-performing loan recovery and credit management services to third parties.
Joint Venture with HDI Seguros S.A.
On December 20, 2017, we entered into binding agreements with HDI Seguros S.A. (“HDI Seguros”) for the formation of a partnership through the creation of a new insurance company called Santander Auto S.A. (“Santander Auto”). Sancap Investimentos e Participações S.A., a company controlled by Santander Brasil, will hold 50% of the issued share capital of Santander Auto with the remaining 50% being held by HDI Seguros. Santander Auto will focus on offering motor insurance policies through a 100% digital platform. The closing of the transaction is subject to the fulfillment of certain customary contractual conditions, including obtaining the applicable regulatory approvals. The CADE approved the transaction on March 2, 2018.
Sale of BW Guirapá I S.A.
On December 22, 2017, our wholly-owned subsidiary Santander Corretora de Seguros, Investimentos e Serviços S.A. (“Santander Investimentos”), Cia. de Ferro Ligas da Bahia – FERBASA S.A. (“FERBASA”) and Brazil Wind S.A. (“Brazil Wind”) entered into an agreement for the sale of 100% of the shares issued by BW Guirapá I S.A. (“BW I”) and owned by Santander Investimentos and Brazil Wind to FERBASA. The transaction also encompasses the seven wind farms organized as special purpose companies held by BW I. The base purchase price for the total shares owned by Santander Investimentos will be up to R$414 million, provided that an additional payment of up to R$35 million may be due if certain future operational milestones set forth in the agreement are achieved. The CADE approved the transaction on January 17, 2018, and the transaction was completed on April 2, 2018.
Acquisition of Technology Companies
On February 19, 2018 and February 28, 2018, Santander Brasil concluded the acquisition of the totality of shares of, respectively, Isban Brasil S.A. and Produban Serviços de Informática S.A., or the Technology Companies, for a price of approximately R$61 million and R$43 million, respectively. The Technology Companies were indirectly controlled by Santander Spain.
The Technology Companies are the main providers of technical support and maintenance services related to software and hardware of Santander Brasil. The transaction will permit Santander Brasil to directly control local technology services and therefore increase the proximity thereof to its business, adopt time-to-market solutions, flexibility, and improve quality and efficiency.
Capital Expenditures and Divestitures
Our main capital expenditures include investments in our Information Technology (“IT”) platform. Our IT platform focuses on our customers and supports our business model. In 2017, 2016 and 2015, total investments in IT were R$1,132 million, R$895 million and R$858 million, respectively.
In 2017, 2016 and 2015, we continually improved our technology platform by means of investments in our core systems and infrastructure renewal. In the past 18 months, we have implemented over 80 new technologies and processes in several areas, including new cybersecurity techniques, new platforms for customer relationship management, big data transformation, increased automation of our development and release cycles, artificial intelligence platforms and the use of cloud-based solutions.
We have recently started a migration towards cloud-based computing in order to provide improved IT services management, flexibility and cost optimization. In 2017, we made the Microsoft Office 365 platform available in cloud format for more than 14,000 users, allowing greater collaboration between teams, increased productivity, simplified internal processes and improved mobility. For further discussion regarding our technology infrastructure see “—B. Business Overview— Technology and Infrastructure”
Our ongoing capital expenditures consist primarily of investments in IT. We expect to fund our ongoing capital expenditures principally from our cash flow from operations.
Our major divestitures in the past three fiscal years and until the date of this annual report were the sale of BW I in 2017 and the sale, in August 2015, of our qualified custody business through the sale of all the shares of SSS DTVM to Santander Securities Brasil (in this respect, see “Item 5. Operating and Financial Review and Prospects—A. Operating Results—Factors Affecting the Comparability of Our Results of Operations—Sale of the Investment Fund Management and Managed Portfolio Operations” and “—Important Events—Sale of BW Guirapá I S.A.”).
4B. Business Overview
Our Profile
We are the only international commercial bank with a significant presence in Brazil, where we are currently the third-largest privately owned bank. We have established a competitive presence in both the retail and wholesale banking sectors in Brazil, enabling us to meet the needs of individuals, small and medium enterprises, and large corporate clients.
Our Units, common shares and preferred shares are traded on B3 under the tickers “SANB11,” “SANB3” and “SANB4,” respectively. Our ADRs have been listed and traded on the NYSE since October 7, 2009 under the ticker “BSBR.”
We believe that being part of the Santander Group offers us a significant competitive advantage over our competitors. While, under the Santander Group’s business model, each major unit is autonomous and is required to be self-sufficient in terms of capital and liquidity, our relationship allows us to:
| · | access the Santander Group’s global operations, providing operational synergies with the Santander Group and enhancing our ability to provide global products and services to our customers while reducing technology development costs; |
| · | provide our customers with the benefits of a strong presence in certain markets, predominantly in Latin America and Western Europe; |
| · | take advantage of best practice already implemented in other countries, including with regards to products, services, internal controls and risk management; and |
| · | develop our employees’ skills through local and international training and development, as well as by allowing them to gain international experience in other offices of the Santander Group. |
Our Strategy
Our goal is to be the leading financial group in Brazil, by providing the best experience in retail and wholesale banking services to our customers and employees.
We believe that the best way to grow in a profitable, recurring and sustainable manner is by providing services with excellence and to consistently strive to enhance customer satisfaction levels, attract additional customers and increase the loyalty of our customers. We seek to establish close and long-lasting relationships with customers, suppliers and shareholders. To accomplish that goal, our purpose is to help people and businesses prosper by being a Simple, Personal and Fair bank. Our strategy is focused on the following objectives:
| · | Increase customer preference and loyalty by offering targeted, simple, digital and innovative products and services through a multichannel platform. Our active customer base totaled 21.7 million customers as of December 31, 2017, an 8% increase over our customer base as of December 31, 2016. As of December 31, 2017, we had 4.2 million loyal customers, an increase of 16% as compared to December 31, 2016. We define loyal customers as (1) active account holders who use at least three other products or services offered by Santander Brasil on a regular basis, and (2) have processed at least five transactions through Santander Brasil in the preceding 60 days. The minimum number of products or services which a customer must use in order to be classified as a loyal customer depends upon the customer’s segment (i.e., Private Banking, Santander Select, Santander Van Gogh or Santander Especial) and the type of product or service consumed. We believe this increase is a result of our focus on constantly improving our customers’ experience and satisfaction levels through our service-focused culture and the technological transformation of our channels, such as the new Internet banking and mobile banking for individuals and companies, 100% digital account opening portal and the Santander Way card app, among others. For more details on the channels, refer to “—Our Business—Service Channels.” |
| · | Improve the profitability, recurrence and sustainability of our results by growing and increasing our revenue diversification, with the objective of striking a balance between loans, funding and services, while maintaining a preemptive risk management approach and rigorous cost control. In 2017, 2016 and 2015, our net interest income and net fee income amounted to an aggregate R$47.7 billion (net interest income of R$34.9 billion and net fee income of R$12.7 billion), R$41.6 billion (net interest income of R$30.6 billion and net fee income of R$11.0 billion) and R$40.8 billion (net interest income of R$31.3 billion and net fee income of R$9.5 billion), respectively, driven, in each case, by customer revenues (loan and funding) and service revenues, as a result of our stronger portfolio of products and services and greater transactional activity by our customers. Our preemptive risk management led to an improvement in the default rate, from 7.04% for the fiscal year ended December 31, 2016 to 6.65% for the fiscal year ended December 31,December 2017, despite the slowdown in economic activity in the period. |
| · | Be disciplined with capital and liquidity to preserve our solvency, face regulatory changes and seize growth opportunities.Our Basel capital adequacy ratio, calculated in accordance with the regulations and guidance of the Brazilian Central Bank, totaled 15.8% at the end of 2017, higher than the sum of the minimum regulatory capital and capital conservation requirements. |
| · | Boost productivity through an intense agenda of commercial improvements that enable us to offer a complete portfolio of services. Our focus on operational excellence, with the adoption of simpler and more agile processes which provide us with full visibility of the customers’ relationship with us and enable us to interact effectively with customers, underscores our commitment to continuously improving customer satisfaction. For more information on products and services, refer to “Item 4. Company Information B. Business Overview—Our Business—Products and Services Provided to Our Customers.” |
In addition, we also seek to support the success of our business by: (i) having a diversified business model, (ii) focusing on recurring revenue generation, (iii) maintaining prudent risk management, (iv) implementing strict cost control and (v) executing efficient capital allocation. We also strive to ensure that our banking activities contribute to the social and economic progress of the communities in which we are present, in a responsible and sustainable manner and with a special commitment to higher education.
Recent Business Developments
In recent years, our commercial banking segment has accounted for an increasingly large portion of our net interest income and our net fee and commissions income, as demonstrated in the following table.
| | | For the year ended December 31, |
| | | 2017 | | 2016 | | 2015 | | 2017 | | 2016 | | 2015 |
| | | Net interest income | | Net fee and commissions income |
| | | | (%) |
| Commercial Banking | | | 92.7 | | | | 89.5 | | | | 86.3 | | | | 88.5 | | | | 87.3 | | | | 86.9 | |
| Global Wholesale Banking | | | 7.3 | | | | 10.5 | | | | 13.7 | | | | 11.5 | | | | 12.7 | | | | 13.1 | |
We believe that the increase in the portion of our net interest income and our net fee and commissions income derived from commercial banking is the result of the execution of a wide-scale transformation agenda based on a customer-centric vision as a result of which we were able to change the way we operate, introduce a culture of service and steadily increase our customer base. The following are some of the steps we took to achieve this:
| · | Streamlined processes. We have simplified the day-to-day operations of our customer-facing employees with a view to enabling our branch employees to devote a greater amount of time to meeting customers’ needs. As part of this, we made available to our employees a new customer relationship tool which centralizes all necessary information for their daily commercial and financial activities. We have implemented time-saving tools such asClique Único (“single click”) to reduce the volume of information and steps needed on operational tasks. |
| · | Improved accountability and incentives for branch employees. In line with the new commercial dynamic implemented in the commercial banking segment and guided by the strategy established by the senior management, we have sought to decentralize the management of our branches’ resources. Branch managers are now responsible for managing the expenses of their own branch and each branch has its own profit and loss account. This gives branch managers and employees a greater sense of autonomy and responsibility, and gives them a stake in success of their branch. In addition, we have made certain changes to the compensation structure of branch managers and employees in order to ensure that any variable components of their remuneration are dependent upon the performance of the branch at which they work. |
| · | Digital strategy. We have implemented a new collaborative working method within our organization based on the “Agile” methodology commonly used in IT. Our new working method involves putting together multidisciplinary teams from our business and technology functions and giving them the necessary autonomy to adapt to changing circumstances and requirements. This new working method has enabled us to put in place several digital tools aimed at enabling customers to access our services through a variety of digital and other channels, including by: (i) providing customers with a full range of services across all channels according to their choices and/or needs; (ii) giving customers autonomy to meet all their needs through digital channels; and (iii) integrating all service channels in order to ensure a seamless customer experience, regardless of the channel selected. |
| · | Performance and compensation.We have set clear key performance indicators for our employees. In addition, we have increased the significance of variable compensation for branch employees in order to align their incentives with those of Santander Brasil. |
| · | Net promoter score, or NPS. In 2017 we introduced the NPS as the leading metric of customer satisfaction. Following each interaction with Santander Brasil (e.g., purchasing a product, a service or communicating with us through one of our customer service channels), our customers are asked to rank this interaction on a scale from zero (which would mean that the customer would not recommend the applicable product or service to others) or ten (which would mean that the customer would recommend the product or service to others). This tool enables us to monitor customer satisfaction. We believe that greater customer satisfaction leads to increased customer loyalty, which we believe is key to growing our results consistently and sustainably. |
Our Business
Overview
We operate along two segments through which we offer our 21.7 million active individual, SME and corporate customers a complete portfolio of products and services:
| · | Commercial Banking Segment.In the Commercial Banking segment, we focus on building long-term relationships with our account holder and non-account holder customers. Customers in our Commercial Banking segment include individuals and companies (except for global corporate customers, which are dealt with within our Global Wholesale Banking segment). Revenue from this segment is generated by the provision of banking and financial products and services to our account holder and non-account holder customers, including essential checking and savings account services, priority services (such as withdrawals, debit cards, deposits and transfers), credit cards, foreign exchange services, investments and loans and financing. |
| · | Global Wholesale Banking Segment.Our Global Wholesale Banking segment offers financial services and structured solutions for our global corporate customers, principally local and multinational corporations, and carries out proprietary trading activities. Our Global Wholesale Banking segment offers a wide range of national and international services specifically tailored to the needs of each customer. |
The following chart sets forth our operating segments and their main focus.
Commercial Banking | Global Wholesale Banking |
| · Retail banking | · Global Corporate Banking (“GCB”) |
| · Individuals | · Proprietary Trading |
| · SMEs (annual gross revenues up to R$200 million) | |
| · Corporate (annual gross revenues in excess of R$200 million, other than global corporate clients) | |
| · Consumer finance | |
Our Commercial Banking and Global Wholesale Banking segments are strongly integrated, which enables us to capitalize on each segment’s strengths to the benefit of the other. We are able to offer joint solutions to customers in each of our segments, such as for example, offering integrated solutions to (i) large retailers and their respective points of sale and (ii) large companies and their employees.
The following table presents the breakdown of our net interest income and profit before tax by operating segment:
| | | For the year ended December 31, |
| | | 2017 | | 2016 | | 2015 | | 2017 | | 2016 | | 2015 |
| | | Net interest income | | Operating profit before tax |
| | | (R$ millions) |
| Commercial Banking (1) | | | 32,392 | | | | 27,366 | | | | 27,041 | | | | 11,220 | | | | 12,652 | | | | (5,565 | ) |
| Global Wholesale Banking | | | 2,554 | | | | 3,221 | | | | 4,297 | | | | 3,293 | | | | 3,732 | | | | 2,349 | |
| Total | | | 34,946 | | | | 30,586 | | | | 31,337 | | | | 14,514 | | | | 16,384 | | | | (3,216 | ) |
| (1) | Profit before tax reported under commercial banking includes the effects of the hedge for investments held abroad (offset in the same amount in the “Income Tax” line). The effect of the hedge for investments held abroad in 2017, 2016 and 2015 amounted to expenses of R$810 million, gains of R$6,140 million and expenses of R$10,919million, respectively. |
As of December 31, 2017, our net interest income grew 14.3% and reached R$34,946 million compared to R$30,586 million as of December 31, 2016.This increase is primarily due to an increase in the volume of loans extended to customers and of the margins we charge on these loans, both of which were primarily concentrated in our commercial banking segment. As of December 31, 2017, our operating profit before tax decreased 11.4% and reached R$14,514 million compared to R$16,384 million as of December 31, 2016. Excluding the effects of the hedge for investment held abroad operating profit before tax amounted to R$15,324 million for the year ended December 31, 2017, a 49.6% increase from R$10,244 million compared to the year ended December 31, 2016. Operating profit before tax and operating before tax excluding the effects of the hedge investment abroad are non-GAAP measures. For further information, see “Item 3. Key Information—A. Selected Financial Data—Reconciliation of Non-GAAP Measures and Ratios to Their Most Directly Comparable IFRS Financial Measures.”
The following table shows a managerial breakdown of our loans and advances to customers by client category at the dates indicated:
| | | As of December 31, | | Change between 2016 | | Change between 2015 |
| | | 2017 | | 2016 | | 2015 | | and 2017 | | and 2016 |
| | | | (R$ million) |
| Individuals | | | 107,610 | | | | 91,195 | | | | 84,578 | | | | 18.0 | % | | | 7.8 | % |
| Consumer Finance | | | 33,170 | | | | 26,608 | | | | 25,850 | | | | 24.7 | % | | | 2.9 | % |
| SMEs | | | 46,879 | | | | 42,440 | | | | 43,524 | | | | 10.5 | % | | | (2.5 | )% |
| Corporate(1) | | | 100,171 | | | | 108,195 | | | | 113,315 | | | | (7.4 | )% | | | (4.5 | )% |
| Total Credit Portfolio | | | 287,829 | | | | 268,438 | | | | 267,266 | | | | 7.2 | % | | | 0.4 | % |
| (1) | For purposes of loan portfolio presentation, “corporate” includes companies with annual gross revenues exceeding R$200 million, including our Global Corporate Banking customers. |
As of December 31, 2017, our loans and advances to customers grew 7.2% and reached R$287,829 million compared to R$268,438 million as of December 31, 2016. This increase is primarily due to an increase in loans to individuals and in our consumer finance portfolio. For further information, see “Item 5. Operating and Financial Review and Prospects—A. Operating Results—Results of Operations.”
Commercial Banking
Individuals
The services we provide to individuals are currently as follows:
| · | Private Banking Business serves a select group of customers with at least R$5.0 million in assets available for investment. Our goal is to offer our customers a complete and tailor-made portfolio of onshore and offshore financial products and services, investment advice, loans and asset management through a dedicated manager for investments and banking services. |
| · | Santander Select serves customers with a monthly income above R$20,000, or a monthly income above R$10,000 and R$30,000 in investments, or without monthly income but with over R$300,000 in investments. Our goal is to offer a value proposition with differentiated products and services, exclusive service spaces, relationship managers that serve a small number of customers and asset management advisory services. |
| · | Santander Van Gogh serves customers with a monthly income from R$4,000 to R$10,000, or with at least R$40,000 in investments. Our objective is to understand the needs of our customers at each stage of their life and provide them with financial advice through a multichannel relationship, including financial products and services as well as financial advice. |
| · | Santander Especial serves customers who earn less than R$4,000 per month. Our business model offers simple and efficient solutions with an attractive cost benefit to the customer, primarily through electronic channels. |
We offer our retail lending products to customers through our extensive branch network and on-site service units. See “—Service Channels.” The following table sets forth our individual customer loan portfolio at the dates indicated, as per our management records:
| | | For the year ended December 31, | | Change, as of December 31, 2017 vs. December 31, 2016 |
| | | 2017 | | 2016 | | 2015 | | R$ million | | % |
| | | (R$ millions) |
| Leasing/Auto Loans(1) | | | 1,895 | | | | 1,869 | | | | 2,470 | | | | 26 | | | | 1.4 | |
| Credit cards | | | 24,278 | | | | 20,524 | | | | 19,013 | | | | 3,754 | | | | 18.3 | |
| Payroll loans(2) | | | 25,547 | | | | 18,918 | | | | 14,836 | | | | 6,629 | | | | 35.0 | |
| Mortgages | | | 28,232 | | | | 27,313 | | | | 26,134 | | | | 919 | | | | 3.4 | |
| Agricultural Loans | | | 5,232 | | | | 3,416 | | | | 3,438 | | | | 1,816 | | | | 53.2 | |
| Personal loans/Other | | | 22,426 | | | | 19,155 | | | | 18,687 | | | | 3,271 | | | | 17.1 | |
| Total | | | 107,610 | | | | 91,195 | | | | 84,578 | | | | 16,415 | | | | 18.0 | |
| (1) | Including loans to individuals in the consumer finance segment, the auto loan portfolio totaled R$33.1 billion as of December 31, 2017, R$26.7 billion as of December 31, 2016 and R$26.1 billion as of December 31, 2015. |
| (2) | Includes Banco Olé Bonsucesso Consignado’s portfolio payroll loans from the agreement between Santander Brasil and Banco Bonsucesso. |
Small and Medium Enterprises
We serve SMEs through the Santander Negócios e Empresas brand. Our current classification model for SMEs is as follows:
| · | Companies (Empresas) 3. Companies with annual revenues between R$30 million and R$200 million. Our service model is based on dedicated relationship managers, a team of experts for more complex demands and loan managers specializing in risk management for the segment. We also provide specialized services to multinationals and other major corporates in order to meet their specific needs. |
| · | Companies (Empresas) 2. Companies with annual revenue between R$3 million and R$30 million. We offer these customers a comprehensive range of products and services in a user-friendly fashion principally through a relationship manager based at the customer’s branch. We also have committees specific to these customers in order to provide our customers with credit products. |
| · | Companies (Empresas) 1. Companies with annual revenue of up to R$3 million. We offer these customers a simple banking solution through an integrated account (Santander Conta Integrada) that combines a corporate account with a payment terminal to provide benefits for the user, who must simply concentrate MasterCard and Visa credit card sales in the Getnet terminal and receipts in a Santander Brasil current account. We believe that this results in greater commercial efficiency as customers receive our products and services through a single point of access with access to standardized and automatically priced products delivered with the assistance of preapproved risk models and automated decision-making system. |
| · | Companies (Empresas)1 (Digital). Companies with annual revenue of up to R$300,000. We serve these customers principally through a relationship manager available through online channels. We believe that this improves service availability and simplicity for our customers, including through extended service hours (8:00 a.m. to 8:00 p.m., Monday through Friday). We also offer these customers a full range of other online banking services. |
In recent years, we have developed products specifically for SMEs, including industry-specific offers specially designed to meet the needs of bars and restaurants, gas stations, medical offices and clinics, franchises and supermarkets. In addition, we have also repositioned the “Santander Negócios & Empresas” customer segment, improving our financial offer and launching a non-financial offer called “Programa Avançar.” The program provides companies with concrete deliverables, such as videos, events and workshops in order to develop partner and employee skills, build teams to support talent hiring and help connect our customers to international trade through the Santander Trade portal.
The table below sets forth our SME loan portfolio at the dates indicated, as per our management records:
| | | For the year ended December 31, | | Change, December 31, 2017 vs. December 31, 2016 |
| | | 2017 | | 2016 | | 2015 | | R$ million | | % |
| | | (R$ millions) |
| Agricultural lending | | | 506 | | | | 322 | | | | 243 | | | | 184 | | | | 57.1 | |
| Working capital loans | | | 12,359 | | | | 12,695 | | | | 14,736 | | | | (366 | ) | | | (2.6 | ) |
| Buyer financing | | | 32 | | | | 21 | | | | 27 | | | | 11 | | | | 52.4 | |
| Vendor financing | | | 16 | | | | 10 | | | | 9 | | | | 6 | | | | 60.0 | |
| Discounted receivables | | | 1,667 | | | | 1,491 | | | | 1,228 | | | | 176 | | | | 11.8 | |
| Comex | | | 1,723 | | | | 1,259 | | | | 1,954 | | | | 464 | | | | 36.9 | |
| Overdraft facility | | | 2,773 | | | | 2,837 | | | | 3,072 | | | | (64 | ) | | | (2.3 | ) |
| Refinancing | | | 4,169 | | | | 4,365 | | | | 3,691 | | | | (196 | ) | | | (4.5 | ) |
| Resolution 2,770 | | | 16 | | | | 35 | | | | 78 | | | | (19 | ) | | | (54.3 | ) |
| Account overdraft loans | | | 1,820 | | | | 1,734 | | | | 1,983 | | | | 86 | | | | 5.0 | |
| CDC/leasing(1) | | | 1,724 | | | | 1,506 | | | | 1,521 | | | | 218 | | | | 14.5 | |
| Other(2) | | | 20,074 | | | | 16,165 | | | | 14,982 | | | | 3,909 | | | | 24.2 | |
| Total(3) | | | 46,879 | | | | 42,440 | | | | 43,524 | | | | 4,439 | | | | 10.5 | |
| (1) | Does not include consumer finance products. |
| (2) | Includes credit cards, mortgage finance products and other products. |
| (3) | Includes SMEs with annual gross revenues up to R$200 million. |
Consumer Finance
Santander Financiamentos (the commercial brand used by our subsidiary Aymoré CFI) is our main consumer finance channel, with expertise in providing consumer credit (for the financing of purchases of motor vehicles, as well as other goods and services) directly to borrowers or through intermediate agencies.
We have a total portfolio of R$33.2 billion which is primarily composed of auto loans for individuals. We are the market leader in auto loans, with a market share of 23.1% as of December 31, 2017, according to the Brazilian Central Bank.
We have introduced “+negócios,” which we believe to be a leading online lending platform. +negócios is an innovative digital commercial platform designed to be simple and intuitive and which allows for faster loan simulations, credit approval and proposal formalization in addition to providing portfolio management reports. In May 2017, we introduced + Vezes, which enables retailers to offer installment payment options on purchases of goods and services. These platforms supported the expansion of our business, with over one million unique simulations being conducted on these platforms in December 2017.
We have also strengthened our positioning by offering integrated financing solutions together with Webmotors S.A., an online portal active in the Brazilian market through which consumers can advertise their cars for sale, and Santander AutoCompara, a tool which allows customers to compare car insurance prices for insurance coverage across several insurance companies.
We have joint ventures with RCI (Renault and Nissan) and PSA (Peugeot, Citroën and DS), and white-label partnerships with Hyundai, Subaru, Volvo and Chery. In addition, we also provide consumer credit through intermediate customers (i.e., stores), or industrial or partner brands, including businesses in the furniture, tourism, health, technology, accessibility equipment, renewable energy and cleaner processes sectors, among others.
The following table sets forth certain key financial and operating data regarding our consumer finance business for the periods indicated.
| | | As of December 31, | | Change between 2016 and | | Change between 2015 and |
| | | 2017 | | 2016 | | 2015 | | 2017 | | 2016 |
| Consumer finance loan portfolio market share (1) (%) | | | 23.1 | % | | | 20. 3% | | | | 18. 1% | | | | 2. 8 p.p. | | | | 2.2 p.p. | |
| Consumer finance portfolio (R$ billion) | | | 33.1 | | | | 26.6 | | | | 25.8 | | | | 24.7 | % | | | 2.9 | % |
| Share of auto loan in the consumer finance portfolio (%) | | | 85.6 | % | | | 83.0 | % | | | 86.3 | % | | | 2.6 p.p. | | | | (3.3) p.p. | |
| (1) | Source: Brazilian Central Bank. |
Corporate
Our corporate customer segment comprises large companies that have annual gross revenues greater than R$200 million (other than global corporate customers). We focus on fostering a close relationship with our corporate customers by providing them with customer-tailored services. In 2017, our team comprised approximately 120 bankers across Brazil dedicated exclusively to our corporate sector.
Global Wholesale Banking
Global Corporate Banking
Global Corporate Banking (“GCB”) is the global business unit that covers those customers that, due to their size and complexity, require tailored services or high-value-added wholesale products. In this segment, we provide a wide range of domestic and international financial services to large Brazilian and multinational companies. Our customers in the GCB segment benefit from the global structure of services provided by the Santander Group with its worldwide integrated wholesale banking network and global services solutions, combined with its local market expertise and provision of integrated services.
Our product and service portfolio ranges from basic to tailor-made and highly complex solutions in the following areas:
| · | Global Transaction Banking, which includes the development and management of local and global transactional banking products, including local loans, commercial finance, BNDES on-lending, trade finance, local and international guarantees, structured loans, cash management, funding from international banks and specialized sales. |
| · | Global Debt Financing, which includes funding and financial advisory services, origination and distribution of fixed-income securities in the capital markets, financing of acquisitions and syndicated loans, other structured financings, tax equities, subordinated debt and energy efficiency transactions. |
| · | Investment Banking, which includes advisory services relating to mergers and acquisitions and equity capital markets. |
| · | Equities, which includes stock brokerage and advisory services, cash equities services for individuals, corporate and financial institutional investors and equity research. |
| · | Client Treasury, which includes structuring foreign exchange transactions, offering various foreign exchange products, over-the-counter derivatives and investments and other financial and structured products for customer or different segments including institutional investors, corporate and retail customers and equity derivatives. |
| · | Market Making, which is responsible for the pricing of customer deals originated by our sales force from corporate, institutional, private banking and retail segments. |
The GCB team is dedicated to customer coverage comprising a range of industries, including telecommunications, retail, aviation, real estate and logistics, power, construction and infrastructure, natural resources, food, agribusiness and financial institutions. We are one of the leading banks in capital markets and financial advisory services in the Brazilian and international markets as evidenced by the awards we have received, the principal among which are listed in the table below.
Area | Acknowledgments |
Global
Transaction
Banking | 1stplace in BNDES Disbursements to Large Companies and 4th place in BNDES Disbursements to Small and Medium Enterprises in the first half of 2017, according to the BNDES |
Best Trade Bank in Latin America by Trade and Forfaiting Review in 2017 |
| Best Trade Bank in Latin America, according to Euromoney in 2016 |
Investment
Banking | Leadership in M&A: from 5thplace in 2015 to 1st place in 2016, according to Thomson |
| Equities | Ranked as 4th place among Brazilian banks and 6th place in Latin America. Ranked as 1st place in the Energy & Sanitation and Transportation (Latin America), Education (Brazil) and Strategy (Brazil and Latin America) sectors and several leading positions in Brazil’s Research rankings by U.S. magazineInstitutional Investor in 2017 |
Santander Corretora was authorized to use B3’s Agro Broker seal. It now has all B3 qualification seals |
Client
Treasury | 1st place in the Foreign Exchange Rankings by the Brazilian Central Bank since 2014 |
Best Treasury in Brazil in 2017, according to Euromoney |
Financial
Solutions
and
Advisory | Project Finance with Seaborn Networks won the Greenfield Deal of the Year 2016 award byWorld Finance magazine |
Project Finance with Seaborn Networks won the Perfect 10 ECA Finance Deal of the Year 2016 award by Trade & Export Finance |
1st place Financial Advisor for Project Finance in Brazil and Americas 2017, according to Dealogic |
| Leader in Fixed Income, according to ANBIMA |
| Leader in Project Finance Advisory for the 8th time since 2008, according to ANBIMA |
| Best Commodity Finance Bank in Latin America, according to Euromoney |
Proprietary Trading
Our proprietary trading division is responsible for the management of our proprietary books and liquidity positions.
Principal Products and Services Provided to Our Customers
Credit and debit Cards
We operate in the credit and debit card market issuing credit and debit cards to our customers (including both account and non-account holders). We endeavor to offer credit and debit cards compatible with the income level and lifestyle of each of our customers. Most of our credit and debit card customers are individuals. Our revenues from credit and debit cards include administration fees, interest on unpaid balances, annuity fees and withdrawal fees.
Holders of credit cards issued by Santander Brasil have access to the Esfera rewards program, which offers exclusive deals and discounts with more than 300 partners such as Cinépolis, FastShop and Casas Bahia, among others. In addition, holders of credit cards also have access to Bonus Esfera, which enables customers to exchange their Esfera reward points for certain products, services and travel benefits.
Our credit card holders also have access to our Santander Way mobile application, which is an online credit card tool allowing customers, among other things, to track their credit card use online. With more than 4.2 million unique users, Santander Way is a highly ranked payment app, with 4.8 stars on the App Store and 4.6 stars on Google Play. In 2017, we launched Santander Pass, a credit card using near-field communication technology which allows for contactless payments. We offer two devices (a bracelet and a sticker) linked to our customers’ cards to simplify our customers’ user experience.
We exclusively distribute the AAdvantage® card in Brazil, which is linked to the American Airlines loyalty program, one of the most recognized programs in the market. We also have partnerships and associations with brands such as Dufry, Shell, Vivo and Smiles (which was launched recently) to offer exclusive benefits to our customers.
We have also launched two -innovative credit cards in the market:
| · | “Play,” which is aimed at college students and has a dynamic credit limit that increases according to customers’ usage and payment history; and |
| · | “1|2|3,” which is aimed at customers with higher incomes (R$1,500 per month and above) and Santander Van Gogh customers. “1|2|3” allows users to earn points from our Esfera rewards program (each U.S. dollar spent equals one point in domestic transactions, two points in online transactions and three points in international transactions). |
In January 2017, the CMN enacted a new resolution establishing that credit card bills and the debt balance of other forward-paying products may be used as revolving credit only until the following bill. Thereafter, financial institutions must offer customers another type of financing on more favorable conditions than those typically found in the credit card market. In order to comply with the resolution, we offer customers a solution that automatically converts the balance of any revolving credit outstanding after the relevant bill into an installment loan. See “Item 4. Information on the Company—B. Business Overview—Regulation and Supervision—Other Applicable Laws and Regulations—Credit Cards.”).
The following table sets forth certain key financial and operating data regarding our credit card business for the periods indicated.
| | | As of and For the Year Ended December 31, | | Change between 2016 and | | Change between 2015 and |
| | | 2017 | | 2016 | | 2015 | | 2017 | | 2016 |
| Credit card turnover market share(1) | | | 14.6 | % | | | 13.1 | % | | | 12.2 | % | | | 1.5 p.p. | | | | 0.9 p.p. | |
| Credit card portfolio (R$ billion) | | | 25.1 | | | | 21.1 | | | | 19.4 | | | | 19.0 | % | | | 8.7 | % |
| Total card turnover (R$ billion) | | | 167.9 | | | | 140.2 | | | | 122.9 | | | | 19.7 | % | | | 14.1 | % |
| Credit card turnover (R$ billion) | | | 111.5 | | | | 92.2 | | | | 82.2 | | | | 20.9 | % | | | 12.2 | % |
| Total card transactions (in millions) | | | 1,969.0 | | | | 1,651.5 | | | | 1,424.0 | | | | 19.2 | % | | | 16.0 | % |
| Credit card transactions (in millions) | | | 974.2 | | | | 810.7 | | | | 704.0 | | | | 20.2 | % | | | 15.2 | % |
| Participation of credit card in the household consumption – Market overview (1) (%) | | | 17.6 | % | | | 17.5 | % | | | 17.7 | % | | | 0.1 p.p. | | | | (0.2) p.p. | |
| (1) | Source: Data for 2017 is based on ABECS data for the nine months period ended September 30, 2017 as data for the year ended December 31, 2017 was not available as of the date of this annual report.For comparison purposes, the differencebetweenSeptember 30, 2017andSeptember 30, 2016 would be: 1.7 p.p. for “Credit card turnover market share” and 0.4 p.p. for “Participation of credit card in the household consumption – Market Overview.” |
Payroll Loans
A payroll loan is a retail product with a differentiated method of payment. Monthly installments are deducted directly from customers’ payroll by their employer and then credited to Santander Brasil, significantly reducing our credit risk. Our customers are typically retirees benefitting from a state pension, private sector employees and employees from the public sector. We make payroll loans available directly to our account holders as well as indirectly to non-account holders through Olé Consignado.
We offer payroll loans through our mobile banking as well as through our branches. Since July 2017, customers can apply for and receive a payroll loan entirely online. We seek to advise our customers as to which type of loan they should enter into (personal or payroll) based on their financial needs.
The following table sets forth certain key financial and operating data regarding our payroll loans business for the periods indicated.
| | | As of December 31, | | Change between 2016 and | | Change between 2015 and |
| | | 2017 | | 2016 | | 2015 | | 2017 | | 2016 |
| Market share in origination (1) | | | 12.1 | % | | | 9.8 | % | | | 6.5 | % | | | 2.3 p.p. | | | | +3.3 p.p. | |
| Payroll loan portfolio (R$ billion) | | | 25.5 | | | | 18.9 | | | | 14.8 | | | | 35.0 | % | | | 27.5 | % |
| (1) | Source: Brazilian Central Bank, as of December 31, 2017 and December 31, 2016, as applicable. |
Mortgages
We offer long-term loans to our customers for the purchase of real estate, secured by deeds of trust, or for customers who wish to obtain a loan using real estate as collateral. We consider mortgages to be a strategic product due to their lower risk (since the acquired property serves as collateral) and ability to increase customer loyalty (especially given that we offer customers more attractive rates if they choose to bank with us). Our customers in this market are primarily individuals.
We do not offer mortgage loans that do not meet prime lending regulatory standards, which means that (i) we do not make any loans for more than 80% of the value of the property to be purchased, (ii) borrowers must meet certain minimum monthly income levels evidenced by recent payroll information and tax returns to confirm their employment or other types of revenue, which allows us to evaluate their credit risk profile and (iii) monthly payments may not exceed 35% of borrowers’ monthly gross income.
The following table sets forth certain key financial and operating data regarding our mortgage business for the periods indicated.
| | | As of December 31, | | Change between 2016 and 2017 | | Change between 2015 and 2016 |
| | | 2017 | | 2016 | | 2015 | | | | |
| | | | (in R$ billions, except percentages) |
| Mortgage loan portfolio | | | 34.8 | | | | 36.6 | | | | 36.8 | | | | (5.0 | )% | | | (0.5 | )% |
| Individual sector mortgage loans | | | 28.2 | | | | 27.3 | | | | 26.1 | | | | 3.4 | % | | | 4.5 | % |
| Loan to value(1) – Production (% quarterly average) | | | 58.6 | % | | | 55.9 | % | | | 59.2 | % | | | 2.7 p.p. | | | | (3.3) p.p. | |
| Loan to value(2) – Portfolio (%) | | | 46.4 | % | | | 48.1 | % | | | 49.3 | % | | | (1.7) p.p. | | | | (1.2) p.p. | |
| (1) | Ratio between loans and the value of the collateral, excluding home equity. |
| (2) | As of 2017, the LTV guarantee is calculated at market value. In the previous years it was calculated based on the value of the collateral registered in the contract. For better comparison, the 2016 and 2015 values were restated. |
Superdigital is our digital payment solution that allows customers to manage their daily financial activities entirely online in a user-friendly interface through a pre-paid account. Superdigital is an evolution of ContaSuper, which we acquired in 2016.
Superdigital customers can easily and rapidly (i) make withdrawals in the “Banco24Horas” ATM network; (ii) send and receive money from any bank; (iii) recharge mobile phones; and (iv) carry out foreign exchange transactions in up to 10 currencies. In addition to all these features, customers also receive an international MasterCard credit card to make purchases in physical and online stores and have access to the Santander Esfera and MasterCard Surpreenda programs, which offer a series of benefits and promotions.
The following table sets forth certain key financial and operating data regarding our Superdigital business for the periods indicated.
| | | For the Year Ended December 31, | | Change between 2016 and 2017 | | Change between 2015 and 2016 |
| | | 2017 | | 2016 | | 2015 | | | | |
| Total customers (thousands) | | | 1,287.2 | | | | 810.7 | | | | 391.3 | | | | 58.8 | % | | | 107.2 | % |
Agribusiness
Our agribusiness customer unit offers a complete range of products and services targeting the agribusiness sector through a network that includes 14 specialized stores located in key agricultural regions, a team with expertise in the agribusiness (including agronomists) sector and a team with the expertise necessary to offer certain segment-specific products, in addition to our mainstream banking and finance products, to farmers, cooperatives and agribusinesses.
The following table sets forth certain key financial and operating data regarding our agribusiness for the periods indicated.
| | As of and For the Year Ended December 31, | Change between 2016 and 2017 | Change between 2015 and 2016 |
| | 2017 | 2016 | 2015 |
| | | | | | |
| Number of agribusiness-focused stores | 14 | — | — | 14 | — |
| Agribusiness loan portfolio (R$ billion) | 11.5 | 8.9 | 6.0 | 29.1% | 47.9% |
Merchant Acquiring Market | Getnet
Getnet is a technology company that offers merchant acquiring solutions, both physically and through digital means. The acquisition of Getnet, which was completed in 2014, has given us more flexibility, allowing us to create more complete and tailor-made solutions to our customers. According to a Nilson report for 2017, Getnet is currently the fourth largest merchant acquiring company in Latin America and the second largest e-commerce acquiring company in Latin America, in each case based on number of transactions.
We offer payment solutions for individuals and companies, including: (i) mobile and Wi-Fi point of sale, or POS, devices; (ii)Vermelhinha, a mobile POS device which self-employed professionals and small companies may buy or rent from us; (iii) TEF, a solution for establishments with a significant number of transactions, integrated with the establishment’s systems and which offers reconciliation of sales through our “Santander Mais Gestão” program; (iv) the Getnet App, which helps merchants manage their business; (v) POS Digital, which merges payment and apps; and (vi) eGetnet, a digital platform of e-commerce with services such as safe box, recurrence and anti-fraud systems.
Getnet also enables us to provide a fully integrated offering to SME customers, including card payment solutions. One of them is “Conta Integrada,” a bundle combining a current account with an integrated card payment solution which rewards customers who concentrate their sales on POS devices.
In order to ensure the high quality of our products and services, we have received these relevant certifications:
| · | Tier III – international seal of availability, reliability and security in data centers; |
| · | PCI – the highest recognition of data security for the payment card industry; |
| · | PIN Visa 2.0 – to enhance validation methods and improve consistency with compliance assessments; |
| · | ISO 27.001 – attests to the excellence of processes and security in confidentiality, integrity and availability of information; |
| · | ISO 10.002 – excellence in the treatment of complaints in electronic means of payment; and |
| · | Reclame Aqui’s RA1000 Seal, which is given to companies with excellent levels of service and commitment to after-sales. |
The following table sets forth certain key financial and operating data regarding our merchant acquiring business for the periods indicated.
| | | As of and For the Year Ended December 31, | | Change between 2016 | | Change between 2015 |
| | | 2017 | | 2016 | | 2015 | | and 2017 | | and 2016 |
| | | (R$ millions, except as otherwise indicated) |
| Market share of total turnover(1) | | | 11.5 | % | | | 9.5 | % | | | 7.7 | % | | | 2.1 p.p. | | | | 1.7 p.p. | |
| Debit turnover | | | 51.2 | | | | 37.6 | | | | 29.3 | | | | 36.0 | % | | | 28.3 | % |
| Credit turnover | | | 90.9 | | | | 70.6 | | | | 53.7 | | | | 28.7 | % | | | 31.4 | % |
| Number of debit transactions (thousand) | | | 840,171 | | | | 592,937 | | | | 436,396 | | | | 41.7 | % | | | 35.9 | % |
| Number of credit transactions (thousand) | | | 743,263 | | | | 654,090 | | | | 381,937 | | | | 13.6 | % | | | 71.3 | % |
Cash Management
We offer cash management solutions to corporate customers and SMEs online through our Internet banking and mobile banking services. Our revenues from cash management include fees from the following products which we offer: (i) collections, in which we assist customers in carrying out commercial transactions using printed or online payment slips; (ii) payments, consisting of simple and automatic management of our customers’ accounts payable activities through individual transactions or via electronic file transfer; (iii) payroll, which is intended to facilitate the management of salary and benefits payments to our customers’ employees via an online tool; (iv) collection of values, which consists of the payment of cash values and checks at the customer’s points of sale; and (v) custody, by which we perform the custody, control and deposit of predated checks up to the date of clearing.
Customer Funding
Since we are primarily a commercial bank, our main sources of liquidity are customer funding through deposits and other bank funding instruments. These deposits, combined with equity and other instruments, enable us to meet most of our liquidity and legal reserve requirements. As of December 31, 2017, customer deposits amounted to R$276.0 billion, representing 63.5% of total funding, which amounted to R$434.6 billion.
For more information, refer to “Item 5. Review and Operating and Financial Outlook—B. Liquidity and Capital Resources—Liquidity and Funding.”
Investments
Our investment products are created through a qualified advisory process that seeks to understand our customers’ investment profile. This analysis allows us to map out solutions for our customers’ short-, medium- and long-term objectives.
Our recommendations are always based on a “recommended portfolio” solution, which seeks better returns for our customers through the combination of diversified products and services that meet the specific needs of each customer, as well as our own objectives.
Our portfolio is composed of a wide range of products, which are distributed and offered at our branches and digital channels, including investment funds, which are managed by Santander Asset Management, time deposits, real estate credit notes, agricultural credit notes, financial letters and structured notes certificates, which are treasury-managed, and other products such as equities, derivatives, exchange traded funds, real estate funds and public securities, which are intermediated by Santander Corretora.
Additionally, our partnership with Zurich Santander allows us to offer a wide range of private pension plans.
Service Channels
We offer our financial services and products to our customers through our multichannel distribution network, composed of: (i) physical channels, such as branches, mini-branches, or PABs, and ATMs; (ii) call centers; and (iii) digital channels, such as Internet banking and mobile banking.
The main focus of our service channels is to provide our customers a full range of services across all channels, according to their choices and/or needs. The availability of digital service channels gives our customers the necessary autonomy to meet most of their needs through digital channels. This enables our branch employees to focus on customer service and the provision of advice rather than operational tasks. Our investment in digital channels has been important in developing this strategy.
Physical Distribution Network
Our distribution network provides integrated financial services and products to our customers through a variety of channels, including branches and mini-branches (or PABs) and ATMs. The following table presents our physical distribution network as of the dates indicated.
| | | As of December 31, |
| | | 2017 | | 2016 | | 2015 |
| Branches | | | 2,255 | | | | 2,254 | | | | 2,262 | |
| PABs | | | 1,211 | | | | 1,167 | | | | 1,175 | |
| Own ATMs | | | 13,522 | | | | 13,806 | | | | 14,221 | |
| Shared ATMs | | | 21,195 | | | | 19,868 | | | | 18,550 | |
Branch Network
Our branch network offers our customers our entire portfolio of products and services with personal and customized customer service. As of December 31, 2017, we had a network of 2,255 full service branches throughout Brazil, 85% of which were concentrated in the Southeast and South regions.
The table below shows the geographic distribution of our branch network as of the dates indicated.
| | | As of December 31, |
| | | 2017 | | 2016 | | 2015 |
| Northeast | | | 8 | % | | | 8 | % | | | 8 | % |
| North and Midwest | | | 6 | % | | | 6 | % | | | 6 | % |
| Southeast | | | 72 | % | | | 72 | % | | | 72 | % |
| South | | | 13 | % | | | 13 | % | | | 13 | % |
PABs
We offer daily banking services to our SME and corporate customers and their employees through our PABs - located on their sites, as well as in hospitals and universities. Our PABs are generally exclusive sale points at customers’ sites. We believe that the presence of PABs in our customers’ offices strengthens our relationship and builds loyalty with those customers, who benefit from the convenience of conducting their banking transactions at their workplace.
ATMs
We operate an extensive network of 13,522 ATMs, including those located in our branches and PABs. In addition, our customers have access to the “Banco24Horas” network, which operates 21,195 ATM units. Through this network, our customers are able to access their accounts and conduct banking transactions, as well as purchase most of the products and services available in our portfolio.
Call Centers
Our call centers provide our customers with the opportunity to make inquiries, execute payment transactions and apply for products and services, such as personal loans. Our call centers are also an important distribution channel that offers our clients additional products and services to our customers.
As of December 31, 2017 our call centers served approximately 8.9 million customers and employed approximately 5,200 people.
Digital Channels
Our digital channels include Internet banking, mobile banking and other digital platforms intended to provide our customers a convenient manner in which to access the products and services which we offer. We have recently made improvements to our digital channels, including:
| · | Internet Banking. We have revised our Internet banking service with a view to simplifying it. The home screen now features the most important services, such as checking account, credit card, investments and personal loans, as well as the option to choose favorite features. We have also added a search engine, which helps customers find features that are not frequently used, such as income reports. |
| · | Mobile Banking.We have modernized our apps, which can be downloaded on mobile devices and smartphones from the Apple Store and Google Play store. As a new feature for investments, our apps now provides a graphical and consolidated view of the investment portfolio, in addition to allowing customers to make investments in mutual funds, fixed income products and others (as well as withdraw funds from the same). We also provide corporate and SME customers the possibility of making transfers and payments, checking their ContaMax account, simulating, contracting and canceling working capital loans, accessing the automatic prepayment of card receivables, using certain chat functions and unlocking and registering a new access password. |
The following table provides certain key operating information with regards to our digital channels as of the dates indicated.
| | | For the year ended
December 31, |
| | | 2017 | | 2016 | | 2015 |
| | | (in millions) |
| Number of digital customers(1) | | | 8.6 | | | | 6.4 | | | | 4.8 | |
| Number of digital channel transactions(2) | | | 3,699 | | | | 3,151 | | | | 2,460 | |
| Number of customers with biometric registration | | | 7.7 | | | | 6.6 | | | | 0.12 | |
| (1) | We define digital customers as customers who have used at least one of the digital channels made available by Santander Brasil (i.e., mobile banking and internet banking) in the preceding 30 days. |
| (2) | Refers to transactions carried out through Internet banking, mobile banking and other digital platforms. |
Internet banking and mobile banking transactions accounted for around 73.9% of all transactions in 2017, compared to 69.4% in 2016 and 65.9% in 2015. The following table provides an overview of the weight of each key non-physical distribution channel in our overall distribution system.
| | | For the year ended
December 31, |
| | | 2017 | | 2016 | | 2015 |
| | | | (%) | | | | | | | | | |
| Internet banking | | | 54.0 | | | | 54.3 | | | | 56.2 | |
| ATMs | | | 14.4 | | | | 16.7 | | | | 16.7 | |
| Mobile(1) | | | 19.9 | | | | 15.1 | | | | 9.7 | |
| Branch | | | 5.4 | | | | 6.8 | | | | 9.2 | |
| IVR(2) | | | 2.7 | | | | 3.8 | | | | 5.5 | |
| Call Center | | | 3.5 | | | | 3.3 | | | | 2.7 | |
| (1) | Includes tablet transactions. Data refers to total transactions (account holder and unique product-holder). |
| (2) | Interactive voice response is an automated telephony system in which a computer interacts with callers (who can use their voice and tones input via a keypad to communicate with the computer), gathers information and routes calls to the appropriate recipient. |
In addition to Internet banking and mobile banking, we have digital platforms that play an important role in providing a better digital experience for our customers and potential customers, including:
| · | Digital account opening. We have made it possible to open an account with Santander Brasil entirely online. |
| · | Santander Corretora App. We provide a digital trading platform for our brokerage customers. |
| · | Superdigital. Our digital payment platform is available online and through our mobile app. |
| · | Santander Financiamentos. We have made it possible for customers to simulate and enter into auto loans via our website as well as through our online app. |
| · | Autocompara. Autocompara allows customers to obtain insurance quotes from six different insurance companies and purchase the best offer through Autocompara’s website. |
| · | Esfera. Our reward and discount program can be accessed through a dedicated website and mobile app. |
| · | SantanderWay. SantanderWay is an app that allows customers to manage all their Santander Brasil cards through a digital channel. |
| · | ID Santander. ID Santander is an app designed to increase transaction security across our corporate Internet banking and Santander Empresas apps. |
| · | Getnet app. The Getnet app enables customers to manage credit and debit card sales on Getnet terminals, among other services. |
| · | Santander One Investimentos. Our Santander One Investimentos program features videos with information on the best investments for our customers and is available on our website and our YouTube channel. |
Technology and Infrastructure
We believe that proper management of technology is key for the efficiency of our business. Santander Brasil is continuously investing in new technologies and renewal of equipment and infrastructure, aiming to provide better solutions to our customers, improve profitability and grow our business. We operate a modern technology platform interconnected with that of the Santander Group, which allows us to serve our customers on an international scale. We believe that being interconnected with the technological platform of the Santander Group gives us an advantage as we are the only international bank with significant operations in Brazil. See also “Item 7. Major Shareholders and Related Party Transactions—B. Related Party Transactions—Information Technology Platform.”
One of our key goals is to be able to serve our customers through a number of channels, including both physical channels (such as branches) and digital channels (such as Internet and mobile banking). We endeavor to be customer-centric and be able to meet customers’ needs conveniently and effectively by enabling our customers to interact with us through the channels which they prefer from time to time.
In order to achieve this goal, in 2017, we released a new app called “Santander Way” developed for the credit card and payments market which, among other functionalities, allows our customers to shop using a virtual card (secure online shopping), enable or disable the use of customers own credit cards outside of Brazil and manage their expenditure and limits in an user-friendly manner.
Below are a few of the other initiatives which we have undertaken in order to be able to provide our customers with an enhanced digital experience:
| · | Continuous improvements to our mobile banking systems.We have made continuous incremental improvements to our mobile banking systems and interface, including making loan renegotiations via chat possible, providing “touchID” sign in, enabling customers to recharge their prepaid mobile phones, introducing ID Santander (an app designed to increase transaction security across our corporate Internet banking) as well as other steps to make it easier for our customers to perform transactions online. |
| · | Santander Pass.In 2017, we launched Santander Pass, a credit card using near-field communication technology which allows for contactless payments. We offer two devices (a bracelet and a sticker) linked to our customers’ cards to simplify our customers’ user experience. |
| · | Digital document management system.We have put in place a digital documents management platform to improve the day to day work of our branches and back office. The system was put in place in November,2016 and already contains approximately five million documents. |
| · | Biometric identification.As of December 31, 2017, we had enrolled over 10 million customers in our biometric identification platform, which allows our customers to access ATMs without using their debit or credit cards. |
| · | Digital client onboarding.We have put in place a digital client onboarding solution which enables customers to open an account with us entirely online. |
| · | Superdigital.We have made improvements to our Superdigital app, which enables customers to manage their finances in a different and dynamic way through a prepaid account. Services available include money transfers, payment sharing and other similar services available via chat. |
| · | New HR tools. We have a new human resources interactive portal which includes new tools such as working hours management, team information and personalized alerts. In addition, we have introduced “Santander Pessoas,” an application that enables employees to clock in and out by geolocation, and review their pay slips and working hours. |
| · | Academia Santander. We have also launched Academia Santander, which is both a physical space and an online platform intended to spread knowledge among our employees regarding strategic subjects such as innovation, digital culture and business unit management, among others. |
| · | Ongoing development.We are pursuing analyzing the possibility of introducing certain additional technologies to our operations, including: (i) research on speech analytics with regards to contact center calls, (ii) research of natural language processing to review legal agreements and (iii) launch of a new projects to deliver an improved chat-automated chat platform to support our employees. |
A key factor in making us a more digital organization has been the evolution in the way we develop new solutions internally. In 2016, we introduced a software development method known as “Scaled Agile” development. This involves putting together multidisciplinary teams from our business and technology functions and giving them the necessary autonomy to adapt to changing circumstances and requirements. We believe that these multidisciplinary, issue-focused teams are able to delivery projects in an efficient and more responsive manner. As of December 31, 2017, we had over 1,000 professionals spread through 100 “agile” teams covering approximately 70% of all our ongoing software development projects. We have also taken steps to increase the automation of development and release cycles through a software life cycle best practice known as “DevOps” which seeks to promote greater contact between IT developers and IT operations teams.
Communications and Marketing
In 2017, we used communication and marketing tools to deliver more streamlined and appropriate solutions against a demanding economic scenario. Our communications and marketing initiatives in 2017 included:
| · | Campaigns focused on debt renegotiation. We used the “Credit with Attitude” campaign, for example, to promote the proper use of credit. |
| · | Black Week Santander. We launched “Black Week Santander” in the last quarter of 2017 during which we placed more than 30 products and services on sale. |
| · | Reduced Response Times in Our Interactions with Customers.We launched the “Mesa Ágil Santander Brasil” pilot project at the end of 2017 pursuant to which we began providing our customer service on a 24/7 basis in order to significantly reduce our response time. |
| · | Social Media. In 2017, we accumulated around 3.3 million followers on Facebook, 183,900 on Twitter, 84,400 on LinkedIn, 57,000 on Instagram and 121,300 registered followers on YouTube. |
| · | Farol Santander. We launched the latest entrepreneurism, culture and leisure facility in the city of São Paulo, Farol Santander. The building, a landmark in the city of São Paulo, was initially inaugurated in 1947 and was acquired by Santander Brasil in 2000. Reopened on January 25, 2018, the Farol building was designed to connect citizens, their capacity, cultural identity and social relationships, thereby contributing to the redevelopment of the city’s old quarter. |
Sustainability
Our sustainability strategy is based on three pillars which are aligned with our business and Brazil’s development priorities: (i) social and financial inclusion, (ii) education and (iii) social and environmental businesses and management. Our solidity is based on a consistent risk culture and the responsible management of our activities. Through our practices, we seek to act as a transformational agent, contributing to the prosperity of our clients and society.
Social and Financial Inclusion
Our microcredit unit, Prospera Santander Microcrédito, is the largest productive and oriented microcredit operation - which is aimed at formal and informal micro entrepreneurs and focused on generating work and income - among privately owned banks in Brazil based on market share and portfolio value. In 2017, we launched products and services designed to increase access to banking services such as checking account, credit card, POS machines, personal accident insurance and savings accounts. As a result, in the year ended December 31, 2017, our microcredit unit disbursed a total of approximately R$800 million (a 32.9% increase compared to our disbursements in the year ended December 31, 2016), by generating more than 200,000 operations, from active customers, and opened approximately 36,000 new checking accounts. We maintained a high payment compliance rate (95.6%), as a result of our business model, educational actions, such as financial education lectures, and the capacity-building programParceiros em Ação, which is a private social investment program that supports the development of microenterprises in low-income regions where Prospera Santander Microcrédito is present. In the year ended December 31, 2017, 1,066 entrepreneurs were trained in 17 Brazilian cities.
ThePrograma Amigo de Valor, for instance, allows Santander Brasil, as well as our employees and customers, to transfer part of their owed income tax directly to the Child and Adolescent’s Rights Funds. In the year ended December 31, 2017, this program raised funds totaling R$12 million (a 14.5% increase compared to the year ended December 31, 2016), which were directed to 38 projects in Brazil. We expect that these projects will benefit approximately 10,000 children, adolescents and their families.
In addition, thePrograma Escola Brasil, a corporate volunteering program focusing on public schools, promoted over 400 actions with the effort of 1,174 employee volunteers, in 198 public schools.
Education
OurSantander Universidades Brasil program is committed to social and economic inclusion through investment in higher education programs, promoting the insertion of students in the labor market and supporting entrepreneurship and innovation initiatives with incentives and awards. In 2017,Santander Universidades Brasil, granted 3,437 scholarships to students.
Another important initiative to support education is Universia, the leading university network in Ibero-America. Universia has been sponsored by the Santander Group since its founding. In Brazil, there are 404 universities participating, 120 employment websites with over 800,000 job positions. In 2017, Universia Brazil recruited 2,800 students for internship positions, had over 17.3 million unique users in its website.
Social and Environmental Businesses
In 2015, we published and implemented our Socio-Environmental Responsibility Policy, or PRSA, based on the guidelines set forth in CMN Resolution 4,327/14, further incorporating sustainability into the organization’s analytic and decision-making processes. As part of our socio-environmental governance improvement process we launched the Senior Executive Committee of the PRSA, which is composed of the vice presidents of risk, human resources, communications, marketing, institutional relations and sustainability and the compliance officer. This committee will be involved in strategic decisions regarding the PRSA and will act as a bridge with the board of executive officers.
We offer products, services and programs which promote the development of our customers’ businesses in more sustainable ways. For example, in 2017, we participated in an issuance of green bonds in the amount of U.S.$500 million for projects involving energy efficiency, waste management and sustainable water management and two issuances for the construction of wind farms, in the amount of R$22 million. We have also set up an initiative to promote low-carbon financing. In 2017, we launched theCDC Socioambiental product for individual customers and thePlano Empresário Sustentável product for the construction sector. In the year ended December 31, 2017 we disbursed more than R$1.7 billion to socio-environmental financing.
We have continued to progress with “Fit to Grow,” which was implemented in 2016 to promote rational expenditure management. At the end of the first year of implementation, we had a reduction in consumption involving electricity (approximately of 6%), paper prints (of 4.5%) and air travel (of 19.5%).
Recognitions
Our sustainability strategy and practices have been recognized by the inclusion of Santander Brasil, for the eighth consecutive year, in the portfolio of theÍndice de Sustentabilidade Empresarial – “ISE” (Business Sustainability Index) of the B3. The ISE highlights companies with recognized commitment to social responsibility and business sustainability, in addition to acting as a promoter of best practices in the business community.
Other recognitions in 2017 included:
| · | We were recognized by the Exame Sustainability Guide promoted by “Revista Exame.” |
| · | We achieved third place in the category Leading Company in Corporate Governance 2017 in the Sustainable Leaders Agenda 2020 of ALAS20 Latinoamérica. |
| · | Spanish Chamber of Commerce in Brazil Award of Sustainability: Universia Brazil’s activities were one of the highlights in the “large companies” category. |
| · | With Fit to Grow case, we were recognized in the category of Sustainability in Products and Services, by the “Prêmio ECO,” organized by the American Chamber of Commerce. |
| · | We received the “Efficiency Practices Leader” awarded by the “Federación Latinoamericana de Bancos” (FELABAN) and the International Finance Corporation (IFC). |
| · | We were recognized by the Carbon Disclosure Project as one of the largest Brazilian leaders in climate change, having reached the highest score among companies in the financial sector. |
| · | Our head office received the “Guia de Rodas Seal,” a certification related to accessibility for people with disabilities. |
| · | In 2017, we contributed to the Santander Group’s inclusion in the Dow Jones Sustainability Index for an additional year (ranked tenth among banks included in the index, which includes a total of 319 companies). |
Insurance Coverage
We maintain insurance policies that we renew annually in order to protect our assets. All of our branches, affiliates and administrative buildings are insured against loss caused by fire, lightning, explosions and other risks. Such coverage establishes reimbursement for the asset replacement value.
In addition, we also maintain the following insurance policies:
| · | policies against material and/or bodily damage caused to third parties for which we are held responsible; |
| · | policies against financial losses due to fraud or employee misconduct, among others; |
| · | directors and officers insurance policy for our management against third-party complaints regarding management acts. There are insurance policies against crimes, employee dishonesty and damages arising out of public offerings; and |
| · | policies against hacker attacks and cyber-crimes. |
Dependence on Patents, Licenses, Contracts and Processes
In Brazil, ownership of trademarks can be acquired only through a validly approved registration with the National Institute of Intellectual Property (Instituto Nacional de Propriedade Industrial, or “INPI”), the agency responsible for registering trademarks, patents, designs and software in Brazil. After registration, the owner has exclusive rights of use of the trademark throughout Brazil for a 10-year period that can be successively renewed for equal periods.
As of the date of this annual report, we own 545 trademarks in Brazil, 365 of which are owned by Santander Brasil, with the remaining 180 owned by other companies of the Group.
The major trademarks we use, including, among others, the “Santander” and “Banco Santander” brands, are owned by the Santander Group. One of the Santander Group’s affiliates granted us a license to use such brands. All material trademarks for our business are registered or have been submitted to INPI by us or by the Santander Group.
We also own the principal domain names used in our business, which include:
| (1) | www.santanderbrasil.com.br; |
| (2) | www.bancosantander.com.br; |
| (3) | www.bsantander.com.br; |
| (4) | www.corretorasantander.com.br; |
| (5) | www.gruposantander.com.br; |
| (7) | www.santander.net.br; and |
Our Intellectual Property department monitors social media pages for any unauthorized use of our trademarks. In addition, our Internet domain names are registered and monitored by the Santander Group in accordance with its policies, and the registration and creation by us of Internet domain names are subject to the prior approval of our Intellectual Property department.
Competition
In the last few decades, the Brazilian financial system has experienced significant structural changes, following the evolution of the country’s economic environment and developing a solid framework, for both legal and financial supervision.
The consolidation of the Brazilian financial sector in the recent past, with the merger of large banks and the privatization of state-owned banks, led to increased competition in the Brazilian market for banking and financial services. According to the Brazilian Central Bank, in December 2017, there were 135 universal banks, 20 commercial banks and 13 investment banks, along with several brokers, leasing companies and other financial institutions operating in Brazil. Between 2011 and 2016, the Brazilian economy grew less than in prior years while delinquency rates, inflation and currency depreciation increased. Consequently, financial institutions operating in Brazil intensified their efforts to reduce their exposure to credit risk by increasing their provisions for credit losses, moving their credit portfolio from products with larger spreads (and therefore, increased credit risk) to products with lower risks (and therefore, lower spreads) and shifting to a more conservative product mix. In 2017 the Brazilian economy began recovering with GDP growing by 1% during the year.
Currently, there are five commercial financial institutions at the forefront of the Brazilian financial industry in terms of assets: Santander Brasil, Bradesco, Itaú Unibanco, Banco do Brasil and Caixa Econômica Federal. Together, these financial institutions accounted for 76.0% of the credit and 84.1% of the deposits available in the country in September 2017, according to the Brazilian Central Bank and the financial statements of the aforementioned banks.
Industry Transformation
Public Sector
Despite the privatizations and consolidations in the banking industry, the Brazilian government still controls commercial banks at both the state and federal levels. In addition to their significant roles as credit providers (with a 54.1% market share) and deposit takers (with a 43.0% market share, according to the Brazilian Central Bank. The state-owned banks also act as regional development agencies, with a strong position in markets such as housing and rural credit.
The three main financial institutions controlled by the federal government are:
| · | Banco do Brasil, a full-service bank that offers a wide range of products to the public and private sectors, and runs public rural loans programs. It is the main financial agent of the Brazilian government; |
| · | Caixa Econômica Federal, a full-service bank, mainly involved in deposit taking, housing credit and urban infrastructure development; and |
| · | BNDES, a development bank which offers credit lines of medium and long-term financing at competitive interest rates to the private sector, especially the industrial sector. It operates with direct or indirect financing, through the transfer of resources to other state or privately owned financial institutions. |
Private Sector
We consider two privately owned financial institutions to be our main competitors: Bradesco and Itaú Unibanco. Both have established brands and distribution capacity throughout the country, competing in every category of banking activity. Furthermore, we also face competition from local and regional banks that operate with commercial banking products in specific niches. In the GCB segment, our competitors are global financial institutions focused on investment bank services, which fill this role as a result of their experience in complex and structured operations, as well as their distribution network throughout Europe, North America and Asia.
Market Share
The following table shows the market share of the four leading financial institutions in Brazil at the dates indicated:
| | | Santander Brasil | | Bradesco | | Itaú Unibanco | | Banco do Brasil |
| | | | (%) | | | | | | | | | | | | | |
| Total assets(1) | | | 8.4 | % | | | 13.2 | % | | | 17.3 | % | | | 17.1 | % |
| Total loans(2) | | | 7.9 | % | | | 12.3 | % | | | 14.6 | % | | | 18.7 | % |
| Total deposits(2) | | | 9.2 | % | | | 12.0 | % | | | 20.0 | % | | | 20.4 | % |
| (1) | According to the IF report of the Brazilian Central Bank in December 2017. |
| (2) | According to the Brazilian Central Bank, reported and presented in accordance with BR GAAP (December 2017). |
Brazilian Credit Market
The Brazilian credit market is based on two types of loans:
| · | mandatory or earmarked credit, which is subject to government-controlled interest rates and follows rules for funding and destination defined by law; and |
| · | market-based credit, which is not subject to any constraints regarding interest rates, funding or resource allocation. |
By the end of December 2017, 51.3% of the R$3,086 billion of total credit outstanding in Brazil was market-based credit, of which 53.7% were loans to individuals and 46.3% were corporate and SME loans:
| | | 2017 | | 2016 | | 2015 |
| | | | (R$ billion) |
| Total outstanding loans | | | 3,086 | | | | 3,105 | | | | 3,219 | |
| Earmarked credit | | | 1,503 | | | | 1,549 | | | | 1,582 | |
| Market-based credit | | | 1,583 | | | | 1,556 | | | | 1,637 | |
| Corporate and SME | | | 732 | | | | 747 | | | | 832 | |
| Individuals | | | 851 | | | | 809 | | | | 805 | |
Source: Brazilian Central Bank.
Credit to Individuals
According to the Brazilian Central Bank, the total outstanding market-based credit for individuals increased at an average annual compounded rate (“CAGR”) of 4.3% between December 2012 and December 2017, reaching R$850.5 billion, or 27.6% of total loans in Brazil.
The following table shows the evolution of the main retail credit products offered to individuals:
| | | 2017 | | 2016 | | 2015 | | CAGR between December 2015 and December 2017 |
| | | | (R$ billion, except for percentages) |
| Overdraft accounts | | | 21.8 | | | | 23.3 | | | | 24.7 | | | | (6.1 | )% |
| Payroll loans | | | 310.5 | | | | 287.6 | | | | 272.5 | | | | 6.7 | % |
| Personal loans | | | 101.9 | | | | 101.7 | | | | 107.5 | | | | (2.7 | )% |
| Credit card | | | 201.1 | | | | 184.9 | | | | 173.4 | | | | 7.7 | % |
| Auto loans | | | 150.8 | | | | 144.8 | | | | 163.0 | | | | (3.8 | )% |
| Mortgage loans (individuals only) | | | 565.1 | | | | 534.4 | | | | 499.6 | | | | 6.3 | % |
| Agricultural loans (individuals only) | | | 176.2 | | | | 162.5 | | | | 153.7 | | | | 7.0 | % |
| Others | | | 121.6 | | | | 121.3 | | | | 117.6 | | | | 1.7 | % |
| Total | | | 1,649.0 | | | | 1,560.7 | | | | 1,512.2 | | | | 4.4 | % |
Source: Brazilian Central Bank.
Despite the economic recession in 2015 and 2016, the housing and real estate financing market continued to grow. According to the Brazilian Central Bank, the ratio of mortgage loans to GDP increased from 4.3% in December 2011 to 9.5% in December 2017. Government financing for housing and real estate accounts for approximately 28.6% of the retail credit market in Brazil, according to the Brazilian Central Bank. As of December 31, 2017, our market share was 5.5%.
Historically, the costs of market-based loans in Brazil have always been high due to the lack of competition and high default rates. Payroll loans are a safer and more attractive type of market-based loan for individuals. As its payments are deducted directly from the borrower’s paycheck, it is considerably less risky and, therefore, has lower interest rates than unsecured consumer credit, and presented a CAGR of 10.6% between December 2012 and December 2017. As of December 31, 2017, payroll loans accounted for approximately 18.8% of the retail credit market in Brazil. As of December 31, 2017, we had an 8.3% market share in payroll loans, according to the Brazilian Central Bank.
The auto loan market has very competitive interest rates and the market’s ability to access a low-cost source of funding is an important advantage. Thus, this market has been dominated by the large retail banks, which gradually assumed the business from the automakers’ lending arms. As this product is secured by the asset being financed, it tends to have lower default rates than other market-based products. As a result of deteriorating economic conditions in Brazil, the auto loan portfolio decreased by 11.1% in 2016 but increasing by 4.1% in 2017 as a result of the improving condition of the Brazilian economy. As of December 31, 2017, we ranked first in the auto loan market, with a market share of 23.2%, according to the Brazilian Central Bank.
The credit card market has relatively high default rates and, as a result, higher interest rates than other market-based products. This market is dominated by the large retail banks, operating their own labels associated with international labels (such as Visa and MasterCard). In November 2013, the Brazilian Central Bank began to regulate electronic payment services with a view to decreasing the risks associated with electronic transactions and reducing related costs. As of December 31, 2017, we had a 14.2% the market share in credit cards in terms of revenue, according to the Brazilian Central Bank.
Corporate and SME Credit
According to the Brazilian Central Bank data, the amount of loans granted to companies has increased at a CAGR of 2.1% between December 2012 and December 2017, reaching R$1.4 trillion, or 46.6% of the total lending in Brazil. The main corporate products are BNDES loans and working capital loans, which account for 15.8% and 9.5%, respectively, of total loans in the country according to the Brazilian Central Bank.
Asset Management
According to ANBIMA, the asset management industry in Brazil increased at a CAGR of 11.9% between December 2011 and December 2017, reaching R$3.8 trillion of total assets. Retail funds represent 25.7% of this total. The largest players in the market are the large financial conglomerates and their main customers are institutional investors, including pension funds, insurance companies and private banking customers. As of December 31, 2017, we had a 7.8% market share with regard to assets under administration, according to ANBIMA.
REGULATION AND SUPERVISION
The basic institutional framework of the Brazilian financial system was established by Law 4,595, of December 31, 1964, as amended from time to time (the “Banking Reform Law”). The Banking Reform Law created the CMN, responsible for establishing the general guidelines of the monetary, foreign currency and credit policies, as well as regulating the institutions of the financial system.
Principal Regulatory Agencies
CMN
The CMN oversees the Brazilian monetary, credit, budgetary, fiscal and public debt policies. The board of the CMN is composed of the president of the Brazilian Central Bank, the Minister of Planning and the Minister of Finance and is chaired by the Minister of Finance. Pursuant to the Banking Reform Law, the CMN is the highest regulatory entity within the Brazilian financial system, authorized to regulate the credit operations of Brazilian financial institutions, to regulate the Brazilian currency, to supervise Brazil’s reserves of gold and foreign exchange, to determine Brazilian savings and investment policies and to regulate the Brazilian capital markets with the purpose of promoting the economic and social development of Brazil. In this regard, the CMN also oversees the activities of the Brazilian Central Bank and the CVM.
Brazilian Central Bank
The Brazilian Central Bank is responsible for implementation of the CMN policies related to foreign currency and credit, regulation of Brazilian financial institutions, including as regards the minimum capital and compulsory deposit requirements, disclosure of the transactions carried out by financial institutions, as well as their financial information and monitoring and regulation of foreign investments in Brazil. The Brazilian Central Bank has committees to address specific issues, noteworthy among which is the Monetary Policy Committee (“Copom”), which has the purpose of adopting measures to fulfill the inflation targets defined by the CMN and establishing monetary policy guidelines. The activity of the Copom in the control of inflation targets includes the definition of the target for the SELIC Rate (the average rate for daily financing, backed by federal instruments, as assessed under the Special Settlement and Custody System) and publication of reports on the Brazilian economic and financial environment and projections for the inflation rate.
CVM
The CVM is responsible for implementation of the policies established by the CMN related to securities, with the purpose of regulating, developing, controlling and inspecting the securities market and its participants (companies with securities traded in the market, investment funds, investors, financial agents, such as custodians of instruments and securities, asset managers, independent auditors, consultants and instruments and securities analysts).
Self-Regulating Entities
The Brazilian financial and capital markets are also subject to the regulation of self-regulating entities that are divided by field of activity. The self-regulating entities include, among others, the National Association of Investment Banks – ANBIMA, the Brazilian Association of Credit Card and Services Companies – ABECS, the Brazilian Banks Federation – FEBRABAN, the Brazilian Association of Publicly-Held Companies – ABRASCA and the B3.
Principal Limitations and Obligations of Financial Institutions
In line with leading international standards of regulation, Brazilian financial institutions are subject to a series of limitations and obligations. In general, such limitations and obligations concern the offering of credit, the concentration of risk, investments, operating procedures, loans and other transactions in foreign currency, the administration of third-party funds and micro-credit. The restrictions and requirements for banking activities, established by applicable legislation and regulations, include the following:
| · | No financial institution may operate in Brazil without the prior approval of the Brazilian Central Bank. In December 2017, the CMN enacted a new rule establishing that all such requests submitted to the Brazilian Central Bank must be approved within 12 months (subject to suspension of the term in some instances). In addition, foreign banks must be expressly authorized by a presidential decree to operate in Brazil; |
| · | A Brazilian financial institution may not hold direct or indirect equity interests in any company located in Brazil or abroad without prior approval of the Brazilian Central Bank. In addition, the corporate purpose of the company in which the financial institution invests shall be complementary or subsidiary to the activities carried out by the financial institution. The following do not depend on such prior approval: (i) equity interests typically held in the investment portfolios of investment banks, development banks, development agencies (agências de fomento) and full-service banks with investment or development portfolios and (ii) temporary equity interests not registered as permanent assets of the financial institution; |
| · | Brazilian financial institutions must submit for prior approval by the Brazilian Central Bank the corporate documents that govern their organization and operation, including but not limited to those related to capital increases, transfer of headquarters, opening, transfer or closing of branches (whether in Brazil or abroad), election of the members of the statutory bodies and any corporate restructuring or alteration in the composition of their equity control. In December 2017, the CMN enacted a new rule establishing all requests of change of control submitted to the Brazilian Central Bank must be approved within 12 months and all requests for changes to organizational documents mentioned above must be approved within three months (in both cases subject to suspension of the term in some instances); |
| · | Brazilian financial institutions must fulfill minimum capital and compulsory deposit requirements and must observe certain operational limits; |
| · | A Brazilian financial institution may not own real estate, except for properties it occupies and subject to certain limitations imposed by the CMN. If a financial institution receives real estate, for example, in satisfaction of a debt, such property must be sold within one year, unless otherwise authorized by the Brazilian Central Bank; |
| · | Brazilian financial institutions must comply with the principles of selectivity, guarantee, liquidity and risk diversification; |
| · | A Brazilian financial institution cannot lend more than 25% of its Regulatory Capital (Patrimônio de Referência) to a single person or group; |
| · | A Brazilian financial institution cannot carry out credit transactions with (i) its controlling shareholders, directors and members of other statutory bodies (fiscal, advisory and other) and their respective spouses and relatives up to second degree, (ii) with the individuals or legal entities that hold a qualified interest (15% of the capital stock) in their capital, (iii) with the legal entities in which they have qualified interest (direct or indirect), (iv) with the legal entities in which they have effective operational control or preponderance in the deliberations, regardless of the equity interest, and (v) with the legal entities with common directors or members of the board of directors. Such prohibition shall not be applied, subject to limits and conditions still to be issued, to: (i) transactions carried out under market-compatible conditions, without additional benefits or different benefits when compared to the operations deferred to the institution other customers with the same profile, (ii) credit operations that have as counterparty a financial institution that is part of the institution prudential conglomerate, provided that they contain contractual clauses of subordination, except in the case of overnight and loan transactions with other financial institutions specified by the law, (iii) the interbank deposits, according to the law, (iv) the obligations assumed by related parties under the compensation and settlement services authorized by the Brazilian Central Bank or by the CVM and their respective counterparties, and (v) other cases authorized by the CMN; the management of third-party assets must be segregated from other activities and must follow the regulations issued by the CVM; |
| · | The total amount of the funds applied in permanent assets of the financial institutions cannot exceed 50% of their adjusted stockholders’ equity; |
| · | Brazilian financial institutions must comply with anti-money laundering and anti-corruption regulations; |
| · | Brazilian financial institutions must implement policies and internal procedures to control their systems of financial, operating and management information, as well as their conformity to all applicable regulations; |
| · | Brazilian financial institutions must implement a policy for remuneration of board members and executive officers that is compatible with their risk management policies. At least 50% of the variable remuneration must be paid in stock or instruments based on stock and at least 40% of the variable remuneration must be deferred for payment at least three years in the future; and |
| · | The Banking Reform Law and specific regulations enacted by the CMN provide for the imposition of penalties on financial institutions in certain situations where applicable requirements, controls and requisites have not been observed. In addition, the Brazilian Central Bank may cancel the financial institution’s authorization to operate if the Brazilian Central Bank identifies at any time, in relation to a given financial institution: (i) habitual non-performance of the transactions considered to be essential for financial institutions, (ii) operational inactivity, (iii) non-establishment at the address provided to the Brazilian Central Bank, (iv) non-remittance to the Brazilian Central Bank for a period of more than four months, without acceptable justification, of the consolidated financial statements required by the applicable regulations, and (v) non-accomplishment of the business plan. The cancellation of an authorization for operation of a financial institution may only occur upon the establishment and processing of the appropriate administrative proceeding by the Brazilian Central Bank. |
Additionally, as part of the Santander Group and due to the global nature of our organization we are subject to related international rules.
Capital Adequacy and Leverage – Basel
Current Requirements
The Brazilian Central Bank supervises the Brazilian banking system in accordance with the Basel Committee on Banking Supervision (“Basel Committee”) guidelines and other applicable regulations, including the Basel II Accord (“Basel II”), which was recently implemented in Brazil, and the Basel III Accord (“Basel III”), which supplements and amends Basel II and is in the process of being implemented. For this purpose, banks provide the Brazilian Central Bank with the information necessary for it to perform its supervisory functions, which include supervising the changes in the solvency and the capital adequacy of banks.
The main principle that guides the directives set forth in Basel II and Basel III is that a bank’s own resources must cover its principal risks, including credit risk, market risk and operational risk.
Brazilian financial institutions are subject to capital measurement and standards based on a weighted risk-asset ratio. The parameters of this methodology resemble the international framework for minimum capital measurements adopted by Basel II, except for certain differences (for instance, Basel II requires banks to have a capital to risk-weighted assets ratio of at least 8.0%, while current Brazilian rules require minimum capital of 11.0% of risk weighted assets). Brazilian financial institutions’ regulatory capital is composed of two tiers. Tier I capital is represented by stockholders’ equity plus certain reserves, earned income and hybrid debt and capital instruments authorized by the Brazilian Central Bank. Tier II capital is represented by revaluation reserves, contingency reserves, special profit reserves related to mandatory dividends not yet distributed, preferred cumulative stock, certain subordinated debt and hybrid instruments and non-realized earnings related to available-for-sale securities market value adjustments.
Basel III
On December 16, 2010, the Basel Committee issued the Basel III framework, which supplements and amends Basel II. Basel III includes higher minimum capital requirements and new conservation and counter cyclical buffers capital requirements, revised risk-based capital measures and the introduction of a new leverage ratio and two liquidity standards. As with other Basel directives, the Basel III framework will not be self-effectuating and will be implemented gradually by each country through legislation or regulation to be imposed upon that country’s home banks. Basel III is currently being implemented in Brazil and its implementation is expected to conclude on January 1, 2022, according to the agreed international timeframe.
Regulatory capital will continue to be composed of two tiers.
Tier I capital will have to reach a minimum index of 6.0% (according to the schedule established by the Brazilian Central Bank), divided into two portions: (i) Principal Capital consisting mainly of corporate capital and profit reserves (shares, units of ownership, reserves and earned income) of at least 4.5%, and (ii) Supplementary Capital consisting mainly of hybrid securities and capital instruments authorized by the Brazilian Central Bank (but excluding amounts relating to funding instruments issued by other local or foreign financial institutions) and any of our own shares purchased by us and the integration of which into the Supplementary Capital is permitted. To improve the quality of the capital of financial institutions, Basel III restricts the acceptance of financial instruments that fail to demonstrate effective capability of absorbing losses and requires the reduction of assets that in certain situations could jeopardize the financial institution’s capital value due to the instruments’ low liquidity, dependence on future profits for realization or difficulty of value measurement.
Current hybrid instruments and subordinated debt approved by the Brazilian Central Bank as additional capital requirements or Tier II are expected to be maintained if they also comply with requirements introduced by Basel III, including the mandatory conversion clauses into equity or write-off upon the occurrence of triggering events provided for in the regulations. The instruments that do not comply with Basel III rules have been gradually reduced since January 1, 2013 and shall continue to be so reduced until they do not consist of any portion of our regulatory capital as from January 1, 2022.
In accordance with the Basel III standards, the Brazilian Central Bank created the Premium Principal Capital (Adicional de Capital Principal), which corresponds to additional capitals (buffers) that create additional capital reserves to be used in periods of stress. In accordance with CMN regulation, the Brazilian Central Bank is entitled to establish the percentage of the Premium Principal Capital within certain minimum and maximum limits previously set forth by the CMN, the final minimum and maximum limits being 2.5% and 5%, respectively, of the weighted risk-asset ratio.
On December 29, 2014, the Brazilian Central Bank established that the amount of the Premium Principal Capital shall start at 0.625% of the weighted risk-asset ratio as of January 1, 2016, and shall increase to 1.25% on January 1, 2017, 1.875% on January 1, 2018 and 2.5% on January 1, 2019.
In 2015, the CMN and the Brazilian Central Bank enacted a set of rules which determine that the Premium Principal Capital will be equivalent to the sum of the Capital Conservation Buffer (Adicional de Conservação de Capital Principal), the Countercyclical Buffer (Adicional Contracíclico de Capital Principal), and the Systemic Relevance Premium Principal Capital (Adicional de Importância Sistêmica de Capital Principal). The regulation establishes the minimum requirements and methods to calculate each of them separately. The Conservation Buffer and the Countercyclical Buffer will compose the Premium Principal Capital of all financial institutions and
institutions authorized to operate by the Brazilian Central Bank (except for those expressly waived from complying with regulatory capital requirements). The Systemic Relevance Premium Principal Capital will only apply to multiple banks, commercial banks, investment banks and saving banks (caixas econômicas).
The Basel III minimum capital index will increase from the current 11% to a maximum of 13%. The total index will be calculated as the sum of two parts: the Regulatory Capital and the Premium Principal Capital.
The Basel III rules also provide for the implementation of a leverage ratio calculated by the division of the Tier I capital by a bank’s total exposure. In early 2015, the Brazilian Central Bank issued a new regulation governing the calculation and reporting of the leverage ratio of Brazilian financial institutions in line with the Basel III rules which became effective in October 2015.
In 2015, the CMN and the Brazilian Central Bank also issued a set of rules for the implementation in Brazil of the liquidity coverage ratio or “LCR,” a short-term liquidity index. The purpose of the LCR is to demonstrate that financial institutions have sufficient liquid assets to make it through a stress scenario lasting one month. According to the recently enacted rules, the largest Brazilian banks have been required to maintain an LCR of at least 60% since October 2015. This ratio will increase 10% annually until it reaches 100% in 2019. The Brazilian Central Bank also released in 2015 the local methodology for calculating the LCR so as to align the existing rules with the guidelines of the document “Basel III: The Liquidity Coverage Ratio and liquidity risk monitoring tools” issued by the Bank for International Settlements on January 2013. In January 2017, the Brazilian Central Bank enacted a new rule amending the calculation method and procedures for disclosure of LCR information. The new regulation establishes a new possible stress scenario and for purposes of LCR retail includes spot and forward deposits.
As mentioned above, the LCR is a short-term liquidity ratio for a 30-day stress scenario. It represents the result of the division of the high quality liquidity assets by net outflows. High Quality Liquidity Assets are composed mainly by Brazilian federal government bonds and reserve requirements returns. Net Outflows are mainly composed by losses of deposits, offset in part by Inflows, which are mainly credits. In the months ending on October 31, November 30 and December 31, 2017, Santander Brasil had a surplus (difference between net assets and net cash outflows) of R$14.6 billion, which resulted in an LCR of 123%, above the regulatory requirement of 80%.
In November 2017, the CMN established a minimum limit for the Net Stable Funding Ratio (Índice de Liquidez de Longo Prazo, or “NSFR”) and the Leverage Ratio (Razão de Alavancagem, or “RA”) with which Brazilian financial institutions are required to comply. The NSFR corresponds to the ratio between the Available Stable Funds (Recursos Estáveis Disponíveis, or “ASF”) and the Required Stable Funds (Recursos Estáveis Requeridos, or “RSF”) of the financial institution. The financial institutions classified as “segment 1” for purposes of the application of prudential rules, as we are, must maintain, as from October 1, 2018, a minimum NSFR of 1.00. The RA consists on the ratio between the sum of the principal capital and the supplementary capital divided by the total liabilities of the financial institution as determined pursuant to applicable regulation. The financial institutions classified as “segment 1,” as we are, or “segment 2” for purposes of the application of prudential rules are required to maintain a minimum RA of 3% starting on January 1, 2018.
The following table presents an estimate of the implementation schedule of the main changes related to capital adequacy and leverage expected as a result of Basel III, as established by the Brazilian Central Bank:
| Parameters | | 2013 | | 2014 | | 2015 | | 2016 | | 2017 | | 2018 | | As from 2019 |
| Common equity | | | 4.5 | % | | | 4.5 | % | | | 4.5 | % | | | 4.5 | % | | | 4.5 | % | | | 4.5 | % | | | 4.5 | % |
| Tier I | | | 5.5 | % | | | 5.5 | % | | | 6.0 | % | | | 6.0 | % | | | 6.0 | % | | | 6.0 | % | | | 6.0 | % |
| Regulatory capital | | | 11.0 | % | | | 11.0 | % | | | 11.0 | % | | | 9.9 | % | | | 9.3 | % | | | 8.6 | % | | | 8.0 | % |
| Capital conservation buffer | | | — | | | | — | | | | — | | | | 0.6 | % | | | 1.3 | % | | | 1.9 | % | | | 2.5 | % |
| Countercyclical buffer | | | — | | | | up to 0.6% | | | | up to 1.3% | | | | up to 1.9% | | | | up to 2.5% | | | | up to 2.5% | | | | up to 2.5% | |
In addition, in order to enable the implementation of the Basel III framework in Brazil, certain legislative changes were made. Among others, Law No 12,838 enacted on July 9, 2013, granted powers to the Brazilian Central Bank to limit the payment of dividends by financial institutions in case of non-compliance with the prudential capital requirements defined by the CMN.
Systemically Important Financial Institutions
The assessment of the global systemic importance of financial institutions (“IAISG”) comprises the index of systemic importance (“ISG”) and the aggregate of ancillary indexes established by regulations issued by the Brazilian Central Bank, which take into account, among other things, amounts relating to certain current and long-term liabilities, deposits, financial transactions and revenues. The Brazilian Central Bank adopted the same components set out by the Basel Committee to calculate the ISG, including (i) size; (ii) interconnectedness; (iii) lack of readily available substitute or financial institution infrastructure for the services provided; (iv) global or cross-jurisdictional activity; and (v) complexity, with each of these components receiving an equal weight in the assessment.
This assessment should be carried out by banks with total exposure in excess of R$500 billion, individually or at the consolidated enterprise level (conglomerado prudencial), as the case may be. Our controlling shareholder Santander Spain is considered a global systemically important financial institution in accordance with the Basel Committee rules. In Brazil, we are considered a systemically important financial institution pursuant to regulations issued by the Brazilian Central Bank.
Other Applicable Laws and Regulations
Consolidated Enterprise Level (conglomerado prudencial)
Financial institutions must submit to the Brazilian Central Bank, monthly and semi-annually, consolidated financial statements based on the “consolidated enterprise level” (conglomerado prudencial) of which the financial institution is a member, which serve as the basis for calculation of the required regulatory capital of the Brazilian institutions. The “consolidated enterprise level” (conglomerado prudencial) includes data relative to the financial institutions and other institutions authorized to operate by the Brazilian Central Bank, administrators of consortia, payment institutions and credit factoring companies, including real estate credit, or of credit rights, such as mercantile foment companies, securitization companies and specific purpose companies, located in Brazil or abroad, as well as other legal entities headquartered in Brazil that have equity participation in the mentioned entities as their exclusive business purpose.
Segmentation for the Proportional Application of Prudential Regulation
In January 2017, the CMN enacted a resolution establishing segmentation for financial institutions, financial institution groups, and other institutions authorized to operate by the Brazilian Central Bank for the purposes of proportional application of the prudential regulation. The segmentation is based on the size, international activity and risk profile of members of each segment. Pursuant to the resolution, the segments are as follows:
(i) Segment 1 comprises multiservice banks, commercial banks, investment banks, foreign exchange banks and savings bank with (a) an asset base equivalent or superior to 10% of Brazil’s GDP; or (b) which perform relevant international activities, irrespective of the size of the institution;
(ii) Segment 2 comprises multiservice banks, commercial banks, investment banks, foreign exchange banks and savings banks with (a) an asset base lower than 10% of Brazil’s GDP; and (b) other institutions with an asset base equivalent to or greater than 1% of Brazil’s GDP;
(iii) Segment 3 comprises institutions with an asset base lower than 1% and equivalent to or greater than 0.1% of Brazil’s GDP;
(iv) Segment 4 comprises institutions with an asset base lower than 0.1% of Brazil’s GDP; and
(v) Segment 5 comprises (a) institutions with an asset base lower than 0.1% of Brazil’s GDP that applies a simplified optional method for the verification of reference equity’s minimum requirements, except for multiservice banks, commercial banks, investment banks, foreign exchange banks and savings bank; and (b) institutions not subject to the verification of reference equity.
We have been categorized by the Brazilian Central Bank in segment 1, the highest level for application of regulation for banks in Brazil.
Regulation of Risk and Capital Management Structure
In February 2017, the CMN enacted a new rule which unifies and expands the Brazilian regulation on risk and capital management for Brazilian financial institutions and other institutions authorized to operate by the Brazilian Central Bank. The new rule is also an effort to incorporate into Brazilian regulation new recommendations from the Basel Committee on Banking Supervision. The rule provides that risk management must be conducted through an integrated effort by the relevant entity (i.e., not only must risks be analyzed on an individual basis, but financial institutions and other institutions authorized to operate by the Brazilian Central Bank must also control and mitigate the adverse effects caused by the interaction between different risks). It also expands the rules and requirements on risk management governance and the competence and duties of the risk management officer.
The rule sets out different structures for risk and capital management which are applicable for different risk profiles, based on the risks profiles set out in the applicable regulation. This means that a financial institution of limited systemic importance can have a simplified structure of management, while institutions of larger complexity have to follow stricter protocols and implement the new rules until a closer deadline (180 days). Certain provisions of the new rule became effective on the date it was published and others will become effective within 360 days of such date.
Compulsory Reserve Requirements
Currently, the Brazilian Central Bank imposes a series of compulsory reserves requirements. Financial institutions must deposit these reserves with the Brazilian Central Bank. The Brazilian Central Bank uses these reserve requirements as a mechanism to control the liquidity of the Brazilian financial system for both monetary policy and risk mitigation purposes. Reserves imposed on time deposits, demand deposits and saving accounts represent almost the entirety of the amount that must be deposited at the Brazilian Central Bank.
Time Deposits (CDBs). The Brazilian Central Bank imposes a reserve requirement of 25.0% in relation to time deposits. Financial institutions must deposit an amount equivalent to the surplus of (i) R$3 billion for financial institutions with consolidated Tier 1 capital under R$2 billion; (ii) R$2 billion for financial institutions with consolidated Tier 1 capital between R$2 billion and R$5 billion; (iii) R$1 billion for financial institutions with consolidated Tier 1 capital between R$5 billion and R$15 billion; and (iv) zero for financial institutions with Regulatory Capital higher than R$15 billion. As from the end of April 2017, the reserve requirement on time deposits will be increased to 36.0% and the surplus will be calculated based on the following metrics: (i) R$3 billion for financial institutions with consolidated Tier 1 capital under R$3 billion; (ii) R$2 billion for financial institutions with consolidated Tier 1 capital between R$3 billion and R$10 billion; (iii) R$1 billion for financial institutions with consolidated Tier 1 capital between R$10 billion and R$15 billion; and (iv) zero for financial institutions with consolidated Tier 1 capital higher than R$15 billion.
Demand Deposits. As a general rule, the Brazilian Central Bank imposes a reserve requirement of 25% in relation to demand deposits.
Savings Deposits. The Brazilian Central Bank imposes a reserve requirement of 20% in relation to general savings deposits and to rural savings deposits.
Additional Deposit Requirements. The Brazilian Central Bank also stipulates an additional reserve requirement on deposits raised by full service banks, investment banks, commercial banks, development banks, finance, credit and investment companies, real estate credit companies and savings and loan associations, as amended in early January, 2017. These institutions are required to deposit on a weekly basis the sum of the following amounts: (i) 0% of the mathematical average of funds from time deposits and other specific amounts, subject to the reserve requirement; and (ii) 5.5% of the mathematical average of funds from savings accounts subject to the reserve requirement. These amounts must be discounted by: (i) R$3 billion for financial institutions with consolidated Tier 1 capital under R$3 billion; (ii) R$2 billion for financial institutions with consolidated Tier 1 capital between R$3 billion and R$10 billion; (iii) R$1 billion for financial institutions with consolidated Tier 1 capital between R$10 billion and R$15 billion; and (iv) zero for financial institutions with Regulatory Capital higher than R$15 billion. At the close of each day, the balance of such account should be equivalent to 100% of the additional reserve requirement.
Asset Composition Requirements
Permanent assets (defined as property and equipment other than commercial leasing operations, unconsolidated investments and deferred charges) of Brazilian financial institutions may not exceed 50% of their adjusted net equity, calculated in accordance with the criteria established by the Brazilian Central Bank.
Brazilian financial institutions may not have more than 25.0% of their Regulatory Capital– Tier 1 allocated to credit and leasing transactions and guarantees extended to the same customer or group of customers acting jointly or representing the same economic interest. In addition, Brazilian financial institutions must comply with an exposure limit of 25.0% of their Regulatory Capital in connection with underwriting for or investments in securities of the same entity, its affiliates, or controlled or controlling companies. Repurchase transactions executed in Brazil are subject to operational capital limits based on the financial institution’s Regulatory Capital, as adjusted in accordance with Brazilian Central Bank regulations. A financial institution may carry out repurchase transactions in an amount of up to 30 times its Regulatory Capital. Within that limit, repurchase transactions involving private securities may not exceed five times the Regulatory Capital. Limits on repurchase transactions involving securities backed by Brazilian governmental authorities vary in accordance with the type of security involved in the transaction and the perceived risk of the issuer as determined by the Brazilian Central Bank.
The regulation issued by the Brazilian Central Bank with respect to the classification and valuation of securities and derivative financial instruments—including government securities—owned by financial institutions, based on the investment strategy of the financial institution, determined that securities and derivatives are to be classified into three categories: (i) trading; (ii) available for sale; and (iii) held to maturity.
In September 2016, the CMN enacted a rule, which amends the regulation on repurchase transactions involving fixed-income securities. The recent changes to the regulation amend the list of the types of securities that may be subject to repurchase transactions by expressly including obligations issued by the International Finance Corporation and certain securities issued by leasing companies (Letras de Arrendamento Mercantil). It also removes the possibility of the Brazilian Central Bank adding to the list any securities not expressly listed in the regulation.
“Trading” and “available for sale” securities are to be marked-to-market with effects in income and stockholders’ equity, respectively. Securities classified as “held to maturity” are recorded at amortized cost. Derivatives are marked-to-market and recorded as assets and liabilities in the balance sheet. Changes in the market value of derivatives are generally recognized in income with certain modifications, if these are designated as hedges and qualify for hedge accounting under the regulations issued by the Brazilian Central Bank. Securities and derivatives in the “held to maturity” portfolio may be hedged for accounting purposes but their increase or decrease in value as derived from the marked-to-market accounting method should not be taken into account.
In this respect, on February 9, 2018, the Brazilian Central Bank submitted to public consultation a draft regulation which, if it comes into force, would provide that financial institutions categorized as “Segment 1” as per the Brazilian Central Bank’s classification system established in 2017 (which is our case) (1) may not have more than 25.0% of their Regulatory Capital allocated to a single legal or natural person, and (2) that the total exposure of such financial institutions to one individual customers may not exceed 600% of their Regulatory Capital allocated to focused exposure, that is 10% of their Regulatory Capital – Tier 1. All exposures subject to capital requirements would be considered for purposes of this proposed rule. The proposed rule also intends to establish the criteria for measurement of the exposures, definition of related parties, the acknowledgment of credit risk mitigators and a requirement to report compliance with the applicable limitations. The proposed rule would subject financial institutions categorized as segment 2, segment 3 or segment 4 to less restrictive rules.
Centralized Registration and Deposit of Financial Assets and Securities
In August 2017, the Brazilian Congress converted Provisional Measure No. 775, issued by the President of Brazil in April 2017, into Law No. 13,476. The new law consolidates the provisions on creation of liens over financial assets and securities. On the same day, the CMN issued a new rule to regulate the provisions set by Law 13,476 and consolidate the regulation on centralized deposit and registry of financial assets and securities issued or owned by financial institutions and other institutions authorized to operate by the Brazilian Central Bank. Law No. 13,476 became effective on March 1, 2018. On February 1, 2018 the Brazilian Central Bank submitted to public consultation a draft of a new rule to establish the terms for the creation of liens over financial assets registered with regulated entities.
Brazilian Payment and Settlement System
The rules for the settlement of payments in Brazil are based on the guidelines adopted by the Bank of International Settlements, or “BIS,” and the current Brazilian Payment and Settlement System (Sistema Brasileiro de Pagamentos e Compensação or the “SPB”). The Brazilian Central Bank and CVM (in relation to transactions with securities) have the power to regulate and supervise this system. SPB is composed of systems for the clearing of checks, clearing and settlement of debit and credit electronic orders, transfer of funds and other financial assets, clearing and settlement of transactions involving securities, clearing and settlement of transactions carried out in commodities and futures, and others, collectively designated as Financial Market Infrastructures, as well as the payment arrangements and payment institutions.
Within the scope of SPB, the Brazilian Central Bank operates the Reserves Transfer System (“STR”) and the SELIC. STR is a system of transfer of funds with real-time gross settlement, which means that transfers are made at the processing time, one by one, and are subject to the existence of outstanding balance in the account. STR is composed of financial institutions, clearing and settlement houses and the National Treasury Office. SELIC is a system intended for custody of book-entry securities issued by the National Treasury Office and for the registration and settlement of transactions involving such securities.
The interbank transfers of funds are not only settled by STR but also by the Funds Transfer System (Sitraf), the Deferred Settlement System for Interbank Credit Orders (Siloc) and the Centralizer Clearance for Checks (Compe), which are also part of SPB.
Treatment of Overdue Debts
The Brazilian Central Bank requires financial institutions to classify credit transactions in accordance with their level of credit risk and to make provisions according to the level attributed to each transaction. Such credit classifications shall be determined in accordance with criteria set forth from time to time by the Brazilian Central Bank, relating to the conditions of the debtor and the guarantor and the transaction terms. Where there are several credit transactions involving the same customer, economic group or group of companies, the credit risk must be determined by analyzing the particular credit transaction of such customer or group that represents the greatest credit risk to the financial institution.
Credit transactions of up to R$50,000 may be classified either by the financial institution’s own evaluation method or according to the number of days such transaction is past due, whichever is the more stringent. Credit classifications are required to be reviewed (i) monthly, in the event of a delay in the payment of any installment of principal or interest, in accordance with the maximum risk classifications; (ii) every six months, in the case of transactions involving the same customer, economic group or group of companies, the amount of which exceeds 5% of the adjusted net worth of the financial institution in question; and (iii) once every 12 months, in all circumstances, except in the case of credit transactions with a customer whose total liability is lower than R$50,000, the classification of which may be reviewed as provided above. Such R$50,000 limit may be amended by the Brazilian Central Bank from time to time.
The provisions set forth above are not applicable to our IFRS consolidated financial statements, which are based on the criteria described under “Item 5. Operating and Financial Review and Prospects—A. Operating Results—Critical Accounting Policies—Impairment Losses on Financial Assets.”
Credit Performance Information – Positive Registration
Brazilian law regulates databases containing credit performance information of individuals and legal entities. Dissemination of information from these databases is subject to the express request or authorization of the institution’s corresponding customers. Databases managed by a group of entities that jointly have net equity equal or higher than R$70 million (excluding any amounts relating to the interest holding among such entities) may receive credit performance information.
Collection of Bank Fees
The collection of bank fees and commissions is extensively regulated by the rules that seek standardization of the collection of bank fees and of the costs of credit transactions for individuals. According to these rules, bank services to individuals are divided into the following four groups: (i) essential services; (ii) priority services;
(iii) special services; and (iv) specific or differentiated services. Banks are not able to collect fees in exchange for supplying essential services to individuals with regard to checking accounts, such as (i) supplying a debit card; (ii) supplying 10 checks per month to accountholders who meet the requirements to use checks, as per the applicable rules; (iii) supplying a second debit card (except in cases of loss, theft, damage and other reasons not caused by the bank); (iv) up to four withdrawals per month, which can be made at a branch of the bank, using checks or in ATM terminals; (v) supplying up to two statements describing the transactions during the month, to be obtained through ATM terminals; (vi) inquiries over the Internet; (vii) up to two transfers of funds between accounts held by the same bank, per month, at a branch, through ATM terminals or over the Internet; (viii) clearing checks; and (ix) supplying a consolidated statement describing, on a month-by-month basis, the fees charged over the preceding year with regard to checking accounts and savings accounts.
Certain services rendered to individuals with regard to savings accounts also fall under the category of essential services and therefore are exempt from the payment of fees. CMN prohibits banks from charging fees for supplying essential services in connection with deposit and savings accounts where customers agree to access and use their accounts by electronic means only. In the case of these exclusively electronic deposit and savings accounts, banks are authorized to charge fees for supplying essential services only when the customer voluntarily elects to obtain personal service at the banks’ branches or customer service locations.
Priority services are those rendered to individuals with regard to checking accounts, transfers of funds, credit transactions, leasing, standard credit cards, over-the-counter exchange transactions for the purchase or sale of foreign currency in respect of international travel, and records, and are subject to the collection of fees by the financial institutions only if the service and its nomenclature are listed in its regulations. Commercial banks must also offer to their individual customers a “standardized package” of priority services, whose content is defined, as well as the customers’ option to acquire individual services instead of adhering to the package.
The collection of fees in exchange for the supply of special services (including, among others, services relating to rural credit, currency exchange market and on-lending of funds from the real estate financial system) is governed by the specific provisions found in the laws and regulations relating to such services. The regulation authorizes financial institutions to charge fees for the performance of specific services, provided either that the account holder or user is informed of the conditions for use and payment or that the fee and charging method are defined in the contract. Some of the specific services, among others, are (i) approval of signatures; (ii) management of investment funds; (iii) rental of safe deposit boxes; (iv) courier services; (v) custody and brokerage services, (vi) endorsement of customers debts (aval, or guarantee); and (vii) foreign currency exchange.
It is worth pointing out: (i) the prohibition against charging fees in cases of adhesion contracts amendments, except in the cases of asset replacement in leasing transactions, early liquidation or amortization, cancelation or termination; (ii) the prohibition against including services related to credit cards and other services not subject to fees in service packages that include priority, special and/or differentiated services; (iii) the requirement that subscription to service packages must be through a separate contract; (iv) the requirement that information given to the customer with respect to a service package must include the value of each service included in the package, the number of times that each service may be utilized per month, and the total price of the package; (v) the requirement that a customer’s annual banking statement must separately identify default interest, penalties and other costs charged on loans and leasing transactions; (vi) the requirement that registration fees cannot be cumulatively charged; and (vii) the requirement that overdraft fees can be charged, at most, once over the course of 30 days.
In addition, CMN regulations establish that all debits related to the collection of fees must be charged to a bank account only if there are sufficient funds to cover such debits in such account and thus forbid overdrafts caused by the collection of banking fees. Furthermore, a minimum of 30 days’ notice must precede any increase or creation of fees (except if related to credit card services, when a minimum of 45 days’ notice is required), while fees related to priority services and the “standardized package” can be increased only after 180 days from the date of the last increase (except if related to credit card services, when a minimum of 365 days’ notice is required) whereas reductions can take place at any time.
Late Payment Fees
The default payment fees charged by financial institutions, consumer credit companies (financeiras), and leasing companies are expressly limited to compensatory interest per day on the amount that is overdue, interest on arrears and fines on arrears.
Credit Cards
The banking regulations also have specific rules relative to the charging of credit card fees, the publication of information in the card invoices and the obligation to provide a package of basic services upon offering credit cards to customers. Credit card holders must pay monthly at least 15% of outstanding credit card balances. This minimum payment does not apply to credit cards with payment by means of direct payroll deductions.
Revolving credit for financings of credit card bills may only be extended to customers until the due date of the following credit card bill. After this term, financial institutions must offer customers another type of financing with conditions more favorable than the ones typically found in the credit card market. Banks are prohibited from offering this type of credit to customers who have already contracted one revolving credit for financing of credit card bills which was not repaid in a timely manner.
Payment Agents and Payment Arrangements
Since 2014, the CMN and the Brazilian Central Bank have powers to regulate payment mechanisms, players and transactions. The regulation issued by the Brazilian Central Bank, determines, among other aspects: (i) consumer protection and anti-money laundering compliance and risk prevention systems that should be observed by payment agents and payment arrangers; (ii) the procedures for incorporation, organization, authorization and operation of payment agents, as well transfer of shareholding control, subject to the Brazilian Central Bank’s prior approval; (iii) capital requirements; (iv) definition of arrangements excluded from the SPB; and (v) rules related to payment accounts, which are divided into prepaid and post-paid accounts and require the allocation of the totality of their balance to a special account at the Brazilian Central Bank or investment in government bonds.
In March 2018, the CMN enacted a set of new rules establishing, among others, the regulatory cost reduction by decreasing the maximum limit for the interchange fee in purchase domestic payment arrangements and checking accounts, in order to improve the competition.
Portability of Credit Transactions
Financial institutions’ customers can transfer their credit transactions from one institution to another. Such transfers must comply with the specific rules established by the Brazilian Central Bank, including, among others, the requirement that the amount and term of the transaction in the receiving financial institution must not be higher than the amount due and term of the original transaction.
Digitalization of Documents and Record Keeping
Financial institutions and other institutions authorized to operate by the Brazilian Central Bank may keep on their records digital documents instead of physical documents, provided that certain requirements to ensure the documents authenticity and validity are met such as recording if the physical document that originated the digital version was an original or a copy, the parameters to validate the document and select the technology used to ensure the security of the electronic documents, as well as the parameters to select the documents that will continue being kept as hard documents on the institution’s files.
Anti-Money Laundering Regulations
Under the Brazilian Anti-Money Laundering Law, it is a crime to conceal or dissimulate the nature, origin, location, availability, transaction or ownership of assets, rights or amounts resulting, directly or indirectly, from any criminal offense, as well as their use in economic or financial activity and the participation in a group, association or office while being aware that its principal or secondary activities are directed towards the practice of such acts.
The Brazilian Anti-Money Laundering Law also created theConselho de Controle de Atividades Financeiras (the Council of Control of Financial Activities, or “COAF”), which operates under the jurisdiction of the Ministry of Finance. The purpose of the COAF is to investigate, examine, identify and impose administrative sanctions in respect of any suspicious occurrences of illicit activities related to money laundering in Brazil. The COAF is composed of individuals with recognized competence in this area, appointed by the Minister of Finance, all of whom are nominated by each of the following entities: (i) the Brazilian Central Bank; (ii) the CVM; (iii) the SUSEP; (iv) the National Treasury Attorney-General’s Office; (v) the Brazilian Federal Revenue; (vi) the Federal Intelligence Agency; (vii) Ministry of Foreign Affairs; (viii) the Ministry of Justice; (ix) the Federal Police Department; (x) the Ministry of Social Security; and (xi) the General Comptroller’s Office, one of whom will be the president, which shall be appointed by the President of Brazil on the basis of recommendations by the Minister of Finance.
Brazilian anti-money laundering legislation and applicable regulation issued by the CMN and the Brazilian Central Bank established that financial institutions must, among others:
| · | keep up-to-date records regarding their permanent customers (including registration data, statements of purpose and nature of transactions, their financial capacity, as well as the verification of characterization of customers as politically-exposed individuals); |
| · | adopt policies, procedures and internal controls; |
| · | record transactions involving Brazilian and foreign currency, securities, metals or any other asset which may be converted into money, including specific registries of issuances or recharging of prepaid cards; |
| · | keep records of transactions or groups of turnover of funds carried out by individuals or entities belonging to the same group or financial conglomerate, in a total amount that exceeds R$10,000 in a calendar month or which reveal a pattern of activity, amount or form that suggests a scheme to avoid identification, control and registration; |
| · | review transactions or proposals the features of which may indicate criminal intentions; and |
| · | keep records of every transfer of funds related to, among others (a) deposits, wire transfers and checks, and (b) the issuance of checks and payment orders, in amounts that exceed R$1,000. |
Brazilian financial institutions must inform COAF in the manner established by the Brazilian Central Bank, by the day following the date on which any of the following transactions, proposed or carried out, were verified:
| · | transactions carried out or services provided, whose amount equals or is greater than R$10,000 and for which, considering the parties involved, the amounts, the forms of execution, the instrument used or the lack of economic or legal bases could characterize the existence of evidence of the crimes provided for in the Brazilian Anti-Money Laundering Law; |
| · | transactions carried out or services rendered that, based on their frequency, amount or form, could be aimed at deceiving the identification, control and record mechanisms; |
| · | transactions carried out by or services rendered to, regardless of their amount, the persons that recognizably have perpetrated or attempted to perpetrate terrorist acts or have participated in them or facilitated their practice, as well as the existence of funds that belong to or are directly or indirectly controlled by them or by entities that belong or are directly or indirectly controlled by such persons, as well as by persons and entities acting on their behalf or under their orders; and |
| · | any acts that are believed to be financing terrorism. |
These communications must be made without providing knowledge thereof to the parties involved.
The records referred to above must be kept for five to ten years, depending on the nature of the information, from the end of the relationship with the customer.
Failure to comply with any of the obligations indicated above can subject the financial institution and its officers and directors to penalties that range from fines (not above 200% of the transaction amount or the real profit obtained or that would be obtained by carrying out the transaction or the amount of R$20 million) to the declaration of its officers and directors as ineligible to exercise any position at a financial institution and/or the cancellation of the financial institution’s operating license.
Government officials and auditors from the Brazilian Federal Revenue Service may also inspect an institution’s documents, books and financial registry in certain circumstances.
Financial institutions must maintain specific records of the transactions in cash (deposit, withdrawal, withdrawal by means of a prepaid card or request of provision for withdrawal) so as to enable the identification of a deposit in cash, withdrawal in cash, withdrawal in cash by means of a prepaid card, or request of provision for withdrawal, of an amount equal to or greater than R$100,000 or that presents evidence of concealment or dissimulation of the nature, of the origin, of the location, of the disposal, of the movement or of the ownership of assets, rights and valuables, as well as issuance of cashier’s checks, TED (Electronic Available Transfer) or of any other instrument of transfer of funds upon payment in cash, for an amount equal to or greater than R$100,000.
Financial institutions must also maintain specific records of transactions in cash (deposit, withdrawal, withdrawal by means of a prepaid card, request of provision for withdrawal or TED) by financial institutions of an amount equal to or greater than R$50,000. The regulations also provide for a minimum of three business days prior communication for withdrawals and cash payments of an amount equal to or greater than R$50,000.
Brazilian Anti-Corruption Law
Law No. 12,846 of August 1, 2013, Brazil’s new anti-corruption law (“Brazilian Anti-Corruption Law”), entered into force on January 29, 2014. This law aims at fulfilling international commitments assumed by Brazil as a result of the ratification of various anti-corruption treaties, as well as meeting the population’s demands for the creation of more effective mechanisms to fight corruption at the public administration level. The Brazilian Anti-Corruption Law establishes that legal entities will have strict liability regardless of fault or willful misconduct for acts against the public administration carried out in their interest or for their benefit. Although known as the Anti-Corruption Law, this Law encompasses not only performance of acts of corruption but also performance of other injurious acts contrary to the Brazilian or foreign public administration.
Corporations that violate the Brazilian Anti-Corruption Law’s provisions will be subject to heavy penalties, some of which may be imposed through administrative proceedings and others solely through judicial channels. The Brazilian Anti-Corruption Law also creates a leniency program under which self-disclosure of violations and cooperation by corporations might result in the reduction of fines and other sanctions.
Politically Exposed Individuals
Financial institutions and other institutions authorized by the Brazilian Central Bank to operate must take certain actions and have certain controls in order to establish business relationships with and to follow up financial transactions of customers who are deemed to be politically exposed individuals. The internal procedures developed and implemented for this purpose by financial institutions must be structured in such a way as to enable the identification of politically exposed individuals, as well as the origin of the funds involved in the transactions of such customers. One option is to verify the compatibility between the customer’s transactions and the net worth stated in such customer’s file.
Politically exposed individuals are public agents and their immediate family members, spouses, life partners and stepchildren who occupy or have occupied a relevant public office or position over the past five years in Brazil or other countries, territories and foreign jurisdictions.
Bank Secrecy
Brazilian financial and payment institutions shall also maintain the secrecy of their banking operations and services provided to their customers. The only circumstances in which information about customers, services or transactions of Brazilian financial and payment institutions may be disclosed to third parties are the following:
| · | the disclosure of information with the express consent of the interested parties; |
| · | the exchange of information between financial institutions for record purposes; |
| · | the supplying to credit reference agencies of information based on data from the records of issuers of bank checks drawn on accounts without sufficient funds and defaulting debtors; and |
| · | the occurrence or suspicion that criminal or administrative illegal acts have been performed, in which case the financial institutions and the credit card companies may provide the pertinent authorities with information relating to such criminal acts when necessary for the investigation of such acts. |
Complementary Law 105/01 also allows the Brazilian Central Bank or the CVM to exchange information with foreign governmental authorities, provided that a specific treaty has previously been executed.
The government of the Federal Republic of Brazil and the government of the United States of America executed an agreement on March 20, 2007, by means of which these governments established rules for the exchange of information relating to tax (“2007 Agreement”). Under the 2007 Agreement, the Brazilian tax authority would be able to send information it receives by virtue of Section 5 of the Bank Secrecy Law to the U.S. tax authority.
Auditing Requirements
The legislation and regulations issued by the CMN, CVM and B3 determine that the periodic financial statements of financial institutions must be audited by independent auditors (individuals or legal entities) that are registered with CVM and who meet the minimum requirements set forth by the Brazilian Central Bank, and that the financial statements must be presented together with an independent auditor’s report. Our financial statements are audited in accordance with International Standards on Auditing with regard to Brazilian GAAP and also on the standards of the Public Company Accounting Oversight Board with regard to IFRS as issued by the IASB, as required by the SEC. For purposes of the financial statements prepared according to Brazilian GAAP, as from January 2017 all financial institutions and other institutions authorized to operate by the Brazilian Central Bank are required to create provisions for all losses related to financial guarantees issued by them. As result of the auditing work, the independent auditor must prepare the following reports: (i) audit report, issuing an opinion regarding the accounting statements and the respective explanatory notes, including regarding the compliance with financial regulations issued by the CMN and the Brazilian Central Bank; (ii) internal control system quality and adequacy evaluation report, including regarding electronic data processing and risk management systems, evidencing any identified deficiencies; (iii) legal and regulatory provisions non-compliance report, regarding those which have, or may have, material impacts on the financial statements or on the audited financial institution’s operations; (iv) limited assurance report, analyzing Santander Brasil’s Annual and Sustainability Report pursuant to the guidelines and requirements of the Global Reporting Initiative (“GRI”); and (v) any other reports required by the Brazilian Central Bank, CVM and B3. The reports issued by independent auditors must be available for consultation upon request by the overseeing authorities.
Independent auditors and the fiscal council, when established, individually or jointly, must formally notify the Brazilian Central Bank of the existence or evidence of error or fraud, within three business days of the identification of the respective occurrence, including:
| · | non-compliance with legal rules and regulations which places the continuity of the audited entity at risk; |
| · | frauds of any amount perpetrated by the management of the institution; |
| · | material frauds perpetrated by the institution’s employees or third parties; and |
| · | errors that result in major incorrectness in the financial statements of the audited entity. |
The executive office of the financial institution must inform the independent auditor and the fiscal council, when established, if any of the above situations occur.
CMN regulation also requires financial institutions and certain other entities holding regulatory capital equal to or greater than R$1 billion to create a corporate body designated as the “audit committee.”
To obtain more information concerning the audit committee, see “Item 6. Directors, Senior Management and Employees—C. Board Practices—Board Advisory Committees—Audit Committee.”
New regulation on internal auditing of financial institutions
On June 29, 2017, the CMN enacted a new regulation establishing new guidelines for the implementation of internal audit controls for financial institutions. According to this new ruling, that will be effective as of December 31, 2017, financial institutions are required to establish and maintain internal audit activities compatible with their operational specifications, so that such internal bodies are able to perform an independent, autonomous and impartial audit of the quality and effectiveness of the institutions’ internal systems. The new regulation also requires that these activities to be performed by a unit directly controlled by the institution’s board of directors. In addition, Provisional Measure No. 784 has established new responsibilities to internal and external independent auditors, who may now be held liable for failures of the financial institution’s internal control mechanisms.
Socio-Environmental Responsibility Policy
Financial institutions are required to have a Responsibility Policy, which must guide the social and environmental actions in conducting their businesses, their relationship with their customers and other users of their products and services. The Responsibility Policy must also guide the financial institution’s relationship with its personnel and with any others affected by the financial institution’s activities. In addition, the Responsibility Policy must provide for the management of social and environmental risks (which, according to the Brazilian Central Bank, represent one of the several categories of risk to which financial institutions are exposed).
Policy for Succession of Financial Institutions Managers
Brazilian financial institutions and other institutions authorized to operate by the Brazilian Central Bank shall implement and maintain internal policies for succession of managers, applicable to higher levels of the institution’s management. The internal policy shall encompass the procedures related to recruitment, promotion, appointment and retention of managers in accordance with the institution’s rules for identification, evaluation, training and selection of the candidates to management offices.
Corporate governance of financial institutions
In April 2017, the CMN issued a new resolution with the purpose of incorporating in the Brazilian regulatory framework principles and criteria on corporate governance of financial institutions established by the Basel Committee on Banking Supervision, through the “Core Principles for Effective Banking Supervision.” This measure is an additional step towards aligning the Brazilian regulatory framework applicable to financial institutions with international recommendations.
The rule establishes the terms for the remittance to the Brazilian Central Bank of information on the financial institution’s management, controlling group and relevant shareholders, including the obligation to communicate to the regulator any information that may affect the reputation of any such persons. Financial institutions must make available a communication channel allowing employees, contributors, customers, users, associates, or services providers to report anonymously situations indicating illegalities of any nature related to the institution. Financial institutions must also have an internal body responsible for receiving the information and complying with the reporting obligations.
Compliance Policy
In August 2017, the CMN enacted a new rule providing that Brazilian financial institutions and other institutions authorized to operate by the Brazilian Central Bank must implement and maintain a compliance policy compatible with the nature, size, complexity, structure, risk profile and business model of the institution. The compliance policy is intended to ensure an effective compliance risk management by the institution and may be established at the consolidated enterprise level (conglomerado prudencial). Among others, the compliance policy must establish the scope and purpose of the compliance function in the institution, set forth the organizational structure of the compliance function, specify which personnel is allocated to the compliance function, and establish a segregation of roles among personnel in order to avoid conflicts of interest.
The compliance policy must be approved by the board of directors and the regulation also assigns to the board the responsibility to ensure the following: adequate management of the compliance policy throughout the institution, its effectiveness and continued application, its communication to all employees and services providers, as well as the dissemination of the integrity and ethical standards as part of the institutions culture. The board of directors is also responsible for ensuring the application of measures in case of non-compliance, and for providing the necessary means for the activities related to the compliance functions to be adequately conducted.
The entities subject to the new rule are required adopt and implement a compliance policy in accordance with such requirements by December 31, 2017.
Consumer Protection
Relationships between consumers and financial institutions are governed by Law 8,078, dated September 11, 1990 (“Brazilian Consumer Protection Code”), which grants consumers certain rights and sets forth measures to be observed by suppliers, which must be complied with by financial institutions. The Brazilian Consumer Protection Code sets forth as consumer rights, among others, the assistance/facilitation in the defense of consumer’s rights, including through reverse burden of proof in their favor, and possibility of judicial review of contractual provisions deemed abusive.
Furthermore, banking regulation establishes procedures that financial institutions must observe when contracting any transactions, as well as when rendering services. We may highlight the following as examples of said procedures:
| · | to timely provide the necessary information to allow customer’s and user’s free choice and decision-making process, including rights, duties, responsibilities, costs or advantages, penalties and possible risks when carrying out a transaction or rendering a service; |
| · | to timely provide, to the customer or user, agreements, receipts, statements, advices and other documents related to the transactions and services, as well as the possibility of timely cancellation of the agreements; |
| · | formalization of an adequate instrument setting forth the rights and obligations for opening, using and maintaining a post-paid payment account; |
| · | to forward a payment instrument to the customer’s or user’s residence or to enable the respective instrument only upon express request or authorization; and |
| · | identification of end users’ beneficiaries for payments or transfer in statements and bills of the payer, including in situations in which the payment service involves institutions participating in different payment arrangements. |
Financial institutions operating exclusively via digital means are excluded from the scope of certain aspects of the regulation.
Policy for Relationship with Customers and Users of Financial Products and Services
Financial institutions and other institutions authorized to operate by the Brazilian Central Bank must have a policy governing the relationship with customers and users of financial products and services. In addition, such entities shall comply with the principles of ethics, liability, transparency and diligence promoting the convergence of interests and the consolidation of the institutional image of credibility, security and expertise.
Ombudsman
Financial institutions and other entities which are authorized to operate by the Brazilian Central Bank must have an ombudsman office. In 2015, the regulatory framework that regulates the ombudsman office of the entities authorized to operate by the Brazilian Central Bank was updated. The new framework aims at establishing a more effective and transparent ombudsman office that is able to provide better assistance to the financial institutions’ customers. An ombudsman office has the following attributions according the current regulation:
| · | to provide last resort assistance in connection with customer claims that have not been resolved through the conventional customer service channels (including the banking correspondents and the Customer Service Attendance channel – SAC); |
| · | to act as a communication channel between the financial institutions and their customers, including for dispute resolution; and |
| · | to keep management informed of its activities. |
Financial institutions have been required to fully implement the above since June 2016. Institutions that are part of a financial group are allowed to establish one ombudsman department to service the whole group. The officer in charge of the ombudsman office must prepare a report every six months, which must be provided to the management and auditing bodies, as well as be available to the Brazilian Central Bank for a period of at least five years.
Certain amendments to the regulations governing the role of the ombudsman will come into force in July 2018, including the requirements to implement a system for customers to be able to assess and report on the performance of the ombudsman office and a requirement for financial institutions to disclose the existence of the ombudsman through their channels of communication.
Investment Funds Industry Regulation
Investment funds are subject to the regulation and supervision of the CMN and the CVM and, in certain specific matters, the Brazilian Central Bank. Investment funds may be managed by full-service banks, commercial banks, savings banks, investment banks, credit, financing and investment companies and brokerage and dealer companies within certain operational limits.
Investment funds may invest in any type of financial instrument available in the financial and capital markets, including for example, fixed income instruments, stocks, debentures and derivative products, provided that, in addition to the denomination of the fund, a reference to the relevant type of fund is included.
Investment funds may not:
| · | have more than 10% of their net worth invested in securities of a single issuer that is a publicly-held company (and that is not a financial institution), its controlling shareholders, subsidiaries and affiliates, or another investment fund; |
| · | have more than 20% of their net worth invested in securities issued by a financial institution (including the fund manager), its controlling shareholders, subsidiaries and affiliates; and |
| · | have more than 5% of their net worth invested in securities issued by an individual or private legal entity that is neither a publicly-held company nor a financial institution authorized to operate by the Brazilian Central Bank. |
Broker-Dealer Regulation
Broker and dealer firms are part of the national financial system and are subject to CMN, Brazilian Central Bank and CVM regulation and supervision. Brokerage firms must be chartered by the Brazilian Central Bank and are the only institutions in Brazil authorized to trade on stock exchanges. Both brokers and dealers may act as underwriters in the public placement of securities and engage in the brokerage of foreign currency in any exchange market.
Broker and dealer firms may not execute operations that may be qualified as the granting of loans to their customers, including the assignment of rights with limited exceptions; collect commissions from their customers related to transactions of securities during the primary distribution; acquire real estate which is not for their own use; or obtain loans from financial institutions, except for (i) loans for the acquisition of goods for use in connection with the firm’s corporate purpose or (ii) loans the amount of which does not exceed two times the relevant firm’s net worth.
Foreign Exchange Market
Transactions involving the sale and purchase of foreign currency in Brazil may be conducted only by institutions duly authorized by the Brazilian Central Bank to operate in the foreign exchange market. There is no current limit to long or short positions in foreign currency for banks authorized to carry out transactions on the foreign exchange market. Other institutions within the national financial system are not allowed to have short positions in foreign currency, although there are no limits with respect to foreign exchange long positions.
The Brazilian Central Bank imposes a limit on the total exposure in foreign currency transactions and transactions subject to foreign exchange fluctuation undertaken by Brazilian financial institutions, including branches abroad, and their direct and indirect affiliates. The limit is currently equivalent to 30.0% of the financial institution’s regulatory capital (Patrimônio de Referência), on a consolidated basis. The CMN, the Brazilian Central Bank and the Brazilian government may change the regulation applicable to foreign currency and foreign exchange transactions undertaken by Brazilian financial institutions in accordance with Brazil’s economic policy (including its foreign exchange policy).
Foreign Investment in Brazilian Financial Institutions
According to the Brazilian federal constitution, the acquisition of equity interests by foreign individuals or legal entities in the capital stock of Brazilian financial institutions is forbidden, unless permitted by bilateral international treaties or by the Brazilian government by means of a Presidential decree. A Presidential decree issued on November 13, 1997, issued in respect of Banco Meridional do Brasil S.A. (our legal predecessor) allows 100% foreign participation in our capital stock. Foreign investors may acquire the shares issued by Santander Brasil as a result of this decree. In addition, foreign investors may acquire publicly traded non-voting shares of Brazilian financial institutions traded on a stock exchange or securities depositary receipts offered abroad representing shares without specific authorization.
In addition, the Brazilian constitution prohibits foreign financial institutions from establishing new branches or subsidiaries in Brazil except when duly authorized by the President of Brazil and by the Brazilian Central Bank. A foreign financial institution duly authorized to operate in Brazil through a branch or a subsidiary is subject to the same rules, regulations and requirements that are applicable to any Brazilian financial institution.
Banking Correspondents
Financial institutions are allowed to provide specific services to customers, including customer services, through other entities. These entities are called “bank correspondents” and the relationship between the financial institution and the bank correspondent is ruled by a specific regulation published by CMN and is subject to the supervision of the Brazilian Central Bank.
Regulation of Branches
Authorization by the Brazilian Central Bank is required for operations of branches or subsidiaries of Brazilian financial institutions, upon the compliance with certain term, capital and equity requirements, as well as the submission of an economic and financial feasibility analysis.
The Brazilian Central Bank’s prior authorization is also required in order to: (i) allocate new funds to branches or subsidiaries abroad; (ii) subscribe capital increases, directly or indirectly, in subsidiaries abroad; (iii) increase equity participation, directly or indirectly, in subsidiaries abroad; and/or (iv) merge or spin off, directly or indirectly, subsidiaries abroad.
The Brazilian Central Bank determines that financial institutions can install the following establishments in Brazil: (i) branches, (ii) teller booths, (iii) automatic teller machines, and (iv) segregated administrative units, provided that, for items (i) to (iii), conformity with requirements of minimum capital and operating limits are necessary.
Cayman Islands Banking Regulation
We have a branch in the Cayman Islands with its own staff and representative officers. Banco Santander (Brasil) S.A. – Grand Cayman Branch is licensed under The Banks and Trust Companies Law (2013 Revision) of the Cayman Islands, or the “Banks and Trust Companies Law,” as a Category “B” Bank and it is duly registered as a Foreign Company with the Registrar of Companies in the Cayman Islands. The branch, therefore, is duly authorized to carry on banking business in the Cayman Islands. The branch was authorized by the local authorities to act as its own registered office and it is located at the Waterfront Centre Building, 28, North Church Street – 2nd floor, George Town, Grand Cayman, Cayman Islands, P.O. Box 10444 – KYI-1004, Phone: 1-345-769-4401 and Fax: 1-345-769-4601.
Our Grand Cayman Branch is currently engaged in the business of sourcing funds in the international banking and capital markets to provide credit lines for us, which are then extended to our customers for working capital and trade-related financings. It also takes deposits in foreign currency from corporate and individual customers and extends credit to Brazilian and non-Brazilian customers, mainly to support trade transactions with Brazil. The results of the operations of the Grand Cayman Branch are consolidated in our consolidated financial statements.
Banks and trust companies wishing to conduct business from within the Cayman Islands must be licensed by the Cayman Islands Monetary Authority under the Banks and Trust Companies Law, irrespective of whether the business is to be actually conducted in the Cayman Islands.
Under the Banks and Trust Companies Law, there are two main categories of banking license: a category “A” license, which permits unrestricted domestic and offshore banking business, and a category “B” license, which permits principally offshore banking business. The holder of a category “B” license may have an office in the Cayman Islands and conduct business with other licensees and offshore companies but, except in limited circumstances, may not do banking business locally with the public or residents of the Cayman Islands. We have an unrestricted category “B” license.
There are no specific ratio or liquidity requirements under the Banks and Trust Companies Law, but the Cayman Islands Monetary Authority will expect observance of prudent banking practices, and the Banks and Trust Companies Law imposes a minimum net worth requirement of an amount equal to CI$400,000 (or, in the case of licensees holding a restricted category “B” or a restricted trust license, CI$20,000). As of December 31, 2017, CI$1 was equivalent to R$4.0341, according to the Brazilian Central Bank.
Luxembourg Banking Regulation
Branches of credit institutions from outside the European Union (“non-EU credit institutions”) must be licensed by the Luxembourg Minister of Finance under the law of 5 April 1993 on the financial sector, as amended, in order to operate in Luxembourg.
We have a branch in Luxembourg with its own staff and representative officers. Our Luxembourg branch is licensed as a Luxembourg branch of a non-EU credit institution and is duly registered with the Luxembourg Trade and Companies’ Registry. The branch, therefore, is duly authorized to carry on banking business in Luxembourg. Its registered offices at 35F, avenue J.F. Kennedy, 2nd floor, L-1855 Luxembourg, Grand Duchy of Luxembourg.
Our Luxembourg branch is currently engaged in the business of sourcing funds in the international banking and capital markets to provide credit lines for us, which are then extended to our customers for working capital and trade-related financings. It also takes deposits in foreign currency from corporate and individual customers and extends credit to Brazilian and non-Brazilian customers, mainly to support trade transactions involving Brazil. The results of the operations of the Luxembourg branch are consolidated in our consolidated financial statements.
Luxembourg law requires the Luxembourg branch to have a minimum endowment capital of EUR 8,700,000 and the solvency and liquidity requirements deriving among others from EU Regulation No 575/2013 of the European Parliament and of the Council of 26 June 2013 on prudential requirements for credit institutions and investment firms apply to it.
Foreign Subsidiary
We established an independent subsidiary in Spain, Santander EFC, in order to complement our foreign trade strategy for corporate customers, which are composed of large Brazilian companies and their operations abroad. This allows us to provide financial products and services by means of an offshore entity which is not established in a “tax haven,” such as our Cayman Islands branch, in accordance with Law No. 12,249, of June 11, 2010, and Brazilian Federal Revenue Normative Ruling No. 1,037, of June 4, 2010.
The establishment of our foreign subsidiary was approved by the Brazilian Central Bank on September 26, 2011, by the SpanishMinisterio de Economia y Hacienda on February, 6, 2012 and by the Bank of Spain on March 28, 2012. The remittance of resources to pay up the share capital of the subsidiary was carried out on March 5, 2012, totaling €748 million. Santander EFC has been operational since March 2012.
U.S. Banking Regulation
Financial Regulatory Reform
Banking statutes and regulations are continually under review by the United States Congress. In addition to laws and regulations, the U.S. bank regulatory agencies may issue policy statements, interpretive letters and similar written guidance. Many changes have occurred as a result of the 2010 Dodd-Frank Act and its implementing regulations, most of which are now in place. More recently, the President of the United States issued an executive order in 2017 that sets forth principles for financial regulatory and legislative reform, and the Republican majority in Congress has also suggested an agenda for financial legislative reform. In addition, the five regulatory agencies charged with implementing the Section 13 of the U.S. Bank Holding Company Act of 1956, as amended, and its implementing rules (collectively, the “Volcker Rule”) are considering changes to the Volcker Rule regulations to make them less burdensome. It is too early to assess whether there will be any major changes in the regulatory environment or merely a rebalancing of the post-financial crisis framework, but we will monitor these developments and assess their impact on our operations.
Volcker Rule
The “Volcker Rule prohibits “banking entities” from engaging in certain forms of proprietary trading or from sponsoring or investing in “covered funds,” in each case subject to certain exceptions. The Volcker Rule also limits the ability of banking entities and their affiliates to enter into certain transactions with covered funds with which they or their affiliates have certain relationships. Banking entities such as Santander Brasil and Santander Spain were required to bring their activities and investments into compliance with the requirements of the Volcker Rule by the end of the conformance period applicable to each requirement. Santander Spain has assessed how the Volcker Rule affects its businesses and subsidiaries, including Santander Brasil, and has brought its activities into compliance. Santander Brasil has adopted processes to establish, maintain, enforce, review and test the compliance program designed to achieve and maintain compliance with the Volcker Rule. The Volcker Rule contains exclusions and certain exemptions for market-making, hedging, underwriting, trading in U.S. government and agency obligations, as well as certain foreign government obligations, and trading solely outside the United States, and also permits certain ownership interests in certain types of funds to be retained. Santander Spain’s non-U.S. banking organizations, including Santander Brasil, are largely able to continue their activities outside the United States in reliance on the “solely outside the U.S.” exemptions from the Volcker Rule. Those exemptions generally apply to proprietary trading, and sponsoring or investing in covered funds if, among other restrictions, the essential actions take place outside the United States and any transactions are not with U.S. persons.
On July 21, 2017 the five regulatory agencies charged with implementing the Volcker Rule announced the coordination of reviews of the treatment of certain foreign funds that are investment funds organized and offered outside of the United States and that are excluded from the definition of covered fund under the agencies’ implementing regulations. Also in July 2017, the Federal Reserve issued guidelines for banking entities seeking an extension to conform certain “seeding” investments in covered funds to the requirements of the Volcker Rule. Santander Spain will continue to monitor these developments and assess their impact on its operations, including those of Santander Brasil, as necessary.
U.S. Anti-Money Laundering, Anti-Terrorist Financing, and Foreign Corrupt Practices Act Regulations
Santander Brasil, as a foreign private issuer whose securities are registered under the U.S. Securities Exchange Act of 1934, is subject to the U.S. Foreign Corrupt Practices Act (the “FCPA”). The FCPA generally prohibits such issuers and their directors, officers, employees and agents from using any means or instrumentality of U.S. interstate commerce in furtherance of any offer or payment of money to any foreign official or political party for the purpose of influencing a decision of such person in order to obtain or retain business. It also requires that the issuer maintain books and records and a system of internal accounting controls sufficient to provide reasonable assurance that accountability of assets is maintained and accurate financial statements can be prepared. Penalties, fines and imprisonment of Santander Brasil’s officers and/or directors can be imposed for violations of the FCPA.
Furthermore, Santander Brasil is subject to a variety of U.S. anti-money laundering and anti-terrorist financing laws and regulations, such as the Bank Secrecy Act of 1970, as amended, and the USA PATRIOT ACT of 2001, as amended, and a violation of such laws and regulations may result in substantial penalties, fines and imprisonment of Santander Brasil’s officers and/or directors.
Antitrust Regulation
According to the Brazilian antitrust law, actions which concentrate market share must be previously submitted to CADE for approval if the following criteria are met: (i) at least one of the groups involved in the deal has posted annual gross revenues or volume of business equal to or over R$750 million, in Brazil, in the year prior to the transaction; and (ii) at least another group has posted annual gross revenues or volume of business equal to or over R$75 million, in Brazil, in the year prior to the transaction. Closing of a transaction without CADE’s approval will subject the parties to fines ranging from R$60 thousand to R$60 million.
The Brazilian Central Bank will also examine certain corporate reorganizations and other acts involving two or more financial institutions not only considering their potential effects on the financial system and its stability but also any potential impacts regarding market concentration and competition. Upon approval of the transaction, the Brazilian Central Bank may establish certain restrictions and require that the financial institutions execute an agreement of market concentration control, pursuant to which the terms and conditions of the sharing of the efficiency gain resulting from the act shall be set forth.
Insolvency Laws Concerning Financial Institutions
Financial institutions are subject to the proceedings established by Law 6,024 of March 13, 1974 (“Law 6024”), which establishes the applicable provisions in the event of intervention or extra-judicial liquidation by the Brazilian Central Bank, as well as to bankruptcy proceedings.
Intervention and extra-judicial liquidation occur when the Brazilian Central Bank has determined that the financial institution is in bad financial condition or upon the occurrence of events that may impact the creditors’ situation. Such measures are imposed by the Brazilian Central Bank in order to avoid the bankruptcy of the entity.
Intervention
An intervention can be carried out at the discretion of the Brazilian Central Bank in the following cases:
| · | risk to the creditors due to mismanagement; |
| · | consistent violation of Brazilian banking laws or regulations; or |
| · | if the intervention is a feasible alternative to the liquidation of the financial institution. |
As of the date on which it is ordered, the intervention will automatically suspend the enforceability of the payable obligations; prevent early termination or maturity of any previously contracted obligations; and freeze deposits existing on the date on which the intervention is decreed.
The intervention will cease if interested parties undertake to continue the economic activities of the financial institution, by presenting the necessary guarantees, as determined by the Brazilian Central Bank, when the situation of the entity is regularized as determined by the Brazilian Central Bank; or when extra-judicial liquidation or bankruptcy of the entity is ordered.
Intervention may also be ordered upon the request of a financial institution’s management.
Extra-judicial Liquidation
Extra-judicial liquidation is an administrative proceeding decreed by the Brazilian Central Bank (except that it is not applicable to financial institutions controlled by the Brazilian federal government) and conducted by a liquidator appointed by the Brazilian Central Bank. This extraordinary measure aims at terminating the activities of the affected financial institution, liquidating its assets and paying its liabilities, as in a judicially decreed bankruptcy. The Brazilian Central Bank will extra-judicially liquidate a financial institution if:
| · | the institution’s economic or financial situation is at risk, particularly when the institution ceases to meet its obligations as they become due, or upon the occurrence of an event that could indicate a state of insolvency under the rules of the Bankruptcy Law; |
| · | management seriously violates Brazilian banking laws, regulations or rulings; |
| · | the institution suffers a loss which subjects its unprivileged and unsecured creditors to severe risk; and/or |
| · | upon revocation of the authorization to operate, the institution does not initiate ordinary liquidation proceedings within ninety days or, if initiated, the Brazilian Central Bank determines that the pace of the liquidation may harm the institution’s creditors. |
A request for liquidation procedures can also be filed on reasonable grounds by the officers of the respective financial institution or by the receiver appointed by the Brazilian Central Bank in the receivership procedure.
The decree of extra-judicial liquidation will: (i) suspend the actions or foreclose on rights and interests relating to the estate of the entity being liquidated, while no other actions or executions may be brought during the liquidation; (ii) accelerate the obligations of the entity; and (iii) interrupt the statute of limitations with regard to the obligations assumed by the institution.
Extra-judicial liquidation procedures may be terminated:
| · | by discretionary decision of the Brazilian Central Bank if the parties involved undertake the administration of the financial institution after having provided the necessary guarantees; or |
| · | when the final accounts of the receiver are delivered and approved and subsequently registered in the relevant public records; or |
| · | when converted into ordinary liquidation; or |
| · | when a financial institution is declared bankrupt. |
Temporary Special Administration Regime (Regime de Administração Especial Temporária or “RAET”)
In addition to the intervention procedures described above, the Brazilian Central Bank may also establish a RAET, under Law 9447, dated March 14, 1997 combined with Law 6,024/74, which is a less severe form of the Brazilian Central Bank intervention in private and non-federal public financial institutions that allows institutions to continue to operate normally. The RAET may be ordered in the case of an institution which:
| · | continually enters into recurrent operations which are against economic or financial policies set forth in federal law; |
| · | faces a shortage of assets; |
| · | fails to comply with the compulsory reserves rules; |
| · | reveals the existence of hidden liabilities; |
| · | experiences the occurrence of situations that cause receivership pursuant to current legislation; |
| · | has reckless or fraudulent management; or |
| · | carries out activities which call for an intervention. |
The main objective of a RAET is to assist the recovery of the financial condition of the institution under special administration and thereby avoid intervention and/or liquidation. Therefore, a RAET does not affect the day-to-day business, operations, liabilities or rights of the financial institution, which continues to operate in the ordinary course of business. Measures which may be adopted by the institution include the transfer of assets, rights and obligations to other entities, and corporate restructuring of these entities, with a view to the continuity of the institution’s business or activities.
There is no minimum term for a RAET, which ceases upon the occurrence of any of the following events: (i) acquisition by the Brazilian federal government of control of the financial institution, (ii) corporate restructuring, merger, spin-off, amalgamation or transfer of the controlling interest of the financial institution, (iii) decision by the Brazilian Central Bank, or (iv) declaration of extra-judicial liquidation of the financial institution.
Bankruptcy Law
Law No. 11,101, of February 9, 2005, as amended (the “Bankruptcy Law”) regulates judicial reorganizations, out-of-court reorganizations and the bankruptcy of individuals and corporations that have occurred since 2005 and applies to financial institutions only with respect to the matters not specifically regulated by the intervention and extra-judicial liquidation regimes described above.
Repayment of Creditors in a Liquidation or Bankruptcy
In the event of extra-judicial liquidation or bankruptcy of a financial institution, creditors are paid pursuant to their priorities and privileges. Pre-petition claims are paid on a ratable basis in the following order: labor credits; secured credits; tax credits; credits with special privileges; credits with general privileges; unsecured credits; contractual fines and pecuniary penalties for breach of administrative or criminal laws, including those of a tax nature; and subordinated credits.
The current law confers immunity from attachment of compulsory deposits maintained by financial institutions with the Brazilian Central Bank. Such deposits may not be attached in actions by a bank’s general creditors for the repayment of debts and require that the assets of any insolvent bank funded by loans made by foreign banks under trade finance lines be used to repay amounts owing under such lines in preference to those amounts owing to the general creditors of such insolvent bank.
Recovery Plans for Systematically Important Financial Institutions
Systemically important Brazilian financial institutions must implement a recovery plan (plano de recuperação), with the aim of reestablishing adequate levels of capital and liquidity and to preserve the viability of such institutions. The recovery plans must identify their critical functions for the National Financial System, adopt stress-testing scenarios, define clear and transparent governance procedures, assess possible barriers to the entity’s recovery, as well as implement effective communication plans with key stakeholders.
Deposit Insurance - FGC
The purpose of the FGC is to guarantee the payment of funds deposited with financial institutions in case of intervention, liquidation, bankruptcy or insolvency. The FGC is funded by ordinary contributions made by the financial institutions in the amount of up to 0.0125% of the total amount of outstanding balances of the accounts corresponding to guaranteed obligations, and certain special contributions as determined. Delay in performing such contributions is subject to a penalty of 2% over the amount of the contribution.
The total amount of credit in the form of demand deposits, savings deposits, time deposits, deposits maintained in accounts blocked for transactions with checks (for the registration and control of funds relating to the rendering of services of payment of salaries, earnings, pensions), bills of exchange, real estate bills, mortgage bills, real estate credit bills and repurchase and resale agreements which object are instruments issued after March 8, 2012 by a company of the same group due to each customer by a financial institution (or by financial institutions of the same financial group) will be guaranteed by the FGC for up to a maximum of R$250,000 per customer. When the assets of the FGC reach 2% of the total amounts they guarantee, the CMN may temporarily suspend or reduce the contribution of financial institutions to the FGC. As from February 2016, credits of financial institutions and other institutions authorized to operate by the Brazilian Central Bank, complementary welfare entities, insurance companies, capitalization companies, investment clubs and investment funds, as well as those representing any interest in or financial instrument held by such entities, are not protected by the ordinary guarantee of FGC. In December 2017, the CMN enacted a new rule amending certain provisions of the FGC regulation among which the establishment of a limit of R$1 million per 4-year period for the coverage of the credits of a certain creditor against the group of associated financial institutions.
Bill of Law amending the administrative proceedings in the Brazilian national financial system, the Brazilian Payment System and capital markets
On October 20, 2017, Provisional Measure No. 784, issued on June 8, 2017, ceased to be effective. The modifications proposed by the Brazilian National Congress with regards to administrative measures applicable to the Brazilian national financial system, the Brazilian payment system and capital markets were then reissued under Law No. 13,506, of November 13, 2017, or “Law 13,506.”
Law 13,506 applies to entities authorized or supervised by the Brazilian Central Bank or by the CVM, as well as to market participants. Some of the key aspects of Law 13,506 are: (i) it increases the maximum fine applicable by the Brazilian Central Bank from R$250 thousand to R$2 billion or 0.5% of the revenues of the company arising from services and financial products in the year prior to the violation; (ii) it increases the maximum fine applicable by the CVM from R$500 thousand to R$50 million; (iii) it makes additional types of violations subject to penalties; (iv) it provides that the penalty of “public admonition” may be cumulative to other penalties applicable by the Brazilian Central Bank; (v) it provides that Brazilian Central Bank may enter into cease-and-desist commitments; and (vi) it provides that the Brazilian Central Bank and the CVM may enter into administrative agreements similar to leniency agreements.
Taxation
Corporate Income Tax (IRPJ) and Social Contribution Tax (CSLL)
The IRPJ is calculated at a rate of 15.0%, plus a surtax of 10.0% which is levied on profits exceeding the amount of R$240,000 per year and the CSLL is calculated at a rate of 20.0% for financial institutions and 9.0% for companies, after adjustments determined by the tax legislation.
Deferred tax assets and liabilities are computed based on temporary differences between the book basis and tax basis of assets and liabilities, tax losses, and adjustments to fair value of securities and derivatives.
According to the requirements in the current regulations, the expected realization of deferred tax assets is based on projections of future results and a technical study approved by the Directors of Santander Brasil.
The changes introduced by Law 11,638/2007 and by Law 11,941/2009 (articles 37 and 38), which modified the criteria for recognizing revenues, costs and expenses computed in the determination of net income, had no effect for purposes of determining the taxable profit for a legal entity which opted for the Transitional Tax Regime (“RTT”), being used for tax purposes the regulations in effect on December 31, 2007. The tax effects on the adoption of such rules are recorded, for accounting purposes, in the corresponding deferred assets and liabilities.
The RTT expired in 2015 by virtue of Law 12,973.
Tax on Services (ISS)
Each of the Municipalities of Brazil and the Federal District are responsible for establishing the applicable ISS rate which is charged on the value of services provided by us where we have branches or administrative centers. The rates vary from 2.0% to 5.0% and depend on the nature of the service.
On December 30, 2016, Supplementary Law No. 157/2016 was enacted. This new legislation establishes a minimum rate of 2.0% for these types of taxes (without any reductions or deductions being permitted). Law No. 157/2016 provides that the ISS owed by credit card managing companies (administradoras de cartões de créditos) should be paid to the municipality in which the service taker is located and where the corresponding POS has been registered. In addition, it also determined that the following services are subject to ISS in the municipality in which the service taker is located: (i) card management; (ii) leasing; (iii) fund management; and (iv) syndicate activities. Before the aforementioned Law was enacted, the ISS was due in the municipality in which the service provider was located (irrespective of where the service taker was located). With this new legislation, ISS rates may vary depending on where the service taker is located.
There are several complications that may arise from this new legislation, including (i) as service takers are generally located in several municipalities, it is logistically difficult to comply and collect the taxes; and (ii) there are situations where the municipality of the service taker is not easily identifiable by the credit card company (as is the case for online transactions, for example).
Since the ISS is a municipal tax, the rule must be regulated by each municipality in order to be enforceable. This new rule is only applicable to triggering events occurring from 2018 onwards, when the municipal regulations to the Supplementary Law No. 157 comes into force. On March 23, 2018, the Brazilian Supreme Court suspended the application of the Supplementary Law No. 157.
PIS and COFINS Tax Rates
PIS and COFINS (respectively, the profit participation contribution and the social security financing contribution, both of which are social contributions due on some revenues net of some expenses) payable by financial institutions and similar entities, as defined by law, are due at the rate of 0.65% and 4%, respectively. They are levied cumulatively on gross revenue billed, understood as the total revenues earned by the legal entity, net of certain expenses, such as funding costs.
The non-financial entities are taxed at the rates of 1.65% and 7.6% of PIS and COFINS, respectively, and are subject to non-cumulative incidence, which consists of deduction of certain expenses from the tax base as allowed by law.
Recent Amendments to the Brazilian Federal Tax Legislation
On May 14, 2014, Law No. 12,973 (the “2014 Tax Law”) was enacted, amending federal tax legislation with respect to IRPJ, CSLL, PIS and COFINS. The 2014 Tax Law governs the following matters, among others:
| · | the tax effects connected with IFRS; |
| · | the revocation of the Transitory Tax Regime – RTT, which was implemented to temporarily neutralize the tax effects related to IFRS until the 2014 Tax Law was enacted; |
| · | the valuation of controlled companies using the equity accounting method, including new provisions for the tax treatment applicable to goodwill or to the discount paid upon the investment in those entities; |
| · | the tax regime applicable to profits, dividends and interest on net equity paid by Brazilian companies; |
| · | creation of a new regime for controlled foreign companies – CFC rules – and the consequent tax effects arising from income earned abroad by Brazilian subsidiaries or affiliates; and |
| · | a new tax base for PIS and COFINS for financial institutions that includes the revenues from core activities of these companies. |
As mentioned above, on December 30, 2016, Supplementary Law No. 157/2016 was enacted by the Brazilian federal government. This new legislation establishes a minimum rate of 2.0% for this tax and changes the place where the collection and payment of the ISS should be made by certain service providers.
Tax on Financial Transactions (IOF)
IOF is a tax levied on credit, currency exchange, insurance and securities transactions and it is imposed on the following transactions and at the following rates:
Transaction(1) | Maximum Legal Rate | Current Rate |
| Credit extended by financial institutions and non-financial entities | 1.5% or 3% | 0.0041% per day for loans contracted by legal entities and 0.0082% per day for individuals capped at 365 days. An additional 0.38% rate is applicable in both cases. |
| Transactions relating to securities(2) | 1.5% per day | 0.5% per day for certain investment funds. |
| | | 0% on transactions with equity securities and certain debt securities, such as debentures and real estate receivables and agribusiness (CRI / CRA). |
| | | 1% per day on transactions with fixed income derived from federal, state, or municipal public and private bonds, and fixed income investment funds limited to certain percentages of the income raised from investment. This rate is reduced to zero from the 30th day following the acquisition date of the investment and on repurchase agreements carried out by financial institutions and other institutions authorized by the Brazilian Central Bank with debentures issued by institutions belonging to the same group (Decree 8,731/2016). |
| | | 0% on the assignment of securities to permit the issuance of Depositary Receipts abroad. |
| Transactions relating to derivatives | 25.0% | 0% on the notional value of the adjusted purchase, sale or maturity of financial derivative contract in the country that individually result in an increased foreign exchange exposure on a short position. |
| | | 0% on derivative contracts to hedge risks inherent to the price fluctuation of foreign exchange resulting from export contracts signed by an individual or legal entity resident or domiciled in the country. |
| | | 0% other transactions with derivative contracts not expressly mentioned by the tax law. |
| Insurance transactions entered into by insurance companies | 25% | 2.38% for health insurance. |
| | | 0.38% for life insurance. |
| | | 7.38% for other types of insurance. |
| Foreign exchange transactions(2) | 25% | 0.38% (general rule). |
| | | 6.38% on credit card transactions as from April 27, 2011. |
| | | 6.38% on withdrawals abroad using credit or debit cards as from December 28, 2013. |
| | | 6.38% on purchase of travelers checks or loading of international prepaid card as from December 28, 2013. |
| | | 0% for outflow of funds related to the payment of principal and interest in connection with foreign loans and financings. |
| | | 6% for the inflow of funds into Brazil, related to foreign loans subject to registration before the Brazilian Central Bank whose average maturity term is equal or less than 180 days. |
| | | 0% for the inflow of funds into Brazil, related to foreign loans subject to registration before the Brazilian Central Bank whose average maturity term is higher than 180 days. |
| | | 0% for interbank transactions. |
| | | 0% for exchange transactions in connection with the outflow of proceeds from Brazil for the remittance of interest on net equity and dividends to be received by foreign investors. |
| | | 0% for exchange transactions, including by means of simultaneous foreign exchange transactions, for the inflow of funds by foreign investors in the Brazilian financial and capital markets. |
| | | 0% for exchange transactions, including by means of simultaneous foreign exchange transactions, for the inflow of funds by foreign investors for purposes of initial or additional margin requirements in connection with transactions in stock exchanges. |
| | | 0% for exchange transactions for the outflow of funds invested by foreign investors in the Brazilian financial and capital markets. |
| | | 0% for exchange transactions for the inflow and outflow of funds invested by foreign investors, including by means of simultaneous foreign exchange transactions, in certificates of deposit of securities, known as BDRs. |
| | | 0% for simultaneous exchange transactions, for the inflow of funds by foreign investors derived from the conversion of direct investments in Brazil made pursuant to Law 4,131/62 into investments in stock tradable in stock exchanges as from May, 2 2016. |
| | | 0% for revenues related to the export of goods and services transactions. |
| | | The applicable rate is 1.10% for acquisitions of foreign currency (Decree 8,731/2016). 1.10% applicable to remittances to foreign bank account owned by Brazilian residents, as from March, 3 2018. |
| (1) | The transactions mentioned in the table are for illustration purposes and do not reflect an exhaustive list of transactions subject to the IOF. |
| (2) | There are some exemptions or specific cases in which the applicable rate is zero. |
FATCA
The Foreign Account Tax Compliance Act (“FATCA”) became law in the United States on March 18, 2010. The legislation requires foreign financial institutions (“FFIs”) (such as Santander Brasil) to enter into an FFI agreement under which they agree to identify and provide the U.S. Internal Revenue Service (“IRS”) with information on accounts held by U.S. persons and certain U.S.-owned foreign entities, or otherwise face a 30% withholding tax on certain U.S. source withholdable payments. In addition, FFIs that have entered into an FFI agreement will be required to withhold on such payments made to FFIs that have not entered into an FFI agreement, account holders who fail to provide sufficient information to classify an account as a U.S. or non-U.S. account, and U.S. account holders who do not agree to the FFI reporting their accounts to the IRS.
On September 23, 2014, Brazil and the United States announced that they entered into an intergovernmental agreement (“IGA”), which became effective in Brazil by virtue of Decree 8,506 as of August 24, 2015. The aim of the IGA is to improve international tax compliance and implement FATCA. The IGA establishes an automatic annual bilateral exchange of information with the U.S. tax authorities. Under this agreement, Brazilian financial institutions will generally be required to provide certain information about their U.S. account holders to the Brazilian tax authorities (Receita Federal do Brasil), which will share that information with the IRS.
Complying with the required identification, withholding and reporting obligations requires significant investment in an FFI’s compliance and reporting framework. We are continuing to follow developments regarding FATCA closely and are coordinating with all relevant authorities.
Common Reporting Standard
On December 28, 2016, Normative Ruling No.1,680 was enacted, introducing the Common Reporting Standard in Brazil. The Common Reporting Standard provides for certain account reporting obligations similar to those existing under FATCA. It was created in the context of the Organisation for Economic Co-operation and Development’s Base Erosion and Profit Shifting project, which is aimed at reducing tax avoidance. Normative Ruling No. 1,680 applies to legal entities required to present thee-Financeira pursuant to Normative Ruling No. 1,571, dated July 2, 2016.
On the same date, the Normative Ruling No. 1,681 was enacted providing for the obligation to annually deliver the “Country to Country Statement,” an ancillary obligation also arising from the discussions under the BEPS Project, before the Brazilian Federal Revenue Service (“RFB”) as a measure to expand information exchange and improve the level of international tax transparency. This new regulation should not have any impact on Santander Brasil, since, as it is controlled by a legal entity resident in Spain, it is not required by the Brazilian regulation to present such statement.
Alterations Related to the Service Tax
On December 30, 2016, Complementary Law No. 157/2016 was enacted. This new legislation establishes a minimum rate of 2.0% for these types of taxes (without any reductions or deductions being permitted). Law No. 157/2016 provides that the ISS owed by credit card managing companies (administradoras de cartões de créditos) should be paid to the municipality in which the service taker is located and where the corresponding POS has been registered. In addition, also determined that the following services are subject to ISS in the municipality in which the service taker is located: (i) card management; (ii) leasing; (iii) fund management; and (iv) syndicate activities. Before the aforementioned Law was enacted, the ISS was due in the municipality in which the service provider was located (irrespective of where the service taker was located). With this new legislation, ISS rates may vary depending on where the service taker is located. On March 23, 2018, the Brazilian Supreme Court suspended the application of the Supplementary Law No. 157.
Tax Amnesty Program
On January 13, 2016, the Brazilian federal government enacted Law 13,254, complemented by Normative Ruling No. 1,627 of March 15, 2016, which introduced an amnesty program aiming at encouraging Brazilian taxpayers to voluntarily disclose to the tax authorities the Brazilian Central Bank unreported assets held abroad (the-so calledRegime Especial de Regularização Cambial e Tributária, or “RERCT”) until December 31, 2014. Law No. 13,428/2017 extended that deadline to June 30, 2016 (and also provided that heirs may take advantage of RERCT, if the inheritance process prior to the RERCT application date.
Under the RERCT, taxpayers that declare previously unreported foreign assets to the competent authorities (without the need to bring these back to Brazil) will (i) be subject to the payment of income tax and a fine in the total amount of 30% on the total tax amount due and (ii) benefit from an amnesty in relation to any potential related criminal proceeding, provided that the assets are of legal origin. In order to benefit from the RERCT, the interested taxpayers had to file specific forms with the Brazilian tax authorities and the Brazilian Central Bank. According to IN 1,627/2016, the deadline to apply for participation in the RERCT expired on October 31, 2016.
In March 2016, the Brazilian Central Bank issued a regulation establishing the necessary operational procedures to implement the RERCT, which include amendments to the foreign exchange rules in order to allow the necessary remittance of funds to implement the RERCT.
On April 3, 2017, the Federal Revenue Office published Normative Ruling No. 1,704/2017 regulating the new round of the RERCT, under which taxpayers that have not yet disclosed their assets held abroad may do so until July 31, 2017.
The new program provides that income tax shall be assessed at a 15% rate, in addition to a penalty of 135% of the tax due (i.e., thus leading to a 20.25% penalty), thus resulting in a total tax burden of 35.25%. For purposes of the assessment of the income tax and penalty, the value of the assets as of June 30, 2016 should be reported to the tax authorities. Moreover, the amount related to these assets must be converted into Brazilianreaisaccording to the exchange rate provided for the Brazilian Central Bank on that same date, that is, June 30, 2016.
Special Regularization Tax Program
Provisional Measure No. 783 of 2017 was published on May 31, 2017, creating the Special Tax Regularization Program (Programa Especial de Regularização Tributária,or “PERT”) before the Brazilian Federal Revenue Office and the National Treasury Public Attorney’s Office. The Provisional Measure was converted into Law No. 13,496, of October 24, 2017 (“Law 13,496/17”). Taxpayers had until November 14, 2017 to apply for enrollment in the PERT tax relief program.
PERT encompasses tax and non-tax debts past due on or before April 30, 2017, including those covered by past tax relief programs (whether ongoing or terminated), under judicial or administrative dispute, or otherwise arising from tax assessments issued after publication of Law 13,496/17.
Taxpayers may use tax losses and the CSL negative tax base ascertained by December 31, 2015 and reported by July 29, 2016, whether relating to the taxpayer itself or to a party responsible for the tax or co-obligor for the debt, as well as those relating to direct or indirect controlled and controlling companies, or companies under direct or indirect common control as of December 31, 2015 (provided that such companies are domiciled in Brazil and that such status remains unchanged until the option date).
Income Tax Levied on Capital Gains
Law 13,259, of March 16, 2016 (“Law 13,259/16”) introduced the application of progressive tax rates for income taxation over capital gains recognized by Brazilian individuals and by holders that are not domiciled in Brazil for purposes of Brazilian taxation (“Non-Resident Holders”) on the disposition of assets in general. Under Law 13,259/16, the income tax rates applicable to capital gains realized by these investors would be: (i) 15% for the portion of the gains up to R$5 million, (ii) 17.5% for the portion of the gain that exceeds R$5 million but does not exceed R$10 million, (iii) 20% for the portion of the gain that exceeds R$10 million but does not exceed R$30 million, and (iv) 22.5% for the portion of the gain that exceeds R$30 million.
The provisions of Law 13,259/16 apply to Non Resident Holders pursuant to CMN Resolution 4,373, provided such Non Resident Holders are not located in a Tax Haven. However, Non Resident Holders (whether they are considered to be Non-Resident Holders as a result of CMN Resolution 4373 or otherwise) located in a Tax Haven are subject to a specific tax regulation and will continue to be taxed at a rate of 25.0%.
The tax must be withheld and paid by the buyer or, in cases where the buyer and seller are domiciled abroad, a legal representative of buyer shall be designated for the payment of the tax.
Disclosure pursuant to Section 219 of the Iran threat reduction and Syria Human Rights Act
Pursuant to Section 219 of the Iran Threat Reduction and Syria Human Rights Act of 2012, which added Section 13(r) to the Exchange Act, an issuer is required to disclose in its annual or quarterly reports, as applicable, whether it or any of its affiliates knowingly engaged in certain activities, transactions or dealings relating to Iran or with individuals or entities designated pursuant to certain Executive Orders. Disclosure is generally required even where the activities, transactions or dealings were conducted in compliance with applicable law.
On September 6, 2017, Santander Brasil received a payment order in an amount of €1,603.00 in favor of a Brazilian recipient from an entity based in Turkey. Upon receipt of the supporting documentation, Santander Brasil became aware of the fact that the ultimate payer was actually Iran Water and Electrical Equipments Engineering Co., an entity based in Iran and controlled by the Iranian government. Santander Brasil therefore declined to process the transaction. The intended recipient of the funds obtained an order from the Court of Justice of the State of São Paulo (Tribunal de Justiça Estado de São Paulo) requiring Santander Brasil to process the payment. Santander Brasil complied with the court order and processed the payment accordingly. Revenues and profits generated by Santander Brasil on this transaction in the year ended December 31, 2017 were negligible.
As we are part of the Santander Group, we must also disclose the exposure of other entities of the Santander Group to Iran. The following activities are disclosed in response to Section 13(r) with respect to the Santander Group and its affiliates. During the period covered by this annual report:
| (a) | Santander UK plc (“Santander UK”) holds two savings accounts and one current account for two customers resident in the UK who are currently designated by the US under the Specially Designated Global Terrorist (“SDGT”) sanctions program. Revenues and profits generated by Santander UK on these accounts in the year ended December 31, 2017 were negligible relative to the overall profits of Santander Spain. |
| (b) | Santander UK holds two frozen current accounts for two UK nationals who are designated by the US under the SDGT sanctions program. The accounts held by each customer have been frozen since their designation and have remained frozen through 2017. The accounts are in arrears (£1,844.73 in debit combined) and are currently being managed by Santander UK Collections & Recoveries department. No revenues or profits were generated by Santander UK on these accounts in the year ended December 31, 2017. |
The Santander Group also has certain legacy performance guarantees for the benefit of Bank Sepah and Bank Mellat (stand-by letters of credit to guarantee the obligations – either under tender documents or under contracting agreements – of contractors who participated in public bids in Iran) that were in place prior to April 27, 2007.
In the aggregate, all of the transactions described above resulted in gross revenues and net profits in the year ended December 31, 2017, which were negligible relative to the overall revenues and profits of the Santander Group. The Santander Group has undertaken significant steps to withdraw from the Iranian market such as closing its representative office in Iran and ceasing all banking activities therein, including correspondent relationships, deposit taking from Iranian entities and issuing export letters of credit, except for the legacy transactions described above. The Santander Group is not contractually permitted to cancel these arrangements without either (i) paying the guaranteed amount (in the case of the performance guarantees), or (ii) forfeiting the outstanding amounts due to it (in the case of the export credits). As such, the Santander Group intends to continue to provide the guarantees and hold these assets in accordance with company policy and applicable laws.
SELECTED STATISTICAL INFORMATION
The following information for Santander Brasil is included for analytical purposes and is derived from, and should be read in conjunction with, the consolidated financial statements and related notes contained elsewhere herein, as well as “Item 5. Operating and Financial Review and Prospects.”
Average annual balance sheet data has been calculated based upon the average of the monthly balances at 13 dates: as of December 31 of the prior year and each of the month-end balances of the 12 subsequent months. Average income statement and balance sheet data and other related statistical information have been prepared on a consolidated annual basis.
The selected statistical information set forth below includes information at and for the years ended December 31, 2017, 2016, 2015, 2014 and 2013 extracted from the audited financial statements prepared in conformity with IFRS as issued by the IASB. See “Presentation of Financial and Other Information” and “Item 3. Key Information—A. Selected Financial Data.”
Average Balance Sheet and Interest Rates
The following tables show our average balances and interest rates for each of the periods presented. With respect to the tables below and the tables under “—Changes in Net Interest Income – Volume and Rate Analysis” and “—Assets—Earning Assets – Yield Spread,” (i) we have stated average balances on a gross basis, before netting impairment losses, except for the total average asset figures, which include such netting, and (ii) all average data have been calculated using month-end balances, which is not significantly different from having used daily averages. We stop accruing interest on loans once they are more than 60 days past due. All our non-accrual loans are included in the table below under “Other assets.”
| | | For the year ended December 31, |
| | | 2017 | | 2016 | | 2015 |
| | | Average Balance | | Interest | | Average Rate | | Average Balance | | Interest | | Average Rate | | Average Balance | | Interest | | Average Rate |
| | | (in millions of R$, except percentages) |
Assets and Interest
Income | | | | | | | | | | | | | | | | | | | | | | | | | | | | | | | | | | | | |
| Cash and balances with the Brazilian Central Bank | | | 105,301 | | | | 5,954 | | | | 5.7 | % | | | 99,374 | | | | 7,316 | | | | 7.4 | % | | | 67,261 | | | | 4,625 | | | | 6.9 | % |
| Loans and amounts due from credit institutions | | | 23,460 | | | | 5,107 | | | | 21.8 | % | | | 33,982 | | | | 7,473 | | | | 22.0 | % | | | 41,622 | | | | 5,076 | | | | 12.2 | % |
| Loans and advances to customers | | | 277,797 | | | | 44,507 | | | | 16.0 | % | | | 239,762 | | | | 43,978 | | | | 18.3 | % | | | 245,749 | | | | 41,845 | | | | 17.0 | % |
| Debt instruments | | | 146,822 | | | | 13,457 | | | | 9.2 | % | | | 128,105 | | | | 14,783 | | | | 11.5 | % | | | 122,137 | | | | 14,872 | | | | 12.2 | % |
| Other interest – earning assets | | | — | | | | 2,393 | | | | 0.0 | % | | | — | | | | 3,597 | | | | — | | | | — | | | | 3,451 | | | | — | |
| Total interest – earning assets | | | 553,380 | | | | 71,418 | | | | 12.9 | % | | | 501,222 | | | | 77,146 | | | | 15.4 | % | | | 476,769 | | | | 69,870 | | | | 14.7 | % |
| Equity instruments | | | 1,871 | | | | 83 | | | | 4.4 | % | | | 2,195 | | | | 259 | | | | 11.8 | % | | | 2,729 | | | | 143 | | | | 5.2 | % |
| Investments in associates | | | 987 | | | | — | | | | — | | | | 878 | | | | — | | | | — | | | | 903 | | | | — | | | | — | |
| Total earning assets | | | 556,238 | | | | 71,501 | | | | 12.9 | % | | | 504,296 | | | | 77,405 | | | | 15.3 | % | | | 480,401 | | | | 70,013 | | | | 14.6 | % |
| Cash and balances with the Brazilian Central Bank | | | 4,569 | | | | — | | | | — | | | | 2,995 | | | | — | | | | — | | | | 3,056 | | | | — | | | | — | |
| Loans and amounts due from credit institutions | | | 2,455 | | | | — | | | | — | | | | 1,737 | | | | — | | | | — | | | | 1,463 | | | | — | | | | — | |
| Impairment losses | | | (18,169 | ) | | | — | | | | — | | | | (15,539 | ) | | | — | | | | — | | | | (14,212 | ) | | | — | | | | — | |
| Other assets | | | 55,648 | | | | — | | | | — | | | | 75,540 | | | | — | | | | — | | | | 64,048 | | | | — | | | | — | |
| Tangible assets | | | 6,484 | | | | — | | | | — | | | | 6,786 | | | | — | | | | — | | | | 6,881 | | | | — | | | | — | |
| Intangible assets | | | 30,286 | | | | — | | | | — | | | | 29,832 | | | | — | | | | — | | | | 30,222 | | | | — | | | | — | |
| Total average assets | | | 637,511 | | | | 71,501 | | | | 11.2 | % | | | 605,646 | | | | 77,405 | | | | 12.8 | % | | | 571,860 | | | | 70,013 | | | | 12.2 | % |
| Liabilities and Interest Expense | | | | | | | | | | | | | | | | | | |
| Deposits from the Brazilian Central Bank and Deposits from credit institutions | | | 81,797 | | | | 3,783 | | | | 4.6 | % | | | 68,761 | | | | 3,370 | | | | 4.9 | % | | | 67,375 | | | | 4,584 | | | | 6.8 | % |
| Customer deposits | | | 244,364 | | | | 19,491 | | | | 8.0 | % | | | 229,645 | | | | 25,693 | | | | 11.2 | % | | | 217,653 | | | | 20,666 | | | | 9.5 | % |
| Marketable debt securities | | | 82,055 | | | | 7,901 | | | | 9.6 | % | | | 95,760 | | | | 12,213 | | | | 12.8 | % | | | 84,118 | | | | 10,048 | | | | 11.9 | % |
| Subordinated debts | | | 8,599 | | | | 548 | | | | 6.4 | % | | | 13,901 | | | | 1,233 | | | | 8.9 | % | | | 16,070 | | | | 1,523 | | | | 9.5 | % |
| Other interest-bearing liabilities | | | — | | | | 4.456 | | | | — | | | | — | | | | 3,759 | | | | — | | | | — | | | | 1,308 | | | | — | |
| Total interest-bearing liabilities | | | 416,816 | | | | 36,179 | | | | 8.7 | % | | | 408,067 | | | | 46,268 | | | | 11.3 | % | | | 385,215 | | | | 38,129 | | | | 9.9 | % |
| Noninterest bearing demand deposits | | | 64 | | | | — | | | | — | | | | 15,393 | | | | — | | | | — | | | | 14,792 | | | | — | | | | — | |
| Other liabilities | | | 117,161 | | | | — | | | | — | | | | 97,283 | | | | — | | | | — | | | | 89,820 | | | | — | | | | — | |
| Non-controlling interests | | | 745 | | | | — | | | | — | | | | 638 | | | | — | | | | — | | | | 557 | | | | — | | | | — | |
| Stockholders’ Equity | | | 87,868 | | | | — | | | | — | | | | 84,283 | | | | — | | | | — | | | | 81,475 | | | | — | | | | — | |
| Total average liabilities and equity | | | 638,983 | | | | 36,179 | | | | 5.7 | % | | | 605,664 | | | | 46,268 | | | | 7.6 | % | | | 571,860 | | | | 38,129 | | | | 6.7 | % |
Changes in Net Interest Income – Volume and Rate Analysis
The following tables present the changes in our net interest income allocated between changes in average volume and changes in average rate for the year ended December 31, 2017, compared to the year ended December 31, 2016, and for the year ended December 31, 2016 compared to the year ended December 31, 2015. We have calculated volume variances based on movements in average balances over the period and rate variance based on changes in interest rates on average interest-earning assets and average interest-bearing liabilities. We have allocated variances caused by changes in both volume and rate to volume. You should read the following tables and the footnotes thereto in light of our observations noted in “—Average Balance Sheet and Interest Rates.”
| | | For the years ended 2017/2016 | | For the years ended 2016/2015 |
| | | Increase (decrease) due to changes in |
| | | Volume | | Rate | | Net change | | Volume | | Rate | | Net change |
| | | (in millions of R$) |
| Interest and Similar Income | | | | | | | | | | | | | | | | | | | | | | | | |
| Interest-earning assets | | | | | | | | | | | | | | | | | | | | | | | | |
| Cash and balances with the Brazilian Central Bank | | | 427 | | | | (1,789 | ) | | | (1,362 | ) | | | 2,344 | | | | 346 | | | | 2,690 | |
| Loans and amounts due from credit institutions | | | (1,482 | ) | | | (884 | ) | | | (2,365 | ) | | | (1,071 | ) | | | 3,468 | | | | 2,397 | |
| Loans and advances to customers | | | 6,103 | | | | (5,574 | ) | | | 529 | | | | (1,038 | ) | | | 3,172 | | | | 2,134 | |
| Debt instruments | | | 1,975 | | | | (3,302 | ) | | | (1,326 | ) | | | 708 | | | | (798 | ) | | | (90 | ) |
| Other interest-earning assets | | | (1,200 | ) | | | — | | | | (1,200 | ) | | | 142 | | | | — | | | | 142 | |
| Total interest-earning assets | | | 5,823 | | | | (11,548 | ) | | | (5,724 | ) | | | 1,085 | | | | 6,188 | | | | 7,273 | |
| Equity Instruments | | | (34 | ) | | | (141 | ) | | | (175 | ) | | | (33 | ) | | | 148 | | | | 115 | |
| Total earning assets | | | 5,790 | | | | (11,690 | ) | | | (5,900 | ) | | | 1,052 | | | | 6,336 | | | | 7,388 | |
| Interest Expense and Similar Charges | | | | | | | | | | | | | | | | | | | | | | | | |
| Interest-bearing liabilities | | | | | | | | | | | | | | | | | | | | | | | | |
| Deposits from the Brazilian Central Bank and Deposits from credit institutions | | | 611 | | | | (198 | ) | | | 413 | | | | 93 | | | | (1,307 | ) | | | (1,214 | ) |
| Customer deposits | | | 1,561 | | | | (7,763 | ) | | | (6,202 | ) | | | 1,187 | | | | 3,840 | | | | 5,027 | |
| Marketable debt securities | | | (1,590 | ) | | | (2,722 | ) | | | (4,312 | ) | | | 1,454 | | | | 711 | | | | 2,165 | |
| Subordinated liabilities | | | (394 | ) | | | (291 | ) | | | (685 | ) | | | (197 | ) | | | (93 | ) | | | (290 | ) |
| Other interest-bearing liabilities | | | 697 | | | | — | | | | 697 | | | | 2,451 | | | | — | | | | 2,451 | |
| Total interest-bearing liabilities | | | (885 | ) | | | (10,974 | ) | | | (10,089 | ) | | | 4,988 | | | | 3,151 | | | | 8,139 | |
Assets
Earning Assets – Yield Spread
The following table analyzes our average earning assets, interest income and dividends on equity securities and net interest income and shows gross yields, net yields and yield spread for each of the periods indicated. You should read this table and the footnotes thereto in light of our observations noted in “—Average Balance Sheet and Interest Rates.”
| | | For the year ended December 31, |
| | | 2017 | | 2016 | | 2015 |
| | | (in millions of R$, except percentages) |
| Average earning assets | | | 553,380 | | | | 504,296 | | | | 480,401 | |
| Interest and dividends on equity securities(1) | | | 71,501 | | | | 77,405 | | | | 70,013 | |
| Net interest income | | | 35,322 | | | | 31,137 | | | | 31,884 | |
| Gross yield(2) | | | 12.9 | % | | | 15.3 | % | | | 14.6 | % |
| Net yield(3) | | | 6.4 | % | | | 6.2 | % | | | 6.6 | % |
| Yield spread(4) | | | 4.0 | % | | | 4.0 | % | | | 4.7 | % |
| (*) | Yield information does not give effect to changes in fair value that are reflected as a component of stockholder’s equity. |
| (1) | Total earning assets plus dividends from companies accounted for by the equity method (equity instruments). |
| (2) | Gross yield is the amount of “Interest and dividends on equity securities” divided by “Average earning assets.” |
| (3) | Net yield is the amount of “Net interest income” divided by “Average earning assets.” |
| (4) | Yield spread is the difference between the average rate of “Total earning asset” and the average rate of “Total interest-bearing liabilities.” |
Return on Equity and Assets
The following table presents our selected financial ratios for the periods indicated.
| | | For the year ended December 31, |
| | | | 2017 | | | | 2016 | (3) | | | 2015 | |
| ROA: Return on average total assets | | | 1.4 | % | | | 1.2 | % | | | 1.7 | % |
| ROE: Return on average stockholders’ equity | | | 10.4 | % | | | 8.9 | % | | | 12.1 | % |
| ROE (adjusted) (1) | | | 15.4 | % | | | 13.3 | % | | | 18.5 | % |
| Average stockholders’ equity as a percentage of average total assets | | | 13.8 | % | | | 13.9 | % | | | 14.2 | % |
| Payout(2) | | | 70.7 | % | | | 71.6 | % | | | 63.4 | % |
| (1) | “Average stockholders’ equity excluding goodwill as a percentage of average total assets excluding goodwill” is a non-GAAP financial measure which adjusts “Return on average stockholders’ equity” to exclude the goodwill arising from the acquisition of Banco Real in 2008. See “Item 3. Key Information—A. Selected Financial Data—Selected Consolidated Ratios” for a reconciliation of “Average stockholders’ equity excluding goodwill as a percentage of average total assets excluding goodwill” to “Return on average stockholders’ equity.” |
| (2) | Dividend payout ratio (dividends declared per preferred share divided by net income per preferred share). |
| (3) | Our results for 2015 were affected by the R$4.8 billion reversal of tax provision regarding COFINS in that year which did not occur in 2017 or 2016. |
Interest-Earning Assets (other than Loans)
The following table shows the percentage mix of our average interest-earning assets for the years indicated. You should read this table in light of our observations noted in “—Average Balance Sheet and Interest Rates.”
| | | For the year ended December 31, |
| | | 2017 | | 2016 | | 2015 |
| Cash and balances with the Brazilian Central Bank | | | 19 | % | | | 19.8 | % | | | 14.1 | % |
| Loans and amounts due from credit institutions | | | 4.2 | % | | | 6.8 | % | | | 8.7 | % |
| Loans and advances to customers | | | 50.2 | % | | | 47.8 | % | | | 51.5 | % |
| Debt instruments | | | 26.5 | % | | | 25.6 | % | | | 25.6 | % |
| Total interest-earning assets | | | 100 | % | | | 100.0 | % | | | 100.0 | % |
Loans and Amounts Due from Credit Institutions
The following table shows our short-term funds deposited with other banks at each of the dates indicated.
| | | For the year ended December 31, |
| | | 2017 | | 2016 | | 2015 |
| | | (in millions of R$) |
| Time deposits | | | 4,237 | | | | 2,070 | | | | 3,627 | |
| Reverse repurchase agreements | | | 271 | | | | 848 | | | | 153 | |
| Escrow deposits | | | 10,136 | | | | 9,836 | | | | 9,493 | |
| Cash and foreign currency investments | | | 15,981 | | | | 13,195 | | | | 24,058 | |
| Other accounts | | | 1,744 | | | | 2,014 | | | | 5,271 | |
| Total | | | 32,369 | | | | 27,964 | | | | 42,601 | |
Investment Securities
As of December 31, 2017 and 2016, the book value of investment securities was R$151 billion and R$146 billion, respectively (representing 23.0% of our total assets as of such dates). Brazilian government securities totaled R$122 billion, or 81.2% and R$123 billion, or 84.2% of our investment securities as of December 31, 2017 and 2016, respectively. For a discussion of how our investment securities are valued, see notes 7 and 8 to our consolidated financial statements.
The following table shows the carrying amounts of our investment securities by type and residence of the counterparty at each of the indicated dates:
| | | As of December 31, |
| | | 2017 | | 2016 | | 2015 |
| | | (in millions of R$) |
| Debt securities | | | | | | | | | | | | |
| Government securities—Brazil | | | 122,362 | | | | 122,972 | | | | 93,440 | |
| Debentures and promissory notes | | | 12,097 | | | | 12,923 | | | | 11,967 | |
| Other debt securities | | | 14,626 | | | | 7,931 | | | | 10,307 | |
| Total domestic/debt securities | | | 149,086 | | | | 143,825 | | | | 115,714 | |
| | | | | | | | | | | | | |
| Equity securities | | | | | | | | | | | | |
| Shares of Brazilian companies | | | 389 | | | | 1,186 | | | | 1,168 | |
| Shares of foreign companies | | | 5 | | | | 4 | | | | 11 | |
| Investment fund units and shares | | | 1,235 | | | | 1,237 | | | | 961 | |
| Total equity securities | | | 1,629 | | | | 2,427 | | | | 2,141 | |
| Total investment securities | | | 150,715 | | | | 146,252 | | | | 117,855 | |
As of December 31, 2017 and 2016, we held no securities of single issuers or related groups of companies whose aggregate book or market value exceed 6% of our stockholders’ equity, other than the Brazilian government securities, which represented 140% and 144%, respectively of our stockholders’ equity. As of December 31, 2017 and 2016, the total value of our debt securities was approximately 172% and 171%, respectively, of stockholders’ equity.
The following table analyzes the maturities and weighted average yields of our debt investment securities (before impairment allowance) as of December 31, 2017. Yields on tax-exempt obligations have not been calculated on a tax equivalent basis because the effect on such calculation is not significant.
| | | Maturing within 1 year | | Maturing between 1 and 5 years | | Maturing between 5 and 10 years | | Maturing after 10 years | | Total |
| | | (in R$ millions) |
| Debt securities | | | | | | | | | | | | | | | | | | | | |
| Government securities—Brazil | | | 24,474 | | | | 51,049 | | | | 20,068 | | | | 26,771 | | | | 122,362 | |
| Other debt securities | | | 4,930 | | | | 13,000 | | | | 8,129 | | | | 665 | | | | 26,724 | |
| Total debt investment securities | | | 29,404 | | | | 64,049 | | | | 28,197 | | | | 27,436 | | | | 149,086 | |
The average rate for debt investment securities is 9.3%.
Domestic and Foreign Currency
The following table shows our assets and liabilities by domestic and foreign currency, on December 31, 2017, 2016, and 2015:
| | | As of December 31, |
| | | 2017 | | 2016 | | 2015 |
| | | Domestic Currency | | Foreign Currency | | Domestic Currency | | Foreign Currency | | Domestic Currency | | Foreign Currency |
| | | (in millions of R$) |
| Assets | | | | | | | | | | | | |
| Cash and balances with the Brazilian Central Bank | | | 100,740 | | | | 126 | | | | 110,430 | | | | 175 | | | | 88,909 | | | | 234 | |
| Debt instruments | | | 137,420 | | | | 11,666 | | | | 134,038 | | | | 9,788 | | | | 109,837 | | | | 5,877 | |
| Loans and amounts due from credit institutions, gross | | | 17,005 | | | | 15,364 | | | | 25,421 | | | | 2,542 | | | | 18,631 | | | | 23,970 | |
| Loans and advances to customers, gross | | | 269,126 | | | | 18,703 | | | | 257,170 | | | | 11,267 | | | | 264,491 | | | | 2,775 | |
| Equity Instruments | | | 1,624 | | | | 6 | | | | 2,426 | | | | — | | | | 2,141 | | | | — | |
| Total assets | | | 525,915 | | | | 45,865 | | | | 529,485 | | | | 23,772 | | | | 484,009 | | | | 32,857 | |
| Liabilities | | | | | | | | | | | | | | | | | | | | | | | | |
| Financial Liabilities at Amortized cost | | | | | | | | | | | | | | | | | | | | | | | | |
| Deposits from the Brazilian Central Bank and Deposits from credit institutions | | | 56,563 | | | | 22,812 | | | | 51,340 | | | | 27,294 | | | | 33,056 | | | | 36,395 | |
| Customer deposits | | | 276,042 | | | | — | | | | 247,445 | | | | — | | | | 232,344 | | | | 10,669 | |
| Marketable debt securities | | | 68,335 | | | | 1,912 | | | | 92,132 | | | | 7,711 | | | | 82,507 | | | | 12,151 | |
| Subordinated debts | | | 519 | | | | — | | | | 466 | | | | — | | | | 8,097 | | | | — | |
| Debt instruments eligible to compose capital | | | 8,435 | | | | — | | | | 8,312 | | | | — | | | | 9,959 | | | | — | |
| Other financial liabilities | | | 44,261 | | | | — | | | | 36,879 | | | | — | | | | 32,073 | | | | — | |
| Total liabilities | | | 454,155 | | | | 24,724 | | | | 436,574 | | | | 35,005 | | | | 398,036 | | | | 59,245 | |
Loan Portfolio
As of December 31, 2017, our total loans and advances to customers were R$287.8 billion (44.6% of our total assets). Net impairment losses, loans and advances to customers were R$272.4 billion as of December 31, 2017 (42.1% of our total assets). In addition to loans, we had outstanding as of December 31, 2017, 2016, 2015, 2014 and 2013, R$106.9 billion, R$91.2 billion, R$91.9 billion, R$98.6 billion and R$100.5 billion respectively, of loan commitments drawable by third parties.
Types of Loans by Type of Customer
Substantially all of our loans are to borrowers domiciled in Brazil and are denominated inreais. The table below analyzes our loans and advances to customers (including securities purchased under agreements to resell), by type of customer loan, at each of the dates indicated. For each category of loan, we maintain specific risk management policies in line with the standards of the Santander Group and as managed and monitored by our board of officers through the credit committee. Our credit approval processes for each category of loan are structured primarily around our business segments. See “Item 11. Quantitative and Qualitative Disclosures about Risk—Credit Risk” for details on our credit approval policies for retail and wholesale lending.
We have a diversified loan portfolio with no specific concentration exceeding 10.0% of our total loans Furthermore, currently, 1.2% of our loan portfolio is allocated to our largest debtor and 7.7% to our next 10 largest debtors.
| | | As of December 31, |
| | | 2017 | | 2016 | | 2015 | | 2014 | | 2013 |
| | | (in millions of R$) |
| Commercial and industrial(1) | | | 140,619 | | | | 140,993 | | | | 150,881 | | | | 133,087 | | | | 113,571 | |
| Real estate – (2) | | | 34,809 | | | | 36,650 | | | | 36,852 | | | | 31,864 | | | | 25,555 | |
| Installment loans to individuals(3) | | | 110,513 | | | | 88,702 | | | | 77,407 | | | | 81,893 | | | | 84,312 | |
| Lease financing(4) | | | 1,888 | | | | 2,093 | | | | 2,126 | | | | 2,266 | | | | 2,768 | |
| Loans and advances to customers, gross(5) | | | 287,829 | | | | 268,438 | | | | 267,266 | | | | 249,111 | | | | 226,206 | |
| Impairment losses | | | (15,409 | ) | | | (16,435 | ) | | | (15,233 | ) | | | (13,421 | ) | | | (13,472 | ) |
| Loans and advances to customers, net | | | 272,420 | | | | 252,003 | | | | 252,033 | | | | 235,690 | | | | 212,734 | |
| (1) | Includes primarily loans to small and medium-size businesses, or SMEs in our Commercial Banking segment, and to GCB, corporate and business enterprise customers in our Wholesale Global Banking segment. The principal products offered to SMEs in this category include revolving loans, overdraft facilities, installment loans, working capital and equipment finance loans. Credit approval for SMEs is based on customer income, business activity, collateral coverage and internal and external credit scoring tools. Collateral on commercial and industrial lending to SMEs generally includes receivables, liens, pledges, guarantees and mortgages, with coverage generally ranging from 100.0% to 150.0% of the loan value depending on the risk profile of the loan. Our Wholesale Global Banking customers are offered a range of loan products ranging from typical corporate banking products (installment loans, working capital and equipment finance loans) to more sophisticated products (derivative and capital markets transactions). As Wholesale Global Banking customers tend to be larger businesses, credit approval is based on customer credit quality as evaluated by a specialized team of risk analysts taking account of, among other things, business revenues and credit history of each customer. Underwriting policies for this category of loan to our Wholesale Global Banking customers are focused on the type of guarantee or collateral provided. Certain loans (BNDES products) are generally secured by liens on financed machinery and equipment, though guarantees may be provided as additional security. |
| (2) | Includes loans on residential real estate to individuals. Credit approval policies in this category are determined by reference to the type of lending product being offered, the type and location of the real estate, the revenue or income of the business or customer, respectively, requesting the loan and internal and external credit scoring information. All loans granted under this category are secured by the financed real estate. Loan-to-value ratios for loans in this category are generally limited to 80.0% and the average loan to value ratio for new loans is approximately between 54.0% and 60.0%. Moreover, real estate also includes construction loans made principally to real estate developers that are SMEs and corporate customers in our Wholesale Global Banking Segment. Loans in this category are generally secured by mortgages and receivables, though guarantees may be provided as additional security. |
| (3) | Consists primarily of unsecured and secured personal installment loans (including loans the payments for which are automatically deducted from a customer’s payroll), revolving loans, overdraft facilities, consumer finance facilities and credit cards. Credit approval in this category is based on individual income, debt-to-income ratio and internal and external credit scoring models. Credit approval for many of these types of loans is based on automatic scoring models, with pre-set lending limits based on credit scores. For example, the maximum lending amount on revolving loans and overdraft facilities may vary from between 60.0% to 240.0% of an individual’s monthly income, depending on the specific product and credit score of the individual. |
| (4) | Includes primarily automobile leases and loans to individuals and other leases to corporate customers. Credit approval is based both on an automatic scoring model using external credit scores and on evaluation by our branch personnel following our risk management policies. The vehicle financed acts as collateral for the particular loan granted. |
| (5) | Includes commercial credit, credit granted by us, money market operations, lease financing, other time credits and impaired assets. |
Maturity
The following table sets forth an analysis by maturity of our loans and advances to customers by type of loans on December 31, 2017.
| | | Maturity |
| | | Less than one year | | One to five years | | Over five years | | Total |
| | | Balance | | % of Total Loans | | Balance | | % of Total Loans | | Balance | | % of Total Loans | | Balance | | % of Total Loans |
| | | (in millions of R$, except percentages) |
| Commercial and industrial | | | 103,378 | | | | 59.3 | | | | 31,262 | | | | 37.9 | | | | 5,979 | | | | 19.2 | | | | 140,619 | | | | 48.9 | |
| Real estate | | | 7,792 | | | | 4.5 | | | | 10,970 | | | | 13.3 | | | | 16,047 | | | | 51.7 | | | | 34,809 | | | | 12.1 | |
| Installment loans to individuals | | | 62,078 | | | | 35.6 | | | | 39,394 | | | | 47.7 | | | | 9,041 | | | | 29.1 | | | | 110,513 | | | | 38.4 | |
| Lease financing | | | 1,000 | | | | 0.6 | | | | 887 | | | | 1.1 | | | | 1 | | | | 0.0 | | | | 1,888 | | | | 0.7 | |
| Loans and advances to customers, gross | | | 174,248 | | | | 100.0 | | | | 82,513 | | | | 100.0 | | | | 31,068 | | | | 100.0 | | | | 287,829 | | | | 100.0 | |
Fixed and Variable Rate Loans
The following table sets forth a breakdown of our fixed and variable rate loans by maturity as of December 31, 2017.
| | | Fixed and variable rate loans with maturity |
| | | Less than one year | | One to five years | | Over five years | | Total |
| | | Balance | | % of Total | | Balance | | % of Total | | Balance | | % of Total | | Balance | | % of Total |
| | | (in millions of R$, except percentages) |
| Fixed rate | | | 137,109 | | | | 78.7 | | | | 54,621 | | | | 66.2 | | | | 10,862 | | | | 35.0 | | | | 202,592 | | | | 70.4 | |
| Variable rate | | | 37,139 | | | | 21.3 | | | | 27,892 | | | | 33.8 | | | | 20,206 | | | | 65.0 | | | | 85,237 | | | | 29.6 | |
| Total | | | 174,248 | | | | 100.0 | | | | 82,513 | | | | 100.0 | | | | 31,068 | | | | 100.0 | | | | 287,829 | | | | 100.0 | |
Cross-Border Outstandings
The following table presents, at each balance sheet date indicated, the aggregate amount of our cross-border outstandings (which consist of loans, interest-bearing deposits with other banks, acceptances and other monetary assets denominated in a currency other than the home-country currency of the office where the item is booked). Cross-border outstandings do not include local currency loans made by subsidiary banks in other countries to the extent that such loans are funded in the local currency or hedged. As a result, they do not include the majority of the loans made by our Cayman Islands branch, which are fully hedged.
| | | As of December 31, |
| | | 2017 | | 2016 | | 2015 |
| | | Balance | | % of Total Assets | | Balance | | % of Total Assets | | Balance | | % of Total Assets |
| | | (in millions of R$, except percentages) |
| OECD countries(1) | | | | | | | | | | | | |
| Spain | | | 1,217 | | | | 0.2 | | | | 1,495 | | | | 0.2 | | | | 240 | | | | — | |
| United States | | | 3,304 | | | | 0.5 | | | | 1,692 | | | | 0.3 | | | | 2,686 | | | | 0.4 | |
| Netherlands | | | 3,853 | | | | 0.6 | | | | 6,595 | | | | 1.0 | | | | 5,474 | | | | 0.9 | |
| United Kingdom(3) | | | 6,508 | | | | 1.0 | | | | 190 | | | | 0.0 | | | | 10 | | | | 0.0 | |
| Other OECD countries(2) | | | 1,072 | | | | 0.1 | | | | 1,020 | | | | 0.2 | | | | 364 | | | | 0.1 | |
| Total OECD | | | 15,954 | | | | 2.5 | | | | 10,992 | | | | 1.7 | | | | 8,774 | | | | 1.4 | |
| Non-OECD countries | | | | | | | | | | | | | | | | | | | | | | | | |
| Latin American countries(2) | | | 314 | | | | 0.0 | | | | 55 | | | | 0.0 | | | | 522 | | | | 0.1 | |
| Cayman Islands | | | (8,304 | ) | | | (1.3 | ) | | | 1,301 | | | | 0.2 | | | | 4,372 | | | | 0.7 | |
| Other(2) | | | 100 | | | | 0.0 | | | | 463 | | | | 0.1 | | | | 574 | | | | 0.1 | |
| Total non-OECD | | | (7,890 | ) | | | (1.2 | ) | | | 1,819 | | | | 0.3 | | | | 5,468 | | | | 0.9 | |
| Total | | | 8,064 | | | | 1.2 | | | | 12,811 | | | | 2.0 | | | | 14,242 | | | | 2.4 | |
| (1) | The Organisation for Economic Cooperation and Development. |
| (2) | Aggregate outstandings in any single country in this category do not exceed 0.75% of our total assets. |
| (3) | In 2017, the outstandings with the United Kingdom exceeded 0.75% of our total assets. For comparison purposes, the 2016 and 2015 outstanding for the country were reclassified from the “Other OECD” line to a specific line at the table above. |
The following table presents the amounts of our cross-border outstandings as of December 31, 2017, 2016 and 2015 by type of borrower where outstandings in the borrower’s country exceeded 0.75% of total assets.
| | | Government | | Banks and Other Financial Institutions | | Commercial and Industrial | | Other Loans | | Total |
| | | (in millions of R$) |
| 2015 | | | | | | | | | | |
| United States | | | — | | | | 2,621 | | | | 59 | | | | — | | | | 2,680 | |
| Netherlands | | | — | | | | — | | | | 5,474 | | | | — | | | | 5,474 | |
| United Kingdom | | | | | | | 9 | | | | — | | | | 1 | | | | 10 | |
| Cayman Islands | | | — | | | | 2,265 | | | | — | | | | — | | | | 2,265 | |
| Total | | | — | | | | 4,895 | | | | 5,533 | | | | 1 | | | | 10,429 | |
| 2016 | | | | | | | | | | | | | | | | | | | | |
| United States | | | — | | | | 2,621 | | | | 23 | | | | 43 | | | | 1,692 | |
| Netherlands | | | — | | | | — | | | | 6,595 | | | | — | | | | 6,595 | |
| Austria | | | — | | | | 168 | | | | — | | | | — | | | | 168 | |
| United Kingdom | | | — | | | | 52 | | | | — | | | | 138 | | | | 190 | |
| Cayman Islands | | | — | | | | 778 | | | | — | | | | — | | | | 778 | |
| Total | | | — | | | | 3,619 | | | | 6,618 | | | | 181 | | | | 9,423 | |
| 2017 | | | | | | | | | | | | | | | | | | | | |
| United States | | | — | | | | 3,168 | | | | 20 | | | | 115 | | | | 3,303 | |
| Netherlands | | | — | | | | — | | | | 3,853 | | | | — | | | | 3,853 | |
| Austria | | | — | | | | — | | | | 280 | | | | (5 | ) | | | 275 | |
| United Kingdom(1) | | | — | | | | 5 | | | | 247 | | | | 6,256 | | | | 6,508 | |
| Cayman Islands | | | 5,656 | | | | — | | | | 1,485 | | | | (15,445 | ) | | | (8,304 | ) |
| Total | | | 5,656 | | | | 3,172 | | | | 5,885 | | | | (9,079 | ) | | | 5,635 | |
| (1) | In 2017, the outstandings with the United Kingdom exceeded 0.75% of our total assets. For comparison purposes, the 2016 and 2015 outstanding for the country were reclassified from the “Other OECD” line to a specific line at the table above. |
Changes in Allowances for Impairment Losses on the Balances of “Loans and receivables”
The following tables analyze changes in our allowances for impairment losses for the periods indicated. For further discussion of movements in the allowances for impairment losses, see “Item 5. Operating and Financial Review and Prospects—A. Operating Results—Results of Operations for the Years Ended December 31, 2017, 2016 and 2015—Impairment Losses on Financial Assets (Net).”
| | | As of December 31, |
| | | 2017 | | 2016 | | 2015 | | 2014 | | 2013 |
| | | (in millions of R$) |
| Balance at beginning of year | | | 18,191 | | | | 15,412 | | | | 13,563 | | | | 13,641 | | | | 14,042 | |
| Impairment losses charged to income for the year | | | 13,493 | | | | 14,383 | | | | 13,723 | | | | 12,049 | | | | 14,356 | |
| Write-off of impaired balances against recorded impairment allowance | | | (13,422 | ) | | | (11,605 | ) | | | (11,874 | ) | | | (12,126 | ) | | | (14,757 | ) |
| Balance at end of year | | | 18,262 | | | | 18,191 | | | | 15,412 | | | | 13,563 | | | | 13,641 | |
| Of which: | | | | | | | | | | | | | | | | | | | | |
| Loans and advances to customers | | | 15,409 | | | | 16,435 | | | | 15,233 | | | | 13,421 | | | | 13,472 | |
| Loans and amounts due from credit institutions | | | 69 | | | | 201 | | | | 179 | | | | 142 | | | | 168 | |
| Debt Instruments | | | 2,784 | | | | 1,555 | | | | 144 | | | | — | | | | — | |
| Recoveries of loans previously written off(1) | | | 1,154 | | | | 994 | | | | 757 | | | | 855 | | | | 456 | |
| (1) | Impairment losses on financial assets, net, as reported in our consolidated financial statements, reflect net provisions for credit losses less recoveries of loans previously written off. |
Allowance by Type of Borrower
The table below shows a breakdown of recoveries, net provisions and write-offs against credit loss allowance by type of borrower for the periods indicated.
| | | For the year ended December 31, |
| | | 2017 | | 2016 | | 2015 | | 2014 | | 2013 |
| | | (in millions of R$) |
| Recoveries of loans previously written off(1) | | | 1,154 | | | | 994 | | | | 757 | | | | 855 | | | | 456 | |
| Commercial and industrial | | | 413 | | | | 563 | | | | 294 | | | | 185 | | | | 123 | |
| Real estate | | | 210 | | | | 103 | | | | 86 | | | | 81 | | | | 78 | |
| Installment loans to individuals | | | 521 | | | | 314 | | | | 348 | | | | 560 | | | | 215 | |
| Lease finance | | | 10 | | | | 14 | | | | 29 | | | | 29 | | | | 41 | |
| Impairment losses charged to income for the year(1) | | | 13,492 | | | | 14,383 | | | | 13,723 | | | | 12,048 | | | | 14,356 | |
| Commercial and industrial | | | 5,499 | | | | 6,523 | | | | 6,634 | | | | 4,875 | | | | 5,186 | |
| Real estate – mortgage | | | 471 | | | | 369 | | | | 91 | | | | 38 | | | | 126 | |
| Installment loans to individuals | | | 7,461 | | | | 7,617 | | | | 6,766 | | | | 6,867 | | | | 8,803 | |
| Lease finance | | | 61 | | | | (125 | ) | | | 232 | | | | 268 | | | | 241 | |
| Write-off of impaired balances against recorded impairment allowance | | | (13,422 | ) | | | (11,605 | ) | | | (11,874 | ) | | | (12,126 | ) | | | (14,757 | ) |
| Commercial and industrial | | | (5,716 | ) | | | (4,553 | ) | | | (4,953 | ) | | | (4,494 | ) | | | (3,195 | ) |
| Real estate | | | (342 | ) | | | (190 | ) | | | (77 | ) | | | (97 | ) | | | (177 | ) |
| Installment loans to individuals | | | (7,312 | ) | | | (6,811 | ) | | | (6,622 | ) | | | (7,337 | ) | | | (11,093 | ) |
| Lease finance | | | (52 | ) | | | (51 | ) | | | (222 | ) | | | (199 | ) | | | (292 | ) |
| (1) | Impairment losses on financial assets, net, as reported in our consolidated financial statements, reflect net provisions for credit losses less recoveries of loans previously written off. |
The table below shows a breakdown of allowances for credit losses by type of borrowers and the percentage of loans in each category as a share of total loans at the date indicated.
| | | As of December 31, |
| | | 2017 | | % of Total Loans | | 2016 | | % of Total Loans | | 2015 | | % of Total Loans |
| | | (in millions of R$, except percentages) |
| Borrowers | | | | | | | | | | | | |
| Commercial and industrial | | | 10,339 | | | | 56,6 | | | | 10,555 | | | | 58.0 | | | | 8,586 | | | | 55.7 | |
| Real estate | | | 493 | | | | 2,7 | | | | 364 | | | | 2.0 | | | | 184 | | | | 1.2 | |
| Installment loans to individuals | | | 7,374 | | | | 40,4 | | | | 7,226 | | | | 39.7 | | | | 6,420 | | | | 41.7 | |
| Lease financing | | | 56 | | | | 0,3 | | | | 46 | | | | 0.3 | | | | 222 | | | | 1.4 | |
| Total | | | 18,262 | | | | 100,0 | | | | 18,191 | | | | 100 | | | | 15,412 | | | | 100.0 | % |
Internal Risk Rating
The following table presents a breakdown of our portfolio by internal risk rating, at the dates indicated:
| | | As of
December 31, |
| | | 2017 | | 2016 | | 2015 |
| | | (in millions of R$) |
| Internal Risk Rating (1) | | | | | | | | | | | | |
| Low | | | 226,098 | | | | 207,890 | | | | 211,645 | |
| Medium-low | | | 33,635 | | | | 32,104 | | | | 29,501 | |
| Medium | | | 10,423 | | | | 10,941 | | | | 8,639 | |
| Medium-high | | | 8,215 | | | | 6,977 | | | | 8,552 | |
| High | | | 9,457 | | | | 10,526 | | | | 8,929 | |
| Loans and advances to customers, gross | | | 287,829 | | | | 268,438 | | | | 267,266 | |
For further information on our internal risk rating levels and their corresponding probability of default, see “Item 11. Quantitative and Qualitative Disclosures about Risk—Credit Risk—Credit Monitoring.”
Renegotiation Portfolio
The renegotiation portfolio for the year ended on December 31, 2017 amounted to R$12.2 billion, compared to R$12 billion for the same period in 2016, an increase of R$213 million or 1.8%. This portfolio includes loans and advances to customers that were extended and/or modified to facilitate repayment under conditions agreed upon with customers.
The renegotiation portfolio was covered by allowances for impairment losses of 54.0% as of December 31, 2017 and 51.9% as of December 31, 2016. These levels are considered appropriate for the characteristics of these loans and advances to customers.
The following table presents a breakdown of our renegotiation portfolio by type of customer, allowances for impairment losses and our coverage ratio at the dates indicated:
| | | 2017 | | 2016 | | 2015 |
| | | (in millions of R$, except percentages) |
| Renegotiation Portfolio by type of customer | | | | | | |
| Commercial and industrial | | | 6,086 | | | | 5,763 | | | | 5,158 | |
| Real Estate | | | 1 | | | | — | | | | — | |
| Installment loans to individuals | | | 6,047 | | | | 6,130 | | | | 6,173 | |
| Financial leasing | | | 79 | | | | 99 | | | | 64 | |
| Total | | | 12,213 | | | | 11,992 | | | | 11,395 | |
| Allowances for impairment losses | | | 6,596 | | | | 6,226 | | | | 5,740 | |
| Coverage ratio | | | 54.0 | % | | | 51.92 | % | | | 50.4 | % |
Balances are deemed to be impaired when there are reasonable doubts as to their full recovery and/or the collection of the related interest for the amounts on the dates indicated in the loan agreement, after taking into account the collateral guarantees received to secure (fully or partially) collection of the related balances.
In relation to renegotiated products, we, through our internal renegotiation policy, require at least a minimum amount of payment of quotas for any renegotiated products to be considered performing (note that the classification of such transactions as renegotiated operations will remain even after such payments). Renegotiated loans that are more than 60 days late than due date are also accounted for as impaired.
Since 2015, we increased our efforts regarding the collection of loans that are less than 60 days past due and also in relation to written off loans. We are also continuing with our strategy (in place since 2012) of granting loans to persons with low risk profile and higher levels of collaterals and guarantees.
Impaired Assets
The following table shows our impaired assets, excluding country risk.
| | | As of December 31, |
| | | 2017 | | 2016 | | 2015 | | 2014 | | 2013 |
| | | (in millions of R$, except percentages) |
| Impaired assets | | | | | | | | | | | | | | | | | | | | |
| Past due and other impaired assets(1) | | | 19,145 | | | | 18,887 | | | | 18,599 | | | | 14,011 | | | | 14,022 | |
| Impaired assets as a percentage of total loans | | | 6.7 | % | | | 7.0 | % | | | 7.0 | % | | | 5.6 | % | | | 6.2 | % |
| Net loan charge-offs as a percentage of total loans | | | 4.7 | % | | | 4.3 | % | | | 4.4 | % | | | 4.9 | % | | | 6.5 | % |
| Net loan charge-offs as a percentage of average total loans | | | 4.8 | % | | | 4.5 | % | | | 4.5 | % | | | 5.3 | % | | | 6.8 | % |
| (1) | Includes as of December 31, 2017, R$5,439 million of doubtful loans (R$5,576 million in 2016, R$5,549 million in 2015, R$3,959 million in 2014 and R$1,744 million in 2013) that were not past-due. |
Evolution of Impaired Assets
Our impaired assets increased by 1.4 %, or R$258 million, to R$19,145 million as of December 31, 2017, compared to R$18,887 million as of December 31, 2016. Provisions for impairment losses, including total recoveries of loans previously charged off, increased 0.4%, or R$71 million, to R$18,262 million as of December 31, 2017, compared to R$18,191 million as of December 31, 2016. Offsetting these effects were recoveries of R$1,154 million on loans previously written off as of December 31, 2017 and R$994 million as of December 31, 2016.
Santander Brasil believes the provisions it has taken were adequate to cover all known or reasonably probable losses or incurred losses in the credit portfolio of loans and other assets as of December 31, 2017.
The following table shows the changes in our impaired assets at the dates indicated:
| | | As of December 31, |
| | | 2017 | | 2016 | | 2015 | | 2014 | | 2013 |
| | | (in millions of R$) |
| Balance at beginning of year | | | 18,887 | | | | 18,599 | | | | 14,011 | | | | 14,022 | | | | 16,057 | |
| Net additions | | | 13, 680 | | | | 11,893 | | | | 16,462 | | | | 12,114 | | | | 12,722 | |
| Write-offs | | | (13,422 | ) | | | (11,605 | ) | | | (11,874 | ) | | | (12,127 | ) | | | (14,757 | ) |
| Balance at end of year | | | 19,145 | | | | 18,887 | | | | 18,599 | | | | 14,011 | | | | 14,022 | |
The amount of “net additions” for any period is assets that became impaired in that period less assets that were impaired but became performing in that period. In 2017, better options to restructure debts decreased the “net additions” to impaired assets, keeping the amount relatively stable.
Impaired Assets by Type of Customer
The following table shows the amount of our impaired assets by type of customers at the dates indicated:
| | | As of December 31, |
| | | 2017 | | 2016 |
| | | (in millions of R$) |
| Commercial and industrial | | | 11,994 | | | | 11,629 | |
| Real estate | | | 782 | | | | 719 | |
| Installment loans to individuals | | | 6,304 | | | | 6,488 | |
| Lease financing | | | 65 | | | | 52 | |
| Total | | | 19,145 | | | | 18,887 | |
Commercial and Industrial
Impaired assets in the portfolio of commercial and industrial loans amounted to R$11,994 million as of December 31, 2017, an increase of R$365 million, or 3.1%, compared to R$11,629 million as of December 31, 2016. The increase in impaired assets in this portfolio was mainly primarily due to defaults by certain borrowers as a result of the weak macroeconomic conditions in Brazil. We have put in place various measures to manage impaired assets, including collection practices with respect to our borrowers whereby we offered certain customers the chance to negotiate a restructuring of their debts.
Real Estate
Impaired assets in the real estate lending portfolio totaled R$782 million on December 31, 2017, an increase of R$63 million, or 8.8%, compared to R$719 million as of December 31, 2016. The increase was primarily due to defaults by certain specific large borrowers as a result of the weak macroeconomic conditions in Brazil.
Installment Loans to Individuals
Impaired assets in the installment loans to individuals lending portfolio totaled R$6,304 million as of December 31, 2017, with a decrease of R$184 million, or 2.8%, compared to 2016. This decrease was a result of renegotiation practices for customers during restructuring programs along the year which reflects the measures adopted by Santander Brasil since late 2012 to manage default rates in this portfolio, which included the adaptation of credit limits for new customers, the development of new loan models with “predictive scoring” enhancements and recovery campaigns to offer to delinquent customers loan terms adjustments to help them meet their payment obligations.
Lease Financing
Impaired assets in the lease financing lending portfolio totaled R$65 million on December 31, 2017, an increase of R$13 million compared to December 31, 2016. The increase in impaired assets was mainly due to defaults by certain borrowers as a result of weak macroeconomic conditions in Brazil.
Methodology for Impairment Losses
We evaluate all loans regarding the provision for impairment losses from credit risk. Loans are either individually evaluated for impairment, or collectively evaluated by grouping similar risk characteristics. Loans that are individually evaluated for impairment losses are not evaluated collectively.
To measure the impairment loss on loans individually evaluated for impairment, we consider the conditions of the borrowers, such as their economic and financial situation, level of indebtedness, ability to generate income, cash flow, management, corporate governance and quality of internal controls, payment history, industry expertise, contingencies and credit limits, as well as the characteristics of assets, such as their nature and purpose, type, sufficiency and liquidity level guarantees and total amount of credit, as well as based on historical experience of impairment and other circumstances known at the time of evaluation.
To measure the impairment loss on loans collectively evaluated for impairment, we segregate financial assets into groups considering the characteristics and similarity of credit risk. In other words, according to segment, the type of assets, guarantees and other factors associated such as the historical experience of impairment and other circumstances known at the time of assessment.
The loss parameters used to calculate the provisions also consider the type of exposure risk, recovery history and payment of renegotiated portfolio, as well as the probability of default of these operations, which are usually higher when compared to operations which have not been renegotiated.
The impairment loss is calculated using statistical models that consider the following factors:
| · | Exposure at default or “EAD” is the amount of risk exposure at the date of default by the borrower. In accordance with IFRS as issued by the IASB, the exposure at default used for this calculation is the current exposure, as reported in the balance sheet. |
| · | Probability of default or “PD” is the probability of the borrower failing to meet its principal and/or interest payment obligations. PD is measured using a time horizon of one year; that is, it quantifies the probability of the borrower defaulting in the coming year. A loan is in default if either the value of principal or interest is past due by ninety days or more or the loan is current but there are doubts as to the solvency of the counterparty (subjective doubtful assets). |
| · | Loss given default, or “LGD,” is the loss arising in the event of default. In addition to examining the PD, we manage our portfolio looking for loans in which the borrowers will provide higher volumes of guarantees relating to operations and who will also act to constantly strengthen the area of loan recovery. These and other actions combined are responsible for ensuring the adequacy of the LGD parameters (loss resulting from the event of default by the borrower to honor the principal and/or interest payments). The LGD calculation is based on the net charge-offs on defaulted loans, taking into account the guarantees/collateral associated with the loans, the income and expenses associated with the recovery process and the timing of delinquency. |
| · | Loss identification period, or “LIP,” is the time period between the occurrence of a loss event and the identification of an objective evidence of this loss by us. In other words, it represents the time horizon from the credit loss occurrence until the effective confirmation of such loss. |
Moreover, prior to charging off past due loans without recovery (which is only done after we have completed all recovery efforts), we record provisions to the remaining balance of the loan so our allowance for impairment losses fully covers our losses. Thus, we understand that our allowance for impairment losses methodology has been developed to fit its risk metrics and capture loans that could potentially become impaired.
Loans Past Due for Less Than 90 Days But Not Classified as Impaired
The following table shows the loans past due for less than 90 days but not classified as impaired at the dates indicated:
| | | As of December 31, |
| | | 2017 | | % of total | | 2016 | | % of total |
| | | (in millions of R$, except percentages) |
| Commercial and industrial | | | 3,559 | | | | 19.9 | | | | 4,141 | | | | 23.8 | |
| Mortgage loans | | | 4,880 | | | | 27.3 | | | | 5,202 | | | | 29.9 | |
| Installment loans to individuals | | | 9,266 | | | | 51.8 | | | | 7,957 | | | | 45.7 | |
| Lease financing | | | 177 | | | | 1.0 | | | | 109 | | | | 0.6 | |
| Total (*) | | | 17,882 | | | | 100.0 | | | | 17,409 | | | | 100.0 | |
| (*) | Refers only to loans past due between 1 and 90 days. |
Impaired Asset Ratios
Our Credit risk exposure portfolio increased by R$28.8 billion to R$330.5 billion as of December 31, 2017 compared to R$301.7 billion as of December 31, 2016. Our impaired assets increased by approximately R$258 million in the same period, from R$18.9 billion to R$19.1 billion. The default rate decreased by 47 basis points in 2017 in comparison to 2016. The decrease in impaired asset ratios was mainly caused by our efforts to better manage our impaired assets and provisions for impairment losses, especially in the commercial and industrial portfolio, by offering certain customers the chance to negotiate and restructure their debts.
The following table shows the ratio of our impaired assets to total credit risk exposure and our coverage ratio at the dates indicated.
| | | As of December 31, |
| | | 2017 | | 2016 | | 2015 | | 2014 | | 2013 |
| | | (in millions of R$ except percentages) |
| Loans and advances to customers, gross | | | 287,829 | | | | 268,438 | | | | 267,266 | | | | 249,111 | | | | 226,206 | |
| Impaired assets | | | 19,145 | | | | 18,887 | | | | 18,599 | | | | 14,011 | | | | 14,022 | |
| Provisions for impairment losses | | | 18,262 | | | | 18,191 | | | | 15,412 | | | | 13,563 | | | | 13,641 | |
| Credit risk exposure Non-GAAP – customers (1) | | | 330,474 | | | | 301,703 | | | | 310,877 | | | | 288,445 | | | | 257,420 | |
| Ratios | | | | | | | | | | | | | | | | | | | | |
| Impaired assets to credit risk exposure | | | 5,8 | % | | | 6.3 | % | | | 6.0 | % | | | 4.9 | % | | | 5.4 | % |
| Coverage ratio(2) | | | 95,4 | % | | | 96.3 | % | | | 82.9 | % | | | 96.8 | % | | | 97.3 | % |
| Impairment losses | | | (12,338 | ) | | | (13,390 | ) | | | (12,966 | ) | | | (11,193 | ) | | | (13,900 | ) |
| Losses on other financial instruments not measured at fair value(3) | | | — | | | | 88 | | | | (524 | ) | | | (78 | ) | | | (218 | ) |
| Impairment losses on financial assets (net)(4) | | | (12,338 | ) | | | (13,301 | ) | | | (13,634 | ) | | | (11,272 | ) | | | (14,118 | ) |
| (1) | Credit risk exposure is a non-GAAP financial measure. Credit risk exposure is the sum of the amortized cost amounts of loans and advances to customers (including impaired assets) amounting to R$287,829 million as of December 31, 2017 and guarantees and documentary credits amounting to R$42,645 million as of December 31, 2017. We include off-balance sheet information in this measure to better demonstrate our total managed credit risk. |
| (2) | Provisions for impairment losses as a percentage of impaired assets. |
| (3) | Corresponds to the registration of losses of a permanent character in the realization value of bonds and securities classified as “securities available for sale” currently accounted for in “earnings on financial assets (net).” |
| (4) | As of December 31, 2017 impairment losses on financial assets (net) included R$2.784 million relating to debt instruments. |
The following chart shows our impaired assets to credit risk ratio from 2013 through 2017:
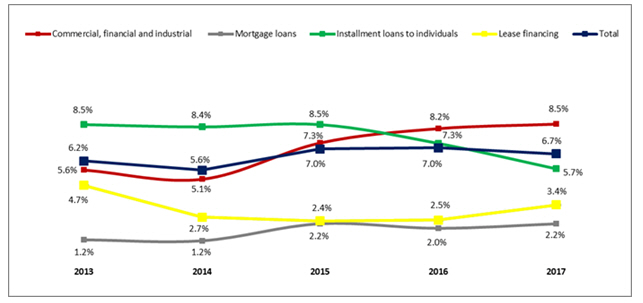
Non-current assets held for sale
The following table shows the movement in non-current assets held for sale at the dates indicated.
| | | As of December 31, |
| | | 2017 | | 2016 | | 2015 |
| | | (in millions of R$, except percentages) |
| Balance at beginning of year | | | 1,418 | | | | 1,310 | | | | 978 | |
| Foreclosures loans and other assets transferred | | | 524 | | | | 835 | | | | 293 | |
| Capital increase in companies held for sale | | | — | | | | 10 | | | | 355 | |
| Change in the scope of consolidation (1) | | | — | | | | (498 | ) | | | — | |
| Sales | | | (435 | ) | | | (239 | ) | | | (317 | ) |
| Final balance, gross | | | 1,508 | | | | 1,418 | | | | 1,310 | |
| Impairment losses | | | (352 | ) | | | (80 | ) | | | (73 | ) |
| Impairment as a percentage of foreclosed assets | | | 23.4 | % | | | 5.7 | % | | | 5.5 | % |
| Balance at end of year | | | 1,155 | | | | 1,338 | | | | 1,237 | |
| (1) | In 2016, as a result of there being no expectation of sale of these wind energy entities in existing market conditions, it was decided to transfer these to the line “Investments in affiliates and subsidiaries in the country.” On December 22, 2017, our wholly-owned subsidiary Santander Corretora de Seguros, Investimentos e Serviços S.A. (“Santander Investimentos”), Cia. de Ferro Ligas da Bahia – FERBASA S.A. (“FERBASA”) and Brazil Wind S.A. (“Brazil Wind”) entered into an agreement for the sale of 100% of the shares issued by BW Guirapá I S.A. (“BW I”) and owned by Santander Investimentos and Brazil Wind to FERBASA. For more information, see“Item 4. A—Important Events—Sale of BW Guirapá I S.A.” |
Liabilities
Deposits
The principal components of our deposits are customer demand, time and notice deposits, and international and domestic interbank deposits. Our retail customers are the principal source of our demand, time and notice deposits.
The following tables analyze our deposits at the dates indicated.
| | | As of December 31, |
| | | 2017 | | 2016 | | 2015 |
| | | (in millions of R$) |
Deposits from the Brazilian Central Bank
and Credit Institutions | | | | | | | | | | | | |
| Time deposits | | | 52,739 | | | | 49,549 | | | | 55,795 | |
| Demand deposits | | | 306 | | | | 314 | | | | 145 | |
| Repurchase agreements | | | 26,329 | | | | 28,771 | | | | 13,511 | |
| of which: | | | | | | | | | | | | |
| Backed operations with Private Securities(1) | | | — | | | | 446 | | | | 85 | |
| Backed operations with Public Securities | | | 26,329 | | | | 28,324 | | | | 13,427 | |
Total deposits of the Brazilian Central Bank
and Credit Institutions | | | 79,375 | | | | 78,634 | | | | 69,451 | |
| Customer deposits | | | | | | | | | | | | |
| Current accounts | | | 17,560 | | | | 15,868 | | | | 15,580 | |
| Savings accounts | | | 40,572 | | | | 36,051 | | | | 35,985 | |
| Time deposits | | | 146,818 | | | | 94,478 | | | | 89,986 | |
| Repurchase agreements | | | 71,092 | | | | 101,047 | | | | 101,492 | |
| of which: | | | | | | | | | | | | |
| Backed operations with Private Securities(1) | | | 33,903 | | | | 59,460 | | | | 61,174 | |
| Backed operations with Public Securities(1) | | | 37,189 | | | | 41,586 | | | | 40,318 | |
| Total Customer deposits | | | 276,042 | | | | 247,445 | | | | 243,043 | |
| Total deposits | | | 355,417 | | | | 326,079 | | | | 312,494 | |
| (1) | Refers primarily to repurchase agreements backed by debentures of own issue. |
The following table shows the maturity of time deposits (excluding inter-bank deposits) in denominations of U$100,000 or more at the dates indicated. Large denomination customer deposits may be a less stable source of funds than demand and savings deposits.
| | | As of December 31, 2017 |
| | | Domestic | | International |
| | | (in millions of R$) |
| Under 3 months | | | 20,299 | | | | 2,815 | |
| 3 to 6 months | | | 9,690 | | | | — | |
| 6 to 12 months | | | 11,270 | | | | — | |
| Over 12 months | | | 38,200 | | | | 3,396 | |
| Total | | | 79,459 | | | | 6,211 | |
Short-Term Borrowings
The following table shows our short-term borrowings consisting of government securities that we sold under agreements to repurchase for purpose of funding our operations.
| | | As of December 31, |
| | | 2017 | | 2016 | | 2015 |
| | | Amount | | Average Rate | | Amount | | Average Rate | | Amount | | Average Rate |
| | | (in millions of R$, except percentages) |
Securities sold under agreements
to repurchase | | | | | | | | | | | | | | | | | | | | | | | | |
| As of December 31 | | | 97,421 | | | | 8.33 | % | | | 131,016 | | | | 13.60 | % | | | 115,003 | | | | 14.15 | % |
| Average during the period (1) | | | 98,567 | | | | 10.63 | % | | | 124,705 | | | | 14.11 | % | | | 89,046 | | | | 14.24 | % |
| Maximum month-end balance | | | 119,007 | | | | | | | | 131,016 | | | | | | | | 103,105 | | | | | |
Total short-term borrowings at
year end | | | 97,421 | | | | | | | | 131,016 | | | | | | | | 115,003 | | | | | |
| (1) | The average annual balance sheet data has been calculated based upon the average of the monthly balances at 13 dates: at December 31 of the prior year and for each of the month-end balances of the 12 subsequent months. |
4C. Organizational Structure
Santander Group controls Santander Brasil directly and indirectly through Santander Spain, Sterrebeeck B.V. (“Sterrebeeck”) and Grupo Empresarial Santander, S.L. which are controlled subsidiaries of the Santander Group. As of December 31, 2017, Santander Spain held, directly and indirectly, 89.5% of our voting stock (not including the shares held by Banco Madesant - Sociedade Unipessoal).
As of December 31, 2017, Santander Spain was the largest bank in the euro zone by market capitalization, with a market capitalization of approximately €88,410 million. As of December 31, 2017, Santander Spain’s attributable profit totaled €7,516 million, 13.5% higher than the previous year, and the total shareholder remuneration on account of the earnings for the 2017 financial year is €0.463 per share. The Santander Group operates principally in Spain, the United Kingdom, other European countries, Brazil and other Latin American countries and the United States, offering a wide range of financial products. In Latin America, the Santander Group has majority shareholdings in financial institutions in Argentina, Brazil, Chile, Mexico, Peru, Puerto Rico and Uruguay. As of December 31, 2017, Santander Brasil contributed 26% of the profit attributable to the Santander Group.
The following table presents the name, country of incorporation or residence and proportion of ownership interest of our main subsidiaries in accordance with the criteria for consolidation pursuant to IFRS:
| | Activity | Country of Incorporation | Ownership Interest |
Direct | Total Direct and Indirect |
| Direct and Indirect subsidiaries of Banco Santander (Brasil) S.A. | | | | |
| Banco Bandepe S.A. | Bank | Brazil | 100.00% | 100.00% |
| Santander Leasing S.A. Arrendamento Mercantil | Leasing | Brazil | 78.57% | 99.99% |
| Aymoré Crédito, Financiamento e Investimento S.A. | Financial | Brazil | 100.00% | 100.00% |
| Santander Brasil Administradora de Consórcio Ltda. | Buying club | Brazil | 100.00% | 100.00% |
| Atual Companhia Securitizadora de Créditos Financeiros | Securitization | Brazil | 100.00% | 100.00% |
| Santander Corretora de Câmbio e Valores Mobiliários S.A. | Broker | Brazil | 99.99% | 100.00% |
| Santander Corretora de Seguros, Investimentos e Serviços S.A. (current name of Santander Participações S.A.) | Holding | Brazil | 100.00% | 100.00% |
| Getnet Adquirência e Serviços para Meios de Pagamento S.A.(1) | Payment Institution | Brazil | 88.50% | 88.50% |
| Sancap Investimentos e Participações S.A. | Holding | Brazil | 100.00% | 100.00% |
| Santander Brasil, EFC | Financial | Spain | 100.00% | 100.00% |
| Santander Holding Imobiliária S.A. (current name of Webcasas S.A.) | Holding | Brasil | 100% | 100.00% |
| Controlled by Sancap | | | | |
| Santander Capitalização S.A. | Savings and annuities | Brazil | — | 100.00% |
| Evidence Previdência S.A. | Social Securities | Brazil | — | 100.00% |
| Controlled by Getnet | | | | |
| Auttar HUT Processamento de Dados Ltda. | Other Activities | Brazil | — | 100.00% |
| Integry Tecnologia e Serviços A.H.U Ltda. | Other Activities | Brazil | — | 100.00% |
| Toque Fale Serviços de Telemarketing Ltda. | Other Activities | Brazil | — | 100.00% |
| Controlled by Aymoré CFI | | | | |
| Super Pagamentos e Administração de Meios Eletrônicos S.A.(2). | Other Activities | Brazil | — | 100.00% |
| Banco Olé Bonsucesso Consignado S.A. (current nameof Banco Bonsucesso Consignado S.A.)(3). | Bank | Brazil | — | 60.00% |
| Banco PSA Finance Brasil S.A. (6) | Bank | Brazil | — | 50.00% |
| Controlled by Banco Olé Bonsucesso Consignado | | | | |
| BPV Promotora de Vendas e Cobrança Ltda. | Other Activities | Brazil | — | 100.00% |
| OléTecnologia Ltda. | Other Activities | Brazil | — | 100.00% |
| Controlled by Santander Leasing | | | | |
| Santander Finance Arrendamento Mercantil S.A. (current name of PSA Finance Arrendamento Mercantil S.A.) (6). | Leasing | Brazil | — | 100.00% |
| Controlled by Corretora de Seguros, Investimentos e Serviços | | | | |
| Webmotors S.A. | Other activities | Brazil | — | 70% |
| Tecban – Tecnologia Bancária S.A. (Tecban) | Other activities | Brazil | — | 19.81% |
| PSA Corretora de Seguros e Serviços Ltda. | Insurance broker | Brazil | — | 50% |
| Santander FIC FI Contract I Referenciado DI | Investment Fund | Brazil | — | (a) |
| Santander Fundo de Investimento Unix Multimercado Crédito Privado | Investment Fund | Brazil | — | (a) |
| Santander Fundo de Investimento Diamantina Multimercado Crédito Privado de Investimento no Exterior | Investment Fund | Brazil | — | (a) |
| Santander Fundo de Investimento Amazonas Multimercado Crédito Privado de Investimento no Exterior | Investment Fund | Brazil | — | (a) |
| Santander Fundo de Investimento SBAC Referenciado DI Crédito Privado | Investment Fund | Brazil | — | (a) |
| Santander Fundo de Investimento Guarujá Multimercado Crédito Privado de Investimento no Exterior | Investment Fund | Brazil | — | (a) |
| Santander Fundo de Investimento Financial Curto Prazo | Investment Fund | Brazil | — | (a) |
| Santander Fundo de Investimento Capitalization Renda Fixa | Investment Fund | Brazil | — | (a) |
| Santander Paraty QIF PLC (5) | Investment Fund | Brazil | — | (a) |
| Santander FI Hedge Strategies Fund (5) | Investment Fund | Brazil | — | (a) |
| BRL V - Fundo de Investimento Imobiliário-FII (4) | Investment Fund | Brazil | — | (a) |
| (a) | Company to which we are exposed, or have rights to variable returns and have the ability to affect those returns by making certain decisions in accordance with IFRS 10 - Consolidated Financial Statements. We and/or our subsidiaries hold 100% of the quotas of these investment funds. |
| (1) | In May 2016, Super received approval from the Brazilian Central Bank to operate as a payment institution. |
| (2) | On January 4, 2016, Aymoré CFI informed the sellers of its decision to exercise the call option for the shares representing the remaining 50% of Super’s total voting capital owned by the sellers, for a value of approximately R$113 million. The transaction was completed on March 10, 2016, following receipt of approval from the Brazilian Central Bank. |
| (3) | At an extraordinary general meeting held on March 3, 2016 the change from the name of Banco Bonsucesso Consignado S.A. to Banco Olé Bonsucesso Consignado S.A. was approved. This name change received approval from the Brazilian Central Bank on June 1, 2016. At the ESM of November 1, 2016, the capital increase of Banco Olé Bonsucesso Consignado in the amount of R$50,000, from the current R$350,000 to R$400,000 was approved, through the issuance of 28,509,708 new nominated ordinary shares, without nominal value. The capital increase was approved by the Brazilian Central Bank in November 22, 2016. |
| (4) | This fund was established and became consolidated from August 2016. It is a structure in which Santander Brasil is the creditor of certain debts guaranteed by real estate. The real estate provided as guarantee was converted into capital contributions to the fund. Simultaneously with this, the shares in the fund were transferred to Santander Brasil. |
| (5) | Santander Brasil, through its subsidiaries, holds the risks and benefits of Santander Paraty QIF PLC and the sub-fund Santander FI Hedge Strategies Fund, both of which are based in Ireland and since August 2016 are fully consolidated into Santander Brasil’s financial statements. Santander Paraty QIF PLC does not hold any investments itself, acting instead through Santander FI Hedge Strategies Fund. |
| (6) | Investment acquired on August 1, 2016. |
4D. Property, Plant and Equipment
We operate four major administrative operational centers, all of which are owned properties. Additionally, we own 403 properties for the activities of our banking network and rent 1,635 properties for the same purpose. Furthermore, in 2014, we opened and concluded the migration of our operation to the new data center located in Campinas, which also is an owned property. For further information about the location of our branches, see “—Item 4. Information on the Company—B. Business Overview—Distribution Network.” Our headquarters are located at Av. Presidente Juscelino Kubitschek, 2,041 and 2,235 Block A, Vila Olímpia, São Paulo, State of São Paulo, Brazil.
ITEM 4A. UNRESOLVED STAFF COMMENTS
Not applicable.
ITEM 5. OPERATING AND FINANCIAL REVIEW AND PROSPECTS
5A. Operating Results
The following discussion of our financial condition and results of operations should be read in conjunction with our consolidated financial statements for the years ended December 31, 2017, 2016 and 2015 and the related notes thereto, and with the financial information presented under the section entitled “Item 3. Key Information—A. Selected Financial Data” included elsewhere in this annual report. The preparation of the consolidated financial statements referred to in this section required the adoption of assumptions and estimates that affect the amounts recorded as assets, liabilities, revenue and expenses in the years and periods presented and are subject to certain risks and uncertainties. Our future results may vary substantially from those indicated as a result of various factors that affect our business, including, among others, those mentioned in the sections “Forward-Looking Statements” and “Item 3. Key Information—D. Risk Factors,” and other factors discussed elsewhere in this annual report. Our consolidated financial statements for the years ended December 31, 2017, 2016 and 2015, prepared in accordance with IFRS as issued by the IASB and the report of our independent registered public accounting firm are included in “Item 18. Financial Statements.”
Brazilian Macroeconomic Environment
In 2015, the economy deteriorated due to imbalances in the main macro fundamentals (inflation, external accounts and fiscal accounts). Monetary policy adjustments, contraction of federal government spending and tax increases, depreciation of the real against the dollar, and realignment of public tariff prices were needed. These factors contributed to a decrease in disposable income, which further slowed down the economy. Despite all the economic adjustments implemented throughout the year, the fiscal imbalance widened and the GDP contracted by 3.5% during 2015, which led to Brazil being downgraded to non-investment grade status by S&P in September 2015, Fitch Ratings in December 2015 and Moody’s in February 2016. Various major Brazilian companies were also downgraded. Such downgrades have further worsened the conditions of the Brazilian economy and the financial condition of Brazilian companies, especially those relying on foreign investments.
The recession continued throughout 2016, with GDP contracting 3.5%. However, market conditions improved markedly after a turbulent first quarter: inflation started to fall and ended the year within the official target band (at 6.3%), the currency strengthened, and the Central Bank started cutting the overnight interest rate. Fiscal deficits remained high, but a broad reform agenda, including the imposition of a freeze in government spending in real terms (already approved by the Congress) and a proposed social security reform helped to put the debt/GDP ratio on a more sustainable path, which appeared to have a positive impact on markets.
During the course of 2017 the Brazilian government announced changes to certain labor laws and the creation of a new long term rate for BNDES loans. However, the reform of Brazil’s social security system has been postponed to 2019.
Other Factors Affecting Our Financial Condition and Results of Operations
As a Brazilian bank, we are significantly affected by the general economic environment in Brazil. The following table presents key data of the Brazilian economy for the periods indicated:
| | | For the year ended December 31, |
| | | 2017 | | 2016 | | 2015 |
| GDP growth (1) | | | 1.0 | % | | | (3.5 | )% | | | (3.5 | )% |
| CDI rate (2) | | | 9.9 | % | | | 14.0 | % | | | 13.2 | % |
| TJLP (3) | | | 7.00 | % | | | 7.50 | % | | | 7.00 | % |
| SELIC rate (4) | | | 7.00 | % | | | 13.75 | % | | | 14.25 | % |
| Increase (decrease) in real rate against the U.S. dollar | | | 1.5 | % | | | (16.5 | )% | | | 47.0 | % |
| Selling exchange rate (at period end) R$ per U.S.$1.00 | | | 3.31 | | | | 3.26 | | | | 3.90 | |
| Average exchange rate R$ per U.S.$1.00 (5) | | | 3.19 | | | | 3.49 | | | | 3.33 | |
| Inflation (IGP-M) (6) | | | (0.5 | )% | | | 7.2 | % | | | 10.5 | % |
| Inflation (IPCA) (7) | | | 2.9 | % | | | 6.3 | % | | | 10.7 | % |
Sources: BNDES, Brazilian Central Bank, FGV and IBGE.
| (1) | Revised series. Source: IBGE. |
| (2) | The overnight interbank deposit rate (Certificado de Depósito Interbancário), or “CDI” is the average daily interbank deposit rate in Brazil (at the end of each month and annually). This is the average rate for the given year. |
| (3) | Represents the interest rate applied by the BNDES for long-term financing (at the end of the period). |
| (4) | The benchmark interest rate payable to holders of some securities, such as treasury financial letters, issued by the Brazilian government and traded on the SELIC rate at the end of the applicable period. |
| (5) | Average of the selling exchange rate for the business days during the period. |
| (6) | The inflation rate is the general index of market prices (Índice Geral de Preços-Mercado, or “IGP-M”), as calculated by FGV. |
| (7) | The inflation rate is the consumer price index (Índice de Preços ao Consumidor – Amplo, or “IPCA”), as calculated by the IBGE. |
Interest Rates
On January 21, 2015, the SELIC rate was increased to 12.25%, reaching 12.75% on March 3, 2015. In April 2015, the SELIC rate was 13.25%. The monetary tightening cycle was extended until July 2015, when the SELIC rate reached 14.25%. In October 2016, the Brazilian Central Bank started a monetary easing cycle, reducing the SELIC rate to 13.75% on December 31, 2016, and further reducing the SELIC rate to 7.00% as of December 31, 2017. The Brazilian Central Bank reduced the SELIC rate by 0.25% on meetings held on February 7 and March 21, 2018, bringing the SELIC rate down to 6.50%. A decrease in the SELIC rate may have a positive impact on our operations by promoting volume growth, even though it may also create pressure on asset-side spreads, while liability spreads should remain stable or even improve.
The following table presents the low, high, average and period-end SELIC rate since 2013, as reported by the Brazilian Central Bank:
| | | Low | | High(1) | | Average(2) | | Period-End |
| Year | | | | | | | | | | | | | | | | |
| 2013 | | | 7.25 | | | | 10.00 | | | | 8.44 | | | | 10.00 | |
| 2014 | | | 10.00 | | | | 11.75 | | | | 11.02 | | | | 11.75 | |
| 2015 | | | 11.75 | | | | 14.25 | | | | 13.58 | | | | 14.25 | |
| 2016 | | | 13.75 | | | | 14.25 | | | | 14.15 | | | | 13.75 | |
| 2017 | | | 7.00 | | | | 13.75 | | | | 9.83 | | | | 7.00 | |
| 2018 (through March 30, 2018) | | | 6.50 | | | | 7.00 | | | | 6.75 | | | | 6.50 | |
| (1) | Highest month-end rate. |
| (2) | Average of month-end rates during the period. |
Our assets are predominantly fixed rate and our liabilities are predominantly floating. The resulting exposure to increases in market rates of interest is modified by our use of cash flow hedges to convert floating rates to fixed, but we maintain an exposure to interest rate movements. As of December 31, 2017, a 100 basis point increase in the yield curve would have resulted in R$378 million decline in the net interest income over a one-year period.
Credit Volume and Quality in Brazil
There was a slowdown in credit growth in 2015, with an annual growth of outstanding credit of 6.7%, a ratio of non-performing loans to individuals increased to 4.2% and a decrease of the household debt burden to 21.2%. In 2016, outstanding credit contracted 3.5% in nominal terms, but delinquency continued to fall: the ratio of non-performing loans to individuals reached 3.9%.
The total outstanding credit to GDP increased from 34.7% in December 2007 to 53.7% in December 2016, and fell to 47% in 2017.
| | | 2017 | | 2016 | | 2015 |
| | | (in billions of R$) |
| Total Credit Outstanding (*) | | | 3,064 | | | | 3,107 | | | | 3,217 | |
| Earmarked credit | | | 1,511 | | | | 1,550 | | | | 1,582 | |
| Non-earmarked based credit | | | 1,553 | | | | 1,557 | | | | 1,635 | |
| of which: | | | | | | | | | | | | |
| Corporate | | | 705 | | | | 747 | | | | 832 | |
| Individuals (retail) | | | 847 | | | | 809 | | | | 805 | |
| (*) | Some figures may be subject to revision by the Brazilian Central Bank. |
Source: Brazilian Central Bank.
Foreign Exchange Rates
Our policy is to maintain limited foreign exchange rate exposure by seeking to match foreign currency denominated assets and liabilities as closely as possible, including through the use of derivative instruments. In 2017, we recorded foreign exchange revenues of R$605 million, R$4,575 million in 2016 and foreign exchange losses of R$10,084 million in 2015. These results are due to the variation of the U.S. dollar against thereal on our assets and liabilities positions in U.S. dollar denominated instruments during these years. These foreign exchange gains and losses were offset in large part in each year by a corresponding loss or gain on derivatives entered into to hedge this exposure. Such losses and gains are recorded under “Exchange differences (net).”
The Brazilian currency has, during the last decades, experienced frequent and substantial variations in relation to the U.S. dollar and other foreign currencies. During 2015, thereal depreciated significantly mainly as a result of deteriorating economic conditions in Brazil, including Brazil being downgraded to non-investment grade status by
S&P and Fitch Ratings, and a decrease in global commodities prices, and on December 31, 2015, the exchange rate was R$3.90 per U.S.$1.00. During 2016, thereal appreciated 17% against the U.S. dollar as a result of improved macroeconomic conditions in Brazil. On December 31, 2016, the exchange rate was R$3.26 per U.S.$1.00. Therealremained relatively stable against the U.S. dollar throughout 2017, with a small depreciation of 1.5%. On December 31, 2017, the exchange rate was R$3.31 per U.S.$1.00.
Depreciation of thereal relative to the U.S. dollar has created additional inflationary pressures in Brazil, which have led to increases in interest rates, limited Brazilian companies’ access to foreign financial markets and prompted the adoption of recessionary policies by the Brazilian government. Depreciation of thereal may also, in the context of an economic slowdown, lead to decreased consumer spending, deflationary pressures and reduced growth of the Brazilian economy as a whole, and thereby harm our asset base, financial condition and results of operations. Additionally, depreciation of thereal could make our foreign currency-linked obligations and funding more expensive, negatively affect the market price of our securities portfolios and have similar consequences for our borrowers. Conversely, appreciation of thereal relative to the U.S. dollar and other foreign currencies could lead to a deterioration of the Brazilian foreign exchange currency accounts, as well as dampen export-driven growth. Depending on the circumstances, either depreciation or appreciation of thereal could materially and adversely affect the growth of the Brazilian economy and our business, financial condition and results of operations.
Inflation
The adoption of inflation targeting in 1999 resulted in a significant reduction in inflation rates in Brazil (measured by the IPCA, Consumer Price Index, the official inflation rate provided by the IBGE). In recent years, inflation has been oscillating around the target, which is set by the CMN. The target, which is still in effect, has been set at 4.5% since 2005 with a tolerance interval of 2% above and below this target. From 2017 onwards the tolerance interval for 2017 inflation was reduced to 1.5%. In addition, the target for inflation was set at 4.25% in 2019 and 4.00% in 2020.
Between 2012 and 2014, inflation ranged from 5.8% to 6.4%,i.e., it was close to the top of the fluctuation range in the Brazilian Central Bank’s inflation targeting range. In 2015, as a result of the indexation of a significant portion of contracts for services to the inflation levels of the previous years, the impact of adjustment of tariffs and the impact of the depreciation of thereal on prices, the inflation rate reached a level of 10.7%, the highest on record since May 2005 and well above the Brazilian Central Bank’s inflation target of 4.5%. In 2016, inflation fell substantially as a result of the consistent efforts of the Brazilian Central Bank to reduce the inflation rate, ending the year at 6.3% (twelve-month accumulated rate). In 2017, inflation continued to decrease, with the twelve-month accumulated rate reaching 2.95%, below the lower limit of the Brazilian Central Bank’s target fluctuation range of 3% to 6%. As a result, the Brazilian Central Bank was required to send a letter to the CMN explaining the reasons for not meeting the target in which the Brazilian Central Bank explained that it expects that the monetary easing undertaken between 2016 and 2017 is expected to make the actual inflation rate converge towards the target.
The majority of our income, expenses, assets and liabilities are directly tied to interest rates. Therefore, our results of operations and financial condition are significantly affected by inflation, interest rate fluctuations and related government monetary policies, all of which may materially and adversely affect the growth of the Brazilian economy, our loan portfolios, our cost of funding and our income from credit operations. We estimate that in 2017, a 1.0% increase or decrease in the base interest rate would have resulted in a decrease or increase, respectively, in our net interest income of R$378 million. Any changes in interest rates may negatively impact our business, financial condition and results of operations. In addition, increases in base interest rates may adversely affect us by reducing the demand for our credit and investment products, increasing funding costs and increasing in the short run the risk of default by our customers.
Inflation adversely affects our personnel and other administrative expenses that are directly or indirectly tied to inflation indexes, generally the consumer price index (Índice de Preços ao Consumidor – Amplo), or “IPCA,” and the general index of market prices (Índice Geral de Preços-Mercado), or “IGPM.” For example, considering the amounts in 2017, each additional percentage point change in inflation, would impact our personnel and other administrative expenses by approximately R$84 million and R$65 million, respectively.
Reserve and Lending Requirements
The requirements set by the Brazilian Central Bank for reserves and credit has a significant impact on the operational results of the financial institutions in Brazil. Increases or decreases in such requirements may have an impact on our operational results by limiting or expanding the amounts available for commercial credit transactions.
The table below shows the requirements for reserves and credit to which we are subject for each financing category:
Product | As of December 31, 2017 | As of December 31, 2016 | Form of Required Reserve | Yield |
| Demand deposits | | | | |
| Rural credit loans (1) | 34.0% | 34.0% | Loans | Cap rate: 9.5% p.a. |
| Microcredit loans (2) | 2.0% | 2.0% | Loans | Cap rate: 2.0% p.m. |
| Reserve requirements (4) | 40.0% | 45.0% | Cash | Zero |
| Additional reserve requirements | 0.0% | 0.0% | Cash | SELIC |
| Free funding (3) | 24.0% | 19.0% | | |
| Savings accounts | | | | |
| Mortgage loans | 65.0% | 65.0% | Loans | Cap of TR + 12.0% p.a. |
| | | | TR + 6.17% p.a., or | |
| Reserve requirements (4) | 24.5% | 24.5% | Cash | TR + 70.0% of the target SELIC |
| Additional reserve requirements | 0.0% | 5.5% | Cash | SELIC |
| Free funding (3) | 10.5% | 5.0% | | |
| Time deposits | | | | |
| Reserve requirements (4) | 34.0% | 25.0% | | |
| In cash or other instruments | 0.0% | 15.0% | Cash or other instruments | SELIC for Cash |
| In cash | 0.0% | 10.0% | Cash | SELIC |
| Additional reserve requirements | 0.0% | 11.0% | Cash | SELIC |
| Free funding(3) | 66.0% | 64.0% | | |
| (1) | Rural credits are credits granted to farmers in the amount of R$11.6 billion and R$9.0 billion on December 31, 2017 and December 31, 2016, respectively. |
| (2) | Micro-credit is a credit granted to very small businesses, with an open position of R$429.0 million and R$317.1 million on December 31, 2017 and December 31, 2016, respectively. |
| (3) | Interest-free financing is the amount to be used on a free of interest basis for other purposes in each financing category. |
| (4) | According to Circular No. 3,823” of the CMN, the Brazilian Central Bank replaced the reserve requirement deduction of time deposits and demand deposits by a fixed amount, based on total deductions as of January 20, 2017. From 2020, no deductions will be allowed. No deductions are allowed to meet reserve requirements for saving accounts. |
Taxes
See “Item 4. Information on the Company—B. Business Overview—Regulation and Supervision—Taxation.”
Hedging in Foreign Investments
We operate a branch in the Cayman Islands and have a subsidiary named Santander Brasil Establecimiento Financiero de Credito, EFC, or “Santander EFC” (an independent wholly-owned subsidiary in Spain) which are used primarily for sourcing funds in the international banking and capital markets to provide credit lines for us that are extended to our customers for working capital and trade-related financings. Under Brazilian income tax rules, the gains or losses resulting from the impact of appreciation or devaluation of thereal on foreign investments are non-taxable or non-deductible. This tax treatment results in volatility of the income tax line item in our income statement. This asymmetry is offset through a derivative position in U.S. dollar futures, which generates gains or losses dependent on any devaluation or appreciation of thereal, which is our strategy to protect our after-tax results. The reconciliation of our effective tax rate to the statutory tax rate is set forth in note 23b to our consolidated financial statements as of and for the year ended December 31, 2017.
Goodwill of Banco Real
We generated goodwill of R$27 billion as a result of our acquisition of Banco Real in 2008. Under IFRS, we are required to analyze goodwill for impairment at least annually or whenever there are indications of impairment. In 2017, 2016 and 2015, the recoverable goodwill amounts are determined from “value in use” calculations. For this purpose, we estimate cash flow for a period of five years. We prepare cash flow estimates considering several
factors, including: (i) macroeconomic projections, such as interest rates, inflation and exchange rates, among others, (ii) the performance and growth estimates of the Brazilian financial system, (iii) increased costs, returns, synergies and investment plans, (iv) the behavior of customers, and (v) the growth rate of, and long-term adjustments to, cash flows. These estimates rely on assumptions regarding the likelihood of future events, and changing certain factors could result in different outcomes. The estimate of cash flows is based on valuations prepared by an independent research company, which is reviewed and approved by the board of directors. Therefore, amortization of goodwill for tax purposes generates a permanent difference and, as a result, no record of the deferred tax liability.
The following table shows the main assumptions for the basis of valuation as of the dates indicated.
| | 2017 | 2016 | 2015 |
| | (Value in use: cash flows) |
| Main Assumptions(*) | | | |
| Basis of valuation | | | |
| Period of the projections of cash flows(1) | 5 years | 5 years | 5 years |
| Growth rate(2) | 8.3% | 8.0% | 7.5% |
| Discount rate(3) | 14.6% | 15.2% | 15.2% |
| (1) | The projections of cash flow are prepared using internal budget and growth plans of management, based on historical data, market expectations and conditions such as industry growth, interest rate and inflation. |
| (2) | The growth rate is calculated based on areal growth rate of 4.15% p.a. plus annual long-term inflation in 2017. |
| (3) | The discount rate is calculated based on the capital asset pricing model. The discount rate before tax is 20.42% in 2017, 20.23% in 2016 and 20.11% in 2015. |
| (*) | The recoverability test was performed during the second half of 2017. Goodwill is tested for impairment at the end of each reportable period or whenever there is any indication of a potential impairment. |
We performed a sensitivity test in the goodwill impairment analysis considering the main assumptions that could reasonably be expected to possibly change, as required by the IFRS. Accordingly, we applied such a test considering the discount rate and perpetuity growth rate as the main assumption subject to reasonably possible change and we did not identify any impairment to goodwill.
Factors Affecting the Comparability of Our Results of Operations
Acquisition of equity stake of Ipanema Empreendimentos e Participações S.A. and Gestora de Investimentos Ipanema S.A.
On October 16, 2017, Santander Brasil, through its wholly-owned subsidiary Atual Companhia Securitizadora de Créditos Financeiros, acquired a direct equity interest in the Ipanema Entities corresponding to 70% of Ipanema Entities’ share capital.
The Ipanema Entities are active in the credit recovery intelligence sector, providing services such as credit portfolio evaluation and pricing, collection, management and recovery of non-performing loans. Ipanema Credit Management focuses on portfolio pricing, collection and credit recovery management while Ipanema Asset, as an authorized asset manager duly licensed by the CVM, is responsible for the management of credit funds in which the portfolios of the Ipanema Entities’ customers are concentrated.
We intend to increase our recovery indicators with regards to non-performing loans by using the know-how of the Ipanema Entities. We also intend for the Ipanema Entities to continue to provide non-performing loan recovery and credit management services to third parties.
Accession to Certain Tax Payment Plans
In August 2017 we joined the Special Tax Regularization Program (Programa Especial de Regularização Tributária), or PERT. The program allows for certain tax debts to be repaid in installments. In connection with our participation in this program, we are repaying in installments certain amounts due as a result of lawsuits and administrative proceedings relating to corporate income tax and social security contributions for the periods from 1999 to 2005 in a total amount of R$492 million in January 2018 (taking into account the reduction arising from our participation in the program). A payment of R$191.9 million was due in August 2017 and a further payment of R$299.7 million was due by January 2018, both of which we have made within the prescribed time limits. As a result of our participation, we recorded expenses in an amount of R$364 million (after tax) in the third quarter of 2017.
In October 2017 we joined the Incentive Payment Programs and Installments (Programa de Parcelamento Incentivado) created by the cities Rio de Janeiro and São Paulo. The program allows for certain tax debts to be repaid in installments. In connection with our participation in this program, we are repaying in installments certain amounts due as a result of lawsuits and administrative proceedings relating to ISS for the periods from 2005 to 2016 in a total amount of R$293 million as of December 31, 2017. As we had made provisions for these losses, we registered income of R$435 million as a result of the reversal of certain provisions, net of tax effects, in an amount of R$96 million.
Establishment of Credit Intelligence Bureau
On January 20, 2016, we entered into a non-binding memorandum of understanding with Banco Bradesco S.A., Banco do Brasil S.A., Caixa Econômica Federal and Itaú Unibanco S.A., for the creation of a credit intelligence bureau, the CIB. The CIB will be structured as a corporation and each of Santander Brasil, Banco Bradesco S.A., Banco do Brasil S.A., Caixa Econômica Federal and Itaú Unibanco S.A. will have a 20% ownership stake in the corporation.
The purpose of the CIB will be to develop a database that, in conformity with applicable laws, will collect, reconcile and handle the credit information of individuals and legal entities that register with the CIB and expressly authorize the inclusion of their credit information on the CIB’s database. We believe this initiative will lead to an increased degree of efficiency and improvement of our credit management activities, and will also facilitate the disbursement of long and medium-term lines of credit to participants in the Brazilian Financial System and to other corporate entities.
On April 14, 2017, the final documents were signed by the shareholders. The necessary regulatory authorizations, including by the Brazilian Central Bank and the CADE have already been granted. We estimate that the CIB will become fully operational in 2019.
Sale of SSS DTVM
On June 19, 2014, we executed preliminary documents containing the main terms and conditions of the sale of our qualified custody business and the sale of our subsidiary SSS DTVM, which renders third party fund administration services, to a holding company owned by Santander Spain and a group of private equity funds managed by Warburg Pincus. Following the sale, we will continue to act as the administrator of the funds, as per CVM Instruction No. 306, dated as of May 5, 1999, as amended.
The closing of the transaction occurred on August 31, 2015, when all of our shares in SSS DTVM were formally transferred to Santander Securities Brasil and SSS DTVM acquired our qualified custody business. We received R$859 million at the closing of the transaction which generated gains of R$751 million before taxes recorded in the “Other non-financial gains/losses” line.
Equity Distribution
On November 1, 2013, the proposal for equity distribution to shareholders was approved at a shareholders’ meeting. In January 2014, the conditions for us to be able to effect the equity distribution (i.e., end of the period of opposition from unsecured creditors, approval by the Brazilian Central Bank and filing of the minutes of the meeting at the JUCESP) were satisfied. The equity distribution to shareholders occurred on January 29, 2014, and our shares and Units have been traded ex-rights to the equity distribution since January 15, 2014.
Plans to Optimize our Capital Structure
On September 26, 2013, we announced that, in order to optimize our capital structure, our board of directors submitted a proposal to optimize the composition of our regulatory capital to our shareholders for their approval (“PR Optimization Plan”). The aim was to establish a more efficient capital structure, consistent with recent capital rules and aligned with our business strategy and asset growth plan. The PR Optimization Plan was composed of the following items: (i) an equity distribution to the shareholders of Santander Brasil in the total amount of R$6 billion, with no reduction in the number of shares; (ii) the issuance abroad of capital instruments to compose Tier I and Tier II of our regulatory capital; and (iii) a bonus share program and an adjustment in the composition of the Units, followed by a reverse share split (inplit), with the purpose of eliminating trading in cents ofreais.
Critical Accounting Policies
Our consolidated financial statements have been prepared in accordance with IFRS as issued by the IASB.
General
Our principal accounting policies are described in note 2 to our audited consolidated financial statements. The following discussion describes those areas that require the most judgment or involve a higher degree of complexity in the application of the accounting policies, and estimates that currently affect our financial condition and operational results. The accounting estimates made in these contexts require management to make assumptions about matters that are highly uncertain. In this regard, if management decides to change these estimates, or even if changes in these estimates occur from period to period, these accounting estimates could have a material impact on our financial condition and operational results.
Management bases its estimates and judgments on historical experience and on various other factors and circumstances, which are believed to be reasonable. Actual results may differ from these estimates if assumptions and conditions change. Judgments or changes in assumptions are submitted to the audit committee and to our regulatory authorities and are disclosed in the notes to our consolidated financial statements.
Fair Value of Financial Instruments
We record financial assets and liabilities as financial instruments that are classified at fair value through profit or loss, available-for-sale securities, and all derivatives at fair value on the balance sheet. The fair value of a financial instrument is the price that would be received to sell an asset or paid to transfer a liability in an orderly transaction between market participants at the measurement date, regardless of whether that price is directly observable or estimated using another valuation technique.
In estimating the fair value of an asset or a liability, we take into account the characteristics of the asset or liability if market participants would take those characteristics into account when pricing the asset and liability at the measurement date. That assumed transaction establishes the price to sell the asset or to transfer the liability. In the absence thereof, the price is established on the basis of valuation techniques commonly used by the financial markets.
We use derivative financial instruments for both trading and non-trading activities. The principal types of derivatives used are interest rate swaps, future rate agreements, interest rate options and futures, foreign exchange forwards, foreign exchange futures, foreign exchange options, foreign exchange swaps, cross-currency swaps, equity index futures, equity options and equity swaps. The fair value of exchange traded derivatives is calculated based on published price quotations. The fair value of over-the-counter derivatives is calculated as the sum of the expected future cash flows arising from the instrument, discounted to present value at the date of measurement (“present value” or “theoretical close”) using valuation techniques commonly used by the financial markets as follows:
| · | The present value method for valuing financial instruments permitting static hedging (principally, forwards and swaps) and loans and advances. Expected future cash flows are discounted using the interest rate curves of the applicable currencies. The interest rate curves are generally observable market data. |
| · | The Black-Scholes model for valuing financial instruments requiring dynamic hedging (principally structured options and other structured instruments). Certain observable market inputs are used in the Black-Scholes model to generate variables such as the bid-offer spread, exchange rates, volatility, correlation between indexes and market liquidity, as appropriate. |
| · | Each of the present value methods and the Black-Scholes models are used for valuing financial instruments exposed to interest rate risk, such as interest rate futures, caps and floors. The main inputs used in these models are principally observable market data, including appropriate interest rate curves, volatilities, correlations and exchange rates. |
| · | We use dynamic models similar to those used in the measurement of interest rate risk for measuring credit risk of linear instruments (such as bonds and fixed-income derivatives). In the case of non-linear instruments, if the portfolio is exposed to credit risk (such as credit derivatives), the joint probability of default is determined using the Standard Gaussian Copula model. The main inputs used to determine the underlying cost of credit for credit derivatives are quoted credit risk spreads, and the correlation between quoted credit derivatives of various issuers. |
| · | The determination of fair value requires us to make certain estimates and assumptions. If quoted market prices are not available, fair value is calculated using widely accepted pricing models that consider contractual prices of the underlying financial instruments, yield curves, contract terms, observable market data and other relevant factors. The use of different estimates or assumptions in these pricing models could lead to a different valuation being recorded in our consolidated financial statements. |
See note 2d (iii) to our consolidated financial statements for additional information on valuation techniques used by us and details of the principal assumptions and estimates used in these models and the sensitivity of the valuation of financial instruments to changes in the principal assumptions used.
Impairment Losses on Financial Assets
Definition
A financial asset is considered impaired when there is objective evidence of any of the following:
| · | significant financial difficulties affecting the issuer, borrower or other similar obligor; |
| · | it becoming probable that the issuer, borrower or other similar obligor will enter bankruptcy or other financial reorganization; |
| · | a breach of contract, such as a default or delinquency in interest or principal payments; |
| · | a breach of certain other clauses or terms of the documentation underlying the transaction; |
| · | the disappearance of an active market for that financial asset because of financial difficulties; or |
| · | observable data indicating that there is a measurable decrease in the estimated future cash flows from financial assets since the initial recognition of those assets (even though such decrease is yet to materialize), including: (i) adverse changes in the payment status of issuers, borrowers or other similar obligors in the group; or (ii) national or local economic conditions that correlate with defaults on the assets. |
As a general rule, when any of the events listed above occurs, the carrying amount of impaired financial assets is adjusted by recording a provision for losses on debts expense as “Losses on financial assets (net)” in the consolidated income statement. The reversal of previously recorded losses is recognized in the consolidated income statement in the period in which the impairment and decrease can be related objectively to an event of recovery.
Financial assets are deemed to be impaired, and the interest accrual suspended, when there are reasonable doubts as to their full recovery and/or the collection of the related interest for the amounts and on the dates indicated in the loan agreement after taking into account the collateral guarantees received to secure (fully or partially) collection of the related balances.
For all non-performing past due assets, any collections relating to impaired loans and advances are used to recognize the accrued interest and the remainder, if any, is applied to reduce the principal amount outstanding.
Debt Instruments Carried at Amortized Cost
The amount of an impairment loss incurred for determination of the recoverable amount on a debt instrument measured at amortized cost is equal to the difference between its carrying amount and the present value of its estimated future cash flows (excluding future credit losses that have not been incurred), discounted to the original effective interest rate of the financial asset (or the effective interest rate computed at initial recognition), and is presented as a reduction of the asset balance and recorded on income statements.
In estimating the future cash flows of debt instruments, the following factors are taken into account:
| · | All the amounts that are expected to be obtained over the remaining life of the instrument, in this case, the provided guarantees. |
| · | The impairment loss takes into account the likelihood of collecting accrued interest receivable. |
| · | The various types of risk to which each instrument is subject; and |
| · | The circumstances in which collections will foreseeably be made. |
These cash flows are subsequently discounted using the instrument’s effective interest rate.
With regard to recoverable amount losses resulting from a materialization of the insolvency risk of the obligors (credit risk), a debt instrument is impaired due to insolvency when there is evidence of a deterioration in the obligor’s ability to pay, either because such obligor is in arrears or for other reasons.
We have certain policies, methods and procedures for minimizing our exposure to counterparty insolvency. These policies, methods and procedures are applied in the granting, examination and documentation of debt instruments, and contingent liabilities and commitments, the identification of their recoverable amount and the calculation of the amounts necessary to cover the related credit risk.
The procedures employed in the identification, measurement, control and reduction of exposure to credit risk, are applied on an individual basis or by grouping similar credit risk characteristics.
| · | Customers with individual management: Wholesale segment customers, financial institutions and certain companies. Risk management is performed through an analysis complemented by tools to support decision-making model-based risk assessment internal procedure. |
| · | Customers with standardized management: individuals and companies not classified as individual clients. Risk management models based on automated decision-making and risk assessment procedure, complemented, by teams of analysts specializing in this type of risk. The credits related to standardized customers are usually considered not recoverable when they have historical loss experience and delay greater than 90 days. |
Methodology for Impairment Losses
We evaluate all loans in respect of the provision for impairment losses from credit risk. Loans are either individually evaluated for impairment, or, for loans accounted as amortized cost, collectively evaluated by grouping similar risk characteristics. Loans that are individually evaluated for impairment losses are not evaluated collectively.
To measure the impairment loss on loans individually evaluated for impairment, we consider the conditions of the borrowers, such as their economic and financial situation, level of indebtedness, ability to generate income, cash flow, management, corporate governance and quality of internal controls, payment history, industry expertise, contingencies and credit limits, as well as the characteristics of assets, such as their nature and purpose, type, sufficiency and liquidity level guarantees and total amount of credit, as well as based on historical experience of impairment and other circumstances known at the time of evaluation.
To measure the impairment loss on loans collectively evaluated for impairment, we segregate financial assets into groups considering the characteristics and similarity of credit risk, or in other words, according to segment, the type of assets, guarantees and other factors associated such as the historical experience of impairment and other circumstances known at the time of assessment.
The impairment loss is calculated using statistical models that consider the following factors:
| · | Exposure at default or “EAD” is the amount of risk exposure at the date of default by the borrower. In accordance with IFRS as issued by the IASB, the exposure at default used for this calculation is the current exposure, as reported in the balance sheet. |
| · | Probability of default or “PD” is the probability of the borrower failing to meet its principal and/or interest payment obligations. PD is measured using a time horizon of one year; that is, it quantifies the probability of the borrower defaulting in the coming year. A loan is in default if either the principal or interest is past due by ninety days or more or the loan is current but there are doubts as to the solvency of the counterparty (subjective doubtful assets). |
| · | Loss given default, or “LGD,” is the loss arising in the event of default. In addition to examining the PD, we manage our portfolio looking for loans in which the borrowers will provide higher volumes of guarantees relating to operations and who will also act to constantly strengthen the area of loan recovery. These and other actions combined are responsible for ensuring the adequacy of the LGD parameters (loss resulting from the event of default by the borrower to honor the principal and/or interest payments). The LGD calculation is based on the net charge-offs on defaulted loans, taking into account the guarantees/collateral associated with the loans, the income and expenses associated with the recovery process and the timing of delinquency. |
| · | Loss identification period, or “LIP,” is the time period between the occurrence of a loss event and the identification of an objective evidence of this loss by Santander Brasil. In other words, it represents the time horizon from the credit loss occurrence until the effective confirmation of such loss. |
Moreover, prior to charging off past due loans (which is only done after we have completed all recovery efforts), we record provisions to the remaining balance of the loan so our allowance for impairment losses fully covers our losses. Thus, we understand that our allowance for impairment losses methodology has been developed to fit its risk metrics and capture loans that could potentially become impaired.
Impairment
Certain assets, such as intangible assets, including goodwill, equity method investments, financial assets not carried at fair value through profit or loss and other assets are subject to impairment review. We record impairment charges when we believe there is objective evidence of impairment, or that the cost of the assets may not be recoverable.
The assessment of what constitutes an impairment is based on the following models:
We test goodwill for impairment on an annual basis, or more frequently if events or changes in economic circumstances, such as an adverse change in Santander Brasil’s business condition or observable market data, indicate that these assets may be impaired. The recoverable amount determination used in the impairment assessment requires prices of comparable businesses, present value or other valuation techniques, or a combination thereof, requiring management to make subjective judgments and assumptions. Events and factors that may significantly affect the estimates include, among other things, competitive forces, customer behaviors and attrition, changes in revenue growth trends, cost structures and technology, and changes in discount rates and specific industry or market sector conditions. If an impairment loss is recognized for goodwill, it may not be reversed in a subsequent period. The recognition of impairment is applicable when significant changes occur in the main estimates used to evaluate the recoverable amounts of the cash-generating unit recoverable amount below the carrying amount. Based on the assumptions described above, no impairment of goodwill in 2017, 2016 and 2015 was identified.
Given the level of uncertainty related to these assumptions, our officers carry out sensitivity analysis using reasonably possible changes in the key assumptions on which the recoverable amount of the cash-generating units are based in order to confirm that the recoverable amounts still exceed the carrying amounts.
All debt and equity securities (other than those carried at fair value through profit or loss) are subject to impairment testing every reporting period. The carrying value is reviewed in order to determine whether an impairment loss has been incurred.
Evaluation for impairment includes both quantitative and qualitative information. For debt securities, such information includes actual and estimated incurred credit losses indicated by payment default, market data on (estimated) incurred losses and other current evidence that the issuer may not pay amounts when due. Equity securities are impaired when management believes that, based on a significant or prolonged decline of fair value below the acquisition price, there is sufficient reason to believe that the acquisition cost may not be recovered. “Significant” and “prolonged” are interpreted on a case-by-case basis for specific equity securities.
Upon impairment of either debt or equity instruments, the amount considered as effective loss is recognized in profit or loss. In addition, we did not identify any impairment of tangible assets in 2017, 2016 and 2015 (see notes 14, 13 and 12, respectively, to our audited consolidated financial statements).
Post-employment Benefit Plan
The Post-employment benefits plans include the following obligations undertaken by us: (i) to supplement the public social security system benefits, and (ii) medical assistance in the event of retirement, permanent disability or death for eligible employees and their direct beneficiaries.
Defined Contribution Plan
A defined contribution plan is the post-employment benefits plan for which we and our controlled entities as employer entities pay pre-determined contributions to a separate entity and will have no legal or constructive obligation to pay further contributions if the separate entity does not hold sufficient assets to honor all benefits relating to the service rendered in the current and prior periods.
These contributions are recognized as personnel expenses in the consolidated income statement.
Defined Benefit Plans
A defined benefit plan is the post-employment benefit plan which is not a defined contribution plan and is shown in note 21 to our audited consolidated financial statements. For this type of plan, the sponsoring entity’s obligation is to provide the agreed benefits to employees, assuming the potential actuarial risk that benefits will cost more than expected.
The amendment of IAS 19 established fundamental changes in the accounting for and disclosure of employee post-employment benefits such as removing the mechanism of the corridor approach for recording of the obligation of the plans, as well as changes in the criteria for recognition of conventional interest of plan assets (valuation based on the discount rate actuarial liability).
The adoption of this accounting policy involved, fundamentally, full recognition of liabilities on account of actuarial losses (actuarial deficit) not recognized previously, against the stockholders’ equity (Statements of Comprehensive Income).
Main Definitions:
| · | The present value of the defined benefit obligation is the present value of expected future payments required to settle the obligation resulting from employee service in the current and past periods, without deducting any plan assets. |
| · | Deficit or surplus is: (a) the present value of the defined benefit obligation, less (b) the fair value of plan assets. |
| · | The sponsoring entity may recognize the plan’s assets in the balance sheet when they meet the following characteristics: (i) the assets of the fund are sufficient to meet all employee benefit plan or sponsor obligations; or (ii) the assets are returned to the sponsoring entity in order to reimburse it for employee benefits already paid. |
| · | Actuarial gains and losses are changes in present value of defined benefit obligation resulting from: (a) adjustments due to experience (the effects of differences between the actuarial assumptions adopted and what has actually occurred); and (b) effects of changes in actuarial assumptions. |
| · | Current service cost is the increase in the present value of the defined benefit obligation resulting from employee service in the current period. |
| · | The past service cost is the change in present value of defined benefit obligation for employee service in prior periods resulting from a change in the plan or reductions in the number of employees covered. |
Post-employment benefits are recognized in the income statement in the lines of “Interest expense and similar charges” and “Provisions (net).”
The defined benefit plans are recorded based on an actuarial study, conducted annually by an external consultant, at the end of each year to be effective for the subsequent period.
New Accounting Pronouncements
The new accounting standards which will come into force after December 31, 2017 are mentioned in our audited consolidated financial statements included in this annual report. For further information, see note 1.c.1 to our audited consolidated financial statements.
All accounting policies and measurement bases on the consolidated financial statements for 2017were applied in the preparation of such financial statements.
Results of Operations for the Years Ended December 31, 2017, 2016 and 2015
The following table presents an overview of the certain key aspects of our results of operations for the years ended December 31 2017, 2016 and 2015:
Executive Summary |
Results |
Total Income Our total income amounted to R$48,725 million for the year ended December 31, 2017, a decrease of 0.2% as compared to R$48,837 million for the year ended December 31, 2016. This decrease was primarily due to lower gains/losses on financial assets and liabilities (net) and exchange differences (net) of R$1,576 million in the year ended December 31, 2017 as compared to R$7,591 million in the year ended December 31, 2016, mainly as a consequence of our results of hedging on investments abroad in 2017. This decrease was offset by an increase in our net interest income of R$4,360 million, or 14.3% mainly due to an increase in our credit portfolio and margins charged on the loans we extend, and an increase in net fees and commissions of R$1,744 million, or 15.9% due to increase in the number loyal customers and an increase in the volume of transactions processed. Excluding the effects of the hedge for investment held abroad, our total income would have amounted to R$49,535 million in the year ended December 31, 2017, an increase of 17.6% compared to the year ended December 31, 2016. Total income excluding the effects of the hedge investment abroad is a non-GAAP measure. For further information, see “Item 3. Key Information—A. Selected Financial Data—Reconciliation of Non-GAAP Measures and Ratios to Their Most Directly Comparable IFRS Financial Measures.” Our total income for the year ended December 31, 2015 amounted to R$30,814 million, a decrease of 58.5% compared to the year ended December 31, 2016, mainly due to the impact of the non-recurring result regarding reversal of tax provisions and tax reimbursement in relation to COFINS. | Impairment losses on Financial Assets (Net) Our impairment losses on financial assets (net) reached R$12,338 million for the year ended December 31, 2017, a decrease of R$963 million, or 7.2% compared to our impairment losses on financial assets (net) in the year ended December 31, 2016. This decrease was primarily due to certain risk management measures which we have undertaken in recent years. In the year ended December 31, 2016, our impairment losses on financial assets (net) decreased by R$333 million, or 2.4%, as compared to our impairment losses on financial assets (net) of R$13,634 million in the year ended December 31, 2015, primarily as a result of (1) an increase of 2.1%, or R$280 million, in impairment losses for loans and receivables from R$13,110 million as of December 31, 2015 to R$13,390 million on December 31, 2016, and (2) a decrease of R$612 million to revenues of R$88 million for the year ended December 31, 2016 in other financial instruments not measured at fair value compared to a loss of R$524 million for the year ended December 31, 2015 |
Consolidated Profit for the Year Our consolidated profit for the year ended December 31, 2017 was R$9,138 million, an increase of R$1,673 million, or 22.4%, as a result of an increase in the volume of transactions primarily due to our expanded digital offering and an increase in the number of loyal customers. For the year ended December 31, 2016, we reported a consolidated profit of R$7,465 million, a decrease of R$2,369 million as compared to the year ended December 31, 2015. This decrease was mainly due to nonrecurring results before taxes of R$7.9 billion related to a reversal of tax provision regarding COFINS and R$765 million of tax reimbursements related to COFINS that did not occur in 2016. | Efficiency Our efficiency ratio was 33.1% in December 2017, a 2.5 p.p. increase from 30.6% in December 2016. Our efficiency ratio was 30.6% in December 2016, a 16.6 p.p. decrease from 47.1% in December 2015. Disregarding the effect of the hedge for investment abroad on our revenues, our adjusted efficiency ratio reached 32.5%, 34.9% and 34.8% in December 2017, 2016 and 2015, respectively. The efficiency ratio excluding the effects of the hedge investment abroad is a non-GAAP measure. For further information, see “Item 3. Key Information—A. Selected Financial Data—Reconciliation of Non-GAAP Measures and Ratios to Their Most Directly Comparable IFRS Financial Measures.” |
Loan Portfolio Our total loan portfolio reached R$287.8 billion as of December 31, 2017, an increase of 7.2% compared to December 31, 2016, mainly due to an increase in loans to individuals and consumer finance portfolio. Loans to individuals totaled R$107.6 billion, an increase of 18.0%, driven by credit cards, payroll loans and agricultural loans. Our consumer finance loan portfolio grew 24.7% in 2017, mainly due to an increase in vehicle financing greater than the market growth rate. In 2016, our total loan portfolio totaled R$268.4 billion, an increase of 0.4% as compared to the year ended December 31, 2015, driven by loans to individuals (specifically payroll loans and mortgages). | Credit Quality Our impaired assets to credit risk ratio was 6.7% for the year ended December 31, 2017, a 0.3 p.p. decrease as compared to 7.0% in the years ended December 31, 2016. In 2015 impaired assets to credit risk ratio was 7.0%. Our coverage ratio (provisions for impairment losses as a percentage of impaired assets) was 95.4% in the year ended December 31, 2017, a 0.9 p.p. decrease as compared to 96.3% December 31, 2016. This decrease was principally caused by a specific borrower in the final quarter of 2017. In 2015, this ratio was 82.9%, a 13.5p.p. increase as compared to 2016. Our Basel Capital adequacy ratio, calculated in accordance with the regulations and guidance of the Brazilian Central Bank, was 15.8% for the year ended December 31, 2017, a decrease from 16.3%, as of December 31, 2016. For the year ended December 31, 2015 this ratio was 15.7%. |
Deposits Deposits from Brazilian Central Bank and deposits from credit institutions plus customer deposits increased by 9.0% to R$355.4 billion on December 31, 2017. For the year ended December 31, 2016, deposits from Brazilian Central Bank and deposits from credit institutions plus customer deposits amounted to R$326.1 billion, a 4.3% increase compared to R$312.5 billion in the year ended December 31, 2015. |
Results of Operations
The following table presents our consolidated results of operations for the years ended December 31 2017, 2016 and 2015:
| | | For the year ended December 31, |
| | | 2017 | | 2016 | | 2015 | | % Change
2017/2016 | | %Change
2016/2015 |
| | | (in millions of R$, except percentages) |
| Net interest income | | | 34,946 | | | | 30,586 | | | | 31,337 | | | | 14.3 | | | | (2.4 | ) |
| Income from equity instruments | | | 83 | | | | 259 | | | | 143 | | | | (67.9 | ) | | | 81.0 | |
| Income from companies accounted for by the equity method | | | 72 | | | | 48 | | | | 116 | | | | 50.0 | | | | (58.6 | ) |
| Net fee and commission income | | | 12,722 | | | | 10,978 | | | | 9,484 | | | | 15.9 | | | | 15.8 | |
| Gains/losses on financial assets and liabilities (net) and exchange differences (net) | | | 1,574 | | | | 7,591 | | | | (9,918 | ) | | | (79.3 | ) | | | (176.5 | ) |
| Other operating income (expenses) | | | (672 | ) | | | (625 | ) | | | (347 | ) | | | 7.6 | | | | 79.9 | |
| Total income | | | 48,725 | | | | 48,837 | | | | 30,814 | | | | (0.2 | ) | | | 58.5 | |
| Administrative expenses | | | (16,121 | ) | | | (14,920 | ) | | | (14,515 | ) | | | 8.0 | | | | 2.8 | |
| Depreciation and amortization | | | (1,662 | ) | | | (1,483 | ) | | | (1,490 | ) | | | 12.1 | | | | (0.5 | ) |
| Provisions (net) | | | (3,309 | ) | | | (2,725 | ) | | | (4,001 | ) | | | 21.4 | | | | (31.9 | ) |
| Impairment losses on financial assets (net) | | | (12,338 | ) | | | (13,301 | ) | | | (13,364 | ) | | | (7.2 | ) | | | (2.4 | ) |
| Impairment losses on other assets (net) | | | (457 | ) | | | (114 | ) | | | (1,221 | ) | | | 300,9 | | | | (90.6 | ) |
| Other nonfinancial gain (losses) | | | (324 | ) | | | 91 | | | | 831 | | | | n.d. | | | | (89.1 | ) |
| Operating profit before tax | | | 14,514 | | | | 16,384 | | | | (3,216 | ) | | | (11.4 | ) | | | (609.5 | ) |
| Income tax | | | (5,376 | ) | | | (8,919 | ) | | | 13,050 | | | | (39.7 | ) | | | (168.3 | ) |
| Consolidated profit for the year | | | 9,138 | | | | 7,465 | | | | 9,834 | | | | 22.4 | | | | (24.1 | ) |
Consolidated Profit for the Year
Our consolidated profit for the year ended December 31, 2017 was R$9,138 million, an increase of R$1,673 million, or 22.4%, as compared to our consolidated profit of R$7,465 million for the year ended December 31, 2016 as a result of (i) an increase of R$4,360 million in net interest income as a result of an increase in the volume of transactions primarily due to our expanded digital offering and an increase in the number of loyal customers (ii) lower expenses of R$3,543 million tax expenses and (iii) a decrease of R$6,017 million in gains/losses on financial assets and liabilities (net) and exchange differences (net), both of which include the effects of the hedge for investment held abroad (i.e., R$6,950 million of gains in tax expenses line and losses in gains/losses on financial assets and liabilities (net) and exchange differences (net)).
| · | Our consolidated profit for the year ended December 31, 2016 was R$7,465 million, a 24.1% decrease as compared to the year ended December 31, 2015 for which our consolidated profit was R$9,834 million. This decrease in our consolidated profit was mainly due to an increase of R$21,969 million in the “Income taxes” line item for the year ended December 31, 2016 as compared to the year ended December 31, 2015. This increase can be principally attributed to gains of R$2.7 billion related to the reversal of tax provisions made to cover the legal and a tax reimbursement related to COFINS in 2015 which did not occur in 2016; |
| · | an increase from 15% to 20% in the CSLL tax rate in the fourth quarter of 2015; and |
| · | tax expenses of R$17,059 million in the year ended December 31, 2016 arising out of the effects of foreign exchange rate variations affecting certain of our foreign branches and the associated hedging instruments, which was offset by gains in the same amount on financial assets and liabilities (net) and exchange differences (net). For further information, see “—Other Factors Affecting Our Financial Condition and Results of Operations—Hedging in Foreign Investments.” |
Net Interest Income
Net interest income for the year ended December 31, 2017 was R$34,946 million, a 14.3% or R$4,360 million increase from R$30,586 million for the year ended December 31, 2016. This increase was mainly due to a 7.2% increase in the volume of loans extended to customers and an increase in the margin we charge on these loans, both of which were primarily concentrated in our commercial banking segment. In addition, our revenues from deposits increased as a result of our liability management plan, which included: (i) an increase in the average margins charged on deposit products which we offer, and (ii) an increase in the proportion of products which we offer on which we charge relatively higher margins.
Net interest income for the year ended December 31, 2016 was R$30,586 million, a 2.4%, or R$751 million, decrease from R$31,337 million for the year ended December 31, 2015. This decrease was principally due to a nonrecurring reversal of tax provision and a tax reimbursement in relation to COFINS in an amount of R$2.4 billion in 2015 that did not occur in 2016. For further information, please see note 24.c.1 and note 25 to our audited consolidated financial statements included in this annual report. Despite such decrease, revenues from deposits and others products related to our funding operations increased 31.1% or R$723 million, as compared to the year ended December 31, 2015, as a result of our focus on customer loyalty and active liability management.
Average total earning assets in 2017 were R$556.2 billion, a 10.3% or R$51.9 billion increase from R$504.3 billion in 2016. The principal drivers were an increase of R$38.0 billion, or 15.9%, in the average of loans and advances to customers and a R$18.7 billion increase in average of debt instruments. Net yield (the net interest income divided by average earning assets) was 6.4% in 2017 compared to 6.2% in 2016, an increase of 0.2 p.p. Our average total earning assets in 2016 were R$504.3 billion, a 5.0% or R$23.9 billion increase from R$480.4 billion in 2015. The principal drivers of this increase were an increase of R$32.1 billion, or 47.7%, in the average of cash and balances with the Brazilian Central Bank partially offset by a decrease of R$7.6 billion, or 18.4%, in the average of loans and amounts due from credit institutions. Net yield was 6.2% in 2016, compared to 6.6% in 2015, a decrease of 0.4 p.p.
Average total interest liabilities in 2017 were R$416.8 billion, a 2.1% or R$8.7 billion increase from R$408.1 billion in 2016. The main drivers of this growth were an increase of R$14.7 billion in customer deposits and an increase of R$13.0 billion in deposits from the Brazilian Central Bank and deposits from credit institutions, which were partially offset by a decrease of R$13.7 billion in marketable debt securities and a decrease of R$5.3 billion in subordinated debts. Average total interest bearing liabilities in 2016 were R$408.1 billion, a 5.9% or R$22.9 billion increase from R$385.2 billion in 2015. The main drivers of this growth were an increase of R$12.0 billion in customer deposits, an increase of R$11.6 billion in marketable debt securities and an increase of R$1.4 billion in deposits from the Brazilian Central Bank and deposits from credit institutions offset by R$2.2 billion in other interest bearing liabilities.
Finally, the yield spread (the difference between gross yield on earning assets and the average cost of interest-bearing liabilities) was 4.0% in 2017 and 2016 and 4.7% in 2015.
Income from Equity Instruments
Income from equity instruments for the year ended December 31, 2017 totaled R$83 million, a R$175 million decrease from R$259 million for the year ended December 31, 2016. This decrease was mainly due to a decrease in dividends from investments registered in available for sale financial assets. In 2016, totaled R$259 million, a R$116 million increase from R$143 million for the year ended December 31, 2015. This increase was mainly due to an increase in dividends from investments registered in available for sale financial assets.
Income from Companies Accounted for by the Equity Method
Income from companies accounted for by the equity method for the year ended December 31, 2017 was R$72 million, a R$24 million increase from R$48 million for the year ended 2016. This increase was mainly due to the positive results of operations of Banco RCI Brasil S.A., a jointly-controlled company, which were partially offset by negative results of operations of Webmotors S.A., a jointly-controlled company. Income from companies accounted for by the equity method for the year ended December 31, 2016 was R$48 million, a R$69 million decrease from R$116 million for the year ended December 31, 2015. This decrease was mainly due to losses with results of operations at Banco RCI Brasil S.A., a jointly-controlled company.
Net Fee and Commission Income
Net fee and commission income for the year ended December 31, 2017 reached R$12,722 million, a 15.9% or R$1,744 million, increase from R$10,978 million for the year ended December 31, 2016. This increase was mainly due to an increase of R$670 million in revenues from credit and debit cards, R$543 million in revenues from current account services, R$337 million in revenues from insurance and capitalization products and an increase of R$283 million in revenues from capital markets services. Net fees and commissions for the year ended December 31, 2016 reached R$10,978 million, a 15.8%, or R$1,494 million, increase from R$9,484 million for the year ended December 31, 2015. This increase was mainly due to an increase of R$512 million in revenues from credit and debit cards, R$430 million in revenues from banking fees and R$285 million in revenues from insurance and capitalization products.
Net fees and commissions from credit and debit cards totaled R$3,692 million for the year ended December 31, 2017, an increase of 22.2% compared to the year ended December 31, 2016. This increase was primarily due to higher transaction volume (1,969.0 million in the year ended December 31, 2017 as compared to 1,651.5 million the year ended December 31, 2016). Net fees and commissions from credit and debit cards totaled R$3,022 million for the year ended December 31, 2016, an increase of 20.4% compared to the year ended December 31, 2015, mainly owing to higher interchange fees due to an increase in transaction volumes.
Net fees and commissions from current account services totaled R$3,544 million for the year ended December 31, 2017, an increase of 18.1% compared to the year ended 2016 primarily due to an increase in the volume of transactions of 20.2%. Net fees and commissions from current account totaled R$3,001 million for the year ended December 31, 2016, an increase of 16.7% compared to the year ended December 31, 2015 primarily due to an increase in the volume of transactions and a change in our product mix.
Net fees and commissions from insurance and capitalization products totaled R$2,815 million for the year ended December 31, 2017, a 13.6% increase compared to the year ended December 31, 2016, mainly due to the expansion of our product portfolio and the growth in credit related insurance products. Net fees and commissions from insurance and capitalization products totaled R$2,478 million for the year ended December 31, 2016, a 13.0% increase compared to the year ended December 31, 2015. This increase was mainly due to the marketing campaigns conducted in the branch network during the first half of 2016.
Revenues from fees and commissions charged in connection with capital markets totaled R$873 million for the year ended December 31, 2017, an increase of 47.9% compared to the year ended 2016, mainly due to an increase in revenues from securities placements. For the year ended December 31, 2016, Revenues from fees and commissions charged in connection with capital markets totaled R$590 million, a R$89 million increase compared to the year ended December 31, 2015.
The following table reflects the breakdown of net fee and commission income for the year ended December 31, 2017, 2016 and 2015:
| | | For the year ended December 31 |
| | | 2017 | | 2016 | | 2015 | | % Change 2017/2016 | | Change% 2016/2015 |
| | | | | (in millions of R$, except percentages) |
| Current account services | | | 3,544 | | | | 3,001 | | | | 2,570 | | | | 18.1 | | | | 16.7 | |
| Collection and payment services | | | 1,152 | | | | 957 | | | | 816 | | | | 20.4 | | | | 17.3 | |
| Insurance and capitalization | | | 2,815 | | | | 2,478 | | | | 2,192 | | | | 13.9 | | | | 13.0 | |
| Asset Management and pension funds | | | 824 | | | | 1,174 | | | | 1,028 | | | | (29.8 | ) | | | 14.2 | |
| Credit and debit cards | | | 3,692 | | | | 3,022 | | | | 2,509 | | | | 22.2 | | | | 20.4 | |
| Capital markets | | | 873 | | | | 590 | | | | 501 | | | | 47.9 | | | | 17.8 | |
| Trade finance | | | 956 | | | | 855 | | | | 701 | | | | 11.8 | | | | 22.0 | |
| Tax on services | | | (526 | ) | | | (515 | ) | | | (401 | ) | | | 2.2 | | | | 28.3 | |
| Others | | | (608 | ) | | | (584 | ) | | | (433 | ) | | | 4.1 | | | | 35.0 | |
| Total | | | 12,722 | | | | 10,978 | | | | 9,484 | | | | 15.9 | | | | 15.8 | |
Gains/losses on Financial Assets and Liabilities (net) and Exchange Differences (net)
Gains/losses on financial assets and liabilities (net) and exchange differences (net) for the year ended December 31, 2017 were gains of R$1,574 million, a R$6,017 million decrease from gains of R$7,591 million for the year ended December 31, 2016. This variation is mainly due to a decrease of R$6,950 million in derivatives transactions, as a consequence of our results of hedging on investments abroad, which was offset by the same amount in income taxes. Excluding the results of hedging on investments abroad effect, gains/losses on financial assets and liabilities (net) and exchange differences (net) were R$2,384 million for the year ended December 31, 2017, a 64.3% increase from R$1,451 million compared to the year ended December 31, 2016, primarily due to positive results in our derivative positions as a result of market volatility. Gains/losses on financial assets and liabilities (net) and exchange differences (net) excluding the effects of the hedge investment abroad is a non-GAAP measure. For further information, see “Item 3. Key Information—A. Selected Financial Data—Reconciliation of Non-GAAP Measures and Ratios to Their Most Directly Comparable IFRS Financial Measures.”
Gains/losses on financial assets and liabilities (net) and exchange differences (net) for the year ended December 31, 2016 were gains of R$7,591 million, a R$17,509 million increase from losses of R$9,918 million for the year ended December 31, 2015. This variation is mainly explained by an increase of R$17,059 million from derivatives transactions, as a consequence of our results of hedging on investments abroad, which was offset by losses in the same amount in income taxes. For further information, see “—Other Factors Affecting Our Financial Condition and Results of Operations—Hedging in Foreign Investments.”
The following table presents our gains/losses on Financial Assets and Liabilities (net) and Exchange Differences (net) for the periods indicated.
| | | For the year ended December 31 |
| | | 2017 | | 2016 | | 2015 | | % Change 2017/2016 | | %Change 2016/2015 |
| | | (in millions of R$, except percentages) |
| Gains/losses on financial assets and liabilities (net) and exchange differences (net) | | | 1,574 | | | | 7,591 | | | | (9,918 | ) | | | (79.3 | ) | | | (176.5 | ) |
| Effects of the hedge for investment held abroad | | | (810 | ) | | | 6,140 | | | | (10,919 | ) | | | (113.2 | ) | | | (156.2 | ) |
| Gains/losses on financial assets and liabilities (net) and exchange differences (net) excluding Hedge Impact(1) | | | 2,384 | | | | 1,451 | | | | 1,001 | | | | 64.3 | | | | 45.0 | |
| (1) | Gains/losses on financial assets and liabilities (net) and exchange differences (net) excluding the effects of the hedge investment abroad is a non-GAAP measure. For further information, see “Item 3. Key Information—A. Selected Financial Data—Reconciliation of Non-GAAP Measures and Ratios to Their Most Directly Comparable IFRS Financial Measures.” |
Other Operating Income/Expenses
Other operating income/expenses for the year ended December 31, 2017 were expenses of R$672 million, an increase of R$47 million compared to expenses of R$625 million for the year ended December 31, 2016 primarily due to an increase in contributions to a deposit protection scheme known as the Credit Guarantee Fund (Fundo Garantidor de Crédito). Other operating income/expenses for the year ended December 31, were expenses of R$625 million, an increase of R$277 million compared to expenses of R$347 million for the year ended December 31, 2015, primarily due to the reversal of losses related to the private pension plan which occurred during the year ended December 31, 2015 that did not occur in the year ended December 31, 2016, and an increase in operational losses relating to fraud.
Administrative Expenses
Administrative expenses for the year ended December 31, 2017 were R$16,121 million, a R$1,200 million increase compared to expenses of R$14,920 million for the year ended December 31, 2016. For the year ended December 31, 2016, our administrative expenses of R$14,920 million reflected a R$405 million increase compared to administrative expenses of R$14,515 million for the year ended December 31, 2015.
Personnel expenses increased R$560 million for the year ended December 31, 2017, as a consequence of the increase in wages and salaries and social security costs, mainly due to higher profit sharing expenses related to the incentive plan expenses aligned with the business performance. In the year ended December 31, 2016, our personnel expenses increased R$578 million compared to the same period in 2015, due principally to higher wage and salaries and the R$155 million lump-sum bonus in connection with the renegotiation of our collective bargaining agreement in October 2016.
The following table sets forth our personnel expenses for each of the periods indicated:
| | | For the year ended December 31, |
| | | 2017 | | 2016 | | 2015 | | % Change 2017/2016 | | %Change 2016/2015 |
| | | (in millions of R$, except percentages) |
| Wages and salaries | | | 5,714 | | | | 5,377 | | | | 4,655 | | | | 6.3 | | | | 15.5 | |
| Social security costs | | | 1,381 | | | | 1,273 | | | | 1,316 | | | | 8.5 | | | | (3.3 | ) |
| Benefits | | | 1,309 | | | | 1,278 | | | | 1,184 | | | | 2.4 | | | | 7.9 | |
| Training | | | 58 | | | | 63 | | | | 93 | | | | (7.9 | ) | | | (32.7 | ) |
| Other personnel expenses | | | 475 | | | | 386 | | | | 550 | | | | 23.1 | | | | (29.8 | ) |
| Total | | | 8,937 | | | | 8,377 | | | | 7,799 | | | | 6.7 | | | | 7.4 | |
Other administrative expenses increased R$640 million from R$6,543 million for the year ended December 31, 2016 to R$7,183 million for the year ended December 31, 2017. This increase mostly reflects higher expenses with specialized and technical services, technology and systems, and advertising and communications as a consequence of our commercial actions in line with business transformations. Other administrative expenses decreased R$173 million from R$6,716 million for the year ended December 31, 2015 to R$6,543 million for the year ended December 31, 2016. This decrease was primarily due to lower expenses from specialized and technical services, advertising and per diems and travel expenses.
The following table sets forth our administrative expenses for each of the periods indicated:
| | | For the year ended December 31, |
| | | 2017 | | 2016 | | 2015 | | % Change 2017/2016 | | %Change 2016/2015 |
| | | (in millions of R$, except percentages) |
| Specialized and technical services | | | 1,901 | | | | 1,745 | | | | 1,821 | | | | 9.0 | | | | (4.2 | ) |
| Property, fixtures and supplies | | | 1,284 | | | | 1,279 | | | | 1,268 | | | | 0.5 | | | | 0.8 | |
| Technology and systems | | | 1,365 | | | | 1,247 | | | | 1,193 | | | | 9.5 | | | | 4.6 | |
| Advertising | | | 618 | | | | 487 | | | | 523 | | | | 26.9 | | | | (7.0 | ) |
| Communications | | | 593 | | | | 489 | | | | 481 | | | | 21.4 | | | | 1.6 | |
| Per diems and travel expenses | | | 107 | | | | 133 | | | | 160 | | | | (19.6 | ) | | | (16.9 | ) |
| Surveillance and cash courier services | | | 630 | | | | 622 | | | | 615 | | | | 1.3 | | | | 1.3 | |
| Other administrative expenses | | | 685 | | | | 542 | | | | 655 | | | | 26.3 | | | | (17.3 | ) |
| Total | | | 7,183 | | | | 6,543 | | | | 6,716 | | | | 9.8 | | | | (2.6 | ) |
The efficiency ratio, which we calculate as total administrative expenses divided by total income, increased to 33.1% in the year ended December 31, 2017, as compared to 30.6% for the year ended December 31, 2016. For the year ended December 31, 2015 it was 47.1%. Our adjusted efficiency ratio, which excludes the effect of the hedge for investment held abroad (see “—Hedging in Foreign Investments” and “Selected Financial Data—Selected Consolidated Ratios, Including Non-GAAP Ratios”), was 32.5%, 34.9% and 34.8% in 2017, 2016 and 2015, respectively.
Depreciation and Amortization
Depreciation and amortization for the year ended December 31, 2017 was R$1,662 million, a R$180 million increase from R$1,483 million for the year ended December 31, 2016. This was principally due to impairment of intangible assets related to software of R$155 million and an increase of R$29 million incurred in connection with lease renewals. For the year ended December 31, 2016, depreciation and amortization amounted to R$1,483 million, a R$7 million decrease from R$1,490 million for the year ended December 31, 2015.
Provisions (Net)
Provisions principally include provisions for tax, civil, and especially labor claims. Provisions (net) totaled R$3,309 million for the year ended December 31, 2017, an increase of R$584 million compared to R$2,725 million for the year ended December 31, 2016. This increase was mainly due to an increase in provisions related to civil and labor contingences and by our participation in the incentive installment payment program related to ISS taxes and the participation in the amnesty program for outstanding taxes and social security debts (in accordance with Provisional Measure No.783/2017). For further information, see note 24.c1 from our audited consolidated financial statements included in this annual report. In the year ended December 31, 2016, provisions (net) totaled R$2,725 million, a decrease of R$1,277 million compared to R$4,001 million for the year ended December 31, 2015. This decrease was mainly due to a decrease in provisions related to tax and civil contingencies.
Impairment Losses on Financial Assets (Net)
Impairment losses on financial assets (net) for the year ended December 31, 2017 were R$12,338 million, a R$963 million decrease compared to R$13,301 million for the year ended December 31, 2016. This decrease was principally due to:
| · | A decrease of 7.9%, or R$1,052 million, in impairment loss for loans and receivables to R$12,338 million as of December 31, 2017, from R$13,390 million on December 31, 2016. We believe this decrease is primarily a result of our risk management strategy and which included the adaptation of credit limits for new customers, the development of new loan models with “predictive scoring” enhancements and recovery campaigns to offer to delinquent customers loan terms adjustments to help them meet their payment obligations. |
| · | A decrease of R$89 million in other financial instruments not measured at fair value from a revenue of R$88 million in the year ended December 31, 2016 to a loss of R$1 million in the year ended December 31, 2017. |
For the year ended December 31, 2016, impairment losses on financial assets (net) were R$13,301 million, a R$333 million decrease compared to R$13,634 million for the year ended December 31, 2015 principally due to:
| · | An increase of 2.1%, or R$280 million, in impairment losses for loans and receivables from R$13,110 million as of December 31, 2015 to R$13,390 million on December 31, 2016. The increase in impairment losses for loans and receivables was mainly caused by the slowdown in the Brazilian economy observed in the last two years, which affected our portfolio generally and, in particular, our commercial and industrial portfolio. As a result of the increase in impaired assets, we kept in place our measures to manage impaired assets and provisions for impairment losses, especially collection practices with respect to our borrowers whereby we offered certain customers the chance to negotiate a restructuring of their debts. |
| · | A decrease of R$612 million to revenues of R$88 million for the year ended December 31, 2016 in other financial instruments not measured at fair value compared to a loss of R$524 million for the year ended December 31, 2015. This change was mainly due to provisions made in 2015 that did not occur in 2016. |
Our credit risk exposure portfolio decreased by approximately R$9,174 billion from R$310.9 billion as of December 31, 2015 to R$301.7 billion as of December 31, 2016. Our impaired assets increased by approximately R$289 million in the same period from R$18.6 billion to R$18.9 billion (see “—Impaired Assets by Type of Loan”). The default rate on all loans and other financial assets increased by 30 basis points in 2016 in comparison to 2015.
Our credit risk exposure portfolio increased by R$28.8 billion to R$330.5 billion as of December 31, 2017 compared to R$301.7 billion as of December 31, 2016. Our credit risk exposure portfolio of R$310.7 billion as of December 31, 2016 was approximately R$9.174 billion lower than our credit risk exposure portfolio of R$310.9 billion as of December 31, 2015. Furthermore, our impaired assets increased R$257 million from R$18.9 billion as of December 31, 2016 to R$19.1 billion for the year ended December 31, 2017. Our impaired assets increased by approximately R$289 million from R$18.6 billion as of December 31, 2015 to R$18.9 billion as of December 31, 2016 (see “—Impaired Assets by Type of Loan”). The default rate decreased by 47 base points in 2017 in comparison with 2016, and increased by 30 basis points in 2016 in comparison with 2015.
The following table shows the ratio of our impaired assets to total credit risk exposure and our coverage ratio as of December 31, 2017 and December 31, 2016 and 2015.
| | | For the year ended December 31, |
| | | 2017 | | 2016 | | 2015 | | % Change 2017/2016 | | %Change 2016/2015 |
| | | (in millions of R$, except percentages) |
| Loans and advances to customers, gross | | | 287,829 | | | | 268,438 | | | | 267,266 | | | | 7.2 | | | | 0.4 | |
| Impaired assets | | | 19,145 | | | | 18,887 | | | | 18,599 | | | | 1.4 | | | | 1.6 | |
| Provisions for impairment losses | | | 18,262 | | | | 18,191 | | | | 15,412 | | | | 0.4 | | | | 18.0 | |
| Credit risk exposure – customers(1) | | | 330,474 | | | | 301,703 | | | | 310,877 | | | | 9.5 | | | | (3.0 | ) |
| Ratios | | | | | | | | | | | | | | | | | | | | |
| Impaired assets to credit risk exposure | | | 5.8 | % | | | 6.3 | % | | | 6.0 | % | | | (0.5) p.p. | | | | 0.3 p.p. | |
| Coverage ratio(2) | | | 95.4 | % | | | 96.3 | % | | | 82.9 | % | | | (0.9) p.p. | | | | 13.4 p.p. | |
| Impairment losses on loans and receivables | | | (12,338 | ) | | | (13,390 | ) | | | (13,110 | ) | | | (7.9 | ) | | | 2.1 | |
| Impairment losses on other financial instruments not measured at fair value through profit for loss(3) | | | (0 | ) | | | 88 | | | | (524 | ) | | | (100.2 | ) | | | (116.9 | ) |
| Total of Impairment losses on financial assets (net)(4) | | | (12,338 | ) | | | (13,301 | ) | | | (13,364 | ) | | | (7.2 | ) | | | (2.4 | ) |
| (1) | Credit risk exposure is a non-GAAP financial measure. Credit risk exposure is the sum of the amortized cost amounts of loans and advances to customers (including impaired assets) amounting to R$287,829 million and guarantees and documentary credits amounting to R$42,645 million. We present the off-balance information to better demonstrate our total managed credit risk. |
| (2) | Provisions for impairment losses as a percentage of impaired assets. |
| (3) | Corresponds to registration of losses of a permanent character in the realization value of bonds and securities classified as “Securities available for sale” currently accounted for “Earnings on financials assets (net).” |
| (4) | As of December 31, 2017, 2016 and December 31, 2015, our total of impairment losses on financial instruments included R$2,784 million, R$144 million and R$1,555 million, respectively, relating to debt instruments. |
The following chart shows our impaired assets to credit risk ratio (impairment losses divided by loans and advances to customers, gross) from 2013 through 2017:

Impaired Assets by Type of Loan
The following table shows our impaired assets by type of loan as of December 31, 2017, 2016 and 2015.
| | | For the year ended December 31, |
| | | 2017 | | 2016 | | 2015 | | % Change 2017/2016 | | %Change 2016/2015 |
| | | (in millions of R$, except percentages) |
| Commercial and industrial | | | 11,994 | | | | 11,629 | | | | 10,749 | | | | 3.1 | | | | 8.2 | |
| Real estate | | | 782 | | | | 719 | | | | 829 | | | | 8.8 | | | | (13.3 | ) |
| Installment loans to individuals | | | 6,304 | | | | 6,488 | | | | 6,970 | | | | (2.8 | ) | | | (6.9 | ) |
| Lease financing | | | 65 | | | | 52 | | | | 52 | | | | 25.0 | | | | n.d. | |
| Total | | | 19,145 | | | | 18,888 | | | | 18,599 | | | | 1.4 | | | | 1.5 | |
For a discussion of the evolution in impairment in our lending portfolios and our methodology for loan loss allowances with respect to the following lending portfolios, see “Item 4. Information on the Company—B. Business Overview—Selected Statistical Information—Assets—Impaired Assets—Methodology for Impairment Losses.” See also “Item 3. Key Information—D. Risk Factors—Risks Relating to Brazil and Macroeconomic and Political Conditions in Brazil and Globally—Ongoing investigations relating to corruption and diversion of public funds that are being conducted by the Brazilian federal police as well as other Brazilian and non-Brazilian regulators and law enforcement officials may adversely affect the growth of the Brazilian economy and could have a material adverse effect on us” and “Item 3. Key Information—D. Risk Factors—Risks Relating to Brazil and Macroeconomic and Political Conditions in Brazil and Globally—The financial problems faced by our customers could adversely affect us.”
Commercial and Industrial
Impaired assets in the portfolio of commercial and industrial loans amounted to R$11,994 million as of December 31, 2017, an increase of R$365 million, or 3.1%, compared to R$11,629 million as of December 31, 2016. The increase in impaired assets in this portfolio was mainly primarily due to defaults by certain borrowers as a result of the weak macroeconomic conditions in Brazil. We have put in place various measures to manage impaired assets, including collection practices with respect to our borrowers whereby we offered certain customers the chance to negotiate a restructuring of their debts.
Impaired assets in the portfolio of commercial and industrial loans amounted to R$11,629 million as of December 31, 2016, an increase of R$880 million, or 8.2%, compared to R$10,749 million as of December 31, 2015. The increase in impaired assets in this portfolio was mainly caused by the slowdown in the Brazilian economy in the last three years, affecting our commercial and industrial portfolio. For further information, please see “Item 4. Information on the Company—B. Business Overview—Selected Statistical Information—Assets—Impaired Assets—Methodology for Impairment Losses.”
Real Estate
Impaired assets in the real estate lending portfolio totaled R$782 million on December 31, 2017, an increase of R$63 million, or 8.8%, compared to R$719 million as of December 31, 2016. The increase was primarily due to defaults by certain specific large borrowers as a result of the weak macroeconomic conditions in Brazil.
Impaired assets in the real estate lending portfolio totaled R$719 million on December 31, 2016, a decrease of R$111 million compared to R$829 million as of December 31, 2015. The decrease in impaired assets between December 31, 2016 and 2015 was primarily due to better management of this portfolio, with improved options for customers to restructure their debt. For further information, please see “Item 4. Information on the Company—B. Business Overview—Selected Statistical Information—Assets—Impaired Assets—Methodology for Impairment Losses.”
Installment Loans to Individuals
Impaired assets in the installment loans to individuals lending portfolio totaled R$6,304 million as of December 31, 2017, with a decrease of R$184 million, or 2.8%, compared to 2016. This decrease was a result of renegotiation practices for customers during restructuring programs along the year which reflects the measures adopted by Santander Brasil since late 2012 to manage default rates in this portfolio, which included the adaptation of credit limits for new customers, the development of new loan models with “predictive scoring” enhancements and recovery campaigns to offer to delinquent customers loan terms adjustments to help them meet their payment obligations.
On December 31, 2016, our impaired assets in the installment loans to individuals lending portfolio totaled R$6,488 million, with a decrease of R$482 million, or 6.9%, compared to 2015. The decrease in impaired assets reflects the measures adopted by us since late 2012 to manage default rates in this portfolio. For further information, please see “Item 4. Information on the Company—B. Business Overview—Selected Statistical Information—Assets—Impaired Assets—Methodology for Impairment Losses.”
Financial Leasing
Impaired assets in the lease financing lending portfolio totaled R$65 million on December 31, 2017, an increase of R$13 million compared to December 31, 2016. The increase in impaired assets was mainly due to defaults by certain borrowers as a result of weak macroeconomic conditions in Brazil.
Impaired assets in the financial leasing lending portfolio amounted to R$52 million as of December 31, 2016 and 2015. For further information, please see “Item 4. Information on the Company—B. Business Overview—Selected Statistical Information—Assets—Impaired Assets—Methodology for Impairment Losses”
Impairment Losses on Other Assets (Net)
Impairment losses on other assets (net) for the year ended December 31, 2017 amounted to losses of R$457 million, an increase of R$342 million as compared to the year ended December 31, 2016. This increase was primarily due to impairment losses of R$306 million related to system acquisition and development that did not occur in 2016. For the year ended December 31, 2016, impairment losses on other assets (net) amounted to losses of R$114 million, a decrease of R$1,106 million as compared to 2015, mainly due to expenses of R$675 million related to the impairment of software and expenses of R$534 million related to the impairment of payroll services related assets in 2015 that did not recur in 2016.
Other Nonfinancial Gains/Losses
Other nonfinancial gains/losses were losses of R$324 million during the year ended December 31, 2017, a negative variation of R$415 million from gains of R$91 million during the year ended December 31, 2016, mainly due to the disposal of property received in the collection process and the provision of the recoverable value of these assets. During the year ended December 31, 2016, other nonfinancial gains/losses were gains of R$91 million, a R$740 million decrease from gains of R$831 million during the year ended December 31, 2015, mainly due to a nonrecurring gain of R$751 million from the sale of SSS DTVM in 2015. For further information, see “Item 4. Information on the Company—A. History and Development of the Company—Important Events—Sale of Santander Securities Services Brasil DTVM S.A.”
Operating Profit Before Tax
Operating profit before tax for the year ended December 31, 2017 was R$14,514 million, a decrease of R$1,870 million, or 11.4%, as compared to R$16,384 million for the year ended December 31, 2016. In the year ended December 31, 2015, our operating profit before tax for the year end was negative R$3,216 million.
Excluding the effects of the hedge for investment held abroad operating profit before tax amounted to R$15,324 million for the year ended December 31, 2017, a 49.6% increase from R$10,244 million compared to the year ended December 31, 2016. In the year ended December 31, 2015 operating profit before tax was R$7,703 million. Operating profit before tax excluding the effects of the hedge for investment held abroad is a non-GAAP measure. For further information, see “Item 3. Key Information—A. Selected Financial Data—Reconciliation of Non-GAAP Measures and Ratios to Their Most Directly Comparable IFRS Financial Measures.”
The table below presents our operating profit before tax and our operating profit before tax excluding the effects of the hedge for investment held abroad for the periods presented.
| | | For the year ended December 31, |
| | | 2017 | | 2016 | | 2015 | | % Change 2017/2016 | | %Change 2016/2015 |
| | | (in millions of R$, except percentages) |
| Operating Profit Before Tax | | | 14,514 | | | | 16,384 | | | | (3,216 | ) | | | (11.4 | ) | | | (609.5 | ) |
| Effects of the hedge for investment held abroad | | | (810 | ) | | | 6,140 | | | | (10,919 | ) | | | (113.2 | ) | | | (156.2 | ) |
| Adjusted operating profit before tax | | | 15,324 | | | | 10,244 | | | | 7,703 | | | | 49.6 | | | | 33.0 | |
| (1) | Adjusted operating profit is a non-GAAP measure. For further information, see “Item 3. Key Information—A. Selected Financial Data—Reconciliation of Non-GAAP Measures and Ratios to Their Most Directly Comparable IFRS Financial Measures.” |
Income Taxes
Income taxes expense includes income tax, social contribution, PIS and COFINS (which are social contributions due on certain revenues net of some expenses). Income taxes amounted to expenses of R$5,376 million for the year of 2017, a R$3,543 million decrease from losses of R$8,919 million for the year 2016. This decrease is mainly attributable to the following events: (i) foreign exchange gains of R$6,950 million as a consequence of the effects of foreign exchange rate variations on the investment abroad on our foreign branch and subsidiary, and the associated hedging instruments, affecting the “Gains (losses) on financial assets and liabilities (net)” line and (ii) the recognition of certain deferred tax credits during 2017 as a result of the decrease of CSLL rate from 20% to 15% applicable from 2019 onwards.
For the year ended December 31, 2016, income taxes amounted to expenses of R$8,919 million, a R$21,969 million change from a R$13,050 million of tax benefit for the year 2015. This change is mainly attributable to the following events: (i) negative variation of R$17,059 million as a consequence of the effects of foreign exchange rate variations on investments held abroad, and the associated hedging instruments, affecting the “Gains (losses) on financial assets and liabilities (net)” line, (ii) gains of R$2.7 billion related to the reversal of a tax provision and a tax reimbursement related to the COFINS in 2015 that did not occur in 2016, and (iii) the recognition of deferred tax credits derived from the increase of the CSLL tax rate from 15% to 20% in August 2015.
The following table shows our income taxes and income taxes excluding the effects of the hedge for investment held abroad for the periods indicated.
| | | For the year ended December 31, |
| | | 2017 | | 2016 | | 2015 | | % Change 2017/2016 | | %Change 2016/2015 |
| | | (in millions of R$, except percentages) |
| Income taxes | | | (5,376 | ) | | | (8,919 | ) | | | 13,050 | | | | (39.7 | ) | | | (168.3 | ) |
| Effects of the hedge for investment held abroad | | | 810 | | | | (6,140 | ) | | | 10,919 | | | | (113.2 | ) | | | (156.2 | ) |
| Income taxes excluding effects of the hedge for investment held abroad | | | (6,186 | ) | | | (2,779 | ) | | | 2,130 | | | | 122.6 | | | | (230.5 | ) |
| (1) | Income taxes excluding effects of the hedge for investment held abroad is a non-GAAP measure. For further information, see “Item 3. Key Information—A. Selected Financial Data—Reconciliation of Non-GAAP Measures and Ratios to Their Most Directly Comparable IFRS Financial Measures.” |
Results of Operations by Segment for the Years Ended December 31, 2017, 2016 and 2015
The following tables show our results of operations for the years ended December 31, 2017, 2016 and 2015, for each of our operating segments.
Commercial Banking
| | | For the year ended December 31, |
| | | 2017 | | 2016 | | 2015 | | % Change 2017/2016 | | %Change 2016/2015 |
| | | (in millions of R$, except percentages) |
| Net interest income | | | 32,392 | | | | 27,366 | | | | 27,041 | | | | 18.4 | | | | 1.2 | |
| Income from equity instruments | | | 83 | | | | 259 | | | | 143 | | | | (67.9 | ) | | | 81.0 | |
| Income from companies accounted for by the equity method | | | 72 | | | | 48 | | | | 116 | | | | 50.0 | | | | (58.6 | ) |
| Net fee and commission income | | | 11,262 | | | | 9,580 | | | | 8,241 | | | | 17.6 | | | | 16.3 | |
| Gains/losses on financial assets and liabilities (net) and exchange differences (net) | | | (26 | ) | | | 5,619 | | | | (9,069 | ) | | | (100.5 | ) | | | (162.0 | ) |
| Other operating income (expenses) | | | (641 | ) | | | (611 | ) | | | (335 | ) | | | 4.8 | | | | 82.4 | |
| Total income | | | 43,143 | | | | 42,261 | | | | 26,136 | | | | 2.1 | | | | 61.7 | |
| Personnel expenses | | | (8,167 | ) | | | (7,638 | ) | | | (7,123 | ) | | | 6.9 | | | | 7.2 | |
| Other administrative expenses | | | (7,012 | ) | | | (6,273 | ) | | | (6,450 | ) | | | 11.8 | | | | (2.7 | ) |
| Administrative expenses | | | (15,179 | ) | | | (13,911 | ) | | | (13,573 | ) | | | 9.1 | | | | 2.5 | |
| Depreciation and amortization | | | (1,560 | ) | | | (1,382 | ) | | | (1,361 | ) | | | 12.9 | | | | 1.5 | |
| Provisions (net) | | | (3,190 | ) | | | (2,685 | ) | | | (4,013 | ) | | | 18.8 | | | | (33.1 | ) |
| Impairment losses on financial assets (net) | | | (11,233 | ) | | | (11,607 | ) | | | (12,365 | ) | | | (3.2 | ) | | | (6.1 | ) |
| Impairment losses on other assets (net) | | | (436 | ) | | | (114 | ) | | | (1,220 | ) | | | 281.9 | | | | (90.7 | ) |
| Other nonfinancial gain (losses) | | | (324 | ) | | | 91 | | | | 831 | | | | (456.9 | ) | | | (89.1 | ) |
| Operating profit before tax | | | 11,220 | | | | 12,652 | | | | (5,565 | ) | | | (11.3 | ) | | | (327.3 | ) |
| | | For the year ended December 31, |
| | | 2017 | | 2016 | | 2015 | | % Change 2017/2016 | | %Change 2016/2015 |
| | | (in millions of R$, except percentages) |
| Operating Profit Before Tax | | | 11,220 | | | | 12,652 | | | | (5,565 | ) | | | (11.3 | ) | | | (327.3 | ) |
| Effects of the hedge for investment held abroad | | | (810 | ) | | | 6,140 | | | | (10,919 | ) | | | (113.2 | ) | | | (156.2 | ) |
| Adjusted Operating Profit Before tax | | | 12,030 | | | | 6,512 | | | | 5,354 | | | | 84.7 | | | | 21.6 | |
2017 and 2016
Operating profit before tax attributed to the Commercial Banking segment for the year ended December 31, 2017 was R$11.2 billion, a R$1.4 billion decrease from R$12.6 billion for the year ended December 31, 2016. This variation was mainly due to:
| · | An increase of R$5,026 million in net interest income for the year ended December 31, 2017, compared to the year ended December 31, 2016, as a result of an increase in volume of loans extended to customers, an increase in the margin we charge on these loans and an increase in revenues from deposits as a result of our liability management plan. |
| · | An increase of R$1,682 million in net fee and commission income for the year ended December 31, 2017, compared to the year ended December 31, 2016, mainly due to (i) an increase in revenues from current accounts, (ii) an increase in revenues from credit and debit cards, and (iii) an increase in revenues from insurance and capitalization products. |
| · | A decrease of R$375 million in impairment losses on financial assets (net) for the year ended December 31, 2017, compared to the year ended December 31, 2016. This decrease reflects the adaptation of credit limits for new customers, the development of new loan models with “predictive scoring” enhancements and recovery campaigns to offer to delinquent customers loan terms adjustments to help them meet their payment obligation. |
This variation was partially offset by:
| · | A decrease of R$5,645 million in gains/losses on financial assets and liabilities (net) and exchange differences (net) for the year ended December 31, 2017, compared to the year ended December 31, 2016. This variation is mainly explained by a decrease of R$6,590 million from derivatives transactions, as a consequence of our results of hedging on investments abroad. For further information, see “— Other Factors Affecting Our Financial Condition and Results of Operations—Hedging in Foreign Investments.” |
Excluding the hedge of investments abroad effect on our revenues, our operating profit before taxes would have been R$12.0 billion, 84.7% higher than in the fiscal year ended December 31, 2016. Operating profit before taxes excluding the hedge of investments held abroad is a non-GAAP measure. For further information, see “Item 3. Key Information—A. Selected Financial Data—Reconciliation of Non-GAAP Measures and Ratios to Their Most Directly Comparable IFRS Financial Measures.”
2016 and 2015
Operating profit before tax attributed to the Commercial Banking segment for the year ended December 31, 2016 was R$12.6 billion, a R$18.2 billion increase from losses of R$5.6 billion for the year ended December 31, 2015. This variation was mainly due to:
| · | An increase of R$14,688 million in gains/losses on financial assets and liabilities (net) and exchange differences (net) for the year ended December 31, 2016, compared to the year ended December 31, 2015, mainly due an increase of R$17,059 million from derivatives transactions, as a consequence of our results of hedging on investments abroad. For further information, see “—Other Factors Affecting Our Financial Condition and Results of Operations—Hedging in Foreign Investments.” |
| · | A decrease of R$1,328 million in provisions (net) for the year ended December 31, 2016, compared to the year ended December 31, 2015, mainly due to a decrease in provisions expenses principally related to tax and civil contingencies. |
| · | An increase of R$1,339 million in net fee and commission income for the year ended December 31, 2016, compared to the year ended December 31, 2015, mainly due to an increase in revenues from banking fees, revenues from credit and debit cards and an increase in revenues from insurance and capitalization products. |
Global Wholesale Banking
| | | For the year ended December 31, |
| | | 2017 | | 2016 | | 2015 | | % Change 2017/2016 | | %Change2016/2015 |
| | | (in millions of R$, except percentages) |
| Net interest income | | | 2,554 | | | | 3,221 | | | | 4,297 | | | | (20.7 | ) | | | (25.0 | ) |
| Net fee and commission income | | | 1,460 | | | | 1,397 | | | | 1,243 | | | | 4.5 | | | | 12.4 | |
| Gains/losses on financial assets and liabilities (net) and exchange differences (net) | | | 1,600 | | | | 1,972 | | | | (849 | ) | | | (18.9 | ) | | | (332.1 | ) |
| Other operating income (expenses) | | | (31 | ) | | | (14 | ) | | | (12 | ) | | | 132.9 | | | | 14.5 | |
| Total income | | | 5,582 | | | | 6,576 | | | | 4,678 | | | | (15.1 | ) | | | 40.6 | |
| Administrative expenses | | | (943 | ) | | | (1,009 | ) | | | (942 | ) | | | (6.5 | ) | | | 7.1 | |
| Personnel expenses | | | (771 | ) | | | (739 | ) | | | (675 | ) | | | 4.3 | | | | 9.4 | |
| Other administrative expenses | | | (172 | ) | | | (270 | ) | | | (267 | ) | | | (36.5 | ) | | | 1.3 | |
| Depreciation and amortization | | | (102 | ) | | | (101 | ) | | | (129 | ) | | | 0.9 | | | | (21.6 | ) |
| Provisions (net) | | | (119 | ) | | | (39 | ) | | | 12 | | | | n.d. | | | | (439.4 | ) |
| Impairment losses on financial assets (net) | | | (1,105 | ) | | | (1,694 | ) | | | (1,269 | ) | | | (34.7 | ) | | | 33.5 | |
| Impairment losses on other assets (net) | | | (21 | ) | | | (0 | ) | | | (0 | ) | | | n.d. | | | | n.d. | |
| Operating profit before tax | | | 3,293 | | | | 3,732 | | | | 2,349 | | | | (11.8 | ) | | | 58.9 | |
| | | | | | | | | | | | | | | | | | | | | |
2017 and 2016
Profit before tax attributed to the Global Wholesale Banking segment for the year ended December 31, 2017 was R$3.3 billion, a 11.8%, or R$439 million, decrease from R$3.7 billion for the year ended December 31, 2016.
This variation was mainly due to:
| · | a decrease of R$666 million in net interest income, principally due to lower income from market activities with customers and our proprietary trading; and |
| · | a decrease of R$372 million in gains/losses on financial assets and liabilities (net) and exchange differences (net), mainly explained by a decrease in gains from derivatives and market positions. This variation was partially offset by a decrease of R$589 million in impairment losses on financial assets (net), primarily due to our risk management. |
2016 and 2015
Profit before tax attributed to the Global Wholesale Banking segment for the year ended December 31, 2016 was R$3.7 billion, a 58.9%, or R$1,383 million, increase from R$2.3 billion for the year ended December 31, 2015.
This variation was mainly due to:
| · | an increase of R$2,821 million in gains on financial assets and liabilities (net) and exchange differences (net), mainly explained by an increase in gains from derivatives and market positions. |
This variation was partially offset by:
| · | a decrease of R$1,076 million in net interest income, mainly related to losses on market positions offset in part by gains on financial assets and liabilities (net) and exchange differences (net); and |
| · | an increase of R$425 million in impairment losses on financial assets (net), as a result of additional allowances for certain corporations that were adversely affected by the weak macroeconomic environment. |
5B. Liquidity and Capital Resources
Our asset and liability management strategy is set by the asset and liability committee, which operates under strict guidelines and procedures established by the Santander Group. The asset and liability committee establishes, among other policies, our funding strategy, and the target positioning with respect to structural balance sheet risk.
Pursuant to the Santander Group’s model, all subsidiaries have to be self-funded in terms of liquidity and capital. In addition, our general asset and liability management policy is to maintain a close match of maturity, interest rate and currency exposures. Subject to our internal risk management policies we aim to maintain adequate liquidity to meet our present and future financial obligations and to capitalize on business and market opportunities as they arise.
Most of our liquidity is raised in the local market and we maintain a portfolio of high quality public bonds for liquidity management. Legal reserve requirements consume a significant amount of funding in Brazil, see “Item 4. Information on the Company—B. Business Overview—Regulation and Supervision—Other Applicable Laws and Regulations—Compulsory Reserve Requirements.”
Due to our stable and diversified sources of funding, which include a large client deposit base in the local market and a large number of correspondent banks with long-standing relationships, historically we have not experienced liquidity problems. In our opinion, our current levels of liquidity and working capital are sufficient for our present requirements.
See also “Item 4. Information on the Company—B. Business Overview—Selected Statistical Information.”
Liquidity and Funding
Market conditions and prospects, as well as the Brazilian Central Bank requirements for compulsory deposits and stress tests determine our minimum liquidity levels. We control, manage and review our liquidity analyzing current and expected levels of liquidity, structuring the sources of financing to achieve an optimal diversification in terms of maturities, instruments, currencies, markets, as well as setting forth contingency plans. The objective is to ensure that we have sufficient liquidity to honor our commitments in light of market conditions, our institutional needs and market opportunities.
Due to our stable and diversified funding sources, which include a large base of customer deposits as detailed in below, we have historically had no liquidity deficiencies.
As part of our liquidity risk management, we have a formal plan with measures to be taken in the event of a systemic liquidity crisis and/or for liquidity concerns arising from possible reputational risk. Our liquidity contingency plan contains defined thresholds, preventive measures and actions to be taken when a liquidity deficiency occurs and our reserves fall below certain levels.
The following resources and strategies may be used as sources of financing for working capital and for investments in non-current assets and to cover liquidity deficiencies: (i) increase of customer deposits; (ii) securities issuances; (iii) repurchase agreements; (iv) a review of transfer pricing practices; and (v) establishment of more restrictive credit policies.
The following tables present the composition of our consolidated funding at the dates indicated.
| | | As of December 31, |
| | | 2017 | | 2016 | | 2015 |
| | | (in millions of R$) |
| Customer deposits | | | 276,042 | | | | 247,445 | | | | 243,043 | |
| Current accounts | | | 17,560 | | | | 15,868 | | | | 15,580 | |
| Savings accounts | | | 40,572 | | | | 36,051 | | | | 35,985 | |
| Time deposits | | | 146,818 | | | | 94,479 | | | | 89,986 | |
| Repurchase agreements | | | 71,092 | | | | 101,047 | | | | 101,492 | |
| Backed operations with Private Securities(1) | | | 33,903 | | | | 59,460 | | | | 61,174 | |
| Backed operations with Public Securities(1) | | | 37,189 | | | | 41,586 | | | | 40,318 | |
| Deposits from the Brazilian Central Bank and credit institutions | | | 79,375 | | | | 78,634 | | | | 69,451 | |
| Demand deposits | | | 306 | | | | 314 | | | | 145 | |
| Time deposits(2) | | | 52,739 | | | | 49,549 | | | | 55,795 | |
| Repurchase agreements | | | 26,329 | | | | 28,771 | | | | 13,512 | |
| Backed operations with Private Securities(1) | | | — | | | | 446 | | | | 85 | |
| Backed operations with Public Securities(1) | | | 26,329 | | | | 28,324 | | | | 13,427 | |
| Total deposits | | | 355,417 | | | | 326,079 | | | | 312,494 | |
| Marketable debt securities | | | 70,247 | | | | 99,843 | | | | 94,658 | |
| Agribusiness Credit Notes | | | 8,854 | | | | 6,981 | | | | 2,097 | |
| Treasury Bills | | | 31,686 | | | | 61,157 | | | | 55,301 | |
| Real Estate Credit Notes | | | 27,714 | | | | 23,983 | | | | 23,795 | |
| Bonds and other securities | | | 1,993 | | | | 7,722 | | | | 13,465 | |
| Debt Instruments Eligible to Compose Tier 1 and Tier 2 Capital | | | 8,437 | | | | 8,312 | | | | 9,959 | |
| Subordinated liabilities | | | 519 | | | | 466 | | | | 8,097 | |
| Total Funding | | | 434,620 | | | | 434,700 | | | | 425,209 | |
| (1) | Refers primarily to repurchase agreements backed by debentures of own issue. |
| (2) | This includes transactions with credit institutions in connection with export and import financing lines, BNDES and FINAME on-lending and abroad on other credit lines abroad. |
Deposits
Customer Deposits
Our balance of customer deposits was R$276.0 billion on December 31, 2017, R$247.4 billion on December 31, 2016, and R$243.0 billion on December 31, 2015, representing 63.5%, 56.9% and 57.2% of our total funding, respectively.
Current Accounts
Our balance of current accounts was R$17.6 billion on December 31, 2017, R$15.9 billion on December 31, 2016 and R$15.6 billion on December 31, 2015, representing 4.9%, 4.9%, and 5.0% of total deposits, respectively.
Customer Savings Deposits
Our balance of customer savings deposits was R$40.6 billion on December 31, 2017, R$36.0 billion on December 31, 2016 and R$36.0 billion on December 31, 2015, representing 11.4%, 11.1% and 11.5% of total deposits, respectively.
Customer Time Deposits
Our balance of customer time deposits was R$146.8 billion on December 31, 2017, R$94.5 billion on December 31, 2016 and R$90.0 billion on December 31, 2015, representing 41.3%, 29.0% and 28.8% of total deposits, respectively.
Customer Deposits – Repurchase Agreements
We maintain a portfolio of Brazilian public and private sector debt instruments used to obtain overnight funds from other financial institutions or investment funds by selling such securities and simultaneously agreeing to repurchase them. Due to the short-term (overnight) nature of this funding source, such transactions are volatile and composed, generally, of Brazilian public securities and of repurchase agreements linked to debentures. Securities sold under repurchase agreements decreased to R$71.1 billion on December 31, 2017 from R$101.0 billion on December 31, 2016 and R$101.5 billion on December 31, 2015, representing 20.0%, 31.0% and 32.5% of total deposits, respectively.
Deposits from the Brazilian Central Bank and Credit Institutions
Our balance of deposits from the Brazilian Central Bank and credit institutions was R$79.4 billion on December 31, 2017, R$78.6 billion on December 31, 2016 and R$69.4 billion on December 31, 2015, representing 22.3%, 24.1% and 22.2% of total deposits, respectively.
Our balance of deposits includes mainly borrowings and domestic onlendings:
| · | Borrowings. We have relationships with banks all over the world, providing credit lines as foreign currency-linked (either to the U.S. dollar or to a basket of foreign currencies). We apply the proceeds from these transactions mainly to U.S. dollar-linked lending operations and in particular to trade finance operations. |
| · | Domestic Onlendings. We onlend from public institutions, mainly BNDES and FINAME, for which we act as a financial agent. Funding from these sources in Brazil represents a method of providing long-term loans with attractive average interest rates to certain sectors of the economy. Loans from these funds are allocated by BNDES through banks to specific sectors targeted for economic development. This type of lending is known as “repassing” or “onlending.” Under this arrangement, we borrow funds from BNDES or FINAME, the equipment financing subsidiary of BNDES, and pass the funds to the targeted sector of the economy. These loans are generally granted at rates below the average market rates and have an average maturity of up to five years. Because the repassed funds are generally matched and/or funded by loans from a federal government agency, we take no interest rate or maturity mismatch risk nor charge interest at a fixed margin over the cost of funds. We, however, retain the commercial credit risk of the borrower and therefore have discretion in the lending decision and application of the credit criteria. This type of funding is not affected by compulsory deposit requirements. The onlending is generally secured or guaranteed, although this is not required by the terms of the onlending. |
Other Funding
Marketable Debt Securities
Our balance of marketable debt securities was R$70.2 billion on December 31, 2017, R$99.8 billion on December 31, 2016 and R$94.7 billion on December 31, 2015, representing 16.2%, 23.0% and 22.3% of our total funding, respectively.
Agribusiness credit notes (Letra de Crédito do Agronegócio), which are credit notes that are freely negotiable and represent an unconditional promise of payment in cash, are issued exclusively by financial institutions and related to credit rights originated from transactions conducted between rural producers and their cooperatives and agents of the agribusiness production chain and the exchange acceptances, reached R$8.9 billion on December 31, 2017, R$6.9 billion on December 31, 2016, and R$2.1 billion on December 31, 2015.
Treasury bill instruments (Letras financeiras) are a funding alternative available to banks that can be characterized as senior or eligible to compose the Regulatory Capital. Pursuant to CMN Resolution 4,123 of August 23, 2012, its minimum term must be 24 months and it must be issued for a minimum amount of R$300,000 for subordinated transactions and R$150,000 for senior transactions. Our balance of treasury bills instruments totaled R$31.7 billion as of December 31, 2017, a 48.2% decrease from December 2016.
Real estate credit notes (Letras de Crédito Imobiliário) increased 15.6%, from R$23.9 billion on December 31, 2016 to R$27.7 billion on December 31, 2017.
We undertake issuances of securities, including under our U.S.$10,000,000,000 Global Medium Term Notes Program. Our balance of bonds and other securities was R$1.9 billion on December 31, 2017 and R$7.7 billion on December 31, 2016. This change was principally due to the non-replacement of certain debt instruments reaching maturity.
Debt Instruments Eligible to Compose Tier 1 and Tier 2 Capital
We have issued U.S. dollar-denominated Notes that constitute Tier 1 and Tier 2 regulatory capital as part of our plan to optimize our capital structure. As of December 31, 2017 the balance for both Tier 1 and Tier 2 debt instruments was R$8.4 billion compared to R$8.3 billion as of December 31, 2016. This variation was caused by the depreciation of the U.S. dollar against thereal.
Subordinated Liabilities
As of December 31, 2017 and 2016, our subordinated liabilities amounted to a total of R$0.5 billion of certificates of deposit issued by us in the local market in various issuances at average interest rates indexed to CDI or IPCA.
Capital Management
Our capital management is based on conservative principles and continuous monitoring of the items that affect our solvency level. We are required to comply with Brazilian capital adequacy regulations under Brazilian Central Bank rules. In October 2013, the new regulations implementing the capital and the regulatory capital requirements of the Basel Committee on Banking Supervision (Basel III) came into effect in Brazil. The minimum regulatory capital requirements is currently at 11%. The Tier I requirement is 6.0%, divided into core capital of at least 4.5%, consisting mainly of corporate capital and profit reserves, including shares, units of ownership, reserves and earned income, and additional capital consisting mainly of certain reserves, revenue earned and hybrid securities and instruments as capital authorized by the Brazilian Central Bank.
According to the new rules on regulatory capital in Brazil, the value of goodwill for the calculation of capital base was deducted from the capital base according to the “phase-in” for implementation of Basel III in Brazil, which will be completed by January 1, 2019. The following table sets forth the percentage of required goodwill deduction for each year up to 2019:
Basel III Phase in |
2013 | 2014 | 2015 | 2016 | 2017 | 2018 |
| 0% | 20% | 40% | 60% | 80% | 100% |
Source: Brazilian Central Bank; Resolution No. 4,192 of the Brazilian Central Bank of March 2013.
If Basel III requirements were fully implemented as of the date hereof, we would continue to maintain an adequate regulatory capital ratio under Basel III and Brazilian Central Bank rules.
Our Basel capital adequacy ratio, calculated in accordance with the regulations and guidance of the Brazilian Central Bank was 15.8% as of December 31, 2017. For more information, see “Item 4. Information on the Company—B. Business Overview—Regulation and Supervision—Capital Adequacy and Leverage—Basel.”
| | | As of December 31, |
| | | | 2017(1)(2) | | | | 2016(1) | | | | 2015(1) | |
| | | | (in millions of R$, except percentages) |
| Tier I Regulatory Capital | | | 56,386.0 | | | | 56,264.0 | | | | 52,785.0 | |
| CET 1 Common Equity Tier I | | | 52,196.9 | | | | 52,136.8 | | | | 47,840.2 | |
| Supplementary Capital | | | 4,189.1 | | | | 4,127.2 | | | | 4,944.9 | |
| Tier II Regulatory Capital | | | 4,250.4 | | | | 4,280.8 | | | | 5,182.1 | |
| Regulatory Capital (Tier I and II) | | | 60,636.4 | | | | 60,544.9 | | | | 57,967.1 | |
| Required Regulatory Capital | | | 383,132.7 | | | | 36,669.6 | | | | 40,531.2 | |
| Portion of Credit Risk(3) | | | 324,696.5 | | | | 31,309.9 | | | | 36,355.9 | |
| Market Risk Portions(4) | | | 25,857.1 | | | | 2,388.6 | | | | 2,301.0 | |
| Operational Risk Portion(5) | | | 32,579.1 | | | | 2,971.0 | | | | 1,874.3 | |
| Tier I Ratio | | | 14.7 | % | | | 15.2 | % | | | 14.3 | % |
| Basel Principal Capital | | | 13.6 | % | | | 14.0 | % | | | 13.0 | % |
| Basel Ratio | | | 15.8 | % | | | 16.3 | % | | | 15.7 | % |
| (1) | Amounts calculated based on the applicable consolidated prudential conglomerate definition, which took effect as of January 2015. |
| (2) | As of 2017, the amounts of required regulatory capital have been informed as the risk-weighted assets correspondent and in the prior years the amounts were being informed as the allocated portions. For better comparison to the prior years, the respective recalculated amounts of portions for 2017 are: Portion of credit risk R$30,034, Market risk portion R$2,392 and Operational risk portion R$3,014. |
| (3) | To calculate the capital allocation for credit risk we considered Brazilian Central Bank Circular No. 3,714 of August 20, 2014, which amends Circular No. 3,644 of March 4, 2013. |
| (4) | Includes portions for market risk exposures subject to variations in rates of foreign currency coupons, or “PJUR2,” price indexes, or “PJUR3,” and interest rate, or “PJUR1/PJUR4,” the price of commodities, or “PCOM,” the price of shares classified as trading portfolios, or “PACS,” and portions for gold exposure and foreign currency transactions subject to foreign exchange, or “PCAM.” |
| (5) | To calculate the capital allocation for the Operational Risk Portfolio we considered Brazilian Central Bank Circular Nº 3.640 of March 4, 2013, which amends the resolution No. 4.193 of March 1, 2013. |
5C. Research and Development, Patents and Licenses, etc.
We do not have any significant policies or projects relating to research and development, and we own no relevant patents or licenses.
5D. Trend Information
The following list sets forth, in our view, the most important trends, uncertainties and events that are reasonably likely to continue to have a material effect on our revenues, income from continuing operations, profitability, liquidity and capital resources, or that may cause reported financial information to be not necessarily indicative of future operating results or financial condition:
| · | The ongoing economic and political crisis in Brazil may adversely affect the performance of the Brazilian economy. As a result, our credit portfolio, which is focused on Brazil, may not grow or could decrease and our provisions for loan losses would increase; |
| · | Financial problems in certain countries in Europe could lead to another international financial crisis. If this occurs, Brazilian GDP growth in future periods may be depressed and, as a result, our credit portfolio may not grow or could decrease and our provisions for loan losses would increase; |
| · | Potential inflation increases that could cause an increase in interest rates and lower growth in lending activities; |
| · | Continued market volatility and instability that could affect our revenues; |
| · | Restrictive regulations or government intervention in the banking business, which could affect our margins and/or growth in lending activities; |
| · | Regulatory capital changes towards more restrictive rules as a response to any potential financial crisis or general macroeconomic conditions; |
| · | Decreased liquidity in domestic capital markets; |
| · | Tax policies that could decrease our profitability; |
| · | Currency fluctuation and exchange rate controls that could have an adverse impact on international investors; |
| · | Failure to adequately protect ourselves against risks relating to cyber-security; |
| · | Our dependence on the proper functioning of information technology systems; and |
| · | In contrast to all the points mentioned above, a recovery in the Brazilian economy, with new reforms underway (such as the pension reform and the foreign trade reform), and ongoing control of inflation, could have a positive effect on the economic environment and, therefore, impact our business. |
For more information, see “Item 3. Key Information—D. Risk Factors” where we present the risks we face in our business that may affect our commercial activities, operating results or liquidity.
5E. Off-Balance Sheet Arrangements
We have entered, in the normal course of business, into several types of off-balance sheet arrangements, including lines and letters of credit and financial guarantees.
Lending-Related Financial Instruments and Guarantees
We use lines and letters of credit and financial guarantee instruments to meet the financing needs of our customers. The contractual amount of these financial instruments represents the maximum possible credit risk should the counterparty draw down the commitment or we fulfill our obligation under the guarantee, and the counterparty subsequently fails to perform according to the terms of the contract. Most of these commitments and guarantees expire without the counterparty drawing on the credit line or a default occurring. As a result, the total contractual amount of these instruments does not represent our future credit exposure or funding requirements. Further, certain commitments, primarily related to consumer financing are cancelable, upon notice, at our option.
The “maximum potential amount of future payments” represents the notional amount that could be lost if there were a total default by the guaranteed parties, without consideration of possible recoveries from collateral held or pledged, or recoveries under recourse provisions. There is no relationship between these amounts and probable losses on these guarantees. In fact, the maximum potential amount of future payments significantly exceeds inherent losses.
The following table sets forth the maximum potential amount of future payments under credit and financial guarantees.
| | | As of December 31, |
| | | 2017 | | 2016 | | 2015 |
| | | (millions of R$) |
| Contingent liabilities | | | | | | | | | | | | |
| Guarantees and other sureties | | | 40,730 | | | | 32,630 | | | | 42,836 | |
| Documentary credits | | | 1,915 | | | | 635 | | | | 774 | |
| Total contingent liabilities | | | 42,645 | | | | 33,265 | | | | 43,611 | |
We also manage certain funds that are not recorded on our balance sheet as detailed below for the periods indicated:
| | | As of December 31, |
| | | 2017 | | 2016 | | 2015 |
| | | (millions of R$) |
| Funds under management | | | 1,748 | | | | 1,534 | | | | 2,542 | |
| Total | | | 1,748 | | | | 1,534 | | | | 2,542 | |
Finally, we hold certain third-party securities in custody which are not recorded on our balance sheet. As of December 31, 2017, 2016 and 2015, we held in custody debt securities and equity instruments entrusted to Santander Brasil by third parties totaling R$40.4 million, R$27.8 million and R$38.4 million, respectively.
5F. Contractual Obligations
Our contractual obligations as of December 31, 2017 are summarized as follows:
| | | As of December 31, 2017 |
| | | Total | | Less than 1 year | | 1-3 years | | 3-5 years | | More than 5 years |
| | | (in millions of R$) |
| Contractual Obligations | | | | | | | | | | | | | | | | | | | | |
| Deposits from the Brazilian Central Bank and credit institutions | | | 79,375 | | | | 66,727 | | | | 6,798 | | | | 2,718 | | | | 3,131 | |
| Customer deposits | | | 276,042 | | | | 216,363 | | | | 42,494 | | | | 17,176 | | | | 9 | |
| Marketable debt securities | | | 70,247 | | | | 49,952 | | | | 17,923 | | | | 1,492 | | | | 880 | |
| Debt Instruments Eligible to Compose Capital(1) | | | 8,437 | | | | 114 | | | | — | | | | — | | | | 8,323 | |
| Subordinated liabilities | | | 519 | | | | 519 | | | | — | | | | — | | | | — | |
| Contractual Interest payments(2) | | | 45,976 | | | | 17,788 | | | | 11,687 | | | | 7,854 | | | | 8,648 | |
| Total | | | 480,596 | | | | 351,464 | | | | 78,903 | | | | 29,239 | | | | 20,991 | |
| (1) | The table above excludes the notional and any interest payments relating to our perpetual Tier I bonds which interests are discretionary as described in “Item 5A—Operating And Financial Review And Prospects—Operating Results.” |
| (2) | Calculated for all Deposits from credit institutions, Customer Deposits, Marketable debt securities, Subordinated liabilities and Debt Instruments Eligible to Compose Capital (Tier II) assuming a constant interest rate based on data as of December 31, 2017 over time for all maturities, and those obligations with maturities of more than five years have an average life of ten years. |
The above table does not reflect amounts that we may have to pay on derivative contracts. The amounts ultimately payable will depend upon movements in the financial markets. The net fair value position of our derivative contracts as of December 31, 2017 reflected assets of R$414 million, compared to assets of R$4,466 million as of December 31, 2016.
In addition, we lease many properties under standard real estate lease contracts, which can be canceled at our option and include renewal options and escalation clauses. Total future minimum payments of non-cancelable operating leases as of December 31, 2017 was R$2,458 million, of which R$624 million matures in up to one year, R$1,545 million from one year to up to five years and R$288 million after five years. Additionally, we have contracts with indeterminate maturities totaling R$1 million per month.
5G. Safe Harbor
See “Forward-Looking Statements.”
ITEM 6. DIRECTORS, SENIOR MANAGEMENT AND EMPLOYEES
6A. Board of Directors and Board of Executive Officers
Pursuant to our By-Laws, we are managed by a board of directors (conselho de administração) and a board of executive officers (diretoria executiva). The board of directors is our supervisory board as set out in our By-Laws and in applicable legislation. Our board of executive officers is responsible for our day-to-day management.
Our board of directors is composed of a minimum of five members and a maximum of twelve members. A minimum of 20.0% of the members of the board of directors must be independent members. The board of directors has a Chairman and a Vice-Chairman, each elected at the general shareholders’ meeting by majority vote.
Our board of executive officers is composed of a minimum of two members and a maximum of 75 members, one of them being appointed as the Chief Executive Officer, and the others may be appointed as senior vice president executive officers, vice president executive officers, investor relations officer, executive officers and officers without specific designation. Certain of our executive officers are also members of the boards of executive officers and/or boards of directors of our subsidiaries.
Pursuant to Brazilian law, the election of each member of the board of directors and board of executive officers must be approved by the Brazilian Central Bank.
The following table presents the names, positions and dates of birth of the current members of our board of directors and board of executive officers:
Members of the Board of Directors:
Name | Position | Date of Birth |
| Álvaro Antonio Cardoso de Souza | Chairman | September 5, 1948 |
| Sergio Agapito Lires Rial | Vice-Chairman | July 28, 1960 |
| Conrado Engel | Member | May 30, 1957 |
| José Antonio Álvarez Álvarez | Member | January 6, 1960 |
| José Maria Nus Badía | Member | February 9, 1950 |
| José de Paiva Ferreira | Member | March 1, 1959 |
| Celso Clemente Giacometti | Independent Member | October 13, 1943 |
| Deborah Patricia Wright | Independent Member | September 4, 1957 |
| Deborah Stern Vieitas | Independent Member | August 21, 1957 |
| José Luciano Duarte Penido | Independent Member | March 8, 1948 |
Members of the Board of Executive Officers:
Name | Position | Date of Birth |
| Sergio Agapito Lires Rial | Chief Executive Officer | July 28, 1960 |
| José de Paiva Ferreira | Senior Vice President Executive Officer | March 1, 1959 |
| Angel Santodomingo Martell | Vice President Executive Officer and Investor Relations Officer | November 16, 1965 |
| Alessandro Tomao | Vice President Executive Officer | March 8, 1977 |
| Antonio Pardo de Santayana Montes | Vice President Executive Officer | November 5, 1971 |
| Carlos Rey de Vicente | Vice President Executive Officer | February 20, 1974 |
| Jean Pierre Dupui | Vice President Executive Officer | September 23, 1968 |
| Juan Sebastián Moreno Blanco | Vice President Executive Officer | December 17, 1964 |
| Manoel Marcos Madureira | Vice President Executive Officer | December 30, 1951 |
| Mário Roberto Opice Leão | Vice President Executive Officer | July 21, 1975 |
| Vanessa de Souza Lobato Barbosa | Vice President Executive Officer | December 24, 1968 |
| José Alberto Zamorano Hernandez | Executive Officer | May 9, 1962 |
| José Roberto Machado Filho | Executive Officer | August 25, 1968 |
| Alexandre Grossmann Zancani | Officer | October 14, 1977 |
| Amancio Acúrcio Gouveia | Officer | March 31, 1963 |
Name | Position | Date of Birth |
| André de Carvalho Novaes | Officer | April 14, 1969 |
| Carlos Aguiar Neto | Officer | March 5, 1971 |
| Cassio Schmitt | Officer | April 23, 1971 |
| Cassius Schymura | Officer | February 19, 1965 |
| Claudenice Lopes Duarte | Officer | July 25, 1972 |
| Ede Ilson Viani | Officer | September 5, 1967 |
| Germanuela de Almeida de Abreu | Officer | December 6, 1975 |
| Gilberto Duarte de Abreu Filho | Officer | August 7, 1973 |
| Gustavo Alejo Viviani | Officer | August 26, 1975 |
| Igor Mario Puga | Officer | November 10, 1981 |
| José Teixeira de Vasconcelos Neto | Officer | March 8, 1975 |
| Leopoldo Martinez Cruz | Officer | August 19, 1974 |
| Luis Guilherme Mattos de Oliem Bittencourt | Officer | December 4, 1973 |
| Luiz Masagão Ribeiro Filho | Officer | January 1, 1976 |
| Marcelo Malanga | Officer | May 18, 1969 |
| Marino Alexandre Calheiros Aguiar | Officer | May, 14, 1971 |
| Nilton Sergio Silveira Carvalho | Officer | January 1, 1957 |
| Rafael Bello Noya | Officer | October 19, 1977 |
| Ramón Sanchez Díez | Officer | October 29, 1968 |
| Reginaldo Antonio Ribeiro | Officer | May 19, 1969 |
| Roberto de Oliveira Campos Neto | Officer | June 28, 1969 |
| Robson de Souza Rezende | Officer | January 24, 1967 |
| Rodrigo Cury | Officer | July 17, 1976 |
| Ronaldo Wagner Rondinelli | Officer | August 2, 1973 |
| Sergio Gonçalves | Officer | August 7, 1956 |
| Thomas Gregor Ilg | Officer | September 12, 1968 |
| Ulisses Gomes Guimarães | Officer | March 14, 1971 |
Below are the biographies of the members of our board of directors and board of officers.
Members of the Board of Directors:
Álvaro Antonio Cardoso de Souza. Mr. Souza is Portuguese and was born on September 5, 1948. He holds degrees in Economics and Business Administration from the Pontifícia Universidade Católica de São Paulo, and attended several specialization courses from a number of American universities, such as the University of Pittsburgh and The Wharton Business School of the University of Pennsylvania. Currently, he is an Officer of AdS – Gestão, Consultoria e Investimentos Ltda. He is a Certified Director, an accreditation granted to him by Instituto Brasileiro de Governança Corporativa. He was General Officer of Banco de Investimentos Crefisul and Chief Executive Officer of Citibank / Brazil. As Vice-President Executive Officer of Citibank New York, he led the Cross Border Finance Group, the Global Private Bank, the Consumer Bank USA and the Latin America Consumer Bank. He was also Chairman of the board of directors of Citibank in Switzerland, Chairman of the board of directors of Banco Crefisul, Chairman of the boards of directors of Fundo Brasileiro para a Biodiversidade (FUNBIO), of WWF Brasil, of Board Trustees of WWF Inernacional and of Credicard in Brazil, besides participating in the board of directors of Citibank Equity Investments (Argentina) and AMBEV. He also worked as Senior Advisor for Latin America at Citibank until his retirement in September 2003. He was President of Banco ABC-Roma, an affiliate to Grupo Globo and was member of the board of directors of several Brazilian companies, such as Celbrás, Ultraquímica, SPCI Computadores, Signature Lazard, Banco Triângulo, CSU Cardsystems and Gol Linhas Aéreas, Duratex and Grupo Libra. He was also member of the board of directors of MasterCard International and President of the American Chamber of Commerce in São Paulo. Currently, he is the Chairman of our board of directors and a member of our Risk and Compliance Committee, Compensation Committee and Nomination and Governance Committee.
Conrado Engel. Mr. Engel is Brazilian and was born on May 30, 1957. He holds a degree in Aeronautical Engineering from the Instituto Tecnológico de Aeronáutica - ITA. He started his career in 1981 as management trainee of Citibank S.A., where he worked for seven years. From 1992 to 1997 he was the responsible Officer for the businesses related to credit cards for Banco Nacional-Unibanco. In 1998 he was elected Chief Executive Officer of
Financeira Losango. In October 2003 he became responsible for the retail business of HSBC in Brazil and was a member of its executive committee until the end of 2006. From January 2007 to May 2009 he was responsible for the retail business and was a member of the directive committee of HSBC in the Asian-Pacific region, in Hong Kong. In May 2008 he was appointed group general manager and took office as Chief Executive Officer of HSBC Brasil in June 2009, where he remained until March 2012. As one of our Senior Vice-President Executive Officers, he has been responsible for the Wealth Management & Specialized Businesses Vice-Presidency, including Auto Joint Ventures, until January 2018. Currently he is a member of our Board of Directors, a member of our Risk and Compliance Committee of Santander Brasil, Chairman of the board of directors of Banco Olé Bonsucesso Consignado S.A. and a member of the advisory board of Santander Brasil Gestão de Recursos Ltda.
José Antonio Álvarez Álvarez. Mr. Álvarez is Spanish and was born on January 6, 1960. He holds a bachelor’s degree in Administration and Business Economics from Universidad Santiago de Compostela in Spain and an MBA from the University of Chicago’s Graduate School of Business. He started at Santander Spain in 2002 as the head of finance management and in November 2004 he was elected as Chief Financial Officer. He served as Head of the Finance Division of Banco Bilbao Vizcaya Argentaria, S.A. in Spain from 1999 to 2002 and as Financial Officer of Corporación Bancaria de España, S.A. (Argentaria) from 1995 to 1999. He was also Chief Financial Officer of Banco Hipotecario, S.A. in Spain from 1993 to 1995 and vice president of Finanpostal Gestión Fondos de Inversión y Pensiones from 1990 to 1993, and held roles at Banco de Crédito Industrial and Instituto Nacional de Industria. He was a member of the board of directors of Banco de Crédito Local S.A. from 2000 to 2002 and President of the European Banking Federation’s Banking Supervision Committee from 2009 to 2012. Currently, he is the Chief Executive Officer of the Santander Group, a member of the board of directors of Santander Consumer Finance, S.A., a member of the Supervisory Board of Banco Zachodni WBK S.A., a member of the Supervisory Board of Santander Consumer Bank AG and Santander Consumer Holding GmbH and was a member of the Supervisory Board of Santander Holdings USA, Inc. until January 2015. He has been a member of our board of directors since 2009.
José Maria Nus Badía. Mr. Badía is Spanish and was born on February 9, 1950. He serves as Chief Risk Officer at Banco Santander, S.A. and has been its Senior Executive Vice President since January 19, 2015. Mr. Badía served as an Executive Vice President of Risk, Head of Strategic Planning of Risk Division from March 2014 to January 2015. He also served as the Executive Vice President of Santander UK Operations at Banco Santander, S.A. and as the Chief Risk Officer and Executive Director at Santander UK plc from March 17, 2011 to March 1, 2014. He was also the Executive Vice President for Risk at Argentaria and Bankinter, and a member of the board of directors of Banco de Vitoria, Banco de Negocios Argentaria, Banco de Credito Local and Banco de Alicante. He also served as an Executive Director and Chief Risk Officer of Banco Banesto. Previously, he was Chief Risk Officer at Banco Español de Credito, S.A., where he was a member of the board of directors and the board of officers. He has been an Executive Director at Alliance & Leicester plc since March 17, 2011. He is also a member of the board of Societat Catalana d’Economia. He has been a member of our board of directors since 2015.
José de Paiva Ferreira. Mr. Paiva is Portuguese and was born on March 1, 1959. He has a specialization degree in Business Administration from the Fundação Getúlio Vargas, and an MBA from the Wharton School of Business at the University of Pennsylvania. He has worked in the financial markets for more than 40 years. He started at Banco Bradesco in 1973 and occupied several different positions. Afterwards, he joined Banco Geral do Comércio, Noroeste and Santander Brasil, where he was Vice President Executive Officer, responsible for the Business, Human Resources, Operations, Technology, Property, Products, Marketing, Credit Cards, Insurance, Leasing and Branch Network. From 2000 to 2001 he occupied the position of e-Business Officer for Latin America, for the American Division of Santander Central Hispano. At the end of 2001, he came back to Brazil in order to work at Banco Banespa as Vice President Executive Officer, responsible for the Operational Resources department. In 2003, he became Vice President Executive Officer responsible for Marketing, Products and Retail Business for Santander Brasil. In 2008, he became the Chief Executive Officer of Santander Brasil, a position that he occupied until the merger with Banco Real, when he became Senior Vice President Executive Officer, responsible for the Retail Business. In March 2011 he became Director of Santander Brasil’s board of directors, and joined the Board business group based in Los Angeles, California, USA, where his main activities involved technological innovations. Currently, he is a member of our board of directors, and since July 2013 he also acted as Senior Vice President Executive Officer, responsible for the Human Resources, Organization, Property, Proceedings, Operations, Technology and Costs. He is also Chairman of the board of directors of Santander Leasing S.A. Arrendamento Mercantil, a member of the board of directors of TECBAN – Tecnologia Bancária, and Getnet Adquirência e Serviços para Meios de Pagamento S.A., officer of Gestora de Investimentos Ipanema S.A. and a member of our Risk and Compliance Committee.
Sergio Agapito Lires Rial. Mr. Rial is Brazilian and was born on July 28, 1960. He was Chief Executive Officer of Marfrig Global Foods S.A. His professional career includes the posts of Vice-President Executive Officer and World Chief Financial Officer of Cargill. He was also a member of the board of directors of Cargill for nine years. He was a Managing Director of Bear Stearns & Co., in New York, Officer of ABN AMRO Bank and a member of the board of directors of ABN AMRO Bank in the Netherlands, as well as a member of the board of directors of Mosaic Fertilizers. He has a degree in Law from the Universidade Federal do Rio de Janeiro and in Economics from Universidade Gama Filho, and also has an MBA from IBMEC in São Paulo, as well as specializations from Harvard Business School, the Wharton School of Business at the University of Pennsylvania and INSEAD, in France. Currently he is Vice-Chairman of the board of directors and the Chief Executive Officer of Santander Brasil, Chairman of the board of directors of Getnet Adquirência e Serviços para Meios de Pagamento S.A. and Universia Brasil S.A.
Celso Clemente Giacometti. Mr. Giacometti is Brazilian and was born on October 13, 1943. He holds a degree in Business Administration from the Faculdade de Economia São Luís and graduated with an accounting sciences degree from the Faculdade de Ciências Econômicas de Ribeirão Preto. He started his career in 1960 as trainee and reviewer at Citibank. From 1963 to 2001 he worked at Arthur Andersen, becoming a partner in 1974 and acting as CEO of Brazilian operations from 1985 to 2000. He served on the board of directors and audit committees of Lojas Marisa S.A., Tarpon Investments, TIM Participações, Sabó Autopeças and Votorantim Indústrias. He was a member of the Fiscal Council of CTEEP/ISA - Transmissão Paulista. He was also the CEO of Souto Vidigal, a holding company and family office, from 2004 to 2006. On February 3, 2010, he was elected as an independent member of our board of directors, a body which he presided over between October 2011 and June 2013 and between August 2013 and March 2015. He is President of the Fiscal Council and member of the Audit Committee of Ambev S.A. He is the manager partner of Giacometti Serviços Profissionais Ltda. Mr. Giacometti is also one of the co-founders and former board member of IBGC (Brazilian Institute of Corporate Governance) and a current member of its Governance and Nomination Commission. He is a member of the CAF (Comitê de Fusões e Aquisições). Currently, he is an independent member of our board of directors, as well as member of our Compensation Committee and Nomination and Governance Committee.
Deborah Patricia Wright. Mrs. Wright is Brazilian and was born on September 4, 1957. She holds a Business Administration degree from the São Paulo School of Business Administration (EAESP-FGV). Mrs. Wright started her career in 1980 at Kibon’s Marketing Department, where she remained until 1989. In 1989, she joined Unilever as Marketing Manager and worked in the food division. In 1991, she returned to Kibon as Marketing Director, becoming Commercial Vice-President in 1994. In 1995 she became the General Manager of Kraft Suchard Foods. In 1997, she reached the position of General Manager of Kibon. At ICI/Paints, she was the General Manager for Tintas Coral Brasil from 1997 to 1999, and subsequently the Regional Manager for ICI. She was also General Officer at Parmalat Brasil in 1999, and Chief Executive Officer of Pão de Açúcar’s Group Internet Division from 2000 to 2002. From 2002 to 2007, she was Corporate Vice-President/Commercial Vice-President in the area of Sales and Corporate Marketing of the Abril Group. From 2009 to 2010, she was Chief Executive Officer/Country Manager of Ipsos Brasil, a market research firm. She has been acting as board member since 2001. From 2001 to 2005, she was a member of the Escola Americana de São Paulo’s board (Graded School). From 2005 to 2006, she was a member of the superior board of CONAR (National Board of Advertising Self-Regulation). From 2008 to 2014, she was member of Lojas Renner’s board, as well as Chairwoman of the Sustainability Committee from 2012 to 2014. She was a member of the consultative council of Eurofarma from 2013 to 2016. Currently, she is associated with: WCD Brazilian Group (Women Corporate Directors); Strategy and Innovation Committee of the IBGC (Brazilian Institute of Corporate Governance); the Commission of Strategy and of the Group; and Gender Diversity – Women in Boards. Currently she is a member of our Nomination and Governance Committee and Compensation Committee.
Deborah Stern Vieitas. Mrs. Vieitas is Brazilian and was born on August 21, 1957. She is currently the CEO of American Chamber of Commerce Brazil (Amcham Brazil) and a board member of AXA Seguros S.A. From 2008 to 2014, she was a CEO and a member of the Board of Banco Caixa Geral Brasil. From 2000 to 2008, she was an Executive Vice President of Banco BNP Paribas Brasil, responsible for Corporate Coverage and Loan and Financing portfolios. From 1998 to 2000, she was an Executive Vice President of Banco CCF Brasil. Currently she is a member of our Risk and Compliance Committee.
José Luciano Duarte Penido. Mr. Penido is Brazilian and was born on March 8, 1948. He holds a Mining Engineering degree from the Engineering School of Universidade Federal de Minas Gerais. He started his career at ICOMI – Indústria e Comércio de Minérios in the manganese mine of Serra do Navio, in Amapá, where he worked until August 1973. From September 1973 to 1988, he worked at SAMITRI, a mining company from the Belgo
Mineira Group, where he played several mineral research, mining, and industrial project management roles. From 1989 to 2003, he worked for SAMARCO, where he started as Development Officer and was the Chief Executive Officer for 12 years. From 2004 to 2009, he was the Chief Executive Officer of VCP – Votorantim Celulose e Papel. Since 2009, Mr. Penido has been chairing the board of directors of Fibria Celulose. He is also an independent member of the boards of directors of COPERSUCAR, Química Amparo YPÊ and the ALGAR Group. Additionally, he is a member of the Instituto Votorantim’s board. In his socio-environmental activities, Mr. Penido acts as Chairman of the ACEVP – Paraíba River Valley’s Ecological Corridor Association and as a member of the Board of Directors of the Rede Cidadã NGO. Currently he is also coordinator of our Audit Committee and a coordinator of our Sustainability Committee.
Members of the Board of Executive Officers:
Sergio Agapito Lires Rial. See “—Members of the Board of Directors.”
José de Paiva Ferreira. See “—Members of the Board of Directors.”
Angel Santodomingo Martell. Mr. Santodomingo is Spanish and was born on November 16, 1965. He holds a degree in Economics and Business with specialization in Finance from the ICADE University in Madrid and a CFA (Chartered Financial Analyst) from the CFA Society of the United States. As one of our Vice President Executive Officers, he holds the position of Chief Financial Officer and Investor Relations Officer. He started at the Santander Group in 2005 as Head of International Developments and Asset Management and then became globally responsible for the investor relations area. He was the Country Head of Grupo Fortis and an officer and board member at Banesto Bolsa. He also worked at Usera y Morenés S.V.B. - Sociedade de Valores y Bolsa and Arthur Andersen (Deloitte). From 1996 to 2008, he occupied the position of Chief Executive Officer of CFA Society in Spain, where he acted as founding member of such nonprofit organization focused on serving the holders of financial analyst accreditation (CFA) and from 2009 to 2014 was Vice President of AERI’s (Asociación Española de Relaciones con Inversores) board of directors. He is also Chief Executive Officer of Aymoré CFI, Santander Leasing S.A. Arrendamento Mercantil, Santander Corretora de Seguros, Investimentos e Serviços S.A. and Atual Companhia Securitizadora de Créditos Financeiros S.A., Executive Officer of Santander Cultural and Santander Holding Imobiliária S.A., Chairman of the Board of Directors of Webmotors S.A. and a member of the boards of directors of Banco Olé Bonsucesso Consignado S.A., Banco RCI Brasil S.A., Santander Leasing S.A. Arrendamento Mercantil, Super Pagamentos e Administração de Meios Eletrônicos S.A. and Getnet Adquirência e Serviços para Meios de Pagamento S.A.
Alessandro Tomao. Mr. Tomao is Brazilian and was born on March 8, 1977. He holds a bachelor’s degree in Law from the FMU University and a master’s in Business Administration - HR degree from the University of São Paulo. As one of our Executive Vice-Presidents, he has been responsible for the Company’s Legal and Corporate Affairs department since February 2018. From June 2010 to February 2018, he has been the head of the legal litigation, legal consulting in labor and pension funds departments at Santander Brasil. From 2000 to 2010, he served as head of labor and pension funds legal department at Banco Itaú S.A. Previously, from 1998 to 2000, he acted as trainee at Whirlpool Brazil, where he started his career. Since 2015, he has been a permanent member of the legal counsel of FEBRABAN, where he acted from 2011 to 2015 as the coordinator of the labor committee. Currently, since January 2017, he is a member of the Legal Counsel of ABRAPP (Brazilian Association of Pension Funds) as well.
Antonio Pardo de Santayana Montes. Mr. Pardo is Spanish and was born on November 5, 1971. He holds a degree in Economics and Law from the ICADE school of the Universidade Pontifícia Comillas. As one of our Vice-President Executive Officers, he is responsible for the risk management department, having previously held the post of Officer responsible for the Risk Credit Recovery area and Officer of Wholesale Risks and Aymoré CFI. He was a consultant at PricewaterhouseCoopers from 1995 to 1998, senior risk analyst for Santander Central Hispano/Santander Investment from 1998 to 2000 and senior manager of Monitor Company from 2000 to 2005. He returned to the Santander Group in 2005 as Associate Officer in the Wholesale Risks area, where he remained until 2009, when he came to work in Brazil. He is also Executive Officer of Banco Bandepe S.A., Aymoré CFI, Santander Leasing S.A. Arrendamento Mercantil, Santander Capitalização S.A. and Santander Finance Arrendamento Mercantil, Sancap Investimentos e Participações S.A. and Santander Finance Arrendamento Mercantil S.A.
Carlos Rey de Vicente. Mr. Rey is Spanish and was born on February 20, 1974. He graduated in Law from the Universidad Complutense de Madrid, and he became a member of the Colégio de Abogados de Madrid in 1997. In 2010 he started at Santander Spain, where he was responsible for the strategy and planning of the banks of Santander México, Chile, Argentina, Puerto Rico, Uruguay, Peru and Colombia. From 2001 to May 2010, Mr. Rey was a partner of McKinsey & Co., where he was responsible for heading several projects on strategic consulting. His activities were always concentrated on banking and insurance matters, besides acting on team management. Before, he worked as a lawyer in two different law firms, at one of which he was partner and founder, dealing mainly with insurance and civil responsibility. Currently, Mr. Rey is our Vice President Executive Officer responsible for the Finance, Strategy and Quality department. He is also a member of the boards of directors of Santander Leasing S.A. Arrendamento Mercantil, Santander Securities Services Brasil Distribuidora de Títulos e Valores Mobiliários S.A., Getnet Adquirência e Serviços para Meios de Pagamento S.A., Zurich Santander Brasil Seguros e Previdência S.A., Zurich Santander Brasil Seguros S.A. and Santander Brasil Establecimiento Financeiro de Crédito S.A., Administrative Officer of Norchem Participações e Consultoria S.A. and Vice-President Officer of Santander Cultural. He is also a member of our Sustainability Committee.
Jean Pierre Dupui. Mr. Dupui is Brazilian and was born on September 23, 1968. He holds a bachelor’s degree in Economics and a specialization degree from Boston University. Currently he is responsible for Global Corporate Banking at Santander Brasil. From 1992 to 1998 he worked at the structured finance and trade finance department of Lloyds TSB Group in São Paulo and London. From 1998 to 2001 he worked at the structured finance department of Citigroup Brasil. From 2001 to 2004 he worked for BBVA Brasil in the debt capital markets department. From 2004 to 2006 he was a Corporate Finance Officer at Citigroup New York and São Paulo. He started his career in Santander Group in 2006, where he took charge of the Credit Markets department of Santander Brasil. From 2009 to 2012 he was responsible for Global Transaction Banking of Santander in Madrid. Mr. Dupui is also an Executive Officer of Santander Cultural and Banco Bandepe S.A. and member of the board of directors of Santander Securities Services Brasil Distribuidora de Títulos e Valores Mobiliários S.A. He is also a member of our Sustainability Committee.
Juan Sebastián Moreno Blanco. Mr. Moreno was born on December 17, 1964, in Spain. He graduated in Business Administration from the University of Houston, TX. From 1987 to 1994 he worked at Bankinter as Commercial Officer, responsible for the commercial area as well as for the Enterprises segment in Santander. From 1994 to 1997 he worked as Project Officer in the financial system of Mexico and Brazil, for Booz Allen Hamilton, in Mexico. He joined the Santander Group in 1997, where he served as Executive Officer of Companies and Institutions, after which he became Executive Officer of Business Development at Banco Santander Mexico, with responsibility for activities in the area of products of the bank. In 2006, he became responsible for the segments of Large Enterprises, Corporate, Institutional and High Income in Latin America, in addition to leading the product areas for the countries of Latin America (Comex, Cash Management, Payroll etc.). From 2008 to 2010, he performed the role of Chief Executive Officer of Banco Santander – Puerto Rico. As of 2010, he occupied the position of Vice President Officer of the Commercial area of Banco Santander Mexico, with responsibility for the business areas. At that time, he was also a member of the board of directors, steering committee, asset and liability committee, finance committee and risk committee. As a Vice President Executive Officer, he is responsible for our Retail and Commercial Branches. He is also a member of the board of directors of Getnet Adquirência e Serviços Para Meios de Pagamento S.A. and Executive Officer of Banco Bandepe S.A.
Manoel Marcos Madureira. Mr. Madureira is Brazilian and was born on December 30, 1951. He holds a bachelor’s degree in Mechanical Engineering from the Taubaté University in São Paulo and a degree in Administration from the Tokyo International Center in Japan. From 1976 to 2005 he worked in the automobile sector, as Institutional Relations and Communication Officer at Fiat Automóveis and Mercedes Benz do Brasil. From 1998 to 2005 he was also Vice President of the Associação de Fabricantes de Veículos Automotores and President of the Associação de Engenharia Automotora. In 2006 he was elected as Vice President of Corporate Affairs of Santander Brasil and in 2007 he was put in charge of the Vice Presidency of the Federação Brasileira de Bancos. In 2008 he was transferred to Santander Spain Group, as Communication Officer for Latin America, where he remained until September 2012. In October 2012 he returned to Brazil as Executive Officer to be in charge of the Corporate Communication and Institutional Relations Departments of Santander Brasil, and he is currently the Vice President Executive Officer responsible for the Communication, Marketing, Institutional Relations and Sustainability departments. Mr. Madureira is also Chief Executive Officer of Santander Cultural and Rojo Entretenimento S.A. and Executive Officer of Universia Brasil S.A.
Mário Roberto Opice Leão. Mr. Leão is Brazilian and was born on July 21, 1975. He holds a degree in Production Engineering from the Escola Politecnica of the Universidade de São Paulo. He began his career in 2001 as an associate at Citigroup, in the financial control area, being the financial analyst of all wholesale products from Citigroup Brazil, including global markets, financing, and corporate banking account. In 2006 he served as Global Markets Manager. He also had an active role in the development and innovation of derivatives in Brazil. From 2006 to 2008, he worked at Goldman Sachs as Fixed Income, Currencies and Commodities Manager. From 2011 to 2015 he was Global Capital Markets Executive Superintendent at Morgan Stanley responsible for corporate finance and member of the Committee of Global Solutions at Morgan Stanley. Since October 2015, he has been part of the executive team of Santander Brasil, being responsible for wholesale banking, leading a team of 70 people servicing more than 700 large national and international companies in Brazil. This position also covers foreign exchange loans and treasury products.
Vanessa de Souza Lobato Barbosa. Ms. Lobato is Brazilian and was born on December 24, 1968. She holds a bachelor’s degree in Business Administration from Pontifícia Universidade Católica de Minas Gerais, and a specialization degree in Marketing from Universidade Federal de Minas Gerais. From 1992 to 1995 she served as Marketing Local Manager at Banco Nacional, with responsibility for the sponsorship budget and micro marketing activities focused on the retail network. She also worked at Unibanco, in Recife, from 1995 to 1999, where she was responsible for different branches in the city of Recife. In 1999 she started at Santander Brasil, where she worked as General Manager of the Recife branch office. From 2001 to 2006 she served as Local Superintendent, where she was responsible for one of the Retail’s Locals, with head office in Belo Horizonte, covering the states of Minas Gerais, Goiás, as well as Brasília, and the states of the Northeast Region. From 2006 to 2013, Ms. Lobato was Executive Superintendent of our branch network, with responsibility for one of our retail branches in Brazil, specifically the “SPI Centro Sul” branch based in Campinas, State of São Paulo, covering important cities such as: Campinas, Jundiaí, Sorocaba, Piracicaba, Limeira and Americana. As one of our Vice President Executive Officers, she is currently responsible for the Human Resources department.
José Alberto Zamorano Hernandez. Mr. Zamorano is Spanish and was born on May 9, 1962. He holds a degree in Business Administration from the Universidad Complutense de Madrid. In 1991, he began his career in Santander Group as manager of the internal audit area from 1995 to 2002, where he was responsible for the credit risk audit in regional units of Galícia, Alicante and Castilla La Mancha. From 2002 to 2005, he was superintendent of internal audit of Santander Brasil and from 2005 to 2010, he was the Executive Officer responsible for internal audit in Grupo Financeiro Santander México. As one of our Executive Officers, Mr. Zamorano has been responsible for our internal audit area since 2011.
José Roberto Machado Filho. Mr. Machado is Brazilian and was born on August 25, 1968. He holds a degree in Electrical Engineering from Faculdade de Engenharia Industrial in São Paulo and has a master’s degree in business, economics and finance from the Universidade de São Paulo. He was an engineer for Keumkang Limited from 1990 to 1991, a foreign exchange manager from 1992 to 1995 and a manager of the emerging markets trading desk from 1992 to 1996 of Banco CCF Brasil S.A. He was also an Executive Officer of Banco Rabobank Internacional Brasil S.A. from 1998 to 2003 and was an Executive Officer of Banco Real from 2003 to 2009. Currently, he is responsible for the Individuals Businesses area. He is also Executive Officer of Banco Bandepe S.A., administrator of Santander Brasil Administradora de Consórcio Ltda. and a member of the boards of directors of Super Pagamentos e Administração de Meios Eletrônicos S.A., Zurich Santander Brasil Seguros e Previdência S.A., Zurich Santander Brasil Seguros S.A. and B3.
Alexandre Grossmann Zancani. Mr. Zancani is Brazilian and was born on October 14, 1977. He holds a degree in Computer Engineering from the Escola Politécnica of Universidade de São Paulo. He started his professional career at Banco Real and from 2002 to 2004 he served as an analyst in different retail risks teams focused on portfolio monitoring and decision models development. From 2004 to 2006 he served as team manager responsible for the Basel II project. From 2006 to 2007, he was the Quantitative Methods Superintendent, with responsibility for the Basel project. In 2008, he was Risk Superintendent of Santander Brasil and served as project manager in the process for integration of different areas as part of the merger with Banco Real. From 2009 to 2012, he became the Cards Risks Superintendent and, then, the Individuals Portfolio Management’s Superintendent. Currently, Mr. Zancani is the Executive Officer of Digital Businesses. He also serves as a member of the board of directors of Banco PSA Finance Brasil S.A.
Amancio Acúrcio Gouveia. Mr. Gouveia is Brazilian and was born on March 31, 1963. He holds a degree in Accounting from the Universidade Santa Úrsula. As one of our Officers, he has been acting as a controller working in accounting and fiscal management of our companies since 2001. He was an audit manager for KPMG until 1991, accounting manager of Unibanco – União de Bancos Brasileiros S.A. from 1991 to 1999, and assistant superintendent of BankBoston Banco Múltiplo S.A. from 1999 to 2001. He is Chief Executive Officer of Banco Bandepe S.A. and Executive Officer of Santander Leasing S.A. Arrendamento Mercantil, Atual Companhia Securitizadora de Créditos Financeiros S.A., Santander Capitalização S.A., Aymoré CFI, Evidence Previdência S.A., Santander Finance Arrendamento Mercantil S.A. and SANCAP Investimentos e Participações S.A. He is also administrator of Santander Brasil Administradora de Consórcio Ltda.
André de Carvalho Novaes. Mr. Novaes is Brazilian and was born on April 14, 1969. He holds a degree in Economics from the Universidade Federal Fluminense, and an executive MBA from BPS Business School (São Paulo and Toronto). From 1993 to 1997, he served as products coordinator in Santander Brasil, where he was responsible for credit proposals analysis, and in several areas at Aymoré CFI and in posts as Commercial Operator, Credit and Collection Chief. In 1996, he served as coordinator of products in São Paulo. From 1997 to 2001, he served as Commercial Manager. From 2002 to 2008, he served as Regional Manager. From 2008 to 2012, he served within Santander Brasil as the person responsible for the Other Assets segment in Aymoré CFI. Since 2012, he has served as Executive Superintendent in Santander Brasil, with responsibility for Aymoré CFI’s Vehicle Partnerships. On December 2012, he became the commercial coordinator of Aymoré CFI, with responsibility for the Commercial and Partnerships team. Currently, Mr. Novaes is head of Aymoré CFI and reports to the Vice Presidency of Wealth Management & Specialized Businesses. He is also Executive Officer of Aymoré CFI, Vice-Chairman of the board of directors and Vice-President Officer of Webmotors S.A. and a member of the board of directors and Institutional Relations Officer of Banco RCI Brasil S.A.
Carlos Aguiar Neto. Mr. Aguiar is Brazilian and was born on March 5, 1971. He holds a degree in Electrical Engineering from FAAP (Fundação Armando Alvares Penteado – São Paulo) with specialization in Business Administration from FGV (Fundação Getúlio Vargas – São Paulo). From 1996 to 2007, he worked as Treasurer of Cargill Agrícola S.A., Officer of Cargill Previdência and Executive Officer of Banco Cargill S/A. From 2007 to 2010, he was responsible for the financial and investor relations areas at BrasilAgro – Cia Brasileira de Propriedades Agrícolas S.A. From 2010 to 2015, he was CEO at Macquarie Bank responsible for funds that invest in Farms and grain production in Brazil and Australia. Since 2015, he has been responsible for the agribusiness area of Santander Brasil.
Cassio Schmitt. Mr. Schmitt is Brazilian and was born on April 23, 1971. He holds a degree in Economics from the Universidade Federal do Rio Grande do Sul, a master’s degree in Corporate Economics from the Fundação Getúlio Vargas in São Paulo and an MBA from the Sloan School of Business, Massachusetts Institute of Technology (MIT). He was treasury economist of Banco de Crédito Nacional S.A. from 1995 to 1996, and senior economist at UNIBANCO – União de Bancos Brasileiros S.A. from 1996 to 1999. He was an associate of the leveraged finance team of UBS Warburg in 2000, project finance superintendent of UNIBANCO from 2001 to 2003 and corporate banking superintendent of UNIBANCO Representative Office in New York from 2003 to 2004. He was a superintendent in the M&A/Project Finance team of Santander Brasil in 2004, and became responsible for project finance in Brazil in 2005 and also for the areas of acquisition finance and syndicated lending in 2010. From 2011 to 2012, he was responsible for the GCB clients Risk Department, and until 2014 he was responsible for Global Transaction Banking. Currently he is the Officer responsible for Credit Recovery Businesses. He is also a member of the board of directors of Banco Olé Bonsucesso Consignado S.A.
Cassius Schymura. Mr. Schymura is Brazilian and was born on February 19, 1965. He holds a degree in Electrical Engineering from the Pontifícia Universidade Católica of Rio de Janeiro and an MBA from the Fundação Dom Cabral. As one of our Officers, he is responsible for the Multichannel Platform, including call center and electronic channels. He was investment products analyst at Banco Nacional S.A. from 1989 to 1991, products and marketing manager of Cardway Processamento from 1991 to 1994, products manager of Cartão Nacional from 1994 to 1996, marketing and products supervisory manager of Unicard Banco Múltiplo S.A. from 1996 to 1999, senior associate at Booz Allen Hamilton in 1999, a member of the board of directors and Chief Executive Officer of Ideiasnet S.A. from 2000 to 2001, general manager of SOFTCORP from 2001 to 2004 and has been part of Santander Group since 2004, with responsibility, until 2015, for our Cards and Merchant Acquisition segment. He is also Chairman of the board of directors of Super Pagamentos e Administração de Meios Eletrônicos S.A.
Claudenice Lopes Duarte. Mrs. Duarte is Brazilian and was born on July 25, 1972. She holds a degree in Journalism from FIAM (Faculdades Integradas Alcântara Machado) with specialization in Business Communication from FGV (Fundação Getúlio Vargas – São Paulo). From 1996 to 2009, she worked at GWA Comunicação Integrada as Senior Director. From 2009 to 2010, she was Executive Manager of press relations at Santander Brasil. From 2011 to 2012, she was Superintendent of relations with the press and Institutional Relations at Santander Brasil and, since July 2012, she has been responsible for External Communications at Santander Brasil.
Ede Ilson Viani. Mr. Viani is Brazilian and was born on September 5, 1967. He holds a degree in Accounting and an MBA from Instituto de Ensino e Pesquisa - Insper. He was an auditor at Banco Itaú S.A. from 1986 to 1990, and a senior auditor at BankBoston S.A., where he worked for 17 years, acting in sequence as Officer of Loans and Products and Officer for the banking sector aimed at small and medium companies. He joined Santander Brasil in 2007 as Officer for Small and Medium Business Banking and was the Officer responsible for Retail Banking Risk Management from July 2010 to 2014. As one of our Officers, he is currently responsible for our Companies and Institutions segment.
Germanuela de Almeida de Abreu. Mrs. de Abreu is Venezuelan and was born on December 6, 1975. She holds a degree in Economics from Universidad Católica Andrés Bello – Caracas/Venezuela with an MBA in Human Resources from USP (Universidade de São Paulo – São Paulo). She completed the Development program for Board Members by Fundação Dom Cabral. She served at Banco da Venezuela (Grupo Santander Caracas) as Senior Risk Analyst from 1999 to 2001. At Santander Brasil, she was senior sales support manager between 2001 and 2002, HR Training Consultant between 2002 and 2003, HR Risk Consultant between 2003 and 2006, Executive Manager of HR between 2006 and 2008 and Superintendent of HR between 2008 and 2013. Still at Santander Brasil, since 2013 she has been responsible for strategy related to performance management, career, compensation, benefits and budget and spending management.
Gilberto Duarte de Abreu Filho. Mr. Abreu is Brazilian and was born on August 7, 1973. He holds a degree in Industrial Engineering from the Universidade de São Paulo and an MBA from the Massachusetts Institute of Technology. Before joining Santander Brasil, Mr. Abreu was a Senior Manager at McKinsey & Company, leading projects in both the financial and retail areas. As one of our Officers, he is currently responsible for the Mortgage, Insurances and Fund-raising Businesses and the Individuals segments. He is also the Chief Executive Officer of Sancap Investimentos e Participações S.A. and ABECIP, Executive Officer of Banco Bandepe S.A. and a member of the boards of directors of Zurich Santander Brasil Seguros e Previdência S.A. and Zurich Santander Brasil Seguros S.A.
Gustavo Alejo Viviani. Mr. Alejo is Argentine and was born on August 26, 1975. He holds a degree in Economics from Pontifícia Universidade Católica PUC – São Paulo/Brasil. He completed Academic Extension courses in Business Administration at University of California-Berkeley and Advanced Corporate Finance at London Business School. From July 1997 to March 1999 he was Junior Analyst of shares and fixed income at Citibank (Brasil). He has served at Santander Brasil since 2000, where he has been a Credit Consultant, Trader, Senior Relationship Manager, Superintendent of Corporate and Investment Banking, Executive Superintendent of Corporate and Investment Banking and Executive Superintendent and executive officer responsible for the Business and Wholesale Recoveries area.
Igor Mario Puga. Mr. Puga is Brazilian and was born on November 10, 1981. He holds a degree in Social Communication from the Casper Líbero School of Social Communication and in statistics and applied research from the Institute of Mathematics and Statistics of the University of São Paulo. Currently, he is adjunct professor of the Alvares Penteado School of Commerce Foundation. After joining IG - Internet Group of Brazil (2000 to 2001) and Terra Networks (2002), he was JWT’s Digital Intelligence Manager from 2003 to 2004 and Africa Propaganda’ s digital media manager (from 2005 to 2006). From 2007 to 2014, as founding partner and general officer, he served in the ID\TBWA group. Between 2014 and 2016 he served as Chief Interactive Officer and then Vice President Officer of Integration and Innovation of the DM9DDB. Mr. Puga joined Santander Brasil in 2016, as the Officer responsible for the Marketing department.
José Teixeira de Vasconcelos Neto. Mr. Neto is Brazilian and was born on March 8, 1975. He holds a degree in business administration from the Universidade de Pernambuco - FCAP and in Economic Sciences from the Universidade Católica de Pernambuco. He completed specialization courses in Finance from FCAP-University of Pernambuco, an MBA in Marketing from Fundação Getúlio Vargas (FGV) and an MBA in Retail (GVPEC) from Fundação Getúlio Vargas (FGV). He was General Manager of the Banco Citibank S.A. from 2000 to 2003. He
served as Commercial Superintendent and Executive Superintendent at Banco Citibank S.A. - Consumer Finance Unit (Citifinancial Financial) from 2003 to 2007. He was Regional Superintendent at Santander Brasil from August 2007 to July 2010. From August 2010 to September 2015 he was Executive Superintendent of Network in Banco HSBC Brasil. He has been serving as one of the officers responsible for our branch network since 2015.
Leopoldo Martinez Cruz. Mr. Cruz is Brazilian and was born on August 19, 1974. He holds a degree in Administration with an emphasis in Finance from PUC-SP, with a specialization in Marketing from ESPM. He began his career in 1996 as an Expert Analyst in planning and strategy for sales and credit analysis at PHILIO MORRIS & KRAFT SUCHARD. In 1999, he served as an expert in asset management product development at CITIBANK – Asset Management. From 1999 to 2000, he worked as a Specialist in Marketing and Private Banking Products at MERYL LYNCH BR – Private Banking. He worked for Accenture PLC from 2005 to 2017, and was a Consultant, Manager, Senior Manager, and subsequently Customer Relationship Manager for the Financial Services Industry. He also served as Officer and head of financial services management, consulting for Latin America and later as Officer and head of the Banking Sector for Latin America. He currently works in the Operations area of Santander Brasil, responsible for the factory of components that serve all platforms, segments and that can be reused by different products.
Luis Guilherme Mattos de Oliem Bittencourt. Mr. Bittencourt is Brazilian and was born on December 4, 1973. He holds a degree in Computer Engineering from the University of Campinas. He started his professional career in Banco Itaú-Unibanco serving in the areas of Business Intelligence, Electronic Channels and CRM, where he acquired 14 years of experience. From 2010 to 2012, in Banco HSBC Brasil, Mr. Bittencourt served in the areas of Distribution, Digital Channels and Customer Relationship Management, or “CRM.” Since 2013, Mr. Bittencourt serves in Santander Brasil, initially as Executive Superintendent of CRM, Digital Channels and Management Information System, Customers Intelligence and CRM and, currently, as the Officer responsible for Commercial Intelligence and Trade Marketing.
Luiz Masagão Ribeiro Filho. Mr. Masagão is Brazilian and was born on September 1, 1976. He holds a degree in Business Administration from the Fundação Getúlio Vargas and from the LEAD Program from IE Business School. He started his career in 1997, serving as Operator of Interest Rates Options in Brazil at Banco Citibank S.A. until 2005. He was the Senior Operator of Foreign Exchange Options from February 2005 to September 2005 in ING Bank N.V. Back to Banco Citibank S.A., he was Executive Manager from 2005 to 2008 and Superintendent from 2008 to 2009. He served as Executive Superintendent of Fixed Income Sales from 2009 to 2010 at Morgan Stanley and, then, joined Santander Brasil’s team, initially serving as Chief of the GCB/Corporate Sales team, from 2010 to 2014, and last as Brazil’s Sales Executive Superintendent. Currently, he is the Officer responsible for the departments of sales and management of the markets area products, including foreign exchange transactions, derivatives and fixed income products to all customers segments of Santander Brasil (retail, corporate and GCB).
Marcelo Malanga. Mr. Malanga is Brazilian and was born on May 18, 1969. He holds a degree in Business Administration from Universidade de São Paulo and a master’s degree in Finance and Accounting from Pontifícia Universidade Católica – PUC-SP. He has 25 years of experience in the financial markets. He served as Division Manager at Banco do Brasil S.A. from 1987 to 2001. From 1998 to 2001, he was responsible for the Governments Business’ strategy in Brasília, serving as PROEX manager. In 2001, as Santander Brasil’s employee, he was responsible for building business relationships with state and local governments until 2004. From 2006 to 2009, he served as the superintendent responsible for the management and administration of several lines of business of Santander Brasil in the State of Rio de Janeiro. From 2009 to 2012, he was responsible for the overdue assets collection of Santander Brasil, Banco Real and Aymoré CFI, in the retail and wholesale segments. From 2012 to 2013, he was responsible for the Companies segment. Since 2013, he has served as a Branch Executive Superintendent.
Marino Alexandre Calheiros Aguiar. Mr. Aguiar is Portuguese and was born on May 14, 1971. He graduated with a degree in Business Administration from the Technical University of Lisbon and an MBA in Information Technology and Internet. Mr. Aguiar started his career in 1994 as a systems analyst at Accenture in Portugal, responsible for Functional Design and Technical Computer Systems. From 1996 to 1999, he had the task of coordinator and in 1999 became manager responsible for providing consulting and technology services to banking institutions in Portugal and Brazil. He held the position of Senior Manager from 2002 to 2006, and was an Officer from 2006 to 2008, with responsibility for developing the commercial and relationship strategy of the insurance segment. Between 2008 and 2010, he worked for CPM Braxis as an Officer, with responsibility for the technology program of a major financial institution in Brazil. In 2010, he was a statutory officer at Accenture Brazil, with responsibility for technology services to the financial industry in Latin America. He is currently one of our Officers, and is responsible for our technology area in the Vice Presidency of Proceedings, Technology and Operations unit. He is also Superintendent Executive Officer of Santander Brasil Tecnologia S.A.
Nilton Sergio Silveira Carvalho. Mr. Carvalho is Brazilian and was born on January 1, 1957. He holds a degree in Electric Production Engineering from the Faculdade de Engenharia Industrial. Mr. Carvalho has been engaged in the banking business since 1981. From 1981 to 2005, he worked at Unibanco in several departments. From 2005 to 2008, he served as Operations Officer of Olé Financiamentos. From 2008 to September 2009, he was responsible for the Organization department at Santander. From October 2009 to October 2012, he was responsible for the operations structure of Aymoré CFI. Currently, as an Officer of Santander Brasil, he is responsible for the Security, Premises and Facilities department, and he is also Executive Officer of Banco Bandepe S.A., Rojo Entretenimento S.A., Evidence Previdência S.A. and Santander Capitalização S.A., Deputy Director of Banco RCI Brasil S.A. and Tecnologia Bancária S.A. – TECBAN.
Rafael Bello Noya. Mr. Noya is Brazilian and was born on October 19, 1977. He holds a degree in Business Administration from Universidade de São Paulo and from LEAD Program from IE Business School. He started his career in Citibank, in the division of commercial operations and finance, as analyst and negotiator, from 1996 to 2001, when he joined the local and international risk distribution area, with responsibility for the creation and implementation of new products during the period from 2001 to 2003. He then served as senior negotiator, from 2003 to 2005, and then as Superintendent from 2005 to 2007. He joined Santander Brasil in 2007, and was an Assistant Superintendent from 2007 to 2015, with responsibility for customer coverage in the following sectors: real estate, logistics, aviation, cellulose and paper, industry, cement, construction and infrastructure, steel, energy, petrochemistry and construction materials. Currently, he is an Officer with responsibility for generating local and international capital markets, risk syndication, projects and acquisitions financing and capital and assets structuring. He is also Executive Officer of Atual Companhia Securitizadora de Créditos Financeiros S.A. and Santander Leasing S.A. Arrendamento Mercantil.
Ramón Sanchez Díez. Mr. Díez is Spanish and was born on October 29, 1968. He holds a degree in Economics from the Universidad Autónoma de Madrid and has completed an Advanced Management Program at The Wharton School of Business at the University of Pennsylvania. He served as a Financial Analyst and Portfolio Manager for Santander Brasil’s New York branch from 1992 to 1997 and as an Officer for Strategy and Analysis for Latin American banks at Santander in Madrid from 1997 to 2003. He was an Officer for Strategy and Investor Relations for Santander Brasil from 2004 to 2006, Head of Customer Acquisition from 2007 to 2009, was in charge of our retail banking channels (call center, Internet, mobile and ATM) from 2009 until 2011 and before his current position was the Head of Retail Commercial Planning and Communication. Mr. Díez was President of the Spanish Chamber of Commerce in Brazil, between 2006 and 2009. As one of our Officers, he is responsible for our compliance department. He also serves as Executive Officer of Banco Bandepe S.A.
Reginaldo Antonio Ribeiro. Mr. Ribeiro is Brazilian and was born on May 19, 1969. He holds a degree in Economics from the Universidade Estadual de Campinas, an Accounting degree from the Universidade Paulista and an MBA from the Fundação Instituto de Pesquisas Contábeis, Atuariais e Financeiras – FIPECAFI of the Universidade de São Paulo. He served as a manager for Arthur Andersen Consultoria Fiscal Financeira S/C Ltda. from 1990 to 2001. He was also a member of the Fiscal Council of Companhia Energética de São Paulo and AES Tietê from 2002 to 2006. As one of our Officers, he is responsible for tax issues, planning strategies and corporate reorganization processes. He also serves as Executive Officer of Aquanima Brasil Ltda., Atual Companhia Securitizadora de Créditos Financeiros S.A., Banco Bandepe S.A., Fundação Santander and Santander Holding Imobiliária S.A., Vice-President Officer of Santander Corretora de Seguros, Investimentos e Serviços S.A. and Administrative Officer of Norchem Participações e Consultoria S.A.
Roberto de Oliveira Campos Neto. Mr. Campos is Brazilian and was born on June 28, 1969. He holds a degree in Economics and a specialization degree in Economics with a focus on Finance from the University of California, Los Angeles. He worked at Banco Bozano Simonsen from 1996 to 1999, where he served as Operator of Derivatives of Interest and Foreign Exchange (1996), Operator of External Debt (1997), Operator of the Area of Stock Exchanges (1998) and Head of the Area of International Fixed Income (1999). From 2000 to 2003, he served as Head of the International Area and Fixed Income in Santander Brasil. In 2004, he served as Portfolio Manager of Claritas. He joined Santander Brasil in 2005 as Operator and in 2006 he was Head of the Trading Desk. In 2010, he became responsible for the Proprietary Trading and Market Making Local & International. He is currently responsible for our treasury department. He also serves as Executive Officer of Banco Bandepe S.A.
Robson de Souza Rezende. Mr. Rezende is Brazilian and was born on January 24, 1967. He holds a degree in Statistics from Universidade Salgado de Oliveira – RJ. He started his career at Unibanco, where he served between 1985 and 1999 in the Management of the Formation and Development area focused on the Branches of Unibanco
and Chief Manager of the Branch Network. Mr. Rezende joined Santander Brasil in 1999. From 1999 to 2003, he served as Human Resources Superintendent. From 2003 to 2008, he served as Regional Superintendent. From 2008 to 2010, he served as Commercial Model Superintendent, a period in which he participated in the Commercial Model Integration of Santander Brasil and Banco Real. Currently, he is responsible for the Rio de Janeiro and Espírito Santo branch networks, directly managing approximately 330 branches.
Rodrigo Cury. Mr. Cury is Brazilian and was born in July 17, 1976. He holds a degree in Advertising and Marketing from Mackenzie University. He completed his MBA in Financial Management from the CEF, Madrid, and Innovation and Entrepreneurship from Stanford University. He was Manager of Credit Policies and Scoring from 2005 to 2007 at Spain Citifinancial. At Barclays Bank Spain, he served as Officer of Consumer Lending, Mortgages & Cards from 2008 to 2011, and as Head of Consumer Finance Credit Risk from 2007 to 2008. He worked at Citi from 2011 to 2015 as Head of Credit Cards for Central America and Caribbean and Executive Superintendent of Citi Credit Cards Brazil. He has been serving in the Cards, Bills and Rates area at Santander Brasil since 2015.
Ronaldo Wagner Rondinelli. Mr. Rondinelli is Brazilian and was born on August 2, 1973. He holds a degree in Economics from FAAP – Fundação Armando Álvares Penteado, and in Business Finance from FIA USP. From 1994 to 1996, he served in Banco Fenícia S.A. as Junior Information Analyst. Between 1996 and 1997, he served in Banco Santos as Analyst of Planning and Control – Managerial Information. In 1997, he served in Banco Real and ABN AMRO Bank as Senior Analyst of Managerial Information. Between 1997 and 1999, he served as Assistant to the Vice-President – Financial Control Coordination in Banco Real and ABN AMRO Bank, where he was responsible for the coordination of the finance areas in several countries of Latin America. Between 1999 and 2000, he served as Latin America Regional Controller for Banco Real and ABN Amro Bank. Between 2000 and 2004, he served as Planning and Control Superintendent at Banco Real and ABN AMRO Bank, where he was responsible for the management of the MIS area, local results reports and Head Office of Banco Real/ABN AMRO. In 2004, he served as Executive Superintendent of Strategic Decisions Support at Banco Real and ABN AMRO Bank, where he was responsible for the management of the areas of Planning, Budget, local Results Reports and Head Office of Banco Real/ABN AMRO. Between 2004 and 2008, he served as Presidency and COMEX Advisory Executive Superintendent in Banco Real and ABN AMRO Bank, where he served as Secretary of the Executive Committee and Executive Board of Officers of Banco Real and Assistant of the Chief Executive Officer of the bank. He joined Santander Brasil in 2008 and served as Executive Superintendent (Aymoré CFI) between 2008 and 2015, with responsibility for the management of the areas of Products, Prices, Segments, Auto Financing at the Branches of Santander Brasil, Planning and Partnerships with automobile manufacturers. Currently, he is responsible for our Universities’ segment and is an Executive Officer of Universia Brasil S.A.
Sérgio Gonçalves. Mr. Gonçalves is Brazilian and was born on August 7, 1956. He holds a degree in Economics from Fundação Armando Álvares Penteado, São Paulo, with an International Executive MBA degree from the Universidade de São Paulo. Since November 2000, he has been one of our Officers, and he is currently responsible for the Companies, Government & Institutions departments. He worked as Corporate Banking Officer for 16 years (from 1979 to 1994) at Banco Crefisul, associate of Citibank. From 1995 to 2000, he was Products Officer at Banco Nossa Caixa (now, Banco do Brasil S.A.).
Thomas Gregor Ilg. Mr. Ilg is Brazilian and was born on September 12, 1968. He holds a degree in Agricultural Engineering from the Universidade Estadual de Campinas, and a postgraduate diploma in Business Administration from the Fundação Getúlio Vargas. He has been engaged in the financial markets for almost 26 years, including 15 years with Santander Brasil and 10 years with The First National Bank of Boston, where he first joined as a Trainee in the Risks and Business areas. At Santander Brasil, he was responsible for the Corporate Banking Business until the beginning of 2007 when he joined our Treasury Division to develop an area designed to distribute derivatives to the Middle Market, Private Banking and Retail Business in general. At the end of 2008, he moved to the Credit Division to manage the Corporate Banking Risk Area, and now, as an Officer, he is responsible for our retail risks function. He is also deputy director of Banco RCI Brasil S.A.
Ulisses Gomes Guimarães. Mr. Guimarães is Brazilian and was born on March 14, 1971. He holds a degree in Mechanical Engineering from ITA – Instituto Tecnológico de Aeronáutica and an Executive MBA in Finance from IBMEC. He started his career as trainee and, then, as an analyst at Citibank from 1994 to 1997. He was manager, then Executive Superintendent at Banco Real/ABN AMRO Bank from 1997 to 2007. Starting in 2007, he was an Officer of Santander Brasil, with responsibility for the Human Resources area from 2007 to 2012. From 2012 to 2015 he served in Santander Spain as Executive Superintendent in the area of compensation and mobility politics. Currently, back to Santander Brasil, he serves as one of our Officers, with responsibility for the implementation of the Finance transformation program.
Certain Arrangements and Relationships
We have no knowledge of any arrangement or understanding with major shareholders, customers, suppliers or any other person pursuant to which any person was selected as a director or executive officer. None of the members of our board of directors or of our board of executive officers have any family relationships with each other, or with any other members of our senior management.
6B. Compensation
Compensation of Directors, Executive Officers and Members of Audit Committee
Our shareholders establish the maximum annual aggregate compensation of our directors and officers at the annual shareholders’ meeting. Compensation of the members of our audit committee is established by our board of directors.
All members of the board of directors are entitled to a fixed compensation composed of monthly fees and benefits within the overall limit set by the annual compensation approved at our annual general shareholders’ meeting. In exceptional and fully justified cases, the chairman of our board of directors may also receive an annual variable compensation for his or her duties as determined by the compensation committee and the board of directors, within the annual limit set forth by the annual shareholders meeting. If granted, such variable compensation should consider the form of payment and the different deferral percentages, according to the level of variable compensation received in the year, and observe the Malus clause with the possibility of reducing up to 100% of the value of the variable compensation in the assumptions.
In the cases where a member of the board of directors is also a member of our audit committee, pursuant to the applicable regulations and the internal regulations of the audit committee, such member must choose to receive the remuneration package of only one of the bodies. Regarding the other advisory committees, if one of the members of the board of directors becomes a member of it, in addition to the corresponding remuneration as a member of the board of directors he or she will be entitled to an additional compensation per meeting held in the relevant advisory committee, approved by the compensation committee.
The members of the board of executive officers are entitled to compensation composed of monthly payments, benefits, pensions and variable remuneration, always within the overall limit of the annual compensation approved at the annual general shareholders’ meeting.
The variable compensation shall be paid considering the different deferral percentages depending on the level of the variable compensation received in the year (includes amount of Long-Term Incentive - ILP in the year of grant, valued at the granting price), and observe the Malus clause with the possibility of reducing up to 100% of the value of the variable compensation in the assumptions.
The following payment summarizes the applicable rules of payment as of December 31, 2017.
2018 | 2019 | 2020 | 2021 |
At the time of the award | Deferred |
| 30% in cash | Remaining 20% in cash |
| Payment calculated on ⅓ cash awarded | Payment calculated on ⅓ cash awarded | Payment calculated on ⅓ cash awarded |
30% in units
(with one year lockup) | Remaining 20% in units |
| Payment calculated on ⅓ units awarded | Payment calculated on ⅓ units awarded | Payment calculated on ⅓ units awarded |
If the amount of the variable compensation is between R$5.5 million and R$8 million, the deferral is 50%, 25% of which is deferred and paid in cash and the other 25% is paid in up to five tranches of units with a one-year lock-up each. If the variable compensation amount is equal to or greater than R$8 million, the deferral is 60%, 30% of which is deferred and paid in cash and the other 30% is paid in up to five tranches of units with a one-year lock-up each. In the case of the Chief Executive Officer, the deferral in this program is at least 50%, with at least 25% paid in accordance with each of the items mentioned above.
Under Brazilian law, companies are required to disclose the highest, lowest and average compensation of our directors, members of the audit committee and officers without indicating any individual name. However, as members of the Brazilian Institute of Finance Executives (Instituto Brasileiro de Executivos de Finanças – IBEF) we were granted an injunction on March 2, 2010, allowing us not to disclose this information.
Shareholders at the general shareholders meeting held on April 28, 2017 set compensation for our directors and executive officers at a total of up to R$300 million and for our audit committee at a total of up to R$3.0 million for the 12-month period starting on January 1, 2017, as proposed by the board of directors at the meeting held on March 28, 2017. For the abovementioned twelve-month period, members of our board of directors and executive officers received a total of approximately R$211 million and members of our audit committee received a total of approximately R$2.63 million. The total amount of contributions for pension plans of our board of directors in 2017 was R$4.5 million.
The criteria for granting and paying variable compensation vary according to the activities performed by the different areas and, therefore, payment of the variable compensation may differ depending on the department and activities performed by each member. Pursuant to Brazilian law, variable compensation is required to be compatible with the financial institution’s own risk management policies. At least 50% of variable compensation must be paid in stock or stock-based instruments and at least 40% of variable compensation must be deferred for future payment by at least 3 years. These rules are effective as from January 1, 2012.
As approved by our board of directors at the meeting held on December 23, 2009, we indemnify our directors and executive officers and members of the audit committee from claims arising during the time they occupy their respective offices, exclusively related to court or administrative costs and attorneys’ fees, except in cases of bad faith, gross negligence, willful misconduct or mismanagement by our directors or executive officers. This indemnity was also granted to the members of the audit committee and the compensation committee.
Compensation Plan Overview
We have four programs for long-term compensation: (i) the Deferral Program; (ii) the Stock Option Plan; (iii) the First Long-Term Incentive Global Plan CRDIV – Grant 2014; and (iv) the Second Long-Term Incentive Global Plan CRDIV – Grant 2015.
Executive officers and executives in key positions are eligible to participate in these plans. The plans last three years promoting our executive officers and executives’ commitment to our long-term results. Members of the board of directors can participate in these plans only if they are executive officers, otherwise, the board members are not eligible to participate in any of these plans.
Deferral Program
Our deferral program is available to our statutory officers, officers in positions of management and certain other eligible employees. As part of the deferral program compensation, we defer between 40% and 60% of the variable compensation of an employee over a period of three to five years, depending on the employee’s level of responsibility.
Our deferral program aims to (i) align the program with the principles of the Financial Stability Board, or “FSB,” agreed upon at the G20; (ii) align our interests with those of the plan’s participants (to achieve sustainable and recurring growth and profitability of our businesses and to recognize the participants’ contributions); (iii) allow the retention of participants; and (iv) improve our performance and protect the interests of shareholders via a long-term commitment.
Pursuant to Brazilian law, payments made under the deferral program are subject to total or partial cancellation, or claw back, in cases of: (i) our unsatisfactory financial performance (financial results audited lower than as defined in our business plan or loss in the period); (ii) failure to comply with internal policies, especially policies for risk management (with the need for reclassification of operations or revision of provisions); (iii) substantial change in our financial condition, unless arising from changes in accounting standards (damages, financial loss); or (iv) significant changes in our share capital or risk profile. If the board of directors deems it necessary, it may also take into account any change in the capital base of the Santander Group.
We renew and update our deferral program every year. As of December 31, 2017, we had three plans outstanding: one for each fiscal year: 2014, 2015, 2016 and 2017. As of December 31, 2017, we recorded total expenses of R$206.764 million in connection with our Deferral Program compared to total expenses of R$132.294 million in 2016.
Deferral Program – 2014, 2015, 2016 and 2017
Our 2014, 2015, 2016 and 2017 deferral programs were divided in two programs:
| · | Collective Identified. Statutory officers and executives who take significant risks in Santander Brasil and are in charge of the control areas. Deferred compensation will be paid 50% in cash, indexed to 100% of the CDI, and 50% in Units. |
| · | Collective Unidentified – Employees. Individuals eligible for this program include manager employees and certain of our other employees. Deferred compensation will be paid 100% in cash, indexed to 100% of the CDI. |
Stock Option Plan – SOP
The Stock Option Plan, or SOP is an option plan to purchase our Units for our top management. The objective of this plan is to retain our employees’ commitment to long-term results.
During the fiscal year 2017, a total amount of options equivalent to R$17.8 million was exercised under the current SOP 2013 plan.
Our Stock Option Plan consists of three-year stock option plans to purchase our Units. The period for exercising the options is within two years of the vesting period. The volume equivalent to 40% of the Units resulting from the exercise of options cannot be sold by the participant during a period of one year from the exercise date. Plan participants must remain with us during the term of the plan in order to be eligible to exercise their options on their corresponding Units.
Incentive Plan Long-term – SOP 2013
On April 29, 2013, our shareholders approved the grant of the SOP 2013 plan, with an exercise period between June 30, 2016 and June 30, 2018. The number of Units exercisable by the participants was determined according to the total shareholder return, or “TSR” and reduced according to the result of the modifier return on risk-weighted assets, or “RoRWA,” based on a yearly comparison between realized and budgeted performance. The options issued under the plan have an option price of R$12.84 per Unit. Approximately 89.61% of the total number of Units available for delivery under the plan were delivered following the RoRWA-based adjustment described above once participants who lost the right to receive Units were excluded. On December 31, 2017, there were 1,117 outstanding options under the plan.
Fair Value and Performance Parameters of SOP
For the accounting of the local program’s plans, simulations were performed by an independent consultant, based on the Monte Carlo methodology, using the performance parameters used to calculate the shares to be granted. These parameters are associated with their respective probabilities of occurrence, which are updated at the closing of each period.
TSR Ranking | SOP 2013(1) |
| | (% of Shares exercisable) |
| 1 | 100% |
| 2 | 75% |
| 3 | 50% |
| 4 | 0% |
| (1) | The percentage of shares determined at the position of TSR is subject to reduction in accordance with the implementation of the reduction of Return on Risk-weighted Assets (RoRWA). |
Global Long-Term Incentive Program
First Long-Term Incentive Global Plan CRDIV – Grant 2014
In 2014, a long-term incentive plan was created for the overall group of executives included in the Collective Identified (“Global Plan CRDIV”). The indicator is used to measure the achievement of targets which will form a basis for comparison of the Total Shareholder Return (“TSR”) of the Santander Group with the TSR of the top 15 global competitors.
The indicator is calculated in two stages: initially for program verification (2014) and subsequently in the annual payment of each installment (2015, 2016 and 2017).
For program verification purposes, the established achievement threshold is such that for 100% of the plan to be applied, it is necessary that the Santander Group be positioned above the average of global competitors, as shown below. This measurement will be performed considering the TSR between January and December 2014.
TSR Position | % Applied |
| 1st to 8th | 100.0% |
| 9th to 12th | 50.0% |
| 13th to 16th | 0.0% |
For the payment of an installment of one third of the value determined, the TSR will be determined as shown below. The position of the Santander Group in the ranking of TSR will be measured considering the position accumulated until the year before each payment.
TSR Position | % To Distribute |
| 1st to 4th | 100.0% |
| 5th | 87.5% |
| 6th | 75.0% |
| 7th | 62.5% |
| 8th | 50.0% |
| 9th to 16th | 0.0% |
Each executive has a target inreais, which was converted into shares of the Santander Group for a price of R$19.2893, which will be delivered in installments in 2016, 2017 and 2018, with a lock-up of one year after each delivery.
In the year ended December 31, 2017 there were no expenses related to cycle costs of the first Global Long-Term Incentive Program.
Second Long-Term Incentive Global Plan CRDIV – Grant 2015
In 2015, a second global long-term incentive plan was created for executives included in the Identified Collective (CRDIV Global Plan). The indicators that will be used to measure the attainment of the targets are presented below and will be used at two different stages: (i) to calculate the maximum target of each participant (2015-2016); and (ii) to calculate the amount of shares to be paid (2016, 2017 and 2018).
1. TSR vs. Competitor
RTA in 2015
(% on the RTA 2015 budgeted) | “Coefficient RTA 2015” |
| ≥ 90% | 1 |
| > 75% to < 90% | 0.75 – 1 (*) |
| ≤ 75% | 0 |
| (*) | Linear increase of the RTA 2015 coefficient in function of the concrete percentage that the RTA 2015 represents on the budget of this scale line. |
2. ROTE Bank (Return on Tangible Equity) vs Budgeted
ROTE in 2015
(% on the ROTE 2015 budgeted) | “Coefficient ROTE 2015” |
| ≥ 90% | 1 |
| > 75% to < 90% | 0.75 – 1 (*) |
| ≤ 75% | 0 |
| (*) | Linear increment of the ROTE 2015 coefficient in function of the concrete percentage that the ROTE 2015 represents on the budget of this scale line. |
3. Employees Satisfaction
Position among the best banks to work in 2017 | “Coefficient Employees” |
| 1st to 3rd | 1 |
| 4th or subsequent | 0 |
4. Client satisfaction
Position among the best banks according to client satisfaction index in 2017 | “Coefficient Clients” |
| 1st to 3rd | 1 |
| 4th or subsequent | 0.5 – 1 (*) |
5. Business bindings vs Budgeted
Clients companies 1 and 2 linked
(% on budget for the corresponding market) | “Coefficient Companies” |
| ≥ 100% | 1 |
| > 90% and < 100% | 0.5 – 1 (*) |
| ≤ 90% | 0 |
| (*) | Linear increment of the coefficient companies according to the concrete percentage, within these lines of each scale that the number of linked clients of each type represents on December 31, 2017 on the budgeted. |
Each executive has a target inreais, which has been converted into Santander Group shares for a price of R$17.473 which will be delivered in 2019, with a lockup of one year after each delivery.
In the year ended December 31, 2017, “pro rata” expenses in an amount of R$4,797 million were recorded relating to costs on the respective dates of the cycles of the global program. The expenses related to the plans are recognized as “Other liabilities—Provision for share-based payments.”
Contract termination
Employment contracts have an undefined period. The termination of the employment relationship for non-fulfillment of obligations or voluntarily does not entitle executives to any financial compensation.
Pension and Retirement Benefits
Members of our board of directors and our executive officers may enroll in our retirement plan, SantanderPrevi, while they are affiliated with Santander Brasil. For further information on SantanderPrevi, please see “— D. Employees.”
6C. Board Practices
Our shareholders elect members of our board of directors at the annual general shareholders’ meeting for two-year terms (members may be reelected). The board of directors appoints our executive officers for two-year terms (members may be reelected).
The current members of the board of directors were elected at the ordinary shareholders meeting held on April 28, 2017 and at the extraordinary shareholders meeting held on July 20, 2017, to serve until the ordinary shareholders meeting to be held in 2019. The current executive officers were elected at the board of directors meetings held on May 2, 2017, August 25, 2017, November 1, 2017, February 1, 2018 and February 26, 2018, with terms of office until the first board of directors meeting occurring after the ordinary shareholders’ meeting to be held in 2019.The board of directors meets normally four times in each year, but meetings may be held more frequently if the chairman of the board of directors so wishes. The executive officers meet as often as required by the chief executive officer or by the person designated by him.
On August 31, 2017, our board of directors approved its regulations. Shareholders may access such code on the website www.ri.santander.com.br, in the section entitled “Corporate Governance—Management—Regulations of the Board of Directors.” The information contained on our website, any website mentioned in this annual report, or any website directly or indirectly linked to these websites, is not part of and is not incorporated by reference in, this annual report.
Fiscal Council
According to Brazilian Corporate Law, the adoption of a permanent fiscal council by us as a publicly held company is voluntary. Our By-Laws provide for a nonpermanent fiscal council, which can be installed at the request of shareholders representing at least one-tenth of the voting shares or five percent of the nonvoting shares. Currently our fiscal council is not installed. The fiscal council is an independent body elected by shareholders to supervise the activities of managers and independent auditors. The responsibilities of the fiscal council are established by Brazilian Corporate Law and include oversight of management’s compliance with laws and By-Laws, the issuance of a report on the company’s annual and quarterly reports, certain matters submitted for shareholders’ approval, calling of shareholders’ meetings in some cases and reporting on specific matters arising at those meetings.
Board Advisory Committees
Audit Committee
According to Brazilian Central Bank regulations, an audit committee is a statutory board, separate from the board of directors, created by a shareholders’ resolution. The members of the audit committee may be members of the board of directors, provided that they meet certain independence requirements. All members of our audit committee meet such independence requirements. In addition, under Brazilian law, the function of hiring independent auditors is reserved for the board of directors. As a result, as specified in Section 3(a)(58) of the Exchange Act, our board of directors functions as our audit committee for the purpose of approving any engagement of our independent auditors for audit and non-audit services provided to our subsidiaries or to us. Except in these respects, our audit committee performs the functions of audit committees of U.S. companies. For more information, see “Item 16D. Exemptions from the Listing Standards for Audit Committees.”
Our audit committee is composed of three to six members, elected by our board of directors, among persons, members of the board of directors and others, who meet all statutory and regulatory requirements for the exercise of their office, including any requirements to ensure their independent judgment who shall serve for a one-year term and may be reelected pursuant to applicable legislation for up to four consecutive times to a maximum five-year term of office. One of the members shall be designated as the audit committee’s coordinator, and at least one member must have proven knowledge in the areas of accounting and auditing (financial expert).
Our audit committee has as its main functions:
| · | to advise the board of directors on the engagement or replacement of the independent auditor; |
| · | review, prior to publication, the interim financial statements, including the notes, the management report and the opinion of the independent auditor; |
| · | to evaluate the effectiveness of the independent and internal audits, including in regard to compliance with normative provisions applicable to us, in addition to internal regulation and codes; |
| · | to evaluate the fulfillment by our management of the recommendations made by the independent or internal auditors; and |
| · | to prepare, at the end of the six-month period ended on June 30 and December 31 of each year, the report of the audit committee, meeting the applicable legal and regulatory provisions. |
The current members of the audit committee are Luiz Carlos Nannini, who acts as financial expert and Elidie Palma Bifano, Julio Sergio de Souza Cardozo and José Luciano Duarte Penido, who act as coordinator. Our audit committee meets ordinarily once a month. The current members of the audit committee were appointed on May 2, 2017 to serve until the first board meeting after the ordinary shareholders’ meeting to be held in 2018.
Set forth below are the biographies of the members of our audit committee:
Elidie Palma Bifano. Mrs. Bifano is Brazilian and was born on May 16, 1947. She holds a bachelor’s degree in Law and Social Sciences from the Faculdade de Direito da Universidade de São Paulo. She holds a specialization degree in Tax Law from Universidade de São Paulo and Pontifícia Universidade Católica de São Paulo and a Master’s Degree and a Doctorate in Tax Law from Pontifícia Universidade Católica de São Paulo. From 1974 to 2012 she worked at PricewaterhouseCoopers, where she served as a partner in the tax advisory department for more than 20 years. In June 2012, she became a partner at Mariz Oliveira e Siqueira Campos Advogados. She is also a professor of postgraduate studies at Universidade de São Paulo, Pontifícia Universidade Católica, Fundação Getúlio Vargas, Instituto Brasileiro de Estudos Tributários and Instituto Brasileiro de Direito Tributário, or “IBDT.” For more than 18 years she has been serving as Chief Financial Officer of the Brazil-Canada Chamber of Commerce. She is also a member of the International Tax Law Magazine’s Editorial Council, at Quartier Latin Publishing. She has been a member of the Audit Committee of Santander Brasil since 2012.
Luiz Carlos Nannini. Mr. Nannini is Brazilian and was born on January 2, 1960. He holds a degree in Accounting Sciences, with several specialization courses in Brazil and abroad, including a leadership course at Harvard. He has more than 30 years of experience in the conduct of independent audit services, including: the preparation of financial statements in accordance with IFRS and U.S. GAAP; due diligence; implementation of internal controls (including IT); corporate restructuring; tax planning and affairs; and participation in advisory councils in Brazil, the U.S. and globally.
Julio Sergio de Souza Cardozo. Mr. Cardozo is Brazilian, born on August 18, 1944. He holds a degree in Accounting and Business Administration from Universidade Presbiteriana Mackenzie Rio de Janeiro and PhD equivalent in Finance and Internal Controls from Rio de Janeiro State University, where he acted as Auditing and Accounting professor at the undergraduate and master degree levels until August 2016. From 1985 to 2001, he served as Audit Partner at Ernst & Young Brazil. From 2001 to 2007, he held the position of CEO and Chairman of the Board of Ernst & Young Brazil, as well as Board Member of Ernst & Young Americas (New York). During the same time, he served as CEO and Chairman of the Board of Ernst & Young South America. He served as Fiscal Council member of USIMINAS, Centrais Elétricas de Santa Catarina and BRADESPAR. Also, served as Board of Directors member and Audit Committee Coordinator with Administradora de Cartões de Crédito AVISTA S.A. Currently, Mr. Cardozo is the managing partner of Julio Sergio Cardozo & Associados Consultoria de Negócios Ltda.; Member of the Board of Directors of Saraiva S.A.-Livreiros e Editores; Member coordinator of the Audit Committee of Fibria Celulose S.A.; Fiscal Council member of Centrais Elétricas do Ceará and professor of the MBA Program in finance with Fundação Getúlio Vargas.
José Luciano Duarte Penido. See “—Members of the Board of Directors.”
Compensation Committee
In compliance with regulations issued by the Brazilian Central Bank (specifically, CMN Resolution No. 3,921/2010 of November 25, 2010), on February 7, 2012 our shareholders established the compensation committee in our by-laws, which also acts as the compensation committee for certain of our affiliates and subsidiaries.
Our compensation committee is composed of three to five members, appointed by the board of directors from among persons who meet all statutory and regulatory requirements for the exercise of their office. At least one of the members cannot be an executive officer and the others may or may not be members of our board of directors, and at least two members shall be independent, pursuant to paragraph 3 of article 14, of our By-Laws. The compensation committee shall have in its composition qualified members with the experience required for the competent and independent judgment about our internal compensation policy and the repercussion of this internal compensation policy on the risk management. Such persons shall serve for a term of two years and may be reelected for up to four consecutive times, pursuant to applicable legislation.
Our compensation committee has as its main functions:
| · | develop internal compensation policies applicable to our management and makes proposals to our board of directors regarding policies for variable and fixed compensation, benefits, and special programs for recruiting and terminations; |
| · | to supervise the implementation and coming into operation of the compensation policy for our management; |
| · | to propose to the board of directors the aggregate compensation of our management to be submitted to the general meeting, pursuant to Article 152 of Brazilian Corporate Law; |
| · | to analyze our internal officer and board compensation policies and procedures in comparison with market practice, and recommends changes to align our policies with market practice if significant differences from market practice are identified; |
| · | to prepare annually, within ninety days as from December 31 of each year, the compensation committee report, in accordance with applicable statutory and regulatory provisions; and |
| · | to ensure that the management compensation policy is compatible with our risk management policy, the goals and current and expected financial condition, as well as with the provisions set forth in applicable regulatory provisions and regulations published by the Brazilian Central Bank. |
The current members of the compensation committee are Deborah Patricia Wright (who acts as coordinator), Álvaro Antonio Cardoso de Souza, Celso Clemente Giacometti and Luiz Fernando Sanzogo Giorgi. The current members of the compensation committee were appointed on May 2, 2017 to serve until the first board of directors meeting occurring after the ordinary shareholders’ meeting to be held on 2019.
Set forth below are the biographies of the members of our compensation committee:
Deborah Patricia Wright. See “—Members of the Board of Directors.”
Álvaro Antonio Cardoso de Souza. See “—Members of the Board of Directors.”
Celso Clemente Giacometti. See “—Members of the Board of Directors.”
Luiz Fernando Sanzogo Giorgi. Mr. Giorgi is Brazilian and was born on September 3, 1964. He has a bachelors’ degree in Business Administration fromFundação Armando Alvares Penteado(FAAP) and over 26 years of experience in management. He started his career in 1982 at Price Waterhouse, where he worked until 1986, and, then at Embraer, where he worked between 1986 and 1989. From 1989 to 2003, he worked as a consultant and director at Hay Group, and from 2003 to 2005, he worked for the Suzano Group as a vice chairman of Suzano Holding. He was a member of the Management Committee of the Board of Directors of Suzano Papel e Celulose, Chief Executive Officer of Suzano Petroquímica, and a full member of the Board of Petroflex. In September of 2005, he founded LFG – Assessoria em Gestão Empresarial e Liderança. From 2007 to 2015, he served as a member of the Board of Directors of Santher S.A.; from 2007 to 2011, he served as a full member of the Board of Directors of J. Macedo Alimentos S.A.; in 2008, he served as a full member of the Board of Directors of Vix Logística S.A.; from 2007 to 2008, he served as a member of the HR Committee of the Board of Directors of Grupo Libra S.A.; and in 2013, he served as a member of the Board of Directors of Itautec S.A. Currently, he serves as a member of the Boards of Directors of Vonpar S.A. and Empresas Concremat. He is also a member of the Advisory Board of Heads Agencia De Propaganda and chairman of the Board of Directors of Teadit S.A. He holds the position of member of the HR Committees of Sul América Seguros S.A., Lojas Marisa S.A., and Martins Atacadista S.A. He is also a member of our Nomination and Governance Committee.
Risk and Compliance Committee
The risk and compliance committee is a consultative body, which has the responsibility of advising our board of directors on subjects related to the policies, operational directions and methodologies of capital allocation, risk management and exposure edges, according to the applicable law, as well as advising on compliance practices that enhance our management, regarding the transparency and the monitoring of the compliance functions of the institution.
The risk and compliance committee is composed of three to six members, provided that the majority of them: (i) may not be, nor may they have been, employees of Santander Brasil in the last six months prior to their appointment; (ii) may not be the spouse or relative of a person referred to in item (i) of this list; (iii) cannot receive from us any compensation that does not relate to their role as a member of the risk and compliance committee or the board of directors; (iv) must have experience in risk management; and (v) may not be a controlling shareholder of
Santander Brasil nor participate in decisions at the executive level. The term of office is of two years, re-election permitted, and the members may be removed at any time. The risk and compliance committee meetings are held at least four times a year or when extraordinarily convened by its coordinator.
The current members of the risk and compliance committee are Deborah Stern Vieitas (who acts as coordinator), Álvaro Antônio Cardoso de Souza, Conrado Engel, José de Paiva Ferreira, Bernardo Parnes and René Luiz Grande. The current members of the risk and compliance committee were appointed on May 2, 2017 to serve until the first board of directors meeting occurring after the ordinary shareholders’ meeting to be held in 2019.
Deborah Stern Vieitas. See “—Members of the Board of Directors.”
Álvaro Antônio Cardoso de Souza. See “—Members of the Board of Directors.”
Conrado Engel. See “—Members of the Board of Directors.”
José de Paiva Ferreira. See “—Members of the Board of Directors.”
Bernardo Parnes. Mr. Bernardo was CEO of Deutsche Bank Latin America and Chief Country Officer of Deutsche Bank Brazil. At Deutsche Bank, he was also a member of the Americas’ Executive Committee, the Regional Management Executive Committee and the Latin American Advisory Board. Prior to Deutsche Bank, he was CEO of Banco Bradesco BBI S.A., and before that, he was CEO of JSI Investimentos Ltda., Part of the Safra Group. Mr. Bernardo also worked for 14 years at Merrill Lynch, where he was Country Head of Brazil, and worked for 7 years at Citigroup in Brazil. He is currently a member of the board of directors of Albert Einstein Hospital, MASP (São Paulo Art Museum) and Unibes (Brazilian Israeli Social Welfare Union), as well as a member of the Arlon Advisory Board in Latin America.
René Luiz Grande. Mr. Grande is Brazilian and was born on April 19, 1953. He holds a degree in Economics from Pontificia Universidade Católica de São Paulo, and a specialization degree in National Financial System from Fundação Instituto de Administração. He was an employee of the Brazilian Central Bank, qualified by the public examination since June, 1975, and worked in the Supervision and Inspection Department of the National Financial System. During his career in the Brazilian Central Bank he served as an analyst from 1975 to 1978; technical assistant from 1978 to 1989; inspection supervisor from 1989 to 1999; head of the Banking Supervisory and Technical Department from 1999 to 2003, and deputy head of the Banking Supervisory and Financial Conglomerates Department from 2003 to 2011. Before working with the Brazilian Central Bank, he occupied the position of head of Human Resources with the Companhia Brasileira de Embalagens Metálicas BRASILATA from 1973 to 1975.
Nomination and Governance Committee
The nomination and governance committee is a consultative body which is responsible for advising the board of directors on subjects related to the nomination and governance of Santander Brasil.
The committee is composed of three to seven members, and the majority of those members must be independent and, preferably, members of the board of directors. The term of office is of two years, re-election permitted, and the members may be removed at any time. The committee meetings are held at least four times a year or when extraordinarily convened by its coordinator.
The current members of the nomination and governance committee are Celso Clemente Giacometti (who acts as coordinator), Álvaro Antonio Cardoso de Souza, Deborah Patricia Wright and Luiz Fernando Sanzogo Giorgi. The current members of the nomination and governance committee were appointed on May 2, 2017 to serve until the first board of directors meeting occurring after the ordinary shareholders’ meeting to be held in 2019.
Celso Clemente Giacometti. See “—Members of the Board of Directors.”
Álvaro Antonio Cardoso de Souza. See “—Members of the Board of Directors.”
Deborah Patricia Wright. See “—Members of the Board of Directors.”
Luiz Fernando Sanzogo Giorgi. See “—Compensation Committee.”
Sustainability Committee
The sustainability committee is a consultative body which is responsible for advising the board of directors on subjects relating to social and sustainable development issues, including the promotion of sustainable development and other social initiatives.
The committee is composed of three to five members, and at least one of these members must be independent. The term of office is of two years, re-election permitted, and the members may be removed at any time. The committee meetings are held at least four times a year or when extraordinarily convened by its coordinator.
The current members of the sustainability committee are José Luciano Duarte Penido (who also acts as coordinator), Carlos Rey de Vicente, Jean Pierre Dupui and Tarcila Reis Corrêa Ursini. The current members of the sustainability committee were appointed on May 2, 2017 to serve until the first board of directors meeting occurring after the ordinary shareholders’ meeting to be held in 2019.
José Luciano Duarte Penido. See “—Members of the Board of Directors.”
Carlos Rey de Vicente. See “—Members of the Board of Executive Officers.”
Jean Pierre Dupui. See “—Members of the Board of Executive Officers.”
Tarcila Reis Corrêa Ursini. Ms. Tarcila is Brazilian, born on May 9, 1974. She holds a degree in economics from FEA/USP, a law degree from PUC/SP and a master's degree in Development and Law from Kings College, London. Tarcila began her career as a lawyer, with work experiences in Brazil, Spain and England. She was an associated lawyer at Machado, Meyer, Sendancz and Opice from 1997 to 2000 in the corporate and mergers and acquisitions area. Since 2000 she has been working on sustainability strategy, management and research, advising organizations from the most diverse sectors, sizes and cultures. She was manager of the Ethos Institute from 2003 to 2007. She was international representative of Brazil in the development of ISO 26000. Ms. Tarcila was a member of the International Council of Stakeholders of the Global Reporting Initiative (GRI), Netherlands. She is an independent member of Duratex S.A. Board of Sustainability Committee since June 2012, beginning to preside it in 2016; is an independent member of the Sustainability Committee of the Baumgart Group Council since Feb/2017; is an independent member of the Sustainability Committee of Precon Engenharia since 2016. She is a member of the Brazilian Institute of Corporate Governance - IBGC, of the Sustainability Studies Committee since its foundation, was part of the 40th group of Formation Counselors. She is a member of WCD - Women Corporate Directors (IFC / IBGC / KPMG), Women's Leadership Group for Sustainability, Ministry of the Environment and voluntary supporter of various civil society organizations. She is a postgraduate professor in socio-environmental management at FIA. She is co-author of The World Guide to CSR, chapter Brazil, Greenleaf 2009, a collaborator of Communication in Progress of the United Nations Global Compact, co-author of the Term of Reference that defined the Sustainability of the Sebrae System.
Executive Committee
The Chief Executive Officer, Senior Vice President Executive Officers and Vice President Executive Officers make up the executive committee which examines policies for business management, operational support, human resources and capital allocation. It also deliberates on the main technological, infrastructure and services projects.
6D. Employees
On December 31, 2017, we had 47,404 full-time, permanent employees. The following table presents the breakdown of our full-time, permanent employees (in accordance with local criteria) at the date indicated.
| | | As of December 31, 2017 |
| | | 2017 | | 2016 | | 2015 |
| Administrative employees | | | 10,936 | | | | 10.256 | | | | 9,884 | |
| Commercial areas employees | | | 36,468 | | | | 36.996 | | | | 40,140 | |
| Total | | | 47,404 | | | | 47,252 | | | | 50,024 | |
We provide a competitive benefits package, which contributes to the engagement, attraction and retention of our employees. To ensure competitiveness, we compare our annual benefit package to market practices and trends. Policies are developed and offered contemplating the needs of our employees. We also have a policy of providing continuous training to our employees, allowing them to hone their skills and create a more effective team, committed to the values of the group.
We have a profit sharing plan with our employees based on predetermined goals for our annual operating and financial results. As a result, if we meet or exceed certain goals, our employees can share in our financial performance. See “—B. Compensation.”
We also offer our employees a defined contribution pension plan where employees can choose to contribute part of their wages and to which we can also make contributions on behalf of such employees. This plan provides retirement benefits, and disability and death benefits. SantanderPrevi is the only pension plan currently open for new membership. Most of our current employees are registered with the SantanderPrevi plan. As of December 31, 2017, 43,175 participants were enrolled in that plan, making the total amount under management approximately R$3.5 billion. For additional information on our pension plans, see note 23 to our audited consolidated financial statements.
The Brazilian Banking Employees’ Union represents most of our employees. In the event of a potential conflict with our banking employees and/or the banking union, negotiations are conducted by the FENABAN. Each year, generally in September, all Brazilian banks have a collective negotiation period in which they revise salary structures. During this period, the Brazilian Banking Employees’ Union negotiates bank employees’ salaries within the scope of the Brazilian Banking Collective Agreement with the FENABAN. Negotiations pertaining to wages and salaries for 2017 have already been concluded and the levels of compensation agreed are consistent with market practice. Since the acquisition of our predecessor banks by our indirect shareholder Santander Spain, we have not suffered significant losses through strikes and our management believes it has good relations with our employees.
6E. Share Ownership
The following table provides the names of our directors and executive officers who owned shares of Santander Brasil as of April 5, 2018.
| Shareholders | | Common Shares | | Percentage of Outstanding Common Shares | | Preferred Shares | | Percentage of Outstanding Preferred Shares | | Percentage of Total Share Capital |
| Alessandro Tomao | | | 63,152 | | | | (1 | ) | | | 63,152 | | | | (1 | ) | | | (1 | ) |
| Alexandre Grossmann Zancani | | | 19,162 | | | | (1 | ) | | | 19,162 | | | | (1 | ) | | | (1 | ) |
| Amancio Acurcio Gouveia | | | 103,438 | | | | (1 | ) | | | 103,438 | | | | (1 | ) | | | (1 | ) |
| Andre de Carvalho Novaes | | | 27,857 | | | | (1 | ) | | | 27,857 | | | | (1 | ) | | | (1 | ) |
| Angel Santodomingo Martell | | | 155,453 | | | | (1 | ) | | | 155,453 | | | | (1 | ) | | | (1 | ) |
| Antonio Pardo de Santayana Montes | | | 102,937 | | | | (1 | ) | | | 102,937 | | | | (1 | ) | | | (1 | ) |
| Carlos Aguiar Neto | | | 21,592 | | | | (1 | ) | | | 21,592 | | | | (1 | ) | | | (1 | ) |
| Carlos Rey de Vicente | | | 285,702 | | | | (1 | ) | | | 285,702 | | | | (1 | ) | | | (1 | ) |
| Cassio Schmitt | | | 93,099 | | | | (1 | ) | | | 93,099 | | | | (1 | ) | | | (1 | ) |
| Cassius Schymura | | | 48,706 | | | | (1 | ) | | | 48,706 | | | | (1 | ) | | | (1 | ) |
| Celso Clemente Giacometti | | | 1 | | | | (1 | ) | | | 0 | | | | (1 | ) | | | (1 | ) |
| Conrado Engel | | | 580,768 | | | | (1 | ) | | | 580,768 | | | | (1 | ) | | | (1 | ) |
| Ede Ilson Viani | | | 132,145 | | | | (1 | ) | | | 132,145 | | | | (1 | ) | | | (1 | ) |
| Felipe Pires Guerra de Carvalho | | | 101,671 | | | | (2 | ) | | | 101,671 | | | | (2 | ) | | | (2 | ) |
| Germanuela de Almeida de Abreu | | | 23,786 | | | | (1 | ) | | | 23,786 | | | | (1 | ) | | | (1 | ) |
| Gilberto Duarte de Abreu Filho | | | 64,747 | | | | (1 | ) | | | 64,747 | | | | (1 | ) | | | (1 | ) |
| Igor Mario Puga | | | 9,076 | | | | (1 | ) | | | 9,076 | | | | (1 | ) | | | (1 | ) |
| Jean Pierre Dupui | | | 232,347 | | | | (1 | ) | | | 232,347 | | | | (1 | ) | | | (1 | ) |
| Jose Alberto Zamorano Hernandez | | | 172,483 | | | | (1 | ) | | | 172,483 | | | | (1 | ) | | | (1 | ) |
| Jose Antonio Alvarez Alvarez | | | 1 | | | | (1 | ) | | | 0 | | | | (1 | ) | | | (1 | ) |
| Jose de Paiva Ferreira | | | 300,289 | | | | (1 | ) | | | 300,288 | | | | (1 | ) | | | (1 | ) |
| Jose Roberto Machado Filho | | | 92,908 | | | | (1 | ) | | | 92,908 | | | | (1 | ) | | | (1 | ) |
| Juan Sebastian Moreno Blanco | | | 234,370 | | | | (1 | ) | | | 234,370 | | | | (1 | ) | | | (1 | ) |
| Leopoldo Martinez Cruz | | | 57,948 | | | | (1 | ) | | | 57,948 | | | | (1 | ) | | | (1 | ) |
| Luis Guilherme Mattosso de Oliem Bittencourt | | | 32,631 | | | | (1 | ) | | | 32,631 | | | | (1 | ) | | | (1 | ) |
| Luiz Masagao Ribeiro Filho | | | 110,996 | | | | (1 | ) | | | 110,996 | | | | (1 | ) | | | (1 | ) |
| Manoel Marcos Madureira | | | 286,410 | | | | (1 | ) | | | 286,410 | | | | (1 | ) | | | (1 | ) |
| Shareholders | | Common Shares | | Percentage of Outstanding Common Shares | | Preferred Shares | | Percentage of Outstanding Preferred Shares | | Percentage of Total Share Capital |
| Marcelo Malanga | | | 26,044 | | | | (1 | ) | | | 26,044 | | | | (1 | ) | | | (1 | ) |
| Marcelo Zerbinatti | | | 34,572 | | | | (2 | ) | | | 34,572 | | | | (2 | ) | | | (2 | ) |
| Marino Alexandre Calheiros Aguiar | | | 13,012 | | | | (1 | ) | | | 13,012 | | | | (1 | ) | | | (1 | ) |
| Mario Roberto Opice Leao | | | 110,942 | | | | (1 | ) | | | 110,942 | | | | (1 | ) | | | (1 | ) |
| Nilton Sergio Silveira Carvalho | | | 33,804 | | | | (1 | ) | | | 33,804 | | | | (1 | ) | | | (1 | ) |
| Rafael Bello Noya | | | 40,095 | | | | (1 | ) | | | 40,095 | | | | (1 | ) | | | (1 | ) |
| Ramon Sanchez Diez | | | 51,934 | | | | (1 | ) | | | 51,934 | | | | (1 | ) | | | (1 | ) |
| Reginaldo Antonio Ribeiro | | | 31,623 | | | | (1 | ) | | | 31,623 | | | | (1 | ) | | | (1 | ) |
| Roberto de Oliveira Campos Neto | | | 454,935 | | | | (1 | ) | | | 454,935 | | | | (1 | ) | | | (1 | ) |
| Robson de Souza Rezende | | | 38,240 | | | | (1 | ) | | | 38,240 | | | | (1 | ) | | | (1 | ) |
| Rodrigo Cury | | | 21,118 | | | | (1 | ) | | | 21,118 | | | | (1 | ) | | | (1 | ) |
| Ronaldo Wagner Rondinelli | | | 35,293 | | | | (1 | ) | | | 35,293 | | | | (1 | ) | | | (1 | ) |
| Sergio Agapito Lires Rial | | | 303,314 | | | | (1 | ) | | | 303,314 | | | | (1 | ) | | | (1 | ) |
| Sergio Goncalves | | | 26,949 | | | | (1 | ) | | | 26,949 | | | | (1 | ) | | | (1 | ) |
| Thomas Gregor ILG | | | 72,514 | | | | (1 | ) | | | 72,514 | | | | (1 | ) | | | (1 | ) |
| Ulisses Gomes Guimaraes | | | 27,210 | | | | (1 | ) | | | 27,210 | | | | (1 | ) | | | (1 | ) |
| Vanessa de Souza Lobato Barbosa | | | 38,635 | | | | (1 | ) | | | 38,635 | | | | (1 | ) | | | (1 | ) |
| Employees | | | 4,010,408 | | | | 0.12 | % | | | 4,015,096 | | | | 0.12 | % | | | 0.12 | % |
| Total | | | 8,724,317 | | | | | | | | 8,729,002 | | | | | | | | | |
Shares held by members of our board of directors and our officers do not have special voting rights in relation to shares held by our other shareholders.
For a description of our equity compensation plans, see “Item 6. Directors, Senior Management and Employees––B. Compensation.”
ITEM 7. MAJOR SHAREHOLDERS AND RELATED PARTY TRANSACTIONS
7A. Major Shareholders
As of April 5, 2018, Santander Spain directly and indirectly through its subsidiaries, Grupo Empresarial Santander, S.L. and Sterrebeeck B.V., owned approximately 89.5% of our total capital stock (not including the shares held by Banco Madesant - Sociedade Unipessoal).
The following table presents the beneficial ownership of our common and preferred shares as of April 5, 2018.
| Principal Shareholders | | Common Shares | | Percentage of Outstanding Common Shares | | Preferred Shares | | Percentage of Outstanding Preferred Shares | | Total Shares (thousands) | | Percentage of Total Share Capital |
| | | (in thousands, except percentages) |
| Sterrebeeck BV (1) | | | 1,809,583 | | | | 47.39 | % | | | 1,733,643 | | | | 47.11 | % | | | 3,543,226 | | | | 47.25 | % |
| Grupo Empresarial Santander SL | | | 1,107,672 | | | | 29.01 | % | | | 1,019,645 | | | | 27.71 | % | | | 2,127,317 | | | | 28.37 | % |
| Banco Santander, S.A. | | | 521,964 | | | | 13.67 | % | | | 519,268 | | | | 14.11 | % | | | 1,041,232 | | | | 13.89 | % |
| Treasury Shares (2) | | | 2,832 | | | | 0.07 | % | | | 2,832 | | | | 0.08 | % | | | 5,664 | | | | 0.08 | % |
| Employees (3) | | | 8,587 | | | | 0.22 | % | | | 8,592 | | | | 0.23 | % | | | 17,179 | | | | 0.23 | % |
| Other minority shareholders | | | 368,054 | | | | 9.64 | % | | | 395,853 | | | | 10.76 | % | | | 763,907 | | | | 10.19 | % |
| Total | | | 3,818,692 | | | | 100.00 | % | | | 3,679,833 | | | | 100.00 | % | | | 7,498,525 | | | | 100.00 | % |
| (1) | An affiliate within the Santander Group. |
| (2) | On September 18, 2017, our shareholders approved the cancellation of 64,551,366 shares held in treasury (32,275,683 common shares and 32,275,683 preferred shares). |
| (3) | Includes members of senior management. See “—E. Share Ownership.” |
The total number of ADRs held by U.S. investors as of December 31, 2017, is 194,699,689. The total number of Units held by U.S. investors as of December 31, 2017, is 60,255,764 (excluding Units held by The Bank of New York Mellon as depositary).
Significant Changes in Percentage Ownership of Principal Shareholders
On December 14, 2015, our shareholders approved the cancellation of 37,757,908 shares held in treasury, representing 18,878,954 common shares and 18,878,954 preferred shares. Such treasury shares corresponded, as of that date, to approximately 53.9% of the totality of the shares then held in treasury. As a result, as of December 31, 2015, we held 40,435,466 shares in treasury, of which 20,217,733 were common shares and 20,217,733 were preferred shares.
On December 31, 2016, we held 51,571,846 shares in treasury, of which 25,785,923 were common shares and 25,785,923 were preferred shares.
On April 11, 2017, Qatar Holding LLC (the “Selling Shareholder”) participated in a secondary offering of 80,000,000 units, each of which is composed of one common share, no par value, and one preferred share, no par value, of Santander Brasil. Furthermore, the Selling Shareholder granted the international underwriters the option to purchase up to 12,000,000 additional ADSs of Santander Brasil within 30 days from, but not including, April 5, 2017, solely to cover over-allotments of ADSs, if any. The international underwriters exercised the option for 5,065,000 ADSs, and the settlement of took place on May 9, 2017.
On September 18, 2017, our shareholders approved the cancellation of 64,551,366 shares held in treasury, representing 32,275,683 common shares and 32,275,683 preferred shares. Such treasury shares corresponded, as of that date, to the totality of the shares then held in treasury.
On December 31, 2017, we held 11,689,106 shares in treasury, of which 5,844,533 were common shares and 5,844,553 were preferred shares.
Voting Rights of Principal Shareholders
Our principal shareholders do not have voting rights distinct from those of our other shareholders. See “Item 10. Additional Information—B. By-Laws—Rights of Common Shares and Preferred Shares.”
7B. Related Party Transactions
We have a documented policy with respect to related party transactions approved by the board of directors, which is intended to ensure that all transactions covered by the policy are conducted based on our interest and that of our shareholders. The policy defines the power to approve certain transactions by the board of directors. The rules are also applied to all our directors, senior management, employees and subsidiaries. Additionally, related party transactions are also included in the regular auditing program developed by our internal audit.
We currently engage in, and expect from time to time in the future to engage in, financial and commercial transactions with our subsidiaries and affiliates and those of the Santander Group. We have credit lines outstanding with the Santander Group and its affiliated financial institutions around the world. As of December 31, 2017, borrowings and deposits from the Santander Group represented approximately 2% of our total funding. In addition, from time to time, we enter into certain transactions with the Santander Group and other related parties for the provision of advisory and advertising services. Such transactions are conducted on an arm’s-length basis, based on terms that would have been applied for transactions with third parties.
The transactions and remuneration of services with related parties are made in the ordinary course of business on an arms’ length basis under similar conditions, including interest rates, terms and guarantees, and involve no greater risk than transactions with unrelated parties carried out in the ordinary course and have no other disadvantages. The following discussion describes all of our material related party transactions.
Information Technology Platform
We enter into certain agreements with some affiliates of the Santander Group (Ingeniería de Software Bancário S.L. (Spain), ISBAN S.A. (Chile), Produban Servicios Informáticos Generales S.L. (Spain), and Produban Brasil Tecnologia Ltda (Brazil) for the outsourcing of certain products and services relating to our information technology
platform, including software development, hosting and information processing. We believe the provisions of these services are provided on an arm’s-length basis with terms substantially similar to those available from other providers in the market. In 2017 and 2016, Santander Group affiliates received approximately R$697 million and R$761 million, respectively, for the products and outsourcing provided above. See “Item 4. Information on the Company—B. Business Overview— Technology and Commercial Transformation—Technological Infrastructure.”
Procurement Services
We have entered into agreements with Aquanima Brasil Ltda., an affiliate of the Santander Group, which offers procurement services (sourcing, e-procurement, outsourcing and consultancy) to Santander Brasil. Volume aggregation between Santander Brasil and other client companies allow for joint purchases for groups of different clients. The agreements entered into with Aquanima Brasil Ltda. were on an arm’s-length basis. We paid Aquanima Brasil Ltda. approximately R$26 million in 2017 and R$25 million in 2016.
Other Related Party Transactions
From time to time, we engage in lending and borrowing transactions to fund our operations and other miscellaneous transactions with various companies of the Santander Group, in compliance with restrictions on loans or advances imposed by Brazilian law. The following table shows the balances owed to us by such companies (assets) at each of December 31, 2017 and December 31, 2016 and the amounts owed by us to such companies (liabilities) at the same dates. The table also sets forth amounts received (income) or paid (expenses) to such companies for the year ended December 31, 2017 and December 31, 2016. All such transactions with Santander Group companies were conducted on an arm’s-length basis with terms substantially similar to those available from other providers in the market.
| | | As of December 31, 2017 | | As of December 31, 2016 |
| | | Parent(1) | | Jointly-controlled companies | | Other Related Party(2) | | Parent(1) | | Jointly-controlled companies | | Other Related Party(2) |
| | | (in thousands of R$) |
| Assets | | | 8,214,739 | | | | 1,214,312 | | | | 926,994 | | | | 10,919,116 | | | | 794,800 | | | | 556,248 | |
| Financial assets for trading, net | | | (173,065 | ) | | | — | | | | (74,873 | ) | | | (184,304 | ) | | | — | | | | (400,570 | ) |
| Santander Spain | | | (173,065 | ) | | | — | | | | — | | | | (184,304 | ) | | | — | | | | — | |
| Abbey National Treasury Services Plc(2) | | | — | | | | — | | | | (71,672 | ) | | | — | | | | — | | | | (91,828 | ) |
| Real Fundo de Investimento Multimercado Santillana Crédito Privado(2) | | | — | | | | — | | | | (3,201 | ) | | | — | | | | — | | | | (308,742 | ) |
| Loans and amounts due from credit institutions–Cash and overnight operations in foreign currency | | | 8,363,038 | | | | — | | | | 76,009 | | | | 10,900,941 | | | | — | | | | 94,530 | |
| Santander Spain(3) (5) | | | 8,363,038 | | | | — | | | | — | | | | 10,900,941 | | | | — | | | | — | |
| Banco Santander Totta, S.A(2). | | | — | | | | — | | | | 2,733 | | | | — | | | | — | | | | 1,261 | |
| Abbey National Treasury Services Plc(2) | | | — | | | | — | | | | 71,751 | | | | — | | | | — | | | | 92,118 | |
| Bank Zachodni(2). | | | — | | | | — | | | | 177 | | | | — | | | | — | | | | 117 | |
| Banco Santander, S.A. – México(2) | | | — | | | | — | | | | 1,348 | | | | — | | | | — | | | | 1,034 | |
| Loans and advances to customers | | | 132 | | | | 9,661 | | | | 925,858 | | | | — | | | | 136,354 | | | | 862,288 | |
| Zurich Santander Brasil Seguros S.A. | | | — | | | | — | | | | 925,835 | | | | — | | | | — | | | | 862,553 | |
| Webmotors S.A. | | | — | | | | 9,661 | | | | — | | | | — | | | | 136,354 | | | | — | |
| Abbey National Treasury Services Plc(2). | | | — | | | | — | | | | 23 | | | | — | | | | — | | | | — | |
| Santander Spain(1). | | | 132 | | | | — | | | | — | | | | — | | | | — | | | | — | |
| Santander Brasil Gestão de Recursos Ltda. | | | — | | | | — | | | | — | | | | — | | | | — | | | | (265 | ) |
| Loans and amounts due from credit institutions(1) | | | 23,896 | | | | 1,203,032 | | | | — | | | | 25,546 | | | | 656,806 | | | | — | |
| Santander Spain | | | 23,896 | | | | — | | | | — | | | | 25,546 | | | | — | | | | — | |
| Banco RCI Brasil S.A | | | — | | | | 1,203,032 | | | | — | | | | | | | | 656,806 | | | | | |
| Other Assets | | | 738 | | | | 1,619 | | | | — | | | | 176,933 | | | | 1,640 | | | | — | |
| Santander Spain | | | 738 | | | | — | | | | — | | | | 176,933 | | | | — | | | | — | |
| | | As of December 31, 2017 | | As of December 31, 2016 |
| | | Parent(1) | | Jointly-controlled companies | | Other Related Party(2) | | Parent(1) | | Jointly-controlled companies | | Other Related Party(2) |
| | | (in thousands of R$) |
| Banco RCI Brasil S.A. | | | — | | | | 1,619 | | | | — | | | | — | | | | 1,640 | | | | — | |
| Liabilities | | | (12,360,383 | ) | | | (57,221 | ) | | | (2,107,677 | ) | | | (11,984,199 | ) | | | (106,527 | ) | | | (1,222,556 | ) |
| Deposits of Brazil Central Bank and deposits of credit institutions | | | (387,937 | ) | | | (47,423 | ) | | | (1,862,058 | ) | | | (327,466 | ) | | | (40,202 | ) | | | (980,702 | ) |
| Santander Spain(4) | | | (387,937 | ) | | | — | | | | — | | | | (327,466 | ) | | | — | | | | — | |
| Santander Securities Services Brasil DTVM S.A. | | | — | | | | — | | | | (300,074 | ) | | | — | | | | — | | | | (208,059 | ) |
| Santander Brasil Asset(2) | | | — | | | | — | | | | (16,766 | ) | | | — | | | | — | | | | (12,079 | ) |
| Banco RCI Brasil S.A. | | | — | | | | (47.423 | ) | | | — | | | | — | | | | (40,202 | ) | | | — | |
| Real Fundo de Investimento Multimercado Santillana Credito Privado(2) | | | — | | | | — | | | | (1,543,752 | ) | | | — | | | | — | | | | (757,874 | ) |
| Banco Santander, S.A. – Uruguay(2) | | | — | | | | — | | | | (1,466 | ) | | | — | | | | — | | | | (2,158 | ) |
| Others | | | — | | | | — | | | | — | | | | — | | | | — | | | | (532 | ) |
| Customer Deposits | | | — | | | | (9,798 | ) | | | (222,473 | ) | | | — | | | | (66,325 | ) | | | (189,794 | ) |
| ISBAN Brasil S.A | | | — | | | | — | | | | (20,893 | ) | | | — | | | | — | | | | (22,232 | ) |
| Santander Securities Services Brasil Participações S.A.(2) | | | — | | | | — | | | | (71,947 | ) | | | — | | | | — | | | | (52,484 | ) |
| Produban Serviços de Informática S.A.(2) | | | — | | | | — | | | | (34,410 | ) | | | — | | | | — | | | | (19,653 | ) |
| Zurich Santander Brasil Seguros e Previdência S.A.(1) | | | — | | | | — | | | | (55,935 | ) | | | — | | | | — | | | | (44,840 | ) |
| Santander Brasil Gestão de Recursos Ltda. | | | — | | | | — | | | | (32,334 | ) | | | — | | | | — | | | | (39,361 | ) |
| Webmotors S.A. | | | — | | | | (9,798 | ) | | | — | | | | — | | | | (66,325 | ) | | | — | |
| Others | | | — | | | | — | | | | (6,954 | ) | | | — | | | | — | | | | (11,224 | ) |
| Other financial liabilities – Dividends and interest on capital Payable | | | (3,992,820 | ) | | | — | | | | (1,132 | ) | | | (3,794,130 | ) | | | — | | | | (16,494 | ) |
| Santander Spain | | | (620,264 | ) | | | — | | | | — | | | | (589,227 | ) | | | — | | | | — | |
| Grupo Empresarial Santander S.L. (1) | | | (1,264,470 | ) | | | — | | | | — | | | | (1,201,612 | ) | | | — | | | | — | |
| Sterrebeeck B.V.(1) | | | (2,108,086 | ) | | | — | | | | — | | | | (2,003,291 | ) | | | — | | | | — | |
| Banco Madesant – Sociedade Unipessoal S.A. | | | — | | | | — | | | | (1,132 | ) | | | — | | | | — | | | | (1,075 | ) |
| Santusa Holding, S.L. | | | — | | | | — | | | | — | | | | — | | | | — | | | | (15,419 | ) |
| Other payables | | | (2,050 | ) | | | — | | | | (22,014 | ) | | | (2,954 | ) | | | — | | | | (35,566 | ) |
| Santander Spain | | | (2,050 | ) | | | — | | | | — | | | | (2,954 | ) | | | — | | | | — | |
| Santander Brasil Asset(2) | | | — | | | | — | | | | (69 | ) | | | — | | | | — | | | | (70 | ) |
| ISBAN Brasil S.A.(2) | | | — | | | | — | | | | 237 | | | | — | | | | — | | | | (339 | ) |
| Produban Servicios Informáticos Generales, S.L. (Produban Espanha)(2) | | | — | | | | — | | | | (905 | ) | | | — | | | | — | | | | — | |
| Santander Securities Services Brasil DTVM S.A. | | | — | | | | — | | | | 6,762 | | | | — | | | | — | | | | (4,430 | ) |
| Zurich Santander Brasil Seguros e Previdência S.A. | | | — | | | | — | | | | (27,748 | ) | | | — | | | | — | | | | (30,684 | ) |
| Others | | | — | | | | — | | | | (291 | ) | | | — | | | | — | | | | (43 | ) |
| Debt instruments Eligible Capital(7) | | | (7,977,576 | ) | | | — | | | | — | | | | (7,859,649 | ) | | | — | | | | — | |
| Santander Spain | | | (7,977,576 | ) | | | — | | | | — | | | | (7,859,649 | ) | | | — | | | | — | |
| (*) | All loans and amounts to related parties were made in our ordinary course of business and on sustainable basis, including interest rates and collateral and did not involve more than the normal risk of collectability or present other unfavorable features. |
| (1) | Santander Brasil is indirectly controlled by Santander Spain and, through its subsidiaries Grupo Empresarial Santander and S.L. Sterrebeeck B.V. |
| (2) | Refers to the subsidiaries of Santander Spain. |
| (3) | In December 31, 2017, refers to the cash of R$587,531 (2016 – R$582,571, and 2015 – R$1,866,683). |
| (4) | As of December 31, 2017, refers to raising funds through operations transfers abroad amounted to R$387,937 (2016 - R$327,466 and 2015 - R$219,037), with maturity until November, 2018 and interest between 0.56% and 6.65% p.a. |
| (5) | On December 31, 2017, refers to investments in foreign currency maturing on January 2, 2018 in the amount of R$7,384,335 (2016 - R$10,269,812 and 2015 - R$20,699,539) and interest of 1.43% p.a. held at Santander Brasil Establecimiento Financiero de Credito, Santander Brasil and our Grand Cayman Branch. |
| (6) | Refers to issuances of Eurobonds of Santander Brasil’s Grand Cayman Branch, maturing between from January 16, 2016 to February 13, 2017 and interest of 3.152% p.a. and 4.625% p.a. |
| (7) | Refers to the portion acquired by the controlling shareholder with the PR Optimization Plan held in the first half of 2014. |
| (8) | In February, 2016 the Cia de Crédito, Financiamento e Investimentos Renault was acquired by Banco RCI Brasil S.A. |
| | | As of December 31, 2017 | | As of December 31, 2016 |
| | | Parent(1) | | Joint-controlled companies | | Other Related–Party(2) | | Parent(1) | | Joint–controlled companies | | Other Related–Party(2) |
| | | (in thousands of R$) |
| Income | | | 389,663 | | | | 126,781 | | | | 1,210,444 | | | | (798,022 | ) | | | 136,111 | | | | 1,197,489 | |
| Interest and similar income—Loans and amounts due from credit institutions | | | 87,217 | | | | 87,381 | | | | 1,417 | | | | 39,677 | | | | 114,909 | | | | 396 | |
| Santander Spain | | | 87,217 | | | | — | | | | — | | | | 39,677 | | | | — | | | | — | |
| Abbey National Treasury Services Plc | | | — | | | | — | | | | 879 | | | | — | | | | — | | | | 396 | |
| Banco RCI Brasil S.A.(6) | | | — | | | | 87.381 | | | | - | | | | — | | | | 114,909 | | | | — | |
| Cibrasec | | | — | | | | — | | | | 538 | | | | — | | | | — | | | | — | |
| Interest expenses and similar charges—Deposits from customers | | | — | | | | (4,486 | ) | | | (41,026 | ) | | | (4,192 | ) | | | (26,996 | ) | | | (49,420 | ) |
| ISBAN Brasil S.A | | | — | | | | — | | | | (2,145 | ) | | | — | | | | — | | | | (3,560 | ) |
| Produban Serviços de Informática S.A. | | | — | | | | — | | | | (1,547 | ) | | | — | | | | — | | | | (2,117 | ) |
| Webmotors S.A | | | — | | | | (4,486 | ) | | | — | | | | — | | | | (26,996 | ) | | | — | |
| Santander Brasil Gestão de Recursos Ltda. | | | — | | | | — | | | | (6,636 | ) | | | — | | | | — | | | | (12,417 | ) |
| Santander Spain | | | — | | | | — | | | | — | | | | (4,192 | ) | | | — | | | | — | |
| Santander Cultural | | | — | | | | — | | | | (69 | ) | | | — | | | | — | | | | (11 | ) |
| Real Fundo de Investimento Multimercado Santillana Credito Privado | | | — | | | | — | | | | — | | | | — | | | | — | | | | (31,097 | ) |
| Santander Securities Services Brasil Participações S.A. | | | — | | | | — | | | | (6,190 | ) | | | | | | | | | | | | |
| Santander Securities Services Brasil DTVM S.A. | | | — | | | | — | | | | (24.344 | ) | | | | | | | | | | | | |
| Others | | | — | | | | — | | | | (95 | ) | | | — | | | | — | | | | (218 | ) |
| Interest expenses and similar charges—Deposits from credit institutions | | | (13,038 | ) | | | (3,026 | ) | | | (113,569 | ) | | | (512 | ) | | | (10,959 | ) | | | (115,458 | ) |
| Santander Spain | | | (13,038 | ) | | | — | | | | — | | | | (512 | ) | | | — | | | | — | |
| Banco RCI Brasil S.A.(6) | | | — | | | | (3,026 | ) | | | — | | | | — | | | | (10,959 | ) | | | — | |
| Real Fundo de Investimento Multimercado Santillana Credito Privado | | | — | | | | — | | | | (112,211 | ) | | | — | | | | — | | | | (88,467 | ) |
| Santander Securities Services Brasil DTVM S.A. | | | — | | | | — | | | | — | | | | — | | | | — | | | | (20,979 | ) |
| Santander Asset Management, S.A. SGIIC | | | — | | | | — | | | | (1,263 | ) | | | — | | | | — | | | | (1,760 | ) |
| Santander Securities Services Brasil Paticipações S.A.(2) | | | — | | | | — | | | | — | | | | — | | | | — | | | | (4,119 | ) |
| SAM Brasil Participações S.A. | | | — | | | | — | | | | (95 | ) | | | — | | | | — | | | | (133 | ) |
| Fee and commission income (expense) | | | (5,099 | ) | | | 14,999 | | | | 2,453,179 | | | | 5,334 | | | | 20,133 | | | | 1,955,255 | |
| Santander Spain | | | (5,099 | ) | | | — | | | | — | | | | 5,334 | | | | — | | | | — | |
| Banco RCI Brasil S.A.(6) | | | — | | | | 14,996 | | | | — | | | | — | | | | 19,211 | | | | — | |
| Banco Santander Internacional | | | — | | | | — | | | | 20,480 | | | | — | | | | — | | | | 20,959 | |
| Santander Securities Services Brasil DTVM S.A. | | | — | | | | — | | | | — | | | | — | | | | — | | | | 1,896 | |
| Webmotors S.A. | | | — | | | | 3 | | | | — | | | | — | | | | 922 | | | | — | |
| Zurich Santander Brasil Seguros S.A. | | | — | | | | — | | | | 295,508 | | | | — | | | | — | | | | 218,773 | |
| | | As of December 31, 2017 | | As of December 31, 2016 |
| | | Parent(1) | | Joint-controlled companies | | Other Related–Party(2) | | Parent(1) | | Joint–controlled companies | | Other Related–Party(2) |
| | | (in thousands of R$) |
| Zurich Santander Brasil Seguros e Previdência S.A. | | | — | | | | — | | | | 2,134,755 | | | | — | | | | — | | | | 1,711,138 | |
| Others | | | — | | | | — | | | | 2,436 | | | | — | | | | — | | | | 2,489 | |
| Gains (losses) on financial assets and liabilities (net) and Exchange differences (net) | | | 592,919 | | | | 31,913 | | | | (39,534 | ) | | | (613,168 | ) | | | 39,024 | | | | 267,983 | |
| Santander Spain | | | 592,919 | | | | — | | | | — | | | | (613,168 | ) | | | — | | | | — | |
| Real Fundo de Investimento Multimercado Santillana Crédito Privado | | | — | | | | — | | | | (79,480 | ) | | | — | | | | — | | | | 257,475 | |
| Abbey National Treasury Services Plc | | | — | | | | — | | | | 23,843 | | | | — | | | | — | | | | 38,274 | |
| Banco RCI Brasil S.A.(6) | | | — | | | | 31,913 | | | | — | | | | — | | | | 39,024 | | | | — | |
| Santander Securities Services Brasil DTVM S.A.(2) | | | — | | | | — | | | | (26,102 | ) | | | — | | | | — | | | | (16,038 | ) |
| Santander Investment Securities Inc. | | | — | | | | — | | | | (13,492 | ) | | | — | | | | — | | | | (15,115 | ) |
| Zurich Santander Brasil Seguros e Previdência S.A. | | | — | | | | — | | | | 52,981 | | | | — | | | | — | | | | — | |
Zurich Santander Brasil Seguros S.A.
| | | — | | | | — | | | | 1,788 | | | | — | | | | — | | | | — | |
| Others | | | — | | | | — | | | | 928 | | | | — | | | | — | | | | 3,387 | |
| Administrative expenses and amortization | | | (50,271 | ) | | | — | | | | (1,028,750 | ) | | | — | | | | — | | | | (840,739 | ) |
| Banco Santander, S.A. – Spain | | | (50,271 | ) | | | — | | | | — | | | | — | | | | — | | | | — | |
| ISBAN Brasil S.A. | | | — | | | | — | | | | (337,161 | ) | | | — | | | | — | | | | (290,430 | ) |
| Produban Serviços de Informática S.A. | | | — | | | | — | | | | (242,191 | ) | | | — | | | | — | | | | (209,253 | ) |
| ISBAN Chile S.A. | | | — | | | | — | | | | (23 | ) | | | — | | | | — | | | | (26 | ) |
| Ingeniería de Software Bancario, S.L. | | | — | | | | — | | | | (70,385 | ) | | | — | | | | — | | | | (42,519 | ) |
| Produban Servicios Informáticos Generales, S.L | | | — | | | | — | | | | (46,494 | ) | | | — | | | | — | | | | (21,525 | ) |
| TECBAN—Tecnologia Bancária S.A. | | | — | | | | — | | | | (262,046 | ) | | | — | | | | — | | | | (213,194 | ) |
| Aquanima Brasil Ltda. | | | — | | | | — | | | | (25,638 | ) | | | — | | | | — | | | | (24,557 | ) |
| Santander Securities Services Brasil Participações S.A.(2) | | | — | | | | — | | | | (42,603 | ) | | | — | | | | — | | | | (35,882 | ) |
| Others | | | — | | | | — | | | | (2,209 | ) | | | — | | | | — | | | | (3,353 | ) |
| Others Administrative expenses—Donation | | | — | | | | — | | | | (21,273 | ) | | | — | | | | — | | | | (20,528 | ) |
| Santander Cultural | | | — | | | | — | | | | (3,513 | ) | | | — | | | | — | | | | (2,737 | ) |
| Fundação Santander | | | — | | | | — | | | | (1.837 | ) | | | — | | | | — | | | | (3,452 | ) |
| Instituto Escola Brasil | | | — | | | | — | | | | (873 | ) | | | — | | | | — | | | | (939 | ) |
| Fundação Sudameris | | | — | | | | — | | | | (15,050 | ) | | | — | | | | — | | | | (13,400 | ) |
| Debt Instruments Eligible Capital | | | (222,065 | ) | | | — | | | | — | | | | (225,161 | ) | | | — | | | | — | |
| Santander Spain | | | (222,065 | ) | | | — | | | | — | | | | (225,161 | ) | | | — | | | | — | |
| (1) | Santander Brasil is indirectly controlled by Santander Spain and, through its subsidiaries Grupo Empresarial Santander and S.L. Sterrebeeck B.V. |
| (2) | Refers to the subsidiaries of Santander Spain. |
| (3) | Refers to the profit on disposal of MS Participações S.A. |
| (4) | Refers the profit on disposal of Santander Brasil Asset Management Distribuidora de Títulos e Valores Mobiliários S.A. |
| (5) | Refers the profit on disposal of Santander Securities Services Brasil DTVM S.A. |
| (6) | In February, 2016 the Cia de Crédito, Financiamento e Investimentos Renault was acquired by Banco RCI Brasil S.A. |
7C. Interests of Experts and Counsel
Not applicable.
ITEM 8. FINANCIAL INFORMATION
8A. Consolidated Statements and Other Financial Information
Consolidated Financial Statements
See “Item 18. Financial Statements,” which contains our audited consolidated financial statements prepared in accordance with IFRS as issued by the IASB.
Legal Proceedings
We are a party to lawsuits and administrative proceedings incidental to the normal course of our business. The main categories of lawsuits and administrative proceedings to which we are subject include:
| · | administrative and judicial actions relating to taxes; |
| · | administrative and indemnification suits for damages related to consumer rights, in particular with respect to credit cards, checking accounts, collection and loan disputes; |
| · | lawsuits involving disputes related to contracts and instruments to which we are a party, including claims related to breach of contracts and foreign currency indexation; |
| · | civil lawsuits mainly from depositors and civil associations, including individual lawsuits and class actions, challenging monetary adjustments determined by government economic plans instituted to combat inflation during the 1980s and 1990s; |
| · | lawsuits relating to the privatization of Banespa; |
| · | class actions involving agreements and settlement of debts with the public sector; and |
| · | suits brought by employees, former employees, associations and unions relating to alleged labor rights violations. |
In accordance with IAS 37 – Provisions, Contingent Liabilities and Contingent Assets, we record provisions for administrative and judicial proceedings in which we assess the risk of loss to be probable and we do not record provisions when the risk of loss is possible or remote. In cases where there is ongoing litigation, we record a provision for our estimate of the probable loss based on historical data for similar claims. In addition, we record provisions (i) on a case-by-case basis based on the analysis and legal opinion of internal and external counsel or (ii) by considering the historical average amount of loss of such category of lawsuits. Due to the established provisions and the legal opinions provided by our counsel, we believe that any liabilities related to lawsuits or proceedings to which we are a party, both individually and in the aggregate, will not have a material adverse effect on our financial condition or results of operations.
As of December 31, 2017, our judicial and administrative proceedings classified as probable loss risk (tax, labor and civil) and legal obligation amounted to approximately R$14.1 billion and have been provisioned. We believe that we have made adequate provisions related to the costs anticipated to be incurred in connection with our judicial and administrative proceedings. Our judicial and administrative proceedings classified as possible loss risk (tax, labor and civil) amounted to approximately R$20.1 billion.
Tax Litigation
We are a party to several tax-related lawsuits and judicial and administrative proceedings.
The main lawsuits related to tax legal obligations fully recognized as obligation are:
| · | PIS/COFINS. We filed lawsuits seeking to invalidate the provisions of Law 9,718/98, pursuant to which PIS and COFINS taxes must be levied on all revenues of legal entities. Prior to the enactment of such provisions, which have been overruled by recent Supreme Court decisions for non-financial institutions, PIS and COFINS were levied only on revenues from services and sale of goods. On April 23, 2015, the |
Supreme Court issued a decision, applicable solely to Santander Brasil, accepting jurisdiction over the appeal regarding PIS and rejecting jurisdiction over the appeal related to COFINS. The tax authorities appealed the decision of the Supreme Court related to COFINS and their appeal was denied on August 19, 2015. In respect of COFINS, the case is finished with a favorable decision applicable to Santander Brasil The appeal related to PIS, as well as the appeals submitted by other companies in the group, are pending. As of December 31, 2017, such claims amounted to R$3,501 million and are fully provisioned.
| · | Tax rate increase of CSLL. We filed for an injunction to avoid the increase in the CSLL tax rate established by Law 11,727/2008. Financial institutions were formerly subject to a CSLL tax rate of 9.0%; however, this Law established a 15.0% CSLL tax rate as from April 2008. Judicial proceedings are pending judgment. As of December 31, 2017, the amount related to this injunction totaled R$905 million, which is fully provisioned. |
As of December 31, 2017, our probable loss risk for tax litigation amounted to approximately R$2.4 billion fully provisioned and our possible loss risk for tax litigation amounted to approximately R$18.7 billion.
The main judicial and administrative proceedings to which probable loss risk assessment relates are:
| · | Tax on services for financial institutions. Certain municipalities levy Service Tax(Imposto Sobre Serviços – ISS) on certain revenues derived from transactions not usually classified as the rendering of services. In such cases, we have argued in administrative and judicial proceedings against the payment of ISS. As of December 31, 2017, amounts related to these proceedings totaled R$238 million, which are fully provisioned. |
| · | Social security contribution. We are involved in administrative and judicial proceedings regarding the collection of income tax on social security and education allowance contributions, as we believe that these benefits do not constitute salary. As of December 31, 2017, amounts related to these proceedings totaled R$265 million, which are fully provisioned. |
| · | Taxes on banking transactions. In May 2003, the Federal Revenue Service issued a tax assessment against Santander Distribuidora de Títulos e Valores Mobiliários Ltda. (Santander DTVM) and another tax assessment against Santander Brasil. The tax assessments refer to the collection of CPMF (Contribuição Provisória sobre Movimentação Financeira) tax on transactions conducted by Santander DTVM in the cash management of its customers’ funds and clearance services provided by Santander Brasil to Santander DTVM in 2000, 2001 and 2002. Based on our tax advisors’ opinion, the procedures adopted by Santander DTVM were correct. Santander Brasil DTVM succeeded in the first instance in its proceeding before the tax appeals board, but this decision was overturned in the Superior Chamber of Tax Appeals, and we were found liable for the tax assessment. Both decisions were appealed before the Board of Tax Appeals (Conselho Administrativo de Recursos Fiscais), or “CARF.” In June 2015, the CARF upheld the decision of the Superior Chamber of Tax Appeals. On July 3, 2015, Santander Brasil and Produban Serviços de Informática S.A. (current name of Santander DTVM) filed a lawsuit requesting the cancellation of both tax assessments and the amount as of December 31, 2017 totaled R$1,432 million. Based on the assessment of legal counsel, a provision of R$715 million was made to cover the probable risk of loss in these proceedings. |
Contingent liabilities classified as possible risk of loss refer to judicial and administrative proceedings involving tax matters assessed by the management taking in account the advice of our legal counsels, as possible losses, which were not recognized as liabilities. The main lawsuits include:
| · | Losses on loans. We have challenged the tax assessments issued by the Brazilian Federal Revenue Service claiming that our deduction of losses on loans from our corporate income tax (Imposto de Renda das Pessoas Jurídicas – IRPJ) and CSLL (Contribuição Social sobre o Lucro Líquido) bases have not met the relevant requirements under applicable law. As of December 31, 2017 the amount related to this challenge was approximately R$436 million. |
| · | Social Security Contribution – Profit Sharing Payments (Participação nos Lucros e Resultados, or “PLR”). We are involved in administrative and judicial proceedings arising from tax assessment with respect to the collection of social security contributions on profit sharing payments. The tax authorities |
claim that payments by us were not made in accordance with law. We have appealed against these infraction notices, since we consider the tax treatment to be appropriate based on applicable law and the nature of the payments. As of December 31, 2017 amounts related to these infraction notices totaled approximately R$3,929 million.
| · | IRPJ and CSLL – Capital Gain. The Brazilian Federal Revenue Service issued a tax assessment against Santander Seguros (legal successor of ABN AMRO Brasil Dois Participações S.A. (AAB Dois Par)) charging income tax and social contribution related to the 2005 fiscal year. The Brazilian Federal Revenue Service claims that the capital gain on the sale of Real Seguros S.A. and Real Vida e Previdência S.A. by AAB Dois Par should be paid at a 34.0% tax rate instead of 15.0%. The assessment was appealed at the administrative level based on our understanding that the tax treatment adopted in the transaction was in compliance with the current tax law and the capital gain was properly taxed. The administrative process is set for trial. We are responsible for any adverse outcome in this process as a former controlling shareholder of Zurich Santander Brasil Seguros e Previdência S.A. As of December 31, 2017 the amount related to this proceeding was approximately R$292 million. |
| · | Goodwill amortization of the acquisition of Banco Real. In October 2014 the Brazilian Federal Revenue Service issued a tax assessment against Santander Brasil in the amount of R$1,063 billion, claiming income tax and social contribution relating to the 2009 tax year. The argument of the Brazilian Federal Revenue Service is that the amortization of goodwill arising before our merger with Banco Real cannot be deducted. On July 14, 2015, we obtained a judgment in our favor in the first instance. The Federal Revenue Service filed an appeal before CARF against the favorable decision granted to Santander Brasil. The CARF granted the appeal filed by the Federal Revenue Service. Santander Brasil filed a motion for clarification against this decision which is pending judgment. As of December 31, 2017 the amounts related to this proceeding totaled approximately R$1.3 billion. This case is classified as possible risk of loss concerning the amortization of goodwill and as remote loss in relation to the fine charged in the case. |
| · | Goodwill amortization of the acquisition of Banco Sudameris. In November 2014, we received a tax assessment of R$196 million related to the deduction of goodwill amortization relating to the acquisition of Banco Sudameris. In December 2012, we received a similar tax assessment in the amount of R$239 million relating to the fiscal years encompassing August 2007 to April 2009. We have appealed in both cases to the CARF. We consider our risk of loss in this case as possible. As of December 31, 2017 the amount related to this proceeding was approximately R$609 million. |
| · | Unrecognized Compensation. We are currently engaged in legal and administrative proceedings with the Brazilian federal revenue service relating to the failure to ratify certain tax offsets with credits due to overpayment or undue payment. As of December 31, 2017 the amount related to these proceedings was approximately R$2,230 million. The risk of loss is classified as possible. |
Accession to Certain Tax Repayment Programs
In August 2017 we joined the Special Tax Regularization Program (Programa Especial de Regularização Tributária), or PERT. The program allows for certain tax debts to be repaid in installments. In connection with our participation in this program, we are repaying in installments certain amounts due as a result of lawsuits and administrative proceedings relating to corporate income tax and social security contributions for the periods from 1999 to 2005 in a total amount of R$492 million in January 2018 (taking into account the reduction arising from our participation in the program). A payment of R$191.9 million was due in August 2017 and a further payment of R$299.7 million was due by January 2018, both of which we have made within the prescribed time limits. As a result, we recorded expenses in an amount of R$364 million (after tax) in the third quarter of 2017.
In October 2017 we joined the Incentive Payment Programs and Installments (Programa de Parcelamento Incentivado) created by the cities Rio de Janeiro and São Paulo. The program allows for certain tax debts to be repaid in installments. In connection with our participation in this program, we are repaying in installments certain amounts due as a result of lawsuits and administrative proceedings relating to ISS for the periods from 2005 to 2016 in a total amount of R$293 million as of December 31, 2017. As we had made provisions for these losses, we registered income of R$435 million as a result of the reversal of certain provisions, net of tax effects, in an amount of R$96 million.
Labor Litigation
Similar to many other Brazilian banks, we are party to lawsuits brought by labor unions, associations and individual employees seeking, in general, compensation for overtime work, lost wages and retiree complaints about pension benefits and other labor rights. We believe we have either paid or adequately provisioned for all such potential liabilities. In addition, we are defendants in labor lawsuits filed by third-party employees that rendered or render services to us through service providers. Brazilian courts understand that if a third-party service provider fails to pay its employee, the employee has the right to demand payment directly from the company to which it rendered its services. As of December 31, 2017, our probable loss risk of labor-related litigation amounted to R$3.4 billion, which amount has been provisioned. Our possible loss risk of labor-related litigation amounted to R$28.7 million.
Former employees of Banco do Estado de São Paulo S.A.:
| · | A claim was filed in 1998 by the association of retired Banespa employees (AFABESP) on behalf of its members, requesting the payment of a half-yearly bonus initially envisaged in the entity’s by-laws in the event that the entity obtained a profit and that the distribution of this profit were approved by the board of directors. The bonus was not paid in 1994 and 1995 since the bank did not make a profit during those years. Partial payments were made from 1996 to 2000, as approved by the board of directors. The relevant clause in the by-laws was eliminated in 2001. The Regional Employment Court ordered the bank to pay this half-yearly bonus in September 2005 and the bank filed an appeal against the decision with the High Employment Court (“TST”) and, subsequently, with the STF. The TST confirmed the judgment against the bank, whereas the STF rejected the extraordinary appeal filed by the bank in a decision adopted by only one of the Court members, thereby also upholding the order issued to the bank. This decision was appealed by the bank and AFABESP. Only the appeal lodged by the bank has been allowed leave to proceed and will be decided upon by the STF in plenary session. The contingent liabilities are classified as possible risk of loss. The amount related to this claim is not disclosed due to the current stage of the lawsuit and the possible impact such disclosure may have on the progress of the claim. |
| · | A claim was filed in 2002 by AFABESP on behalf of its members requesting that certain pension supplements to which persons admitted to the relevant retirement plan prior to May 22, 1975 be adjusted pursuant to the IGP-DI index (Índice Geral de Preços - Disponibilidade Interna). The first instance judgment was favorable to the plaintiffs, requiring that the correction be made but only in the periods in which no other form of adjustment was applied. We and Banesprev have appealed this decision. The contingent liabilities are classified as possible risk of loss. The amount related to this action is not disclosed due to the current stage of the process and the possible impact that such disclosure may generate on the progress of the action. |
Civil Litigation
We are a party to civil lawsuits claiming damages and other civil remedies. These disputes normally fall within one of the following categories typical for Brazilian banks: (i) actions requesting the review of contractual terms and conditions or seeking monetary adjustments, including the alleged effects of implementation of certain economic government plans (as described below); (ii) actions arising from loan agreements; (iii) execution actions; and (iv) actions seeking damages. As of December 31, 2017, our probable loss risk in connection with civil litigation liabilities amounted to R$2.5 billion, which has been provisioned in full and our possible loss risk in connection with civil litigation liabilities amounted to R$1.3 billion. For civil lawsuits considered to be common and similar in nature, the provisions are recorded based on statistically averaged previous payments, and on the legal counsel’s evaluation of success. Provisions for other lawsuits are determined individually on a case-by-case basis.
Economic Plans
Like the rest of the banking system, we have been the subject of claims from customers, mostly depositors, and of class actions brought for a common reason, arising from a series of legislative changes relating to the calculation of inflation in the 1980s and 1990s (“planos econômicos”). The claimants considered that their vested rights had been impaired due to the immediate application of these adjustments. In April 2010, the High Court of Justice (“STJ”) set a limitation period for these class actions at five years, as claimed by the banks, rather than twenty years, as sought by the claimants, which we believe should significantly reduce the number of actions brought and the amounts claimed in this connection. As regards the substance of the matter, the decisions issued to date have been adverse for the banks, although some proceedings have been brought at the STJ and the STF with which the matter is expected to be definitively settled. In August 2010, STJ handed down a decision finding for the plaintiffs in terms of substance, but excluding one of the “planos” from the claim, thereby reducing the amount thereof, and once again confirming the five-year statute of limitations period. Shortly thereafter, the STF issued an injunctive relief order whereby the proceedings in progress in this connection were stayed until the court issues a final decision on the matter. In spite of the fact that STF initiated judgment in November 2013, a formal ruling has not been handed down as of the date hereof and we cannot predict when a formal ruling will be handed down by either the STJ or the STF. The Brazilian Attorney-General’s Office (Advocacia-Geral da União), the Brazilian Central Bank, the Brazilian Consumer Protection Institute (Instituto Brasileiro de Defesa do Consumidor), the Brazilian Savers’ Association (Frente Brasileira pelos Poupadores) and the Brazilian Federation of Banks (Federação Brasileira dos Bancos) have signed an agreement to resolve existing disputes over the economic plans. The settlement discussions did not address the full value of the payments, and focused on setting the amount that would be paid to each person according to the relevant balance at the plan date. The total value of the payments will depend on the number of persons adhering, as well as on the number of savers who have proved in court the existence of the account and the balance on the date of the anniversary of the change in indices. The terms of agreement were negotiated between the parties and submitted to the STF, which approved the terms of the agreement on March 1, 2018.
Insilene Indústria de Silenciosos do Nordeste Ltda.
This is a judicial claim filed against our wholly-owned subsidiary Banco Bandepe S.A. (“Bandepe”) in connection with a loan agreement entered into between Bandepe and Insilene Indústria de Silenciosos do Nordeste Ltda. (“Insilene”). According to the complaint, Bandepe never provided the loan provided for in the agreement, as a result of which Insilene to bankruptcy. In this judicial process, the judge ruled in favor of Insilene and such decision has already become unappealable. The proceeding is in its liquidation phase, and there is disagreement between Bandepe and Insilene regarding the value to be paid. The Court of Justice of the State of Pernambuco approved the amount indicated in the expert’s report and denied the calculation criteria sustained by Bandepe. Bandepe filed an appeal to the STJ to change the form of liquidation to a form which is more favorable to Bandepe, since Insiline could have foreseen the damages. We estimate the risk of loss as possible.
Fundo de Investimento em Direitos Creditórios Trendbank Banco de Fomento – Multisetorial.
A legal proceeding was filed against us in connection with the provision of custody services to Fundo de Investimento em Direitos Creditórios Trendbank Banco de Fomento – Multisetorial (the “Fund”) related to the acquisition of fake or defective bonds.In a decision by the first instance court, the case was dismissed in relation to us on the grounds that the custodian could not be held responsible for the acquisition of bonds. The Court of Justice reversed the decision of the lower court as a result of which the case will be retried following the expert phase. We estimate the risk of loss as possible.
Camargo Corrêa S.A. and Camargo Corrêa Administração e Participações Ltda.
We filed a judicial proceeding along with certain affiliates of ours against Camargo Corrêa S.A. and Camargo Corrêa Administração e Participações Ltda. (“Camargo Corrêa”) in connection with the association agreement entered into for the implementation of the control and administration of Banco Geral do Comércio S.A. (“BGC”) and its affiliates (“Association Agreement”). Under this proceeding the plaintiffs seek compensation for damages arising from obligations originated from events which took place before the signature of the Association Agreement which only were revealed to the parties after the implementation of the terms of such agreement and we (along with our affiliates) assumed BGC’s management. In response, Camargo Corrêa filed a counterclaim arguing to be our creditor. The judge ruled partially against our affiliates and us.In an appeal decision, the Court of Justice of the State of São Paulo (TJSP) reversed the decision in full, following grounds and granting the compensation claimed by us and our affiliates. We estimate the risk of loss aspossible.
Other Litigation
In addition to the matters described above, we are from time to time subject to certain claims and party to certain legal proceedings incidental to the normal course of our business, including in connection with our lending activities, relationships with our employees and other commercial or tax matters. In view of the inherent difficulty of predicting the outcome of legal matters, particularly where the claimants seek very large or indeterminate damages, or where the cases present novel legal theories, or those that involve a large number of parties or are in the early stages of discovery, we cannot state with confidence what the eventual outcome of these pending matters will be, what the timing of the ultimate resolution of these matters will be or what the eventual loss, fines or penalties related to each pending matter may be. We believe that we have made adequate provisions related to the costs anticipated to be incurred in connection with these various claims and legal proceedings and believe that liabilities related to such claims and proceedings should not have, in the aggregate, a material adverse effect on our business, financial condition, or results of operations. However, in light of the uncertainties involved in such claims and proceedings, there is no assurance that the ultimate resolution of these matters will not significantly exceed the provisions currently accrued by us; as a result, the outcome of a particular matter may be material to our operating results for a particular period, depending upon, among other factors, the size of the loss or liability imposed and our level of income for that period.
Contingent liabilities classified as remote risk of loss refer to judicial and administrative proceedings involving other matters assessed by legal counsels, such as remote losses, which were not provided for. The main lawsuits are discussed in the following paragraphs.
In December 2008, the Brazilian Federal Revenue Service issued a tax assessment against us in the total amount of R$3.9 billion with respect to IRPJ and CSLL related to 2002 to 2004. The tax authorities assert that we did not meet the legal requirements for deducting amortization of the goodwill arising from the acquisition of Banespa. On October 21, 2011 a unanimous decision of CARF was handed down to cancel the tax assessments corresponding to fiscal years 2002 to 2004. The Brazilian Federal Revenue Service appealed to the Câmara Superior de Recursos Fiscais with respect to the merits but not the fine, and the 2002 fiscal year, which was already being subject to the statute of limitation. Because of these two items, the assessment was reduced to R$1.8 billion. In, December 2017, that decision was reformed in favor of the Brazilian Federal Revenue Service, and Santander Brasil will file a lawsuit to request the cancellation of tax assessment. In June 2010, the Brazilian Federal Revenue Service issued other two infraction notices in the total amount of R$1.4 billion, based on the same concepts as the previous notice, with respect to IRPJ and CSLL related to 2005 to 2007. In these cases, Santander Brasil was not granted a favorable decision, and it has been appealed on its merits, though there was a reduction in the fine of R$367 million, and the assessment was reduced to R$984 million, but one of the infraction notice was judged unfavorably, ending the administrative discussion. The other one is still pending final judgment. As of December 2013, the Brazilian Federal Revenue Service issued another infraction notice, in the total amount of R$344 million with respect to income tax and social contribution related to 2008. Santander Brasil challenged this tax assessment and was granted a favorable decision in the first instance. The tax authority has appealed the decision, which is pending final judgment. In accordance with the advice of our external legal counsel, we believe that the Brazilian Federal Revenue Service’s position is incorrect, and that the risk of loss is remote. We did not record any provision since this issue should not have an impact on our consolidated financial statements.
In addition to the aforementioned proceedings, in June 2013, the Brazilian tax authorities issued an infraction notice against us as the responsible party liable for the tax on the capital gain allegedly obtained in Brazil by an entity not resident in Brazil, Sterrebeeck B.V., as a result of the “incorporação de ações” (a shares merger) transaction carried out in August 2008. As a result of the aforementioned transaction, we acquired all the shares of Banco Real and AAB Dois Par through the delivery to these entities’ shareholders of newly-issued shares through a capital increase carried out for that purpose. The Brazilian tax authorities take the view that in the aforementioned transaction Sterrebeeck B.V. obtained income subject to tax in Brazil consisting of the difference between the issuance value of our shares that were received and the acquisition cost of the shares delivered in the exchange. We filed an appeal against the infraction notice before the CARF which, in March 2018, in a split decision, settled by the casting vote of the Chairman, dismissed the appeal filed by Santander Brasil. This decision will be subject to clarification action and further appeal at the CARF. Based on the advice of our external legal counsel, that the position taken by the Brazilian tax authorities is not correct, that there are arguments for appeal against the infraction notice and that, as a result, the risk of loss is remote. Consequently, we have not recognized any provisions in connection with these proceedings.
On October 10, 2016, after an inspection conducted in rural properties located in the State of Mato Grosso, the Brazilian Environment Authority (Instituto Brasileiro do Meio Ambiente e dos Recursos Naturais Renováveis), or IBAMA, filed an Infraction Notice against the Company based on the ground of financing of corn in an embargoed area. The fine amount was established in an amount of R$47.5 million (approximately US$ 15 million). According to IBAMA, financing seed production on embargoed areas is considered an environmental infraction due to potential environmental damage resulting therefrom. We filed an administrative defense on November 9, 2016, stating that we had not financed production on embargoed area, since the financing agreement with the property owner had no connection with production of seeds. As a consequence of the filing of the administrative defense, the enforceability of the fine is suspended. Although we believe we have presented valid arguments, our risk assessment is probable loss in the administrative proceeding. If we were to lose the administrative proceeding, we may seek review of the administrative finding by a court in a future lawsuit.
On December 8, 2016, the General Superintendency of the Brazilian Anti-Trust Authority (Superintendencia Geral do Conselho Administrativo de Defesa Econômica), or “CADE,” began an investigation into alleged anticompetitive conduct in the real onshore foreign exchange market. The investigation concerns 11 financial institutions, including Santander Brasil, and 19 individuals active in the Brazilian foreign exchange market between 2009 and 2012. On January 8, 2018, we filed an administrative defense stating our understandings that there is no evidence that we were involved in the alleged conduct. We expect that these investigations will not have an adverse impact on it.
According to reports in the news media and other unofficial sources, the Brazilian Federal Public Prosecutor’s Office (“MPF”) has submitted to a federal judge in Sao Paulo a request for the indictment of several individuals, including an executive officer of Santander Brasil, in connection with the alleged bribery of a Brazilian tax auditor to secure favorable decisions in tax cases resulting in a claimed R$83 million (approximately U.S.$25 million) tax credits benefit to Santander Brasil. Pursuant to Brazilian law, the request for indictment must be approved by the judge in order to proceed. As of the date of this annual report neither Santander Brasil nor the relevant executive officer has been officially served with the proposed indictment or is aware of whether the indictment request has been accepted or rejected. Santander Brasil is cooperating fully with the Brazilian authorities and has relinquished the benefit of certain tax credits to which the allegations relate in order to show its good faith. If the indictment were to be approved, our business could suffer reputational harm.
Dividend Policy
General Rules
We are required by Brazilian Corporate Law and our By-Laws to hold an annual general shareholders’ meeting by no later than the fourth month after each fiscal year, at which time, among other things, the allocation of the net profits in the preceding year and the distribution of an annual dividend are approved by our shareholders. The payment of annual dividends is based on our consolidated audited financial statements prepared for the immediately preceding fiscal year.
Our By-Laws provide that an amount equal to at least 25.0% of our adjusted net income, after deducting allocations to the legal and contingency reserves, should be available for distribution as a dividend or interest attributable to shareholders’ equity in any given year. This amount represents the mandatory dividend.
Our board of directors may declare interim dividends or interest attributable to shareholders’ equity based on income verified in semi-annual consolidated financial statements. The board of directors may also declare dividends or interest attributable to shareholders’ equity based on consolidated financial statements prepared for shorter periods, provided that the total dividends paid in each six-month period do not exceed the capital reserves amount required by Brazilian Corporate Law. The board of directors may also declare interim dividends or interest attributable to shareholders’ equity out of retained earnings or income reserves recorded in the last annual or semi-annual balance sheet. Any payment of interim dividends or interest on shareholders’ equity may be set off against the amount of mandatory dividends relating to the net income earned in the year in which the interim dividends were paid.
The amount distributed to shareholders as interest attributable to shareholders’ equity, net of any withholding tax, may be included as part of the minimum mandatory dividend. In accordance with applicable law, we are required to pay to shareholders an amount sufficient to ensure that the net amount they receive in respect of interest attributable to shareholders’ equity, after payment of the applicable withholding tax, plus the amount of declared dividends, is at least equivalent to the amount of the minimum mandatory dividend.
Brazilian Corporate Law allows, however, our shareholders to suspend dividends distribution if our board of directors reports to our annual shareholders’ meeting that the distribution would not be advisable given our financial condition. Our fiscal council, if in operation, should review any suspension of the mandatory dividend. In addition, our management should submit a report to the CVM setting out the reasons for the suspension. Net income not distributed by virtue of a suspension is allocated to a separate reserve and, if not absorbed by subsequent losses, is required to be distributed as a dividend as soon as our financial condition permits such payment.
Current and Future Dividend Policy
We currently recommend to our shareholders a 50% distribution of our yearly adjusted net income as dividends and/or interest attributable to shareholders’ equity. Our future dividend policy and the amount of future dividends and/or interest attributable to shareholders’ equity we decide to recommend to our shareholders for approval will depend on a number of factors, including, but not limited to, our cash flow, financial condition (including capital position), investment plans, prospects, legal requirements, economic climate and such other factors as we may deem relevant at the time.
Payment of Dividends
Any holder of record of shares at the time a dividend is declared is entitled to receive dividends. Under Brazilian Corporate Law, dividends are generally required to be paid within 60 days following the date on which the dividend is declared, unless the shareholders’ resolution establishes another payment date, which, in any event, must occur prior to the end of the fiscal year in which such dividend was declared. Based on Brazilian Corporate Law, unclaimed dividends do not bear interest, are not monetarily adjusted and may revert to us three years after dividends were declared.
The depositary is the registered owner of the units underlying the ADRs on the records of the registrar. Such units are held since December 13, 2016 by Santander Securities Services Brasil Distribuidora de Títulos e Valores Mobiliários S.A. in Brazil, acting as the custodian and agent for the depositary for our ADRs.
Payments of cash dividends and distributions, if any, are made inreais to the custodian on behalf of the depositary, which then converts such proceeds into U.S. dollars and causes such U.S. dollars to be delivered to the depositary for distribution to holders of ADRs. In the event that the custodian is unable to convert immediately the Brazilian currency received as dividends into U.S. dollars, the amount of U.S. dollars payable to holders of ADRs may be adversely affected by depreciation of the Brazilian currency.
The following table sets forth the amounts available for distribution as dividends based on the Brazilian GAAP calculation of net income. The reconciliation of net income under Brazilian GAAP to net income under IFRS is presented in Appendix I of our audited consolidated financial statements for the years ended December 31, 2017, 2016 and 2015.
| | | For the year ended December 31, |
| | | 2017 | | 2016 | | 2015 |
| | | (in millions of R$) |
| Net Income under Brazilian GAAP | | | 7,996 | | | | 5,522 | | | | 6,983 | |
| (-) Legal Reserve | | | 391 | | | | 276 | | | | 349 | |
| (=) Amounts Available for distribution | | | 7,605 | | | | 5,246 | | | | 6,634 | |
| Mandatory Dividends – 25.0% | | | 1,901 | | | | 1,312 | | | | 1,658 | |
| Interest on Shareholder’s Equity | | | 3,800 | | | | 3,850 | | | | 1,400 | |
| Dividends | | | 2,500 | | | | 1,400 | | | | 4,800 | |
| Total (Interest on Shareholder’s Equity and Dividends) | | | 6,300 | | | | 5,250 | | | | 6,200 | |
| Dividends distributed in excess of the Mandatory Dividend | | | 4,399 | | | | 3,938 | | | | 4,542 | |
History of Payment of Dividends and Interest Attributable to Shareholders’ Equity
In 2017, we declared dividends and interest on shareholders’ equity in the gross amount of R$6,300 million, R$1,500 million of which was paid on May 26, 2017, August 25, October 26, 2017 and R$4,800 million which was paid on February 26, 2018.The table below shows the amounts paid to our shareholders in the periods indicated.
| | | For the year ended December 31, |
| | | 2017 | | 2016 | | 2015 | | 2014 | | 2013 |
| | | (in millions of R$, except per share figures) |
| Dividends | | | 2,500 | | | | 1,400 | | | | 4,800 | | | | 840 | | | | 2,100 | |
| Interest attributable to shareholders’ equity | | | 3,800 | | | | 3,850 | | | | 1,400 | | | | 690 | | | | 300 | |
| Total | | | 6,300 | | | | 5,250 | | | | 6,200 | | | | 1,530 | | | | 2,400 | |
| Dividends and interest on capital per 1,000 shares | | | | | | | | | | | | | | | | | | | | |
| Common shares | | | 776.17 | | | | 666.21 | | | | 784.90 | | | | 193.26 | | | | 302.15 | |
| Preferred shares | | | 853.79 | | | | 732.83 | | | | 863.39 | | | | 212.59 | | | | 332.36 | |
8B. Significant Changes
There has been no significant change since the date of our last audited financial statements.
ITEM 9. THE OFFER AND LISTING
9A. Offering and Listing Details
Market Price and Volume Information
On September 18, 2009, our board of directors approved the implementation of the global public offering, which included the issue of 525,000,000 Units (each representing at that date 55 common shares and 50 preferred shares), all registered, without par value, free and clear of any liens or encumbrances, consisting of the simultaneous initial public offering of (i) Units in Brazil on the over-the-counter market, in accordance with CVM Instruction 400 of December 29, 2003, as amended, and (ii) Units abroad, including in the form of ADRs representing ADSs registered with the SEC under the Securities Act.
On October 6, 2009, the Global Offering priced shares at R$23.50 per unit and U.S.$13.40 per ADR. The Units have been traded on the B3 and the NYSE since October 7, 2009.
On April 29, 2014, Santander Spain, our indirect controlling shareholder, announced its intention to launch voluntary exchange offers in Brazil and in the United States to acquire up to all of our shares that were not held by the Santander Group, representing approximately 25% of our share capital, with payment in BDRs or ADRs representative of Santander Spain’s common shares.
On October 30, 2014, the Brazilian Exchange Offer and U.S. the Exchange Offer were concluded. As a result of these offers, the Santander Group’s shareholding increased to 88.3% of our total share capital (not including the shares held by Banco Madesant - Sociedade Unipessoal). Also as a result of the offer in Brazil, our Units were delisted from Level 2 Segment and are now traded at the basic listing segment of B3.
The following table shows our outstanding publicly traded common shares and preferred shares as of April 5, 2018:
| Free Float | | B3 | | NYSE |
| Common shares | | | 185,410,370 | | | | 185,703,811 | |
| Preferred shares | | | 213,214,785 | | | | 185,703,811 | |
| Total | | | 398,625,155 | | | | 371,407,622 | |
Units, Common and Preferred Shares traded on B3
The table below sets forth the high, low and last daily sales prices inreais for our shares on the B3 for the periods indicated.
| | | Reais per share – SANB3 (Common Shares) |
| | | High | | Low | | Last |
| 2013 Annual | | | 0.16 | | | | 0.11 | | | | 0.14 | |
| 2014 Annual(1) | | | 8.50 | | | | 0.10 | | | | 6.70 | |
| 2015 Annual | | | 10.80 | | | | 6.10 | | | | 8.83 | |
| 2016 Annual | | | 19.46 | | | | 6.60 | | | | 19.36 | |
| 1st Quarter | | | 10.13 | | | | 6.60 | | | | 9.31 | |
| 2nd Quarter | | | 11.42 | | | | 8.75 | | | | 9.90 | |
| 3rd Quarter | | | 14.20 | | | | 9.61 | | | | 13.51 | |
| 4th Quarter | | | 19.46 | | | | 12.90 | | | | 19.36 | |
| 2017 Annual | | | 22.92 | | | | 13.01 | | | | 18.49 | |
| 1st Quarter | | | 22.92 | | | | 16.00 | | | | 16.13 | |
| 2nd Quarter | | | 17.60 | | | | 13.01 | | | | 14.75 | |
| 3rd Quarter | | | 17.40 | | | | 14.30 | | | | 15.10 | |
| 4th Quarter | | | 20.03 | | | | 14.90 | | | | 18.49 | |
| Last 6 Months | | | 22.49 | | | | 14.90 | | | | 21.10 | |
| October 2017 | | | 18.50 | | | | 14.90 | | | | 16.50 | |
| November 2017 | | | 17.90 | | | | 16.20 | | | | 16.38 | |
| December 2017 | | | 20.03 | | | | 16.33 | | | | 18.49 | |
| January 2018 | | | 21.83 | | | | 16.91 | | | | 18.25 | |
| February 2018 | | | 22.49 | | | | 19.50 | | | | 21.20 | |
| March 2018 | | | 23.00 | | | | 20.57 | | | | 23.00 | |
| April 2018 (through April 5, 2018) | | | 23.20 | | | | 22.42 | | | | 22.42 | |
| (1) | With the purpose of eliminating the trading in cents of SANB3 (common) and SANB4 (preferred) shares, increasing liquidity and reducing the transaction costs thereof, our shareholders approved on March 18, 2014 (i) a bonus share issue of 19,002,100,957 preferred shares to our shareholders, at the ratio of 0.047619048 preferred shares for each common share (SANB3) or preferred share (SANB4), which resulted in a bonus share issue of five preferred shares for each Unit (SANB11), through the capitalization of reserves in the amount of approximately R$172 million; and (ii) a reverse share split (inplit) of the totality of our common shares and preferred shares at a ratio of 1:55, so that each fifty-five common shares and fifty-five preferred shares would thereafter correspond to one common share and one preferred share, respectively. As a result, each Unit (ticker SANB11) came to be comprised of one common share and one preferred share. The bonus share issue and reverse share split were implemented on June 2, 2014. |
| | | Reais per share – SANB4 (Preferred Shares) |
| | | High | | Low | | Last |
| 2013 Annual | | | 0.16 | | | | 0.11 | | | | 0.14 | |
| 2014 Annual(1) | | | 8.18 | | | | 0.10 | | | | 6.02 | |
| 2015 Annual | | | 7.92 | | | | 5.52 | | | | 7.23 | |
| 2016 Annual | | | 10.59 | | | | 5.40 | | | | 10.05 | |
| 1st Quarter | | | 8.00 | | | | 5.40 | | | | 7.40 | |
| 2nd Quarter | | | 8.27 | | | | 7.20 | | | | 8.09 | |
| 3rd Quarter | | | 9.64 | | | | 7.86 | | | | 8.53 | |
| 4th Quarter | | | 10.59 | | | | 8.57 | | | | 10.05 | |
| 2017 Annual | | | 14.04 | | | | 9.31 | | | | 13.22 | |
| 1st Quarter | | | 13.79 | | | | 9.31 | | | | 11.68 | |
| 2nd Quarter | | | 11.60 | | | | 9.80 | | | | 10.08 | |
| 3rd Quarter | | | 13.58 | | | | 9.99 | | | | 12.50 | |
| 4th Quarter | | | 14.04 | | | | 12.16 | | | | 13.22 | |
| Last 6 Months | | | 16.95 | | | | 12.16 | | | | 15.52 | |
| October 2017 | | | 13.49 | | | | 12.16 | | | | 12.30 | |
| November 2017 | | | 13.35 | | | | 12.20 | | | | 12.21 | |
| December 2017 | | | 14.04 | | | | 12.21 | | | | 13.22 | |
| January 2018 | | | 15.75 | | | | 12.93 | | | | 13.15 | |
| February 2018 | | | 16.95 | | | | 14.80 | | | | 15.20 | |
| March 2018 | | | 16.89 | | | | 15.34 | | | | 16.89 | |
| April 2018 (through April 5, 2018) | | | 17.50 | | | | 17.10 | | | | 17.20 | |
| (1) | On June 2, 2014, as part of our plan to optimize our capital, we carried out a reverse share split of the totality of our issued share capital at rate of 55:1 for each of our common and preferred shares. |
| | | B3
Units – SANB11 |
| | | High | | Low | | Last |
| | | R$ per share |
| 2013 Annual | | | 16.07 | | | | 12.64 | | | | 13.98 | |
| 2014 Annual | | | 16.49 | | | | 10.84 | | | | 13.46 | |
| 2015 Annual | | | 17.99 | | | | 12.21 | | | | 16.04 | |
| 2016 Annual | | | 29.80 | | | | 12.33 | | | | 29.53 | |
| 1st Quarter | | | 18.63 | | | | 12.33 | | | | 16.95 | |
| 2nd Quarter | | | 19.46 | | | | 16.53 | | | | 18.18 | |
| 3rd Quarter | | | 23.45 | | | | 17.74 | | | | 22.00 | |
| 4th Quarter | | | 29.80 | | | | 21.80 | | | | 29.53 | |
| 2017 Annual | | | 36.13 | | | | 22.75 | | | | 31.88 | |
| 1st Quarter | | | 36.13 | | | | 27.42 | | | | 27.65 | |
| 2nd Quarter | | | 29.24 | | | | 22.75 | | | | 25.00 | |
| 3rd Quarter | | | 29.55 | | | | 24.94 | | | | 27.64 | |
| 4th Quarter | | | 33.21 | | | | 27.23 | | | | 31.88 | |
| Last 6 Months | | | 38.88 | | | | 27.23 | | | | 36,57 | |
| October 2017 | | | 31.83 | | | | 27.23 | | | | 28.61 | |
| November 2017 | | | 30.87 | | | | 28.27 | | | | 28.90 | |
| December 2017 | | | 33.21 | | | | 28.57 | | | | 31.88 | |
| January 2018 | | | 37.20 | | | | 30.98 | | | | 31.46 | |
| February 2018 | | | 38.88 | | | | 34.22 | | | | 36.60 | |
| March 2018 | | | 40.00 | | | | 35.95 | | | | 39.91 | |
| April 2018 (through April 5, 2018) | | | 40.43 | | | | 39.65 | | | | 39.70 | |
| (1) | On June 2, 2014, we carried out a reverse share split of the totality of our issued share capital at rate of 55:1 for each of our common and preferred shares. Bonus Shares and Reverse Share Split (Inplit) |
For information on the rights attaching to our common shares and to our preferred shares, please see “Item 10. Additional Information—B. By-Laws—Rights of Common Shares and Preferred Shares.”
ADRs traded on NYSE
Our ADRs have been listed and traded on the NYSE since October 7, 2009. Our Units abroad, including in the form of ADRs representing ADSs are registered with the SEC under the Exchange Act.
The deposit agreement, pursuant to which ADRs have been issued is between us and The Bank of New York Mellon, as depositary, and the holders from time to time of ADRs. For further information on our arrangements with The Bank of New York Mellon, please see “Item 12. Description of Securities other than Equity Securities—D. American Depositary Receipts.”
Since certain of our shares and our ADRs are held by nominees, the number of record holders may not be representative of the number of beneficial owners.
| | | NYSE
ADR – BSBR |
| | | High | | Low | | Last |
| | | U.S.$ per ADR |
| 2013 Annual | | | 8.08 | | | | 5.71 | | | | 5.97 | |
| 2014 Annual | | | 7.18 | | | | 4.48 | | | | 5.02 | |
| 2015 Annual | | | 5.98 | | | | 2.96 | | | | 3.89 | |
| 2016 Annual | | | 9.12 | | | | 3.02 | | | | 8.89 | |
| 1st Quarter | | | 4.93 | | | | 3.02 | | | | 4.65 | |
| 2nd Quarter | | | 5.74 | | | | 4.41 | | | | 5.70 | |
| 3rd Quarter | | | 7.19 | | | | 5.33 | | | | 6.70 | |
| 4th Quarter | | | 9.12 | | | | 6.66 | | | | 8.89 | |
| | | NYSE
ADR – BSBR |
| | | High | | Low | | Last |
| | | U.S.$ per ADR |
| 2017 Annual | | | 11.75 | | | | 6.86 | | | | 9.67 | |
| 1st Quarter | | | 11.75 | | | | 8.67 | | | | 8.82 | |
| 2nd Quarter | | | 9.40 | | | | 6.86 | | | | 7.53 | |
| 3rd Quarter | | | 9.48 | | | | 7.48 | | | | 8.74 | |
| 4th Quarter | | | 10.00 | | | | 8.36 | | | | 9.67 | |
| Last 6 Months | | | 11.93 | | | | 8.36 | | | | 11.22 | |
| October 2017 | | | 9.89 | | | | 8.60 | | | | 8.69 | |
| November 2017 | | | 9.43 | | | | 8.36 | | | | 8.75 | |
| December 2017 | | | 10.00 | | | | 8.74 | | | | 9.67 | |
| January 2018 | | | 11.72 | | | | 9.78 | | | | 9.99 | |
| February 2018 | | | 11.93 | | | | 10.36 | | | | 11.52 | |
| March 2018 | | | 12.05 | | | | 10.96 | | | | 12.02 | |
| April 2018 (through April 5, 2018) | | | 12.11 | | | | 11.82 | | | | 11.87 | |
9B. Plan of Distribution
Not applicable.
9C. Markets
Our Units, common and preferred shares are traded on B3. The regulation of Brazilian securities markets which affects such securities is described below. In addition, we also have ADRs which have been listed and traded on the NYSE since October 7, 2009. For further information, see “Item 9. The Offer and Listing—A. Offering and Listing Details.”
Regulation of Brazilian Securities Markets
The Brazilian securities market is regulated by the CVM, as provided for by Law 6,385 of December 7, 1976, or the “Brazilian Securities Market Law,” and by the Brazilian Corporate Law, as well as the CMN and the Brazilian Central Bank.
Under Brazilian Corporate Law, a corporation is either publicly held (companhia aberta) or privately held (companhia fechada) and unlisted. All publicly-held companies must be registered with the CVM and are subject to reporting and other regulatory requirements. A company registered with the CVM may list its securities either on the Brazilian stock exchange market or on Brazilian over-the-counter markets. The shares of a publicly held company may also be traded privately.
In Brazil, the over-the-counter market is divided into two categories: (i) organized over-the-counter markets, in which the transactions are supervised by self-regulating entities authorized by the CVM; and (ii) non-organized over-the-counter markets, in which the transactions are not supervised by self-regulating entities authorized by the CVM. In either case, the over-the-counter markets consist of direct trades, outside of the stock exchange market, through a financial institution registered with the CVM, which serves as an intermediary. No special application, other than registration with the CVM (and, in case of organized over-the-counter markets, registration with the applicable one), is necessary for securities of a public company to be traded in these markets.
To be listed on the B3, a company must apply for registration with the CVM and B3.
Trading on the B3 (current name of BM&FBOVESPA)
The B3 currently gathers all trading activities of shares and commodities in Brazil, including settlement, clearing and depositary services.
Trading on the Brazilian stock exchange is conducted by authorized members. Trading sessions in the shares market take place every business day, from 10:00 a.m. to 5:00 p.m. between March and October and from 10:00 a.m. to 6:00 p.m. between November and February, on an electronic trading system called PUMA. Trading is also conducted from March to October between 5:30 p.m. and 6:00 p.m. in an after-market system connected to both traditional brokerage firms and brokerage firms operating on the Internet. This after-market trading is subject to regulatory limits on price volatility of securities traded by investors operating on the Internet.
The trading of securities on the B3 may be suspended at the request of a company in anticipation of a material announcement. Trading may also be suspended on the initiative of the B3 or the CVM, among other reasons, based on or due to a belief that a company has provided inadequate information regarding a significant event or has provided inadequate responses to inquiries by the CVM or the B3.
In addition, in order to maintain control over the fluctuation of the B3 index, the B3 has adopted a “circuit breaker” system pursuant to which trading sessions may be suspended for a period of 30 minutes, one hour, or a time to be defined by B3, whenever the B3 index falls below 10.0%, 15.0% or 20.0%, respectively, in relation to the closing index levels of the previous trading session.
When investors trade shares on the B3, the trade is settled in three business days after the trade date, without adjustments to the purchase price. The seller is ordinarily required to deliver the shares to the exchange on the third business day following the trade date. Delivery of and payment for shares are made through the facilities of an independent clearing house, a division of the B3, which handles the multilateral settlement of both financial obligations and transactions involving securities. According to the regulations of the B3, financial settlement is carried out through the system of transfer of funds of the Brazilian Central Bank and the transactions involving the sale and purchase of shares are settled through the B3 custody system. All deliveries against final payment are irrevocable.
In order to keep our securities listed on the B3, we are required to comply with the provisions of the B3’s Issuer Manual (Manual do Emissor), which establishes technical and operational procedures and criteria applicable to companies that have securities for listed on the B3. The most up to date version of the B3’s Issuer Manual became effective as of January 1, 2018.
Corporate Governance Practices
In 2000, B3 introduced three special listing segments, known as Levels 1 and 2 of Corporate Governance and Novo Mercado, aimed at fostering a secondary market for securities issued by Brazilian companies listed on the B3, and it prompted such companies to follow good corporate governance practices. The listing segments are designed for the trading of shares issued by companies voluntarily undertaking to abide by corporate governance practices and disclosure requirements in addition to those already imposed by Brazilian law. The listing requirements were updated on May 10, 2011.
Our Units were initially listed on the Level 2 Segment. However, as a result of the Brazilian Exchange Offer and the U.S. Exchange Offer launched by Santander Spain in Brazil for the acquisition of our shares, our Units were delisted from Level 2 Segment and are now traded at the basic listing segment of B3.
Within the B3 we are part of one sustainability index: ISE. The ISE (Índice de Sustentabilidade Empresarial – Entrepreneurial Sustainability Index) is a reference for socially responsible investments in Brazil. To be part of the portfolio composed by 40 companies, the company participates in a careful process to evaluate its performance in regards to sustainability, including economic efficiency, environmental balance, social practices and corporate governance.
In 2016, the Brazilian Code of Corporate Governance for Publicly-held Companies (Código Brasileiro de Governança Corporativa – Companhias Abertas), or the “Governance Code,” was published by the Brazilian Institute of Corporate Governance (Instituto Brasileiro de Governança Corporativa). The Governance Code sets forth corporate governance related principles, guidelines and actions applicable for publicly-held companies and establishes a “comply or explain” enforcement model. On June 8, 2017, following a public consultation on the implications of the Governance Code for Brazilian companies, the CVM issued Normative Ruling No. 586 introducing the necessary changes to the existing securities regulation in order to make these consistent with the provisions of the Governance Code.
The new rules established by new CVM ruling apply to companies (i) which are registered as category “A” issuers, (ii) whose securities have been traded on the B3 since January 1, 2018, and (iii) which, on the publication date of CVM Instruction 586, had at least one of their securities included in the Brazil Index 100 – IBrX-100 (Índice Brasil 100) or within the Bovespa Index – IBOVESPA (Índice Bovespa). We fulfill all three of these criteria and are therefore subject to the new CVM rules.
Investment in Our Units by Non-Residents of Brazil
Investors residing outside Brazil, including institutional investors, may either register their investments in securities in Brazil, as a foreign direct investment under Law 4,131/62, or as a portfolio investment under the applicable regulation enacted by CMN and CVM. Foreign investors, regardless of whether their investments are made as direct investments or portfolio investments, must be enrolled with the Brazilian Internal Revenue. This registration process is undertaken by financial institution or an institution authorized to operate by the Brazilian Central Bank as the investor’s legal representative in Brazil.
Since March 30, 2015, portfolio investments are regulated by CMN Resolution 4,373, of September 29, 2014 (“CMN Resolution 4,373”), which revoked CMN Resolution 2,689, of January 26, 2000, which had been in force for about 15 years.
The main purpose of CMN Resolution 4,373 is to facilitate the entry of foreign investors in the Brazilian financial and capital markets. CMN Resolution 4,373 introduces the possibility for foreign investors of making investments in local currency with funds held in foreign bank accounts of the non-resident investor, or with bills of payment denominated inreais but issued abroad.
With certain limited exceptions, CMN Resolution 4,373 allows investors to carry out any type of transaction in the Brazilian capital markets involving a security traded on a Brazilian stock or futures exchange or organized over-the-counter market, but investors may not transfer the ownership of investments made under such regulation to other non-Brazilian holders through private transactions. Investments and remittances outside Brazil of gains, dividends, profits or other payments under our Units are made through the foreign exchange market.
For further information on the requirements for the registration of foreign portfolio investments, see “Item 10. Additional Information—D. Exchange Controls—Foreign Investment in Brazil—Capital Markets Investment.”
In their turn, foreign direct investors under Law 4,131/62 may sell their shares in both private and open market transactions, but these investors are currently subject to a less favorable tax treatment on gains, apart from being subject to taxation on the execution of foreign exchange transactions. For more information on foreign direct investors, see “Item 10. Additional Information—D. Exchange Controls—Foreign Investment in Brazil—Foreign Direct Investment.”
Since March 30, 2015, CMN Resolution 4,373 also deals with investments of foreign capitals in Brazil through Depositary Receipts (“DRs”), and revoked the former rule (CMN Resolution 1,927 of May 18, 1992).
We filed an application to have the ADRs approved under the former rule by the Brazilian Central Bank and the CVM, and we received final approval on October 1, 2009.
If a holder of ADRs decides to exchange ADRs for the underlying Units, the holder will be entitled to (i) sell the Units on the B3 and rely on the depositary’s electronic registration for five business days from the date of exchange to obtain and remit U.S. dollars abroad upon the holder’s sale of our Units, (ii) convert its investment into a foreign portfolio investment under CMN Resolution 4,373, or (iii) convert its investment into a foreign direct investment under Law 4,131/62. See “Item 10. Additional Information—E. Taxation—Brazilian Tax Considerations” for a description of the tax consequences for an investor residing outside Brazil of investing in our Units in Brazil.
If a holder of ADRs wishes to convert its investment into either a foreign portfolio investment under CMN Resolution 4,373 or a foreign direct investment under Law 4,131/62, it should begin the process of obtaining its own foreign investor registration with the Brazilian Central Bank or with the CVM, as the case may be, in advance of exchanging the ADRs for common shares.
The custodian is authorized to update the depositary’s electronic registration to reflect conversions of ADRs into foreign portfolio investments. If a holder of ADRs elects to convert its ADRs into a foreign direct investment under Law 4,131/62, the conversion will be effected by the Brazilian Central Bank after receipt of an electronic request from the custodian with details of the transaction. This may also involve the need to change the Units into shares.
If a foreign direct investor under Law 4,131/62 wishes to deposit its Units into the ADR program in exchange for ADRs, such holder will be required to present to the custodian evidence of payment of capital gains taxes. The conversion will be effected by the Brazilian Central Bank after receipt of an electronic request from the custodian with details of the transaction. This may also involve the need to change the Units into shares.
The Brazilian federal constitution permits foreign individuals or companies to invest in the voting shares of Brazilian financial institutions only if they have specific authorization by the President of Brazil based on national interest or reciprocity. A presidential decree issued on November 13, 1997, in respect of Banco Meridional do Brasil S.A. (a predecessor entity) allows up to 100% foreign participation in our capital stock. Foreign investors may acquire our Units or ADRs as a result of this decree. In addition, foreign investors may acquire publicly traded non-voting shares of Brazilian financial institutions traded on a stock exchange or depositary receipts offered abroad representing non-voting shares without specific authorization. See “Item 4. Information on the Company—B. Business Overview—Regulation and Supervision—Foreign Investment in Brazilian Financial Institutions.”
9D. Selling Shareholders
Not applicable.
9E. Dilution
Not applicable.
9F. Expenses of the Issue
Not applicable.
ITEM 10. ADDITIONAL INFORMATION
10A. Share Capital
Not applicable.
10B. By-Laws
We describe below a summary of the important provisions of our By-Laws and of the corporate and Brazilian capital markets legislation and regulations. This description is not intended to be exhaustive. It is based on our By-Laws (an English translation of which is attached as an exhibit to this annual report), as well as on the legislation and regulations applicable to companies and the Brazilian capital market currently in effect.
Registration and Business Purpose
We are a publicly-held company, incorporated under Brazilian law. Our documents of incorporation are duly registered with JUCESP, under NIRE 35300332067.
Pursuant to article 4 of our By-Laws, our corporate purpose is to (i) participate in asset, liability and accessory transactions related to our respective authorized portfolios (commercial, investment, credit, financing and investment, real estate credit and leasing), (ii) carry out foreign exchange transactions; (iii) manage investment portfolios; (iv) any other transaction that would be allowed by law and regulations in force; and (v) participate, as shareholder or quotaholder, in other companies.
Managers’ Role and Conflict of Interests
Brazilian Corporate Law imposes on the members of the board of directors and officers the duty of diligence during the performance of their functions, as well as the duty of loyalty to the company besides prohibiting the member of the board of directors and the officers from: (i) receiving any type of direct or indirect personal advantage from third parties, by virtue of the position occupied, without authorization in the By-Laws or from a shareholders’ meeting; (ii) taking part in any corporate transaction in which he or she has an interest that conflicts with our interest or in the decisions made by other directors on the matter; (iii) use any commercial opportunity which may come to his or her knowledge, by virtue of his or her position, for his or her own benefit or that of a third party, whether or not harmful to the company; (iv) fail to exercise or protect the company’s rights or to take
advantage of a commercial opportunity of interest to the company, in seeking to obtain advantages for himself or herself or for a third party; and (v) acquire for resale with profit property or rights which he or she knows the company needs or which the company intends to acquire.
As we are a financial institution, we are subject to certain prohibitions established by the Banking Reform Law, as amended by Law 13,506 of November 13, 2017, or “Law 13,506/17,” as well as related regulations. For more information in relation to such prohibitions, see “Item 4B. Regulation and Supervision—Principal Limitations and Obligations of Financial Institutions.”
In addition to these provisions, Article 10 of our By-Laws provides that board members and officers are forbidden to be involved in the analysis, approval or settlement of business deals or loans relating to a company where (i) they hold more than 5% of the capital stock as partners or shareholders, or where they are members of the management, or (ii) had been members within a period of up to six months before their appointment. Finally, our policy for transactions with related parties also sets forth procedures to be followed by managers involved in such transactions, and when other potential conflicts of interest may arise.
Rights of Common Shares and Preferred Shares
Each common share gives its holder the right to a vote at general meetings. In their turn, the preferred shares do not grant voting rights in our shareholders’ general meetings, except as related to the following matters:
| · | change of corporate status, merger, consolidation or spin-off; |
| · | approval of agreements entered into between us and our controlling shareholder, directly or indirectly, and agreements with other companies in which our controlling shareholder has an interest, whenever the law or the By-Laws provide that they must be approved at a shareholders’ general meeting; and |
| · | the appraisal of assets to be contributed to increase our capital stock. |
As regards the election of members of the board of directors, the Brazilian Corporate Law sets forth that, when members of the board of directors are elected, minority holders of shares in public companies holding a minimum of 15% of the total number of voting shares, or holders of preferred shares without voting rights, or with restricted voting rights, representing 10% of the capital stock, or holders of common and preferred shares who jointly represent at least 10% of the capital stock, have the right to elect one member of our board of directors in a separate vote. Nevertheless, these rights can only be exercised by the holders of shares that maintained their holding for at least three months before the date of the annual shareholders’ meeting. The Brazilian Corporate Law also permits a multiple vote procedure to be adopted, upon request by shareholders representing at least 10% of our voting capital. Pursuant to CVM Instruction 282 of June 26, 1998, the percentage needed to call for a multiple vote to elect members of the board of directors, in public companies with capital stock exceeding R$100 million, is 5% of the voting capital per request of multiple vote.
The holders of preferred shares are entitled to the following rights according to our By-Laws:
| · | dividends and interest on shareholders’ own equity in an amount 10% higher than those attributed to common shares, as well as priority in the distribution; |
| · | participation on equal terms with the common shares conditions, in capital increases arising from the capitalization of reserves and income, as well as in the distribution of bonus shares created by the capitalization of accrued income, reserves or any other resources; |
| · | priority in reimbursement of capital, without payment of premium, in the case of liquidation; and |
| · | tag-along rights in the event of a change in our control, under the same terms and conditions extended to our controlling shareholders. |
Common shares not belonging to the controlling shareholders also give their holders tag-along rights in the event that our control is transferred on the same terms and conditions as those granted to our controlling shareholders.
The shareholders’ general meeting may decide on conversion of the preferred shares into common shares.
The Brazilian Corporate Law sets forth that shares without voting rights or shares with restricted rights, including our preferred shares, shall be granted unrestricted voting rights if the company ceases to distribute, during three consecutive fiscal years, any fixed or minimum dividend granted to these shares, until the respective distributions are made.
According to our By-Laws, the dividends that are not claimed by shareholders within three years, from the beginning of their payment, shall prescribe to our benefit.
Under the Brazilian Corporate Law, any change in the preferences or that have an adverse financial effect on the rights of the holders of our preferred shares, or any change that results in the creation of a more favored class of preferred shares, must be approved by a resolution at a general shareholders’ meeting and will become valid and effective only after approval by a majority of our preferred shareholders in a shareholders’ meeting.
Brazilian Corporate Law also sets forth that the following shareholders’ rights cannot be repealed or modified by our By-Laws or decisions made at shareholders’ meetings:
| · | the right to vote at general meetings, in the case of holders of common shares; |
| · | the right to share in the distribution of dividends and interest on shareholders’ equity, and to share in the surplus assets in the event of our liquidation; |
| · | preemptive rights in subscribing for shares or convertible securities in specific circumstances; |
| · | the right to monitor the management; and |
| · | the right of withdrawal in the circumstances established by law, including our consolidation, merger and spin-off. |
Description of Units
The Units are share deposit certificates, each representing one common share and one preferred share, all of them free and unencumbered. The shares represented by the Units shall be registered in a trust account linked to the Units, and their ownership can only be transferred by means of a transfer of the corresponding Units, upon written instructions from the holder. Earnings from the Units and the amount received in the case of redemption or repayment shall only be paid to the holder of the Units registered in the books of the custodian.
None of the shares underlying the Units, the earnings thereon or the corresponding redemption or repayment amounts may be pledged, encumbered or in any other way given in guarantee by the holder of the Units, nor may they be subject to attachment (penhora), seizure (arresto), impounding (sequestro), search and apprehension (busca e apreensão), or to any other lien or encumbrance.
The Units are held by us (except units that underlie the ADSs which are held by our affiliate, Santander Securities Services Brasil Distribuidora de Títulos e Valores Mobiliários S.A.), as the custodian, in book-entry form in an account opened in the holder’s name and the transfer of ownership is effected by debiting the seller’s Unit account and crediting the buyer’s Unit account according to a written transfer order issued by the seller or a court authorization or transfer order delivered to the custodian. The custodian will retain all the written transfer orders sent by the holders of the Units, as well as the court authorizations or transfer orders. Dividends, interest on shareholders’ equity and/or cash bonuses shall be paid to the custodian and the custodian shall then transfer the amount to the custody agents for payment to the Unit holders. The pledge, usufruct, right of succession, fiduciary transfer in guarantee and any other conditions, onus or encumbrances on the Units must be registered in the custodian’s records, as well as noted in the corresponding statement of account of Units.
The custodian shall provide Unit holders with a statement of account at the end of each month in which there is movement and, even if there is no movement, at least once a year. The statement shall show the date and place of issue, the name and details of the holder of the Unit account, an indication that it is a statement of Unit account, details of the shares deposited, a statement that the shares deposited, their earnings and any amounts received in the event of redemption or repayment shall only be paid to the holder of the Unit account or to the holder’s order in writing, our charge for the deposit, if any, and the addresses where Unit holders may obtain assistance.
Upon a written order issued by the holder of the Unit account to a broker authorized by the stock exchange where the Units are traded, the custodian shall block the corresponding Units and transfer them to the buyer upon receipt of a confirmation of the sale from the stock exchange.
The Unit holder shall have the right, at any time, to instruct a broker to cancel Units and transfer the underlying shares. The broker must request to us, as agent, to transfer the Units to the share deposit accounts held by the custodian in the holder’s name. The Unit holder shall bear any transfer and cancellation costs involved. Similarly, the holder may instruct a broker to assemble Units by transferring the number of shares that jointly represent a Unit, which shall be registered by the custodian in a trust account linked to the Units.
The right to cancel Units may be suspended in the event of a public offering for distribution of Units, either in the domestic or the international market, in which case the suspension may not last longer than 180 days. Units subject to any lien or encumbrance may not be cancelled.
The following rules apply to the exercise of the rights granted to the shares represented by Units:
| · | Dividends and share redemption or repayment amounts delivered to us, as depository of the shares, shall be paid by us to the Unit holder; |
| · | Only the Unit holder shall have the right to attend our general meetings and to exercise all of the prerogatives conferred on our shareholders by the shares represented by the Units; |
| · | In the event of a stock split, cancellation or reverse stock split or new issuances of shares by us while the Units are in existence, the following rules will be observed: |
| (1) | In the event there is a change in the number of shares represented by Units as a result of a reverse stock split or cancellation of shares, we will debit from the Unit accounts the number of cancelled shares of each Unit holder and proceed with the automatic cancelation of Units, observing the ratio of one common share and one preferred share issued by us to each Unit. We will deliver to the shareholders those shares that are insufficient to constitute a Unit in the form of shares, rather than Units; and |
| (2) | In the event there is a change in the number of shares represented by the Units as a result of a stock split or new issuances of shares, the custodian will register the deposit of the new shares and issue new Units, registering them in the accounts of their respective holders, so as to reflect the new number of shares held by unit holders, maintaining a ratio of one common share and one preferred share issued by us and represented by Units, and will deliver to holders those shares that are insufficient to constitute a Unit in the form of shares rather than Units; |
In the event of a capital increase by means of the issue of shares that may be converted into new Units, Unit holders may exercise the preemption rights belonging to the shares represented by their Units. We shall create new Units in the register of book-entry Units and credit them to their holders so as to reflect the new number of common and preferred shares issued by us, subject to the current proportion of ordinary and preferred shares to constitute the Units. Shares that are too few to constitute a Unit shall be delivered to the shareholders as shares, rather than Units. There shall be no automatic credit of Units in the event of the exercise of preemption rights in the issue of securities other than shares.
Unit holders will be entitled to receive any shares issued as a result of our spin-off, consolidation or merger.
General Meetings
At our duly convened and installed general meetings, our shareholders are authorized to resolve on business related to our activities and to take the decisions they deem to be in our interests.
Our shareholders are exclusively responsible for approving the financial statements at the annual general meeting, and to decide on the destination of net earnings and the distribution of dividends for the year immediately preceding the meeting. The members of the board of directors and fiscal council are, as a general rule, elected at annual general meetings unless for an exceptional reason they have to be elected at an extraordinary general meeting.
An extraordinary general meeting may be held at any time, including together with an annual general meeting. Our shareholders in a general meeting are exclusively responsible for approving, among other matters: (i) amendments to our By-Laws; (ii) election and dismissal of members of our board of directors; (iii) creation of any reserves of profits, other than the legal reserve; (iv) suspension of the rights of a shareholder that has failed to comply with obligations under the law or our By-Laws; (v) approval of our incorporation, merger or spin-off; and (vi) approval of our dissolution or liquidation, approval of reports prepared by the liquidators and the election of a liquidator and members of the fiscal council to operate during a liquidation.
Quorum of General Meetings
As a general rule, the Brazilian Corporate Law sets forth that a general meeting can be held if shareholders holding at least 25% of the voting capital stock are present, at the first call, and at the second call if any number of holders of voting shares are present. If the shareholders have been convened to resolve on amendments to the By-Laws, the quorum at the first call must be at least 2/3 of the voting shares and, at the second call, any number of holders of voting shares.
The CVM may authorize the aforementioned quorum, set forth in the Brazilian Corporate Law, to be reduced in the case of a publicly held company with widely held shares, and where the last three general meetings have been attended by shareholders representing less than half the voting shares.
In general, the approval of any matter must occur through votes of shareholders attending a general meeting in person, or through a proxy, corresponding at least to a majority of the common shares represented at the meeting, and abstentions are not taken into account for this calculation. Nevertheless, the affirmative vote of shareholders representing at least one half of the voting shares is needed for the approval of the following matters, among others: (i) reduction of the mandatory dividend to be distributed to our shareholders; (ii) changes in our business purpose; (iii) our merger, spin-off or incorporation; (iv) our participation in a corporate group (as defined by the Brazilian Corporate Law); (v) the termination of a state of liquidation; and (vi) our dissolution.
Call Notice of our Shareholders’ General Meetings
The Brazilian Corporate Law requires all general meetings to be called by a minimum of three entries in the Official Gazette of the State of São Paulo and in other two mass circulation newspaper in São Paulo, where the B3 is located. Our call notices of meetings are currently published in the Official Gazette of the State of São Paulo, the official journal of São Paulo state, and in the Valor Econômico newspaper. The first call must be published not more than 30 days before the date of the meeting, and the second call not more than eight days in advance. However, in certain circumstances, at the request of any shareholder, the CVM may (i) after consulting us, require the shareholders’ meeting to be postponed and held 30 days after the first call; and/or (ii) suspend for up to 15 days the advance notice required for an extraordinary general meeting, to give the shareholder time to understand and analyze the proposals to be voted on at the meeting. The call notices must give full details of the agenda for the meeting (the term “general matters” being prohibited) and the adequate supporting documents must be available to the public on the CVM’s website from the date of publication of the first call.
Place of our Shareholders’ General Meetings
Our shareholders’ meetings are held at our headquarters at Avenida Presidente Juscelino Kubitschek, 2041/2235, Bloco A, Vila Olímpia, in the city of São Paulo, state of São Paulo, Brazil. The Brazilian Corporate Law allows our shareholders to hold meetings outside our headquarters in an event of force majeure, provided that the meetings are held in the city of São Paulo and the relevant notice contains a clear indication of the place where the meeting will be held.
Responsibility for Calling General Meetings
It is usually the responsibility of our board of directors to call a general meeting, provided that such meetings may also be called by the following persons or bodies: (i) any shareholder, when our directors fail to call a meeting within 60 days of the date required by law or by our By-Laws; (ii) shareholders representing a minimum of 5% of our capital stock, if our managers fail to call a meeting, within eight days, in response to a justified request submitting matters to be discussed; (iii) shareholders representing a minimum of 5% of our capital stock, if our board of directors fail to call a meeting intended to install a fiscal council, within eight days of the request being made; and (iv) the fiscal council (if already installed), if our board of directors fails to call the annual general meeting; and the fiscal council can also call an extraordinary general meeting whenever there are serious or urgent reasons.
Conditions for Admission to a General Shareholders’ Meetings
Shareholders attending general meetings must prove that they are the holders of shares with voting rights, as set forth in the Brazilian Corporate Law. Our shareholders may be represented by a proxy (including a public proxy in accordance with CVM Instruction 481, of December 17, 2009, as amended), appointed not more than one year before the date of the meeting, and this representative must be a shareholder, a manager, a lawyer or, in the case of a publicly-held company, as ours is, a financial institution. Investment funds may be represented by their respective administrators.
Remote Voting
The CVM has enacted a regulation which establishes rules for remote participation and voting in general meetings of publicly-held companies.
Since January 1, 2017, the rule became applicable to all publicly-held companies that on April 9, 2015 had at least one type or class of share listed included in either the IBrX-100 or the IBOVESPA indices, as is our case. Accordingly, since the beginning of 2017 we have in place the necessary structure to allow our shareholders to participate and vote remotely at general meetings. For this purpose, our shareholders must follow the voting procedures disclosed by us in the call notice for the relevant general meeting to transfer the voting pronouncements including by contacting either us or the custodians (whom will be responsible for transferring the voting pronouncements to us), pursuant to the terms of the applicable regulation.
Policy on Trading in Our Own Securities
The objective of our Policy on Trading in Our Own Securities, prepared in accordance with in accordance with CVM Instruction 358 of January 3, 2002, as amended (“CVM Instruction 358”), is: (i) to control and punish those persons with access to privileged information and who use this information to trade in securities issued by us; and (ii) to establish rules for trading in our securities.
The purpose of this policy is to avoid insider trading (the furnishing of privileged information from which third parties may benefit) and to ensure transparency in the trading of our securities. Our trading policy establishes blackout periods for trading in our shares by ourselves, our controlling shareholders (direct or indirect), members of the board and of our fiscal council (when one has been installed) and other technical or consultative bodies or other persons who, by virtue of their job, position or commercial, professional or trust relationship with us, have access to any privileged information. This is intended to avoid improper use of information not disclosed to us.
Among other matters, our policy establishes that the persons subject to it shall refrain from buying or selling, by themselves or via their direct dependents or by using directly or indirectly controlled companies, any securities issued by us, or backed by them, as well as their respective derivatives:
| (1) | From the time when such persons become aware of material information that may affect the value of our securities, until such information is disclosed to the public. Those subject to the policy may trade in Company securities received or acquired under our variable compensation plans only during a period of 30 days from the date when such securities are vested, and after the end of the corresponding lock-up period, for the purpose of disposing of them, subject to the undertakings described in the following items; |
| (2) | During the period between our decision to increase capital stock, issue securities, distribute dividends, pay bonuses, or execute a stock split or a reverse stock split, and the publication of the corresponding notices or announcements; |
| (3) | When it is intended to carry out a takeover, a total or partial spin-off, transformation or corporate reorganization; |
| (4) | During the 30-day period prior to the publication of annual or six-monthly financial statements, or quarterly financial information. However, exceptionally in the case of issues of fixed-rate securities by us by means of a public offer overseas, in order to raise funds for us in the ordinary course of our business, including medium term notes issued by us, this period shall be reduced to 15 days before the publication of such statements. |
Our policy also establishes that our controlling shareholders, officers, and members of our board of directors, members of our fiscal council (when there is an active one) and members of any other bodies with technical or consulting functions created by a provision in the By-Laws, shall not trade securities issued by us or their respective derivatives on the same day that we, our controlled or associated companies or any other company under their common control are selling shares held in treasury or purchasing shares to be held in treasury, or while holding open orders to deal in our shares. However, such prohibition shall not apply if the acquisition or sale of our shares by us has the specific purpose of making feasible the management of risk arising out of our activities as market maker of certain funds indexes.
Right to Withdrawal
The Brazilian Corporate Law gives our shareholders the right to withdraw from Santander Brasil, upon reimbursement of the equity value of their shares, if the shareholder disagrees with or abstains from voting on certain resolutions approved in shareholders’ general meetings.
According to the Brazilian Corporate Law, the right of withdrawal may be exercised in the following circumstances, among others as provided by law: (i) a change in the preferences, privileges or repayment or redemption conditions granted to our preferred shares, or the creation of a new, more favored class of shares (in which case, only a shareholder who is adversely affected by such change or creation shall have the right of withdrawal); (ii) spin-off (subject to the conditions below); (iii) a reduction in our mandatory dividend; (iv) a change in our corporate purpose; (v) a merger or incorporation with another company in specific circumstances (as described below); (vi) our joining to a group of companies, as defined in the Brazilian Corporate Law; (vii) a corporate transformation; (viii) the takeover of all of our shares by another Brazilian company, so as to make us its wholly-owned subsidiary; or (ix) the acquisition of control of another company at a price exceeding the legal limits.
The Brazilian Corporate Law also provides that a spin-off of a company shall entitle its shareholders to withdraw only if it results in: (i) a change in the corporate purpose, unless the assets spun off are transferred to a company whose principal activity coincides with the business purpose of spun-off company; (ii) a reduction in the mandatory dividend; or (iii) becoming part of a group of companies, as defined in the Brazilian Corporate Law. Besides, in the event of a consolidation or merger of us into another company, or when we become part of a group of companies (as defined in the Brazilian Corporate Law), our shareholders will not be entitled to withdraw from our company if the shares of such companies (a) are liquid, i.e., are listed on the 3 general index or on any other Stock Exchange index, as defined by the CVM, and (b) are widely held, such that our controlling shareholders or other companies under common control hold less than half the shares of the type or class to which the right of withdrawal corresponds. The right of withdrawal must be exercised within 30 days of publication of the minutes of the general meeting resolving on the matter that gave rise to such right. Furthermore, we have the right to reconsider any resolution that has given rise to a right of withdrawal, during the ten days following the end of the period for exercising the right, if we consider that the payment of the price for buying out dissident shareholders would put our financial stability at risk.
Shareholders who exercise the right to withdrawal shall receive the equity value of their shares, based on the latest balance sheet approved at a general meeting. If, however, the resolution giving rise to the right of withdrawal was passed more than 60 days after the date of the latest approved balance sheet, a shareholder may call for a special balance sheet to be prepared as of a date not more than 60 days before the resolution, to assess the value of the shares. In this case, we must immediately pay 80% of the reimbursement value, calculated according to the latest balance sheet approved by our shareholders, and the balance within 120 days of the date of the resolution of the general meeting.
Redemption of Shares
According to the Brazilian Corporate Law, we may redeem our shares by means of a resolution passed at a general meeting by votes representing at least 50% of the shares affected by the redemption. Shares may be redeemed out of retained profits, revenues reserves or capital reserves. If not all of the shares are to be redeemed, a lottery ballot shall be held. If custody shares are selected in the ballot and the custody agreement does not provide for the situation, the financial institution must specify the proportion of shares to be redeemed.
Preemption Rights
Our shareholders have preemptive rights to subscribe for shares in any capital increase, in proportion to their shareholding at the time of the increase. Our shareholders also have preemptive rights in any offer of our shares or subscription warrants. A period of not less than 30 days from the publication of the notice to shareholders of the capital increase is allowed for the exercise of preemptive rights, and these rights are transferable.
However, according to the Brazilian Corporate Law and our By-Laws, our shareholders do not have preemptive rights in cases of granting or exercise of any share call option. In addition, our board of directors may exclude the preemptive right of our shareholders or reduce the exercise period, in the issuance of shares and subscription warrants whose placement is made through sale on stock exchange or public subscription, or share exchange, in a public offering of control acquisition.
Purchase of Our Own Shares
Our By-Laws authorize our board of directors to approve the purchase of our own shares. In any of the following circumstances, the decision, will only become effective upon prior approval by a shareholders meeting: (i) acquisition on an organized securities market involving more than 5% of our outstanding shares of a certain type or class in less than 18 months; (ii) acquisition on an organized securities market for prices 10% above the market price; (iii) acquisition aiming at changing or preserving our share control composition or our management structure; or (iv) where the counterparty in an acquisition out of the organized securities markets is related to us (according to the applicable accounting rules). The decision to purchase our shares will be disclosed to the markets and the respective trade be settled within 18 months from the approval.
The decision to acquire our shares is also subject to certain restrictions. It may not, among others: (i) aim for the acquisition of shares belonging to our controlling shareholders; (ii) be carried in the organized markets for prices above the market prices; (iii) take place simultaneously with a public offering for the purchase of our shares; or (iv) require the use of funds exceeding the available funds (considered all capital or profits reserves plus the realized results of the ongoing fiscal year, excluded, in both cases, the legal reserve, the reserve for realizable profits, the special reserve for non-distributed compulsory dividends and the tax incentives).
We may not hold in treasury more than 10% of our outstanding shares of a certain type or class, including shares held by our subsidiaries and affiliated companies and the shares corresponding to the economical exposure arising from derivatives or deferred settlement transactions entered into by us, our subsidiaries and affiliated companies. This limit does not apply to reimbursed shares or forfeited shares, and acquisitions in the scope of a public offering for acquisition of shares, which will be subject to specific laws and regulation.
We may purchase our shares on the stock exchange, but not for a price above the market value. Acquisitions by means of private transactions must observe the applicable limitations and the approval by the shareholders meeting may be required. We may also buy our own shares in the event that we should cease to be a publicly-held company. We may also purchase or issue put or call options on our shares.
On December 14, 2015, our shareholders approved the cancellation of 37,757,908 shares held in treasury, representing 18,878,954 common shares and 18,878,954 preferred shares. Such treasury shares corresponded, as of that date, to approximately 53.9% of the totality of the shares then held in treasury. As a result, as of December 31, 2016 (and 2015), we held 51,571,846 (40,435,466) shares in treasury, of which 25,785,923 (20,217,733) were common shares and 25,785,923 (20,217,733) were preferred shares
On September 18, 2017, our shareholders approved the cancellation of 64,551,366 shares held in treasury, representing 32,275,683 common shares and 32,275,683 preferred shares. Such treasury shares corresponded, as of that date, to the totality of the shares then held in treasury.
On November 1, 2017, our board of directors approved the Unit repurchase program to cover the acquisition of up to 38,717,204 Units, representing 38,717,204 common shares and 38,717,204 preferred shares or ADRs by us or our branch in Cayman, corresponding to approximately 1.03% of the totality of our corporate capital. The repurchase program ends on November 5, 2018.
Cancellation of Registration as a Publicly-Held Company
We may cancel our registration as a publicly-held company and, for this purpose, our controlling shareholders must necessarily make a public offer to acquire all our shares in the market, according to the Brazilian Corporate Law and the regulations issued by the CVM. The minimum offer price must be at least equal to the economic value of our shares, as valued by a specialized company using any generally accepted and recognized valuation method, or any other criteria defined by the CVM.
The valuation report must be prepared by a specialized and experienced appraiser, who is independent of Santander Brasil, our management team and our controlling shareholders and who shall be chosen by the board of directors. The controlling shareholder shall bear the costs of preparing the valuation report.
Disposal of Control
Our By-Laws state that disposal of control of our company, either in a single transaction or in a series of transactions, must be subject to the condition, whether suspensive or resolutory, that the acquirer undertakes to make a public offer to acquire all the shares held by our other shareholders, both common and preferred, pursuant to the conditions and deadlines required by the current legislation, so as to ensure that they receive equal treatment with respect to the controlling shareholder in the disposal.
This offer will still be required (i) in cases where there is assignment for consideration of rights to subscribe for shares that may result in the disposal of the company’s control; and (ii) in case of disposal of control of a company that holds the control power over us.
Requirement for Disclosure of Information
As a publicly-held company, we must comply with the requirements for disclosure of information set forth by the Brazilian Corporate Law and the CVM.
Periodic and Occasional Disclosure of Information
The regulations applicable to publicly-held companies issued by the CVM, including CVM Instruction 358, provide that we must disclose a number of items of periodic and occasional information. Among such items of information are, for example, our financial statements accompanied by the management reports and the reports of our independent auditors, our standard financial information form (formulário de informações financeiras padronizadas – DFP), our quarterly report (formulário de informações trimestrais – ITR) and our reference form (formulário de referência).
According to CVM Instruction 480 of December 7, 2009, as amended, the reference form (formulário de referência) must be filed with the CVM annually, within five months of the closing date of the reporting period, in the form established by the regulation. The reference form (formulário de referência) shall be updated prior to a public offer, as well as upon the occurrence of certain events determined by the regulation that alter the information described therein, within 7 business days of the date of the respective change. This document contains complete information regarding us including, in general, the matters addressed in this annual report.
CVM Instruction 457 of July 13, 2007, as amended (“CVM Instruction 457”) provides that we are also subject to the disclosure of our consolidated financial statements based on the International Financial Reporting Standards, or IFRS, within four months of the end of each reporting period. The financial statements mentioned by CVM Instruction 457 must be disclosed in their entirety, together with (i) the management report, (ii) explanatory note expressly stating without reservation that the consolidated financial statements are in accordance with IFRS as issued by the IASB and Brazilian GAAP, and (iii) the opinion of the independent auditors. Within 15 days following the term established by Brazilian law for disclosure of our quarterly information, we must: (i) disclose our full quarterly information translated into the English language; or (ii) disclose our financial statements or consolidated financial statements in accordance with IFRS as issued by the IASB, accompanied by the independent auditors’ review report.
Disclosure of Information about Trading by Our Managers and Related Persons
Our officers, members of our board of directors, fiscal council, if in operation, and any technical or consulting body created by our By-Laws must disclose to us the securities issued by us, our controlling or controlled companies, when publicly-held, and the derivatives and other securities referenced by such securities that are held by them, as well as the trades with such securities. This obligation includes the securities held by the spouses, companions and any dependents of the aforementioned persons, as well as the companies directly or indirectly controlled by them.
We are obliged to send such information to CVM and B3 within ten days following the end of the month in which there is a change in the holding position or the month in which the relevant person is invested in the position (including name of person acquiring the shares, number and characteristics of the securities, form, price and date of acquisition). Upon the issuance of CVM Instruction 568 of September 17, 2015, it also became mandatory to provide the CVM and B3 within the same time period the information related to the securities traded by us, our entities and affiliated companies.
Disclosure of Information about our Shareholders with Relevant Interest
CVM Instruction 358, as amended, sets forth that (i) any direct or indirect controlling shareholders, (ii) any shareholders entitled to elect members of the board of directors and fiscal council, as well as (iii) any person or group of persons acting jointly with the aforementioned persons or representing the same interest, that carries out relevant transactions (that is, transactions whereby the direct or indirect holding of the aforementioned persons surpasses, upwards or downwards the thresholds of 5%, 10%, 15%, and so on successively, of our shares of a certain class and type) must disclose to us information on their trades, which will be forwarded to the CVM.
The ruling establishes that the following information must be provided: (i) the name and qualification of the person acquiring the shares, including the registration number in the Natural Persons Registry (CPF) or the National Register of Legal Entities (CNPJ); (ii) the reason for the participation and aimed quantity of shares, containing, if it were the case, a declaration by the acquiring party that it does not intend to alter the composition of its control or the structure of the company’s administration; (iii) the number of shares and other securities or other financial instruments referenced in such shares, of physical or financial settlement, specifying the number, class and type of such shares; (iv) indication of any agreements ruling the exercise of voting rights or the purchase and sale of our securities; and (v) if the shareholder is resident or domiciled abroad, the name and the registration number in the Natural Persons Registry (CPF) or the National Register of Legal Entities (CNPJ) of its agent or legal representative in Brazil for the purposes of article 119 of the Brazilian Corporate Law.
Such obligations also apply to (i) the acquisition of any right over our shares and other securities subject to disclosure; and (ii) execution of any derivative financial instruments referenced in our shares, even without physical settlement provisions.
Our investor relations officer is responsible for sending this information to CVM and to B3 as soon as received.
Disclosure of Material Facts
The Brazilian Securities Market Law and CVM Instruction 358 set forth that we must disclose any decision of our controlling shareholder, of a general shareholders’ meeting or of any of our management bodies, or any other act or event in connection with our business that could influence: (i) the trading price of our securities or securities referenced to our securities; (ii) the decision by investors to buy, sell or keep those securities; and (iii) the decision by investors to exercise any rights they have as holders of those securities.
Examples of material facts are: the signing of shareholders’ agreements, the transfer of control of the company, a consolidation, merger or spin-off involving the company or associated companies, the change in rights and advantages of the securities issued by the company, the split or reverse split of shares, among others.
Our investor relations officer is responsible for the disclosure of any material facts to the market.
The applicable regulation authorizes us, on an exceptional basis, to request confidential treatment of certain material developments from the CVM when our management believes that disclosure of the respective fact to the public could result in adverse consequences to us.
10C. Material Contracts
For the two years immediately preceding the publication of this annual report, we were not a party to any material contract outside the ordinary course of business.
10D. Exchange Controls
Foreign Investment in Brazil
Foreign Direct Investment
Foreign direct investment in Brazil is regulated by Law 4,131 and Law 4,390, enacted on September 3, 1962 and August 29, 1964, respectively, as amended. A foreign direct investor under Law 4,131/62 must:
| · | register as a foreign direct investor with the Brazilian Central Bank; |
| · | obtain a taxpayer identification number from the Brazilian tax authorities; |
| · | appoint a tax representative in Brazil; and |
| · | appoint a representative in Brazil for service of process in respect of suits based on the Brazilian Corporate Law. |
Foreign capital must be registered with the Brazilian Central Bank through the Electronic Registration System – Foreign Direct Investment (the “Registro Declaratório Eletrônico – Investimento Externo Direto”) within 30 days of the flow of funds into Brazil in accordance with Law 4,131. The registration of foreign capital is required for the remittance of profits abroad, the repatriation of capital and the registration of reinvestments. Investments will always be registered in the foreign currency in which they are actually made, or in Brazilian currency, if the funds are derived from a non-resident account properly held in Brazil.
On December 28, 2006, Law 11,371 allowed the registration of the foreign capital invested in Brazilian companies but not yet duly registered and not subject to other types of registration. For the purposes of such registration the amount of foreign capital inreais to be registered must be evidenced in the accounting records of the relevant Brazilian company and must be registered prior to the last business day of the subsequent calendar year during which the company becomes obligated to register the capital.
Other than such registration, foreign investment is not subject to government approvals or authorizations and there are no requirements regarding minimum investment or local participation in capital (except in very limited cases such as in regard to financial institutions, insurance companies and other entities subject to specific regulations). Foreign participation, however, is limited (that is, subject to approvals) or forbidden in several sectors.
Foreign investments in currency must be officially channeled through financial institutions duly authorized to deal in foreign exchange. Foreign currency must be converted into Brazilian currency and vice versa through the execution of an exchange contract. Foreign investments may also be made through the contribution of assets and equipment intended for the local production of goods and services.
Capital Markets Investment
Investors residing outside Brazil, including institutional investors, are authorized to purchase securities in Brazil on the Brazilian stock exchange, provided that they comply with the registration requirements set forth in the applicable regulation enacted by CMN and the CVM.
Since March 30, 2015, portfolio investments are regulated by CMN Resolution 4,373, which revoked the former rule (CMN Resolution 2,689, of January 26, 2000) which had been in force for about 15 years.
The main purpose of CMN Resolution 4,373 is to facilitate the entry of foreign investors in the Brazilian financial and capital markets. It introduced, among other things, the possibility for foreign investors of making investments in local currency with funds held in foreign bank accounts of the non-resident investor, or with bills of payment denominated inreais but issued abroad.
With certain limited exceptions, under CMN Resolution 4,373 investors are permitted to carry out any type of transaction in the Brazilian capital markets involving a security traded on a stock or futures exchange or an organized over-the-counter market, but may not transfer the ownership of investments made under such regulation to other non-Brazilian holders through private transactions. Investments and remittances outside Brazil of gains, dividends, profits or other payments under Santander Brasil’s shares are made through the commercial rate exchange market.
Under CMN Resolution 4,373, an investor residing outside Brazil must:
| · | appoint at least one financial institution or an institution authorized to operate by the Brazilian Central Bank as representative in Brazil that will be responsible for complying with the registration and reporting requirements and reporting procedures of the Brazilian Central Bank and the CVM; |
| · | register as a foreign investor with the CVM; |
| · | appoint one or more custodians authorized by CVM; |
| · | register the foreign investment with the Brazilian Central Bank; |
| · | appoint a tax representative in Brazil; and |
| · | obtain a taxpayer identification number from the Brazilian federal tax authorities. |
Securities and other financial assets held by foreign investors pursuant to said regulation must be registered or maintained in deposit accounts or under the custody of an entity duly licensed by the Brazilian Central Bank or the CVM. In addition, securities trading by foreign investors is generally restricted to transactions involving securities listed on the Brazilian stock exchanges or traded in organized over-the-counter markets licensed by the CVM.
CVM Instruction No. 560, of March 27, 2015, as amended, introduced in Brazilian securities regulation the obligation of the representatives of investors residing outside Brazil to inform the CVM of the movements and applications of funds of such investors participating in collective accounts and holders of own accounts represented by them.
10E. Taxation
The following summary contains a description of certain Brazilian and U.S. federal income tax consequences of the ownership and disposition of units or ADRs, but it does not purport to be a comprehensive description of all the tax considerations that may be relevant to the ownership or disposition of units or ADRs. The summary is based on the tax laws of Brazil and regulations thereunder and on the tax laws of the United States and regulations thereunder, as of the date hereof, which are subject to change.
Although there is at present no income tax treaty between Brazil and the United States, the tax authorities of the two countries have had discussions that may culminate in a treaty. No assurance can be given, however, as to whether or when a treaty will enter into force or how it will affect the U.S. Holders (as defined below) of units or ADRs. Prospective holders of units or ADRs should consult their tax advisors as to the tax consequences of the acquisition, ownership and disposition of units or ADRs in their particular circumstances.
Brazilian Tax Considerations
The following discussion is a summary of the Brazilian tax considerations relating to the acquisition, exchange, ownership and disposition of units or ADRs by a Non-Resident Holder. The discussion is based on Brazilian law as currently in effect, which is subject to change, possibly with retroactive effect, and to differences of interpretation. Any change in such law may change the consequences described below.
The tax consequences described below do not take into account the effects of any tax treaties or reciprocity of tax treatment entered into by Brazil and other countries. The discussion also does not address any tax consequences under the tax laws of any state or locality of Brazil.
The description below is not intended to constitute a complete analysis of all tax consequences relating to the acquisition, exchange, ownership and disposition of our units or ADRs. Holders of units or ADRs and prospective purchasers thereof should consult their tax advisors with respect to the tax consequences of owning and disposing of our units or ADRs in light of their particular investment circumstances.
Income Tax
Dividends
Dividends paid by a Brazilian company, such as ourselves, including stock dividends to a Non-Resident Holder are currently not subject to withholding income tax in Brazil, to the extent that such amounts are related to profits generated since January 1, 1996. Dividends relating to profits generated prior to January 1, 1996 may be subject to Brazilian withholding tax at varying rates, depending on the year the profits were generated.
Interest Attributable to Shareholders’ Equity
Law 9,249, dated December 1995, as amended, allows a Brazilian corporation, such as ourselves, to make distributions to shareholders of interest on net equity and to treat those payments as a deductible expense for purposes of calculating Brazilian corporate income tax and social contribution on net profits, subject to the limits described below. These distributions may be paid in cash. For tax purposes, this interest is limited to the daily pro rata variation of the Long-Term Interest Rate (Taxa de Juros de Longo Prazo – TJLP), as determined by the Brazilian Central Bank from time to time, and the amount of this deductible expense may not exceed the greater of:
| · | 50.0% of the net income (after the deduction of social contribution on net profit but before taking into account allowances for income tax and the interest attributable to shareholders’ equity) for the period in respect of which the payment is made; and |
| · | 50.0% of our accumulated profits. |
Payment of interest on shareholders’ equity to a Non-Resident Holder is subject to withholding income tax at the rate of 15.0%, or 25.0% for individuals or entities residing in a “Tax Haven.” According to Brazilian legislation, a “Tax Haven” jurisdiction is one in which there is no income taxation or where the local income tax rate is generally applied at rates under 20%. Ordinance 488 dated December 12, 2014, provided for the possibility of that 20% threshold being reduced to 17% if the corresponding jurisdictions are aligned with international standards of fiscal transparency in accordance with rules to be established by the Brazilian tax authorities, or where local legislation imposes restrictions on disclosure regarding shareholder composition or investment ownership. These payments may be included, at their net value, as part of any mandatory dividend, as discussed above under “—Dividend Policy.”
Distributions of interest on shareholders’ equity to Non-Resident Holders may be converted into U.S. dollars and remitted outside Brazil, subject to applicable exchange controls, if the investment is registered with the Brazilian Central Bank.
Capital Gains
(i) Taxation of Capital Gain Earned in the Country in a Transaction Not Carried Out on the Brazilian Stock Exchange (Or Similar Exchange)
According to Law 10,833/03, the gains recognized on a disposition of assets located in Brazil, such as our units, by a Non-Resident Holder, could be subject to withholding tax in Brazil. This rule is applicable regardless of whether the disposition occurs in Brazil or abroad and regardless of whether the disposition is made to an individual or entity resident or domiciled in Brazil.
As a general rule, capital gains realized as a result of a disposition of units are the positive difference between the amount realized on the disposition of the units and the acquisition cost of such units.
Historically, the income tax on these gains had to be withheld at source and the tax rate would vary depending on the domicile of the Non-Resident Holder:
| · | If the Non-Resident Holder is not located in a Tax Haven, a progressive tax rate will be applied as provided for in Law No. 13,259/16, as follows: (i) at a rate of 15% for the portion of the gain up to R$5 million, (ii) at a rate of 17.5% for the portion of the gain that exceeds R$5 million but does not exceed R$10 million, (iii) at a rate of 20% for the portion of the gain that exceeds R$10 million but does not exceed R$30 million, and (iv) 22.5% for the portion of the gain that exceeds R$30 million; |
| · | If the Non-Resident Holder is located in a Tax Haven, the tax rate will be 25.0%. |
The tax must be withheld and paid by the buyer or, in cases where the buyer and seller are domiciled abroad, a legal representative of buyer shall be designated for the payment of the tax.
(ii) Taxation of the Capital Gains Earned in the Country in a Transaction Carried Out on the Brazilian Stock Exchange (Or Similar Exchange)
There could also be the levy of income tax on net gains earned by a Non-Resident Holder on the disposition of units sold on the Brazilian stock exchange, commodities or futures exchange (or similar exchange). The tax rate will vary according to the type of investment registration made by the Non-Resident Holder at the Brazilian Central Bank, as well as the location of the beneficiary:
| · | Capital gains earned by a Non-Resident Holder who (i) has its investment registered in Brazil with the Brazilian Central Bank under the rules of CMN Resolution 4,373 (“Registered Holder”) and (ii) is not a Tax Haven resident are exempt from income tax; and |
| · | Capital gains earned by a Non-Resident Holder who is not a Registered Holder or is a Tax Haven resident (Registered Holder or not) are currently subject to income tax at a rate of 15.0%. In this case, withholding income tax of 0.005% will be levied by the intermediary institution (that is, a broker) that receives the order directly from the Non-Resident Holder, which can be later offset against the 15.0% income tax due on the capital gain, which will be paid by the Non-Resident Holder’s tax representative in Brazil. |
Any other gains realized on a disposition of units that is not carried out in an exchange environment or that is conducted in the non-organized “OTC market” are subject to the same rules set forth in item “(i) Taxation of Capital Gain Earned in the Country in a Transaction Not Carried Out on the Brazilian Stock Exchange (Or Similar Exchange).” Gains realized by a Non-Resident Holder on the disposition of preemptive rights held in stock will be subject to Brazilian income tax, according to the same rules applicable to the sale of units or ADRs.
(iii) Capital Reduction
In the case of a capital reduction by a Brazilian corporation, such as ourselves, the positive difference between the amount received by the Non-Resident Holder and the acquisition cost of the shares is treated as capital gain derived from a transaction held out of a Brazilian exchange described above in (i) and is therefore currently subject to withholding tax at the following progressive rates: (i) 15% for the portion of the gains up to R$5 million, (ii) 17.5% for the portion of the gain that exceeds R$5 million but does not exceed R$10 million, (iii) 20% for the portion of the gain that exceeds R$10 million but does not exceed R$30 million, and (iv) 22.5% for the portion of the gain that exceeds R$30 million for a Non-Resident Holder not located in a Tax Haven or up to 25.0% for a Non-Resident Holder located in a Tax Haven, for the year of 2017.
As mentioned above, in this case, as from January 1, 2017, although subject to interpretation, in the case of Non-Resident Holders carrying out investments pursuant to CMN Resolution 4,373, it is possible to sustain that the income tax should not apply at progressive rates under Law 13,259/16. Moreover, Non-Resident Holders located in a Tax Haven jurisdiction are subject to a specific tax regulation and remain taxed to a tax rate of 25.0%.
Sale of ADRs
Pursuant to Section 26 of Law 10,833/2003, the sale of an asset located in Brazil by a Non-Resident Holder, whether to a Brazilian resident or to another Non-Resident Holder, is subject to Brazilian income tax. Our understanding is that ADRs do not qualify as assets located in Brazil and thus should not be subject to the Brazilian income tax. Notwithstanding the foregoing, since the tax rule referred to in Section 26 of Law 10,833 provides broad language and has not been definitely analyzed by the administrative or judicial courts, we are unable to assure you of the final outcome of such discussion.
Gains on the exchange of ADRs for units
Non-Resident Holders may exchange ADRs for the underlying units, sell the units on the Brazilian stock exchange and the sale proceeds may be remitted abroad. As a general rule, the exchange of ADRs for shares is not subject to income taxation in Brazil.
Upon receipt of the underlying units in exchange for ADRs, Non-Resident Holders may also elect to register with the Brazilian Central Bank the U.S. dollar value of such units as a foreign portfolio investment under CMN Resolution 4373, which will entitle them to the tax treatment applicable to Registered Holders described above.
Alternatively, the Non-Resident Holder is also entitled to register with the Brazilian Central Bank the U.S. dollar value of such units as a foreign direct investment under Law 4,131/62, in which case the respective sale would be subject to the tax treatment applicable to transactions carried out of by a Non-Resident Holder that is not a Registered Holder.
Gains on the exchange of units for ADRs
The deposit of units in exchange for ADRs by a Non-Resident Holder may be subject to Brazilian income tax on capital gains if the acquisition cost of the units is lower than the market price for such units.
The difference between the acquisition cost and the average price of the units is considered a capital gain currently subject to income tax at the following progressive rates: (i) 15% for the portion of the gains up to R$5 million, (ii) 17.5% for the portion of the gain that exceeds R$5 million but does not exceed R$10 million, (iii) 20% for the portion of the gain that exceeds R$10 million but does not exceed R$30 million, and (iv) 22.5% for the portion of the gain that exceeds R$30 million), or 25.0% for Tax Haven residents. If a Non-Resident Holder that is a foreign direct investor under Law 4,131/62 wishes to deposit its units into the ADR program in exchange for ADRs, such Non-Resident Holder will be required to present to the custodian evidence, if applicable, of payment of the income tax assessed on capital gains at the aforementioned progressive rates or, in the case of a Tax Haven resident, 25.0%.
As mentioned above, in this case, from January 1, 2017 pursuant to CMN Resolution 4,373 the progressive rates of Law 13,259/16 to capital gains obtained by Non-Resident Holders not located in a Tax Haven will be applicable and for Non Resident Holders (whether they are considered to be Non-Resident Holders as a result of CMN Resolution 4373 or otherwise) located in a Tax Haven are subject to a specific tax regulation and remain taxed to a tax rate of 25.0%.
However, there are arguments to support the position that there should be no withholding tax on this transaction, because: (i) the deposit of units would not have represented the disposal of the investment; and (ii) the transaction is registered on the stock exchange. Given the uncertainty of these two positions, we recommend that you consult your tax advisors.
Tax on Foreign Exchange Transactions (IOF/Exchange)
The Tax on Foreign Exchange Transactions (“IOF/Exchange”) is due on the conversion of Brazilian or foreign currency, or any document that represents it, into an available equivalent amount. Currently, for most foreign exchange transactions, the IOF/Exchange rate is 0.38%.
However, currently different IOF/Exchange rates apply to foreign exchange transactions carried out in connection with investments made by Non-Resident Holders in the Brazilian financial and capital markets under CMN Resolution 4373. These rates are:
| i. | investment in financial and capital markets (Fixed Income), constitution of guaranteed margin, derivatives operations with predetermined yield, including simultaneous transactions: zero (from June 4, 2013); |
| ii. | investment in variable income securities negotiated on a stock exchange, commodities and futures, acquisition of shares in public offerings or subscription of shares, as long as they belong to publicly-held companies whose shares are subject to trading on the stock exchange: zero; |
| iii. | investment in private equity funds (FIP), investment funds in emerging companies (FIEE) and investment funds in shares from these funds (FIC-FIP and FIC-FIEE): zero; |
| iv. | simultaneous foreign exchange transactions resulting from the cancellation of depositary receipts for the acquisition of shares negotiated on the stock exchange: zero; |
| v. | returns of investments made in the Brazilian capital and financial markets: zero; |
| vi. | distribution of interest on shareholders’ equity and dividends: zero; |
| vii. | investment in Brazilian Depositary Receipts: zero; and |
| viii. | investments in bonds related to infrastructure projects, which comply with the requirements provided for in Article 1 of Law 12,431/2011: zero. |
Under the provisions of the Law, the Brazilian government may increase any of these rates at any time, up to 25.0%. However, any increase in rates may only apply to future transactions.
Tax on Transactions Involving Bonds and Securities and Derivatives
Brazilian law imposes a Tax on Transactions Involving Bonds and Securities, known as “IOF/Bonds Tax.”
Currently, the IOF Bonds Tax is due at a daily rate of 1.0%, limited to 96.0% of the income generated by fixed income bonds, on the redemption amount or the amount received from assignment or renegotiation. The rate is reduced to zero as from the thirtieth day.
The rate of IOF/Bonds Tax applicable to transactions of variable income securities, including those traded in stock, commodities or futures markets that involve shares, or units composed of shares, is reduced to zero.
The IOF Derivatives Tax was established by Decree 7,563 of September 16, 2011, with the original levy of 1.0% on the notional value of the adjusted purchase sale or maturity of financial derivative contract in the country that individually results in an increased foreign exchange exposure on a short position. However, under Decree 8,027 of June 12, 2013 the tax rate was reduced to zero.
Other Brazilian Taxes
The inheritance and gift tax (“ITCMD”) is applicable to the transfer of any goods or rights by gift or bequest. The transfer of shares, or units comprised of shares, that are abroad to individuals who are domiciled in Brazil is subject to taxation. If the shares are in Brazil and are transferred to a non-resident, the ITCMD will apply if the donor is domiciled in Brazil and the recipient is domiciled abroad. The ITCMD is a state tax with a maximum rate of 8%.
Material U.S. Federal Income Tax Considerations for U.S. Holders
The following summary describes the material U.S. federal income tax consequences of the ownership and disposition of ADRs or units, but it does not purport to be a comprehensive description of all of the tax considerations that may be relevant to a particular person’s decision to acquire such securities. This summary does not address “Medicare contribution tax” consequences and applies only to U.S. Holders (as defined below) that hold ADRs or units as capital assets for U.S. federal income tax purposes and does not address special classes of holders, such as:
| i. | certain financial institutions; |
| iii. | dealers and traders in securities that use a mark-to-market method of tax accounting; |
| iv. | persons holding ADRs or units as part of a hedge, “straddle,” conversion transaction or integrated transaction; |
| v. | holders whose “functional currency” is not the U.S. dollar; |
| vi. | holders liable for the alternative minimum tax; |
| vii. | tax exempt entities, including “individual retirement accounts” and “Roth IRAs”; |
| viii. | partnerships or other entities classified as partnerships for U.S. federal income tax purposes; |
| ix. | holders that own or are deemed to own 10% or more of our shares by vote or value; |
| x. | persons holding ADRs or units in connection with a trade or business conducted outside the United States; and |
| xi | persons who acquired ADRs or units pursuant to the exercise of an employee stock option or otherwise as compensation. |
If an entity that is classified as a partnership for U.S. federal income tax purposes holds units or ADRs, the U.S. federal income tax treatment of a partner will generally depend on the status of the partner and upon the activities of the partnership. Partnerships holding units or ADRs and partners in such partnerships should consult their tax advisors as to the particular U.S. federal income tax consequences of holding and disposing of the units or ADRs.
The summary is based upon the Internal Revenue Code of 1986, as amended (the “Code”), administrative pronouncements, judicial decisions and final, temporary and proposed Treasury Regulations, all as of the date hereof, changes to any of which may affect the tax consequences described herein, possibly with retroactive effect. In addition, the summary is based in part on representations of the depositary and assumes that each obligation provided for in, or otherwise contemplated by, the deposit agreement or any other related document will be performed in accordance with its terms. U.S. Holders are urged to consult their tax advisors as to the U.S. federal income tax consequences of the acquisition, ownership and disposition of ADRs or units in their particular circumstances.
As used herein, a “U.S. Holder” is, for U.S. federal income tax purposes, a beneficial owner of ADRs or units that is:
| (1) | an individual who is a citizen or resident of the United States; |
| (2) | a corporation, or other entity taxable as a corporation, created or organized in or under the laws of the United States, any state thereof or the District of Columbia; |
| (3) | an estate the income of which is subject to U.S. federal income taxation regardless of its source; or |
| (4) | a trust if (a) a court within the United States is able to exercise primary supervision for the administration of the trust, and one or more U.S. persons have the authority to control all substantial decisions of the trust, or (b) the trust has validly elected under applicable Treasury Regulations to be treated as a U.S. person. |
In general, for U.S. federal income tax purposes, U.S. Holders of ADRs will be treated as the owners of the underlying units represented by those ADRs. Accordingly, no gain or loss will be recognized if a U.S. Holder exchanges ADRs for the underlying units represented by those ADRs.
The U.S. Treasury has expressed concerns that parties to whom American depositary shares are released before delivery of shares to the depositary (a practice called “pre-release”) or intermediaries in the chain of ownership between U.S. Holders and the issuer of the security underlying the American depositary shares, may be taking actions that are inconsistent with the claiming of foreign tax credits by U.S. Holders of American depositary shares. These actions would also be inconsistent with the claiming of the preferential tax rates described below, applicable to dividends received by certain non-corporate holders. Accordingly, the creditability of Brazilian taxes and the availability of the preferential tax rates for dividends received by certain non-corporate holders, each described below, could be affected by actions taken by these parties or intermediaries.
Taxation of Distributions
Distributions paid on our units or ADRs (including distributions to shareholders that are treated as interest on net equity for Brazilian tax purposes and amounts withheld in respect of Brazilian tax), other than certain pro rata distributions of our common shares, will be treated as dividends to the extent paid out of our current or accumulated
earnings and profits (as determined under U.S. federal income tax principles). Because we do not maintain calculations of our earnings and profits under U.S. federal income tax principles, it is expected that distributions generally will be reported to U.S. Holders as dividends. These dividends will be included in a U.S. Holder’s income on the date of the U.S. Holder’s (or in the case of ADRs, the depositary’s) receipt of the dividend, and will not be eligible for the “dividends received deduction” generally allowed to corporations receiving dividends from domestic corporations under the Code. The amount of the distribution will equal the U.S. dollar value of thereais received, calculated by reference to the exchange rate in effect on the date that distribution is received (which, for U.S. Holders of ADRs, will be the date on which the distribution is received by the depositary), whether or not the depositary or U.S. Holder in fact converts anyreais received into U.S. dollars at that time. If the dividend is converted into U.S. dollars on the date of receipt, a U.S. Holder generally will not be required to recognize foreign currency gain or loss in respect of the dividend income. A U.S. Holder may have foreign currency gain or loss if the dividend is converted into U.S. dollars after the date of receipt. Any gains or losses resulting from the conversion ofreais into U.S. dollars will be treated as ordinary income or loss, as the case may be, of the U.S. Holder and will generally be U.S. source.
Subject to applicable limitations (including the requirement that the ADRs be readily tradable on an established securities market in the United States), the discussion above regarding concerns expressed by the U.S. Treasury and the discussion of the passive foreign investment company rules below, under current law, dividends paid with respect to our ADRs to certain non-corporate U.S. Holders will be taxable at the preferential rates applicable to long-term capital gain. Non-corporate U.S. Holders should consult their tax advisors regarding the availability of these favorable rates in their particular circumstances.
Sale or Other Disposition of ADRs or Units
Subject to the discussion of the passive foreign investment company rules below, gain or loss realized by a U.S. Holder on the sale or exchange of ADRs or units will be subject to U.S. federal income tax as capital gain or loss in an amount equal to the difference between the U.S. Holder’s adjusted tax basis in the ADRs or units and the amount realized on the disposition, in each case as determined in U.S. dollars. Such gain or loss will be long-term capital gain or loss to the extent that the U.S. Holder’s holding period with respect to the ADRs or units exceeds one year. Gain or loss, if any, will generally be U.S. source for foreign tax credit purposes. The deductibility of capital losses is subject to limitations. Long-term capital gain of a non-corporate U.S. Holder is generally taxed at preferential rates. If a Brazilian tax is withheld on the sale or other disposition of ADRs or units, a U.S. Holder’s amount realized will include the gross amount of proceeds of the sale or disposition before the deduction of the Brazilian tax. See “—Brazilian Tax Considerations” for a description of when a disposition may be subject to taxation by Brazil.
Foreign Tax Credits
Subject to certain generally applicable limitations, which may vary depending upon a U.S. Holder’s circumstances, and subject to the discussion above regarding concerns expressed by the U.S. Treasury, a U.S. Holder will be entitled to a credit against its U.S. federal income tax liability for Brazilian income taxes withheld from dividends on ADRs or units. A U.S. Holder will be entitled to use these foreign tax credits to offset only the portion of its U.S. tax liability that is attributable to foreign-source income. This limitation on foreign taxes eligible for credit is calculated separately with regard to specific classes of income. In addition, a U.S. Holder must satisfy minimum holding period requirements in order to be eligible to claim a foreign tax credit for foreign taxes withheld on dividends.
Because a U.S. Holder’s gains from the sale or exchange of ADRs or units will generally be treated as U.S. source income, the limitation described above may preclude a U.S. Holder from claiming a credit for all or a portion of the foreign taxes imposed on any such gains. U.S. Holders should consult their tax advisors as to whether these Brazilian taxes may be creditable against the U.S. Holder’s U.S. federal income tax liability on foreign-source income from other sources. Instead of claiming a credit, a U.S. Holder may, at its election, deduct such otherwise creditable Brazilian income taxes in computing taxable income, subject to generally applicable limitations under U.S. law. An election to deduct foreign taxes instead of claiming foreign tax credits applies to all foreign taxes paid or accrued in the taxable year.
The Brazilian IOF/Exchange Tax imposed on the purchase of units and the IOF/Bonds Tax on the deposit of units in exchange for ADRs (as discussed above under “—Brazilian Tax Considerations”) will not be treated as creditable foreign tax for U.S. federal income tax purposes. U.S. Holders should consult their tax advisors as to whether those taxes would be deductible for U.S. federal income tax purposes.
The rules governing foreign tax credits are complex and, therefore, U.S. Holders are urged to consult their own tax advisors to determine whether they are subject to any special rules that limit their ability to make effective use of foreign tax credits.
Passive Foreign Investment Company Rules
Based on proposed Treasury Regulations, which are proposed to be effective for taxable years beginning after December 31, 1994, we believe we were not a passive foreign investment company (a “PFIC”) for our taxable year ended December 31, 2017. However, because the proposed Treasury Regulations may not be finalized in their current form, because the application of the proposed regulations is not entirely clear and because the composition of our income and assets will vary over time, there can be no assurance that we will not be a PFIC for any taxable year. The determination of whether we are a PFIC is made annually and is based upon the composition of our income and assets (including, among others, entities in which we hold at least a 25.0% interest), and the nature of our activities.
If we were a PFIC for any taxable year during which a U.S. Holder held our ADRs or units, any gain recognized by a U.S. Holder on a sale or other disposition of ADRs or units would be allocated ratably over the U.S. Holder’s holding period for the ADRs or units. The amounts allocated to the taxable year of the sale or other exchange and to any year before we became a PFIC would be taxed as ordinary income. The amount allocated to all other taxable years would be subject to tax at the highest rate in effect for individuals or corporations, as appropriate, for that taxable year, and an interest charge would be imposed on the resulting tax liability for each of those taxable years. Further, the portion of any distribution in respect of ADRs or units that is in excess of 125.0% of the average of the annual distributions on ADRs or units received by the U.S. Holder during the preceding three years or the U.S. Holder’s holding period, whichever is shorter, would be subject to taxation as described above. Certain elections may be available that would result in alternative treatments (such as mark-to-market treatment) of the ADRs or units. U.S. Holders should consult their tax advisors to determine whether any of these elections would be available and, if so, what the consequences of the alternative treatments would be in their particular circumstances.
If we were to be treated as a PFIC in any taxable year in which a U.S. holder held units or ADRs, a U.S. holder would generally be required to file IRS Form 8621 with its annual U.S. federal income tax returns, subject to certain exceptions.
In addition, if we were to be treated as a PFIC in a taxable year in which we pay a dividend or the prior taxable year, the preferential dividend rates discussed above with respect to certain dividends paid to non-corporate holders would not apply.
Information Reporting and Backup Withholding
Payments of dividends and sales proceeds that are made within the United States or through certain U.S.-related financial intermediaries generally are subject to information reporting, and may be subject to backup withholding unless (i) the U.S. Holder is an exempt recipient or (ii) in the case of backup withholding, the U.S. Holder provides a correct taxpayer identification number and certifies that it is not subject to backup withholding. The amount of any backup withholding from a payment to a U.S. Holder will be allowed as a credit against the U.S. Holder’s U.S. federal income tax liability and may entitle the U.S. Holder to a refund, provided that the required information is timely furnished to the IRS.
Certain U.S. Holders who are individuals (and specified entities that are formed or availed of for purposes of holding certain foreign financial assets) may be required to report information relating to their ownership of an interest in certain foreign financial assets, including stock of a non-U.S. entity, subject to certain exceptions (including an exception for publicly traded stock and interests held in custodial accounts maintained by a U.S. financial institution). U.S. Holders are urged to consult their tax advisors regarding the effect, if any, of this requirement on the ownership and disposition of ADRs or units.
FATCA
The United States has enacted legislation, commonly referred to as “FATCA,” that generally imposes a reporting and withholding regime with respect to certain U.S. source payments (including interest and dividends), and, beginning January 1, 2019, to gross proceeds from the disposition of property that can produce U.S. source interest and dividends and certain payments made by entities that are classified as financial institutions under FATCA. The United States has entered into an intergovernmental agreement regarding the implementation of FATCA with Brazil (the “IGA”). For further information, see “Item 4. Information on the Company—B. Business Overview—Other Applicable Laws and Regulations—FATCA,” above. Under the current terms and conditions of the IGA, we do not expect payments made on or with respect to the ADRs or units to be subject to withholding under FATCA. However, significant aspects of when and how FATCA will apply remain unclear, and no assurance can be given that withholding under FATCA will not become relevant with respect to payments made on or with respect to the ADRs or units in the future. Prospective investors should consult their own tax advisors regarding the potential application of FATCA.
10F. Dividends and Paying Agents
Not applicable.
10G. Statement by Experts
Not applicable.
10H. Documents on Display
We are subject to the information requirements of the Exchange Act, except that as a foreign issuer, we are not subject to the proxy rules or the short-swing profit disclosure rules of the Exchange Act. In accordance with these statutory requirements, we file with or furnish reports and other information to the SEC. Reports and other information filed or furnished by us to the SEC may be inspected and copied at the public reference facilities maintained by the SEC at Room 1024, 100 F Street, N.E., Washington, D.C. 20549. Copies of such material may also be inspected at the offices of the NYSE, 11 Wall Street, New York, New York 10005, on which our ADRs are listed. In addition, the SEC maintains a website that contains information filed electronically with the SEC, which can be accessed over the Internet at http://www.sec.gov.
We also file consolidated financial statements and other periodic reports with the CVM located at Rua Sete de Setembro, 111, Rio de Janeiro, Rio de Janeiro 20159-900, Brazil. The CVM maintains an Internet website that contains reports and other information about issuers, like us, that file electronically with the CVM. The address of that website is http://www.cvm.gov.br. We also file consolidated financial statements and other periodic information with B3. The address of the B3 website is http://www.bmfbovespa.com.br.
10I. Subsidiary Information
Not applicable.
ITEM 11. QUANTITATIVE AND QUALITATIVE DISCLOSURES ABOUT MARKET RISK
Overview
To manage the risks of our operations, in addition to establishing and applying our local risk management policies and procedures, we have incorporated the Santander Group’s global risk management functions at various levels of our organization to ensure a consistent management approach worldwide, by implementing the Santander Group’s risk management policies for all areas, including financial, credit, market, operational and compliance risk, among others.
In addition, committees headed by senior management are responsible for overseeing credit approval and risk control, taking into account the parameters and limits of exposure defined and approved by the Bank’s board of directors.
Risk management reports provided to our senior management are generated mainly by the control department and the risk consolidation department based on the databases corresponding to each department. Likewise, the reports for senior management of the Santander Group’s financial entities and foreign branches are generated mainly by the risk control departments of each of those entities and branches.
The presentation of risk management information to senior management is designed to enhance the understanding and management of risks for the Santander Group’s administrative bodies and branches. These reports are targeted to different audiences within senior management, whether the Santander Group, its financial entities, or its foreign branches, depending on the kind of information and of each type of report highlights. Information may be transmitted to senior management either through our intranet risk reporting tool, through e-mail or by live presentations.
Information, analyses and decisions are also disseminated through the channels described below, fostering communication among areas within Santander Brasil and within the risk management process:
| i. | internal department mailboxes, which allow for the exchange of information within groups and areas; |
| ii. | periodic meetings (departmental, monthly, quarterly, off-site, conventions), which allow for regular exchange of information on an in-person basis; |
| iii. | our regulations portal, which is an internal portal within our intranet where we maintain our current risk management policies; |
| v. | video and teleconferences with Santander Spain; and |
| vi. | risk committees, including the Executive Risk Committee for Brazil and the RCC Risk control committee. |
Information is prepared in an effort to improve risk management and is classified as standard information or non-standard information.
| i. | Standard information: includes information and reports generated on a regular basis and with fixed content, subject to revisions, which is available to senior management for different target areas, depending on the type of information included in each report. This information is used to facilitate knowledge about credit use, instrument valuation and the results generated, in addition to the analyses needed to manage these risks and optimize capital. Each report may have a distinct presentation based on the guidelines pursuant to which it is prepared. Standard information delivered to our senior management is intended to facilitate the understanding of all risks for which the risk management department is responsible. |
| ii. | Non-standard information: includes presentations and other information prepared for our senior management on an ad hoc basis or upon specific request and addresses specific topics that are not included in the standard reports. When the request for certain information becomes more regular, such reporting becomes standard and is generated automatically. |
| iii. | The content of each report fits within one of two fundamental bases: the nature of the information and its frequency. The nature of the information prepared is either quantitative or qualitative. |
Quantitative Information. Quantitative information includes risk metrics that permit our senior management to better analyze situations, trends and developments in each segment, activity or portfolio, relating to planned scenarios or defined limits, with emphasis on any scenarios falling outside such limits. Quantitative information is developed primarily to analyze liquidity and market risks, and solvency risks. Information related to liquidity and market risk includes, among other items, measurements of positions, mark-to-market valuations, sensitivity analyses, volume analyses, measures of liquidity gaps and country risk models, impacts of risks on results, economic risks, stress test simulations and back-testing. Information related to solvency risks includes, among other items, credit exposure measures, abnormal events, doubtful asset measurements, impacts of solvency risks on our results, measures of expected loss, stress test simulations, and other information related to economic and market risks.
Qualitative Information. Qualitative information includes internal and external events relating to the economic, financial or competitive environment, and an evaluation and analysis of the causes and consequences or foreseeable consequences of such events. These also include measures used to prepare such models.
The frequency with which quantitative and qualitative risk management information is prepared is determined by the kind of information provided, as follows:
Daily information:
| i. | liquidity and market risk: includes data on treasury limits (VaR, positions, sensitivity of linear and non-linear econometric models) and the principal changes in the treasury portfolio; and |
| ii. | solvency risk: focuses on sharp changes in our business and/or business environment or those that involve significant variations in the evolution of the business and its environment. |
Weekly information:
| i. | focuses on generating updated high-level information in different segments (focused on solvency risk) or portfolios (focused on market risk), as well as a summary of the relevant facts and expected short-term changes; |
| ii. | is generated for our senior management, including the chief executive officer and vice president executive officers of retail, risks and finance, and an independent member of our board of directors; and |
| iii. | is drawn from our risk management framework and policies globally and is validated by local market and solvency risk areas. |
Monthly information:
| i. | liquidity and market risk: facilitates the analysis of the current situation of different activities, including structural and interest rate risks; it also includes a detailed analysis of alternative measures and stress scenarios; |
| ii. | solvency risk: facilitates an assessment of the current situation in different segments, compared to the budgeted situations and an analysis of the causes of deviations; also introduces credit rating with a basis of analysis; |
Monthly information is generally more detailed than weekly information.
Risk Management Committees
The following table describes our principal credit and market risk management committees in Brazil, the responsibilities and members of each such committee and the frequency with which such committees meets.
| Committee | Responsibilities | Members | Meeting Frequency |
| Executive Risk Committee | · Apply the Group’s risk policies locally in a manner compatible with the objectives of the business areas. | CEO | Weekly |
| | · Approves the risk appetite that will be proposed to the board of directors of Santander Brasil; | Vice President Executive Officers (Chief Risk Officer; Legal; GCB and Corporate) that are member of the Executive Committee. | |
| | · Manage exposures from different clients, economic sectors and types of risks, including, among others, the following functions: | | |
| | · Approve risk, including among others, fixed and variable income securing, customer limits and limits / products for Treasury, asset and liability committee, restructuring proposals and payment arrangements; | | |
| | · Handle general issues related to market risk, cross-border limits, country risk, global banking operations, enterprises and retail clients; | | |
| | · Adopt and, if necessary, validate, portfolio sales or individual asset-credits; | | |
| | · Approve internal risk regulations; | | |
| | · Approve changes in risk policies with an impact on revenue, margin or provision expenses on the Strategic Business Plan as well as on any related matters; | | |
| | · Authorize management tools, improvement initiatives, follow up on projects and any other relevant activities related to risk management; | | |
| | · Approve policies and standards for methodologies and their internal validations; | | |
| | · Gather knowledge and take the necessary measures regarding risk to comply with the recommendations and directions issued by supervisory authorities in the exercise of its functions and the internal audit of the Bank; | | |
| | · Provide to the board of directors and to the executive committee the information and assistance needed in order to execute the tasks in risk management that were assigned to it by applicable law, the by-laws, the board of directors´ rules of procedure and the regulation of the Risk Executive Committee; and | | |
| | · Approve the creation, modification and termination of other committees or decision bodies, its regulations and delegate to those committees or people authorization in risk management. | | |
| Risk Control Committee | · Oversee Risk Identification and Assessment (RIA). | Chief Financial Officer Chief Risk Officer | Biweekly |
| | · Conduct a full segment and regular follow up of all risks, checking if the risk profile is set in accordance with the risk appetite, the commercial and strategic plan and the budget approved by the board of directors. | Chief IT Officer Executive Superintendents for Risk Architecture and Risk Control Executive Superintendent for T&O Retail. | |
| | · Carry out an independent and periodical control of risk management activities, which include: | Vice President Executive Officer for Finance and Strategy. Chief Compliance Officer | |
| | · Full risk profile view of the different businesses, including among others, benchmarking of the main competitors of the bank and monitoring of key strategic projects. | Chief Internal Audit Chief Data Officer Client Services Quality Officer | |
| | · Detect and report alerts on relevant risks as well as possible breaches or other significant aspects regarding risks. | | |
| | · Monitor the observance of appetite and risk policies, advising the board risk committee on these issues. | | |
| | · Support and assist the board in carrying out stress tests, in particular valuing the scenarios and assumptions to be used in these tests, valuing the results and analyzing the measures proposed by the risk function as a consequence of the results. | | |
| | · Validate the information on risks that must be submitted to the board of directors when so required and without prejudice to the direct access to the person responsible for the risk function (Chief Risk Officer) to the board. | | |
| | · Supervise measures taken regarding risks to comply with the recommendations and directions issued by the supervisory authorities in the exercise of its function and Santander Brasil’s audit. | | |
| | · Provide the board of directors, through the board risk committee, and the executive committee the information and assistance needed regarding risks for the fulfillment of its functions in risk management matters assigned to it by law, the board of directors´ rules of procedure and the regulation of the Risk Control Committee – RCC. | | |
Our executive credit committee makes decisions with regard to risk management in Brazil with representatives of our senior management, including our Chief Executive Officer, our Vice President Executive Officer of Risk Management and the other members of our executive committee. The main responsibilities of the executive credit committee include defining our level of risk tolerance, monitoring our loan portfolios and market conditions, as well as any recommendations made by the Brazilian Central Bank. The executive credit committee also raises any matters to our board of directors that exceed the authority of the committee. Each of our risk management committees has certain powers and approval levels, in each case subject to Brazilian law and regulations. Decisions at the committee level are intended to be collegial in a manner to ensure that differing opinions are all considered.
Credit Risk
The Santander Group risk management model is based on prudent risk management and the definition of risk tolerance by our board of executive officers. We operate within the risk management culture of the Santander Group following the guidelines of our board of executive officers, the Brazilian Central Bank regulations and international best practices, to protect capital and promote profitability. One of our credit risk management principles is independence among our business areas, which provides sufficient autonomy to accomplish appropriate risk management. Another characteristic of our credit model is the direct involvement of our senior management in decision-making through credit committees. Our credit approval process, particularly the approval of new loans and risk monitoring, is structured according to our classification of customers and products between our retail and wholesale lending operations.
Retail Lending
In retail banking, credit requests by individuals are analyzed by a credit approval system applying various types of processes depending on the credit history of the individual and the type of credit requested. For standard credit requests, approval is generally made at our branches based on an automatic, standardized process. When the customer’s request is submitted for credit approval, we collect relevant credit information from the customer, including the individual’s profession, level of income, internal and external financial restrictions, credit history, current indebtedness, and relationship with us. Based on this data and the type of credit requested, our credit rating system automatically assigns a credit rating based on a scoring model and our risk management policies. We use our scoring models in two different phases: during the “application” process and later in the “ongoing” phase. A credit scoring model is applied in the application phase when the customer begins a relationship with us and a behavioral scoring model is used when the customer has already had a relationship with us for a period established by our risk management policies. This policy allows us to evaluate our existing customers with a more complete analysis than if we applied a pure scoring model for all customers.
For financing products offered to SMEs (retail business), the credit risk approval process can involve an automated scoring system, based on credit policies, and/or be manually and individually analyzed and approved, based on the creditworthiness of the SME, in accordance with the respective credit risk approval authority levels developed internally. This preliminary analysis also generates a credit risk rating based on our internal models. Additional information, such as the characteristics of the financing product being offered, including related terms and conditions and collateral granted in connection therewith, is also taken into account as part of the approval process.
Pre-approved limits on lines of credit for a particular individual or an SME are granted based on the creditworthiness and size as determined according to our scoring criteria. Credit approval by our branches is allowed by authorized personnel according to established parameters. Credit limits are managed based on the performance of the customers, taking into account each customer’s risk profile.
Credit authorizations are established through policies that define the rules and responsibilities of the members of each committee. We have established procedures and authorized certain organizational bodies to approve credit requests in amounts greater than those delegated to individual branches (both for individuals and SMEs). Such approvals are made following application of the relevant scoring model and individualized analysis by the relevant authorized organization body.
The following table presents the individuals or organizational bodies authorized to make extensions of credit to retail borrowers for the amounts specified:
| Authorization Required | | Amount |
| Branch (1) | | Up to R$500 thousand |
| Decision centers(2) | | Up to R$30 million |
| Retail Risk Higher Committee and Wholesale(3) | | Up to R$70 million |
| (1) | For individuals, the maximum value is R$200,000. For SMEs the maximum is R$500,000. |
| (2) | Members of risk decision-making centers include superintendents and other representatives of the risk area. |
| (3) | Members of the higher Risk Committee include, among others, the officers of Wholesale, Retail, Market Risk, Recovery and representatives of the Risk departments. |
Wholesale Lending
With respect to our wholesale customers, the approval process is determined for each customer, taking into account the customer’s financial condition as well as other relevant information pertaining to the customer. All credit requests by our wholesale customers must be approved by the competent credit committees.
| Authorization Required | | Limit |
| Territorial Committee | | Up to R$60 million |
| Superior and High Risk Committee | | Up to R$150 million |
| Wholesale Committee | | Up to R$300 million |
| Executive Risk Committee | | Up to R$600 million |
Credit Monitoring
Credit lines to retail banking SME customers are reviewed on a weekly basis. Credit lines to retail banking individual clients are reviewed, systemically, on a daily basis, based on a client’s credit rating. This process allows for improvements in the credit exposure of customers who have presented good credit quality. Specific early warnings are automatically generated in the case of the deterioration of a customer’s credit quality. In this case, with the identification of the client’s solvency problem, a process to reduce credit risk, designed to prevent default, is implemented. For example, early warnings are automatically generated for SMEs, and their financial performance is monitored monthly. In addition, the financial situation of each enterprise is discussed by specific committees in the presence of the commercial area, with the aim of continuously improving the quality of our loan portfolio.
Credit lines to wholesale customers and related credit quality are reviewed on an annual basis. There is a monitoring procedure and, for any specific concern in regard to the credit quality of a certain customer, we use a system of customer monitoring known as SCAN (Santander Costumer Assessment Note), with possible actions to be taken under the following categories: “monitoring,” “intensive monitoring,” “proactive monitoring” or “block and exit.” A customer subject to action under one of these categories will be reviewed on a quarterly or a semi-annual basis, depending on the situation.
We use proprietary internal rating models to measure the credit quality of a given customer or transaction. Each rating relates to a certain probability of default or non-payment, determined on the basis of the customer’s history, with the exception of certain portfolios classified as “low default portfolios.” These ratings and models are used in our loan approval and risk monitoring processes.
The table below shows the internal risk rating levels and their corresponding probability of default:
Internal Risk Rating | | Probability of Default |
| Low | | Smaller than 2.1% |
| Medium-low | | Bigger than 2.1% and Smaller than 4.1% |
| Medium | | Bigger than 4.1% and Smaller of 6.3% |
| Medium-high | | Bigger than 6.3% and Smaller 10.0% |
| High | | Bigger than 10.0% |
For a breakdown of our portfolio by internal risk rating, see “Item 4. Information on the Company—B. Business Overview—Selected Statistical Information—Movements in Allowances for Impairment Losses—Internal Risk Rating.”
Recovery
Our business recovery area is responsible for all of our non-performing portfolios. This area defines, implements and monitors strategies and performance related to non-performing portfolios, seeking to ensure maximum efficiency in recovery subject to applicable Brazilian law and regulation.
The business recovery area uses statistical tools to study the behavior of clients and develop strategies for more effective recovery. Customers with greater probability of payment are classified as low risk customers and those with a low probability of payment are classified as high risk. The aforementioned risk classification determines the intensity of collection efforts expended.
The channels of operation are defined as “Mapa de Responsabilidade,” (Responsibility Map), using the time value of default versus risk value, in addition to other characteristics, to create strategies for recovery.
Our credit recovery tools include daily contact through our call center, inclusion of defaulting clients within external sources of credit protection, sending collection letters, and direct contact through our branch network. In addition to the aforementioned tools, we use the following strategies:
| · | Internal teams specialized in restructuring and debt recovery work directly with defaulting clients with loans of higher values and/or overdue more than 60 days. |
| · | We use specialized external firms to collect, report and assess high-risk customers. These firms are remunerated according to pre-established percentages applied to the amounts recovered. |
Once we have exhausted all of the credit recovery resources available to us, we conduct sales of any remaining non-performing loans. These sales of non-performing loans are held periodically through an auction process, with the aim of obtaining optimal prices in the markets and thereby reduce the impact on us.
Assets and Liabilities Committee
Our asset and liability management strategy is defined by our assets and liabilities committee, which operates under the strict guidelines and procedures established by the Santander Group. Members of the committee include our Chief Executive Officer, Chief Risk Officer, Chief Executive Officer, Vice President Executive Officer for Finance and Strategy Executive Superintendent of Financial Management and the Chief Economist. The assets and liabilities committee establishes strategies, policies and procedures with the objective of managing our balance sheet and risk structure.
Market Risk
Types of market risk
Interest rate risk
Interest rate risk is the possibility that changes in interest rates could adversely affect the value of a financial instrument, a portfolio or our operations as a whole. We are exposed to interest rate risk whenever there is a mismatch between interest rate sensitive assets and liabilities, subject to any hedging we have engaged in using interest rate swaps or other off-balance sheet derivative instruments. Interest rate risk arises in connection with both our trading and non-trading activities.
Credit spread risk
Credit spread risk arises where changes in credit spread curves associated with specific issuers and debt types may adversely affect the value of a financial instrument, a portfolio or adversely affect Santander Group as a whole. The “spread” refers to the margin charged on financial instruments based on benchmark rates (i.e., the difference between the rate on the relevant instrument and the underlying benchmark rate), with the latter usually being the internal rate of return of government bonds and interbank interest rates.
Exchange rate risk
Exchange rate risk arises due to the sensitivity of the value of a foreign currency position in relation to a base currency (in our case,reais) due to a potential change in exchange rates. We are exposed to foreign exchange rate risk as a result of mismatches between assets and liabilities, and off-balance sheet items denominated in different currencies, either as a result of trading or in the normal course of business. We maintain non-trading open currency positions arising from our investments in overseas subsidiaries (such as our Cayman Islands branch), affiliates and their respective currency funding. Our principal non-trading currency exposure is the U.S. dollar, which, as mandated by our policies, is hedged to thereal within established limits.
Equity price risk
Equity price risk arises due to the sensitivity of the value of an investment position in equity markets to adverse movements in the market prices or in response to expectations of future dividends. Among other instruments, equity price risk affects positions in shares, stock market indices and derivatives using shares as the underlying asset (puts, calls, and equity swaps). We are exposed to equity price risk in both our trading and non-trading investments in equity securities.
Commodities price risk
Commodities price risk is the risk derived from the effect of potential change in commodity prices. Our exposure to this risk is not significant and is concentrated in derivative operations involving commodities for clients.
Inflation risk
Inflation risk is the risk that changes in inflation rates may adversely affect the value of a financial instrument, a portfolio or Santander Group as a whole.
Volatility risk
Volatility risk is the sensitivity of the value of a portfolio to changes in the volatility of a number of risk factors, including volatility of interest rates, exchange rates, share prices and commodity prices. This risk is applicable to financial instruments which have volatility as a variable in their valuation model.
Other, more complex, risks to which we may be exposed include:
Correlation risk
Correlation risk is the sensitivity of the value of a portfolio to changes in the relation between risk factors, whether of the same type (for example, between two exchange rates) or of a different nature (for example, between an interest rate and the price of a commodity).
Market liquidity risk
Market liquidity risk is the possibility of a Bank entity or the Santander Group as a whole finding itself unable to exit or close a position in time without affecting the market price or the cost of the transaction. This risk can be caused by a decrease in the number of market makers or institutional investors, the execution of large volumes of operations, market instability and increases of the concentration existing in certain products and currencies. Market depth is the main liquidity driver in our trading portfolio, even though our policy is to trade the most liquid assets. Our liquidity risk also arises in non-trading activity due to the maturity gap between assets and liabilities mostly in the retail banking business.
Risk of prepayment or cancellation
In certain transactions the relevant loan agreement allows, explicitly or implicitly, voluntary prepayment prior to maturity without any penalty, which creates a risk that the cash flows expected from that particular credit line have to be reinvested at a potentially lower interest rate. This mainly affects loans or mortgage securities.
Underwriting risk
Underwriting risk occurs as a result of participation in the underwriting of a placement of securities or another type of debt, assuming the risk of partially owning the issue or the loan due to non-placement of all or any proportion of any issuance among potential buyers.
Derivatives used in Managing Market Risks
We use derivatives both in trading and non-trading activities to manage market risks. Trading derivatives are used to eliminate, reduce or modify risk in trading portfolios (interest rate, foreign exchange and equity price risk), and to provide financial services to customers. Our principal counterparties (in addition to customers) for this activity are financial institutions and the B3. Our principal derivative instruments include interest rate swaps, interest
rate futures, foreign exchange forwards, foreign exchange futures, foreign exchange options, cross currency swaps, equity index futures and equity options and interest rate options. With respect to non-trading activity, derivatives are used in order to manage interest rate risks and foreign exchange risks arising from asset and liability management activity. We also use interest rate and foreign exchange linear derivatives in non-trading activity. We have no credit derivatives in Brazil, as there is no market for credit derivatives in Brazil.
Activities subject to market risk
Our market risk area is responsible for measuring, controlling and monitoring risk in respect of those operations where risk to our business arises as a result of changes in market factors. Market risk arises due to changes and potential volatility in interest rates, exchange rates, share prices and commodities prices, as well as due to liquidity risk of the various products and markets in which we operate. The following paragraphs summarize the principal market risks to which we are exposed.
On the basis of the origin of the risk to which we are exposed, our activities are classified as follows:
Trading book
The trading book includes financial services to customers and purchase-sale and positioning mainly in fixed income, equity and currency products. The trading book comprises our proprietary positions in financial instruments held for resale and/or bought to take advantage of current and/or expected differences between purchase and sale prices. This portfolio also includes positions in financial instruments deriving from market-making and sales activities. As a result of trading fixed income securities, equity securities and foreign exchange, we are exposed to interest rate, equity price and foreign exchange rate risks. We are also exposed to volatility when non-linear derivatives are used.
Non-trading book (banking/structural)
The non-trading book is constituted of market risks inherent in the balance sheet, excluding the trading portfolio. These include:
| i. | Structural interest rate risks. This arises from mismatches in the maturities and re-pricing of all assets and liabilities. |
| ii. | Structural exchange rate risk/hedging of results. Exchange rate risk occurs when the currency in which the investment is made is different from thereal in companies or branches that are consolidated and those that are not (structural exchange rate). In addition, exchange rate hedging of future results generated in currencies other than thereal (hedging of results). |
| iii. | Structural equity risk. This involves investments via stakes in financial or non-financial companies that are not consolidated, as well as portfolios available for sale formed by equity positions. |
Market Risk Management Framework
Our board of directors is responsible for establishing our policies, procedures and limits with respect to market risk, including which businesses to enter into and maintain. The risk committee monitors our overall performance in light of the risks we assume. Together with the local and global assets and liabilities committees, each market risk unit measures and monitors our market and liquidity risk and provides figures to the assets and liabilities committees to use in managing such risks.
Market risk is regulated and controlled through certain policies, set forth in our market and liquidity risk management policies manual, and through structures setting forth specific limits to our exposure to market risk which is based on global limits established for the entire Santander Group. In addition, authorized products are listed and reviewed periodically.
These policies, procedures and limits on market risk are applicable to all units, businesses or portfolios susceptible to market risk, and rest on five basic pillars, which we believe are vital for correct management of market risks:
| i. | Market and structural risk measurement, analysis and control; |
| ii. | Calculation, analysis, explanation and reconciliation of profit and loss (P&L); |
| iii. | Definition, capture, validation and distribution of market data; |
| iv. | Definition of limits, products and underlyings; and |
| v. | Consolidation of information. |
In turn, our market risk management is guided by the following basic principles:
| i. | Independence of the trading and balance sheet activities; |
| ii. | Global overview of the risks taken; |
| iii. | Definition of limits and empowerment; |
| iv. | Control and oversight; |
| v. | Homogeneous aggregated metrics; |
| vi. | Homogeneous and documented methodologies; |
| viii. | Information consolidation; and |
| ix. | Contingency plans and technical capability. |
Structure of Limits Regarding Market Risk
The market risk limit structure represents Santander Brasil’s risk appetite and is aligned with our global market risk management policies, which encompass all of our business units and serve to:
| i. | identify and define the main types of risk incurred in a manner consistent with our business strategy; |
| ii. | quantify and report to our business segments with respect to appropriate risk levels and risk profile in line with senior management’s assessment of risks to help avoid any of our business segments taking undesired risks; |
| iii. | provide flexibility to our business segments to timely and efficiently establish risk positions that are responsive to market changes and our business strategies, and always within risk levels acceptable to Santander Brasil; |
| iv. | allow the individuals and teams originating new business to take prudent risks that will help attain budgeted results; |
| v. | establish investment alternatives by limiting equity requirements; and |
| vi. | define the range of products and underlying assets within which each unit of treasury can operate, taking into consideration our risk modeling and valuation systems and our liquidity tools. This will help to constrain market risk within our defined risk strategy. |
Global market risk management policies define our risk limit structure while the risk committee reviews and approves such policies. Business managers administer their activities within these limits. The risk limit structure covers both our trading and non-trading portfolios and includes limits on fixed income instruments, equity securities, foreign exchange and derivative instruments.
Limits considered to be global limits refer to the business unit level. To date, system restrictions prevent intra-day limits. Our business units must comply with approved limits. Potential excesses require a range of actions carried out by the global market risk function unit including (i) providing risk-reducing suggestions and controls, which are the result of breaking “alarm” limits and (ii) taking executive actions that require risk takers to close out positions in order to reduce risk levels.
The market risk limits used by us are established along different metrics intended to cover all activity subject to market risk from many perspectives, applying criteria we believe to be conservative. The principal limits include:
Trading limits
VaR limits;
| i. | limits of equivalent positions and/or nominal; |
| ii. | sensitivity limits to interest rates; |
| iv. | risk limits of delivery by short positions in securities (fixed income and equities); and |
| v. | limits aimed at reducing the volume of effective losses or protecting results already generated during the period: |
Structural limits
| i. | structural interest rate risk of the balance sheet: |
| · | sensitivity limit of net interest margin (“NIM”) over a one year horizon; and |
| · | sensitivity limit of market value of equity (“MVE”); |
| ii. | structural exchange rate risk comprised of the net position in each currency; and |
| iii. | liquidity risk: limits defined based on several stress scenarios. |
Market Risk Statistical Tools
Locally, we use a variety of mathematical and statistical models, including VaR models, historical simulations and stress testing to measure, monitor, report and manage market risk. Such numbers, produced locally, also serve as input for global activities such as evaluations of RORAC, and to allocate economic capital to various activities in order to evaluate the RORAC of such activities.
Trading Activity
| · | VaR: as calculated by us, our internal VaR model is an estimate of the expected maximum loss in the market value of a given portfolio over a one-day time horizon at a 99% confidence level, subject to certain assumptions and limitations discussed below. Our standard methodology is based on historical simulation of 520 days and is calculated using the VaR methodology “full revaluation.” In order to capture recent market volatility in the model, the reported VaR is the higher between the 1% percentile and the 1% weighted percentile of the simulated PnL distribution. The first VaR figure gives the same weight to all observed values, and the second one applies an exponential declining factor to give a higher weight for the most recent observations. This methodology makes our VaR numbers react very quickly to changes in current volatility, significantly reducing the likelihood of back testing exceptions. We use VaR estimates to alert senior management whenever the statistically estimated losses in our portfolios exceed prudent levels. |
| 1. | Assumptions and limitations: our VaR methodology should be interpreted in light of the limitations that (i) a one-day time horizon may not fully capture the market risk of positions that cannot be liquidated or hedged within one day and (ii) at present, we compute VaR at the close of business and trading positions may change substantially during the course of the trading day. |
| 2. | Calibration measures: in order to calibrate our VaR model, we use back testing, which is a comparative analysis between VaR estimates and the daily clean Profit and Loss (theoretical result generated assuming the mark-to-market daily variation of the portfolio considering only the movement of the market variables). The purpose of these tests is to verify and measure the precision of the models used to calculate VaR. |
| · | Stressed VaR: our stressed VaR model uses the same calculation methodology as VaR with the following two exceptions: (i) the stressed VaR uses a window of 250 days, instead of 520 days for the VaR; (ii) unlike when calculating the VaR the higher of the percentile uniformly weighted and the one exponentially weighted is not applied. Instead, only the uniformly weighted percentile is used. All the other aspects regarding the methodology and the inputs for calculating the stressed VaR are the same as those for the VaR. To determine the period of observation the methodology area has analyzed the history of the main market risk factors, which were chosen on the basis of expert criteria, and taking into account the most significant positions of our portfolio. |
| · | Stress Test: this is a simulation technique, which consists of estimating the potential impact on results by applying different stress scenarios to all the trading portfolios and considering the same assumptions according to the relevant risk factor. These scenarios can replicate events that happened in the past (such as crisis events) or hypothetical scenarios that do not correspond to past events. These results are analyzed at least monthly and, along with the VaR provide a fuller spectrum of the risk profile. |
| · | Sensitivities: our market risk sensitivity measures are those that gauge the change (or sensitivity) of the market value of an instrument or portfolio to changes in each of the risk factors. The sensitivity of the value of an instrument to changes in market factors may be obtained through analytical approximations by partial derivatives or through a full revaluation of the portfolio. |
Non-trading Activities
| · | Interest rate gap of assets and liabilities: interest rate gap analysis focuses on lags or mismatches between changes in the value of assets, liabilities and off-balance sheet items. Gap analysis provides a basic representation of the balance sheet structure and allows for the detection of interest rate risk by concentration of maturities. It is also a useful tool for estimating the impact of eventual interest rate movements on NIM or equity. All on- and off-balance sheet items must be broken down by their flows and analyzed in terms of re-pricing and maturity. In the case of those items that do not have a contractual maturity, an internal model of analysis is used and estimates are made of their duration and sensitivity. |
| · | NIM sensitivity: The NIM sensitivity measures the change in the short- and medium-term in the accruals expected over a 12-month horizon, in response to a shift in the yield curve. The yield curve is calculated by simulating the NIM, both for a scenario of a shift in the yield curve, as well as for the current scenario. The sensitivity is the difference between the calculation of the two margins. |
| · | MVE sensitivity: Net worth sensitivity measures the interest risk implicit in net worth (equity) over the entire life of the operation on the basis of the effect that a change in interest rates has on the current values of financial assets and liabilities. This is an additional measure to the sensitivity of the NIM. |
| · | Value at risk: The VaR for balance sheet activity and investment portfolios is calculated with the same standard as for trading and historical simulation, with a confidence level of 99.0% and a time frame of twenty-one days. |
| · | Analysis of scenarios of stress test: We apply three scenarios for the performance of interest rates: six standard deviations up and six standard deviations down of risk factors and one abrupt scenario in which risk factors are increased by 50.0% up and down from current levels. These scenarios are applied to the balance sheet, obtaining the impact on net worth, as well as the projections of net interest revenue for the year. |
| · | Liquidity risk: Liquidity risk is associated with our capacity to finance our commitments at reasonable market prices, as well as to carry out our business plans with stable sources of funding. We permanently monitor maximum gap profiles. The measures used to control liquidity risk are the liquidity gap, stress scenarios and contingency plans. |
| · | Liquidity gap: The liquidity gap provides information on contractual and expected cash inflows and outflows for a certain period of time, for each of the currencies in which we operate. The gap measures the net need or excess of funds at a particular date and reflects the level of liquidity maintained under normal market conditions. |
| · | Analysis of scenarios/contingency plan: The contingency plan includes the local and external activities and consists of a formal set of preventive and corrective actions taken in times of liquidity crises. Using analysis of historical scenarios and simulations of impacts on bank liquidity we define action plans and contingencies to establish roles and responsibilities and levels to trigger the contingency plan. Each unit should prepare its contingency plan. Additionally, Santander Spain must be periodically informed about the contingency plan of each subsidiary. The frequency with which this plan must be updated depends on market liquidity conditions. |
Quantitative Analysis
Trading Activity
Quantitative Analysis of Daily VaR in 2017
Our risk performance with regard to trading activity in financial markets between 2015 and 2017, measured by daily VaR (measured at a 99% of confidence level, over a one day time frame), is shown in the following graph.
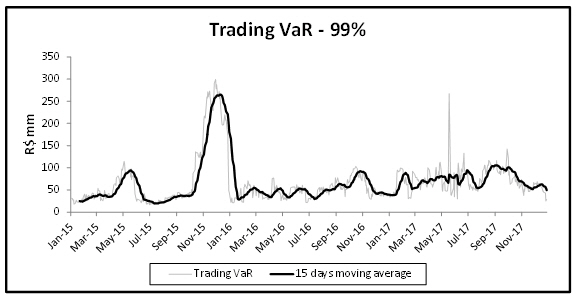
During 2017, VaR was highly volatile, fluctuating between R$25.0 million and R$267.3 million. The 2017 average VaR was R$72.8 million, reaching peak levels in mid-May due to disclosure in the press regarding certain alleged corruption at a major Brazilian meat producing corporation, and in August and September due to increase of interest rates as a result of expected improvements in Brazil’s fiscal outlook. The histogram below shows the distribution of average risk in terms of VaR in 2017 where the accumulation of days with VaR levels between R$50 million and R$80 million can be observed in 56.6% of the distribution.
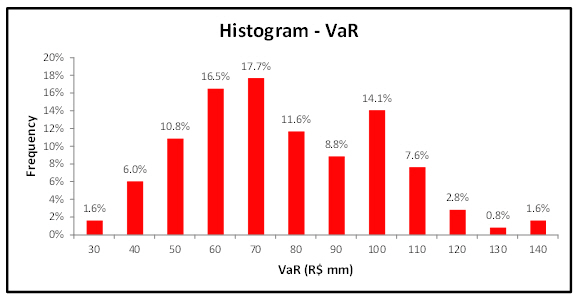
VaR by Risk Factor
The minimum, maximum, average and year-end 2017 VaR values by risk factor were as follows:
| | | 2016 | | 2017 |
| | | Period End | | Low | | Average | | High | | Period End |
| | | (in millions of R$) |
| Trading VaR | | | 37.7 | | | | 25.0 | | | | 72.8 | | | | 267.3 | | | | 28.0 | |
| Diversification Effect | | | (10.0 | ) | | | 3.8 | | | | (11.5 | ) | | | (129.4 | ) | | | (10.7 | ) |
| Interest Rate VaR | | | 34.7 | | | | 20.8 | | | | 52.5 | | | | 297.1 | | | | 23.1 | |
| Equity VaR | | | 2.7 | | | | 1.6 | | | | 11.8 | | | | 24.3 | | | | 8.1 | |
| Foreign Exchange VaR | | | 10.3 | | | | 2.5 | | | | 19.9 | | | | 51.3 | | | | 7.5 | |
The average VaR for 2017 was R$72.8 million, with most of the risk due to interest rate positions. Santander Brasil was relatively conservative in equity trading activity.
The average VaR of the three main risk factors, interest rates, equity prices and exchange rates, were R$52.5 million, R$11.8 million and R$19.9 million, respectively, with a negative average diversification effect of R$11.5 million. The chart below shows the evolution of the risk groups VaR interest rates (IR), VaR exchange rates (FX) and VaR equity prices (EQ) (at a 99% confidence level, over a day time frame and a 15 day moving average).

Risk Management of Structured Derivatives
Our structured derivatives activity is mainly focused on designing investment products and managing hedging risks for clients. Our risk management is focused on ensuring that the net risk exposure is the lowest possible. These transactions include options on equities, currencies, fixed-income instruments and mostly market making books.
The chart below shows the VaR Vega performance of our structured derivatives business in 2015, 2016 and 2017, which fluctuated around an average of R$2.84 million. In general, the periods with higher VaR Vega levels are related to episodes of significant increases in market volatility.

Scenario analysis
Different stress test scenarios were analyzed during 2017. A correlation break scenario generated the results presented below.
Worst Case Scenario
The table below shows the maximum daily losses for each risk factor (fixed-income, equities and currencies) as of December 31, 2017, in a scenario that uses historical volatilities and simulates variations of the risk factors for +/-3 and +/-6 standard deviations on a daily basis. From this group of scenarios, we generate a table of stress test results, which identifies the largest loss per risk factor. The sum of the largest losses of each risk factor is the result of the Worst Case Scenario, which considers the break of correlation between risk factors.
| Worst Case Stress Test | | Exchange Rate | | Fixed Income | | Equity | | Total |
| | | (in millions of R$) |
| Total trading | | | (22.2 | ) | | | (73.3 | ) | | | (21.3 | ) | | | (166.8 | ) |
The stress test shows that the economic loss suffered by the group in the marked-to-market result would be, if this scenario materialized in the market, R$116.8 million.
Non-trading Activity
Quantitative Analysis of Interest Rate Risk in 2017
Convertible Currencies
At the end of 2017, the sensitivity of NIM at one year, to a parallel rise of 100 basis points in the local yield curve was R$378 million.
In addition, at the end of 2017, the sensitivity of net worth to parallel rises of 100 basis points in the yield curves was R$2,066 million in the local currency yield curve.
Structural Gap
The following table shows the managerial gaps between the re-pricing dates of our assets and liabilities as of December 31, 2017 in millions ofreais.
| | | Total | | 0-1 month | | 1-3 months | | 3-6 months | | 6-12 months | | 1-3 years | | 3-5 years | | > 5 years | | Not Sensitive |
| | | (in millions of R$) |
| Structural Gap | | | | | | | | | | | | | | | | | | | | | | | | | | | | | | | | | | | | |
| Money Market | | | 264,101 | | | | 74,447 | | | | 1,043 | | | | 1,248 | | | | 15,761 | | | | 26,403 | | | | 16,259 | | | | 35,028 | | | | 93,911 | |
| Loans | | | 259,116 | | | | 63,587 | | | | 32,065 | | | | 34,085 | | | | 31,435 | | | | 43,712 | | | | 16,192 | | | | 21,922 | | | | 16,119 | |
| Permanent | | | 15,089 | | | | — | | | | — | | | | — | | | | — | | | | — | | | | — | | | | — | | | | 15,089 | |
| Other | | | 145,404 | | | | 38,842 | | | | 44 | | | | 13 | | | | 7 | | | | — | | | | — | | | | — | | | | 106,498 | |
| Total Assets | | | 683,710 | | | | 176,876 | | | | 33,152 | | | | 35,346 | | | | 47,203 | | | | 70,115 | | | | 32,451 | | | | 56,951 | | | | 231,616 | |
| Money Market | | | (113,954 | ) | | | (72,220 | ) | | | (2,719 | ) | | | (1,531 | ) | | | (2,701 | ) | | | (14,660 | ) | | | (5,557 | ) | | | (5,428 | ) | | | (9,138 | ) |
| Deposits | | | (342,410 | ) | | | (170,410 | ) | | | (7,585 | ) | | | (3,092 | ) | | | (6,756 | ) | | | (15,732 | ) | | | (9,346 | ) | | | (24,221 | ) | | | (105,267 | ) |
| Equity and Other | | | (227,346 | ) | | | (47,296 | ) | | | (16,283 | ) | | | (8,194 | ) | | | (19,555 | ) | | | (16,365 | ) | | | — | | | | (2,778 | ) | | | (116,874 | ) |
| Total Liabilities | | | (683,710 | ) | | | (289,927 | ) | | | (26,587 | ) | | | (12,816 | ) | | | (29,013 | ) | | | (46,757 | ) | | | (14,903 | ) | | | (32,427 | ) | | | (231,280 | ) |
| – Balance Gap | | | — | | | | (113,051 | ) | | | 6,565 | | | | 22,529 | | | | 18,190 | | | | 23,358 | | | | 17,548 | | | | 24,524 | | | | 336 | |
| Off-Balance Gap | | | 31,757 | | | | 36,101 | | | | (13,530 | ) | | | 172 | | | | (1,234 | ) | | | (16,785 | ) | | | 2,372 | | | | (5,425 | ) | | | (33,428 | ) |
| Total Structural Gap | | | 31,757 | | | | (76,950 | ) | | | (6,965 | ) | | | 22,701 | | | | 16,957 | | | | 6,573 | | | | 19,920 | | | | 19,099 | | | | (33,092 | ) |
| Accumulated Gap | | | 31,757 | | | | (45,193 | ) | | | (52,158 | ) | | | (29,457 | ) | | | (12,500 | ) | | | (5,927 | ) | | | 13,993 | | | | 33,092 | | | | — | |
The interest rate risk of our balance sheet management portfolios, measured by the sensitivity of the net margin to a parallel movement of 100 basis points, decreased R$7 million during 2017, reaching a maximum of R$458 million in June. The sensitivity of the market value increased R$3 million during 2017, reaching a maximum of R$2,177 million in September. The main factors in 2017 that influenced sensitivity were the volatility of the yield curve, the portfolio decay, the methodologies in the cash flows and the effect of liquidity.
The following chart shows our NIM and MVE sensitivity during each month in 2017.

Interest Rate Risk Profile as of December 31, 2017
The currency gap tables below show the managerial distribution of risk by maturity and currency in Brazil as of December 31, 2017 in millions ofreais.
| | | Total | | 0-1 month | | 1-3 months | | 3-6 months | | 6-12 months | | 1-3 years | | 3-5 years | | > 5 years | | Not Sensitive |
| Gaps in local currency | | | | | | | | | | | | | | | | | | | | | | | | | | | | | | | | | | | | |
| Money Market | | | 231,362 | | | | 62,273 | | | | 412 | | | | 675 | | | | 15,310 | | | | 24,837 | | | | 14,379 | | | | 27,332 | | | | 86,143 | |
| Loans | | | 229,686 | | | | 58,044 | | | | 24,400 | | | | 24,539 | | | | 28,706 | | | | 42,389 | | | | 15,384 | | | | 21,286 | | | | 14,939 | |
| Permanent | | | 15,089 | | | | — | | | | — | | | | — | | | | — | | | | — | | | | — | | | | — | | | | 15,089 | |
| Others | | | 87,816 | | | | 29,000 | | | | — | | | | — | | | | — | | | | — | | | | — | | | | — | | | | 58,816 | |
| Total Assets | | | 563,953 | | | | 149,318 | | | | 24,812 | | | | 25,213 | | | | 44,016 | | | | 67,226 | | | | 29,763 | | | | 48,618 | | | | 174,987 | |
| Money Market | | | (103,906 | ) | | | (72,078 | ) | | | (2,174 | ) | | | (1,365 | ) | | | (1,852 | ) | | | -6,749 | | | | (5,501 | ) | | | (5,048 | ) | | | (9,138 | ) |
| Deposits | | | (331,212 | ) | | | (168,118 | ) | | | (4,200 | ) | | | (2,680 | ) | | | (6,080 | ) | | | (15,514 | ) | | | (9,346 | ) | | | (22,589 | ) | | | (102,686 | ) |
| Equity and Other | | | (137,310 | ) | | | (26,658 | ) | | | (7,277 | ) | | | (5,058 | ) | | | (10,103 | ) | | | (15,124 | ) | | | — | | | | (2,778 | ) | | | (70,312 | ) |
| Total Liabilities | | | (572,428 | ) | | | (266,854 | | | | (13,651 | ) | | | (9,103 | ) | | | (18,035 | ) | | | (37,388 | ) | | | (14,847 | ) | | | (30,415 | ) | | | (182,136 | ) |
| Off-Balance Gap | | | 49,484 | | | | 47,605 | | | | 14,275 | | | | (591 | ) | | | (1,154 | ) | | | (15,185 | ) | | | 1,158 | | | | 95,407 | | | | (53,933 | ) |
| Gap | | | 41,008 | | | | (69,931 | ) | | | 25,437 | | | | 15,520 | | | | 24,828 | | | | 14,653 | | | | 16,073 | | | | 12,796 | | | | (61,083 | ) |
| | | Total | | 0-1 month | | 1-3 months | | 3-6 months | | 6-12 months | | 1-3 years | | 3-5 years | | > 5 years | | Not Sensitive |
| Gaps in foreign currency | | | | | | | | | | | | | | | | | | | | | | | | | | | | | | | | | | | | |
| Money Market | | | 32,739 | | | | 12,174 | | | | 630 | | | | 574 | | | | 451 | | | | 1,566 | | | | 1,880 | | | | 7,696 | | | | 7,768 | |
| Loans | | | 29,430 | | | | 5,543 | | | | 7,665 | | | | 9,546 | | | | 2,729 | | | | 1,323 | | | | 808 | | | | 637 | | | | 1,179 | |
| Permanent | | | — | | | | — | | | | — | | | | — | | | | — | | | | — | | | | — | | | | — | | | | - | |
| Others | | | 57,588 | | | | 9,842 | | | | 44 | | | | 13 | | | | 7 | | | | — | | | | — | | | | — | | | | 47,682 | |
| Total Assets | | | 119,757 | | | | 27,559 | | | | 8,340 | | | | 10,133 | | | | 3,187 | | | | 2,889 | | | | 2,688 | | | | 8,333 | | | | 56,629 | |
| Money Market | | | (10,048 | ) | | | (143 | ) | | | (545 | ) | | | (165 | ) | | | (849 | ) | | | (7,910 | ) | | | (56 | ) | | | (380 | ) | | | — | |
| Deposits | | | (11,198 | ) | | | (2,292 | ) | | | (3,386 | ) | | | (412 | ) | | | (676 | ) | | | (218 | ) | | | — | | | | (1,632 | ) | | | (2,581 | ) |
| Equity and Other | | | (90,036 | ) | | | (20,638 | ) | | | (9,006 | ) | | | (3,136 | ) | | | (9,452 | ) | | | (1,240 | ) | | | — | | | | — | | | | (46,562 | ) |
| Total Liabilities | | | (111,282 | ) | | | (23,073 | ) | | | (12,937 | ) | | | (3,714 | ) | | | (10,978 | ) | | | (9,369 | ) | | | (56 | ) | | | (2,012 | ) | | | (49,144 | ) |
| Off-Balance Gap | | | (17,727 | ) | | | (11,505 | ) | | | (27,805 | ) | | | 762 | | | | (80 | ) | | | (1,600 | ) | | | 1,215 | | | | (18 | ) | | | 20,505 | |
| Gap | | | (9,252 | ) | | | (7,019 | ) | | | (32,402 | ) | | | 7,181 | | | | (7,871 | ) | | | (8,080 | ) | | | 3,847 | | | | 6,303 | | | | 27,991 | |
Market Risk: VaR Consolidated Analysis
Our total daily VaR as of December 31, 2016 and December 31, 2017, broken down by trading and structural (non-trading) portfolios, is set forth below. Our VaR data for trading and non-trading portfolios were summed and thus do not reflect the diversification effect.
| | | 2017 | | 2016 |
| | | Low | | Average | | High | | Period End | | Period End |
| | | (in millions of R$) |
| Trading | | | 25.0 | | | | 72.8 | | | | 267.3 | | | | 28.0 | | | | 37.7 | |
| Non-trading | | | 1,137.8 | | | | 2,293.8 | | | | 3,039.2 | | | | 1380.1 | | | | 3,330.2 | |
| Diversification effect | | | — | | | | — | | | | — | | | | — | | | | — | |
| Total | | | 1,162.8 | | | | 2,366.6 | | | | 3,306.5 | | | | 1,408.1 | | | | 3,367.9 | |
| Note: | VaR figures for trading and non-trading portfolios were added, thus disregarding the diversification effect. During 2017, the horizon of the VaR metric for the non-trading portfolio was changed from 1 to 21 business days. |
Our daily VaR estimates of interest rate risk, foreign exchange rate risk and equity price risk were as set forth below:
Interest Rate Risk
| | | 2017 | | 2016 |
| | | Low | | Average | | High | | Period End | | Period End |
| | | (in millions of R$) |
| Interest rate risk | | | | | | | | | | | | | | | | | | | | |
| Trading | | | 20.8 | | | | 52.5 | | | | 297.1 | | | | 23.1 | | | | 34.7 | |
| Non-trading | | | 1,137.8 | | | | 2,293.8 | | | | 3,039.2 | | | | 1,380.1 | | | | 3,330.2 | |
| Diversification effect | | | — | | | | — | | | | — | | | | — | | | | — | |
| Total | | | 1,158.6 | | | | 2,346.3 | | | | 3,336.3 | | | | 1,403.2 | | | | 3,364.9 | |
| Note: | VaR figures for trading and non-trading portfolios were added, thus disregarding the diversification effect. During the year of 2017, the horizon of the VaR metric for the non-trading portfolio was changed from 1 to 21 business days. |
Foreign Exchange Rate Risk
| | | 2017 | | 2016 |
| | | Low | | Average | | High | | Period End | | Period End |
| | | (in millions of R$) |
| Exchange rate risk | | | | | | | | | | | | | | | | | | | | |
| Trading | | | 2.5 | | | | 19.9 | | | | 51.3 | | | | 7.5 | | | | 10.3 | |
| Non–trading | | | N.A. | | | | N.A. | | | | N.A. | | | | N.A. | | | | N.A. | |
| Diversification effect | | | — | | | | — | | | | — | | | | — | | | | — | |
| Total | | | 2.5 | | | | 19.9 | | | | 51.3 | | | | 7.5 | | | | 10.3 | |
| Note: | VaR figures for trading and non-trading portfolios were added, thus disregarding the diversification effect. |
Equity Price Risk
| | | 2017 | | 2016 |
| | | Low | | Average | | High | | Period End | | Period End |
| | | (in millions of R$) |
| Equity price risk | | | | | | | | | | |
| Trading | | | 1.6 | | | | 11.8 | | | | 24.3 | | | | 8.1 | | | | 2.7 | |
| Non–trading | | | N.A. | | | | N.A. | | | | N.A. | | | | N.A. | | | | N.A. | |
| Diversification effect | | | — | | | | — | | | | — | | | | — | | | | — | |
| Total | | | 1.6 | | | | 11.8 | | | | 24.3 | | | | 8.1 | | | | 2.7 | |
| Note: | VaR figures for trading and non-trading portfolios were added, thus disregarding the diversification effect. |
Our daily VaR estimates by activity were as set forth below:
| | | 2017 | | 2016 |
| | | Low | | Average | | High | | Period End | | Period End |
| | | (in millions of R$) |
| Trading | | | | | | | | | | |
| Interest rate risk | | | 20.8 | | | | 52.5 | | | | 297.1 | | | | 23.1 | | | | 34.7 | |
| Exchange rate risk | | | 2.5 | | | | 19.9 | | | | 51.3 | | | | 7.5 | | | | 10.3 | |
| Equity | | | 1.6 | | | | 11.8 | | | | 24.3 | | | | 8.1 | | | | 2.7 | |
| Total Trading | | | 25.0 | | | | 72.8 | | | | 267.3 | | | | 28.0 | | | | 37.7 | |
| Non-trading | | | | | | | | | | | | | | | | | | | | |
| Interest rate | | | 1,137.8 | | | | 2,293.8 | | | | 3,039.2 | | | | 1,380.1 | | | | 3,330.2 | |
| Exchange rate | | | N.A. | | | | N.A. | | | | N.A. | | | | N.A. | | | | N.A. | |
| Equity | | | N.A. | | | | N.A. | | | | N.A. | | | | N.A. | | | | N.A. | |
| Total Non-Trading | | | 1,137.8 | | | | 2,293.8 | | | | 3,039.2 | | | | 1,380.1 | | | | 3,330.2 | |
| Total (Trading + Non-Trading) | | | 1,162.8 | | | | 2,366.6 | | | | 3,306.5 | | | | 1,408.1 | | | | 3,367.9 | |
| Interest rate | | | 1,158.6 | | | | 2,346.3 | | | | 3,336.3 | | | | 1,403.2 | | | | 3,364.9 | |
| Exchange rate | | | 2.5 | | | | 19.9 | | | | 51.3 | | | | 7.5 | | | | 10.3 | |
| Equity | | | 1.6 | | | | 11.8 | | | | 24.3 | | | | 8.1 | | | | 2.7 | |
| Note: | VaR figures for trading and non-trading portfolios were added, thus disregarding the diversification effect. During the year of 2017, the horizon of the VaR metric for the non-trading portfolio was changed from 1 to 21 business days. |
Operational Risk
We adopted the definition of the Basel Committee and Brazilian Central Bank for operational risk as the possibility of losses resulting from inadequate processes, people and systems failures or even from external events such as natural disasters, terrorism, robbery and vandalism. This definition includes the legal risk associated with the inadequacy or deficiency in executed agreements, as well as penalties for noncompliance with legal provisions and damages for third parties resulting from our activities. Operational risk losses may result in financial losses, adversely affect the continuity of our business and also negatively affect the public’s image of us.
To accomplish our operational risk objectives, we have established an operational risk model based on three lines of defense, with the objective of continuously improving and developing our management and control of operational risks. The three lines of defense are as follows:
| · | First line of defense: all business and support areas within Santander Brasil are responsible for identifying, managing, mitigating and reporting operational risk to its activities; |
| · | Second line of defense: the control of operational risks and control of technological and cybernetic risk units is responsible for monitoring and ensuring sound operational and control of technological risk management practices throughout the organization. It is also responsible for implementing and disseminating our operational risk culture, defining methodologies, policies, tools, training and applicable procedures and requirements for the effective management of operational risk and of ensuring there is adequate business contingency planning in place throughout the organization; |
| · | Third line of defense: the internal audit department is responsible for undertaking independent reviews of the risk management undertaken by the first and second lines of defense and for promoting continuous improvements in both of these lines of defense. |
The objectives of our operational risk management model are:
| · | to disseminate a culture of operational risk management and control, to foster the prevention of risk events and operational risks losses and to mitigate their financial, legal and reputational impacts; |
| · | to provide support to decision-makers within Santander Brasil; |
| · | to ensure the business continuity in a sustainable manner and to improve internal controls; and |
| · | to maintain control of our operational risk in a manner which is consistent with our business strategy. |
The following bodies are involved in the implementation of our risk management model in order to ensure we have a structured process of operational risk management and decision making:
| · | Risk Control Committee (Comitê de Controle de Riscos): A committee which aims to perform a holistic and periodic monitoring of the risks to which we are exposed and to exercise independent control on the risk management activities; |
| · | Operational Risk Operational Committee (Comitê Operacional de Riscos Operacionais): A committee which aims to ensure and to foster the adequate monitoring, control and mitigation of operational risks; and |
| · | Operational Risk Forum (Fórum de Riscos Operacionais): An independent forum, responsible for implementing and disseminating cultural norms, methodologies, standards, policies, tools, training and procedures applicable and required for the effective and efficient management and control of operational risk. |
Our risk management model assists managers in achieving their strategic objectives by contributing to the decision-making process and by reducing operational risk losses. It is based on best market practice and is compliant with the applicable regulatory requirements.
Social and Environmental Risk
We have a social and environmental risk management system for analyzing clients in the wholesale segment. Under this system, clients who are part of one of our 14 sectors of special social and environmental attention and have credit limits and/or risk greater than R$1.0 million are screened for environmental and social concerns. These aspects include contaminated land, illegal deforestation, labor violations and other major environmental and social issues where there are potential legal penalties and reputational risk. In 2017, we screened 2051 wholesale corporate clients, including about 89 major new projects, both Equator Principles and non-Equator Principles, for these types of risks. A specialized team with backgrounds in biology, health and safety engineering, chemical engineering and geology monitors our customers’ environmental practices and point out to our financial analysts unfavorable environmental conditions that may cause damage to our customers’ financial condition and collateral, among other effects. Furthermore, wholesale segment clients, when starting their commercial relationship with us, are screened for environmental and social concerns by the new clients’ acceptance area. The social and environmental risk unit uses software that optimizes, organizes and standardizes the analysis process, leading to more precise monitoring of clients. We constantly train our credit and commercial areas about how to apply environmental and social risk standards in the credit approval process for companies.
Cyber Security Risk
We have put in place extensive security measures to mitigate the risk of cyber-security threats affecting our technology platforms and our business. We have taken into consideration the best practices set forth in the ISO-27002 security standard to assist us in formulating such security measures. The security measures, which we currently have in place include, but are not limited to access and privilege management, separation of test and production environments, network security analysis, incident management, baseline configuration of hardware and software, activity log correlation, malware prevention and remediation, and security analysis of third-party operations. We employ a range of security processes and solutions to enact such security measures, including regular compliance checks and maintaining continuous monitoring of network activity by our Security Operations Center. We also perform periodic reviews of cyber-security threats and related controls, including periodic penetration tests performed by independent third parties. In addition, we are constantly investing in technology and security solutions, as well as conducting user training and awareness efforts. Furthermore, we cooperate and exchange information and experience relating to cyber-security with local and international security communities, such as local telecommunications companies and other financial institutions, and in our capacity as a member of the Financial Services—Information Sharing and Analysis Center community.
In 2017, we set up our cyber security department, which is responsible for all matters relating to cyber security within Santander Brasil. This new structure aims to segregate the functions of the information security group and the cyber security group, thereby enabling each to focus on its designated activities and strategies.
ITEM 12. DESCRIPTION OF SECURITIES OTHER THAN EQUITY SECURITIES
12A. Debt Securities
Not applicable.
12B. Warrants and Rights
Not applicable.
12C. Other Securities
Not applicable.
12D. American Depositary Receipts
Depositary
The Bank of New York Mellon, or BNYM, has acted as depositary in relation to our ADR program since October 20, 2015. The principal executive office of BNYM is located at One Wall Street, New York, New York 10286, United States.
Fees and Expenses
BNYM, as depositary, may charge the following fees and expenses to the ADR holders, any party depositing or withdrawing Units or any party surrendering ADRs or to whom ADRs are issued (including, without limitation, issuance pursuant to a stock dividend or stock split declared by us or an exchange of stock regarding the ADRs or the deposited securities or a distribution of ADRs), as applicable:
| · | a fee of U.S.$5.00 or less for each 100 ADRs (or portion thereof) issued, delivered or surrendered, as the case may be; |
| · | a fee of U.S.$0.05 or less per ADR (or portion thereof) for any cash distribution made pursuant to the deposit agreement; |
| · | a fee of U.S.$0.05 or less per ADR (or portion thereof) per annum for depositary services; |
| · | a fee for the distribution of securities or of rights (where the depositary will not exercise or sell those rights on behalf of the ADR holders), such fee being in an amount equal to the fee for the execution and delivery of ADRs which would have been charged as a result of the deposit of such securities under the deposit agreement entered into with BNYM (for these purposes treating all such securities as if they were Units) but which securities are instead distributed by the depositary to the ADR holders; |
| · | such registration fees as may from time to time be in effect for the registration of transfers of Units generally on the registrar’s unit register and applicable to transfers of Units to or from the name of the depositary or its nominee or the name of the custodian for the depositary or its nominee on the making of deposits or withdrawals; |
| · | certain other cable and facsimile transmission fees and expenses; |
| · | such expenses as are incurred by the depositary in the conversion of foreign currency; |
| · | stock transfer or other taxes and other governmental charges; and |
| · | any other charges payable by the depositary or the custodian of the depositary, any of the depositary’s or such custodian’s agents or the agents of the depositary’s or such custodian’s agents, in connection with the servicing of Units or other deposited securities (which charges shall be assessed against the ADR holders as of the date or dates set by the depositary in accordance with the deposit agreement which we have entered into with BNYM and shall be payable at the sole discretion of the depositary by billing those ADR holders for those charges or by deducting those charges from one or more cash dividends or other cash distributions). |
The depositary may collect any of its fees by deduction from any cash distribution payable, or by selling a portion of any securities to be distributed, to ADR holders that are obligated to pay those fees.
We will pay all other charges and expenses of the depositary and any agent of the depositary (except the custodian) pursuant to agreements from time to time between us and the depositary. The fees described above may be amended from time to time.
Direct and Indirect Payments
BNYM has agreed to reimburse us for certain expenses related to the establishment and maintenance of the ADR program including, among others, expenses incurred in connection with investor relations activities and any other ADR program expenses. Under certain circumstances, including the removal of BNYM as depositary, we are required to repay to BNYM amounts reimbursed in prior periods. For the year ended December 31, 2017, such reimbursements amounted to U.S.$5.7 million.
PART II
ITEM 13. DEFAULTS, DIVIDEND ARREARAGES AND DELINQUENCIES
No matters to report.
ITEM 14. MATERIAL MODIFICATIONS TO THE RIGHTS OF SECURITY HOLDERS AND USE OF PROCEEDS
No matters to report.
ITEM 15. CONTROLS AND PROCEDURES
15A. Disclosure Controls and Procedures
As of December 31, 2017, under the supervision and with the participation of our management, including our chief executive officer, chief financial officer and chief accounting officer, we performed an evaluation of the effectiveness of the design and operation of our disclosure controls and procedures (as defined in Rule 13a-15(e) under the Exchange Act). There are, as described below, inherent limitations to the effectiveness of any control system, including disclosure controls and procedures. Accordingly, even effective disclosure controls and procedures can provide only reasonable assurance of achieving their control objectives.
Based on such evaluation, our chief executive officer, chief financial officer and chief accounting officer concluded that our disclosure controls and procedures are effective in ensuring that information we are required to disclose in the reports we file or submit under the Exchange Act is (i) recorded, processed, summarized and reported within the time periods specified in the SEC’s rules and forms and (ii) accumulated and communicated to our management, including our chief executive officer, chief financial officer and chief accounting officer, as appropriate to allow timely decisions regarding required disclosures.
In addition to this and in accordance with the applicable legal requirements (Resolutions 2,554/98 and Circular 3,467/09), we produced and issued an internal report on March 19, 2018, according to the Brazilian Central Bank’s requirements regarding the effectiveness of the internal control environment.
15B. Management’s Annual Report on Internal Control over Financial Reporting
Our management is responsible for establishing and maintaining an adequate internal control over financial reporting as defined in Rule 13a-15(f) under the Exchange Act.
Our internal control over financial reporting is a process designed by, or under the supervision of, our principal executive and principal financial officers and effected by our board of directors, management and other personnel, to provide reasonable assurance regarding the reliability of financial reporting and the preparation of consolidated financial statements for external purposes, in accordance with generally accepted accounting principles. For us, generally accepted accounting principles refer to IFRS as issued by the IASB.
Our internal control over financial reporting includes those policies and procedures that:
| · | pertain to the maintenance of records that in reasonable detail accurately and fairly reflect the transactions and dispositions of our assets; |
| · | provide reasonable assurance that transactions are recorded as necessary to permit preparation of consolidated financial statements in accordance with generally accepted accounting principles, and that our receipts and expenditures are being made only in accordance with authorizations of our management and officers; and |
| · | provide reasonable assurance of prevention or timely detection of unauthorized acquisition, use or disposition of our assets that could have a material effect on the consolidated financial statements. |
Because of its inherent limitations, internal control over financial reporting may not prevent or detect misstatements. Also, projections of any evaluation of effectiveness to future periods are subject to the risk that controls may become inadequate because of changes in conditions, or that the degree of compliance with the policies or procedures may deteriorate.
We have adapted our internal control over financial reporting to the international standards and comply with the guidelines set by the Committee of Sponsoring Organizations of the Treadway Commission (“COSO”) in its Internal Control – Integrated Framework 2013. These guidelines have been extended and implemented for the Group, applying a common methodology and standardizing the procedures for identifying processes, risks and controls.
Risk Management Integrated Framework
The documentation process in our companies has been constantly directed and monitored by a global coordination team, which set the guidelines for its development and supervised its execution at the unit level.
The general framework is consistent, as it assigns to management specific responsibilities regarding the structure and effectiveness of the processes related directly and indirectly with the production of consolidated financial statements, as well as the controls needed to mitigate the risks inherent in these processes.
Under the supervision and with the participation of our management, including our Chief Executive Officer, Chief Financial Officer and Chief Accounting Officer, we conducted an evaluation of the effectiveness of our internal control over financial reporting as of December 31, 2017, based on the framework set by the COSO Integrated Framework 2013.
Based on this assessment, which was carried out through April 9, 2018, our management concluded that, as of December 31, 2017, its internal control over financial reporting was effective based on those criteria.
Our internal control over financial reporting as of December 31, 2017, has been audited by an independent registered public accounting firm which has issued a report on the effectiveness of our Internal Control over financial reporting as of December 31, 2017, for which see “Item 15C. Audit Report of the Registered Public Accounting Firm.”
15C. Audit Report of the Registered Public Accounting Firm
For the report of PwC, our registered public accounting firm, dated April 9, 2018, on the effectiveness of our internal control over financial reporting as of December 31, 2017, see “Item 18. Financial Statements.”
15D. Changes in Internal Control over Financial Reporting
There was no change in our internal control over financial reporting that occurred during the period covered by this annual report that has materially affected, or is reasonably likely to materially affect, our internal control over financial reporting.
ITEM 16. [RESERVED]
ITEM 16A. AUDIT COMMITTEE FINANCIAL EXPERT
The board of directors has determined that one of the members of our audit committee, Mr. Luiz Carlos Nannini is an “Audit Committee Financial Expert” and meets the requirements set forth by the SEC and NYSE. He is, as are all other current members of the audit committee, deemed independent under the applicable Brazilian law and the regulations of the SEC and NYSE.
For more details about the audit committee see “Item 6. Directors, Senior Management and Employees—C. Board Practices—Board Advisory Committees—Audit Committee”
ITEM 16B. SANTANDER BRASIL’S CODE OF ETHICAL CONDUCT
The Code of Ethical Conduct, the central element of the Governance Compliance, is applicable to the members of the boards of directors, executive officers and to all employees and trainees (“Persons Subject to the Code of Ethical Conduct”) of Santander Brasil and its subsidiaries. It defines the principles that should guide both the personal and professional behavior of the Persons Subject to the Code of Ethical Conduct. They must know the Code of Ethical Conduct and seek to broaden it, by championing and striving for its enforcement. To that effect,
Persons Subject to the Code of Ethical Conduct have the obligation to attend and participate in all training activities to which they are summoned in order to become appropriately acquainted with the Code of Ethical Conduct. The Persons Subject to the Code of Ethical Conduct should be guided by ethical principles and rules of conduct that are consistent with the companies’ values.
The Code of Ethical Conduct helps us to establish respectful and transparent relationships and aims for the accomplishment of Santander Brasil’s obligations with its customers, employees, shareholders, partners, regulators and society as a whole. The Code of Ethical Conduct should also be a reference for compliance with legal duties and for the maintenance of commercial relationships founded on trust with partners and clients.
The full version of the Santander Code of Ethical Conduct, which does not form part of this annual report on Form 20-F, is available on our website atwww.santander.com.br/ri.
ITEM 16C. PRINCIPAL ACCOUNTANT FEES AND SERVICES
The balance of “Other general administrative expenses—Technical reports” includes the fees paid by the consolidated companies (detailed in the accompanying Appendix I of the consolidated financial statements included elsewhere in this annual report) to (1) PwC for the fiscal years ended December 31, 2017 and December 31, 2016 and (2) to Deloitte for the fiscal year ended December 31, 2015, as follows:
| | | For the year ended December 31, |
| | | 2017 | | 2016 | | 2015 |
| | | (in R$ millions) |
| Audit of the annual financial statements of the companies audited (constant scope of consolidation)(1) | | | 17.5 | | | | 9.2 | | | | 12.0 | |
| Audit related | | | 3.9 | | | | 0.1 | | | | 1.5 | |
| Tax | | | — | | | | — | | | | – | |
| All other | | | 1.3 | | | | 0.7 | | | | 1.7 | |
| Total | | | 22.7 | | | | 10.0 | | | | 15.2 | |
| (1) | On March 18, 2016, Santander Brasil engaged PwC to act to replace Deloitte as the auditor of the Santander Brasil group from January 1, 2016. |
The approximate value of withholding taxes in respect of the audit fees for the year ended December 31, 2017 according to applicable law totaled R$3.7 million.
The services commissioned from our auditors meet the independence requirements stipulated by the Brazilian Central Bank and CVM regulation and by the Sarbanes-Oxley Act of 2002, and they did not involve the performance of any work that is incompatible with the audit function.
If we are required to engage an auditing firm for audit and audit-related services, those services and any fees paid to the auditing firms by us have to be pre-approved by the audit committee.
Our audit committee pre-approves all audit and non-audit services to be performed by our registered public accounting firm.
ITEM 16D. EXEMPTIONS FROM THE LISTING STANDARDS FOR AUDIT COMMITTEES
Under NYSE and SEC rules for listed companies, we must comply with Rule 10A-3 under the Securities Exchange Act (Listing Standards Relating to Audit Committees). Rule 10A-3 provides that we should establish an audit committee composed of members of the board of directors, meet the requirements specified in the listing standards, or appoint and establish a board of auditors or similar body to perform the role of the audit committee, in reliance on the general exemption of audit committees of foreign private issuers set forth in Rule 10A-3(c) (3) of the Securities Exchange Act.
In accordance with the rules of the Brazilian Central Bank, we constituted a body similar to the audit committee of the board of directors of an American company, which we refer to as our “audit committee.”
Our audit committee observes Brazilian legislation and performs all the functions of an audit committee under Rule 10A-3. As provided in Brazilian law, our board of directors and the audit committee are distinct statutory entities. Moreover, according to Brazilian law, the function of hiring independent auditors is a power reserved exclusively to the board of directors of the company, under the specific and express recommendation issued from the audit committee, as the case may be, for the engagement or replacement of independent auditors, and our board of directors acts as our audit committee for the purposes of nominating such independent auditors.
Except in these respects, our audit committee is comparable to an audit committee of the board and performs the same functions of an American company. Our audit committee is able to act independently in carrying out the responsibilities of an audit committee under the Sarbanes-Oxley Act, meets the exemption requirements of Rule 10A-3(c)(3) and therefore is in compliance with Rule 10A-3 of the Securities Exchange Act.
ITEM 16E. PURCHASES OF EQUITY SECURITIES BY THE ISSUER AND AFFILIATED PURCHASERS
The following table reflects purchases of our equity securities, including in the form of ADRs, by us or our affiliates in 2017.
Santander Brasil – Buyback Program Units
| Months | | Total Number of Units Purchased (3) | | Average Price Paid per Unit in U.S.$ (4) | | Total Number of Units Purchased as Part of Publicly Announced Plans or Programs (1) (5) | | Maximum Number of Units that May Yet Be Purchased Under the Plans or Programs (2) |
| November 2016 | | | 678,400 | | | | 25.695921 | | | | 678,400 | | | | | |
| December 2016 | | | 911,400 | | | | 26.262221 | | | | 911,400 | | | | | |
| January 2017 | | | 0 | | | | 0 | | | | 0 | | | | | |
| February 2017 | | | 40,000 | | | | 32.290000 | | | | 40,000 | | | | | |
| March 2017 | | | 30,716 | | | | 16.448717 | | | | 30,716 | | | | | |
| April 2017 | | | 0 | | | | 0 | | | | 0 | | | | | |
| May 2017 | | | 5,807,100 | | | | 26.685148 | | | | 5,807,100 | | | | | |
| June 2017 | | | 3,065,400 | | | | 25.030526 | | | | 3,065,400 | | | | | |
| July 2017 | | | 0 | | | | 0 | | | | 0 | | | | | |
| August 2017 | | | 1,042,900 | | | | 27.43204097 | | | | 1,042,900 | | | | | |
| September 2017 | | | 2,783,800 | | | | 28.614697 | | | | 2,783,800 | | | | | |
| October 2017 | | | 552,300 | | | | 29.810967 | | | | 552,300 | | | | | |
| Total | | | 14,912,016 | | | | | | | | 14,912,016 | | | | 39,391,314 | |
| (1) | The buyback program, as approved by our board of directors on November 3, 2015, for the period from November 4, 2015 to November 3, 2016. A new buyback program was approved by our board of directors on November 3, 2016 for the period from November 4, 2016 to November 3, 2017. |
| (2) | The number entered in the “Total” row of the column “Maximum Number (or Approximate Dollar Value) of Units that May Yet Be Purchased Under the Plans or Programs” refers to the number of Units which may be repurchased in the period from November 2015 to November 2016 as approved by our board of directors. The number of Units that may be repurchased for the period from November 4, 2016 to November 3, 2017 as approved by our board of directors is 38,402,972. |
| (3) | The “Total Number of Units Purchased” 2,305,800 in November 2017 and 1,283,600 in December 2017. |
| (4) | The “Average Price Paid per Unit in U.S.$” was 29.72024040 in November 2017 and U.S.$31.109793 in December 2017. |
| (5) | The “Total Number of Units Purchased as Part of Publicly Announced Plans or Programs” was 2,305,800 in November 2017 and 1,283,600 in December 2017. |
| (6) | The repurchase plans define an annual maximum of Units to be repurchased but without a monthly limit. |
Santander Brasil – Buyback Program ADRs
| Months | | Total Number of ADRs Purchased(3) | | Average Price Paid per ADR in U.S.$(4) | | Total Number of ADRs Purchased as Part of Publicly Announced Plans or Programs (1)(5) | | Maximum Number of ADRs that May Yet Be Purchased Under the Plans or Programs (2) |
| November 2016 | | — | | — | | — | | — |
| December 2016 | | — | | — | | — | | — |
| January 2017 | | — | | — | | — | | — |
| February 2017 | | — | | — | | — | | — |
| March 2017 | | — | | — | | — | | — |
| April 2017 | | — | | — | | — | | — |
| May 2017 | | — | | — | | — | | — |
| June 2017 | | — | | — | | — | | — |
| July 2017 | | — | | — | | — | | — |
| August 2017 | | — | | — | | — | | — |
| September 2017 | | — | | — | | — | | — |
| October 2017 | | — | | — | | — | | — |
| Total | | | — | | | | — | | | | — | | | | 39,391,314 | |
| (1) | The buyback program, as approved by our board of directors on November 3, 2015, for the period from November 4, 2015 to November 3, 2016. A new buyback program was approved by our board of directors on November 3, 2016 for the period from November 4, 2016 to November 3, 2017. |
| (2) | The number entered in the “Total” row of the column “Maximum Number (or Approximate Dollar Value) of ADRs that May Yet Be Purchased Under the Plans or Programs” refers to the number of ADRs which may be repurchased for the period from November 2015 to November 2016 as approved by our board of directors. The number of ADRs that may be repurchased for the period from November 4, 2016 to November 3, 2017 as approved by our board of directors is 38,402,972. |
| (3) | The “Total Number of ADRs Purchased” was zero in each of November 2017 and December 2017. |
| (4) | The “Average Price Paid per ADRs in U.S.$” was zero in each of November 2017 and December 2017. |
| (5) | The “Total Number of ADRs Purchased as Part of Publicly Announced Plans or Programs” was zero in November 2017 and December 2017. |
(6) The repurchase plans define an annual maximum of ADRs to be repurchased but without a monthly limit.
For further information on our buyback program, please see “Item 4. Information on the Company—A. History and Development of the Company—Important Events—Buyback Program.”
ITEM 16F. CHANGE IN REGISTRANT’S CERTIFYING ACCOUNTANT
Not applicable.
ITEM 16G. CORPORATE GOVERNANCE
In December 2012, primarily in response to the requirements of the European Banking Authority, Santander Spain adopted a corporate governance framework (Marco de Gobierno Interno del Grupo Santander). The purpose of the framework is to organize and standardize the corporate governance practices of Santander Spain and its most significant subsidiaries, including us, in order to enhance the ability of Santander Spain to manage the risks arising from Santander group operations around the world.
The three pillars of the framework are (i) an organizational model based on functions subject to internal governance, (ii) terms of reference according to which Santander Spain exercises control and oversight over its subsidiaries and participates in specific decisions as their controlling shareholder, and (iii) corporate models establishing common guidelines for the management and control of Santander Spain’s subsidiaries, subject to local autonomy considerations. In general, the framework purports to implement organizational and procedural changes rather than mandating particular substantive outcomes. However, in some cases, and subject to the limitations there set forth, the framework states that Santander Spain may require that its subsidiaries make substantive changes or take specific actions. The framework enables Santander Spain to participate in the decision-making processes of its subsidiaries by requiring its approval of certain decisions that may have a significant impact on the Santander Group as a whole due to their significance or potential risk, such as decisions relating to mergers and acquisitions, capital structure, dividends and risk tolerance, among other things. The framework also requires that a single person at each subsidiary be in charge of each function subject to internal governance and gives Santander Spain the authority to participate in the appointment, evaluation and compensation of each such person.
By its own terms, the framework as a whole is premised on the legal and financial autonomy of the subsidiaries and does not empower Santander Spain to supplant its subsidiaries’ decision-making processes. Moreover, each of the three pillars of the framework is explicitly made subject to local legal requirements. We approved the adoption of this corporate governance framework in May 2013, subject to the precedence of applicable Brazilian laws and regulations and the limitations imposed thereby such as banking secrecy laws, and subject also to our corporate governance practices, including our policies for related party transactions and for disclosure of material acts and facts.
As a result of the precedence given to local legal requirements in the framework itself and in our adopting resolutions, we do not expect that the adoption of the corporate governance framework will affect our ability to comply with applicable corporate governance regulations, including the rules of the Brazilian Central Bank, CVM and B3, and SEC and NYSE rules applicable to foreign private issuers.
Pursuant to Section 303A.11 of the Listed Company Manual of the NYSE we are required to provide a summary of the significant ways in which our corporate governance practices differ from those required for United States resident companies under the NYSE listing standards. Section 303A of the NYSE Listed Company Manual sets forth certain corporate governance requirements that a company must satisfy to be listed on the NYSE. However, exemptions from many of the requirements are available to foreign private issuers such as us. As a foreign private issuer, we are permitted to, and we will, follow home country practice in lieu of the NYSE corporate governance standards from which we are exempt.
A discussion of the significant differences between Brazilian corporate governance standards that govern our practices and the NYSE standards applicable to U.S. companies follows below. It includes only a brief summary description of our corporate governance practices.
Principal Differences between Brazilian and U.S. Corporate Governance Practices
We are also subject to the NYSE corporate governance listing standards. As a foreign private issuer, the standards applicable to us are considerably different than the standards applied to U.S. listed companies. Under the NYSE rules, we are required only to: (i) have an audit committee or audit board, pursuant to an applicable exemption available to foreign private issuers, that meets certain requirements, as discussed below, (ii) provide prompt certification by our Chief Executive Officer of any material non-compliance with any applicable NYSE corporate governance rules, (iii) submit an executed written affirmation annually to the NYSE and submit an interim written affirmation each time a change occurs to the board or any of the committees subject to Section 303A of the NYSE rules, and (iv) provide a brief description of the significant differences between our corporate governance practices and the NYSE corporate governance practice required to be followed by U.S. listed companies. The discussion of the significant differences between our corporate governance practices and those required of U.S. listed companies follows below, as required for foreign private issuers by NYSE Rule 303A.11.
Majority of Independent Directors
The NYSE rules require that a majority of the board must consist of independent directors. As a company with a majority of our voting shares being beneficially owned by another entity (Santander Spain), we are not required to comply with this rule. Independence is defined by various criteria, including the absence of a material relationship between the director and the listed company. Currently, our board of directors must have at least five members, at least 20.0% of which must be independent, as determined pursuant to Article 14 of our By-Laws. Currently, five members of our board of directors are deemed independent (representing 50% of the composition of our board of directors). Also, Brazilian Corporate Law, the Brazilian Central Bank and the CVM have established rules that require directors to meet certain qualification requirements and that address the compensation, duties and responsibilities of, as well as the restrictions applicable to, a company’s executive officers and directors. While we believe that these rules provide adequate assurances that our directors are independent and meet the requisite qualification requirements under Brazilian law, we believe such rules would permit us to have directors that would not otherwise pass the test for director independence established by the NYSE. Brazilian Corporate Law requires that our directors shall be elected by our shareholders at an annual shareholders’ meeting. Currently, all of our directors are elected by our shareholders after recommendation of the Nomination and Governance Committee, for a term of 2 years.
Executive Sessions
NYSE rules require that the non-management directors must meet at regularly scheduled executive sessions without management present. Brazilian Corporate Law does not have a similar provision. According to Brazilian Corporate Law, up to one-third of the members of the board of directors can be elected from management members. Our Chief Executive Officer, Mr. Sergio Agapito Lires Rial, and the Senior Vice President Executive Officer, Mr. José de Paiva Ferreira are members of our board of directors. There is no requirement that our non-management directors meet regularly without management. As a result, the non-management directors on our board do not typically meet in executive session.
Committees
NYSE rules require that listed companies have a nominating/corporate governance committee and a remuneration committee composed entirely of independent directors and governed by a written charter addressing the committee’s required purpose and detailing its required responsibilities. As a company whose majority of voting shares is held by another group, we are not required to comply with this rule. The responsibilities of the nominating/corporate governance committee include, among other things, identifying and selecting qualified board member nominees and developing a set of corporate governance principles applicable to the company. The responsibilities of the remuneration committee, in turn, include, among other things, reviewing corporate goals relevant to the Chief Executive Officer’s compensation, evaluating the Chief Executive Officer’s performance, approving the Chief Executive Officer’s compensation levels and recommending to the board non-chief executive officer compensation, incentive-compensation and equity-based plans.
In January 2016, our board of directors approved the terms for the establishment of our Nomination and Governance Committee. The Nomination and Governance Committee oversees corporate governance and compliance at Santander Brasil.
CMN rules require us to have a compensation committee of at least three members. We have created the compensation committee, whose function is to advise our board of directors on matters in connection with, but not limited to (i) fixed and variable remuneration policies and benefits and (ii) the long-term incentive plan.
See “Item 6. Directors, Senior Management and Employees—C. Board Practices” for a complete description of all of our board advisory committees.
Pursuant to Brazilian Corporate Law, the aggregate compensation for our directors and executive officers is established by our shareholders.
Audit Committee and Audit Committee Additional Requirements
NYSE rules require that listed companies have an audit committee that (i) is composed of a minimum of three independent directors who are all financially literate, (ii) meets the SEC rules regarding audit committees for listed companies, (iii) has at least one member who has accounting or financial management expertise and (iv) is governed by a written charter addressing the committee’s required purpose and detailing its required responsibilities.
CMN rules require us to have an audit committee of at least three independent members. The audit committee is elected by the board of directors. SEC Rule 10A-3 provides that the listing of securities of foreign private issuers will be exempt from the audit committee requirements if the issuer meets certain requirements. Our audit committee allows us to meet the requirements set forth by this rule. See “Item 16D. Exemptions from the Listing Standards for Audit Committees.”
Shareholder Approval of Equity Compensation Plans
NYSE rules require that shareholders be given the opportunity to vote on all equity compensation plans and material revisions thereto, with limited exceptions. Under Brazilian Corporate Law, shareholders must approve all stock option plans. In addition, any issuance of new shares that exceeds our authorized share capital is subject to shareholder approval. Our shareholders do not have the opportunity to vote on all equity compensation plans.
Corporate Governance Guidelines
NYSE rules require that listed companies adopt and disclose corporate governance guidelines. We comply with the corporate governance guidelines under applicable Brazilian law. The corporate governance guidelines applicable to us under Brazilian law are consistent with the guidelines established by the NYSE.
Pursuant to best practices of corporate governance guidelines, on September 22, 2010, our board of directors approved a policy that regulates related party transactions, which was last revised on March 18, 2015. This policy provides rules which aim to ensure that all decisions, in particular those involving related parties and other situations with potential conflict of interests will be aligned with our interests and those of our shareholders. The policy applies to all employees, directors and executive officers of Santander Brasil.
Code of Business Conduct and Ethics
NYSE rules require that listed companies adopt and disclose a code of conduct and ethics for directors, officers and employees, and promptly disclose any waivers of the code for directors or executive officers. Applicable Brazilian law does not have a similar requirement. We adopted a Code of Ethical Conduct on February 27, 2009, last revised on September 28, 2016, which regulates the set of ethical principles that shall guide the conduct of our employees, officers and directors of Santander Brasil, as well as of its affiliates. Our Code of Ethical Conduct complies with the requirements of the Sarbanes-Oxley Act and the NYSE rules.
Internal Audit Function
NYSE rules require that listed companies maintain an internal audit function to provide management and the audit committee with ongoing assessments of the company’s risk management processes and system of internal control.
Our internal audit department works independently to conduct methodologically structured examinations, analysis, surveys and fact finding to evaluate the integrity, adequacy, effectiveness, efficiency and economy of the information systems processes and internal controls related to our risk management. The internal audit department reports on an ongoing basis to the audit committee. In carrying out its duties, the internal audit department has access to all documents, records, systems, locations and professionals involved with the activities under review.
Other Corporate Frameworks
On the recommendation of our controlling shareholder, our board of directors analyzed and approved the adoption of a series of corporate frameworks which aim to foster the adoption of best practices applicable to matters such as: (i) internal audit; (ii) accounting and disclosure of financial information; (iii) risk control; (iv) communication and branding; (v) human resources; (vi) information technology; and (vii) money laundering protection. Currently, we have a total of sixteen frameworks (Marcos Corporativos) in force. Once these frameworks are adopted by us, we believe they will continue to enhance the formalization of our governance and internal controls structures.
Website
Our corporate governance codes, which do not form part of this annual report, are available to the public on our website in Portuguese and English at www.santander.com.br under the heading “Investor Relations—Corporate Governance.” The information contained on our website, any website mentioned in this annual report, or any website directly or indirectly linked to these websites, is not part of and is not incorporated by reference in, this annual report.
ITEM 16H. MINE SAFETY DISCLOSURE
Not applicable.
PART III
ITEM 17. FINANCIAL STATEMENTS
We have responded to Item 18 in lieu of this item.
ITEM 18. FINANCIAL STATEMENTS
Consolidated Financial Statements are filed as part of this annual report, see pages F-1 to F-135.
ITEM 19. EXHIBITS
(a) Index to Consolidated Financial Statements
| | Page |
| Report of PricewaterhouseCoopers Auditores Independentes | F-1 |
| Report of Deloitte Touche Tomahtsu Auditores Independentes | F-3 |
| Consolidated Statement of Financial Position for the years ended December 31, 2017, 2016 and 2015 | F-4 |
| Consolidated Income Statements for the years ended December 31, 2017, 2016 and 2015 | F-6 |
| Consolidated Statements of Profit or Loss and Other Comprehensive Income for the years ended December 31, 2017, 2016 and 2015 | F-7 |
| Consolidated Statements of Changes in Equity for the years ended December 31, 2017, 2016 and 2015 | F-8 |
| Consolidated Statements of Cash Flow for the years ended December 31, 2017, 2016 and 2015 | F-9 |
| Notes to the Consolidated Financial Statements for the years ended December 31, 2017, 2016 and 2015 | F-11 |
(b) List of Exhibits.
We are filing the following documents as part of this annual report on Form 20-F:
| Exhibit Number | | Description |
| 1.1 | | English translation of the By-laws of Santander Brasil, amended and restated on September 18, 2017 (incorporated by reference to our Form 6-K (file no. 001-34476) filed with the SEC on September 18, 2017). |
| 2.1 | | Form of Deposit Agreement among Santander Brasil, The Bank of New York Mellon, as depositary, and the holders from time to time of American depositary shares issued thereunder, including the form of American depositary receipts (incorporated by reference to Exhibit 1 to our Registration Statement on Form F-6 (file no. 333-207353) filed with the SEC on October 9, 2015). |
| 2.2 | | Subordinated Indenture dated as of January 29, 2014, among Santander Brasil and The Bank of New York Mellon, as trustee (incorporated by reference to Exhibit 2.3 to our Annual Report on Form 20-F (file no. 001-34476) filed with the SEC on April 30, 2014). |
| 2.3 | | First Supplemental Indenture dated as of January 29, 2014, among Santander Brasil and The Bank of New York Mellon, as trustee, paying agent, transfer agent and registrar (incorporated by reference to Exhibit 2.4 to our Annual Report on Form 20-F (file no. 001-34476) filed with the SEC on April 30, 2014). |
| 2.4 | | Second Supplemental Indenture dated as of January 29, 2014, among Santander Brasil and The Bank of New York Mellon, as trustee, paying agent, transfer agent and registrar (incorporated by reference to Exhibit 2.5 to our Annual Report on Form 20-F (file no. 001-34476) filed with the SEC on April 30, 2014). |
| 4.1 | | Option Plan to Purchase Share deposit Certificate of Santander Brasil (incorporated by reference to Attachment I to our Form 6-K/A filed with the SEC on January 6, 2010). |
| 4.2 | | Long-term Incentive Plan – Investment in Deposit Share Certificate (“Units”) of Santander Brasil (incorporated by reference to Exhibit III to our Form 6-K (file no. 001-34476) filed with the SEC on September 27, 2011). |
SIGNATURES
The registrant hereby certifies that it meets all of the requirements for filing on Form 20-F and that it has duly caused and authorized the undersigned to sign this annual report on its behalf.
| | BANCO SANTANDER (Brasil) S.A. | |
| | | |
| | | |
| | By: | /s/ Sergio Agapito Lires Rial | |
| | | Name: Sergio Agapito Lires Rial | |
| | | Title: Chief Executive Officer | |
Date: April 9, 2018

BANCO SANTANDER (BRASIL) S.A.
CONSOLIDATED FINANCIAL STATEMENTS
| INDEX | Page |
| Independent Auditors’ Report | F-1 |
| Independent Auditors’ Report | F-3 |
| Consolidated Statement of Financial Position | F-4 |
| Consolidated Income Statements | F-6 |
| Consolidated Statements of Profit or Loss and Other Comprehensive Income | F-7 |
| Consolidated Statements of Changes in Equity | F-8 |
| Consolidated Statement of Cash Flows | F-9 |
| Notes to the Consolidated Financial Statements | |
| Note | 1 Introduction, basis of presentation of the consolidated financial statements and other information | F-11 |
| Note | 2Accounting policies and method of measurement | F-16 |
| Note | 3 Basis of consolidation | F-32 |
| Note | 4Change in the scope of consolidation | F-35 |
| Note | 5Cash and balances with the Brazilian Central Bank | F-36 |
| Note | 6 Loans and amounts due from credit institutions | F-36 |
| Note | 7 Debt instruments | F-37 |
| Note | 8 Equity instruments | F-38 |
| Note | 9 Derivative financial instruments and Short positions | F-38 |
| Note | 10 Loans and advances to customers | F-46 |
| Note | 11 Non-current assets held for sale | F-50 |
| Note | 12 Investments in associates and joint ventures | F-50 |
| Note | 13 Tangible assets | F-54 |
| Note | 14 Intangible assets - Goodwill | F-56 |
| Note | 15 Intangible assets - Other intangible assets | F-57 |
| Note | 16 Other assets | F-58 |
| Note | 17 Deposits from the Brazilian Central Bank and Deposits from credit institutions | F-58 |
| Note | 18 Customer deposits | F-59 |
| Note | 19 Marketable debt securities | F-59 |
| Note | 20 Subordinated liabilities | F-61 |
| Note | 21 Debt Instruments Eligible to Compose Capital | F-61 |
| Note | 22 Other financial liabilities | F-62 |
| Note | 23 Provisions for pensions and similar obligations | F-62 |
| Note | 24 Provisions for judicial and administrative proceedings, commitments and other provisions | F-68 |
| Note | 25 Tax assets and liabilities | F-73 |
| Note | 26 Other liabilities | F-76 |
| Note | 27 Other Comprehensive Income | F-76 |
| Note | 28 Non-controlling interests | F-78 |
| Note | 29 Shareholders’ equity | F-79 |
| Note | 30 Earnings per share | F-80 |
| Note | 31 Fair value of financial assets and liabilities | F-80 |
| Note | 32Operational Ratios | F-86 |
| Note | 33 Interest and similar income | F-88 |
| Note | 34 Interest expense and similar charges | F-88 |
| Note | 35 Income from equity instruments | F-89 |
| Note | 36 Fee and commission income | F-89 |
| Note | 37 Fee and commission expense | F-90 |
| Note | 38 Gains (losses) on financial assets and liabilities (net) | F-90 |
| Note | 39 Exchange differences (net) | F-90 |
| Note | 40 Other operating expense (net) | F-90 |
| Note | 41 Personnel expenses | F-91 |
| Note | 42 Other administrative expenses | F-95 |
| Note | 43 Gains (losses) on disposal of assets not classified as non-current assets held for sale | F-95 |
| Note | 44 Gains (losses) on disposal and expenses of non-current assets held for sale not classified as discontinued operations | F-95 |
| Note | 45 Other disclosures | F-96 |
| Note | 46 Business segment reporting | F-99 |
| Note | 47 Related party transactions | F-101 |
| Note | 48 Risk management | F-110 |
| APPENDIX I RECONCILIATION OF SHAREHOLDERS’ EQUITY AND NET INCOME - BRGAAP vs IFRS | F-132 |
| APPENDIX II STATEMENTS OF VALUE ADDED | F-135 |

Report of Independent Registered Public Accounting Firm
To the Board of Directors and Stockholders of
Banco Santander (Brasil) S.A.
Opinions on the Financial Statements and Internal Control over Financial Reporting
We have audited the accompanying consolidated statement of financial position of Banco Santander (Brasil) S.A. and its subsidiaries as of December 31, 2017 and 2016, and the related consolidated income statement, statement of profit or loss and other comprehensive income, statement of changes in equity and statement of cash flows for each of the two years in the period then ended, including the related notes (collectively referred to as the “consolidated financial statements”). We also have audited the Company’s internal control over financial reporting as of December 31, 2017, based on criteria established inInternal Control - Integrated Framework (2013) issued by the Committee of Sponsoring Organizations of the Treadway Commission (COSO).
In our opinion, the consolidated financial statements referred to above present fairly, in all material respects, the financial position of the Company as of December 31, 2017 and 2016, and the results of their operations and their cash flows for the years then ended in conformity with International Financial Reporting Standards as issued by the International Accounting Standards Board. Also in our opinion, the Company maintained, in all material respects, effective internal control over financial reporting as of December 31, 2017, based on criteria established inInternal Control - Integrated Framework (2013) issued by the COSO.
Basis for Opinions
The Company's management is responsible for these consolidated financial statements, for maintaining effective internal control over financial reporting, and for its assessment of the effectiveness of internal control over financial reporting, included in accompanying Management´s Annual Report on Internal Control over Financial Reporting. Our responsibility is to express opinions on the Company’s consolidated financial statements and on the Company's internal control over financial reporting based on our audits. We are a public accounting firm registered with the Public Company Accounting Oversight Board (United States) ("PCAOB") and are required to be independent with respect to the Company in accordance with the U.S. federal securities laws and the applicable rules and regulations of the Securities and Exchange Commission and the PCAOB.
We conducted our audits in accordance with the standards of the PCAOB. Those standards require that we plan and perform the audits to obtain reasonable assurance about whether the consolidated financial statements are free of material misstatement, whether due to error or fraud, and whether effective internal control over financial reporting was maintained in all material respects.
Our audits of the consolidated financial statements included performing procedures to assess the risks of material misstatement of the consolidated financial statements, whether due to error or fraud, and performing procedures that respond to those risks. Such procedures included examining, on a test basis, evidence regarding the amounts and disclosures in the consolidated financial statements. Our audits also included evaluating the accounting principles used and significant estimates made by management, as well as evaluating the overall presentation of the consolidated financial statements. Our audit of internal control over financial reporting included obtaining an understanding of internal control over financial reporting, assessing the risk that a material weakness exists, and testing and evaluating the design and operating effectiveness of internal control based on the assessed risk. Our audits also included performing such other procedures as we considered necessary in the circumstances. We believe that our audits provide a reasonable basis for our opinions.
PricewaterhouseCoopers, Av. Francisco Matarazzo 1400, Torre Torino, São Paulo, SP, Brasil 05001-903, Caixa Postal 61005
T: (11) 3674-2000, www.pwc.com/br
Supplemental Information
The reconciliation of shareholders' equity and net income – BRGAAP vs IFRS as of and for the years ended December 31, 2017 and 2016 and the statements of value added for the years ended December 31, 2017 and 2016, included in APPENDIX I and II respectively, have been subjected to audit procedures performed in conjunction with the audit of the Company’s consolidated financial statements. The supplemental information is the responsibility of the Company’s management. Our audit procedures included determining whether the supplemental information reconciles to the consolidated financial statements or the underlying accounting and other records, as applicable, and performing procedures to test the completeness and accuracy of the information presented in the supplemental information. In forming our opinion on the supplemental information, we evaluated whether the supplemental information, including its form and content, is presented in conformity with Brazilian Corporate Law. In our opinion, the reconciliation of shareholders' equity and net income – BRGAAP vs IFRS as of and for the years ended December 31, 2017 and 2016 and the statements of value added for the years ended December 31, 2017 and 2016 are fairly stated, in all material respects, in relation to the consolidated financial statements as a whole.
Definition and Limitations of Internal Control over Financial Reporting
A company’s internal control over financial reporting is a process designed to provide reasonable assurance regarding the reliability of financial reporting and the preparation of financial statements for external purposes in accordance with generally accepted accounting principles. A company’s internal control over financial reporting includes those policies and procedures that (i) pertain to the maintenance of records that, in reasonable detail, accurately and fairly reflect the transactions and dispositions of the assets of the company; (ii) provide reasonable assurance that transactions are recorded as necessary to permit preparation of financial statements in accordance with generally accepted accounting principles, and that receipts and expenditures of the company are being made only in accordance with authorizations of management and directors of the company; and (iii) provide reasonable assurance regarding prevention or timely detection of unauthorized acquisition, use, or disposition of the company’s assets that could have a material effect on the financial statements.
Because of its inherent limitations, internal control over financial reporting may not prevent or detect misstatements. Also, projections of any evaluation of effectiveness to future periods are subject to the risk that controls may become inadequate because of changes in conditions, or that the degree of compliance with the policies or procedures may deteriorate.
/s/PricewaterhouseCoopers Auditores Independentes
São Paulo, Brazil
April 9, 2018
We have served as the Company’s auditor since 2016.
 | Deloitte Touche Tohmatsu |
Dr. Chucri Zaidan Avenue, nº 1.240 |
4th to 12thfloors - Golden Tower |
04711-130 - São Paulo - SP |
Brazil |
Tel: + 55 (11) 5186-1000 |
Fax: + 55 (11) 5181-2911 |
www.deloitte.com.br |
REPORT OF INDEPENDENT REGISTERED PUBLIC ACCOUNTING FIRM
To the Board of Directors and Shareholders of
Banco Santander (Brasil) S.A.
Sao Paulo - SP - Brazil
We have audited the accompanying consolidated balance sheet of Banco Santander (Brasil) S.A. and its subsidiaries (the “Bank”) as of December 31, 2015, and the related consolidated income statement, statements of comprehensive income and changes in total equity, and cash flows statement for the year then ended, all expressed in Brazilian reais. These financial statements are the responsibility of the Bank's management. Our responsibility is to express an opinion on these financial statements based on our audits.
We conducted our audit in accordance with the standards of the Public Company Accounting Oversight Board (United States). Those standards require that we plan and perform the audit to obtain reasonable assurance about whether the financial statements are free of material misstatement. An audit includes examining, on a test basis, evidence supporting the amounts and disclosures in the financial statements. An audit also includes assessing the accounting principles used and significant estimates made by management, as well as evaluating the overall financial statement presentation. We believe that our audits provide a reasonable basis for our opinion.
In our opinion, the consolidated financial statements referred to above present fairly, in all material respects, the financial position of Banco Santander (Brasil) S.A. and its subsidiaries as of December 31, 2015, and the results of their operations and their cash flows for the year then ended, in conformity with International Financial Reporting Standards – IFRS as issued by the International Accounting Standards Board - IASB.
Our audits were conducted for the purpose of forming an opinion on the basic financial statements taken as a whole. The supplementary information included in the Appendix II to the notes under the caption Statement of Value Added is presented for the purpose of additional analysis, whose presentation by publicly-held companies is required by Brazilian Corporate Law, and is not a required part of the basic financial statements in conformity with International Financial Reporting Standards – IFRS as issued by the International Accounting Standards Board – IASB. This supplementary information is the responsibility of the Bank's management. Such information has been subjected to the auditing procedures applied in our audit of the basic financial statements and, in our opinion, is fairly stated, in all material respects, when considered in relation to the basic financial statements taken as a whole.
/s/ Deloitte Touche Tohmatsu Auditores Independentes
DELOITTE TOUCHE TOHMATSU
Auditores Independentes
April 29, 2016
Deloitte refers to one or more of Deloitte Touche Tohmatsu Limited, a UK private company limited by guarantee ("DTTL"), its network of member firms, and their related entities. DTTL and each of its member firms are legally separate and independent entities. DTTL (also referred to as "Deloitte Global") does not provide services to clients. Please see www.deloitte.com/about for a more detailed description of DTTL and its member firms. Deloitte provides audit, consulting, financial advisory, risk management, tax and relates services to public and private clients spanning multiple industries. Deloitte serves four out of five Fortune Global 500® companies through a globally connected network of member firms in more than 150 countries bringing world-class capabilities, insights, and high-quality service to address clients’ most complex business challenges. To learn more about how Deloitte’s approximately 225,000 professionals make an impact that matters, please connect with us on Facebook, LinkedIn or Twitter. © 2018 Deloitte Touche Tohmatsu. All rights reserved. | |
BANCO SANTANDER (BRASIL) S.A.
CONSOLIDATED FINANCIAL STATEMENTS OF FINANCIAL POSITION
(Thousands of Brazilian Reais - R$)
| Assets | Note | 2017 | 2016 | 2015 |
| | | | | |
| Cash and Balances With The Brazilian Central Bank | 5 | 100,866,081 | 110,604,911 | 89,143,353 |
| Financial Assets Held For Trading | | 52,439,576 | 84,873,663 | 50,536,731 |
| Debt instruments | 7 | 34,879,681 | 59,994,946 | 25,193,598 |
| Equity instruments | 8 | 489,770 | 398,461 | 404,973 |
| Trading derivatives | 9.a | 17,070,125 | 24,480,256 | 24,938,160 |
| Other Financial Assets At Fair Value Through Profit Or Loss | | 1,692,057 | 1,711,204 | 2,080,234 |
| Debt instruments | 7 | 1,658,689 | 1,668,749 | 1,506,570 |
| Equity instruments | 8 | 33,368 | 42,455 | 573,664 |
| Available-For-Sale Financial Assets | | 85,823,384 | 57,815,045 | 68,265,606 |
| Debt instruments | 7 | 84,716,747 | 55,829,572 | 67,103,274 |
| Equity instruments | 8 | 1,106,637 | 1,985,473 | 1,162,332 |
| Held to maturity investments | 7 | 10,214,454 | 10,048,761 | 10,097,836 |
| Loans and Receivables | | 322,336,767 | 296,048,506 | 306,268,788 |
| Loans and amounts due from credit institutions | 6 | 32,300,095 | 27,762,473 | 42,422,638 |
| Loans and advances to customers | 10 | 272,420,157 | 252,002,774 | 252,033,449 |
| Debt instruments | 7 | 17,616,515 | 16,283,259 | 11,812,701 |
| Hedging Derivatives | 9.a | 192,763 | 222,717 | 1,312,202 |
| Non-Current Assets Held For Sale | 11 | 1,155,456 | 1,337,885 | 1,237,493 |
| Investments in Associates and Joint Ventures | 12 | 866,564 | 990,077 | 1,060,743 |
| Tax Assets | 25 | 28,825,741 | 28,753,184 | 34,769,848 |
| Current | | 4,047,663 | 4,316,072 | 4,194,344 |
| Deferred | | 24,778,078 | 24,437,112 | 30,575,504 |
| Other Assets | 16 | 4,578,270 | 5,104,012 | 3,802,118 |
| Tangible Assets | 13 | 6,509,883 | 6,646,433 | 7,005,914 |
| Intangible Assets | | 30,202,043 | 30,236,842 | 29,813,662 |
| Goodwill | 14 | 28,364,256 | 28,355,039 | 28,332,719 |
| Other intangible assets | 15 | 1,837,787 | 1,881,803 | 1,480,943 |
| TOTAL ASSETS | | 645,703,039 | 634,393,240 | 605,394,528 |
The accompanying Notes are an integral part of these consolidated financial statements.
BANCO SANTANDER (BRASIL) S.A.
CONSOLIDATED FINANCIAL STATEMENTS OF FINANCIAL POSITION
(Thousands of Brazilian Reais - R$)
| Liabilities and Stockholders’ Equity | Note | 2017 | 2016 | 2015 |
| Financial Liabilities Held For Trading | | 49,322,546 | 51,619,869 | 42,387,768 |
| Trading derivatives | 9.a | 16,514,154 | 19,925,600 | 22,340,137 |
| Short positions | 9.b | 32,808,392 | 31,694,269 | 20,047,631 |
| Financial Liabilities at Amortized Cost | | 478,880,704 | 471,579,467 | 457,281,656 |
| Deposits from Brazilian Central Bank and deposits from credit institutions | 17 | 79,374,685 | 78,634,072 | 69,451,498 |
| Customer deposits | 18 | 276,042,141 | 247,445,177 | 243,042,872 |
| Marketable debt securities | 19 | 70,247,012 | 99,842,955 | 94,658,300 |
| Subordinated debts | 20 | 519,230 | 466,246 | 8,097,304 |
| Debt Instruments Eligible to Compose Capital | 21 | 8,436,901 | 8,311,918 | 9,959,037 |
| Other financial liabilities | 22 | 44,260,735 | 36,879,099 | 32,072,645 |
| Hedging Derivatives | 9.a | 163,332 | 311,015 | 2,376,822 |
| Provisions | | 13,986,916 | 11,776,491 | 11,409,677 |
| Provisions for pensions funds and similar obligations | 23 | 3,923,457 | 2,710,627 | 2,696,653 |
| Provisions for judicial and administrative proceedings, commitments and other provisions | 24 | 10,063,459 | 9,065,864 | 8,713,024 |
| Tax Liabilities | 25 | 8,248,019 | 6,094,740 | 5,253,125 |
| Current | | 5,751,488 | 4,826,703 | 4,436,000 |
| Deferred | | 2,496,531 | 1,268,037 | 817,125 |
| Other Liabilities | 26 | 8,013,921 | 8,199,099 | 6,850,196 |
| Total Liabilities | | 558,615,438 | 549,580,681 | 525,559,244 |
| Stockholders’ Equity | 29 | 87,425,075 | 85,434,855 | 83,531,754 |
| Share capital | | 57,000,000 | 57,000,000 | 57,000,000 |
| Reserves | | 28,966,451 | 27,881,326 | 24,388,967 |
| Treasury shares | | (148,440) | (514,034) | (423,953) |
| Option for Acquisition of Equity Instrument | | (1,017,000) | (1,017,000) | (1,017,000) |
| Profit for the year attributable to the Parent | | 8,924,064 | 7,334,563 | 9,783,740 |
| Less: dividends and remuneration | | (6,300,000) | (5,250,000) | (6,200,000) |
| Other Comprehensive Income | | (774,368) | (1,347,800) | (4,131,532) |
| Stockholders’ Equity Attributable to the Parent | | 86,650,707 | 84,087,055 | 79,400,222 |
| Non - Controlling Interests | 28 | 436,894 | 725,504 | 435,062 |
| Total Stockholders’ Equity | | 87,087,601 | 84,812,559 | 79,835,284 |
| Total Liabilities and Stockholders’ Equity | | 645,703,039 | 634,393,240 | 605,394,528 |
The accompanying Notes are an integral part of these consolidated financial statements.
BANCO SANTANDER (BRASIL) S.A.
CONSOLIDATED INCOME STATEMENTS
(Thousands of Brazilian Reais – R$, except for per share data)
| | Note | 2017 | 2016 | 2015 |
| Interest and similar income | 33 | 71,418,349 | 77,146,077 | 69,870,200 |
| Interest expense and similar charges | 34 | (36,471,860) | (46,559,584) | (38,533,089) |
| Net interest income | | 34,946,489 | 30,586,493 | 31,337,111 |
| Income from equity instruments | 35 | 83,120 | 258,545 | 142,881 |
| Income from companies accounted for by the equity method | 12 | 71,551 | 47,537 | 116,312 |
| Fee and commission income | 36 | 15,815,543 | 13,548,481 | 11,797,191 |
| Fee and commission expense | 37 | (3,093,675) | (2,570,885) | (2,313,682) |
| Gains (losses) on financial assets and liabilities (net) | 38 | 969,090 | 3,016,156 | (20,002,859) |
| Financial assets held for trading | | 1,174,111 | 3,166,399 | (19,936,801) |
| Other financial instruments at fair value through profit or loss | | 30,694 | 82,638 | 46,859 |
| Financial instruments not measured at fair value through profit or loss | | (122,115) | (115,202) | (120,523) |
| Other | | (113,600) | (117,679) | 7,606 |
| Exchange differences (net) | 39 | 605,056 | 4,574,814 | 10,084,420 |
| Other operating expense (net) | 40 | (672,013) | (624,571) | (347,123) |
| Total Income | | 48,725,161 | 48,836,570 | 30,814,251 |
| Administrative expenses | | (16,120,595) | (14,920,410) | (14,515,132) |
| Personnel expenses | 41 | (8,937,278) | (8,377,265) | (7,798,792) |
| Other administrative expenses | 42 | (7,183,317) | (6,543,145) | (6,716,340) |
| Depreciation and amortization | | (1,662,247) | (1,482,639) | (1,490,017) |
| Tangible assets | 13 | (1,190,967) | (1,154,588) | (1,029,706) |
| Intangible assets | 15 | (471,280) | (328,051) | (460,311) |
| Provisions (net) | | (3,309,239) | (2,724,742) | (4,001,294) |
| Impairment losses on financial assets (net) | | (12,338,300) | (13,301,445) | (13,633,989) |
| Loans and receivables | 10.c | (12,338,141) | (13,389,834) | (13,110,319) |
| Other financial instruments not measured at fair value through profit or loss | | (159) | 88,389 | (523,670) |
| Impairment losses on other assets (net) | | (456,711) | (114,321) | (1,220,645) |
| Other intangible assets | 15 | (306,110) | (5,838) | (679,254) |
| Other assets | | (150,601) | (108,483) | (541,391) |
| Gains (losses) on disposal of assets not classified as non-current assets held for sale | 43 | (64,302) | 3,816 | 780,615 |
| Gains (losses) on non-current assets held for sale not classified as discontinued operations | 44 | (260,083) | 87,073 | 50,493 |
| Operating Profit Before Tax | | 14,513,684 | 16,383,902 | (3,215,718) |
| Income taxes | 25 | (5,375,636) | (8,918,984) | 13,049,544 |
| Consolidated Profit for the Year | | 9,138,048 | 7,464,918 | 9,833,826 |
| Profit attributable to the Parent | | 8,924,064 | 7,334,563 | 9,783,740 |
| Profit attributable to non-controlling interests | 28 | 213,984 | 130,355 | 50,086 |
| Earnings Per Share (Brazilian Reais) | 30 | | | |
| Basic earnings per 1,000 shares (Brazilian Reais) | | | | |
| Common shares | | 1,133.43 | 929.93 | 1,236.96 |
| Preferred shares | | 1,246.77 | 1,022.92 | 1,360.66 |
| Diluted earnings per 1,000 shares (Brazilian Reais) | | | | |
| Common shares | | 1,132.44 | 929.03 | 1,235.79 |
| Preferred shares | | 1,245.69 | 1,021.93 | 1,359.36 |
| Net Profit attributable - Basic (Brazilian Reais) | | | | |
| Common shares | | 4,332,026 | 3,560,288 | 4,748,896 |
| Preferred shares | | 4,592,038 | 3,774,275 | 5,034,844 |
| Net Profit attributable - Diluted (Brazilian Reais) | | | | |
| Common shares | | 4,331,955 | 3,560,222 | 4,748,810 |
| Preferred shares | | 4,592,109 | 3,774,341 | 5,034,930 |
| Weighted average shares outstanding (in thousands) - Basic | | | | |
| Common shares | | 3,822,057 | 3,828,555 | 3,839,159 |
| Preferred shares | | 3,683,145 | 3,689,696 | 3,700,299 |
| Weighted average shares outstanding (in thousands) - Diluted | | | | |
| Common shares | | 3,825,313 | 3,832,211 | 3,842,744 |
| Preferred shares | | 3,686,401 | 3,693,352 | 3,703,884 |
The accompanying Notes are an integral part of these consolidated financial statements.
BANCO SANTANDER (BRASIL) S.A.
CONSOLIDATED STATEMENT OF PROFIT OR LOSS AND OTHER COMPREHENSIVE INCOME
(Thousands of Brazilian Reais - R$,)
| | 2017 | 2016 | 2015 |
| Consolidated Profit for the Year | 9,138,048 | 7,464,918 | 9,833,826 |
| Other Comprehensive Income that will be reclassified subsequently to profit or loss when specific conditions are met: | 1,194,335 | 3,725,565 | (3,069,317) |
| Available-for-sale financial assets | 1,147,384 | 3,311,607 | (2,718,709) |
| Valuation adjustments - Gains / (Losses) | 1,789,286 | 5,458,735 | (4,155,414) |
| Amounts transferred to income statement | 30,694 | 82,638 | 46,859 |
| Income taxes | (672,596) | (2,229,766) | 1,389,846 |
| Cash flow hedges | 46,951 | 413,958 | (350,608) |
| Valuation adjustments | 73,238 | 761,423 | (842,073) |
| Amounts transferred to income statement | - | 1,580 | 144,196 |
| Income taxes | (26,287) | (349,045) | 347,269 |
| Net investment hedge | - | 634,207 | (791,228) |
| Net investment hedge | - | 1,209,338 | (1,460,720) |
| Income taxes | - | (575,131) | 669,492 |
| Translation adjustments investment abroad | - | (634,207) | 791,228 |
| Exchange on investments Abroad | - | (634,207) | 791,228 |
| Other Comprehensive Income that will not be Reclassified to net Income: | (620,903) | (941,833) | 739,706 |
| Defined benefits plan | (620,903) | (941,833) | 739,706 |
| Defined benefits plan | (992,156) | (1,568,122) | 1,186,862 |
| Income taxes | 371,253 | 626,289 | (447,156) |
| Total Comprehensive Income | 9,711,480 | 10,248,650 | 7,504,215 |
| Attributable to the parent | 9,497,496 | 10,118,295 | 7,454,129 |
| Attributable to non-controlling interests | 213,984 | 130,355 | 50,086 |
| Total Comprehensive Income | 9,711,480 | 10,248,650 | 7,504,215 |
The accompanying Notes are an integral part of these consolidated financial statements.
BANCO SANTANDER (BRASIL) S.A.
CONSOLIDATED STATEMENT OF CHANGES IN EQUITY
(Thousands of Brazilian Reais - R$,)
| | | Stockholders´ Equity Attributable to the Parent | | |
| | | | | | | | | | Other Comprehensive Income | | |
| | Note | Share Capital | Reserves | Treasury Shares | Option for Acquisition of Equity Instrument | Profit
Attributed
to the
Parent | Dividends and Remuneration | Total Stockholders’ Equity | Available-
for-sale Financial
Assets | Defined Benefits plan | Translation adjustments investment abroad | Gains and losses - Cash flow hedge and investment | Total | Non-controlling interests | Total Stockholders’ Equity |
| Balances at December 31, 2014 | | 56,806,384 | 20,594,135 | (445,501) | (950,000) | 5,630,023 | (1,530,000) | 80,105,041 | 73,292 | (1,881,350) | 702,349 | (696,212) | 78,303,120 | 380,173 | 78,683,293 |
| Total comprehensive income | | - | - | - | - | 9,783,740 | - | 9,783,740 | (2,718,709) | 739,706 | 791,228 | (1,141,836) | 7,454,129 | 50,086 | 7,504,215 |
| Appropriation of net profit for the year | | - | 5,630,023 | - | - | (5,630,023) | - | - | - | - | - | - | - | - | - |
| Dividends and interest on capital | 29.b | - | (1,530,000) | - | - | - | (4,670,000) | (6,200,000) | - | - | - | - | (6,200,000) | - | (6,200,000) |
| Share based compensation | 41.b | - | 160,916 | - | - | - | - | 160,916 | - | - | - | - | 160,916 | - | 160,916 |
| Treasury shares | 29.d | - | - | (246,975) | - | - | - | (246,975) | - | - | - | - | (246,975) | - | (246,975) |
| Capital restructuring | | - | - | (50) | - | - | - | (50) | - | - | - | - | (50) | - | (50) |
| Results of treasury shares | 29.d | - | (3,918) | - | - | - | - | (3,918) | - | - | - | - | (3,918) | - | (3,918) |
| Option for Acquisition of Equity Instrument | | - | - | - | (67,000) | - | - | (67,000) | - | - | - | - | (67,000) | (240,000) | (307,000) |
| Cancellation of Shares | | - | (268,573) | 268,573 | - | - | - | - | - | - | - | - | - | - | - |
| Other | 29.a | 193,616 | (193,616) | - | - | - | - | - | - | - | - | - | - | 244,803 | 244,803 |
| Balance at December 31, 2015 | | 57,000,000 | 24,388,967 | (423,953) | (1,017,000) | 9,783,740 | (6,200,000) | 83,531,754 | (2,645,417) | (1,141,644) | 1,493,577 | (1,838,048) | 79,400,222 | 436,062 | 79,835,284 |
| Total comprehensive income | | - | - | - | - | 7,334,563 | - | 7,334,563 | 3,311,607 | (941,833) | (634,207) | 1,048,165 | 10,118,295 | 130,355 | 10,248,650 |
| Appropriation of net profit for the year | | - | 9,783,740 | - | - | (9,783,740) | - | - | - | - | - | - | - | - | - |
| Dividends and interest on capital | 29.b | - | (6,200,000) | - | - | - | 950,000 | (5,250,000) | - | - | - | - | (5,250,000) | - | (5,250,000) |
| Share based compensation | 41.b | | (35,463) | - | - | - | - | (35,463) | - | - | - | - | (35,463) | - | (35,463) |
| Treasury shares | 29.d | - | - | (90,031) | - | - | - | (90,031) | - | - | - | - | (90,031) | - | (90,031) |
| Capital restructuring | | - | - | (50) | - | - | - | (50) | - | - | - | - | (50) | - | (50) |
| Treasury shares income | 29.d | - | (11,574) | - | - | - | - | (11,574) | - | - | - | - | (11,574) | - | (11,574) |
| Other | | - | (44,344) | - | - | - | - | (44,344) | - | - | - | - | (44,344) | 160,087 | 115,743 |
| Balance at December 31, 2016 | | 57,000,000 | 27,881,326 | (514,034) | (1,017,000) | 7,334,563 | (5,250,000) | 85,434,855 | 666,190 | (2,083,477) | 859,370 | (789,883) | 84,087,055 | 725,504 | 84,812,559 |
| Total comprehensive income | | - | - | - | - | 8,924,064 | - | 8,924,064 | 1,147,384 | (620,903) | - | 46,951 | 9,497,496 | 213,984 | 9,711,480 |
| Appropriation of net profit for the year | | - | 7,334,563 | - | - | (7,334,563) | - | - | - | - | - | - | - | - | - |
| Dividends and interest on capital | 29.b | - | (5,250,000) | - | - | - | (1,050,000) | (6,300,000) | | - | - | - | (6,300,000) | - | (6,300,000) |
| Share based compensation | | - | 37,161 | - | - | - | - | 37,161 | - | - | - | - | 37,161 | - | 37,161 |
| Treasury shares | 29.d | - | (744,419) | 365,643 | - | - | - | (378,776) | - | - | - | - | (378,776) | - | (378,776) |
| Capital restructuring | 29.d | - | - | (49) | - | - | - | (49) | - | - | - | - | (49) | - | (49) |
| Treasury shares income | 29.d | - | (2,498) | - | - | - | - | (2,498) | - | - | - | - | (2,498) | - | (2,498) |
| Other | | - | (289,682) | - | - | - | - | (289,682) | - | - | - | - | (289,682) | (502,594) | (792,276) |
| Balance at December 31, 2017 | | 57,000,000 | 28,966,451 | (148,440) | (1,017,000) | 8,924,064 | (6,300,000) | 87,425,075 | 1,813,574 | (2,704,380) | 859,370 | (742,932) | 86,650,707 | 436,894 | 87,087,601 |
The accompanying Notes are an integral part of these consolidated financial statements.
BANCO SANTANDER (BRASIL) S.A.
CONSOLIDATED STATEMENT OF CASH FLOWS
(Thousands of Brazilian Reais - R$,)
| | Note | 2017 | 2016 | 2015 |
| 1. Cash Flows From Operating Activities | | | | |
| Consolidated profit for the year | | 9,138,048 | 7,464,918 | 9,833,826 |
| Adjustments to profit | | 17,015,113 | 20,143,702 | (8,904,694) |
| Depreciation of tangible assets | 13 | 1,190,967 | 1,154,588 | 1,029,706 |
| Amortization of intangible assets | 15 | 471,280 | 328,051 | 460,311 |
| Impairment losses on other assets (net) | | 456,711 | 114,321 | 1,220,645 |
| Provisions and Impairment losses on financial assets (net) | | 15,647,539 | 16,026,187 | 17,635,283 |
| Net Gains (losses) on disposal of tangible assets, investments and non-current assets held for sale | 43&44 | 324,385 | (90,889) | (831,108) |
| Share of results of entities accounted for using the equity method | 12 | (71,551) | (47,537) | (116,312) |
| Changes in deferred tax assets and liabilities | 25.d | (406,395) | 5,343,885 | (9,417,913) |
| Monetary Adjustment of Escrow Deposits | | (637,124) | (749,040) | (650,314) |
| Recoverable Taxes | | (210,834) | (215,228) | (985,776) |
| Effects of Changes in Foreign Exchange Rates on Cash and Cash Equivalents | | - | 2,289,849 | (2,106,652) |
| Effects of Changes in Foreign Exchange Rates on Assets and Liabilities | | 33,691 | (3,924,662) | (7,349,318) |
| Others(1) | | 216,444 | (85,823) | (7,793,246) |
| Net (increase) decrease in operating assets | | (16,745,263) | (59,866,978) | (65,884,338) |
| Balance with the Brazilian Central Bank | | 10,535,759 | (24,156,755) | (35,884,381) |
| Financial assets held for trading | | 32,410,414 | (33,996,130) | 5,997,510 |
| Other financial assets at fair value through profit or loss | | 18,988 | 457,419 | (1,607,210) |
| Available-for-sale financial assets | | (27,214,188) | 9,976,210 | (16,217,109) |
| Loans and receivables | | (35,295,311) | (5,473,968) | (34,360,873) |
| Held to maturity investments | | (26,266) | (449,792) | 2,563,141 |
| Other assets | | 2,825,341 | (6,223,962) | 13,624,584 |
| Net increase (decrease) in operating liabilities | | 44,163,382 | 43,247,080 | 70,151,518 |
| Financial liabilities held for trading | | (2,297,323) | 9,232,101 | 22,817,977 |
| Financial liabilities at amortized cost | | 43,702,283 | 32,696,894 | 46,967,102 |
| Other liabilities | | 2,758,422 | 1,318,085 | 366,439 |
| Paid taxes | 25.a | (3,280,230) | (4,240,115) | (1,170,020) |
| Total net cash flows from operating activities (1) | | 50,291,050 | 6,748,607 | 4,026,292 |
| 2. Cash Flows From Investing Activities | | | | |
| Investments | | (2,197,918) | (1,945,372) | (2,135,943) |
| Capital increase in Investments in associates and Joint Ventures | 12 | (34,154) | (3,105) | - |
| Acquisition of subsidiary, less net cash in the acquisition | | (275,091) | (392,998) | 59 |
| Tangible assets | 13.a | (1,106,406) | (873,140) | (1,070,288) |
| Intangible assets | | (738,554) | (670,576) | (710,176) |
| Non - current assets held for sale | 11 | (43,713) | (10,462) | (355,538) |
| Change in the scope of consolidation | 4 | - | 4,909 | - |
| Disposal | | 744,913 | 677,088 | 1,375,108 |
| Net cash received from disposal of subsidiaries | | - | - | 857,830 |
| Capital reduction of investee in joint control | 12.b | - | 76,860 | - |
| Tangible assets | 13&43 | 37,467 | 42,226 | 55,220 |
| Non - current assets held for sale | 11 | 434,553 | 208,232 | 317,321 |
| Dividends and interest on capital received | | 272,893 | 349,770 | 144,737 |
| Total net cash flows from investing activities (2) | | (1,453,005) | (1,268,284) | (760,835) |
| 3. Cash Flows From Financing Activities | | | | |
| Own shares Acquisition | 29.d | (378,776) | (90,031) | (247,025) |
| Issuance of other long-term financial liabilities | 19 | 59,663,420 | 50,313,469 | 72,936,057 |
| Dividends paid and interest on capital | | (5,652,081) | (3,210,762) | (3,992,956) |
| Payments of subordinated liabilities | 20 | - | (8,362,652) | (216,075) |
| Payments of other long-term financial liabilities | 19 | (97,009,957) | (56,164,769) | (63,516,234) |
| Payment of Debt Instruments Eligible to Compose Capital | 21 | (623,146) | (701,671) | (609,035) |
| Increase/ Decrease in non-controlling interests | 28 | (296,184) | 23,909 | 4,803 |
| Total net cash flows from financing activities (3) | | (44,296,724) | (18,192,507) | 4,359,535 |
| Exchange variation on Cash and Cash Equivalents (4) | | - | (2,289,849) | 2,106,652 |
| Net Increase in Cash (1+2+3+4) | | 4,541,321 | (15,002,033) | 9,731,644 |
| Cash and cash equivalents at beginning of year | | 18,129,581 | 33,131,614 | 23,399,970 |
| Cash and cash equivalents at end of year | | 22,670,902 | 18,129,581 | 33,131,614 |
| Cash and cash equivalents components | | | | |
| Cash | 5 | 5,242,869 | 4,445,940 | 7,141,137 |
| Loans and other | 6 | 17,428,033 | 13,683,641 | 25,990,477 |
| Total of cash and cash equivalents | | 22,670,902 | 18,129,581 | 33,131,614 |
| Non-cash transactions | | | | |
| Foreclosures loans and other assets transferred to non-current assets held for sale | 11 | 524,497 | 834,903 | 293,440 |
| Dividends and interest on capital declared but not paid | 29.b | 4,455,000 | 4,750,000 | 3,000,000 |
| Supplemental information | | | | |
| Interest received | | 73,094,248 | 75,818,511 | 70,566,274 |
| Interest paid | | 37,948,828 | 46,051,070 | 37,912,698 |
(1) 2015 includes mainly the effect noted in footnote 25.a.
The accompanying Notes are an integral part of these consolidated financial statements.
BANCO SANTANDER (BRASIL) S.A.
NOTES TO THE CONSOLIDATED FINANCIAL STATEMENTS
(Thousands of Brazilian Reais - R$, unless otherwise stated))
1. Introduction, basis of presentation of the consolidated financial statements and other information
a) Introduction
Banco Santander (Brasil) S.A. (Banco Santander or Bank), directly and indirectly controlled by Banco Santander, S.A., based in Spain (Banco Santander Spain), is the lead institution of the Financial and Prudential Group (Conglomerate Santander) under the authority of the Central Bank of Brazil (Bacen), established as a corporation, with headquarters at Avenida Presidente Juscelino Kubitschek, 2041 and 2235 - A Block - Vila Olímpia - São Paulo - SP. Banco Santander operates as a multiple service bank, conducting its operations by means of portfolios such as commercial, investment, loans and advances, mortgage loans, leasing, credit card operations and foreign exchange. Through its subsidiaries, the Bank also operates in the payment institution, leasing, shares club management, securities and insurance brokerage operations, capitalization and pension plan. The Bank’s activities are conducted within the context of a group of institutions that operate on an integrated basis in the financial market. The corresponding benefits and costs of providing services are absorbed between them, they are conducted in the normal course of business and under commutative conditions.
The consolidated financial statements for the year ended on December 31, 2017, were authorized to be issued by the Board of directors at the meeting held on February 15, 2018.
b) Basis of presentation of the consolidated financial statements
These consolidated financial statements were prepared in accordance with International Financial Reporting Standards (IFRS) issued by the International Accounting Standards Board (IASB), and the interpretations issued by the IFRS Interpretations Committee (Current name of International Financial Reporting Interpretations Committee - IFRIC). All the relevant information specific to Banco Santander’s financial statements, and only these, are being evidenced, and correspond to those used by Banco Santander in its management.
c) Other information
c.1) Adoption of new standards and interpretations
The Bank adopt the rules and interpretations that came into force since January 1, 2017. The following rules and interpretations are applicable to the Bank and did not have relevant effect over the financial statement:
• Annual Improvements of IFRS
2015-2017 cycle (Public Consultation) - Subjects under discussion related to: IAS 12 - Income Taxes, IAS 23 - Borrowing Costs and IFRS 9 - Financial Instruments and IAS 28 - Investments in Associates and Joint Ventures.
IAS 12 - Income Taxes - The subject under discussion is related to the presentation of income tax consequences of payments on, and issuing costs of, financial instruments that are classified as equity, i.e. whether an entity recognizes the relevant income tax consequences directly in equity or in profit or loss.
IAS 23 - Borrowing Costs - Clarify whether an entity transfers specific borrowings to the general borrowings pool once the construction of a qualifying asset is complete.
Standards and Interpretations that became effective after December 31, 2017
At the date of preparation of these consolidated financial statements, the following standards and interpretations which effectively came into force after December 31, 2017 had not yet been adopted by the Bank:
IFRS 9 - Financial Instruments, issued in July 2014 by the International Accounting Standards Board (IASB) in order to replace IAS39 – Financial instruments, establishing the requirements for the recognition and measurement of financial instruments to be applied as from January 2018. The update establishes changes to the IFRS 9 - Financial Instruments: Disclosure, requiring additional disclosure due to such changes.
1. Model proposed by IFRS 9
The main aspects of the new standard are as follows:
1.a) Classification of financial instruments
The criteria for the financial assets classification will depend both on the business management model and the features of the contractual cash flows, aiming to identify specifically if these meet the SPPI criteria. Based on the aforementioned, the financial asset will be classified into: i) amortized cost, ii) fair value with changes in income statement, or iii) fair value with changes in equity. IFRS 9 also establishes other option of designating an instrument in fair value with changes in income statement under certain conditions.
BANCO SANTANDER (BRASIL) S.A.
NOTES TO THE CONSOLIDATED FINANCIAL STATEMENTS
(Thousands of Brazilian Reais - R$ - unless otherwise stated)
The main activity of Banco Santander is the concession of retail banking operations and does not concentrate its exposure on complex financial products. The Bank has made an analysis of its portfolios in order to identify and classify the financial instruments into their corresponding portfolio under IFRS 9 and identify existing business models.
Based on the performed analysis, the Bank does not expect significant changes in the composition of the portfolios, due the fact that there will be no significant changes with respect to the classification under pre-existing regulation:
| · | Financial assets classified as Loans and Advances and Held-to-Maturity under IAS 39 are generally intended to be classified as amortized cost. |
| · | Available for sale debt instruments will generally continue to be classified into fair value with changes in other comprehensive income, unless cash flows features imply its classification into other portfolio. |
| · | Available for sale equity instruments will be classified as fair value and, depending on the nature of the investment, their variations will be recorded in the income statement or in other comprehensive income (irrevocably). |
| · | Financial instruments currently classified as fair value through profit and loss will generally continue to be classified in this category. |
With regard to financial liabilities, the classification remains essentially unchanged relative to the current standard.
Based on the adopted models, the Bank estimated a non material impact in its equity arising from the IFRS 9 adoption, related to the application of the new financial assets classification requirements. This amount will be booked when the standard becomes fully applied, on January 1, 2018, registering the counterparties in each financial asset heading.
1.b) Credit risk impairment model
The IFRS 9 introduces a new impairment model to be applied to financial assets which requires the expected credit loss (ECL) recognition instead of incurred loss, according to the current rule.
Under the current standard, the incurred losses are calculated based on reasonable and substantiated information about past events and current conditions. According to the IFRS 9 the expectation of future events and economic conditions must also be considered.
The Bank does not recognize interest from the moment Management understands that the recognition of this revenue is not probable, due to the significant uncertainty of future receipt. Banco Santander estimated that this unrecognized balance is not significant.
Scope of application
The IFRS 9 financial assets impairment model has the application scope bigger than the incurred loss model, currently used, being applied on the Financial Assets classified into "amortized cost" and on the debt instruments classified into "fair value through OCI" as well as the consideration of lease, risks and contingent commitments.
Classification of financial instruments by phases
The financial instruments portfolio for impairment purposes will be divided into three categories, based on the phase of each instrument with regard to its credit risk:
- Stage 1: a financial instrument is in phase 1 when there has been no significant increase in its risk since it was initially registered. The impairment over the financial instrument represents the expected loss resulting from possible defaults within the period of 12 months following the reporting date.
- Stage 2: if there has been a significant increase in risk since the date in which the instrument was initially registered, but the impairment has not actually materialized, then the financial instrument will be included in this stage. In this case, the provision for expected loss reflects the estimated loss throughout the residual lifetime of the financial instrument. In order to assess the significant increase in credit risk, shall be used quantitative indicators used in the ordinary credit risk management and other qualitative variables such as the indication that the operation is not impaired if it is considered refinanced or if the operation is included as special agreement.
- Stage 3: a financial instrument is included in this phase when it is considered to be effectively impaired. In this case, the provision for losses will be he expected credit risk losses throughout the residual lifetime of the financial instrument.
Impairment estimation methodology
Expected loss is measured using the following factors:
- Exposure at Default (EAD): is the amount of the transaction exposed to credit risk including the ratio of current outstanding balance exposure that could be provided at default. Developed models incorporate assumptions over the modifications in the payment schedule.
BANCO SANTANDER (BRASIL) S.A.
NOTES TO THE CONSOLIDATED FINANCIAL STATEMENTS
(Thousands of Brazilian Reais - R$ - unless otherwise stated)
- Probability of Default (PD): is the likelihood that a counterparty will fail to meet its obligation to pay principal or interest. For the purposes of IFRS 9, this will consider both PD-12 months, which is the probability of the financial instrument entering default within the next 12 months, and also lifetime PD, which is the probability of the transaction entering into default between the reporting date and the transaction’s residual maturity date. Future information of relevance is considered to be needed to estimate these parameters, according to the standard.
- Loss Given Default (LGD): is the loss produced in the event of default. It reflects the percentage of exposure that could not be recovered in the event of a default. It depends mainly on the collaterals, which are considered as credit risk mitigating factor associated with each credit financial asset, and the future cash flows that are expected to be recovered. According to the standard, forward-looking information must be taken into account in the estimation.
- Discount rate: the rate applied to the future cash flows estimated during the expected life of the asset which its purpose is to equalize the net present value of the financial instrument and the carrying value. When calculating the discount rate, expected losses for default when estimating future cash flows are not generally taken into consideration, except in cases in which the asset is considered to be impaired, in which case the interest rate applied will take into consideration such losses and it will be known as the effective interest rate adjusted for credit risk.
In order to estimate the above parameters, the Bank has applied its experience in developing internal models for parameters calculation both for regulatory and management purposes.
Use of present, past and future information
Apart from using present and past information, the Bank currently uses forward-looking information in internal management and regulatory processes, considering several factors, resulting in three scenarios such as: basis, pessimist and optimist. In this sense, the Bank will re-use its experience in the management of such information and maintain consistency with the information used in the other processes.
Based on the adopted models, the Bank estimated an impact of R$1.5 billion in its equity net of tax effects arising from the IFRS 9 adoption, related to financial assets impairment. This amount will be booked when this rule becomes fully applied, on January 1, 2018, registering the counterparty in the heading "Allowance for Credit Losses" related to the expected losses for financial assets classified at "amortized cost", for debt instruments classified at "fair value with changes in other comprehensive instruments", as well as the lease consideration. For the other risks and contingent commitments the register will be in the heading "provisions".
1.c) Accounting of hedges
IFRS 9 includes new hedge accounting requirements which have a twofold objective: to simplify current requirements and to bring hedge accounting in line with risk management, allowing a greater variety of derivative financial instruments which can be considered to be hedging instruments.
The Bank decided to keep its Hedge Accounting coverage aligned with IAS 39 requirements, considering that IFRS 9 exempts the application of the new Hedge Accounting concepts while IASB has not determined the new accounting treatment and concepts for Macro Hedge yet.
2. IFRS 9 implementation strategy
The Santander Spain Group together with its subsidiaries has established a global work stream with the aim of adapting its processes to the new classification standards for financial instruments, accounting of hedges and estimating credit risk impairment, so that such processes are applicable in a uniform way for all Bank units, and, at the same time, it can be adapted to each unit’s individual features.
Accordingly, the Bank is working towards defining an objective internal model and analyzing all the changes which are needed to adapt accounting classifications and credit risk impairment estimation models in force in each unit to the previous definitions.
At December 31, 2017, the aforementioned requirements must be applied retrospectively adjusting the opening balance of January 1, 2018, and it is not necessary to re-issue the comparative Financial Statements.
The project’s main phases and milestones
The main milestones achieved include:
- the definition and implementation of the functional requirements and the design of an operation model adapted to the IFRS 9 demands;
- the need identification of the technological environment and the necessary adjustments to the existing controls frame.
- The implementation of models and other requirements to the provisions calculation.
BANCO SANTANDER (BRASIL) S.A.
NOTES TO THE CONSOLIDATED FINANCIAL STATEMENTS
(Thousands of Brazilian Reais - R$ - unless otherwise stated)
• IFRS 15 - Revenue from Customers Contracts : The standard was issued in May 2014 and applies to an annual reporting period beginning on January 1, 2018. This standard specifies how and when an entity will recognize revenue as well as requiring such entities to provide users of financial statements with more informative, relevant disclosures. The standard provides five basic principles to be applied to all contracts with customers, which are: i) identify the contract with the customer; ii) identify the implementing obligations under the contract; iii) determine the transaction price; iv) allocate the transaction price to performance obligations; and v) recognize revenue at the moment (or the extent to which) the entity carrying out an obligation of execution.
The IFRS 15’s basic principle consists in the fact that an entity recognizes revenues to describe the transference of products or services rendered to clients using the value that reflects the consideration which the entity expects to receive in return of such products or services rendered. An entity recognizes revenues according to this basic principle through the following steps:
Step 1: To identify the contract(s) with a client – a contract is the agreement between two or more parties which creates feasible rights and obligations. The IFRS 15’s requirements are applied to every contract signed with a client and which is according to specific criteria.
Step 2: To identify the performance obligations in the contract – a contract includes promises of products transfer or services to a client. If these products or services are different, the promises become performance obligations and they are registered separately.
Step 3: To determine the transaction price - the transaction price is the value of the contract´s consideration which an entity expects to receive in return of the products transfer or services rendered to a client.
Step 4: To allocate the transaction price into the performance obligation of the contract – an entity normally allocates the transaction price into each performance obligation based on the individual sales price related to each good or service promised in contract.
Step 5: To recognize the revenue when (or as) the entity meets a performance obligation – an entity recognizes revenues when (or as) it meets an performance obligation due to the good transferred or service rendered to a client. The amount of revenue recognized is the value allocate to the performance obligation met.
After the analysis on the commissions/fees applied by the Banco Santander versus the new IFRS 15 concepts, it was possible to conclude that there will not be significant impact on the revenues current recognized.
• IFRS 16 – Leasing contracts – Issued in January 2016 with the mandatory enforcement date since January 1st, 2019. This rule contains a new approach for the leasing contracts, which requires from the lessee the assets and liabilities recognition based on the rights and obligations created by the contract. That way, first the entity shall evaluate whether the contract is or contain a leasing characteristics. The contract is or contain leasing characteristics, if it transmits the right to control the identified asset use in a defined period in return of a consideration.
"Effective from January-2019, the Banks still in the process of analyzing this new rule, looking carefully the new concept of leasing, specially acting as tenant. Acting as lessee, the Bank does not expect great changes.
• IFRS 17 – In May 2017, IASB issues this rule for insurance contracts which its goal is to replace IFRS 4. The enforcement date of IFRS 17 is on January 1st, 2021. The rule´s purpose is to improve the disclosure on the financial statement being one of the main changes the profit recognition during the time that the insurance services are being rendered, evaluating the insurance company´s performance during time.
The possible impacts due to the changes applied since 2018 are under Bank´s analysis, which shall be concluded until the date of enforcement of the rule.
c.2) Estimates used
The consolidated results and the determination of consolidated equity are influenced by the accounting policies, assumptions, estimates and measurement methods used by the management of the Bank in preparing the consolidated financial statements. The Bank makes estimates and assumptions that affect the reported amounts of assets and liabilities of future periods. All estimates and assumptions required, in conformity with IFRS, are best estimates undertaken in accordance with the applicable standard.
In the consolidated financial statements estimates were made by the management of the Bank and of the consolidated entities in order to quantify certain assets, liabilities, revenues, expenses, and disclosure notes.
c.2.1) Critical estimates
The estimates and critical assumptions that have the most significant impact on the carrying amounts of certain assets, liabilities, revenues and expenses and the disclosure notes, are described below:
BANCO SANTANDER (BRASIL) S.A.
NOTES TO THE CONSOLIDATED FINANCIAL STATEMENTS
(Thousands of Brazilian Reais - R$ - unless otherwise stated)
i. Allowance for loan losses
The carrying amount of impaired financial assets is adjusted by recording a provision for losses on debts of "Impairment Losses on Financial Assets (Net) - Loans and Receivables" in the consolidated income statement. The reversal of previously recorded losses is recognized in the consolidated income statement in the period in which the impairment decrease and it can be related objectively to an event of recovery.
To determine the balance of “Provision for Impairment Losses”, Banco Santander first assesses whether there is objective evidence of impairment loss individually for financial assets that are significant, and individually or collectively for financial assets that are not significant.
To measure the impairment loss on loans individually evaluated for impairment, the Bank considers the conditions of the borrower, such as their economic and financial situation, level of indebtedness, ability to generate income, cash flow, management, corporate governance and quality of internal controls, payment history, industry expertise, contingencies and credit limits, as well as characteristics of assets, such as its nature and purpose, type, sufficiency and liquidity level guarantees and total amount of credit, as well as based on historical experience of impairment and other circumstances known at the moment of evaluation.
To measure the impairment loss on loans collectively evaluated for impairment, the Bank segregates financial assets into groups considering the characteristics and similarity of credit risk, in other words, according to segment, the type of assets, guarantees and other factors associated as the historical experience of impairment and other circumstances known at the time of assessment.
For further details see Note 2.i.
ii. Income taxes (IRPJ), Social Contribution (CSLL), Social Integration Program (PIS) and Tax for Social Security Financing (COFINS)
The current income tax expense is calculated by sum of the Current Tax, Social Contribution, Pis and Cofins resulting from application of the appropriate tax rate to the taxable profit for the year (net of any deductions allowable for tax purposes), and of the changes in deferred tax assets and liabilities recognized in the consolidated income statement.
Deferred tax assets and liabilities include temporary differences, which are identified as the amounts expected to be payable or recoverable on differences between the carrying amounts of assets and liabilities and their related tax bases, and tax loss and tax credit carryforwards. These amounts are measured at the tax rates that are expected to apply in the period when the asset is carried out or the liability is settled. Deferred tax assets are only recognized for temporary differences to the extent that they are considered probable that the consolidated entities will have sufficient future taxable profits against which the deferred tax assets can be utilized, and the deferred tax assets do not arise from the initial recognition (except in a business combination) of other assets and liabilities in a transaction that affects neither taxable profit or accounting profit. Other deferred tax assets (tax loss and tax credit carryforwards) are only recognized if it is considered probable that the consolidated entities will have sufficient future taxable profits against which they can be utilized.
The deferred tax assets and liabilities recognized are reassessed at each financial statement date in order to ascertain whether they still exist, and the appropriate adjustments are made on the basis of the findings of the assessment performed. Under the current regulation, the expected tax credits carrying out is based on the Bank’s projections of future results and based on technical study.
For more details see note 2.aa
iii. Fair value measurement of certain financial instruments
Financial instruments are initially recognized at fair value, which is considered equivalent to the transaction price and those that are not measured at fair value through income statement are adjusted by the transaction costs.
Financial assets and liabilities are subsequently measured at each period-end by using valuation techniques. This calculation is based on assumptions, which take into consideration management’s judgment based on existing information and market conditions at the date of financial statements.
Banco Santander classifies fair value measurements using a fair value hierarchy that reflects the model used in the measurement process, segregating financial instruments between Level I, II or III.
Notes 2.e & 48.c8 present the sensitivity analysis and accounting policies for Financial Instruments, respectively.
iv. Post-employment benefits
The defined benefit plans are recorded based on an actuarial study, conducted annually by specialized company, at the end of each year to be effective for the subsequent period and the effects of such study are recognized in the headings of the income statement "Interest expense and similar Charges" and "Provisions (net)", during the current period.
The present value of the defined benefit obligation is the present value without any assets deductions of expected future payments required to settle the obligation resulting from employee service in the current and past periods.
Notes 2.x & 23.iii present the accounting policies for Post-employment benefits and sensitivity analysis, respectively.
BANCO SANTANDER (BRASIL) S.A.
NOTES TO THE CONSOLIDATED FINANCIAL STATEMENTS
(Thousands of Brazilian Reais - R$ - unless otherwise stated)
v. Provisions, contingent assets and liabilities
Provisions for the lawsuits and administrative proceedings are recorded when their risk of loss are considered probable and the amounts can be reliably measured, based on the nature, complexity and history of lawsuits and the opinion of legal counsel internal and external.
Provisions are fully or partially reversed when the obligations cease to exist or are reduced. Given the uncertainties arising from the proceedings, it is not practicable to determine the timing of any outflow (cash disbursement).
For more details see note 2.r
vi. Goodwill
The goodwill recorded is subject to impairment test at least annually or in a short period, if there is any indication of impairment.
The recoverable goodwill amounts are determined from value in use calculations. For this purpose, it is estimated the cash flow for a period of 5 years. The cash flow was prepared considering several factors, including: (i) macro-economic projections, such as interest rates, inflation and exchange rates, among other, (ii) the performance and growth estimates of the Brazilian financial market, (iii) increased costs, returns, synergies and investment plans, (iv) the behavior of customers, and (v) the growth rate and long-term adjustments to cash flows. These estimates rely on assumptions regarding the likelihood of future events, and changing certain factors could result in different outcomes. The estimate of cash flows is based on valuations prepared by independent research company or whenever there is evidence of impairment, which is reviewed and approved by the Executive Board.
For additional details see note 14.
c.3) Capital management
Capital management considers the regulatory and economic information. The objective is to achieve an efficient capital structure in terms of cost and compliance, meeting the requirements of the regulatory body and contributing to achieve the goals of the classification of rating agencies and investors’ expectations. The capital management includes securitization, assets disposal, raising capital through issue of shares, subordinated debts and hybrid instruments.
From an economic standpoint, capital management seeks to optimize value creation at the Bank and at its different business segment. To this end, the economic capital, RORAC (return on risk-adjusted capital) and value creation data for each business segment are generated, analyzed and reported to the management committee on a quarterly basis. Within the framework of the internal capital adequacy assessment process (Pillar 2 of the Basel Capital Accord), the Group uses an economic capital measurement model with the objective of ensuring that there is sufficient capital available to support all the risks of its activity in different economic scenarios, with the solvency levels agreed upon by the Bank.
In order to adequately manage the Bank’s capital, it is essential to estimate and analyze future needs, in anticipation of the various phases of the business cycle. Projections of regulatory and economic capital are made based on financial projections (statement of financial position, income statement, etc.) and on macroeconomic scenarios estimated by the Economic Research Service. These estimates are used by the Bank as a reference to plan the management actions (issues, securitizations, etc.) required to achieve its capital targets.
2. Accounting policies and method of measurement
The accounting policies and method of measurement applied in preparing the consolidated financial statements were as follows:
a) Foreign currency transactions
The financial statements are presented in Brazilian Reais, the functional and reporting currency of Banco Santander and its subsidiaries, including its subsidiary and non-foreign subsidiary.
The assets and liabilities and foreign subsidiary are converted to Real as follows:
- Assets and liabilities are translated at the exchange rate at the balance sheets date.
- Revenues and expenses are translated at the monthly average exchange rates.
- Gain and losses on translation of net investment are recorded in the statement of comprehensive income, in “exchange rate of investees located abroad”.
BANCO SANTANDER (BRASIL) S.A.
NOTES TO THE CONSOLIDATED FINANCIAL STATEMENTS
(Thousands of Brazilian Reais - R$ - unless otherwise stated)
b) Basis of consolidation
i. Subsidiaries
“Subsidiaries” are defined as entities over which the Bank has control. Control is based on whether the Bank has: i) power over the investee; ii) exposure, or rights, to variable returns from its involvement with the investee; and iii) the ability to use its power over the investee to affect the amount of the returns, as set forth in the law, the Bylaws or agreement.
Consolidation of a subsidiary begins when the Bank obtains control over the subsidiary and ceases when the Bank loses control of the subsidiary. Specifically, income and expense of a subsidiary acquired or disposed during the year are included in the consolidated income statement and other comprehensive income from the date the Bank gains controls until the date when the Bank ceases to control the subsidiary.
Profit or loss and each component of Other Comprehensive Income are attributed to the owners of the Bank and to the non-controlling interests even if the effect is attributed to non-controlling interests. Total comprehensive income of subsidiaries is attributed to the owners of the Bank and to the non-controlling interest even if this generates a negative balance for non-controlling interests. All transactions, balances, income and expenses between the companies of the Santander Group are eliminated in the consolidated financial statements.
Changes in the Santander Group’s interest in a subsidiary that do not result in loss of control are registered as equity transactions. Any difference between the amount by which the non-controlling interests are adjusted and the fair value of the consideration paid or received is recognized directly in equity and attributed to owners of the Company.
When the Bank loses control of a subsidiary, the profit or loss on disposal is calculated as the difference between (i) the aggregate fair value of the consideration received and the fair value of any retained interest and (ii) the previous carrying amount of the assets (including goodwill), and liabilities of the subsidiary and any non-controlling interests. Amounts previously recognized in other comprehensive income in relation to the subsidiary are registered (i.e. reclassified to income statement or transferred directly to retained earnings) in the same manner as it would be required if the relevant assets or liabilities are disposed of. The fair value of any investment retained in the former subsidiary at the date when control got lost is considered as the fair value on initial recognition for subsequent accounting under IAS 39 Financial Instruments: Recognition and Measurement or, when applicable, the costs on initial recognition of an investment in an associate or jointly controlled entity.
ii. Interests in joint ventures (jointly controlled entities) and associates
Joint ventures mean interests in entities that are not subsidiaries but which are jointly controlled by two or more unrelated entities. This is evidenced by contractual arrangements whereby two or more entities (“ventures”) acquire interests in entities (jointly controlled entities) so that strategic financial and operating decisions affecting the joint venture require the unanimous consent of the ventures.
Associates are entities over which the Bank is in a position to exercise significant influence (significant influence is the power to participate in the financial and operating decisions of the investee) but it does not control or has joint control over the investee.
In the consolidated financial statements, interest in joint ventures and investments in associates are registered using the equity method, i.e. at the Bank’s share of net assets of the investee, after taking into consideration the dividends received from capital reductions and other related transactions. Relevant information regarding companies registered under the equity method by the Bank is provided in note 12.
iii. Business combinations, acquisitions and disposals
A business combination is the combination of two or more separate entities or economic units into one single entity or group of entities and is registered in accordance with IFRS 3 - “Business Combinations”.
Business combinations are carried out so that the Bank obtains control over an entity and are recognized for accounting purposes as follow:
• The Bank measures the cost of the business combination, defined as the fair value of the assets offered, the liabilities incurred and the equity instruments issued, if any.
• The fair values of the assets, liabilities and contingent liabilities of the acquired entity or business, including any intangible assets which might not have been recognized by the acquiree, are estimated at the acquisition date and recognized in the consolidated financial statement.
• The excess of the acquisition cost over the fair value of the identifiable net assets acquired are recognized as goodwill (note 14). The excess of fair value of the identifiable net assets over the acquisition cost is an advantageous purchase gain and it is recorded as income on the date of the acquisition.
The notes 3 and 4 includes a description of the most significant transaction carried out in 2017, 2016 and 2015.
BANCO SANTANDER (BRASIL) S.A.
NOTES TO THE CONSOLIDATED FINANCIAL STATEMENTS
(Thousands of Brazilian Reais - R$ - unless otherwise stated)
iv. Investment Funds
These include investment funds in which the Santander Group companies hold a substantial interest or the entirety of the interests and are therefore exposed to, or have rights, to variable returns and have the ability to affect those returns through power over the fund, in accordance with IFRS 10 - Consolidated Financial Statements and are therefore, consolidated in these financial statements.
c) Definitions and classification of financial instruments
i. Definitions
“Financial instrument” is any contract that gives rise to a financial asset of one entity and, simultaneously, to a financial liability or financial interest of another entity.
“Equity instrument” is any agreement that evidences a residual interest in the asset of the issuing entity after deducting all of its liabilities.
“Financial derivative” is a financial instrument whose value changes in response to the change in an observable market variable (such as an interest rate, foreign exchange rate, financial instrument price, market index or credit rating), whose initial investment is zero or very small compared with other financial instruments with a similar response to changes in market factors, and which is settled at a future date.
“Hybrid financial instruments” are contracts that simultaneously include a non-derivative host contract together with a derivative, known as an embedded derivative, that is not separately transferable and has the effect to make part of the cash flow of the hybrid contract vary similar to a stand-alone derivative.
The following transactions are not treated for accounting purposes as financial instruments:
• Investments in subsidiaries, jointly controlled entities and associates (note 3&12).
• Rights and obligations under employee benefit plans (note 23).
ii. Classification of financial assets for measurement purposes
Financial assets are initially classified into the various categories used for management and measurement purposes, unless they have to be presented as Non-current assets held for sale or they relate to Cash, cash balances at Central Banks and other deposits on demand, Changes in the fair value of hedged items in portfolio hedges of interest rate risk (asset side), Hedging derivatives and Investments, which are reported separately.
Financial assets are included for measurement purposes in one of the following categories:
• Financial assets held for trading (at fair value through profit or loss): this category includes the financial assets acquired for the purpose of generating a profit in the near term from fluctuations in their prices and financial derivatives that are not designated as hedging instruments.
• Other financial assets at fair value through profit or loss: this category includes hybrid financial assets not held for trading that are measured entirely at fair value and financial assets not held for trading that are included in this category in order to provide more relevant information, either because this eliminates or significantly reduces recognition or measurement inconsistencies (accounting mismatches) that would otherwise arise from measuring assets or liabilities or recognizing the gains or losses on them on different bases, or because a group of financial assets or financial assets and liabilities is managed and its performance is evaluated on a fair value basis, in accordance with a documented risk management or investment strategy, and information about the group is provided on that basis to the Group’s key management personnel.
Financial instruments included in this category (and “Other financial liabilities at fair value through profit or loss”) are permanently subject to a consistent system of measurement, manage and control of all risks and returns that enables all the financial instruments involved to be identified and monitored and allows the effective reduction of risk checked. Financial assets may only be included in this category on the date they are acquired or originated.
Available-for-sale financial assets are stated at fair value. This category includes debt instruments not classified as “Held-to-maturity investments”, “Loans and receivables” or “Financial assets at fair value through profit or loss”, and equity instruments issued by entities other than subsidiaries, associates and jointly controlled entities, provided that such instruments have not been classified as “Financial assets held for trading” or as “Other financial assets at fair value through profit or loss”. Gains and losses arising from changes in fair value are recognized in "Equity" in the line item "Valuation Adjustment" with the exception of cumulative losses for non-recovery, which are recognized in profit or loss. When the investment is disposed of or is determined to be impaired, the cumulative gain or loss previously accumulated in "Equity - Valuation Adjustments" is reclassified to profit or loss.
• Loans and receivables: this category includes financing granted to third parties, based on their nature, irrespective of the type of borrower and the form of financing, including finance lease transactions in which the consolidated entities act as lessors. The consolidated entities generally intend to hold the loans and credits granted by them until their final maturity and, therefore, they are presented in the consolidated balance sheets at their amortized cost (which includes the required adjustments to reflect estimated impairment losses).
BANCO SANTANDER (BRASIL) S.A.
NOTES TO THE CONSOLIDATED FINANCIAL STATEMENTS
(Thousands of Brazilian Reais - R$ - unless otherwise stated)
• Held-to-maturity investments: this category includes debt instruments traded in an active market, with fixed maturity and with fixed or determinable payments, for which the Bank has both the intention and proven ability to hold to maturity. These investments are measured at amortized cost less any impairment, with revenue recognized on an effective yield basis.
iii. Classification of financial assets for presentation purposes
Financial assets are classified by nature into the following headings in the consolidated financial statements:
• Cash and balances with the Bacen: cash balances and balances receivable on demand relating to deposits with Bacen and credit institutions.
• Loans and receivables: includes the debit balances of all credit and loans granted by the Bank, other than those represented by securities, as well as finance lease receivables and other debit balances of a financial nature in favor of the Bank, such as checks drawn on credit institutions, balances receivable from clearing houses and settlement agencies for transactions on the stock exchange and organized markets, bonds given in cash, capital calls, fees and commissions receivable for financial guarantees and debit balances arising from transactions not originating in banking transactions and services, such as the collection of rentals and similar items.
• Loans and other amounts with credit institutions: credit of any nature in the name of financial institutions.
• Loans and advances to clients: includes debit balances of all the remaining credit and loans granted by the Bank, including money market operations through centralized counterparties.
• Debt instruments: bonds and other securities that represent a debt for their issuer, that generate an interest return, and that are in the form of certificates or book entries.
• Equity instruments: Financial instruments issued by other entities, such as shares, which have the nature of equity instruments for the issuer, other than investments in subsidiaries, joint ventures or associates. Investment fund units are included in this item.
• Trading derivatives: includes the fair value in favor of the Bank of derivatives which do not form part of hedge accounting.
• Hedging derivatives: includes the fair value in favor of the Bank of derivatives designated as hedging instruments in hedge accounting.
• Investments in associates and jointly controlled companies: includes the investments made in the share capital of associates and jointly controlled companies.
iv. Classification of financial liabilities for measurement purposes
Financial liabilities are classified for measurement purposes into one of the following categories:
• Financial liabilities held for trading (at fair value through profit or loss): this category includes financial liabilities incurred for the purpose of generating a profit in the near term from fluctuations in their prices, financial derivatives not designated as hedging instruments, and financial liabilities arising from the outright sale of financial assets acquired under reverse repurchase agreements ("reverse repos") or borrowed (short positions).
• Other financial liabilities at fair value through profit or loss: financial liabilities are included in this category when they provide more relevant information, either because this eliminates or significantly reduces recognition or measurement inconsistencies (accounting mismatches) that would otherwise arise from measuring assets or liabilities or recognizing the gains or losses on them on different bases, or because a group of financial liabilities or financial assets and liabilities is managed and its performance is evaluated on a fair value basis, in accordance with a documented risk management or investment strategy, and information about the group is provided on that basis to the Group’s key management personnel.
• Financial liabilities at amortized cost: financial liabilities, irrespective of their instrumentation and maturity, not included in any of the above-mentioned categories which arise from the ordinary borrowing activities carried on by financial institutions.
v. Classification of financial liabilities for presentation purposes
Financial liabilities are classified by nature into the following items in the consolidated financial statements:
• Deposits from Bacen: deposits of any nature received from Bacen.
• Deposits from credit institutions: deposits of any nature, including credit received and money market operations in the name of credit institutions.
• Client deposits: includes deposits of any nature such as demand deposits, saving deposits and time deposits including money market operation received from client.
BANCO SANTANDER (BRASIL) S.A.
NOTES TO THE CONSOLIDATED FINANCIAL STATEMENTS
(Thousands of Brazilian Reais - R$ - unless otherwise stated)
• Marketable debt securities: includes the amount of bonds and other debt represented by marketable securities, other than subordinated liabilities.
• Trading derivatives: includes the fair value, with a negative balance for the Bank, of derivatives which do not form part of hedge accounting.
• Short positions: includes the amount of financial liabilities arising from the outright sale of financial assets purchased under reverse repurchase agreements or borrowed.
• Subordinated liabilities: amount of financing received which, for the purposes of payment priority, ranks behind ordinary debt. This category also includes the financial instruments issued by the Bank which, although equity for legal purposes, do not meet the requirements for classification as equity.
• Other financial liabilities: includes the amount of payment obligations having the nature of financial liabilities not included in other items, and liabilities under financial guarantee contracts, unless they have been classified as non-performing.
• Hedging derivatives: includes the fair value of the Bank’s liability in respect of derivatives, including embedded derivatives separated from hybrid financial instruments, designated as hedging instruments in hedge accounting.
d) Funding, debt notes issued and other liabilities
Funding debt rates and other liabilities Instruments are recognized initially at fair value, considered primarily as the transaction price. They are subsequently measured at amortized cost and its expenses are recognized as a financial cost.
Among the liabilities initial recognition methods, it is important to emphasize those compound financial instruments which are classified as such due to the fact that the instruments contain both, a debt instrument (liability) and an embedded equity component (derivative).
The recognition of a compound instrument consists of a combination of (i) a main instrument, which is recognized as an entity’s genuine liability (debt) and (ii) an equity component (derivative convertible into ordinary share).
The issue of "Notes" must be registered in specific heading liabilities and updated according to the agreed rates and adjusted by the effect of exchange rate variations, when denominated in foreign currency. All remuneration related to these instruments, such as interest and Exchange variation (difference between the functional currency and the currency in which the instrument was named) shall be registered as expenses for the period, according to the accrual basis.
The relevant details of these issued instruments are described in note 21.
e) Measurement of financial assets and liabilities and recognition of fair value changes
In general, financial assets and liabilities are initially recognized at fair value which, in the absence of evidence to the contrary, is deemed to be the transaction price. Financial instruments not measured at fair value through profit or loss, are adjusted by the transaction costs. Financial assets and liabilities are subsequently measured at each period-end as follows:
i. Measurement of financial assets
Financial assets are measured at fair value, without deduction of estimated costs of transaction that may be incurred on their disposal, except for loans and receivables, held-to-maturity investments, equity instruments whose fair value cannot be determined in a sufficiently objective manner and financial derivatives that have as equity instruments subject and are settled by delivery of those instruments.
The fair value of a financial instrument on a given date is taken to be the price that would be received to sell an asset or paid to transfer a liability in an orderly transaction between market participants. The most objective and common reference for the fair value of a financial instrument is the price that would be paid for it on an active, transparent and deep market (quoted price or market price).
If there is no market price for a given financial instrument, its fair value is estimated on the basis of valuation techniques commonly used by the international financial community, according to the specific features of the instrument to be measured and, particularly, the various types of risk associated with it.
All derivatives are recognized in the balance sheets at fair value from the trade date. If the fair value is positive, they are recognized as assets and if the fair value is negative, they are recognized as liabilities. The changes in the fair value of derivatives from the trade date are recognized in “Gains (losses) on financial assets and liabilities” in the consolidated income statement. Specifically, the fair value of standard financial derivatives included in the portfolios of financial assets or liabilities held for trading is deemed to be their daily quoted price and if, for exceptional reasons, the quoted price cannot be determined on a given date, these financial derivatives are measured using methods similar to those used to measure over the counter “OTC” derivatives.
BANCO SANTANDER (BRASIL) S.A.
NOTES TO THE CONSOLIDATED FINANCIAL STATEMENTS
(Thousands of Brazilian Reais - R$ - unless otherwise stated)
The fair value of OTC derivatives is taken to be the sum of the future cash flows arising from the instrument, discounted to present value at the date of measurement (“present value” or “theoretical close”) using valuation techniques commonly used by the financial markets: “net present value” (NPV), option pricing models and other methods.
“Loans and receivables” and “Held-to-maturity investments” are measured at amortized cost using the effective interest method. “Amortized cost” is the acquisition cost of a financial asset or liability plus or minus, as appropriate, the principal repayments and the cumulative amortization (taken to the income statement) between the difference of the initial cost and the maturity amount. In the case of financial assets, amortized cost furthermore includes any reductions for impairment or uncollectibility. In the case of loans and receivables hedged in fair value hedges, the changes in the fair value of these assets related to the risk or risks being hedged are recognized.
The “effective interest rate” is the discount rate that exactly matches the initial amount of a financial instrument to all its estimated cash flows of all kinds over its remaining life. For fixed rate financial instruments, the effective interest rate coincides with the contractual interest rate established on the acquisition date plus, where applicable, the fees and transaction costs that, because of their nature, form part of their financial return. In the case of floating rate financial instruments, the effective interest rate coincides with the rate of return prevailing in all connections until the next benchmark interest reset date.
Equity instruments whose fair value cannot be determined in a sufficiently objective manner are measured at acquisition cost adjusted, where appropriate, by any related impairment loss.
The amounts at which the financial assets are recognized represent, in all material respects, the Bank’s maximum exposure to credit risk at each reporting date. Also, the Bank has received collateral and other credit enhancements to mitigate its exposure to credit risk, which consist mainly of mortgage guarantees, cash collateral, equity instruments and personal security, assets leased out under leasing and renting agreements, assets acquired under repurchase agreements and securities loans and derivatives.
ii. Measurement of financial liabilities
In general, financial liabilities are measured at amortized cost, as defined above, except for those included under “Financial liabilities held for trading” and “Other financial liabilities at fair value through profit or loss” and financial liabilities designated as hedge items (or hedging instruments) in fair value hedges, which are measured at fair value.
iii. Recognition of fair value changes
As a general rule, changes in the carrying amount of financial assets and liabilities are recognized in the consolidated income statement, distinguishing between those arising from the accrual of interest and similar items -which are recognized under “Interest and similar income” or “Interest expense and similar charges”, as appropriate - and those arising for other reasons, which are recognized at their net amount in the heading “Gains (losses) on financial assets and liabilities (net)”.
Adjustments due to changes in fair value arising from Available-for-sale financial assets are recognized temporarily in equity in the heading “Other Comprehensive Income”. Items charged or credited to this account remain in the Bank’s consolidated equity until the related assets are written-off, whereupon they are charged to the consolidated income statement.
iv. Hedging transactions
The consolidated entities use financial derivatives for the following purposes: i) to provide these instruments to clients who request them in the management of their market and credit risks; ii) to use these derivatives in the management of the risks of the Bank entities’ own positions and assets and liabilities (“hedging derivatives”); and iii) to obtain gains from changes in the prices of these derivatives (“financial derivatives”).
Financial derivatives that do not qualify for hedge accounting are treated for accounting purposes as trading derivatives.
A derivative qualifies for hedge accounting if all the following conditions are met:
1. The derivative hedges one of the following three types of exposure:
a. Changes in the fair value of assets and liabilities due to fluctuations, among other, in the interest rate and/or exchange rate to which the position or balance to be hedged is subject (“fair value hedge”);
b. Changes in the estimated cash flows arising from financial assets and liabilities, commitments and highly probable forecast transactions (“cash flow hedge”);
c. The net investment in a foreign operation (hedge of a net investment in a foreign operation).
2. It is effective in offsetting exposure inherent in the hedged item or position throughout the expected term of the hedge, which means that:
a. At the date of arrangement the hedge is expected, under normal conditions, to be highly effective (prospective effectiveness).
BANCO SANTANDER (BRASIL) S.A.
NOTES TO THE CONSOLIDATED FINANCIAL STATEMENTS
(Thousands of Brazilian Reais - R$ - unless otherwise stated)
b. There is sufficient evidence that the hedge was actually effective during the whole life of the hedged item or position (retrospective effectiveness).
3. There must be adequate documentation evidencing the specific designation of the financial derivative to hedge certain balances or transactions and how this effective hedge was expected to be achieved and measured, provided that this is consistent with the Bank’s management of own risks.
The changes in value of financial instruments qualifying for hedge accounting are recognized as follows:
a. In fair value hedges, the gains or losses arising on both the hedging instruments and the hedged items (attributable to the type of risk being hedged) are recognized directly in the consolidated income statement.
b. In cash flow hedges, the effective portion of the change in value of the hedging instrument is recognized temporarily in equity under “Other comprehensive Income - Cash flow hedges” until the forecast transactions occur, when it is recognized in the consolidated income statement, unless, if the forecast transactions result in the recognition of non-financial assets or liabilities, it is included in the cost of the non-financial asset or liability. The ineffective portion of the change in value of hedging derivatives is recognized directly in the consolidated income statement.
c. The ineffective portion of the gains and losses on the hedging instruments of cash flow hedges and hedges of a net investment in a foreign operation are recognized directly under “Gains (losses) on financial assets and liabilities (net)” in the consolidated income statement.
If a derivative designated as a hedge instrument no longer meets the requirements described above due to expiration, ineffectiveness or for any other reason, the derivative is classified as a trading derivative.
When fair value hedge accounting is discontinued (repealed, expired, sold our no longer meet hedge accounting criteria) the adjustments previously recognized on the hedged item are transferred to profit or loss at the effective interest rate re-calculated at the date of hedge discontinuation. The adjustments must be fully amortized at maturity.
When cash flow hedges are discontinued, any cumulative gain or loss on the hedging instrument recognized in equity in the heading "Other comprehensive Income” (from the period when the hedge was effective) remains recognized in equity until the forecast transaction occurs at which time it is recognized in profit or loss, unless the transaction is no longer expected to occur, in which case any cumulative gain or loss is recognized immediately in profit or loss.
f) Settlement of financial assets and liabilities
The accounting treatment of transfers of financial assets depends on the extent to which the risks and rewards associated with the transferred assets are transferred to third parties:
1. If the Bank transfers substantially all the risks and rewards to third parties-unconditional sale of financial assets, sale of financial assets under an agreement to repurchase them at their fair value at the date of repurchase, sale of financial assets with a purchased call option or written put option that is deeply out of the money, securitization of assets in which the transferor does not retain a subordinated debt or grant any credit enhancement to the new holders, and other similar cases, the transferred financial asset is derecognized and any rights or obligations retained or created in the transfer are recognized simultaneously.
2. If the Bank retains substantially all the risks and rewards associated with the transferred financial asset -sale of financial assets under an agreement to repurchase them at a fixed price or at the sale price plus interest, a securities lending agreement in which the borrower undertakes to return the same or similar assets, and other similar cases, the transferred financial asset is not derecognized and continues to be measured by the same criteria as those used before the transfer. However, the following items are recognized:
a. An associated financial liability, for an amount equal to the consideration received; this liability is subsequently measured at amortized cost.
b. The income from the transferred financial asset not derecognized and any expense incurred on the new financial liability.
3. If the Bank neither transfers or retains substantially all the risks and rewards associated with the transferred financial asset - sale of financial assets with a purchased call option or written put option that is not deeply in or out of the money, securitization of assets in which the transferor retains a subordinated debt or other type of credit enhancement for a portion of the transferred asset, and other similar cases, the following distinction is made:
a. If the transferor does not retain control of the transferred financial asset, the asset is derecognized and any rights or obligations retained or created in the transfer are recognized.
b. If the transferor retains control, it continues to recognize the transferred financial asset for an amount equal to its exposure to changes in value and recognizes a financial liability associated with the transferred financial asset. The net carrying amount of the transferred asset and the associated liability is the amortized cost of the rights and obligations retained, if the transferred asset is measured at amortized cost, or the fair value of the rights and obligations retained, if the transferred asset is measured at fair value.
BANCO SANTANDER (BRASIL) S.A.
NOTES TO THE CONSOLIDATED FINANCIAL STATEMENTS
(Thousands of Brazilian Reais - R$ - unless otherwise stated)
g) Offsetting of financial instruments
Financial asset and liability balances are offset (i.e. reported in the consolidated balance sheets at their net amount) only if the Bank and their subsidiaries currently have a legally enforceable right to set off the recognized amounts and intend either to settle on a net basis, or to realize the asset and settle the liability simultaneously.
Offsetting Agreements and Obligations Settlement (CMN Resolution 3.263/2005) - The Bank has an agreement for the clearing and settlement of obligations under the National Financial System (SFN), signed with individuals and legal entities, whether or not members of the SFN, resulting in higher financial settlement guarantee, with the parties that have this modality of agreement. These agreements establish that payment obligations to Banco Santander arising from credit and derivative operations, in the event of default by the counterparty, will be offset against Banco Santander’s payment obligations with the counterparty.
The following table provides details of financial assets and liabilities subject to offsetting at December 31, 2017, 2016 and 2015:
| Thousand of reais | | | 2017 |
| | | | |
| Assets: | Financial assets, gross | Financial assets
offset in the balance sheet, gross | Financial assets
offset in the balance sheet, net |
| Derivatives | 17,262,888 | - | 17,262,888 |
| Repurchase agreements | 34,505,671 | - | 34,505,671 |
| | | | |
| | | | |
| Liabilities: | Financial liabilities, gross | Financial liabilities
offset in the balance sheet, gross | Financial liabilities
offset in the balance sheet, net |
| Derivatives | 16,677,486 | - | 16,677,486 |
| Repurchase agreements | 97,421,579 | - | 97,421,579 |
| | | | |
| Thousand of reais | | | 2016 |
| | | | |
| Assets: | Financial assets, gross | Financial assets
offset in the balance sheet, gross | Financial assets
offset in the balance sheet, net |
| Derivatives | 24,702,973 | - | 24,702,973 |
| Repurchase agreements | 47,528,393 | - | 47,528,393 |
| | | | |
| | | | |
| Liabilities: | Financial liabilities, gross | Financial liabilities
offset in the balance sheet, gross | Financial liabilities
offset in the balance sheet, net |
| Derivatives | 20,236,615 | - | 20,236,615 |
| Repurchase agreements | 129,817,727 | - | 129,817,727 |
| | | | |
| Thousand of reais | | | 2015 |
| | | | |
| Assets: | Financial assets, gross | Financial assets
offset in the balance sheet, gross | Financial assets
offset in the balance sheet, net |
| Derivatives | 26,250,362 | - | 26,250,362 |
| Repurchase agreements | 31,987,323 | - | 31,987,323 |
| | | | |
| | | | |
| Liabilities: | Financial liabilities, gross | Financial liabilities
offset in the balance sheet, gross | Financial liabilities
offset in the balance sheet, net |
| Derivatives | 24,716,959 | - | 24,716,959 |
| Repurchase agreements | 115,003,783 | - | 115,003,783 |
On December 31, 2017, 2016 and 2015, the Bank has no financial instruments that meet the conditions for recognition on a net basis.
h) Regular way of financial assets purchases
Regular way of financial assets purchases are recognized on trade date. The assets are settled when the rights to receive cash flows have expired or the Bank has transferred substantially all the risks and rewards of ownership.
i) Impairment of financial assets
i. Definition
A financial asset is considered impaired when there is objective evidence that events have occurred which:
• Give rise to an adverse impact on the future cash flows that were estimated at the transaction date, in the case of debt instruments (loans and debt securities);
• In the case of equity instruments, mean that their carrying amount may not be fully recovered.
BANCO SANTANDER (BRASIL) S.A.
NOTES TO THE CONSOLIDATED FINANCIAL STATEMENTS
(Thousands of Brazilian Reais - R$ - unless otherwise stated)
• Arising from the violation of terms of loans, and
• During the Bankruptcy process.
As a general rule, the adjustment of the value of the impaired financial instruments is recognized in the consolidated income statement for the period in which the impairment becomes evident, and the reversal, if any, of previously recognized impairment loss is recognized in the consolidated income statement for the period in which the impairment is reversed or reduced.
ii. Debt instruments carried at amortized cost
The amount of an impairment loss incurred for determination of the recoverable amount on a debt instrument measured at amortized cost is equal to the difference between its carrying amount and the present value of its estimated future cash flows (excluding future credit losses that have not been incurred) discounted the original effective interest rate of the financial asset (or the effective interest rate computed at initial recognition), and is presented as a reduction of the asset balance and recorded in income statements.
In estimating the future cash flows of debt instruments the following factors are taken into account:
• All the amounts that are expected to be obtained over the remaining life of the instrument, in this case, the provided guarantees. The impairment loss takes into account the likelihood of collecting accrued interest receivable.
• The various types of risk to which each instrument is subject; and
• The circumstances in which collections will foreseeably be made.
These cash flows are subsequently discounted using the instrument’s effective interest rate.
Specifically in regards to recoverable amount losses resulting from materialization of the insolvency risk of the obligors (credit risk), a debt instrument is impaired due to insolvency when there is evidence of a deterioration of the obligor’s ability to pay, either because it is in arrears or for other reasons.
The Bank has certain policies, methods and procedures for covering its credit risk arising from insolvency allocable to counterparties.
These policies, methods and procedures are applied in the granting, in the examination and to document debt instruments, and contingent liabilities and commitments, the identification of their recoverable amount and the calculation of the amounts necessary to cover the related credit risk.
The procedures applied in the identification, measurement, control and reduction of the exposure to credit risk, are based on an individual basis or grouped by similarity.
• Clients with individual management: Wholesale clients, financial institutions and certain companies. Risk management is performed through an analysis complemented by tools to support the decision-making based in internal risk assessment.
• Clients with standardized management: individuals and companies not classified as individual clients. Risk management models based on automated decision-making and risk assessment procedure, complemented, when the model is not comprehensive or accurate enough, by teams of analysts specialized in this type of risk. The credits related to clients standardized, are usually considered not recoverable when they have historical loss experience and delay greater than 90 days.
Regarding the provision for impairment losses from credit risk, the Bank evaluates all loans. Loans are either individually or collectively evaluated for impairment. Loans accounted as amortized cost, which are not individually evaluated for impairment, are collectively evaluated for impairment, grouping them considering the similarity of risk. Loans individually evaluated for impairment are not included in balances that are collectively evaluated for impairment.
The Bank first assesses whether objective evidence of impairment loss individually for financial assets are individually significant, and individually or collectively for financial assets are not individually significant.
To measure the impairment loss on loans individually evaluated for impairment, the Bank considers the conditions of the borrower, such as his economic and financial situation, level of indebtedness, ability to generate income, cash flow , management, corporate governance and quality of internal controls, payment history, industry expertise, contingencies and credit limits, as well as characteristics of assets, such as their nature and purpose, type, sufficiency and liquidity level guarantees and total amount of credit, as well as based on historical experience of impairment and other circumstances known at the moment of evaluation.
To measure the impairment loss on loans collectively evaluated for impairment, the Bank segregates financial assets into groups considering the characteristics and similarity of credit risk, in other words, according to segment, the type of assets, guarantees and other factors associated as the historical experience of impairment and other circumstances known at the time of assessment.
BANCO SANTANDER (BRASIL) S.A.
NOTES TO THE CONSOLIDATED FINANCIAL STATEMENTS
(Thousands of Brazilian Reais - R$ - unless otherwise stated)
In some cases the observable data required to estimate the amount of an impairment loss on a financial asset may be limited or no longer fully relevant to current circumstances.
In such cases, an entity uses its experienced judgment to estimate the amount of any impairment loss. Similarly an entity uses its experienced judgment to adjust observable data for a group of financial assets to reflect current circumstances.
The impairment loss is calculated by using statistical models that consider the following factors:
Exposure at default (EAD) is the amount of risk exposure at the date of default by the counterparty.
In accordance with IFRS, the exposure at default used for this calculation is the current exposure, as reported in the balance sheets.
• Probability of default, or “PD”, is the probability of the borrower failing to meet its principal and/or interest payment obligations.
PD is measured using a time horizon of one year; that is, it quantifies the probability of the borrower default in the coming year. A loan will be defaulted if either the principal or interest become past due by ninety days or more or the loan is active but there are doubts about the solvency of the counterparty (subjective doubtful assets).
• Loss given default, or “LGD”, is the loss arising in the event of default.
LGD calculation is based on the net charge offs on defaulted loans, taking into account the guarantees/collateral associated with the loans, the income and expenses associated with the recovery process and the timing of default.
• Loss identification period, or “LIP,” is the time period between the occurrence of a loss event and the identification of an objective evidence of this loss. In other words, it represents the time horizon from the credit loss occurrence until the effective confirmation of such loss.
• In addition, prior to loans be written-off (which is only done after the Bank have completed all recovery efforts and after about 360 days late), it is registered fully provision of the loan´s remaining balance so this provision (allowance for loan losses) fully covers the losses. Thus, the Bank understands that its loan loss allowance methodology has been developed to meet its risk metrics and capture loans that could potentially become impaired.
iii. Debt or equity instruments classified as available for sale
The difference between the amortized cost and fair value of debt or equity instruments classified as available for sale are recorded in equity under "Other Comprehensive Income."
When there is objective evidence that the aforementioned differences are due to a prolonged decline in fair value, they are no longer recognized in equity and are reclassified, at the cumulative amount at that date, to the consolidated income statement. Losses from a prolonged decline in fair value relating to an investment in equity instruments are not reversed in subsequent periods.
j) Repurchase agreements
Purchases (sales) of financial instruments under a non-optional resale (repurchase) agreement at a fixed price (repos) are recognized in the consolidated financial statements as financing granted (received), based on the nature of the debtor (creditor), under Loans and advances with Bacen, Loans and advances to credit institutions or Loans and advances to clients (Deposits from Bacen, Deposits from credit institutions or Client deposits).
Differences between the purchase and sale prices are recognized as interest over the deadline of the contract.
k) Accounting for leases
i. Financial leases
Financial leases are leases that transfer substantially all the risks and rewards incidental to ownership of the leased asset to the lessee.
When the consolidated entities act as the lessors of an asset, the sum of the present value of the lease payments receivable from the lessee, including the exercise price of the lessee’s purchase option at the end of the lease term when such exercise price is sufficiently below fair value at the option date such that it is reasonably certain that the option will be exercised, is recognized as lending to third parties and is therefore included under Loans and receivables in the consolidated financial statements.
The finance income arising from these contracts is credited in the heading “Interest and similar income” in the consolidated income statement in order to achieve a constant rate of return over the deadline of the lease.
BANCO SANTANDER (BRASIL) S.A.
NOTES TO THE CONSOLIDATED FINANCIAL STATEMENTS
(Thousands of Brazilian Reais - R$ - unless otherwise stated)
l) Non-current assets held for sale
“Non-current assets held for sale” includes the carrying amount of individual items or disposal groups or items forming part of a business unit earmarked for disposal (“Discontinued operations”), whose sale in their present condition is highly probable and is expected to occur within one year, the property or other non-current assets received by the consolidated entities as total or partial settlement of their debtors’ payment obligations to them are deemed to be non-current assets held for sale through the completion of actions which normally occurs up to one year.
Non-current assets held for sale are measured at the lower of fair value less costs to sell and their carrying amount at the date of classification in this category. These assets held for sale are not depreciated.
Impairment losses on an asset or disposal group arising from a reduction in its carrying amount to its fair value (less costs to sell) are recognized in the heading “Gains (losses) on disposal and expenses of non-current assets held for sale not classified as discontinued operations” in the consolidated income statement. The gains on a non-current asset held for sale resulting from subsequent increases in fair value (less costs to sell) increase its carrying amount and are recognized in the consolidated income statement up to an amount equal to the impairment losses previously recognized.
m) Residual maturity periods and average interest rates
The analysis of the maturities of the balances of certain items in the consolidated financial statements at 2017, 2016 and 2015 year-end is provided in note 45-d.
n) Tangible assets
“Tangible assets” includes the amount of buildings, land, furniture, vehicles, computer hardware and other fixtures owned by the Bank, including tangible assets received by the Bank in full or partial satisfaction of financial assets representing receivables from third parties which are intended to be held for continuing use and tangible assets acquired under finance leases are presented at acquisition cost, less the related accumulated depreciation and any impairment losses (net carrying amount higher than recoverable amount).
Depreciation is calculated, using the straight-line method, on the basis of the acquisition cost of the assets less their residual value. The land on which the buildings and other structures are located has an indefinite life and, therefore, it is not depreciated.
The tangible asset depreciation charge is recognized in the consolidated income statement and is calculated basically using the following depreciation rates (based on the average years of estimated useful life of the various assets):
| | Annual
Rate |
| Buildings for own use | 4% |
| Furniture | 10% |
| Fixtures | 10% |
| Office and IT equipment | 20% |
| Leasehold improvements | 10% or up to contractual maturity |
The Bank assesses at end of each period, if there is indication that the items of tangible assets carrying amount may be impaired, that is if there is an asset with its carrying amount bigger than its recoverable amount, either for use or sale.
Once an impairment loss of tangible assets is identified, it is adjusted to reach its recoverable amount by recognizing an impairment loss recorded in the heading "Impairment loss on other assets (Net)". Additionally the value of depreciation of that asset is recalculated in order to adjust the value of the life of the asset.
In case of evidence or indication of a recovery of a tangible asset value, the Bank recognizes the reversal of the impairment loss amount recorded in prior years and should adjust the future depreciation expenses according to the lifetime value of the asset. Under no circumstance, a reversal of impairment loss of an asset will increase its carrying amount higher than the amount that it would have had no impairment loss been recognized in prior years.
Upkeep and maintenance expenses relating to property, plant and equipment for own use are recognized as an expense in the period in which they are incurred.
o) Intangible assets
Intangible assets are identifiable non-monetary assets (separable from other assets) without physical substance which arise as a result of a legal transaction or software development. Only assets whose cost can be estimated reliably and from which the consolidated entities consider it probable that future economic benefits will be generated are recognized.
BANCO SANTANDER (BRASIL) S.A.
NOTES TO THE CONSOLIDATED FINANCIAL STATEMENTS
(Thousands of Brazilian Reais - R$ - unless otherwise stated)
Intangible assets are recognized initially at acquisition or production cost and are subsequently measured deducting any accumulated amortization and any accumulated impairment losses.
i. Goodwill
In the acquisition and/or merger of investment in subsidiary, any difference between the investment cost and the investor’s share in net fair value of assets, liabilities and contingent liabilities of the investee (subsidiary or affiliate) is accounted for in accordance with IFRS 3 "Business Combination ".
Goodwill is only recognized when it has been acquired for consideration and represents, therefore, a payment made by the acquirer in anticipation of future economic benefits from assets of the acquired entity that are not capable of being individually identified and separately recognized.
At the end of each annual reporting period or whenever there is any indication of impairment goodwill is reviewed for impairment (i.e. a reduction in its recoverable amount to below its carrying amount) and, if there is any impairment, the goodwill is written down with a charge to Impairment on non financial assets (net) - Intangible assets in the consolidated income statement.
The net fair value adjustments of assets, liabilities and contingent liabilities of the investee in relation to their carrying amount are allocated to individual identifiable assets acquired and liabilities assumed that comprise them based on their respective fair values at the date of purchase.
In the case of a business combination made in stages, prior interest in the acquired is measured again at fair value at the acquisition date when control of the acquired is obtained.
ii. Other intangible assets
Other intangible assets are non-monetary assets without physical substance. Generally arising from software development and acquisition of rights that can generate benefits for the Bank. They can have characteristics of definite or indefinite period.
Other intangible assets can have an indefinite useful life -when, based on an analysis of all the relevant factors, it is concluded that there is no foreseeable limit to the period over which the asset is expected to generate net cash inflows for the consolidated entities- or a finite useful life, in all other cases.
Intangible assets with indefinite useful lives are not amortized, but rather at the end of each reporting period or whenever there is any indication of impairment the consolidated entities review the remaining useful lives of the assets in order to determine whether they continue to be indefinite and, if this is not the case, to take the appropriate steps.
Intangible assets with finite useful lives are amortized over those useful lives using methods similar to those used to depreciate tangible assets. The amortization expense is recognized under "Depreciation and amortization" in the consolidated income statement.
The Bank assesses at the end of each period, if there is any indication that the items of intangible assets may present an impairment loss, i.e. an asset that presents the carrying amount higher than the net realizable value. After identifying any reduction in impairment loss, it is adjusted to reach its fair value.
Measurement of the recoverable amount of other intangible assets - software is made based on the value in use, as well as the analysis of the discontinuity of the asset in relation to the activities of the Bank.
Expenditures for acquisition and development of software are amortized over a maximum period of 5 years.
p) Other assets
Other Assets include the balances of all prepayments and accrued income (excluding accrued interest), acquired client list, the net amount of the difference between pension plan obligations and the fair value of the plan assets with a balance on the entity’s behalf, when this net amount shall be disclosed in the consolidated financial statements, and the amount of any other assets not included in other items.
The Bank uses the value in use of client relationship as a basis for measuring the impairment since it is not reasonably possible to determine the net value of sales, because there is no basis for making a reliable estimate of the value to be obtained by selling the asset in a transaction at cumulative basis, between knowledgeable, willing parties. The value in use of client lists acquired related to the purchase of the "payroll" will be determined individually. An analyses that aims to demonstrate the expectation of generating future economic benefit and the present value of expected cash flows is prepared by the business areas. Quarterly, these analyses are reviewed based on the actual cash flows of each business (value in use), which are compared with the carrying amount, checking whether there is a need to record a loss on non-recoverability.
BANCO SANTANDER (BRASIL) S.A.
NOTES TO THE CONSOLIDATED FINANCIAL STATEMENTS
(Thousands of Brazilian Reais - R$ - unless otherwise stated)
q) Liabilities for insurance contracts
The liabilities for insurance contracts are comprised substantially by mathematical provisions for current and future benefits (PMBaC and PMBC). Insurance contracts are contracts under which the Bank accepts a significant risk, other than a financial risk, from a policyholder by agreeing to compensate the beneficiary on the occurrence of an uncertain future event by which the policyholder will be adversely affected.
Insurance liabilities are recognized when the contract is entered into and the premiums are charged. Contracts that have been classified as insurance are not reclassified subsequently. The liability is derecognized when the contract expires or is cancelled.
All valuation methods used by the subsidiaries are based on the general principle that the carrying amount of the net liability must be sufficient to meet any reasonably foreseeable obligation resulting from the insurance contracts. Investment assumptions are either determined by the local regulator and based on management’s future expectations. In the later case, the anticipated future investment yield is set by management, considering the available market information and economic indicators. A significant assumption related to estimated gross profits on variable annuities, is the annual long-term growth rate of the underlying assets.
At each financial statement date an assessment is made in order to verify whether the Mathematical provisions are adequate.
In the years ended December 31, 2017, 2016 and 2015, as determined by IFRS 4 - Contracts classification and subsequent amendments, the adequacy of the technical provisions constituted were evaluated through Liability Adequacy Test (LAP).
In December 31, 2017, the LAT indicated the need for the additional constitution of technical provisions amounted to R$130,307 (12/31/2016 - R$85,395 and 12/31/2015 - R$57,523) for Indemnity Funds for Benefit (FGB) plans.
r) Provision for contingent assets and liabilities
Banco Santander and its subsidiaries are involved in lawsuits and administrative proceedings related to tax, labor and civil, in the normal course of their activities.
The provisions include legal obligations, lawsuits and administrative proceedings related to tax and social security obligations, whose object is to challenge their legality or constitutionality, regardless of the assessment that the probability of success, the amounts are fully recognized in the financial statements.
Provisions are reviewed at each financial statement date and adjusted to reflect the current best estimate and may be fully or partially reversed or reduced when the outflows of resources and obligations relevant to the process are no longer probable, including decay of legal deadlines, among others.
Provisions for the lawsuits and administrative proceedings are recorded when their risk of loss is considered probable and the amounts can be reliably measured, based on the nature, complexity and history of lawsuits, the legal opinion of the internal and external advisors, based on the best available information. For those lawsuits for which the risk of loss is possible, are not recorded and the information is disclosed in the financial statements (Note 24.h.) and for the lawsuits for which the risk of loss is remote, no disclosure is required.
Contingent assets are not recognized, except when there are guarantees or favorable lawsuits decisions, about which features no longer fit, characterizing the gain as practically certain. Assets with probable success, if any, are only disclosed in the financial statements.
On the favorable decisions to Santander, the counterparty has the right, in the event of specific legal requirements, to file a rescission lawsuit within a period determined by current legislation. Rescission lawsuits are considered as new events and will be evaluated for contingent liability purposes if and when they are filed.
s) Other liabilities
“Other liabilities” includes the balance of all accrued expenses and deferred income, excluding accrued interest, and the amount of any other liabilities not included in other categories.
t) Share-based compensation
The Bank has long-term compensation plans with vesting conditions. The main vesting conditions are: (1) service conditions, since it is necessary that the participant continues to be employed by the Bank during the term of the Plan for his rights to vest; (2) performance conditions, since the number of Units that ultimately vest will be determined according to the result of certain performance parameter of the Bank, such as: total Shareholder Return (TSR) and may be reduced in case of failure to achieve the goals of reducing the Return on Risk Adjusted Capital (RORAC), comparison between actual and budget in each year, as determined by the Board of Directors and (3) market conditions, since some parameters are linked to the market price of the Bank´s shares. The Bank measures the fair value of the services rendered by reference to the fair value of the equity instruments granted at the grant date, taking into account the market conditions for each plan when estimating the fair value.
BANCO SANTANDER (BRASIL) S.A.
NOTES TO THE CONSOLIDATED FINANCIAL STATEMENTS
(Thousands of Brazilian Reais - R$ - unless otherwise stated)
Settlement in shares
The Bank measures the fair value of the services received by reference to the fair value of the equity instruments granted at the grant date, taking into account the market conditions for each grant when estimating the fair value. In order to recognize the personnel expenses against equity reserves throughout the vesting period, as the services are received, the Bank considers the treatment of service conditions and recognize the amount for the services received during the vesting period based on the best available estimate of the number of equity instruments expected to vest. Semi-annually, the Bank reviews the estimate of the number of equity instruments expected to vest.
Settlement in cash
For cash-settled share-based compensation (in the form of share appreciation rights), the Bank measures the fair value of services rendered and the corresponding liability incurred, based on the fair value of the share appreciation rights at the grant date and until the liability is settled. The Banks remeasures the fair value of the liability at the end of each reporting period and at the date of settlement, with any changes in fair value recognized in profit or loss for the period. In order to recognize the personnel expenses against a provision in “other liabilities” throughout the vesting period, reflecting the period as the services are received, the Bank bases the total liability on the best estimate of the number of share appreciation rights that will vest at the end of the vesting period and recognizes the amount for the services received during the vesting period based on such best available estimate. Periodically, the Bank reviews such estimate of the number of share appreciation rights that will vest at the end of vesting period.
u) Recognition of income and expenses
The most significant criteria used by the Bank to recognize its income and expenses are summarized as follows:
i. Interest income, interest expenses and similar items
Interest income, interest expenses and similar items are generally recognized on an accrual basis using the effective interest method. Dividends received from other companies are recognized as income when the consolidated entities’ right to receive them arises.
ii. Commissions, fees and similar items
Fees and commission income and expenses are recognized in the income statement using criteria that vary according to their nature (note 36). The main criteria are as follows:
| · | Fee and commission income and expenses relating to financial assets and financial liabilities measured at fair value through profit or loss are recognized when paid; |
| · | Those arising from transactions or services that are performed over a period of time are recognized over the life of these transactions or services; and |
| · | Those relating to services provided in a single act are recognized when the single act has been performed. |
iii. Non-financial income and expenses
These are recognized for accounting purposes on an accrual basis.
iv. Deferred collections and payments
These are recognized for accounting purposes at the amount resulting from discounting the expected cash flows at market rates.
v. Loan arrangement fees
Loan arrangement fees, mainly loan origination and application fees, are accrued and recognized in the income statement over the term of the loan. In the case of loan origination fees, the portion relating to the associated direct costs incurred in the loan arrangement is recognized immediately in the consolidated income statement.
v) Guarantees
v.1) Financial guarantees
“Financial guarantees” are defined as contracts whereby an entity undertakes to make specific payments for a third party if the latter does not do so, irrespective of the various legal forms they may have, such as guarantees, irrevocable documentary credits issued or confirmed by the entity, among others.
The Bank initially recognizes the commission of the financial guarantees as liability in the consolidated financial statements at fair value, which is generally the present value of the fees, commissions and similar interest receivable from these contracts over their term.
BANCO SANTANDER (BRASIL) S.A.
NOTES TO THE CONSOLIDATED FINANCIAL STATEMENTS
(Thousands of Brazilian Reais - R$ - unless otherwise stated)
Financial guarantees, regardless of the guarantor, type of instrument or other circumstances, are reviewed periodically so as to determine the credit risk to which they are exposed and, if appropriate, to consider whether a provision is required. The credit risk is determined by application of criteria similar to those established for quantifying impairment losses on debt instruments measured at amortized cost.
The provisions made for these transactions are recognized in the heading “Provisions - Provisions for contingent liabilities, commitments and other provisions” in the consolidated financial statements (note 24).
If a specific provision is required for financial guarantees, the related unearned commissions are recognized in the heading “Financial liabilities at amortized cost – Other financial liabilities” in the consolidated financial statements are reclassified to the appropriate provision.
v.2) Guarantees and Credit Risk Mitigation Policy
Banco Santander controls the credit risk using the collateral in its operations. Each business unit is responsible for credit risk management and formalizes the use of collateral in its lending policies.
Banco Santander uses guarantees in order to increase its ability to recover operations subject to credit risk. The guarantees can be fiduciary, real, legal structures with power mitigation and compensation agreements. The Bank periodically reviews its policy guarantees through technical parameters, normative and also its historical basis, to determine whether the guarantee is legally valid and enforceable.
Credit limits are continually monitored and changed in client behavior function. Thus, the potential loss values represent a fraction of the amount available.
w) Assets under management and investment and pension funds managed by the Bank
Assets owned by third parties and managed by the consolidated entities are not presented in the consolidated financial statements. Management fees are included in “Fee and commission income” in the consolidated income statement. Note 45-b contains information on the third-party assets managed by the Bank.
The investment funds and pension funds managed by the consolidated entities are not recorded in the consolidated financial statements since the related assets are owned by third parties. The fees and commissions earned in the year for the services rendered by the Bank entities to these funds (asset management and custody services) are recognized in the heading “Fee and commission income” in the consolidated income statement.
x) Post-employment benefits
Post-employment benefit plans include the commitments of the Bank: (i) addition to the benefits of public pension plan; and (ii) healthcare in case of retirement, permanent disability or death for those employees, and their direct beneficiaries.
Defined contribution plans
Defined contribution plans is the post-employment benefit plan which the Bank, and its subsidiaries, as the sponsoring entity pays fixed contributions into a pension fund, not having a legal or constructive obligation to pay further contributions if the fund does not hold sufficient assets to pay all benefits relating to services provided in the current and in previous periods.
The contributions made are recognized in the heading "Interest Expense and Similar Charges" in the income statement.
Defined benefit plans
Defined benefit plan is the post-employment benefit plan which is not a defined contribution plan and is shown in Note 23. For this type of plan, the sponsoring entity’s obligation is to provide the benefits agreed with the former employees, assuming the potential actuarial risk that benefits will cost more than expected.
For defined benefit plan, the amendment of IAS 19 established fundamental changes in the accounting for and disclosure of employee post-employment benefits such as removing the corridor approach in the accounting for the obligation of the plans, as well as changes in the criteria for recognition of conventional interest of plan assets (valuation based on the discount rate actuarial liability).
In addition, there is full recognition in liabilities heading of actuarial losses (actuarial deficit) not recognized previously when they occur, which its counterparty is a heading in the stockholders’ equity (Other Comprehensive Income).
Main Definitions
- The present value of the defined benefit obligation is the present value without any deduction from the plan assets, of expected future payments required to settle the obligation resulting from employee service in the current and past periods.
BANCO SANTANDER (BRASIL) S.A.
NOTES TO THE CONSOLIDATED FINANCIAL STATEMENTS
(Thousands of Brazilian Reais - R$ - unless otherwise stated)
- Deficit or surplus is: (a) the present value of the defined benefit obligation, less (b) the fair value of plan assets.
- The sponsoring entity may recognize the plan assets in the financial statements when they meet the following characteristics: (i) the fund assets are sufficient to meet all employee benefit plan or the sponsor obligations; or (ii) the assets are returned to the sponsoring entity in order to reimburse it for employee benefits already paid.
- Actuarial gains and losses correspond to changes in the present value of defined benefit obligation resulting from: (a) adjustments by experience (the effects of differences between the actuarial assumptions adopted and what has actually occurred); and (b) effects of changes in actuarial assumptions.
- Current service cost is the increase in the present value of the defined benefit obligation resulting from employee service provided in the current period.
- The past service cost is the change in present value of defined benefit obligation for employee service provided in prior periods resulting from a change in the plan or reductions in the number of employees covered.
Post-employment benefits are recognized in income in the headings "Interest expense and similar Charges" and "Provisions (net)".
The defined benefit plans are recorded based on an actuarial study, conducted annually by an external consulting firm, at the end of each year to be effective for the subsequent period.
y) Other long-term employee benefits
“Other long-term employee benefits”, defined as obligations to early retirees considered as those who have ceased to render services at the entity but who, without being legally retired, continue to have economic rights relating to the entity until they acquire the legal status of retiree, long-service bonuses, obligations for death of spouse or disability before retirement that depend on the employee’s length of service at the entity and other similar items, are treated for accounting purposes, where applicable, as established above for defined benefit post-employment plans, except that all past service costs and actuarial gains and losses are recognized immediately (note 23).
z) Termination benefits
Termination benefits are recognized when there is a detailed formal plan identifying the basic changes to be made, provided that implementation of the plan has begun, its main features have been publicly announced or objective facts concerning its implementation have been disclosed.
aa) Income taxes (IRPJ), Social Contribution (CSLL), Social Integration Program (PIS) and Tax for Social Security Financing (COFINS)
Income tax is calculated at the rate of 15% plus a surcharge of 10% levied on the profit, after adjustments determined by tax legislation. The social contribution (CSLL) is calculated at the rate of 20% for financial institutions (15% up to August 2015) and 9% for other companies, levied on the profit, after considering the adjustments determined by tax legislation. The CSLL rate for financial institutions, legal persons of private insurance and capitalization was increased from 15% to 20% for the fiscal period between September 1, 2015 and December 31, 2018, pursuant to Law 13,169/2015 (a result of the conversion into law of Provisional Measure 675/2015).
The expense for corporate income tax is recognized in the consolidated income statement, except when it results from a transaction recognized directly in equity, in which case the tax effect is also recognized in equity.
The current income tax expense is calculated as the sum of the current tax resulting from application of the appropriate tax rate to the taxable profit for the year (net of any deductions allowable for tax purposes), and of the changes in deferred tax assets and liabilities recognized in the consolidated income statement.
Tax assets classified as "Current" are amounts of tax to be recovered within the next twelve months.
Tax liabilities includes the amount of all tax liabilities (except provisions for taxes), which are broken down into “current” amount payable in respect of the income tax on the taxable profit for the year and other taxes in the next twelve months.
Deferred tax assets and liabilities include temporary differences, which are identified as the amounts expected to be payable or recoverable on differences between the carrying amounts of assets and liabilities and their related tax bases, and tax loss and tax credit carry forwards. These amounts are measured at the tax rates that are expected to apply in the period when the asset is realized or the liability is settled.
Deferred tax assets are only recognized as temporary differences to the extent that it is considered probable that the consolidated entities will have sufficient future taxable profits against which the deferred tax assets can be utilized, and the deferred tax assets do not arise from the initial recognition (except in a business combination) of other assets and liabilities in a transaction that affects neither taxable profit or accounting profit. Other deferred tax assets (tax loss and tax credit carry forwards) are only recognized if it is considered probable that the consolidated entities will have sufficient future taxable profits against which they can be utilized.
BANCO SANTANDER (BRASIL) S.A.
NOTES TO THE CONSOLIDATED FINANCIAL STATEMENTS
(Thousands of Brazilian Reais - R$ - unless otherwise stated)
Due to the change in social contribution tax rate, the group companies made the remeasurement of tax credit assets and deferred liabilities at the rates applicable to the period in which estimates the realization of assets and settlement of liabilities.
Income and expenses recognized directly in stockholders equity are accounted as temporary differences.
The deferred tax assets and liabilities recognized are reassessed at each financial statements date in order to ascertain whether they still exist, and the appropriate adjustments are made on the basis of the findings of the analyses performed.
Under the current regulation, the expected realization of tax credits is based on the Bank’s projections of future results and on technical study, as shown in Note 25.
PIS (Social Integration Program) and COFINS (Tax for Social Security Financing) have been computed at a combined rate of 4.65% on certain gross revenues and expenses. Financial institutions may deduct financial expenses in determining the PIS/COFINS tax basis. PIS and COFINS are considered a profit-base component (net basis of certain revenues and expenses), therefore and accordingly to IAS 12 it is recorded as income taxes.
ab) Consolidated cash flow statements
The following terms are used in the consolidated cash flow statements with the following meanings:
• Cash flows: inflows and outflows of cash and cash equivalents, which are short-term, highly liquid investments that are subject to an insignificant risk of changes in value and original maturity of three months or less.
• Operating activities: the primary revenue-generating activities of credit institutions and other activities that are not investing or financing activities.
• Investing activities: the acquisition and disposal of long-term assets and other investments not included in cash and cash equivalents.
• Financing activities: activities that result in changes in the size and composition of the equity and liabilities that are not operating activities.
In preparing the consolidated cash flows statement, the high liquidity investments with insignificant risk of changes in their values were classified as "Cash and cash equivalents". The Bank classifies as cash and cash equivalents balances recorded in the headings "Cash and balance with the Brazilian Central Bank" and "Loans and amounts due from credit institutions" in the consolidated financial statements, except restricted resources and long-term transactions.
The interest paid and received correspond basically to operating activities of Banco Santander.
Bank’s Management began segregating the "Effects of Exchange Rates on Assets and Liabilities". Consequently, the corresponding figures of the Cash Flow Statements were reclassified for the years ended December 31, 2016 and 2015 with the objective of better presentation of this accounting item.
3. Basis of consolidation
Below are highlighted the controlled entities and investment funds included in the consolidated financial statements of Banco Santander. Similar information regarding companies accounted by the equity method by the Bank is provided in Note 12.
| Directly and Indirectly controlled by Banco Santander (Brasil) S.A. | Activity | Direct | Participation %
Direct and Indirect |
| Banco Bandepe S.A. | Bank | 100,00% | 100,00% |
| Santander Leasing S.A. Arrendamento Mercantil (Santander Leasing) | Leasing | 78,57% | 99,99% |
| Aymoré Crédito, Financiamento e Investimento S.A. (Aymoré CFI) | Financial | 100,00% | 100,00% |
| Santander Brasil Administradora de Consórcio Ltda. (Santander Brasil Consórcio) | Buying club | 100,00% | 100,00% |
| Atual Companhia Securitizadora de Créditos Financeiros (Atual Securitizadora)(13) | Securitization | 100,00% | 100,00% |
| Santander Corretora de Câmbio e Valores Mobiliários S.A. (Santander CCVM) | Broker | 99,99% | 100,00% |
| Santander Corretora de Seguros, Investimentos e Serviços S.A. (Santander Corretora de Seguros) (Previously named as SantanderParticipações S.A.)(3)(5) (7)(9)(10)(11) (20) (21)(22) | Other Activities | 100,00% | 100,00% |
| Getnet Adquirência e Serviços para Meios de Pagamento S.A. (Getnet S.A.) | Payment Institution | 88,50% | 88,50% |
| Sancap Investimentos e Participações S.A. (Sancap) | Holding | 100,00% | 100,00% |
| Santander Brasil EFC | Financial | 100,00% | 100,00% |
| Santander Holding Imobiliária S.A. (Current Corporate Name of da Webcasas S.A.)(2) (17) | Holding | 100,00% | 100,00% |
| Controlled by Atual Securitizadora(13) (18) | | | |
| Ipanema Empreendimentos e Participações(18) | Credit Management and Recovery Management | - | 70,00% |
| Controlled by Ipanema Empreendimentos e Participações(18) | | | |
| Gestora de Investimentos Ipanema(18) | Resource Manager | - | 100,00% |
BANCO SANTANDER (BRASIL) S.A.
NOTES TO THE CONSOLIDATED FINANCIAL STATEMENTS
(Thousands of Brazilian Reais - R$ - unless otherwise stated)
| Directly and Indirectly controlled by Banco Santander (Brasil) S.A. | Activity | Direct | Participation %
Direct and Indirect |
| Controlled by Getnet S.A. | | | |
| Auttar HUT Processamento de Dados Ltda. (Auttar HUT) | Other Activities | - | 100,00% |
| Integry Tecnologia e Serviços A.H.U Ltda. (Integry Tecnologia)(12) | Other Activities | - | 100,00% |
| Toque Fale Serviços de Telemarketing Ltda. (Toque Fale) | Other Activities | - | 100,00% |
| Controlled by Sancap | | | |
| Santander Capitalização S.A. | Savings and annuities | - | 100,00% |
| Evidence Previdência S.A. | Social Securities | - | 100,00% |
| Controlled by Aymoré CFI | | | |
| Super Pagamentos e Administração de Meios Eletrônicos Ltda. (Super Pagamentos)(1) (19) | Payment Institution | - | 100,00% |
| Banco Olé Bonsucesso Consignado S.A. (Olé Consignado)(14) | Bank | - | 60,00% |
| Banco PSA Finance Brasil S.A. | Bank | - | 50,00% |
| Controlled by Olé Consignado(14) | | | |
| BPV Promotora de Vendas e Cobrança Ltda. | Other Activities | - | 100,00% |
| Olé Tecnologia Ltda. ((Current Corporate Name of Bonsucesso Tecnologia Ltda.)(4) | Other Activities | - | 100,00% |
| Controlled by Santander Leasing | | | |
| Santander Finance Arrendamento Mercantil S.A. (Current Corporate Name of PSA Finance Arrendamento Mercantil S.A. (Santander Finance Arrendamento Mercantil)) | Leasing | - | 100,00% |
| Santander FIC FI Contract I Referenciado DI | Investment Fund | | (a) |
| Santander Fundo de Investimento Unix Multimercado Crédito Privado | Investment Fund | | (a) |
| Santander Fundo de Investimento Diamantina Multimercado Crédito Privado de Investimento no Exterior | Investment Fund | | (a) |
| Santander Fundo de Investimento Amazonas Multimercado Crédito Privado de Investimento no Exterior | Investment Fund | | (a) |
| Santander Fundo de Investimento SBAC Referenciado DI Crédito Privado | Investment Fund | | (a) |
| Santander Fundo de Investimento Guarujá Multimercado Crédito Privado de Investimento no Exterior | Investment Fund | | (a) |
| Santander Fundo de Investimento Financial Curto Prazo | Investment Fund | | (a) |
| Santander Fundo de Investimento Capitalization Renda Fixa | Investment Fund | | (a) |
| Santander Paraty QIF PLC(6) | Investment Fund | | (a) |
| Santander FI Hedge Strategies Fund (Santander FI Hedge Strategies)(6) | Investment Fund | | (a) |
| BRL V - Fundo de Investimento Imobiliário-FII(8) | Real Estate Investment Fund | | (a) |
| Fundo de Investimento em Direitos Creditórios Multisegmentos NPL Ipanema VI – Não Padronizado (Fundo Investimento Ipanema NPL VI)(15) | Investment Fund | | (a) |
| Fundo de Investimento em Direitos Creditórios Multisegmentos NPL Ipanema VI – Não Padronizado (Fundo Investimento Ipanema NPL V)(16) | Investment Fund | | (a) |
| (a) | Company over which the Bank is exposed, or has rights, to variable returns and have the ability to affect those returns through the power of decision, in accordance with IFRS 10 - Consolidated Financial Statements. Banco Santander and its subsidiaries holds 100% of the shares of these investment funds. |
| (1) | In May, 2017, it was approved by Bacen the authorization process for the Company operates as a payment institution. |
| (2) | Through the Private Stock Purchase and Sale Agreement held on October 26, 2017, Santander Serviços sold its interest held in Webcasas S.A. to Banco Santander. The full sale occurred at book value. |
| (3) | On December 22, 2017, Santander Corretora de Seguros (current corporate name of Santander Participações SA), Cia de Ferro Ligas da Bahia - Ferbasa SA (Ferbasa) and Brazil Wind SA entered into an agreement for the sale of 100% (one hundred percent) of the shares issued by BW Guirapá I SA (respectively the Agreement and BW Guirapá I SA) held by Santander Corretora de Seguros and Brazil Wind SA to Ferbasa (Operation). Subject to confirmation of certain assumptions, the acquisition price for all the shares held by Santander Corretora de Seguros will be up to R$414 million, and there may be an additional payment of up to R$35 million if future targets have been met stipulated in the Contract. The closing of the Transaction remains conditioned, among other conditions, to: (i) approval of the Operation at the Extraordinary General Meeting of Ferbasa, in accordance with its corporate governance; (ii) obtaining the necessary approvals from the competent authorities; and (iii) maintenance of the ordinary course of business of BW Guirapá SA Considering the current stage of the operation and the expectation of its successful completion, this investment was written off against a credit in the asset, consequently the assets and liabilities of BW Guirapa and subsidiaries are no longer consolidated in the consolidated balance sheet, and the profit or loss is recorded in the income statement until November 30, 2017 (Note 11). |
| (4) | According to the contractual change on June 13, 2017, the shareholders agreed to change company´s name from Bonsucesso Tecnologia Ltda. to Olé Tecnologia Ltda. |
| (5) | Banco Santander, through its subsidiaries, holds the risks and benefits of Santander Paraty and the Santander FI Hedge Strategies Subfund, resident in Ireland, and both are fully consolidated in its Consolidated Financial Statements. In the Irish market, an investment fund can not act directly and, for that reason, it was necessary to create another structure (a sub-fund), Santander FI Hedge Strategies. Santander Paraty does not have a financial position, and all position is derived from the financial position of Santander FI Hedge Strategies. |
| (6) | At the ESM held on September 29, 2017, Santander Corretora de Seguros’ shareholders’ equity increase was approved in the amount of R$12,900, based on the net assets of Santander Brasil Advisory calculated based on its book value at base date of August 31, 2017, of which the amount of R$8,463 was allocated to the share capital account of Santander Corretora de Seguros, increasing the current capital from R$1,717,652 to R$1,726,115, by issuing a total of 37,554 (thirty-seven thousand, five hundred and fifty-four) nominative common shares with no par value that were subscribed and paid-in on that date by Banco Santander, the issue price was set at R$343.50 per share, calculated based on their respective carrying amounts, on the base date of August 31, 2017. |
| (7) | The Banco Santander figured as lender of certain delayed debts (loans) which had real estate as guarantees. The process of credit recovery consists in converting into capital contributions by the Real Estate Fund in conjunction concomitant transfer of the same shares to Banco Santander through the process of payment in kind of the above credit operations payments. |
BANCO SANTANDER (BRASIL) S.A.
NOTES TO THE CONSOLIDATED FINANCIAL STATEMENTS
(Thousands of Brazilian Reais - R$ - unless otherwise stated)
| (8) | At the Extraordinary General Meeting (EGM) held on May 8, 2017, it was approved the change of company name from Santander Participações S.A. to Santander Corretora de Seguros, Investimentos e Serviços S.A. At the same EGM, it was approved the company´s purpose change. |
| (9) | At the ESM held on August 31, 2017, a capital increase of R$17,652 was approved, in view of the version of the net assets of Santander Microcrédito, based on its book value at the date - based on June 30, 2017, entirely destined to the share capital account of Santander Corretora de Seguros, transferring the capital stock from the current R$1,700,000 to R$1,717,652, through the issuance of a total of 51,776 (fifty-one thousand, seven hundred and seventy-six) registered common shares with no par value that were subscribed and paid by Banco Santander on that date, the issue price was set at R$340.93 per share, calculated based on their respective book values, on the base date of June 30, 2017. |
| (10) | On August 31, 2017, the merger and the Private Instrument of Protocol and Justification of Santander Microcrédito by Santander Corretora de Seguros (Current Corporate Name of Santander Participações S.A.) were approved, so that Santander Corretora de Seguros received through their book value, based on the balance sheet drawn up on June 30, 2017, all of the assets, rights and obligations of Santander Microcrédito. With the extinction of Santander Microcrédito the Santander Corretora de Seguros became its successor in all its rights and obligations. |
| (11) | On March 9, 2017, under a contractual amendment, they resolved by mutual agreement to increase Integry Tecnologia’s capital stock in the amount of R$75,000, from the current R$1,276 to R$76,276, through the distribution of 75.000.000 (seventy and five million) of new quotas with a par value of R$1.00 each. |
| (12) | At the ESM held on September 11, 2017, a capital increase of R$120,000 was approved, through the issuance of 120,000,000 (one hundred and twenty million) new common shares, nominative and without par value, the capital stock of R$100.00 (one hundred reais) to R$120,000. The shares issued as a result of the capital increase were fully subscribed by the shareholder Banco Santander. |
| (13) | At the ESM held on December 19, 2017, it was approved the increase of the Olé Conignado´s share capital in the amount of R$120.000, increasing it from R$400.000 to R$520.000, through the issuance of 58.071.890 (fifty eight million, seventy one thousand, eight hundred ninety) new ordinary shares without par value. The share capital increase approved by the shareholders is still pending from Bacen´s approval. |
| (14) | This investment fund was formed and started to be consolidated in September of 2017. It refers to a structure where the Bank has sold certain loans agreements which were already written-off (agreements matured over 360 days) and transferred to this fund. The current Companhia Securitizadora de Créditos Financeiros (current Securitization Company) (Note 15), company controlled by the Bank, holds 100% of the fund´s shares. |
| (15) | This fund was consolidated in October 2017 and is indirectly controlled by Atual Securitizadora. |
| (16) | Investment acquired in October 2017. |
| (17) | At the ESM held on July 21, 2017, the capital increase of Super Payments in the amount of R$20,000 was approved, increasing the capital stock from R$49,451 to R$69,451 through the issuance of 50,724,086 (fifty million, seven hundred and twenty-four thousand and eighty-six) new nominative common shares, with no par value, in all identical to those previously existing, at the approximate issue price of R$394.29 per thousand shares at the book value of Super Payments on June 30, 2017. The shares issued were fully subscribed and paid-in on the same date by Aymoré CFI. |
| (18) | On September 29, 2017, the merger and the Private Instrument of Protocol and Justification of Santander Brasil Advisory by Santander Corretora de Seguros (Current Corporate Name of Santander Participações S.A.) were approved, so that Santander Corretora de Seguros received through their book value, based on the balance sheet drawn up on August 31, 2017, all of the assets, rights and obligations of Santander Brasil Advisory. With the extinction of Santander Brasil Advisory the Santander Corretora de Seguros became its successor in all its rights and obligations. |
| (19) | On November 17, 2017, was formalized the acquisition by Banco Santander of the participation by Santusa Holding, S.L. (equivalent to 39.35%) in the share capital of Santander Serviços. Thus, Banco Santander becomes the holder of 99.99% of the shares of Santander Serviços. The amount of R$298,978 relating to goodwill was recorded. |
| (20) | On November 30, 2017, the merger and the Private Instrument of Protocol and Justification of the Merger Santander Serviços by Santander Corretora de Seguros (Current Corporate Name of Santander Participações S.A.). With the extinction of Santander Serviços , Santander Corretora de Seguros became its successor in all its rights and obligations. |
a) Partnership Formation with HDI Seguros S.A. for the Creation of the Totally Digital Cars Insurance Company
On December 20, 2017, the Bank signed agreements with HDI Seguros S.A. (HDI), in order to form a partnership for the issuance, offering and commercialization of car insurance 100% digital, through the creation of a new insurance company – the Santander Auto, which is controlled 50% by Sancap, entity fully controlled by Banco Santander, and 50% by HDI. The conclusion of this operation is subjected to the compliance with determined conditions including relevant regulatory authorizations.
b) Opening of the branch in Luxembourg
The Brazilian Central Bank, on June 9, 2017, granted to Banco Santander the authorization for the incorporation of a branch in Luxembourg, with a capital equivalent to US$1 billion (approximately R$3.2 billion) and the purpose of complementing the foreign trade strategy for corporate clients (large Brazilian companies and their operations abroad) and offering products and financial services through an offshore entity that is not established in a jurisdiction with favored taxation and that it allows an increase of the ability to source funds.
The incorporation of the branch is still subject to the authorization to be granted by the Luxembourg financial authority.
c) Market Agreement for indirect purchase of share on equity capital of Ipanema Empreendimentos e Participações and Gestora de Investimentos Ipanema
On July 5, 2017, Atual Companhia Securitizadora de Créditos Financeiros, a company wholly-owned by Banco Santander (Brasil) S.A., signed a purchase and sale agreement to acquire the equity portion corresponding to 70% of the shares representing the share capital of the companies Ipanema Empreendimentos e Participações Ltda., Gestora de Investimentos Ipanema Ltda. and Fundo Investimento Ipanema NPL V. The transaction was approved by Bacen on September 19, 2017 and, after fulfillment of other conditions precedent, the parties concluded the transaction on October 16, 2017.
BANCO SANTANDER (BRASIL) S.A.
NOTES TO THE CONSOLIDATED FINANCIAL STATEMENTS
(Thousands of Brazilian Reais - R$ - unless otherwise stated)
d) Incorporation of the Gestora de Inteligência de Crédito – Partnership between Banco Santander and others banks in the Brazilian market
On April 14, 2017, the definitive documents necessary for the creation of a new credit bureau, Gestora de Inteligência de Crédito SA ("Company"), were signed by the shareholders, whose control will be shared among the shareholders who will hold 20% of the its share capital each. The Company will develop a database with the objective of aggregating, reconciling and processing registration and credit information of individuals and legal entities, in accordance with the applicable standards, providing a significant improvement in the processes of granting, pricing and directing credit lines. The Bank estimates that the Company will be fully operational in 2019.
e) Partnership Formation with the Hyundai Group in Brazil
On April 28, 2016, the Aymoré CFI and Banco Santander entered into a transaction for the formation of a partnership with Hyundai Motor Brasil Mondadori de Automóveis Ltda. (Hyundai Motor Brasil) and Hyundai Capital Services, Inc. (Hyundai Capital) for the constitution of Banco Hyundai Capital Brasil S.A. and an insurance brokerage company to provide, respectively, auto finance and insurance brokerage services and products to clients and Hyundai dealerships in Brazil. The partnership capital structure will have a shareholding of 50% held by Aymoré CFI, 25% held by Hyundai Capital and 25% held by Hyundai Motor Brasil. Such partnership implementation shall be subject to the applicable regulatory approvals. In September 19, 2017, it was published on the Federal Official Diary the presidential decree recognizing the Brazilian government interest on the foreign participation in the national financial institution to be incorporated by Santander and Hyundai.
4. Change in the scope of consolidation
a) Sale of Santander Securities Services Brasil DTVM S.A.
On August 31, 2015 the sales transaction of the qualified custody business, with the sale of all shares issued by Santander Securities Services Brazil Distribuidora de Títulos e Valores Mobiliários S.A. to Santander Securities Services Brasil Participações S.A., indirectly controlled by Banco Santander Spain was concluded at the amount of R$859 million, according to what was informed to the market on June 19, 2014.
The transaction generated a gain of R$750,550 before taxes, recorded in the heading Result on disposal of assets not classified as non-current assets held for sale (Note 43).
The operation fits into the context of a global strategic partnership between Banco Santander Spain and a group led by Warburg Pincus LLC in qualified custody activity in Spain, Brazil and Mexico.
b) Investment in Super Pagamentos e Administração de Meios Eletrônicos Ltda. (“Super Pagamentos”)
On January 4, 2016, Aymoré CFI informed the owners of the shares representing the remaining 50% of Super´s total voting capital its decision to make the call related to the call option for the acquisition of such shares, for the value of approximately R$113 million. The transaction was concluded on March 10, 2016.
Due to the event above, Aymoré, as the parent company, purchased the remaining equity instruments of Super entity and should, therefore, consider the paid value of goodwill for expected future profitability as a reduction of shareholders’ equity, since, according to the IFRS 10 this transaction is characterized as transactions between partners. For the same reason, the amount paid for the equity value of the interest participation acquired from non-controlling shareholder is a movement among Stockholders’ Equity accounts.
c) Agreement on the Acquisition of part of the Financial Operation of PSA Group in Brazil and a consequent creation of a Joint Venture Company
On August 1, 2016, after the fulfillment of the applicable conditions precedent, including obtaining the appropriate regulatory approvals, the Aymoré CFI and Banco Santander, in the context of a partnership between the Banque PSA Finance (Banque PSA) and Santander Consumer Finance in Europe for joint operation of the vehicle financing business of PSA brands (Peugeot, Citroën and DS), signed definitive documents for the creation of a financial cooperation with Banque PSA to offer a range of financial and insurance products to clients and dealers of PSA in Brazil.
The main vehicle of financial cooperation is Banco PSA Finance Brasil S.A. which is being held in the proportion of 50% by Aymoré CFI, a subsidiary of Banco Santander, and 50% by Banque PSA. The purchase price was equal to the book value (proportional) on the closing date (08/01/2016). The operation also included the acquisition by Banco Santander subsidiary, of 100% of Santander Finance Arrendamento Mercantil S.A (Current Company Name of PSA Finance Arrendamento Mercantil S.A.), whose price was equivalent to 74% of the equity (equal to the book value) on the closing date, and also the purchase of 50% of PSA Corretora de Seguros e Serviços Ltda., whose price was equal to the book value (proportional) on the closing date.
Banco Santander started to consolidate these companies from August 1, 2016.
BANCO SANTANDER (BRASIL) S.A.
NOTES TO THE CONSOLIDATED FINANCIAL STATEMENTS
(Thousands of Brazilian Reais - R$ - unless otherwise stated)
d) Investment Agreement between Banco Santander and Banco Bonsucesso S.A. (current Olé Consignado)
On February 10, 2015, with the approval of BACEN, the transaction was completed and Banco Santander, through Aymoré CFI, became the controlling shareholder of Olé Consignado, with 60% of the total and voting share capital through an investment of R$460 million. Olé Consignado kept the remaining portion of the share capital (40%).
In December 2015, it has completed the study of the allocation of the purchase price (Purchase Price Allocation - PPA) on the acquisition of Bonsucesso by Aymoré, based on acquisition date as below:
| | Book value | Fair value |
| Financial assets - available-for-sale | 121,468 | 121,468 |
| Loans and Receivables | 508,147 | 508,147 |
| Others Assets | 374,151 | 374,151 |
| Intangible Assets(1) | - | 62,000 |
| Total assets | 1,003,766 | 1,065,766 |
| Financial liabilities | 466,162 | 466,162 |
| Others liabilities | 397,604 | 397,604 |
| Total liabilities | 863,766 | 863,766 |
| Capital increase by Aymore CFI | 460,000 | 460,000 |
| Total of net assets acquired | 600,000 | 662,000 |
| Non-controlling interest(2) | | 264,800 |
| Total consideration transferred by Aymore to acquire control | | 460,000 |
| Goodwill(3) | | 62,800 |
| (1) | Intangible assets identified relate to brand and client relationship with estimated useful life of 10 years and 4 years, respectively. |
| (2) | The amount of non-controlling interests were measured at R$240 million as the proportional value of the net assets of the investee. |
| (3) | Goodwill will be tax deductible under current legislation. |
Olé Consignado has become the exclusive vehicle of Banco Bonsucesso and its affiliates for the payroll credit supply in Brazil and should consolidate existing payroll loans portfolio in Banco Santander and Banco Bonsucesso, in accordance with the terms of the agreement. Banco Santander will continue to originate payroll loans through their own channels independently.
In the operation context, it was granted between institutions a put option (right of Olé Consignado to sell) and purchase (right of Banco Santander to acquire), relating to the shares held by Banco Bonsucesso, equivalent to 40% of the share capital of this company. According to IAS 32,a financial liability was recognized, the balance of which on December 31, 2017of R$484 million (2016 and 2015 - R$307 million) by the commitment made in relation to the put option, accounted in Shareholders’ Equity, the amount of R$67 million, non-controlling interests, the amount of R$240 million. In 2017, a tax credit of R$71 million was recognized and an expense in the consolidated statements of income, in the amount of R$177 million.
At the ESM held on March 3, 2016 the change of the corporate name of Banco Bonsucesso Consignado S.A. to Banco Olé Bonsucesso Consignado S.A. was approved, the process was approved by Bacen on June 1, 2016.
5. Cash and balances with the Brazilian Central Bank
| Thousand of reais | 2017 | 2016 | 2015 |
| Cash and cash equivalents | 5,242,869 | 4,445,940 | 7,141,137 |
| of which: | | | |
| Cash | 4,569,443 | 3,316,800 | 2,995,112 |
| Money market investments | 673,426 | 1,129,140 | 4,146,025 |
| Money market investments (1) | 33,158,095 | 45,242,674 | 27,170,892 |
| Central Bank compulsory deposits (2) | 62,465,117 | 60,916,297 | 54,831,324 |
| Total | 100,866,081 | 110,604,911 | 89,143,353 |
| (1) | Includes securities purchased under agreements to resell, long term and not considered cash equivalents. |
| (2) | Central Bank compulsory deposits relate to a minimum balance that financial institutions are required to maintain with Bacen based on a percentage of deposits received from third parties, considered as restricted use of resources. |
6. Loans and amounts due from credit institutions
The breakdown, by classification, type and currency, of the balances of “Loans and amounts due from credit institutions” in the consolidated financial statements is as follows:
| Thousand of reais | 2017 | 2016 | 2015 |
| Classification: | | | |
| Loans and receivables | 32,300,095 | 27,762,473 | 42,422,638 |
| Of which: | | | |
| Loans and amounts due from credit institutions, gross | 32,369,110 | 27,963,914 | 42,601,397 |
BANCO SANTANDER (BRASIL) S.A.
NOTES TO THE CONSOLIDATED FINANCIAL STATEMENTS
(Thousands of Brazilian Reais - R$ - unless otherwise stated)
| Thousand of reais | 2017 | 2016 | 2015 |
| Impairment losses (note 10.c) | (69,015) | (201,441) | (178,759) |
| Loans and amounts due from credit institutions, net | 32,300,095 | 27,762,473 | 42,422,638 |
| Loans and amounts due from credit institutions, gross | 32,369,110 | 27,963,914 | 42,601,397 |
| | | | |
| Thousand of reais | 2017 | 2016 | 2015 |
| Type: | | | |
| Time deposits(2) | 4,236,990 | 2,070,151 | 3,626,514 |
| Reverse repurchase agreements(1) (2) | 270,735 | 848,096 | 152,870 |
| Escrow deposits | 10,136,079 | 9,836,300 | 9,493,169 |
| Cash and Foreign currency investments(2) | 15,981,475 | 13,194,923 | 24,057,973 |
| Other accounts | 1,743,831 | 2,014,444 | 5,270,871 |
| Total | 32,369,110 | 27,963,914 | 42,601,397 |
| Currency: | | | |
| Brazilian Real | 17,004,884 | 25,421,465 | 18,631,226 |
| US dollar | 15,044,088 | 1,658,980 | 23,607,170 |
| Euro | 307,633 | 779,314 | 323,053 |
| Pound sterling | 3,585 | 51,972 | 4,964 |
| Other currencies | 8,920 | 52,183 | 34,984 |
| Total | 32,369,110 | 27,963,914 | 42,601,397 |
| | | | |
| Thousand of reais | 2017 | 2016 | 2015 |
| | | | |
| Cash equivalents (2): | | | |
| Short-term transactions and low risk of change in its value | 17,428,033 | 13,683,641 | 25,990,477 |
(1) Collateralized by debt instruments.
Note 45-d contains a detail of the residual maturity periods of loans and receivables.
7. Debt instruments
The breakdown, by classification, type and currency, of the balances of “Debt instruments” is as follows:
| Thousand of reais | 2017 | 2016 | 2015 |
| Classification: | | | |
| Financial assets held for trading | 34,879,681 | 59,994,946 | 25,193,598 |
| Other Financial assets designated at fair value through profit or loss | 1,658,689 | 1,668,749 | 1,506,570 |
| Financial assets - available-for-sale | 84,716,747 | 55,829,572 | 67,103,274 |
| Investments Held-to-Maturity | 10,214,454 | 10,048,761 | 10,097,836 |
| Loans and receivables | 17,616,515 | 16,283,259 | 11,812,701 |
| Of which: | | | |
| Debt Instruments | 20,400,082 | 17,838,162 | 11,957,161 |
| Impairment losses | (2,783,567) | (1,554,903) | (144,460) |
| Total | 149,086,086 | 143,825,287 | 115,713,979 |
| Type: | | | |
| Government securities - Brazil (1) | 122,362,389 | 122,971,854 | 93,439,724 |
| Debentures and Promissory notes | 12,097,230 | 12,922,763 | 11,967,222 |
| Other debt securities | 14,626,467 | 7,930,670 | 10,307,033 |
| Total | 149,086,086 | 143,825,287 | 115,713,979 |
| Currency: | | | |
| Brazilian Real | 137,420,134 | 134,037,665 | 109,836,568 |
| US dollar | 11,665,952 | 9,107,513 | 5,111,982 |
| Euro | - | 680,109 | 765,429 |
| Total | 149,086,086 | 143,825,287 | 115,713,979 |
(1) Includes, substantially, National Treasury Bills (LTN), Treasury Bills (LFT) National Treasury Notes (NTN-A, NTN-B, NTN-C e NTN-F).
The Debts Instruments are composed, mainly, of R$77,781,728 (2016 - R$71,810,310 and 2015 - R$58,958,355) of debt securities relating to repurchase agreements, R$2,305,158 (2016 - R$3,044,896 and 2015 - R$6,216,315) to compulsory deposits in Central Bank, R$6,273,561 (2016 - R$6,221,046 and 2015 - R$10,197,025) to guarantee of B3 S.A. - Brasil, Bolsa, Balcão (B3 S.A.) (Current Company Name of BM&FBovespa - Bolsa de Valores, Mercadorias e Futuros (BM&FBovespa)) transactions and R$4,473,298 (2016 - R$5,358,604 and 2015 - R$4,939,160) to escrow deposits and other guarantee.
Note 45-d contains a detail of the residual maturity periods of available-for-sale financial assets and of loans and receivables.
BANCO SANTANDER (BRASIL) S.A.
NOTES TO THE CONSOLIDATED FINANCIAL STATEMENTS
(Thousands of Brazilian Reais - R$ - unless otherwise stated)
8. Equity instruments
a) Breakdown
The breakdown, by classification and type, of the balances of “Equity instruments” is as follows:
| Thousand of reais | 2017 | 2016 | 2015 |
| Classification: | | | |
| Financial assets held for trading | 489,770 | 398,461 | 404,973 |
| Other Financial assets designated at fair value through profit or loss | 33,368 | 42,455 | 573,664 |
| Financial assets available-for-sale | 1,106,637 | 1,985,473 | 1,162,332 |
| Total | 1,629,775 | 2,426,389 | 2,140,969 |
| Type: | | | |
| Shares of Brazilian companies | 389,113 | 1,185,653 | 1,168,186 |
| Shares of foreign companies | 5,347 | 3,588 | 11,445 |
| Investment funds(1) | 1,235,315 | 1,237,148 | 961,338 |
| Total | 1,629,775 | 2,426,389 | 2,140,969 |
(1) Composed mainly by investment on fixed income investment funds.
b) Changes
The changes in the balance of “Equity instruments – Financial assets held for trading” were as follows:
| Thousand of reais | 2017 | 2016 | 2015 |
| Balance at beginning of year | 398,461 | 404,973 | 391,656 |
| Net additions (disposals) | (4,892) | (7,125) | 26,273 |
| Valuation adjustments | 96,201 | 613 | (12,956) |
| Balance at end of year | 489,770 | 398,461 | 404,973 |
The changes in the balance of “Equity instruments – Other financial assets at fair value through profit or loss” were as follows:
| Thousand of reais | 2017 | 2016 | 2015 |
| Balance at beginning of year | 42,455 | 573,664 | 902,794 |
| Net additions (disposals) | (1,586) | (531,209) | (318,307) |
| Valuation adjustments | (7,501) | - | (10,823) |
| Balance at end of year | 33,368 | 42,455 | 573,664 |
The changes in the balance of “Equity instruments – Available-for-sale financial assets” were as follows:
| Thousand of reais | 2017 | 2016 | 2015 |
| Balance at beginning of year | 1,985,473 | 1,162,332 | 1,653,644 |
| Net additions (disposals) | (830,395) | 852,820 | (482,406) |
| Valuation adjustments | (48,441) | (29,679) | (8,906) |
| Balance at end of year | 1,106,637 | 1,985,473 | 1,162,332 |
9. Derivative financial instruments and Short positions
The main risk factors associated to derivatives contracted are related to exchange rates, interest rates and stocks. To manage these and other market risk factors the Bank uses practices which include the measurement and follow up of the limit´s usage previously defined on internal committees, as well as the daily follow up of the portfolios values in risk, sensitivities and changes in the interest rate and exchange exposure, liquidity gaps, among other practices which allow the control and follow up on the main risk metrics that can affect the Bank´s position in the several markets which it acts. Based on this management model the Bank has accomplished its goal, using operations with derivatives, in optimize the relation risk/benefits even in situation with great volatility.
The derivatives fair value is determined through quotation of market prices. The swaps contracts fair value is determined using discounted cash flow modeling techniques, reflecting suitable risk factors. The fair value of NDF and Future contracts are also determined based on the quotation of market prices for derivatives traded in specific chamber (i.e.. stock Exchange for example) or using the same methodology applied for swap contracts. The fair value of options derivatives (call and put) is determined based on the mathematical models, such as Black & Scholes, using yield rates, implied volatilities and the fair value of the corresponding asset. The current market prices are used to price the volatilities. For the derivatives which do not have prices directly disclosed by specific chamber, their fair values are obtained through pricing models which use market information, based on disclosed prices of more liquid assets. Interest rate curves and market volatilities are extracted from these prices to be used as first input in these models.
BANCO SANTANDER (BRASIL) S.A.
NOTES TO THE CONSOLIDATED FINANCIAL STATEMENTS
(Thousands of Brazilian Reais - R$ - unless otherwise stated)
a) Trading and hedging derivatives
a.1) Derivatives Recorded in the Balance Sheet and Compensation Accounts
Portfolio Summary of Trading Derivative and Used as Hedge
| | 2017 | 2016 | 2015 |
| Assets | | | |
| Swap Differentials Receivable | 15,781,207 | 15,321,646 | 22,312,106 |
| Option Premiums to Exercise | 553,217 | 935,520 | 895,684 |
| Forward Contracts and Others | 928,464 | 8,445,807 | 3,042,572 |
| Total | 17,262,888 | 24,702,973 | 26,250,362 |
| Liabilities | | | |
| Swap Differentials Payable | 14,643,016 | 12,267,819 | 20,154,760 |
| Option Premiums Launched | 385,183 | 1,166,002 | 827,757 |
| Forward Contracts and Others | 1,649,287 | 6,802,794 | 3,734,442 |
| Total | 16,677,486 | 20,236,615 | 24,716,959 |
Summary by Category
| Trading | 2017 | 2016 | 2015 |
| | | | |
| | Notional | Fair Value | Notional | Fair Value | Notional | Fair Value |
| "Swap" | | 1,108,760 | | 3,142,125 | | 3,221,966 |
| Assets | 202,081,214 | 57,294,179 | 196,887,188 | 24,311,485 | 315,466,085 | 38,512,406 |
| CDI (Interbank Deposit Rates) | 33,289,522 | 22,409,496 | 44,868,680 | 22,759,822 | 38,808,344 | 9,081,792 |
| Fixed Interest Rate - Real | 95,700,715 | - | 126,300,261 | - | 200,528,046 | - |
| Indexed to Price and Interest Rates | 5,592,892 | - | 9,225,789 | - | 15,491,509 | 6,421,310 |
| Foreign Currency | 67,493,635 | 34,884,683 | 16,492,458 | 1,551,663 | 60,626,540 | 23,009,304 |
| Others | 4,450 | - | - | - | 11,646 | - |
| Liabilities | 199,709,355 | (56,185,419) | 184,350,947 | (21,169,360) | 295,696,266 | (35,290,440) |
| CDI (Interbank Deposit Rates) | 16,664,176 | - | 23,178,722 | - | 32,000,584 | - |
| Fixed Interest Rate - Real | 114,055,076 | (21,687,884) | 133,185,717 | (17,414,147) | 218,588,847 | (35,280,694) |
| Indexed to Price and Interest Rates | 40,146,968 | (34,107,210) | 12,767,212 | (3,518,297) | 6,930,103 | - |
| Foreign Currency | 28,420,467 | - | 15,049,776 | (38,836) | 38,176,732 | (9,746) |
| Others | 422,668 | (390,325) | 169,520 | (198,080) | - | - |
| Options | 190,061,609 | 168,034 | 175,841,405 | (230,482) | 91,877,351 | 67,927 |
| Purchased Position | 87,503,833 | 553,217 | 83,883,966 | 935,520 | 46,024,648 | 895,684 |
| Call Option - US Dollar | 9,369,821 | 169,542 | 12,693,748 | 181,463 | 5,018,652 | 665,655 |
| Put Option - US Dollar | 5,130,392 | 42,389 | 3,788,161 | 392,048 | 2,735,625 | 31,520 |
| Call Option - Other | 1,953,481 | 59,220 | 20,115,932 | 62,517 | 14,106,701 | 113,809 |
| Interbank Market | 1,185,310 | 389 | 17,391,500 | 7,062 | 13,114,822 | 93,435 |
| Others(1) | 768,171 | 58,831 | 2,724,432 | 55,455 | 991,879 | 20,374 |
| Put Option - Other | 71,050,139 | 282,066 | 47,286,125 | 299,492 | 24,163,670 | 84,700 |
| Interbank Market | 70,295,282 | 257,943 | 46,106,600 | 18,029 | 23,350,994 | 4,558 |
| Others(1) | 754,857 | 24,123 | 1,179,525 | 281,463 | 812,676 | 80,142 |
| Sold Position | 102,557,776 | (385,183) | 91,957,439 | (1,166,002) | 45,852,703 | (827,757) |
| Call Option - US Dollar | 5,595,163 | (117,059) | 4,314,988 | (141,172) | 3,331,244 | (596,729) |
| Put Option - US Dollar | 5,919,598 | (77,145) | 7,390,733 | (952,407) | 4,402,202 | (73,815) |
| Call Option - Other | 19,880,180 | (35,961) | 30,441,646 | (46,940) | 14,567,407 | (122,683) |
| Interbank Market | 19,151,110 | (515) | 27,597,764 | (4,087) | 13,730,262 | (112,707) |
| Others(1) | 729,070 | (35,446) | 2,843,882 | (42,853) | 837,145 | (9,976) |
| Put Option - Other | 71,162,835 | (155,018) | 49,810,072 | (25,483) | 23,551,850 | (34,530) |
| Interbank Market | 70,494,622 | (126,743) | 49,245,495 | (5,793) | 23,218,228 | (1,615) |
| Others(1) | 668,213 | (28,275) | 564,577 | (19,690) | 333,622 | (32,915) |
| Futures Contracts | 161,725,596 | - | 104,651,180 | - | 184,191,204 | - |
| Purchased Position | 54,806,022 | - | 40,396,456 | - | 41,186,341 | - |
| Exchange Coupon (DDI) | 9,616,936 | - | 14,473,180 | - | 4,274,352 | - |
| Interest Rates (DI1 and DIA) | 26,456,303 | - | 23,756,523 | - | 22,760,484 | - |
| Foreign Currency | 16,733,437 | - | 1,393,538 | - | 11,710,934 | - |
| Indexes(2) | 1,780,311 | - | 195,160 | - | 577,149 | - |
| Others | 219,035 | - | 578,055 | - | 1,863,422 | - |
| Sold Position | 106,919,574 | - | 64,254,724 | - | 143,004,863 | - |
| Exchange Coupon (DDI) | 55,016,928 | - | 15,048,490 | - | 58,499,504 | - |
| Interest Rates (DI1 and DIA) | 51,135,994 | - | 29,047,678 | - | 20,836,314 | - |
| Foreign Currency | 745,849 | - | 17,384,256 | - | 35,463,589 | - |
| Indexes(2) | 20,803 | - | 185,506 | - | 500,993 | - |
| Treasury Bonds/Notes | - | - | 2,588,794 | - | 49,163 | - |
| Others | - | - | - | - | 27,655,300 | - |
| Forward Contracts and Others | 47,823,561 | (720,823) | 50,853,154 | 1,643,013 | 51,051,014 | (691,870) |
| Purchased Commitment | 23,506,096 | 647,376 | 20,864,170 | 3,386,347 | 21,570,405 | 3,028,038 |
BANCO SANTANDER (BRASIL) S.A.
NOTES TO THE CONSOLIDATED FINANCIAL STATEMENTS
(Thousands of Brazilian Reais - R$ - unless otherwise stated)
| Trading | 2017 | 2016 | 2015 |
| | | | |
| | Notional | Fair Value | Notional | Fair Value | Notional | Fair Value |
| Currencies | 21,525,220 | 618,007 | 19,951,984 | 3,391,275 | 21,570,405 | 2,690,632 |
| Others | 1,980,876 | 29,369 | 912,186 | (4,928) | - | 337,406 |
| Sold Commitment | 24,317,465 | (1,368,199) | 29,988,984 | (1,743,334) | 29,480,609 | (3,719,908) |
| Currencies | 22,096,104 | (1,364,617) | 29,911,406 | (1,826,965) | 29,140,219 | (3,382,384) |
| Others | 2,221,361 | (3,582) | 77,578 | 83,631 | 340,390 | (337,524) |
(1) Includes index options, mainly, options involving DI and CDI and shares.
(2) Includes Bovespa index and S&P.
a.2) Derivatives Financial Instruments by Counterparty
| Notional | | | | 2017 |
| | Customers | Related Parties | Financial Institutions(1) | Total |
| "Swap" | 32,912,721 | 19,599,395 | 149,569,098 | 202,081,214 |
| Options | 11,263,513 | 1,240,309 | 177,557,787 | 190,061,609 |
| Futures Contracts | - | - | 161,725,596 | 161,725,596 |
| Forward Contracts and Others | 25,470,287 | 18,816,991 | 3,536,283 | 47,823,561 |
(1) Includes trades with B3 S.A. (Current Company Name of BM&FBovespa) and other securities and commodities exchanges.
| Notional | | | | 2016 | 2015 |
| | Customers | Related Parties | Financial Institutions(1) | Total | Total |
| "Swap" | 43,082,605 | 15,910,871 | 137,893,712 | 196,887,188 | 315,466,085 |
| Options | 5,916,105 | 839,182 | 169,086,118 | 175,841,405 | 91,877,351 |
| Futures Contracts | - | - | 104,651,180 | 104,651,180 | 184,191,204 |
| Forward Contracts and Others | 29,044,676 | 17,563,319 | 4,245,159 | 50,853,154 | 51,051,014 |
(1) Includes trades with B3 S.A. (Current Company Name of BM&FBovespa) and other securities and commodities exchanges.
a.3) Derivatives Financial Instruments by Maturity
| Notional | | | | 2017 |
| | Up to 3 Months | From 3 to 12 Months | Over 12 Months | Total |
| "Swap" | 20,705,247 | 51,021,102 | 130,354,865 | 202,081,214 |
| Options | 46,139,545 | 89,403,700 | 54,518,364 | 190,061,609 |
| Futures Contracts | 65,489,476 | 55,490,159 | 40,745,961 | 161,725,596 |
| Forward Contracts and Others | 25,015,557 | 14,250,495 | 8,557,509 | 47,823,561 |
| Notional | | | | 2016 | 2015 |
| | Up to 3 Months | From 3 to 12 Months | Over 12 Months | Total | Total |
| "Swap" | 17,499,576 | 26,810,380 | 152,577,232 | 196,887,188 | 315,466,085 |
| Options | 10,785,982 | 10,624,762 | 154,430,661 | 175,841,405 | 91,877,351 |
| Futures Contracts | 66,298,799 | 16,041,642 | 22,310,739 | 104,651,180 | 184,191,204 |
| Forward Contracts and Others | 28,235,186 | 17,826,727 | 4,791,241 | 50,853,154 | 51,051,014 |
a.4) Derivatives by Market Trading
| Notional | Stock Exchange(1) | Over the Counter | 2017 Total |
| "Swap" | 67,112,505 | 134,968,709 | 202,081,214 |
| Options | 172,144,700 | 17,916,909 | 190,061,609 |
| Futures Contracts | 161,725,596 | - | 161,725,596 |
| Forward Contracts and Others | 395,212 | 47,428,349 | 47,823,561 |
(1) Includes trades with B3 S.A. (Current Company Name of BM&FBovespa) and with Cetip, derived from its incorporation by B3.
| Notional | Stock Exchange(1) | Cetip(2) | Over the Counter | 2016 Total | 2015 Total |
| "Swap" | 133,759,441 | 61,856,098 | 1,271,649 | 196,887,188 | 315,466,085 |
| Options | 166,899,868 | 8,234,147 | 707,390 | 175,841,405 | 91,877,351 |
| Futures Contracts | 104,651,180 | - | - | 104,651,180 | 184,191,204 |
| Forward Contracts and Others | - | 35,427,573 | 15,425,581 | 50,853,154 | 51,051,014 |
(1) Includes trades with B3 S.A. (Current Company Name of BM&FBovespa) and with Cetip, derived from its incorporation by B3.
(2) Includes amounts traded on other clearing houses.
BANCO SANTANDER (BRASIL) S.A.
NOTES TO THE CONSOLIDATED FINANCIAL STATEMENTS
(Thousands of Brazilian Reais - R$ - unless otherwise stated)
a.5) Hedge Accounting
There are three types of hedge accounting: Fair Value Hedge, Cash Flow Hedge and Foreign Currency Investments Hedge.
Fair Value Hedge
Banco Santander’s fair value strategy consists of hedging the exposure to changes in fair value related to recognized assets and liabilities.
The adopted fair value management methodology segregates transactions by risk factor (e.g. Real/Dollar foreign exchange risk, fixed Reais interest rate risk, Dollar foreign exchange coupon risk, inflation risk, interest rate risk, etc.). The transactions generate exposures that are consolidated by risk factor and compared with internal pre-established limits.
In order to hedge the changes of fair value in receivables and interest payments, Santander uses interest rate Swap contracts related to pre-fixed assets and liabilities.
Banco Santander applies fair value hedge as follows:
• It buys Foreign Currency + Coupon against % CDI swaps (sold jointly to the client) and designates them as a derivative instrument in a Hedge Accounting structure, having foreign currency loans as the hedged item. The operations were designated in January 2016 and its maturity is between January 2017 and 2021.
• Banco Santander has a portfolio of loan assets issued in foreign currency - Dollar at a fixed rate in the Balance Sheet of the “Santander EFC” (subsidiary in Spain), which operations are registered in euro. In order to manage this mismatch, the Bank designates each Foreign Currency Floating EUR X Fixed Dollar swap as the fair value hedge of the corresponding loan. The hedging operations were designated in 2013 and the related Swaps will mature between June 2017 and 2020.
• Banco Santander has a portfolio of Euro-indexed Assets traded in Cayman subsidiary. For this portfolio, the value of the asset in Euro will be converted into Dollar at the agreed exchange rate, on the recording date of the transaction. After the conversion, the principal, already denominated in Dollar will be restated by % CDI or a pre-fixed rate. The Assets will be covered by Cross Currency Swaps in order to transfer the risk in Dollar to LIBOR + Coupon. The hedging operations were designated in February 2017 and will mature between February 2017 and 2024.
• Banco Santander has a portfolio of Reais-indexed Assets traded in Cayman subsidiary. For this portfolio, the value of the Dollar asset will be converted into Reais at the exchange rate agreed on the recording date of the transaction. After the conversion, the principal, already denominated in Reais will be restated by % CDI or a pre-fixed rate. The Assets will be covered by Cross Currency Swaps in order to transfer the risk in Reais to LIBOR + Coupon. The hedging operations were designated in January 2016 and will mature between January 2017 and 2021.
Santander Arrendamento Mercantil (Leasing) has a portfolio of public securities indexed by Predefined interest rate Brazilian Treasury Bonds (NTN-F). The Bank designates each CDI versus Pre-defined interest rate swap contract as the fair value hedge of the corresponding asset. The hedging operations were designated in October 2017 and will mature between January 2018 and 2021.
• Banco Santander has a portfolio of public securities indexed by Predefined interest rate Brazilian Treasury Bonds (LTN/NTN-F) and designate them as fair value hedge objects. These assets will be hedged by Future Contracts (derivatives indexed by DI1 – B3/BM&F) with the objective to swap the Predefined interest rate risk to floating CDI risk. The hedge operations were designated in March 2017 and will mature between January 2018 and 2027.
In order to assess the effectiveness and measure the ineffectiveness of the strategies, the institution complies with international accounting standard IAS 39, which requires that the effectiveness test be performed at the beginning (prospective test) of the hedge structure and be repeated periodically (prospective and retrospective tests) in order to demonstrate that the hedge ratio remains effective.
a) Prospective test:In accordance with the standard, the prospective test must be performed on the inception date and on a quarterly basis in order to demonstrate that the expectations regarding the effectiveness of the hedge ratio are high.
a.1) Initial prospective test : it is restricted to a qualitative review of the critical terms and conditions of the hedge instrument and the hedged item in order to conclude whether changes in the fair value of both instruments are expected to fully offset each other.
a.2) Periodic prospective test: the sensitivity of the fair value of the hedged item and the hedging instrument will be periodically computed at a parallel variation of 10 basis points in the interest rate curve. For the purposes of effectiveness, these two sensitivity ratios should be between 80% and 125%.
b) Retrospective test:the retrospective effectiveness test will be performed by comparing the MTM change of the hedge instrument since the inception date with the MTM change of the hedged object since the inception date, excluding the transaction’s liquidity and credit spread:
BANCO SANTANDER (BRASIL) S.A.
NOTES TO THE CONSOLIDATED FINANCIAL STATEMENTS
(Thousands of Brazilian Reais - R$ - unless otherwise stated)
In fair value hedges, gains or losses, both on hedge instruments and hedge objects (attributable to the type of risk being hedged) are recognized directly in the consolidated income statement.
The linear regression model of the daily results and coefficient of determination for both tests (prospective and regressive) was used to evaluate the effectiveness and to measure the ineffectiveness of the Government Securities Bonds (LTN / NTN-F), demonstrating that the hedge remains effective.
| | 2017 | 2016 | 2015 |
| Hedge Structure | Effective Portion Accumulated | Portion Ineffective | Effective Portion Accumulated | Portion Ineffective | Effective Portion Accumulated | Portion Ineffective |
| Fair Value Hedge | | | | | | |
| Debentures | - | - | - | - | 10,502 | - |
| Brazilian Treasury Bonds (LTN, NTN-F) | (388,446) | - | - | - | - | - |
| Eurobonds | - | - | 13,163 | - | 2,051 | - |
| Bonds (LEA) | (1,200) | - | - | - | - | - |
| NCE | - | - | - | - | 53,131 | - |
| Resolution 2770 | 304 | - | - | - | 35,338 | - |
| Trade Finance Off | (57,386) | - | 20,471 | - | 11,046 | - |
| Total | (446,728) | - | 33,634 | - | 112,068 | - |
| | 2017 | 2016 | 2015 |
| | Adjustment to Market | Fair Value | Adjustment to Market | Fair Value | Adjustment to Market | Fair Value |
| Hedge Instruments | | | | | | |
| Swap Contracts | (95,672) | (130,683) | (26,703) | (136,467) | (66,990) | 86,822 |
| Assets | 12,954 | 3,005,666 | 11,486 | 1,046,012 | 57,829 | 7,130,753 |
| CDI (Interbank Deposit Rates)(5) | (357) | 1,818,366 | - | - | 4,376 | 1,783,075 |
| Fixed Interest Rate - Real | - | - | - | - | 27,184 | 3,549,659 |
| Indexed to Foreign Currency - Pre Dollar(1) | 320 | 8,742 | 1,103 | 17,678 | 790 | 94,472 |
| Indexed to Foreign Currency - USD/BRL - Dollar(2)(3) (4) | (23,585) | 691,872 | (8,957) | 744,260 | (10,904) | 665,025 |
| Indexed to Foreign Currency - Libor - Dollar | - | - | - | - | 1,962 | 612,623 |
| Indexed to Foreign Currency - Swiss Franc | - | - | - | - | - | - |
| Indexed to Foreign Currency - Euro(6)(7) | 36,576 | 486,686 | 19,340 | 284,074 | 34,347 | 390,156 |
| Indexed to Foreign Currency - Pre YEN | - | - | - | - | 74 | 35,743 |
| Liabilities | (108,626) | (3,136,349) | (38,189) | (1,182,479) | (124,819) | (7,043,931) |
| Indexed to Foreign Currency - US Dollar(6) | (20,109) | (261,915) | (14,958) | (323,197) | (55,892) | (1,082,503) |
| Indexed Indices of Prices and Interest | - | - | - | - | (30,982) | (831,156) |
| Indexed to Foreign Currency - Pre Dollar(5) | (16,303) | (225,857) | (1,103) | (17,676) | - | - |
| CDI (Interbank Deposit Rates)(1)(2) | (21,380) | (474,398) | (18,395) | (804,059) | (12,298) | (3,279,438) |
| Indexed to Foreign Currency - Libor - US Dollar | - | - | - | - | (61) | (41,513) |
| Fixed Interest Rate - Real(3) (8) | 22 | (1,640,708) | (3,733) | (37,547) | (25,586) | (1,809,321) |
| Indexed to Foreign Currency - Colombian Peso(7) | (13,863) | (219,392) | - | - | - | - |
| Indexed to Foreign Currency - Pre Euro(4) | (36,993) | (314,079) | - | - | - | - |
| Object of Hedge | | | | | | |
| Assets | 77,623 | 3,126,828 | 23,165 | 693,132 | 110,003 | 3,103,783 |
| Loans and Receivables | 79,496 | 1,382,326 | 23,165 | 693,132 | 94,104 | 2,218,727 |
| Indexed to Foreign Currency - US Dollar(6) | 4,319 | 288,420 | 4,809 | 323,780 | 42,348 | 1,295,383 |
| Indexed to Foreign Currency - Pre Dollar(5) | 16,416 | 224,943 | - | - | - | - |
BANCO SANTANDER (BRASIL) S.A.
NOTES TO THE CONSOLIDATED FINANCIAL STATEMENTS
(Thousands of Brazilian Reais - R$ - unless otherwise stated)
| | 2017 | 2016 | 2015 |
| | Adjustment to Market | Fair Value | Adjustment to Market | Fair Value | Adjustment to Market | Fair Value |
| Indexed Indices of Prices and Interest(2) | - | - | - | - | 52,984 | 916,765 |
| CDI (Interbank Deposit Rates) | 16,401 | 352,071 | 13,253 | 331,805 | - | - |
| Fixed Interest Rate - Real(3) | 3,900 | 21,077 | 5,103 | 37,547 | (1,228) | 6,579 |
| Indexed to Foreign Currency - Colombian Peso(7) | (2,898) | 173,990 | - | - | - | - |
| Indexed to Foreign Currency - Pre Euro(4) | 41,358 | 321,825 | - | - | - | - |
| Debt instruments | (1,873) | 1,744,502 | - | - | 15,899 | 885,056 |
CDI (Interbank Deposit
Rates)(1)(2) | 354 | 119,892 | - | - | 10,578 | 503,415 |
| Fixed Interest Rate - Real(3) | 91 | 6,082 | - | - | 5,321 | 381,641 |
| National Treasury Notes - NTN F(9) | (2,318) | 1,618,529 | - | - | - | - |
| Liabilities | - | - | 12,830 | (803,929) | (8,383) | (3,520,951) |
| Foreign Borrowings | - | - | 12,830 | (803,929) | (8,342) | (3,485,167) |
| Indexed to Foreign Currency - US Dollar(2) | - | - | 12,830 | (803,929) | (8,342) | (3,485,167) |
| Marketable debt securities | - | - | - | - | (41) | (35,784) |
| Eurobonds | - | - | - | - | (41) | (35,784) |
| Hedge Instruments | | | | | | 12/31/2017 Reference Value |
| Swap Contracts(8) | | | | | | 22,206,615 |
| Interest Rate (DI1 and DIA) | | | | | | 22,206,615 |
| | | | | | | 12/31/2017 |
| | | | | | Adjustment to Market | Fair Value |
| Object of Hedge | | | | | | |
| Assets | | | | | 364,434 | 24,779,831 |
| Securities - Available for Sale | | | | | | |
| Government Securities(8) | | | | | 364,434 | 24,779,831 |
| National Treasury Bills - LTN | | | | | 219,611 | 13,893,932 |
| National Treasury Notes - NTN F | | | | | 144,823 | 10,885,899 |
| (1) | Passive instruments whose hedged items are securities represented by promissory notes indexed in Certificates of Interbank Deposits (CDI) with market value of R$109,538 (12/31/2016 - R$108,845). |
| (2) | These are passive instruments whose hedge items are credit operations and securities represented by promissory notes indexed in interbank deposit certificates (CDI), with market value of credit operations of R$352,071 and promissory notes of R$10,354 (12/31/2016 - R$108,844 and 12/31/2015 - 381,641) and on December 31, 2017 assets instruments whose hedged items are foreign currency indexed bonds denominated in foreign currency - US dollar in the market value of R$803,929 (12/31/2016 - 803,929). |
| (3) | These are passive instruments whose hedged items are securities and securities represented by promissory notes indexed to Real interest rates with market value of R$6,082 (12/31/2016 - R$37,547 and 12/31/2015 - R$6,579) and credit operations in the amount of R$21,077. |
| (4) | These are passive instruments whose hedged items are credit operations indexed in foreign currency - euro at the market value of R$321,825. |
| (5) | These are passive instruments whose hedged items are credit operations indexed in foreign currency - US dollar in the market value of R$224,943. |
| (6) | These are passive instruments whose hedge items are credit operations indexed in foreign currency - US dollar with a market value of R$288,420 (12/31/2016 - R$323,782). |
| (7) | These are passive instruments whose hedged items are credit operations indexed in foreign currency - Colombian peso with market value of R$173,990. |
| (8) | These are obligations over instruments whose hedged items are pre-fixed government securities with a market value of R$1,618,529. |
| (9) | Current value of the instruments as of December 31, 2017 is R22,206,615. |
Cash Flow Hedge
Banco Santander’s cash flow hedge strategies consist of hedging exposure to changes in cash flows, interest payments and the exchange rate, which are attributable to changes in the interest rates related to recognized assets and liabilities and changes in the exchange rate of non-recognized assets and liabilities.
BANCO SANTANDER (BRASIL) S.A.
NOTES TO THE CONSOLIDATED FINANCIAL STATEMENTS
(Thousands of Brazilian Reais - R$ - unless otherwise stated)
Banco Santander applies cash flow hedges as follows:
• Fixed Dollar Liabilities and Reais asset swaps and designates them as instruments in a Cash Flow Hedge structure, having loans indexed in Reais with third-parties established at the Cayman Islands as the hedged objects. The hedging operations were designated in January 2016 and will mature between January 2017 and 2021.
• USD futures or DDI + DI Futures (Synthetic Dollar Futures) and designates them as instruments in a Cash Flow Hedge structure, having part of its dollar Loan portfolio as the hedged objects. The hedging operations were designated in 2007 and will mature between January 2017 and 2025.
• Fixed Dollar Asset and Floating Reais Liability swaps and designates them as instruments in a Cash Flow Hedge structure, having loans indexed in Reais with third-parties established at the Cayman Islands as the hedged objects. The hedging operations were designated in January 2017 and will mature in January 2018.
• It buys Fixed Dollar Asset and Floating Reais Liability swaps and designates them as instrument in a Cash Flow Hedge structure, having loans indexed in Reais with an Investment Fund established at the Cayman Islands as the hedged item. The hedging operations were designated in June 2017 and will mature until February 2018.
• Banco Santander has a portfolio of Government Securities indexed to a Post Fixed rate bonds and designates them as instrument in a Cash Flow Hedge structure. The Assets will be covered by DI1 Futuro (B3 S.A. (Current Company Name of BM&FBovespa)), instruments in order to transpose the Post-Fixed risk to floating CDI. The hedge operations were designated in June 2017 and the maturities will occur between January 2021 and 2023.
In order to assess the effectiveness and measure the ineffectiveness of these strategies, Banco Santander follows the IAS 39, which recommends that the hedge effectiveness test be performed at the inception/beginning (prospective test) of the hedge structure and be repeated periodically (prospective and retrospective tests) in order to demonstrate that the expected hedge ratio remains effective (between 80% and 125%).
In this hedge strategy the effectiveness tests (prospective and retrospective) are conducted through creation of two hypothetical derivatives, one for the object and another for the instrument.
The hypothetical derivative of the object is a conceptual swap where the liability leg simulates the “stable portion” to be protected and the asset leg is identical to the Pre-fixed leg of the derivative designated as hedge. For the hypothetical derivative of the instrument the asset leg will be set by the number of contracts of the future and the liability leg will be the pre-fixed rate negotiated on the acquisition of these contracts. The hypothetical derivative is stable once the contracts are kept until the maturity. Any ineffectiveness will be recognized in profit or loss.
Any ineffectiveness are recognized in the income statement.
a) Prospective Test: in accordance with the standard, the prospective test should be performed on the inception date and on a quarterly basis in order to demonstrate that the expectations regarding the effectiveness of the hedge ratio are high. However, the tests are carried out on a monthly basis in order to monitor the projections in a proactive and more efficient manner, in addition to ensuring better maintenance of test-related routines.
a.1) Periodic Prospective Test: According to the agreed process flow, Market Risk Department performs the projections of three scenarios to the tests, such as: 1st) 10bps in the curve; 2nd) 50bps in the curve and, 3rd) 100bps in the curve. Using the validated estimates, the prospective test are performed tests through the valuation of both positions measured at fair value.
a.2) Initial Prospective Test: the methodology of the periodic prospective test should also be applied on the initial date of each new strategy.
b) Retrospective Test: It should be made monthly with historical data to demonstrate cumulatively that the hedge was effective, according to the methodology presented previously. Any ineffectiveness are recognized in the income statement.
The Ineffective portion will be recognized through the prospective hedge test.
Effectiveness should range between 80% and 125%.
In cash flow hedges, the effective portion of changes in the value of the hedge instruments is temporarily recognized in equity heading “Other comprehensive income - cash flow hedges” until the expected transactions occur, when this portion is then recognized in the consolidated income statement. However, if the expected transactions result in the recognition of non-financial assets or liabilities, this portfolio will be included in the cost of financial assets or liabilities. The non-effective portion of the change in the value of foreign exchange hedge derivatives is recognized directly in the consolidated income statement. The non-effective portion of gains and losses on cash flow hedge instruments in a foreign operation is recognized directly in “Gains (losses) with (net) financial assets and liabilities” in the consolidated income statement. In 2017 the Bank registered an income in the amount of R$9,266 referred to the non-effective portion, in 2016 and 2015 there were no non-effective portion identified.
BANCO SANTANDER (BRASIL) S.A.
NOTES TO THE CONSOLIDATED FINANCIAL STATEMENTS
(Thousands of Brazilian Reais - R$ - unless otherwise stated)
| | | 2017 | 2016 | | 2015 | |
| Hedge Structure | Effective Portion Accumulated | Portion Ineffective | Effective Portion Accumulated | Portion Ineffective | Effective Portion Accumulated | Portion Ineffective |
| Cash Flow Hedge | | | | | | |
| Eurobonds | (25,576) | - | (20,535) | - | (29,750) | - |
| Trade Finance Off | (94,896) | 9,266 | - | - | - | - |
| Government Securities (LFT) | 129,995 | - | - | - | - | - |
| Loans and Receivables | - | - | 174,956 | - | (575,571) | - |
| Total | 9,523 | 9,266 | 154,421 | - | (605,321) | - |
| | 2017 | | 2016 | | 2015 | |
| | Adjustment to Fair Value | Fair Value | Adjustment to Fair Value | Fair Value | Adjustment to Fair Value | Fair Value |
| Hedge Instruments | | | | | | |
| Swap Contracts | (25,142) | 160,114 | (27,261) | 48,169 | (35,492) | (1,151,442) |
| Asset | 97,846 | 2,361,070 | 137,664 | 1,952,189 | 151,793 | 7,931,100 |
| Indexed to Foreign Currency - Swiss Franc | - | - | - | - | 6,998 | 1,244,985 |
| Indexed to Foreign Currency - Chile | - | - | - | - | 1,622 | 302,907 |
| Indexed in Reais(3) | - | - | - | - | (13,690) | 3,733,095 |
| Indexed to Foreign Currency - Pre Dollar | (42,149) | 992,879 | 84,812 | 1,477,821 | 127,632 | 2,170,572 |
| Indexed to Foreign Currency - Euro | 134,435 | 1,223,004 | 52,852 | 474,368 | 29,231 | 479,541 |
| Indexed to Foreign Currency - USD/BRL - Dollar | 5,560 | 145,187 | - | - | - | - |
| Liabilities | (122,988) | (2,200,956) | (164,925) | (1,904,020) | (187,285) | (9,082,542) |
| CDI (Interbank Deposit Rates) | (5,735) | (147,925) | (995) | (341,938) | - | - |
| Indexed to Foreign Currency - Pre Dollar | - | - | - | - | (17,767) | (6,598,073) |
| Indexed to Foreign Currency - Reais | - | - | (1,288) | (199,954) | - | (22,855) |
| Indexed to Foreign Currency - Pre Euro | 13,639 | (895,399) | (102,998) | (805,326) | (133,376) | (1,851,822) |
| Indexed to Foreign Currency - Dollar | (130,892) | (1,157,632) | (59,367) | (548,684) | (34,379) | (544,339) |
| Indexed to Foreign Currency - Reais | - | - | (277) | (8,118) | (1,763) | (65,453) |
| | 2017 Notional | 2016 Notional | 2015 Notional |
| Hedge Instruments | | | |
| Future Contracts | 54,995,334 | 80,149,530 | 72,798,063 |
| Trade Finance Operations(6) | 54,995,334 | 80,149,530 | 72,798,063 |
| Foreign Currency - Dollar | 3,362,582 | 450,571 | 2,651,572 |
| Interest Rate (DI1 and DIA) | 32,344,276 | 46,314,644 | 34,303,028 |
| Interest Rate DDI1 | 19,288,476 | 33,384,315 | 35,843,463 |
| Securities-available for sale | 5,304,261 | - | - |
| Government Securities(6) | 5,304,261 | - | - |
| Interest rate (DI1 and DIA) | 5,304,261 | - | - |
| | 2017 | 2016 | 2015 |
| Hedge Item - Cost | | | |
| Assets | 25,697,291 | 27,858,923 | 37,251,860 |
| Lending Operations - Financing and Export Credit and Imports | 7,632,915 | 24,720,800 | 35,743,885 |
| Loans and Receivables | 10,989,230 | 496,874 | 641,421 |
| Brazilian Foreign Debt Bonds | 809,660 | 701,300 | 866,554 |
| Available for sale - Promissory Notes - NP | 1,194,266 | 1,939,949 | - |
| Government Securities -LFT(6) | 5,071,220 | - | - |
| Liabilities | - | (1,332,972) | (1,995,118) |
| Foreign Borrowings | - | (1,332,972) | - |
| Eurobonds | - | - | (1,995,118) |
| (1) | Operations due April 1, 2021 (12/31/2016 - operations due April 1, 2021 and 12/31/2015 - operations due March, 18, 2016 and April 1,2021), which hedge objects are securities operation represented by title Brazilian External Debt Bonds. |
BANCO SANTANDER (BRASIL) S.A.
NOTES TO THE CONSOLIDATED FINANCIAL STATEMENTS
(Thousands of Brazilian Reais - R$ - unless otherwise stated)
| (2) | Operation maturing on January 5 and April 14, 2018, whose hedged items are securities represented by promissory notes. |
| (3) | Operations maturing between January, 30 2018 and September 30, 2022 (12/31/2016 - operations maturing between January, 2017 to December, 2025 and 12/31/2015 - operations maturing between August 2016 and June 2021), which objects "hedge" contracts are loans from lending institutions. |
| (4) | Operations with maturities between January 2018 and December 2020, whose hedge items are deposits with interbank deposit certificates (CDI), bills of exchange (LC) and financial letters (LF). |
| (5) | Transactions with maturity between February, 2018 and November, 2026 (12/31/2016 - transactions with maturities between January, 2017 to January, 2018 and 12/31/2015 - transactions with maturities between January, 2016 to December, 2024) and restated instrument value of R$16,811,747 (12/31/2016 - R$29,164,917 and 12/31/2015 - R$35,743,844) where operations are denominated futures in US dollars and futures in DI and IDD when used in conjunction with the foreign exchange coupon hedges the trade finance operations, whose hedge is Lending Operation - Financing and Credit to Export and Imports, lending operations, other credits, securities represented by promissory notes and foreign loan obligations. |
| (6) | Operation maturing between March, 2021 and March, 2023 updated value of the instruments of R$5,304,261, whose object of "hedge" are Financial Treasury Bills - LFT, recorded in securities. |
The effect of marking to market the swaps and future contracts corresponds to a credit in the amount of R$116,441 (2016 - corresponds to a debit in the amount of R$69,489 and 2015 - corresponds to a debit in the amount of R$345,373) accounted on Stockholders equity, net of tax effects, of which R$9,342 (12/31/2016 - R$59,930) will be realized in the next twelve months.
Hedging of Foreign Investments
Banco Santander reevaluated the investment structure of the wholly-owned subsidiary in Madrid (EFC), as it noted that due to the change in the strategy of the operation in practice, this subsidiary has a business model in which the Bank has a significant influence on driving and decision-making of its activities. According to the concept discussed in IAS 21, Management concluded that the functional currency of this investment is the Real and, therefore, this change becomes effective prospectively as from January 2017. In addition, the Hedge Accounting structure of Foreign investment that Banco Santander had on this investment was discontinued as of the date of change of the functional currency. In this way, the functional currency of Santander EFC and the Cayman agency is Real and the exchange rate differences of operations in foreign currency are recorded in the income statement. In order to hedge the exchange rate exposures, the Bank uses derivatives, and for both investments abroad the Bank does not apply Hedge Accounting. Foreign exchange variations on foreign currency transactions and the effect of derivatives used in economic protection (futures contracts) are recorded in the income statement.
On December 31, 2016, the notional value of this investment hedge was R$2,687,347, maturing between January 2017 and June 2017 and the effect of R$2,552,596 of the exchange variation recorded in stockholders’ equity, net of the tax effects.
a.6) Derivatives Pledged as Guarantee
The margin used as guarantee of the transactions traded on the B3 S.A. with derivative financial instruments from own and third parties portfolios are composed by government securities.
| | 2017 | 2016 | 2015 |
| Financial Treasury Bill - LFT | 708,960 | 1,556,804 | 330,605 |
| National Treasury Bill - LTN | 4,371,286 | 4,636,644 | 8,757,097 |
| National Treasury Notes - NTN | 1,193,315 | 27,598 | 757,969 |
| Total | 6,273,561 | 6,221,046 | 9,845,671 |
b) Short positions
On December 31, 2017 the balance of short positions totaled R$32,808,392 (2016 - R$31,694,269 and 2015 - R$20,047,631) which includes the amount of financial liabilities resulting from the direct sale of financial assets purchased through resale or loan commitments.
10. Loans and advances to clients
a) Breakdown
The breakdown, by classification, of the balances of “Loans and advances to clients” in the consolidated financial statements is as follows:
| Thousand of reais | 2017 | 2016 | 2015 |
| Loans and receivables | 272,420,157 | 252,002,774 | 252,033,449 |
| Of which: | | | |
| Loans and receivables at amortized cost | 287,829,213 | 268,437,556 | 267,266,449 |
| Impairment losses | (15,409,056) | (16,434,782) | (15,233,000) |
| Loans and advances to customers, net | 272,420,157 | 252,002,774 | 252,033,449 |
| Loans and advances to customers, gross | 287,829,213 | 268,437,556 | 267,266,449 |
BANCO SANTANDER (BRASIL) S.A.
NOTES TO THE CONSOLIDATED FINANCIAL STATEMENTS
(Thousands of Brazilian Reais - R$ - unless otherwise stated)
| Thousand of reais | 2017 | 2016 | 2015 |
| Type: | | | |
| Loans operations(1) | 272,561,017 | 257,256,452 | 257,671,667 |
| Lease Portfolio | 1,888,444 | 2,092,882 | 2,126,210 |
| Repurchase agreements | 403,415 | 308,483 | 517,536 |
| Other receivables(2) | 12,976,337 | 8,779,739 | 6,951,036 |
| Total | 287,829,213 | 268,437,556 | 267,266,449 |
(1) Includes loans and other loans with credit characteristics.
(2) Refers substantially to Foreign Exchange Transactions and Other Receivables with credit granting characteristics.
Note 45-d contains a detail of the residual maturity periods of loans and receivables.
There are no loans and advances to clients for material amounts without fixed maturity dates.
b) Detail
Following is a detail, by loan type and status, borrower sector and interest rate formula, of the loans and advances to clients, which reflect the Bank’s exposure to credit risk in its core business, gross of impairment losses:
| Thousand of reais | 2017 | 2016 | 2015 |
| Loan borrower sector: | | | |
| Commercial, and industrial | 140,619,110 | 140,992,900 | 150,880,864 |
| Real estate-construction | 34,808,681 | 36,650,011 | 36,851,879 |
| Installment loans to individuals | 110,512,978 | 88,701,763 | 77,407,496 |
| Lease financing | 1,888,444 | 2,092,882 | 2,126,210 |
| Total(1) | 287,829,213 | 268,437,556 | 267,266,449 |
(1) It includes commercial credit, secured loans, reverse repurchase agreements, finance leases, other term loans and impaired assets.
| Thousand of reais | 2017 | 2016 | 2015 |
| Interest rate formula: | | | |
| Fixed interest rate | 202,592,491 | 178,231,509 | 173,018,504 |
| Floating rate | 85,236,722 | 90,206,047 | 94,247,945 |
| Total | 287,829,213 | 268,437,556 | 267,266,449 |
| | | | | | | | | 2017 |
| Debt Sector by Maturity | Less than 1 year | % of total | Between 1 and 5 years | % of total | More than 5 years | % of total | Total | % of total |
| Commercial and industrial | 103,377,571 | 59.33% | 31,262,492 | 37.89% | 5,979,047 | 19.25% | 140,619,110 | 48.85% |
| Real estate | 7,791,753 | 4.47% | 10,970,004 | 13.29% | 16,046,924 | 51.65% | 34,808,681 | 12.09% |
| Installment loans to individuals | 62,078,225 | 35.63% | 39,393,699 | 47.74% | 9,041,054 | 29.10% | 110,512,978 | 38.40% |
| Lease financing | 1,000,418 | 0.57% | 886,833 | 1.07% | 1,193 | 0.00% | 1,888,444 | 0.66% |
| Loans and advances to customers, gross | 174,247,967 | 100.00% | 82,513,028 | 99.99% | 31,068,218 | 100.00% | 287,829,213 | 100.00% |
| | | | | | | | | 2016 |
| Debt Sector by Maturity | Less than 1 year | % of total | Between 1 and 5 years | % of total | More than 5 years | % of total | Total | % of total |
| Commercial and industrial | 99,657,024 | 61.65% | 35,789,118 | 45.10% | 5,546,758 | 20.23% | 140,992,900 | 52.52% |
| Real estate | 8,648,702 | 5.35% | 11,761,420 | 14.82% | 16,239,889 | 59.23% | 36,650,011 | 13.65% |
| Installment loans to individuals | 52,205,927 | 32.29% | 30,867,880 | 38.90% | 5,627,956 | 20.53% | 88,701,763 | 33.05% |
| Lease financing | 1,152,579 | 0.71% | 937,951 | 1.18% | 2,352 | 0.01% | 2,092,882 | 0.78% |
| Loans and advances to customers, gross | 161,664,232 | 100.00% | 79,356,369 | 100.00% | 27,416,955 | 100.00% | 268,437,556 | 100.00% |
| Thousand of reais | 2017 | 2016 | 2015 |
| Maturity | | | |
| Less than 1 year | 174,247,968 | 161,664,232 | 116,555,381 |
| Between 1 and 5 years | 82,513,030 | 79,356,369 | 104,563,829 |
| More than 5 years | 31,068,215 | 27,416,955 | 46,147,239 |
| Loans and advances to customers, gross | 287,829,213 | 268,437,556 | 267,266,449 |
| Internal risk classification | | | |
| Low | 226,098,497 | 207,889,639 | 211,645,464 |
| Medium-low | 33,635,378 | 32,104,168 | 29,500,791 |
| Medium | 10,423,293 | 10,940,879 | 8,638,914 |
BANCO SANTANDER (BRASIL) S.A.
NOTES TO THE CONSOLIDATED FINANCIAL STATEMENTS
(Thousands of Brazilian Reais - R$ - unless otherwise stated)
| Thousand of reais | 2017 | 2016 | 2015 |
| Medium - high | 8,215,024 | 6,976,969 | 8,552,474 |
| High | 9,457,021 | 10,525,901 | 8,928,806 |
| Loans and advances to customers, gross | 287,829,213 | 268,437,556 | 267,266,449 |
c) Impairment losses
The changes in the allowances for the impairment losses on the balances of “Loans and receivables” were as follows:
| Thousand of reais | 2017 | 2016 | 2015 |
| Balance at beginning of year | 18,191,126 | 15,411,759 | 13,562,811 |
| Impairment losses charged to income for the year | 13,492,072 | 14,383,935 | 13,723,179 |
| Of which: | | | |
| Commercial and industrial | 5,499,018 | 6,523,051 | 6,634,110 |
| Real estate-construction | 471,366 | 369,431 | 91,196 |
| Installment loans to individuals | 7,460,458 | 7,616,819 | 6,765,541 |
| Lease financing | 61,230 | (125,366) | 232,332 |
| Write-off of impaired balances against recorded impairment allowance | (13,421,560) | (11,604,568) | (11,874,231) |
| Of which: | | | |
| Commercial and industrial | (5,715,903) | (4,553,166) | (4,953,324) |
| Real estate-construction | (341,804) | (189,625) | (77,412) |
| Installment loans to individuals | (7,312,310) | (6,810,997) | (6,621,809) |
| Lease financing | (51,543) | (50,780) | (221,686) |
| Balance at end of year | 18,261,638 | 18,191,126 | 15,411,759 |
| Of which: | | | |
| Loans and advances to customers | 15,409,056 | 16,434,782 | 15,233,000 |
| Loans and amounts due from credit institutions (Note 6) | 69,015 | 201,441 | 178,759 |
| Provision for Debt Instruments (Note 7) | 2,783,567 | 1,554,903 | - |
| | | | |
| Recoveries of loans previously charged off | 1,153,931 | 994,101 | 757,320 |
| Of which: | | | |
| Commercial and industrial | 412,514 | 562,393 | 293,668 |
| Real estate-construction | 209,940 | 102,826 | 86,360 |
| Installment loans to individuals | 521,589 | 314,422 | 348,090 |
| Lease financing | 9,888 | 14,460 | 29,202 |
Taking into account these amounts recognized in “Impairment losses charged to income for the year” and the "Recoveries of loans previously charged off", the "Impairment losses on financial assets - Loans and receivables” amounted on December 31, 2017 R$12,338,141 (2016 - R$13,389,834 e 2015 - R$12,965,859).
The balances of the provision for losses due to non-recovery by debtor sector are as follows:"
| Thousand of reais | 2017 | 2016 | 2015 |
| Commercial and industrial | 10,338,225 | 10,555,109 | 8,585,225 |
| Real estate - Construction | 493,422 | 363,859 | 184,053 |
| Installment loans to individuals | 7,373,969 | 7,225,822 | 6,420,000 |
| Lease financing | 56,022 | 46,336 | 222,481 |
| Total | 18,261,638 | 18,191,126 | 15,411,759 |
d) Impaired assets
The details of the changes in the balance of the financial assets classified as “Loans and receivables – loans and advances to clients” (as defined at Note 1.i) and considered to be impaired due to credit risk are as follows:
| Thousand of reais | 2017 | 2016 | 2015 |
| Balance at beginning of year | 18,887,132 | 18,599,379 | 14,011,225 |
| Net additions | 13,679,423 | 11,892,321 | 16,462,385 |
| Written-off assets | (13,421,560) | (11,604,568) | (11,874,231) |
| Balance at end of year | 19,144,995 | 18,887,132 | 18,599,379 |
BANCO SANTANDER (BRASIL) S.A.
NOTES TO THE CONSOLIDATED FINANCIAL STATEMENTS
(Thousands of Brazilian Reais - R$ - unless otherwise stated)
Following is a detail of the financial assets considered to be impaired classified by age of the oldest past-due amount:
| Thousand of reais | 2017 | 2016 | 2015 |
| With no Past-Due Balances or Less than 3 Months Past Due | 10,844,831 | 10,550,548 | 10,307,442 |
| With Balances Past Due by | | | |
| 3 to 6 Months | 4,123,796 | 2,983,575 | 3,763,466 |
| 6 to 12 Months | 3,791,805 | 4,921,527 | 4,186,323 |
| 12 to 18 Months | 271,965 | 339,596 | 265,407 |
| 18 to 24 Months | 20,825 | 53,578 | 20,045 |
| More than 24 Months | 91,773 | 38,308 | 56,696 |
| Total | 19,144,995 | 18,887,132 | 18,599,379 |
| Debt Sector | | | |
| Commercial and industrial | 11,993,953 | 11,628,655 | 10,748,644 |
| Real estate - Construction | 781,886 | 718,514 | 828,966 |
| Installment loans to individuals | 6,304,134 | 6,487,717 | 6,970,241 |
| Lease financing | 65,022 | 52,246 | 51,528 |
| Total | 19,144,995 | 18,887,132 | 18,599,379 |
e) Loan past due for less than 90 days but not classified as impaired
| Thousand of reais | 2017 | % of total loans past due for less than 90 days | 2016 | % of total loans past due for less than 90 days | 2015 | % of total loans past due for less than 90 days |
| Commercial and industrial | 3,559,349 | 19.90% | 4,141,349 | 23.79% | 5,072,197 | 24.27% |
| Real estate - Construction | 4,879,563 | 27.29% | 5,201,709 | 29.88% | 7,551,584 | 36.13% |
| Installment loans to individuals | 9,266,366 | 51.82% | 7,957,294 | 45.71% | 8,235,699 | 39.40% |
| Financial Leasing | 176,528 | 0.99% | 108,607 | 0.62% | 41,013 | 0.20% |
| Total(1) | 17,881,806 | 100.00% | 17,408,959 | 100.00% | 20,900,493 | 100.00% |
f) Lease at present value
As at December 31, 2017, 2016 and 2015 there were no material agreements for lease contracts.
Breakdown by maturity
Gross investment in lease transactions
| Thousand of reais | 2017 | 2016 | 2015 |
| Overdue | 11,412 | 16,051 | 21,127 |
| Due to: | | | |
| Up to 1 year | 1,057,023 | 1,207,473 | 1,241,798 |
| From 1 to 5 years | 1,101,104 | 1,190,844 | 1,184,418 |
| Over 5 years | 2,177 | 4,079 | 6,078 |
| Total | 2,171,716 | 2,418,447 | 2,453,421 |
g) Transfer of financial assets with retention of risks and benefits
On December 31, 2017, the amount recorded on “Loans and advances to clients” related to loan portfolio assigned is R$431,397 (2016 - R$783,967 and 2015 - R$202,113), and R$428,248 (2016 - R$774,673 and 2015 - R$190,333 ) of “Other financial liabilities - Financial Liabilities Associated with Assets Transfer” (Note 22).
The foregoing transfer was conducted with a recourse clause and the mandatory repurchase is provided for in the following events:
- agreements in default for longer than 90 consecutive days;
- agreements under renegotiation;
- agreements subject to portability pursuant to Resolution 3,401 of the Brazilian Monetary Council (CMN);
- agreements subject to rights of intervention by certain parties to the contract.
BANCO SANTANDER (BRASIL) S.A.
NOTES TO THE CONSOLIDATED FINANCIAL STATEMENTS
(Thousands of Brazilian Reais - R$ - unless otherwise stated)
11. Non-current assets held for sale
At December 31, 2017, 2016 and 2015, the total amount of non-current assets held for sale includes foreclosed assets and other tangible assets. The change in the "Non-current assets held for sale" is as follows:
| Thousand of reais | 2017 | 2016 | 2015 |
| Balance at beginning of year | 1,418,308 | 1,310,033 | 978,274 |
| Loan repayments - repossession of assets | 524,497 | 834,903 | 293,440 |
| Capital Increase in Companies held for sale | - | 10,462 | 355,538 |
| Additions / disposals (net) due to change in the scope of consolidation(2) | - | (497,847) | - |
| Sales(1) | (434,553) | (239,291) | (317,321) |
| Others | (704) | 48 | 102 |
| Final balance, gross | 1,507,548 | 1,418,308 | 1,310,033 |
| Impairment losses(3) | (352,092) | (80,423) | (72,540) |
| Impairment as a percentage of foreclosed assets | 23.37% | 10.52% | 5.54% |
| Balance at end of year | 1,155,456 | 1,337,885 | 1,237,493 |
| (1) | In 2015, it mainly refers to the sale by Santander Corretora de Seguros (Current corporate name of Santander Participações S.A.) of its total interest in Santos Energia and its subsidiaries and, in the Special Purpose Companies Gestamp Eólica Serra de Santana S.A., Gestamp Eólica Paraíso S.A., Gestamp Eólica Lanchinha S.A., Gestamp Eólica Seridó S.A. and Gestamp Eólica Lagoa Nova S.A. |
| (2) | On September 30, 2016, as a result of the non-expectation of sale of investment in BW Guirapá and controlled, from a market period, an administrator transferred the total of this balance to the caption of investments in affiliated and controlled companies in the country (Note 12). In 2017, as described at note 3, this investment was sold. |
| (3) | In 2017, includes the amount of R$271,670 of provisions for devaluations on real estate and which were subsequently sold, constituted from valuation reports prepared by specialized external consulting, recorded as a provision for impairment losses, in 2016, this provision was R$239,291 (Note 44). |
Provisions for devaluations on real estate
On December 31, 2017, includes in the caption "Gains (losses) on non-current assets held for sale not classified as discontinued operations" the amount of R$337,686 of provisions for devaluations on real estate, based on appraisal reports prepared by specialized external consulting.
12. Investments in associates and joint ventures
Jointly controlled
Banco Santander considers investments classified as jointly controlled when they possess a shareholders’ agreement, which sets that the strategic, financial and operating decisions requires the unanimous consent of all investors.
Significant Influence
Associates are entities over which the Bank is in a position to exercise significant influence (significant influence is the power to participate in the financial and operating decisions of the investee) but it does not control or has joint control over the investee.
a) Breakdown
| | | | | | Participation % |
| Jointly Controlled by Banco Santander | Activity | Country | 2017 | 2016 | 2015 |
| Banco RCI Brasil S.A.(2) | Bank | Brazil | 39.89% | 39.89% | 39.89% |
| Norchem Participações e Consultoria S.A.(1) | Other Activities | Brazil | 50.00% | 50.00% | 50.00% |
| Cibrasec - Companhia Brasileira de Securitização(1) (4) (9) | Securitization | Brazil | 9.72% | 9.72% | 13.64% |
| Estruturadora Brasileira de Projetos S.A. - EBP(1) (9) (11) | Other Activities | Brazil | 11.11% | 11.11% | 11.11% |
| Gestora de Inteligência de Crédito(5)(10) | Credit Bureau | Brazil | 20.00% | - | - |
| Campo Grande Empreendimentos | Other Activities | Brazil | 25.32% | 25.32% | 25.32% |
| | | | | | |
| Jointly Controlled by Santander Corretora de Seguros (current corporate name of Santander Participações S.A.) | | | | | |
| Webmotors S.A.(7) (8)(12) | Other Activities | Brazil | 70.00% | 70.00% | 70.00% |
| Tecnologia Bancária S.A. - TECBAN(1) | Other Activities | Brazil | 19.81% | 19.81% | 19.81% |
PSA Corretora de Seguros e Serviços
Ltda.(6)(13)(14) | Insurance Broker | Brazil | 50.00% | 50.00% | 0.00% |
BANCO SANTANDER (BRASIL) S.A.
NOTES TO THE CONSOLIDATED FINANCIAL STATEMENTS
(Thousands of Brazilian Reais - R$ - unless otherwise stated)
| | | | | | Participation % |
| Jointly Controlled by Banco Santander | Activity | Country | 2017 | 2016 | 2015 |
| Jointly Controlled by Getnet S.A. | | | | | |
| iZettle do Brasil Meios de Pagamento S.A. ("iZettle do Brasil”)(3) | Other Activities | Brazil | - | - | 50.00% |
| Significant Influence of Banco Santander | | | | | |
| Norchem Holding e Negócios S.A.(1) | Other Activities | Brazil | 21.75% | 21.75% | 21.75% |
| | | | Investments |
| | 2017 | 2016 | 2015 |
| Jointly Controlled by Banco Santander(11) | 495,264 | 578,761 | 567,367 |
| Banco RCI Brasil S.A.(2) | 427,801 | 538,756 | 526,680 |
| Norchem Participações e Consultoria S.A.(1) | 25,550 | 26,302 | 23,665 |
| Cibrasec - Companhia Brasileira de Securitização(1) (4) (9) | 7,438 | 7,435 | 10,325 |
| Estruturadora Brasileira de Projetos S.A. - EBP(1) (9)(11) | 4,707 | 6,268 | 6,697 |
| Gestora de Inteligência de Crédito(5)(10) | 29,513 | - | - |
| Gestora de Inteligência de Crédito(5)(10) | 255 | - | - |
| Jointly Controlled by Santander Corretora de Seguros (current corporate name of Santander Participações SA) | 350,440 | 390,336 | 476,640 |
| Webmotors S.A.(7) (8)(12) | 197,930 | 246,965 | 339,899 |
| Tecnologia Bancária S.A. - TECBAN(1) | 151,019 | 142,713 | 136,741 |
| PSA Corretora de Seguros e Serviços Ltda.(6)(13)(14) | 1,491 | 658 | - |
| Jointly Controlled by Getnet S.A. | - | - | (2,768) |
| iZettle do Brasil Meios de Pagamento S.A.(3) | - | - | (2,768) |
| Significant Influence of Banco Santander | 20,860 | 20,980 | 19,504 |
| Norchem Holding e Negócios S.A.(1) | 20,860 | 20,980 | 19,504 |
| Total | 866,564 | 990,077 | 1,060,743 |
| | | | Results of Investments |
| | 1/01 to 12/31/2017 | 1/01 to 12/31/2016 | 1/01 to 12/31/2015 |
| Jointly Controlled by Banco Santander | 39,904 | 16,748 | 85,993 |
| Banco RCI Brasil S.A.(2) | 44,384 | 14,175 | 85,221 |
| Norchem Participações e Consultoria S.A.(1) | 1,333 | 2,637 | 1,976 |
| Cibrasec - Companhia Brasileira de Securitização(1) (4) (9) | 389 | 366 | 340 |
| Estruturadora Brasileira de Projetos S.A. - EBP(1) (9)(11) | (1,560) | (430) | (1,544) |
| Gestora de Inteligência de Crédito(5)(10) | (4,642) | - | - |
| Jointly Controlled by Santander Corretora de Seguros (current corporate name of Santander Participações SA) | 30,430 | 29,538 | 29,309 |
| Webmotors S.A.(7)(8)(12) | 21,290 | 23,019 | 23,397 |
| Tecnologia Bancária S.A. - TECBAN(1) | 8,307 | 5,971 | 5,912 |
| PSA Corretora de Seguros e Serviços Ltda.(6)(13)(14) | 833 | 548 | - |
| Jointly Controlled by Getnet S.A. | - | (225) | (491) |
| iZettle do Brasil Meios de Pagamento S.A.(3) | - | (225) | (491) |
| Significant Influence of Banco Santander | 1,217 | 1,476 | 1,501 |
| Norchem Holding e Negócios S.A.(1) | 1,217 | 1,476 | 1,501 |
| Total | 71,551 | 47,537 | 116,312 |
BANCO SANTANDER (BRASIL) S.A.
NOTES TO THE CONSOLIDATED FINANCIAL STATEMENTS
(Thousands of Brazilian Reais - R$ - unless otherwise stated)
| | | | 2017 |
| | Total assets | Total liabilities | Total profit(11) |
| Jointly Controlled by Banco Santander | 9,432,738 | 8,043,604 | 43,866 |
| Banco RCI Brasil S.A.(2) | 9,057,261 | 7,985,647 | 74,452 |
| Norchem Participações e Consultoria S.A.(1) | 78,674 | 27,574 | 2,665 |
| Cibrasec - Companhia Brasileira de Securitização(1) (4) (9) | 86,378 | 9,884 | 4,000 |
| Estruturadora Brasileira de Projetos S.A. - EBP(1) (9)(11) | 42,627 | 264 | (14,040) |
| Gestora de Inteligência de Crédito(5)(10) | 167,798 | 20,235 | (23,211) |
| Jointly Controlled by Santander Corretora de Seguros (current corporate name of Santander Participações SA) | 1,967,989 | 1,077,782 | 74,861 |
| Webmotors S.A.(7)(8)(12) | 490,458 | 50,413 | 31,264 |
| Tecnologia Bancária S.A. - TECBAN(1) | 1,472,774 | 1,025,593 | 41,932 |
| PSA Corretora de Seguros e Serviços Ltda.(6)(13)(14) | 4,757 | 1,776 | 1,665 |
| Significant Influence of Banco Santander | 122,176 | 26,267 | 5,597 |
| Norchem Holding e Negócios S.A.(1) | 122,176 | 26,267 | 5,597 |
| Total | 11,522,903 | 9,147,653 | 124,324 |
| | | | 2016 |
| | Total assets | Total liabilities | Total profit(11) |
| Jointly Controlled by Banco Santander | 8,831,611 | 7,318,656 | 89,544 |
| Banco RCI Brasil S.A.(2) | 8,603,844 | 7,276,320 | 79,223 |
| Norchem Participações e Consultoria S.A.(1) | 78,833 | 26,228 | 5,274 |
| Cibrasec - Companhia Brasileira de Securitização(1) (4) (9) | 91,083 | 14,659 | 7,011 |
| Estruturadora Brasileira de Projetos S.A. - EBP(1) (9) (11) | 57,851 | 1,449 | (1,964) |
| Jointly Controlled by Santander Corretora de Seguros (current corporate name of Santander Participações SA) | 1,459,826 | 943,028 | 58,595 |
| Webmotors S.A.(7)(8)(12) | 145,499 | 35,231 | 29,934 |
| Tecnologia Bancária S.A. - TECBAN(1) | 1,310,945 | 905,731 | 27,568 |
| PSA Corretora de Seguros e Serviços Ltda.(6)(13)(14) | 3,382 | 2,066 | 1,093 |
| Significant Influence of Banco Santander | 127,598 | 31,136 | 6,792 |
| Norchem Holding e Negócios S.A.(1) | 127,598 | 31,136 | 6,792 |
| Total | 10,419,035 | 8,292,820 | 154,931 |
| | | | 2015 |
| | Total assets | Total liabilities | Total profit(11) |
| Jointly Controlled by Banco Santander | 8,702,727 | 7,170,602 | 180,663 |
| Banco RCI Brasil S.A.(2) | 8,474,418 | 7,125,614 | 174,629 |
| Norchem Participações e Consultoria S.A.(1) | 73,288 | 25,958 | 3,953 |
| Cibrasec - Companhia Brasileira de Securitização(1) (4) (9) | 92,495 | 16,775 | 1,932 |
| Estruturadora Brasileira de Projetos S.A. - EBP(1) (9)(11) | 62,526 | 2,255 | 149 |
| Jointly Controlled by Santander Corretora de Seguros (current corporate name of Santander Participações SA) | 1,531,883 | 890,028 | 83,902 |
| Webmotors S.A.(7)(8)(12) | 279,935 | 36,904 | 36,636 |
| Tecnologia Bancária S.A. - TECBAN(1) | 1,251,948 | 853,124 | 47,266 |
| Jointly Controlled by Getnet S.A. | 20,210 | 25,747 | (2,420) |
| iZettle do Brasil Meios de Pagamento S.A.(3) | 20,210 | 25,747 | (2,420) |
| Significant Influence of Banco Santander | 119,687 | 30,017 | 6,902 |
| Norchem Holding e Negócios S.A.(1) | 119,687 | 30,017 | 6,902 |
| Total | 10,374,507 | 8,116,394 | 269,047 |
BANCO SANTANDER (BRASIL) S.A.
NOTES TO THE CONSOLIDATED FINANCIAL STATEMENTS
(Thousands of Brazilian Reais - R$ - unless otherwise stated)
b) Changes
The changes in the balance of this item were as follows:
| | 2017 | 2016 | 2015 |
| Jointly Controlled by Banco Santander | | | |
| Balance at beginning of year | 969,097 | 1,041,239 | 1,004,045 |
| Additions / disposals (net) due to change in the scope of consolidation | - | (2,926) | - |
| Additions /disposals(3) (6) | 34,154 | 3,105 | (2,768) |
| Capital reduction(7) | - | (76,860) | - |
| Share of results of entities accounted for using the equity method | 70,334 | 46,061 | 114,811 |
| Dividends proposed/received | (200,620) | (39,424) | (74,849) |
| Others | (27,261) | (2,098) | - |
| Balance at end of year | 845,704 | 969,097 | 1,041,239 |
| Significant Influence of Banco Santander | | | |
| Balance at beginning of year | 20,980 | 19,504 | 19,416 |
| Share of results of entities accounted for using the equity method | 1,217 | 1,476 | 1,501 |
| Dividends proposed/received | (1,337) | - | (1,413) |
| Balance at end of year | 20,860 | 20,980 | 19,504 |
| (1) | Companies with a delay of one month for the equity calculation. To register the equity income it was used on 12/31/2017 the position of 11/30/2017. |
| (2) | The EGM of July 21, 2015, approved the Company’s transformation into a multiple bank, with investment portfolios, leasing and credit, financing and investment and also the change of the name of the Companhia de Arrendamento Mercantil RCI Brasil to Banco RCI Brasil S.A. This process was approved by the BACEN on October 28, 2015. |
| (3) | In June 2016 the interest held in iZetlle do Brasil S.A was sold. |
| (4) | At the ESM held on April 29, 2016 was approved the reform in the distribution structure of the capital of Cibrasec through the creation of preferred shares issued by the Company with voting rights and the share conversion of the common shares of Company into preferred shares, this reform was ratified at the ESM held on May 30, 2016. Banco Santander became part of their ordinary shares held in the capital of Cibrasec, the corresponding amount to five thousand (5,000) common shares issued by Cibrasec 50 (fifty) preferred shares in the proportion of 100 (one hundred) common shares for each one (1) preferred share, and still held 4,000 (four thousand) common shares in the capital of Cibrasec. Each preferred share entitles the holder the right to one hundred (100) times the right to dividends of the common shares, so that the economic rights were maintained, however, the conversion resulted in reduction in the percentage shareholding in Cibrasec. |
| (5) | Company incorporated in April 2017 and is in the pre-operational phase. Pursuant to the shareholders’ agreement, control is shared between shareholders who hold 20% of their capital stock each. At the Extraordinary General Meeting held on July 6, 2017, the capital increase of Gestora de Crédito was approved in the total amount of R$65,822, so that the capital stock increased from R$1 to R$65,823, through the issue of 6,582,200 (six million, five hundred and eighty-two thousand and two hundred) new shares, of which 3,291,100 (three million, two hundred and ninety-one thousand and one hundred), 1,316,440 (one million, three hundred and sixteen thousand, four hundred and forty) preferred shares Class A and 1,316,440 (one million, three hundred and sixteen thousand, four hundred and forty) preferred shares Class B and 658,220 (six hundred and fifty eight thousand, two hundred and twenty) class C preferred shares, with no par value, at the issue price of R$10.00, corresponding to the equity value of the shares. The shares issued in the capital increase were fully subscribed on the same date by the shareholders in the proportion of 20% of their capital stock each. |
| (6) | In 2017 refers to the incorporation of Gestora de Inteligência de Crédito - partnership between Banco Santander and other banks from Brazilian market (according to note 3.d) and in 2016 refers to the acquisition agreement of part of the financial operations from the Group PSA in Brazil and the consequent creation of a Joint Venture. |
| (7) | At the ESM realized in September 26, 2016, was approved the reduction of the capital of Webmotors S.A. without cancellation of shares in the amount of R$109,800 to be considered excessive to maintain its activities, and the capital of R$194,580 to R$84,780. |
| (8) | On December 30, 2016, at the EGM of Webmotors S.A., the merger and the Private Instrument of Protocol and Justification of Incorporation of Virtual Motors by Webmotors S.A. were approved, so that Webmotors S.A. received, for its accounting value, based on the balance sheet drawn up on November 30, 2016, all of the assets, rights and obligations of Virtual Motors, with the extinction of Virtual Motors that will be succeeded by Webmotors S.A. in all its rights and obligations. |
| (9) | Although the participations was less than 20%, the Bank exercises control over the entity together with other major stockholders’ through a stockholders’ agreement where no business decision can be taken by a single shareholder. |
| (10) | At the EGM held in October 5, 2017, it was approved the share capital increase of the Gestora de Crédito in the amount of R$285.205, that way its share capital increased from R$65,823 to R$351,028, through the issuance of 29,013,700 new shares, being 14,506,850 as ordinary shares, 5,802,740 preferred shares Class A, 5,802,740 preferred shares Class B, and 2,901,370 preferred shares Class C, without par value, at the issuance price of R$9.83 per share. It was also approved by unanimous decision the payment timetable of the new shares issuance made by the Management of Gestora de Crédito. That way, the share capital increase was fully subscribed at the same day by the shareholders in the proportion of 20% of each interest which were partially paid. |
| (11) | According to its Bylaws, EBP was formed in order to carry out projects to contribute for the Brazilian economic and social development for the period of 10 years. After the conclusion of the timetable set EPB closes its activities this year of 2018. The dissolution of its rights and liquidation were approved in the EGM held on January 29, 2018. |
| (12) | Although participation exceeds 50%, in accordance with the shareholders’ agreement, the control is shared by Santander Corretora de Seguros (Current corporate name of Santander Participações S.A.), and Carsales.com. Investments PTY LTD (Carsales), shareholder based in Australia. |
| (13) | Pursuant to the shareholders’ agreement, the control is shared by Santander Corretora de Seguros (current corporate name of Santander Participações SA) and PSA Services LTD. |
BANCO SANTANDER (BRASIL) S.A.
NOTES TO THE CONSOLIDATED FINANCIAL STATEMENTS
(Thousands of Brazilian Reais - R$ - unless otherwise stated)
| (14) | In December 2017, according to the contractual change, the PSA Corretora de Seguros shareholders decided to increase its share capital in R$401, that way the share capital increased from R$500 to R$901, through the issuance of 400,532 new shares, which each new share has the value of R$1. The new shares issued were subscribed and paid at the same date, in local currency, according to the proportion of each shareholder equivalent to 50% to the company´s share capital, that is, 200,266 shares. |
| (15) | According to its Bylaws, EBP was formed in order to carry out projects to contribute for the Brazilian economic and social development for the period of 10 years. After the conclusion of the timetable set EPB closes its activities this year of 2018. The dissolution of its rights and liquidation were approved in the EGM held on January 29, 2018. |
| (*) | The Bank does not have collateral with associates and joint ventures. |
| (**) | The Bank does not have contingent liabilities with significant risk of loss as possible related to investments in affiliates with joint control and significant influence. |
| (***) | As of December 31, 2017, 2016 and 2015, the balances of Assets, Liabilities and Profit refer to 100% of the company balance sheet. There is no balance for the caption "Other Comprehensive Income" in these companies, except for the RCI Bank which recorded R$40,671 (2016 - R$5,261 and 2015 - R$0). |
c) Impairment losses
No impairment losses were recognized on investments in associates and joint ventures in 2017, 2016 and 2015.
d) Other information
Details of the principal jointly controlled entities:
Banco RCI Brasil S.A.: A company incorporated in the form of corporation headquartered in Parana which is primarily engaged in the practice of leasing, credit operations, financing and investment, in order to sustain the growth of automotive brands Renault and Nissan in the Brazilian market by providing credit and leasing operations to the final client. It is a financial institution that is part of the RCI Banque Group and the Santander Group, with operations conducted as part of a set of institutions that operate in the financial market. According to the Shareholders’ Agreement, the key decisions that impact this partnership are taken jointly between Banco Santander and other controllers. On July 21, 2015 the Company’s transformation into a Multiple Bank was approved, with investment portfolios, leasing and credit, financing and investment and also the change of company name of Companhia de Arrendamento Mercantil RCI Brasil to Banco RCI Brasil S.A. This process was approved by Bacen on October 28, 2015. On January 29, 2016, the Companhia de Crédito, Financiamento e Investimento RCI Brasil was merged into its subsidiary Banco RCI Brasil S.A., with this process the interest previously held by RCI Brasil was transferred to Banco Santander.
Webmotors S.A.: A company incorporated in the form of private limited company with headquarters in São Paulo which is engaged in the design, implementation and / or availability of electronic catalogs, space, products, services or means of marketing products and / or services related to the automotive industry, on the Internet or other means related to e-commerce activities and other Internet uses or applications, as well as the participation in capital in other companies and the management of related business. It is a company of the Economic Conglomerate - Financial Santander (Santander Group) and Carsales.com Investments PTY LTD (Carsales), which its operations are conducted as part of a group of institutions that operate jointly. According to the Shareholders’ Agreement, the key decisions that impact this partnership are taken jointly between Banco Santander and other controllers.
| Thousand of reais | | 2017 | | 2016 | | 2015 |
| | Banco RCI Brasil | Webmotors | Banco RCI Brasil | Webmotors | Banco RCI Brasil | Webmotors |
| Current assets | 4,535,521 | 418,795 | 4,103,866 | 23,071 | 5,038,181 | 85,552 |
| Non-current assets | 4,521,740 | 71,663 | 4,499,978 | 122,428 | 3,436,237 | 194,383 |
| Current liabilities | 3,897,010 | 47,166 | 3,629,575 | 32,601 | 3,998,536 | 30,877 |
| Non-current liabilities | 4,088,637 | 3,247 | 3,646,745 | 2,630 | 3,127,078 | 6,027 |
| Cash and cash equivalents | 47,782 | 1,989 | 23,612 | 1,663 | 38,217 | 681 |
| Depreciation and amortization | (1,600) | 16,353 | (911) | (12,295) | (3,783) | (9,883) |
| Revenue | 1,315,695 | 127,064 | 1,575,550 | 135,242 | 591,810 | 137,947 |
| Interest income | 1,294,119 | 7,178 | 1,368,643 | 28,047 | 1,424,211 | 27,854 |
| Interest expense | (626,654) | - | (903,061) | - | (903,864) | (69) |
| Tax Income / (expense) | (122,544) | (12,568) | (3,326) | (13,370) | (108,837) | (16,086) |
| Current financial liabilities (excluding trade and other payables and provisions) | 3,897,010 | 33,320 | 3,629,575 | 31,707 | 3,436,699 | 30,110 |
| Non-current financial liabilities (excluding trade and other payables and provisions) | 4,058,986 | 3,247 | 3,646,745 | 1,736 | 2,565,241 | 5,260 |
13. Tangible assets
Tangible assets of the Bank relate to property, plant and equipment for the its own use. The Bank does not have tangible assets held as investment property nor leased out under operating leases. The Bank is also not a part of any financial lease contracts as of and during fiscal years ended December 31, 2017, 2016 and 2015.
BANCO SANTANDER (BRASIL) S.A.
NOTES TO THE CONSOLIDATED FINANCIAL STATEMENTS
(Thousands of Brazilian Reais - R$ - unless otherwise stated)
a) Breakdown
The detail, by class of asset, of the tangible assets in the consolidated balance sheets is as follows:
| Thousand of reais | | | | | |
| Cost | Land and buildings | IT equipment and fixtures | Furniture and vehicles | Works in progress and others | Total |
| Balance at December 31, 2014 | 2,773,548 | 2,688,990 | 6,967,302 | 4,465 | 12,434,305 |
| Additions | 15,997 | 120,378 | 933,913 | - | 1,070,288 |
| Additions resulting mergers | - | 2,723 | 4,739 | - | 7,462 |
| Write-off | (19,991) | (12,233) | (228,324) | - | (260,548) |
| Transfers | (44,695) | 350,889 | (314,139) | (706) | (8,651) |
| Balance at December 31, 2015 | 2,724,859 | 3,150,747 | 7,363,491 | 3,759 | 13,242,856 |
| Additions | 3,024 | 154,852 | 715,264 | - | 873,140 |
| Additions resulting mergers | - | 2,021 | 3,961 | - | 5,982 |
| Write-off | (29,174) | (15,011) | (141,442) | - | (185,627) |
| Additions / disposals (net) due to change in the scope of consolidation | - | 45 | 257 | - | 302 |
| Transfers | 12,484 | 74,361 | (82,650) | - | 4,195 |
| Balance at December 31, 2016 | 2,711,193 | 3,367,015 | 7,858,881 | 3,759 | 13,940,848 |
| Additions | - | 382,571 | 723,835 | - | 1,106,406 |
| Write-off | (52,102) | (180,036) | (31,053) | - | (263,191) |
| Transfers | (9,779) | 718,666 | (721,520) | - | (12,633) |
| Balance at December 31, 2017 | 2,649,312 | 4,288,216 | 7,830,143 | 3,759 | 14,771,430 |
| Accumulated depreciation | | | | | |
| Balance at December 31, 2014 | (465,169) | (1,739,795) | (3,127,009) | - | (5,331,973) |
| Additions | (83,106) | (343,642) | (602,958) | - | (1,029,706) |
| Additions resulting mergers | - | (831) | (3,357) | - | (4,188) |
| Write-off | 17,353 | 10,531 | 207,420 | - | 235,304 |
| Transfers | (624) | (19,143) | (76,827) | - | (96,594) |
| Balance at December 31, 2015 | (531,546) | (2,092,880) | (3,602,731) | - | (6,227,157) |
| Additions | (82,963) | (387,855) | (683,770) | - | (1,154,588) |
| Additions resulting mergers | - | (1,594) | (1,234) | - | (2,828) |
| Write-off | 13,999 | 13,092 | 121,338 | - | 148,429 |
| Additions / disposals (net) due to change in the scope of consolidation | - | (26) | (76) | - | (102) |
| Transfers | 6,300 | (39,836) | (5,761) | - | (39,297) |
| Balance at December 31, 2016 | (594,210) | (2,509,099) | (4,172,234) | - | (7,275,543) |
| Additions | (81,910) | (499,542) | (609,515) | - | (1,190,967) |
| Write-off | 37,136 | 154,471 | 22,196 | - | 213,803 |
| Transfers | 9,734 | (437,527) | 427,506 | - | (287) |
| Balance at December 31, 2017 | (629,250) | (3,291,697) | (4,332,047) | - | (8,252,994) |
| Losses from non-recovery (impairment) | | | | | |
| Balance at December 31, 2014 | (31,296) | - | - | - | (31,296) |
| Impacts on results | (2,077) | - | - | - | (2,077) |
| Write-off | 23,588 | - | - | - | 23,588 |
| Balance at December 31, 2015 | (9,785) | - | - | - | (9,785) |
| Impacts on results | (3,246) | - | (5,841) | - | (9,087) |
| Balance at December 31, 2016 | (13,031) | - | (5,841) | - | (18,872) |
| Impacts on results | 9,784 | - | 1,047 | - | 10,831 |
| Transfers | - | - | (512) | - | (512) |
| Balance at December 31, 2017 | (3,247) | - | (5,306) | - | (8,553) |
| Carrying amount | | | | | |
| Balance at December 31, 2015 | 2,183,528 | 1,057,867 | 3,760,760 | 3,759 | 7,005,914 |
| Balance at December 31, 2016 | 2,103,952 | 857,916 | 3,680,806 | 3,759 | 6,646,433 |
| Balance at December 31, 2017 | 2,016,815 | 996,519 | 3,492,790 | 3,759 | 6,509,883 |
The depreciation expenses has been included in the heading “Depreciation and amortization” in the income statement.
BANCO SANTANDER (BRASIL) S.A.
NOTES TO THE CONSOLIDATED FINANCIAL STATEMENTS
(Thousands of Brazilian Reais - R$ - unless otherwise stated)
b) Tangible asset purchase commitments
On December 31, 2017 the Bank has contractual commitments for the acquisition of tangible assets amount of R$75.0 (2016 - R$9.1 million and 2015 R$0).
14. Intangible assets - Goodwill
Goodwill is the difference between the acquisition cost and the Bank’s participation in the net fair value of assets, liabilities and contingent liabilities of the acquired company. When the difference is negative (negative goodwill), it is recognized immediately through income statement. In accordance with IFRS 3 Business Combinations, goodwill is stated at cost and is not amortized but tested annually for impairment or whenever there is an evidence of reduction on the recoverable value of the cash generating unit to which the goodwill was allocated. Goodwill is recognized at cost considering the accumulated impairment losses. Impairment losses related to goodwill are not reversible. Gains and losses related to the sale of an entity include the carrying amount of goodwill relating to the entity sold.
The goodwill recorded is subject to impairment test (note 2.o.i) and has been allocated according to the operating segments (note 46).
Based on the assumptions described above, no impairment loss was recognized for goodwill at December 31, 2017, 2016 and 2015.
| Thousand of reais | 2017 | 2016 | 2015 |
| Breakdown | | | |
| Banco ABN Amro Real S.A. (Banco Real) | 27,217,565 | 27,217,565 | 27,217,565 |
| Olé Consignado (Current Company name of Banco Bonsucesso Consignado) | 62,800 | 62,800 | 62,800 |
| Super Pagamentos e Administração de Meios Eletrônicos Ltda. (Super) | 13,050 | 13,050 | 13,050 |
| Banco PSA Finance Brasil S.A. | 1,557 | - | - |
| Getnet Adquirência e Serviços para Meios de Pagamento S.A. (Santander Getnet) | 1,039,304 | 1,039,304 | 1,039,304 |
| BW Guirapá I S.A. | - | 22,320 | - |
| Ipanema Empreendimentos e Participações Ltda. | 28,120 | - | - |
| Others | 1,860 | - | - |
| Total | 28,364,256 | 28,355,039 | 28,332,719 |
| | Commercial Banking |
| | 2017 | 2016 | 2015 |
| Main assumptions: | | | |
| Basis of determining recoverable amounts | | Value in use: cash flows |
| Period of the projections of cash flows(1) | 5 years | 5 years | 5 years |
| Growth rate perpetual | 8.3% | 8.0% | 7.5% |
| Discount rate(2) | 14.6% | 15.2% | 15.2% |
| (1) | The projections of cash flow are prepared using Management´s growth plans and internal budget, based on historical data, market expectations and conditions such as industry growth, interest rate and inflation. |
| (2) | The discount rate is calculated based on the capital asset pricing model (CAPM). The discount rate before tax is 20.42% (2016 - 20.23% and 2015 - 20.11%). |
The impairment test was performed during the second half of 2017, since at the end of each reportable period or whenever there is any indication of impairment, goodwill is tested for impairment.
In the goodwill impairment test, discount rates and perpetuity growth are the most sensitive assumptions for the calculation of present value (value in use) of future cash flows discounted to present value. With the variation of + 0.25% or -0.25% in these rates, the value of future cash flows discounted to present value remains higher than Banco Santander’s shareholders’ equity.
The changes of goodwill in December, 31 2017, 2016 and 2015 were as follows:
| Thousand of reais | 2017 | 2016 | 2015 |
| Balance at beginning of the year | 28,355,039 | 28,332,719 | 28,270,955 |
Additions (loss):
Olé Consignado (Note 4.c) | - | - | 62,800 |
| Super (Note 4.c) | - | - | (1,036) |
| BW Guirapá (Note 4.c) | (22,320) | 22,320 | - |
| Banco PSA Finance Brasil S.A. | 1,557 | - | - |
| Others | 1,860 | - | - |
| Balance at end of the year | 28,336,136 | 28,355,039 | 28,332,719 |
| (1) | In 2016 refers to goodwill of BW Guirapá. In 2015, the Banco Santander, through Aymoré CFI, became the controlling shareholder of Banco Bonsucesso Consignado, with 60% of capital. |
BANCO SANTANDER (BRASIL) S.A.
NOTES TO THE CONSOLIDATED FINANCIAL STATEMENTS
(Thousands of Brazilian Reais - R$ - unless otherwise stated)
15. Intangible assets - Other intangible assets
The details by asset category of the "other intangible assets" of the consolidated financial statements are as follow:
| Cost | IT developments | Other assets | Total |
| Balance at December 31, 2014 | 4,577,074 | 356,868 | 4,933,942 |
| Additions | 607,642 | 3,647 | 611,289 |
| Additions resulting mergers | 759 | 1 | 760 |
| Write-off | (11,282) | - | (11,282) |
| Transfers | 28,307 | 37,200 | 65,507 |
| Balance at December 31, 2015 | 5,202,500 | 397,716 | 5,600,216 |
| Additions | 652,490 | 18,395 | 670,885 |
| Additions resulting mergers | 250 | 89 | 339 |
| Write-off | (450) | (10,202) | (10,652) |
| Additions / disposals (net) due to change in the scope of consolidation | 4 | - | 4 |
| Transfers | 12,150 | - | 12,150 |
| Balance at December 31, 2016 | 5,866,944 | 405,998 | 6,272,942 |
| Additions | 824,411 | 12,072 | 836,483 |
| Write-off | (125,307) | (7,096) | (132,403) |
| Transfers | 4,633 | - | 4,633 |
| Balance at December 31, 2017 | 6,570,681 | 410,974 | 6,981,655 |
| Accumulated amortization | | | |
| Balance at December 31, 2014 | (2,464,273) | (233,532) | (2,697,805) |
| Additions | (413,450) | (46,861) | (460,311) |
| Additions resulting mergers | (115) | - | (115) |
| Write-off | 10,169 | - | 10,169 |
| Transfers | 18,675 | 13,614 | 32,289 |
| Balance at December 31, 2015 | (2,848,994) | (266,779) | (3,115,773) |
| Additions | (304,046) | (24,005) | (328,051) |
| Additions resulting mergers | (249) | - | (249) |
| Write-off | 141 | 10,202 | 10,343 |
| Additions / disposals (net) due to change in the scope of consolidation | (1) | - | (1) |
| Transfers | 32,167 | 3,427 | 35,594 |
| Balance at December 31, 2016 | (3,120,982) | (277,155) | (3,398,137) |
| Additions | (449,709) | (21,571) | (471,280) |
| Write-off | 854 | 5,500 | 6,354 |
| Transfers | 17,402 | 464 | 17,866 |
| Balance at December 31, 2017 | (3,552,435) | (292,762) | (3,845,197) |
| Losses from non-recovery (Impairment) - IT | | | |
| Balance at December 31, 2014 | (285,834) | - | (285,834) |
| Impact on net profit(1) | (670,556) | (8,698) | (679,254) |
| Write-off | (38,412) | - | (38,412) |
| Balance at December 31, 2015 | (994,802) | (8,698) | (1,003,500) |
| Impact on net profit | 898 | (6,736) | (5,838) |
| Transfers | 16,193 | 143 | 16,336 |
| Balance at December 31, 2016 | (977,711) | (15,291) | (993,002) |
| Impact on net profit(2) | (306,110) | - | (306,110) |
| Write-off | 441 | - | 441 |
| Balance at December 31, 2017 | (1,283,380) | (15,291) | (1,298,671) |
| Carrying amount | | | |
| Balance at December 31, 2015 | 1,358,704 | 122,239 | 1,480,943 |
| Balance at December 31, 2016 | 1,768,251 | 113,552 | 1,881,803 |
| Balance at December 31, 2017 | 1,734,866 | 102,921 | 1,837,787 |
| (1) | In 2015, includes impairment loss of assets in the acquisition and development of software in the amount of R$674,780. The loss in the acquisition and development of software was recorded due to obsolescence function and disruption of these systems. |
The amortization expenses has been included in the heading “Depreciation and amortization” in the income statement.
BANCO SANTANDER (BRASIL) S.A.
NOTES TO THE CONSOLIDATED FINANCIAL STATEMENTS
(Thousands of Brazilian Reais - R$ - unless otherwise stated)
16. Other assets
The breakdown of the balance of “Other assets” is as follows:
| Thousand of reais | 2017 | 2016 | 2015 |
| Customer relationships(1) | 1,679,305 | 1,197,278 | 221,478 |
| Prepayments and accrued income | 784,456 | 690,814 | 1,383,476 |
| Contractual guarantees of former controlling stockholders (Note 24.c.5) | 707,130 | 814,925 | 789,974 |
| Actuarial asset (Note 23) | 198,188 | 153,661 | - |
| Amounts receivable of covenants | - | - | 8 |
| Other receivables(2) | 1,209,191 | 2,247,334 | 1,407,182 |
| Total | 4,578,270 | 5,104,012 | 3,802,118 |
| (1) | In 2015, the balance shown is net of provision for non-recoverable loss of the asset recorded for the purchase of rights to the provision of payroll services in the amount of R$534,281 recorded in "Impairment losses on other assets (net) - Others". The loss on the rights in the acquisition of payrolls was recorded due to the reduction of the expected return value in the management of payrolls and contracts break history. |
(2) Corresponds mainly to receivables from third parties.
17. Deposits from the Brazilian Central Bank and Deposits from credit institutions
The breakdown, by classification, type and currency, of the balances of these items is as follows:
| Thousand of reais | 2017 | 2016 | 2015 |
| Classification: | | | |
| Financial liabilities at amortized cost | 79,374,685 | 78,634,072 | 69,451,498 |
| Total | 79,374,685 | 78,634,072 | 69,451,498 |
| Type: | | | |
| Deposits on demand(1) | 306,081 | 314,112 | 144,596 |
| Time deposits(2) | 52,739,163 | 49,548,858 | 55,795,205 |
| Repurchase agreements | 26,329,441 | 28,771,102 | 13,511,697 |
Of which:
Backed operations with Private Securities(3) | - | 446,429 | 84,573 |
| Backed operations with Government Securities | 26,329,441 | 28,324,673 | 13,427,124 |
| Total | 79,374,685 | 78,634,072 | 69,451,498 |
| Currency: | | | |
| Reais | 56,562,950 | 51,339,830 | 33,056,128 |
| Euro | 407,814 | 576,994 | 528,465 |
| US dollar | 22,156,054 | 26,546,404 | 35,612,670 |
| Other currencies | 247,867 | 170,844 | 254,235 |
| Total | 79,374,685 | 78,634,072 | 69,451,498 |
| (1) | Non-interest bearing accounts. |
| (2) | It includes the operation with credit institution arising from export and import financing lines, BNDES and Finame on-lending and abroad and other credit lines abroad. |
| (3) | Refers primarily to repurchase agreements backed by own-issued debentures. |
Note 45-d contains a detail of the remaining maturity of financial liabilities at amortized cost.
BANCO SANTANDER (BRASIL) S.A.
NOTES TO THE CONSOLIDATED FINANCIAL STATEMENTS
(Thousands of Brazilian Reais - R$ - unless otherwise stated)
18. Client deposits
The breakdown, by classification and type, of the balance of “Customer deposits” is as follows:
| Thousand of reais | 2017 | 2016 | 2015 |
| Classification: | | | |
| Financial liabilities at amortized cost | 276,042,141 | 247,445,177 | 243,042,872 |
| Total | 276,042,141 | 247,445,177 | 243,042,872 |
| Type: | | | |
Deposits on demand
Current accounts(1) | 17,559,985 | 15,868,201 | 15,579,923 |
| Savings accounts | 40,572,369 | 36,051,476 | 35,984,838 |
| Time deposits | 146,817,650 | 94,478,875 | 89,986,025 |
| Repurchase agreements | 71,092,137 | 101,046,625 | 101,492,086 |
Of which:
Backed operations with Private Securities(2) | 33,902,890 | 59,460,210 | 61,173,979 |
| Backed operations with Government Securities | 37,189,247 | 41,586,415 | 40,318,107 |
| Total | 276,042,141 | 247,445,177 | 243,042,872 |
| (1) | Non-interest bearing accounts. |
| (2) | Refers primarily to repurchase agreements backed by own-issued debentures. |
Note 45-d contains a detail of the residual maturity periods of financial liabilities at amortized cost.
19. Marketable debt securities
The breakdown, by classification and type, of the balance of “Marketable debt securities” is as follows:
| Thousand of reais | 2017 | 2016 | 2015 |
| Classification: | | | |
| Financial liabilities at amortized cost | 70,247,012 | 99,842,955 | 94,658,300 |
| Total | 70,247,012 | 99,842,955 | 94,658,300 |
| Type: | | | |
| Real estate credit notes - LCI(1) | 27,713,873 | 23,983,429 | 23,795,322 |
| Eurobonds | 1,992,828 | 7,721,646 | 13,465,373 |
| Treasury Bills(2) | 31,686,259 | 61,157,037 | 55,300,989 |
| Agribusiness credit notes - LCA(3) | 8,854,052 | 6,980,843 | 2,096,616 |
| Total | 70,247,012 | 99,842,955 | 94,658,300 |
| Indexers: | Domestic | Abroad |
| Treasury Bills | 97% to 108% of CDI | - |
| | 100% of IGPM | - |
| | 100% of IPCA | - |
| | Pre fixed: 10.05% to 17.74% | - |
| | 104% to 105% of SELIC | - |
| Real estate credit notes - LCI | 70% to 97% of CDI | - |
| | Pre fixed: 8.27% of 14.91% | - |
| | 100% of IPCA | - |
| | 100% of TR | - |
| Agribusiness credit notes - LCA | 87% to 94% of CDI | - |
| Eurobonds | 0.7% to 3% | 0.72% to 15.70% |
| (1) | Real Estate Credit Notes are fixed income securities pegged by mortgages and mortgage-backed securities or liens on property. On December 31, 2017, have maturities between 2018 to 2026 (2016 - there are maturities between 2017 to 2026 and 2015 - there are maturities between 2016 to 2020). |
| (2) | The main features of the Treasury Bills are the minimum period of two years, minimum notional of R$300 and permission for early redemption of only 5% of the issued amount. On December 31, 2017, have a maturity between 2018 to 2025 (2016 - have a maturity between 2016 to 2017 to 2025 and 2015 - there are maturities between 2016 to 2025). |
| (3) | Agribusiness credit notes are fixed income securities in which resources are allocated to the promotion of agribusiness indexed between 86.0% to 94.0% of CDI. On December 31, 2017, its maturities dates are between 2018 to 2019 (12/31/2016 - there are maturities between 2017 to 2018 and 2015 - there are maturities between 2016 to 2018). |
BANCO SANTANDER (BRASIL) S.A.
NOTES TO THE CONSOLIDATED FINANCIAL STATEMENTS
(Thousands of Brazilian Reais - R$ - unless otherwise stated)
The breakdown, by currency, of the balance of this account is as follows:
Thousand of reais
Currency: | 2017 | 2016 | 2015 |
| Real | 68,335,103 | 92,132,195 | 82,506,826 |
| US dollar | 1,911,909 | 7,645,542 | 11,180,678 |
| Swiss Francs | - | - | 603,889 |
| Peso/Chile | - | - | 135,388 |
| Yen | - | - | 35,743 |
| Euro | - | 65,218 | 195,776 |
| Total | 70,247,012 | 99,842,955 | 94,658,300 |
| | Average interest (%) |
| Currency: | 2017 | 2016 | 2015 |
| Real | 5.5% | 11.7% | 12.1% |
| US dollar | 6.8% | 3.7% | 1.0% |
| Yen | - | 0.0% | 3.1% |
| Total | 5.7% | 11.3% | 9.6% |
The changes in the balance of Marketable debt instruments were as follows:
| Thousand of reais | 2017 | 2016 | 2015 |
| Balance at beginning of the year | 99,842,955 | 94,658,300 | 70,355,249 |
| Issuances | 59,663,420 | 50,313,469 | 72,936,057 |
| Payments | (97,009,957) | (56,164,769) | (63,516,234) |
| Interest (Note 34) | 7,901,199 | 12,212,922 | 10,047,874 |
| Exchange differences and Others | (150,605) | (1,305,204) | 4,835,354 |
| Additions arising from acquisitions of companies | - | 128,237 | - |
| Balance at end of the year | 70,247,012 | 99,842,955 | 94,658,300 |
On December 31, 2017, 2016 and 2015, none of these instruments was convertible into Bank shares or granted privileges or rights which, in certain circumstances, make them convertible into shares.
The note 45-d contains a detail of the residual maturity periods of financial liabilities at amortized cost in each year.
The breakdown of "Bonds and other securities" is as follows:
| | Issuance | Maturity | Currency | Interest rate (p.y) | 2017 | 2016 | 2015 |
| Eurobonds | 2011 | 2016 | USD | 4.2% | - | - | 3,268,431 |
| Eurobonds(1) | 2012 | 2016 | CHF | 3.3% | - | - | 603,889 |
| Eurobonds(1) | 2013 | 2016 | BRL | 8.0% | - | - | 1,255,841 |
| Eurobonds(1) | 2012 | 2016 | CLP | 4.6% | - | - | 135,388 |
| Eurobonds | 2014 | 2016 | USD | 1.5% to 2.0% | - | - | 192,583 |
| Eurobonds(1) | 2014 | 2016 | JPY | 1.8% | - | - | 35,743 |
| Eurobonds | 2014 | 2017 | USD | 2.1% to 2.4% | - | - | 27,473 |
| Eurobonds | 2015 | 2016 | USD | 0.4% to 3.0% | - | - | 2,614,244 |
| Eurobonds | 2015 | 2018 | USD | 2.2% | 40,333 | 39,727 | 47,598 |
| Eurobonds | 2015 | 2020 | USD | 2.9% | 10,656 | 10,206 | 11,877 |
| Eurobonds | 2007 | 2017 | BRL | FIDC | - | 1,930 | 7,122 |
| Eurobonds | 2015 | 2016 | BRL | 1.6% | - | - | 3,543 |
| Eurobonds | 2015 | 2016 | EUR | 0.8% to 1.0% | - | - | 195,603 |
| Eurobonds | 2016 | 2017 | USD | 0.7% to 2.5% | - | 3,408,932 | - |
| Eurobonds | 2017 | 2018 | USD | Zero Coupon to 2.4% | 1,195,668 | - | - |
| Eurobonds | 2017 | 2019 | USD | Libor 3M + 1.0% | 165,677 | - | - |
| Eurobonds | 2017 | 2024 | USD | 6.9% to 10.0% | 541,487 | - | - |
| Eurobonds | 2012 | 2017 | USD | 4.6% | - | 4,116,309 | 5,025,982 |
| Others | | | | | 39,007 | 144,542 | 40,056 |
| Total | | | | | 1,992,828 | 7,721,646 | 13,465,373 |
| (1) | On December 31, 2015 includes R$1,995,118 in cash flow hedge operations, being R$1,255,841 indexed in Reais, R$603,889 indexed on foreign currency - Swiss Franc, R$R$135,388 in Chilean Peso and R$35,743 for market risk hedge operations, being R$35,743 (R$24,480) indexed to foreign currency - YEN. |
BANCO SANTANDER (BRASIL) S.A.
NOTES TO THE CONSOLIDATED FINANCIAL STATEMENTS
(Thousands of Brazilian Reais - R$ - unless otherwise stated)
20. Subordinated liabilities
The detail of the balance of “Subordinated liabilities” is as follows:
| | Issuance | Maturity(1) | Amount (millions) | Interest rate | 2017 | 2016 | 2015 |
| Subordinated Liabilities | Jun-06 | Jul-16 | R$1,500 | 105.0% CDI | - | - | 4,196,347 |
| Subordinated Liabilities | Oct-06 | Sep-16 | R$850 | 104.5% CDI | - | - | 2,266,789 |
| Subordinated Liabilities | Jul-06 to Out-06 | Jul-16 | R$447 | 104.5% CDI | - | - | 1,230,505 |
| Subordinated Liabilities | May-08 | May-15 to May-18 | R$283 | CDI(2) | 109,572 | 98,378 | 114,467 |
| Subordinated Liabilities | May-08 to Jun-08 | May-15 to Jun-18 | R$268 | IPCA(3) | 409,658 | 367,868 | 289,196 |
| Total | | | | | 519,230 | 466,246 | 8,097,304 |
| (1) | Subordinated time deposits issued by Banco Santander S.A. with yield paid at the end of the term together with the principal. |
| (2) | Indexed by 100% and 112% of the CDI. |
| (3) | Indexed by the IPCA (extended consumer price index) plus interest of 8.3% p.a. to 8.4% p.a. |
The detail by currency, of the balance of “Subordinated liabilities” is as follows:
| Thousand of reais | | Average interest (%) |
| Currency: | 2017 | 2016 | 2015 | 2017 | 2016 | 2015 |
| Real | 519,230 | 466,246 | 8,097,304 | 7.5% | 9.6% | 14.6% |
| Total | 519,230 | 466,246 | 8,097,304 | 7.5% | 9.6% | 14.6% |
Changes in the balance of "Subordinated liabilities" in twelve-months period ended December 31, 2017, 2016 and 2015 were as follows:
| | 2017 | 2016 | 2015 |
| Balance at beginning of year | 466,246 | 8,097,304 | 7,294,077 |
| Payments | - | (8,362,652) | (216,075) |
| Interest (Note 34) | 52,984 | 731,594 | 1,019,302 |
| Balance at end of year | 519,230 | 466,246 | 8,097,304 |
Note 45-d contains a detail of the residual maturity periods of subordinated liabilities at each year-end in each year.
21. Debt Instruments Eligible to Compose Capital
Details of the balance of "Debt Instruments Eligible to Compose Capital" for the issuance of such instruments to compose the Tier I and Tier II of regulatory capital due to the Regulatory Capital Optimization Plan (Note 29.e), are as follows:
| | Issuance | Maturity | Issuance Value | Interest Rate (p.a.)(3) | 2017 | 2016 | 2015 |
| Tier I(1) | Jan-14 | no maturity (perpetual) | R$3,000 | 7.4% | 4,187,531 | 4,125,557 | 4,943,194 |
| Tier II(2) | Jan-14 | Jan-24 | R$3,000 | 6.0% | 4,249,370 | 4,186,361 | 5,015,843 |
| Total | | | | | 8,436,901 | 8,311,918 | 9,959,037 |
| (1) | Interest quarterly paid from April 29, 2014. |
| (2) | Interest semiannually paid from July 29, 2014. |
| (3) | The effective interest rate, considering the income tax source assumed by the issuer, is 8.676% and 7.059% for instruments Tier I and Tier II, respectively. |
BANCO SANTANDER (BRASIL) S.A.
NOTES TO THE CONSOLIDATED FINANCIAL STATEMENTS
(Thousands of Brazilian Reais - R$ - unless otherwise stated)
Changes in the balance of "Debt Instruments Eligible to Compose Capital" in twelve-months period ended December 31, 2017, 2016 and 2015 were as follows:
| | 2017 | 2016 | 2015 |
| Balance at beginning of year | 8,311,918 | 9,959,037 | 6,773,312 |
| Interest payment Tier I(1) | 273,123 | 276,587 | 277,024 |
| Interest payment Tier II(1) | 222,065 | 225,161 | 226,266 |
| Exchange differences / Others | 252,941 | (1,447,196) | 3,291,470 |
| Payments of interest - Tier I | (344,867) | (379,039) | (347,201) |
| Payments of interest - Tier II | (278,279) | (322,632) | (261,834) |
| Balance at end of the year | 8,436,901 | 8,311,918 | 9,959,037 |
| (1) | The remuneration of interest relating to the Debt Instruments Eligible to Compose Capital Tier I and II was recorded against income for the period as "Interest expense and similar charges". (Note 34) |
22. Other financial liabilities
The breakdown of the balances of these items is as follows:
| Thousand of reais | 2017 | 2016 | 2015 |
| Credit card obligations | 32,049,712 | 25,420,237 | 20,611,690 |
| Unsettled financial transactions(2) | 3,905,236 | 3,829,374 | 5,814,199 |
| Dividends payable | 4,553,914 | 4,346,128 | 2,846,433 |
| Tax collection accounts - Tax payables | 1,077,860 | 1,157,386 | 879,834 |
| Liability associated with the transfer of assets (Note 10.g) | 428,248 | 774,673 | 190,333 |
| Other financial liabilities(1) | 2,245,765 | 1,351,301 | 1,730,156 |
| Total | 44,260,735 | 36,879,099 | 32,072,645 |
| (1) | On December 31, 2017, includes the financial liabilities in the amount of R$484 million (2016 and 2015 - R$307 million) related to the put option’s commitment of the shares held by Banco Bonsucesso and R$1,223 million (2016 and 2015 - R$950 million) related to the put option having as object the shares held by non-controlling of Getnet SA. |
| (2) | Includes operations to settle with B3 S.A. (Current Company Name of BM&FBovespa) and payment orders in foreign currency. |
Note 45-d contains a detail of the residual maturity periods of other financial assets and liabilities at each year-end.
23. Provisions for pensions and similar obligations
On December 31, 2017 the balance of provisions for pension funds and similar obligations totaled R$3.923.457 (2016 - R$2,710,627 and 2015 - R$2,696,653).
ia. Supplemental Pension Plan
Banco Santander and its subsidiaries sponsor the closed pension entities for the purpose of granting pensions and supplementary pensions over those granted by the Social Security, as defined in the basic regulations of each plan.
I) Banesprev - Fundo Banespa de Seguridade Social (Banesprev)
- Plan I: defined benefit plan fully sponsored by Banco Santander, it covers employees hired after May 22, 1975 called Participants Recipients, and those hired until May 22, 1975 called Participants Aggregates, who are also entitled to death benefits. This plan is closed to new entrants since March 28, 2005.
- Plan II: defined benefit plan, constituted from July 27, 1994, effective of the new text of the Statute and Regulations of the Basic Plan II, Plan I participants who chose the new plan began to contribute to the rate of 44.9% stipulated by the actuary for funding each year, introduced in April 2012 extraordinary cost to the sponsor and participants, as agreed with the PREVIC - Superintendence of Pension Funds, due to deficit in the plan. This plan is closed to new entrants since June 3, 2005.
- Plan V: defined benefit plan fully sponsored by Banco Santander, it covers employees hired until May 22, 1975, closed and paid off.
- Supplemental Pension Plan Pré 75: defined benefit plan was created in view of the privatization of Banespa and is managed by Banesprev and offered only to employees hired before May 22, 1975, which its effective date is January 1, 2000. This plan is closed to new entrants since April 28, 2000.
- Plan III: variable contribution plan, for employees hired after May 22,1975, previously served by the Plans I and II. This plan receives contributions from the sponsor and the participants. The benefits are in the form of defined contribution during the period of contribution and defined benefit during the receipt of benefit, if paid as monthly income for life. Plan is closed to new entrants since September 1, 2005.
BANCO SANTANDER (BRASIL) S.A.
NOTES TO THE CONSOLIDATED FINANCIAL STATEMENTS
(Thousands of Brazilian Reais - R$ - unless otherwise stated)
- Plan IV: variable contribution plan, designed for employees hired as of November 27, 2000, in which the sponsor only contributes to the risk benefits and administrative expenses. In this plan the benefit is set in the form of defined contribution during the period of contribution and defined benefit during the receipt of benefits in the form of monthly income for life, in whole or in part of the benefit. The risk benefits of the plan are in defined benefit. This plan is closed to new entrants since July 23, 2010.
- Three plans (DCA, DAB and CACIBAN): additional retirement and former employees associated pension, arising from the process of acquisition of the former Banco Meridional, established under the defined benefit plan. The plans are closed to new participants.
- Plan Sanprev I: defined benefit plan, established on September 27, 1979, covering employees enrolled in the plan sponsor and it is in process of extinction since June 30, 1996.
- Plan Sanprev II: plan that provides insurance risk, pension supplement temporary, disability retirement annuity and the supplemental death and sickness allowance and birth, including employees enrolled in the plan sponsor and is funded solely by sponsors through monthly contributions, as indicated by the actuary. This plan is closed to new entrants since March 10, 2010.
- Plan Sanprev III: variable contribution plan covering employees of the sponsors who made the choice to contribute, by contribution freely chosen by participants from 2% of their salary. That the benefit plan is a defined contribution during the contribution and defined benefit during the receipt of the benefit, being in the form of monthly income for life, in whole or in part of the benefit. This plan is closed to new entrants since March 10, 2010.
II) Sanprev – Santander Associação de Previdência (Sanprev)
Closed-End Private Pension Entity (EFPC) that used to manage three benefit plans, 2 in the Defined Benefit modality and 1 in the modality of Variable Contribution, whose process of management transfer of these plans to Banesprev occurred in January 2017. At the stage of requesting the process of closure of the operating permit with PREVIC.
III) Bandeprev - Bandepe Previdência Social (Bandeprev)
Defined benefit plan, sponsored by Banco Bandepe and Banco Santander, managed by Bandeprev. The plans are divided into basic plan and special retirement supplement plan, with different eligibility requirements, contributions and benefits by subgroups of participants. The plans are closed to new entrants since 1999 for Banco Bandepe’s employees and for others since 2011.
IV) Other Plan
SantanderPrevi - Sociedade de Previdência Privada (SantanderPrevi): it´s a closed-end private pension entity with the purpose of constitution and implementation of social security pension plans, complementary to the social security contribution, in the form of actual legislation.
The Retirement Plan of SantanderPrevi is the only structured as Defined Contribution and open to new members, with contributions shared between sponsors and plan participants. The appropriate values by the sponsors in the year of 2017 was R$86,449 (2016 - R$87,603).
It has 10 cases of lifetime income with benefits arising from the previous plan.
ii. Health and Dental Care Plan
• Cabesp - Caixa Beneficente dos Funcionários do Banco do Estado de São Paulo S.A.
Entity that covers health and dental care expenses of employees hired until Banespa privatization in 2000, as defined in the entity’s bylaws.
• HolandaPrevi’s Retirees (current corporate name of SantanderPrevi)
For the health care plan Retirement has lifetime nature and is a closed group. In his termination the employee should have completed 10 years of employment with Banco Real and 55 years of age. In this case it was offered the continuity of health care plan where the employee pays 70% and the Bank pays 30% of the monthly payment. This rule lasted until December, 2002 and after this period that the employee got terminated with the status Retired Holandaprevi, he pays 100% of the health plan monthly payment.
• Former employees of Banco Real S.A. (retiree by Circulars)
It grants entitlement to healthcare to former employees of Banco Real, with lifetime benefit it was granted in the same condition as the active employee, in this case, with the same coverage and plan design.
Eligible only for basic plans and premium apartment, if the beneficiary chooses for the apartment plan he pays the difference between the plans plus the co-participation in the basic plan. Not allowed new additions of dependents. It is subsidized in 90% of the plan.
BANCO SANTANDER (BRASIL) S.A.
NOTES TO THE CONSOLIDATED FINANCIAL STATEMENTS
(Thousands of Brazilian Reais - R$ - unless otherwise stated)
• Bandeprev’s retirees
Health care plan granted to Bandeprev’s retirees as a lifetime benefit, for which Banco Santander is responsible for subsidizing 50% of the benefits of employees retired until November 27, 1998. For whom retired after this date, the subsidy is 30%.
• Directors with Lifetime Benefits (Lifetime Directors)
Lifetime health care benefit granted to a small closed group of former directors coming from Banco Sudameris, being 100% subsidized by the Bank.
• Free Clinic
Health care plan (free clinic) is offered for a lifetime to retirees who have contributed to the Foundation Sudameris for at least 25 years and has difference in default if the user chooses apartment. The plan is only offered in standard infirmary where the cost is 100% of the Foundation Sudameris.
• Life insurance for Banco Real’s retirees
For Retirees from Circulars: indemnity in case of Natural Death, Disease Disability, Accidental Death. The subsidy is 45.28% of the value. This benefit is also granted to retirees Fundação Sudameris where cost is 100% of the retired. It is a closed group.
Additionally, it is assured to retired employees, since they meet to certain legal requirements and fully pay their respective contributions, the right to be maintaining as a beneficiary of the Banco Santander health plan, in the same conditions for healthcare coverage, taken place during their employment contract. Banco Santander provisions related to this retired employees are calculated using actuarial based in the present value of the current cost.
iii. Actuarial Techniques
The amount of the defined benefit obligations was determined by independent actuaries using the following actuarial techniques:
• Valuation method:
Projected unit credit method, which uses each year of service as giving rise to an additional unit of benefit entitlement and measures each unit separately.
• Nominal discount rate for actuarial obligation and calculation of interest on assets:
- Banesprev, Sanprev, SantanderPrevi, Bandeprev and Other Plans - 9.53% (2016 - 10.9% and 2015 - 12.3%).
- Cabesp, Law 9,656 and others obligations - 9.65% (2014 - 10.8% and 2014 - 12.03%).
• Estimated long-term inflation rate:
- Banesprev, Sanprev, SantanderPrevi, Bandeprev and Other Plans - 4.0% (2016 - 4.5% and 2015 - 4.5%).
• Estimate salary increase rate:
- Banesprev, Sanprev, SantanderPrevi, Bandeprev Básico and Other Plans - 5.0% (2016 - 5.0% and 2015 - 5.0%).
The funding status of the defined benefit obligations in 2017 and in the last 2 years are as follows:
| Thousand of reais | 2017 | 2016 | 2015 |
| Present value of the obligations - Post-employment plans: | | | |
| To current employees | 796,243 | 770,423 | 753,697 |
| Vested obligations to retired employees | 21,205,366 | 19,998,703 | 16,772,102 |
| | 22,001,609 | 20,769,126 | 17,525,799 |
| Less: | | | |
| Fair value of plan assets | 20,689,637 | 20,116,916 | 16,275,269 |
| Unrecognized assets (1) | (1,090,682) | (969,161) | (963,031) |
| Provisions – Post-employment plans, net | 2,402,654 | 1,621,371 | 2,213,561 |
| Present value of the obligations - Other similar obligations: | | | |
| To current employees | 228,107 | 200,009 | 315,474 |
| Vested obligations to retired employees | 4,815,654 | 4,046,480 | 5,719,260 |
BANCO SANTANDER (BRASIL) S.A.
NOTES TO THE CONSOLIDATED FINANCIAL STATEMENTS
(Thousands of Brazilian Reais - R$ - unless otherwise stated)
| Thousand of reais | 2017 | 2016 | 2015 |
| | 5,043,761 | 4,246,489 | 6,034,734 |
| Less: | | | |
| Fair value of plan assets | 3,721,147 | 3,310,895 | 5,673,071 |
| Unrecognized assets(1) | - | - | (121,429) |
| Provisions – Other similar obligations, net | 1,322,614 | 935,594 | 483,092 |
| Total provisions for pension plans, net | 3,725,268 | 2,556,965 | 2,696,653 |
| Of which: | | | |
| Actuarial provisions | 3,923,457 | 2,710,627 | 2,696,653 |
| Actuarial assets (note 16) | 198,189 | 153,662 | - |
| (1) | Refers to fully funded plans Banesprev I and III, Sanprev I, II and III and Bandeprev. |
The amounts recognized in the consolidated income statement in relation to the aforementioned defined benefit obligations are as follows:
| Thousand of reais | Post-Employment Plans |
| | 2017 | 2016 | 2015 |
| Staff costs - Current service costs (note 41) | 14,605 | 15,416 | 20,560 |
| Interest and similar income and expenses - Interest cost (net) (notes 33 and 34) | 70,429 | 120,524 | 187,650 |
| Interest and similar income and expenses - Interest on unrecognized assets (notes 33 and 34) | 105,832 | 117,981 | 95,652 |
| Other movements | 5,323 | 4,355 | (2,607) |
| Total | 196,189 | 258,276 | 301,255 |
| Thousand of reais | Other Similar Obligations |
| | 2017 | 2016 | 2015 |
| Staff costs - Current service costs (note 41) | 5,476 | 9,064 | 10,740 |
| Interest and similar income and expenses - Interest cost (net) (notes 33 and 34) | 99,575 | 38,064 | 124,469 |
| Interest and similar income and expenses - Interest on unrecognized assets (notes 33 and 34) | - | 14,608 | - |
| Other movements | - | 55,943 | 27 |
| Total | 105,051 | 117,679 | 135,236 |
The changes in the present value of the accrued defined benefit obligations were as follows:
| Thousand of reais | Post-Employment Plans |
| | 2017 | 2016 | 2015 |
| Present value of the obligations at beginning of year | 20,769,126 | 17,525,799 | 17,891,352 |
| Current service cost (Note 41) | 14,605 | 15,416 | 20,560 |
| Interest cost | 2,170,639 | 2,046,949 | 1,877,942 |
| Benefits paid | (1,834,681) | (1,679,794) | (1,530,082) |
| Actuarial (gains)/losses | 871,308 | 2,844,733 | (753,155) |
| Others | 10,612 | 16,023 | 19,182 |
| Present value of the obligations at end of year | 22,001,609 | 20,769,126 | 17,525,799 |
| Thousand of reais | Other Similar Obligations |
| | 2017 | 2016 | 2015 |
| Present value of the obligations at beginning of year | 4,246,489 | 6,034,734 | 6,077,521 |
| Current service cost (Note 41) | 5,476 | 9,064 | 10,740 |
| Interest cost | 447,653 | 703,874 | 653,206 |
| Benefits paid | (339,538) | (465,029) | (421,429) |
| Actuarial (gains)/losses | 683,681 | 1,330,371 | (285,304) |
| Others(1) | - | (3,366,525) | - |
| Present value of the obligations at end of year | 5,043,761 | 4,246,489 | 6,034,734 |
| (1) | In the fourth quarter of 2016, Banco Santander updated the procedures for recognizing its obligations to the entity CABESP, in accordance with its bylaws, which establishes the coverage of medical costs in the equality of proportion between associates and sponsor. |
The changes in the fair value of the plan assets were as follows:
BANCO SANTANDER (BRASIL) S.A.
NOTES TO THE CONSOLIDATED FINANCIAL STATEMENTS
(Thousands of Brazilian Reais - R$ - unless otherwise stated)
| Thousand of reais | Post-Employment Plans |
| | 2017 | 2016 | 2015 |
| Fair value of plan assets at beginning of year | 20,116,916 | 16,275,269 | 16,067,029 |
| Interest (Expense) Income | 2,100,211 | 1,926,424 | 1,690,293 |
| "Remeasurement - Actual return (loss) on plan assets excluding the amounts included in net interest expense" | 268,309 | 1,589,517 | (297,461) |
| Contributions/(surrenders) | 38,883 | 2,001,806 | 298,198 |
| Of which: | | | |
| By the Bank | 27,439 | 1,985,722 | 279,111 |
| By plan participants | 11,444 | 16,084 | 19,087 |
| Benefits paid | (1,834,682) | (1,676,116) | (1,482,914) |
| Exchange differences and other items | - | 16 | 124 |
| Fair value of plan assets at end of year | 20,689,637 | 20,116,916 | 16,275,269 |
| Thousand of reais | Other Similar Obligations |
| | 2017 | 2016 | 2015 |
| Fair value of plan assets at beginning of year | 3,310,895 | 5,673,071 | 4,906,977 |
| Interest (Expense) Income | 348,078 | 665,811 | 528,737 |
| "Remeasurement - Actual return (loss) on plan assets excluding the amounts included in net interest expense" | 303,504 | 718,628 | 581,755 |
| Contributions/(surrenders) | 61,803 | - | 52,894 |
| Of which: | - | | |
| By the Bank | 61,803 | - | 52,894 |
| Benefits paid | (303,133) | (3,746,615) | (397,292) |
| Fair value of plan assets at end of year | 3,721,147 | 3,310,895 | 5,673,071 |
Opening of gains (losses) Actuarial from experience, financial assumptions and demographic hypotheses:
| Thousand of reais | Post-Employment Plans |
| | 2017 | 2016 | 2015 |
| Experience Plan | 686,204 | (696,910) | (1,299,660) |
| Changes in Financial Assumptions | (1,557,689) | (2,135,189) | 2,049,061 |
| Changes in Financial Demographic | 146 | (12,773) | - |
| Gain (Loss) Actuarial - Obligation | (871,339) | (2,844,872) | 749,401 |
| Return on Investment, Return Unlike Implied Discount Rate | 270,158 | 1,589,446 | (297,271) |
| Gain (Loss) Actuarial - Asset | 270,158 | 1,589,446 | (297,271) |
| Changes in Surplus Uncollectible | (15,690) | - | - |
| Thousand of reais | Other Similar Obligations |
| | 2017 | 2016 | 2015 |
| Experience Plan | (303,396) | (1,116,845) | (433,550) |
| Changes in Financial Assumptions | (380,285) | (537,952) | 718,854 |
| Changes in Financial Demographic | - | (379) | - |
| Gain (Loss) Actuarial - Obligation | (683,681) | (1,655,176) | 285,304 |
| Return on Investment, Return Unlike Implied Discount Rate | 303,504 | 718,628 | 581,755 |
| Gain (Loss) Actuarial - Asset | 303,504 | 718,628 | 581,755 |
BANCO SANTANDER (BRASIL) S.A.
NOTES TO THE CONSOLIDATED FINANCIAL STATEMENTS
(Thousands of Brazilian Reais - R$ - unless otherwise stated)
The experience adjustments arising from plan assets and liabilities are shown below:
| Thousand of reais | Post-Employment Plans |
| | 2017 | 2016 | 2015 |
| Experience in Net Assets Adjustments | 268,309 | 1,589,517 | (297,461) |
| Thousand of reais | Other Similar Obligations |
| | 2017 | 2016 | 2015 |
| Experience in Net Assets Adjustments | 303,504 | 718,628 | 581,755 |
The amounts of actuarial obligation of defined benefit plans uninsured and defined benefit plans partially or totally covered are shown below:
| Thousand of reais | 2017 | 2016 | 2015 |
| Defined benefit plans uninsured | 701,551 | 826,963 | 878,550 |
| Defined benefit plans partially or totally covered | 26,343,818 | 22,734,017 | 23,090,769 |
In 2018 the Bank expects to make contributions to fund these obligations for amounts similar to those made in 2017.
The main categories of plan assets as a percentage of total plan assets are as follows:
| | 2017 | 2016 | 2015 |
| Equity instruments | 4.60% | 1.00% | 0.48% |
| Debt instruments | 94.70% | 98.16% | 98.54% |
| Properties | 0.35% | 0.30% | 0.28% |
| Other | 0.35% | 0.54% | 0.70% |
The expected return on plan assets was determined on the basis of the market expectations for returns over the duration of the related obligations.
The actual return on plan assets was R$3,021,950 (2016 - R$4,900,380 and 2015 - R$2,503,610).
The following table shows the estimated benefits payable on December 31, 2017 for the next ten years:
| Thousand of reais | |
| 2018 | 2,003,227 |
| 2019 | 2,076,856 |
| 2020 | 2,149,325 |
| 2021 | 2,221,682 |
| 2022 | 2,291,726 |
| 2023 to 2027 | 12,431,279 |
| Total | 23,174,095 |
Assumptions about the rates related to medical care costs have a significant impact on the amounts recognized in income. A change of one percentage point in the medical care cost rates would have the effects as follows:
| Thousand of reais | | |
| | (+) 1.0% | (-) 1.0% |
| Effect on current service cost and interest on actuarial liabilities | 57,001 | (63,510) |
| Effects on present value of obligation | 597,410 | (665,700) |
BANCO SANTANDER (BRASIL) S.A.
NOTES TO THE CONSOLIDATED FINANCIAL STATEMENTS
(Thousands of Brazilian Reais - R$ - unless otherwise stated)
The following table shows the duration of the actuarial liabilities of the plans sponsored by Banco Santander:
| Plans | Post-Employment Plans |
| | Duration (in years) |
| Banesprev Plans I | 11.26 |
| Banesprev Plans II | 11.51 |
| Banesprev Plans III | 9.03 |
| Banesprev Plans IV | 13.86 |
| Banesprev Plans V | 8.82 |
| Banesprev Pre-75 | 9.57 |
| Sanprev I | 6.46 |
| Sanprev II | 10.94 |
| Sanprev III | 9.46 |
| Bandeprev Basic | 9.46 |
| Bandeprev Special I | 6.75 |
| Bandeprev Special II | 6.61 |
| SantanderPrevi | 7.20 |
| CACIBAN / DAB / DCA | 6,87 / 5,82 / 6,41 |
| Plans | Other Similar Obligations |
| Cabesp | 13.02 |
| Law 9656 | - |
| Bandepe | 14.47 |
| Free Clinic | 10.88 |
| Lifetime officers | 8.49 |
| Circulars(1) | 12,4e10,15 |
| Life Insurance | 7.64 |
| (1) | The duration 12.91 refers to the plan of Former Employees of Banco ABN Amro and 10.05 to the plan of Former Employees of Banco Real. |
Actuarial Assumptions Adopted in Calculations
| | Pension | 2017 Health | Pension | 2016 Health | Pension | 2015 Health |
| Nominal Discount Rate for Actuarial Obligation | 9.5% | 9.7% | 10.9% | 10.8% | 12.3% | 12.0% |
| Rate Calculation of Interest Under Assets to the Next Year | 9.5% | 9.7% | 10.9% | 10.8% | 12.3% | 12.0% |
| Estimated Long-term Inflation Rate | 4.0% | 4.0% | 4.5% | 4.5% | 4.5% | 4.5% |
| Estimated Salary Increase Rate | 5.0% | 5.0% | 5.0% | 5.0% | 5.0% | 5.0% |
| Mortality tables | AT2000 | AT2000 | AT2000 | AT2000 | AT2000 | AT2000 |
| (1) | For Banesprev II, V and Pré 75 plans. |
24. Provisions for judicial and administrative proceedings, commitments and other provisions
a) Breakdown
The breakdown of the balance of “Provisions” is as follows:
| Thousand of reais | 2017 | 2016 | 2015 |
| Judicial and administrative proceedings under the responsibility of former controlling stockholders (Note 16) | 707,131 | 814,925 | 789,974 |
| Judicial and administrative proceedings | 8,365,320 | 7,470,344 | 7,000,680 |
| Of which: | | | |
| Civil | 2,522,005 | 1,842,549 | 1,986,602 |
| Labor | 3,448,388 | 3,138,645 | 2,501,426 |
| Tax and Social Security | 2,394,927 | 2,489,150 | 2,512,652 |
| Others provisions(1) | 991,008 | 780,595 | 922,370 |
| Total | 10,063,459 | 9,065,864 | 8,713,024 |
| (1) | In 2017, includes R$287,446 (2016 - R$450,284 and 2015 - R$301,447) relating to the expenses of projects aimed at improving operational productivity and efficiency. |
BANCO SANTANDER (BRASIL) S.A.
NOTES TO THE CONSOLIDATED FINANCIAL STATEMENTS
(Thousands of Brazilian Reais - R$ - unless otherwise stated)
b) Changes
The changes in “Provisions” were as follows:
| Thousand of reais | | | 2017 |
| | Provisions(2) | Other Provisions(1) | Total |
| Balance at beginning of year | 2,710,626 | 9,065,864 | 11,776,490 |
| Additions charged to income: | | | |
| Interest expense and similar charges (Note 33 & 34) | 275,836 | - | 275,836 |
| Personnel Expenses (Note 41) | 20,081 | - | 20,081 |
| Additions to provisions | 1,723 | 3,112,684 | 3,114,407 |
| Other Comprehensive Income | 1,028,090 | - | 1,028,090 |
| Payments to external funds | (127,357) | - | (127,357) |
| Amount used | - | (2,123,483) | (2,123,483) |
| Transfer to other assets - actuarial assets (Note 16) | 14,457 | - | 14,457 |
| Transfers, exchange differences and other changes | - | 8,394 | 8,394 |
| Balance at end of year | 3,923,456 | 10,063,459 | 13,986,915 |
| (1) | Refers substantially to provisions for tax risks and legal obligations and judicial and administrative proceedings for labor and civil actions. |
| (2) | For further information, see note 23. Provisions for pension funds and similar obligations. |
| Thousand of reais | | | 2016 |
| | Provisions(2) | Other Provisions(1) | Total |
| Balance at beginning of year | 2,696,653 | 8,713,024 | 11,409,677 |
| Additions charged to income: | | | |
| Interest expense and similar charges (Note 34) | 287,576 | - | 287,576 |
| Personnel Expenses (Note 41) | 24,480 | - | 24,480 |
| Additions to provisions | 60,309 | 2,645,764 | 2,706,073 |
| Other Comprehensive Income | 1,876,888 | - | 1,876,888 |
| Payments to external funds | (2,074,873) | - | (2,074,873) |
| Amount used | - | (2,330,283) | (2,330,283) |
| Transfer to other assets - actuarial assets (Note 16) | (153,595) | - | (153,595) |
| Transfers, exchange differences and other changes | (6,812) | 37,359 | 30,547 |
| Balance at end of year | 2,710,626 | 9,065,864 | 11,776,490 |
| (1) | Refers substantially to provisions for tax risks and legal obligations and judicial and administrative proceedings for labor and civil actions. |
| (2) | For further information, see note 23. Provisions for pension funds and similar obligations. |
| Thousand of reais | | | 2015 |
| | Provisions(2) | Other Provisions(1) | Total |
| Balance at beginning of year | 3,869,728 | 7,257,716 | 11,127,444 |
| Additions charged to income: | | | |
| Interest expense and similar charges (Note 34) | 404,171 | - | 404,171 |
| Personnel Expenses (Note 41) | 31,332 | - | 31,332 |
| Additions to provisions | (3,912) | 3,997,463 | 3,993,551 |
| Payments to pensioners and early retirees with a change to internal provisions | (47,682) | - | (47,682) |
| Payments to external funds | (354,534) | - | (354,534) |
| Amount used | - | (2,225,641) | (2,225,641) |
| Other Comprehensive Income | (1,202,450) | - | (1,202,450) |
| Transfers, exchange differences and other changes | - | (315,646) | (315,646) |
| Sale of companies(1) | - | (868) | (868) |
| Balance at end of year | 2,696,653 | 8,713,024 | 11,409,677 |
| (1) | Refers substantially to provisions for tax risks and legal obligations and judicial and administrative proceedings for labor and civil actions. |
| (2) | For further information, see note 23. Provisions for pension funds and similar obligations. |
BANCO SANTANDER (BRASIL) S.A.
NOTES TO THE CONSOLIDATED FINANCIAL STATEMENTS
(Thousands of Brazilian Reais - R$ - unless otherwise stated)
c) Provisions for civil, labor, tax and social security contingencies
Banco Santander and its subsidiaries are involved in lawsuits and administrative tax, labor and civil proceedings arising in the normal course of its activities.
The provisions were constituted based on the nature, complexity, lawsuits historic and company´s assessment of lawsuit losses based on the opinions of internal and external legal advisors. The Santander has the policy to constitute provision of full amount of lawsuits whose the result of loss assessment is probable. The legal obligation of tax and social security were fully recognized in the financial statements.
Management understands that the provisions recorded are sufficient to meet legal obligations and losses from lawsuits and administrative proceedings as follows:
c.1) Lawsuits and Administrative Proceedings - Tax and Social Security
In October 2017, the Bank also joined the Incentive Payment and Installment Programs of the municipalities of São Paulo and Rio de Janeiro. Adhesions to the programs included payment of administrative and legal proceedings related to the ISS, related to the periods 2005 to 2016, in the total of R$292,562. As a consequence, provisions were reversed in the amount of R$435,454. In the Statement of Income, a reversal of provisions was recorded, net of tax effects, in the total of R$96,129.
In August, 2017, The Bank and its affiliates joined a federal amnesty program established by MP (Law) 783/2017 and reissues.
The adherence to the program included judicial and administrative tax cases related to Income Tax, Social Contribution and Social Security Contributions from 1999 to 2005 tax periods, in the total of R$534,001, after the benefits of the amnesty program, of which R$191,897 payment was due in August 2017 and R$342,104 can be done until January 2018. As a consequence of joining the program, it was recognized in the P&L expenses on the total amount of R$333,996, after tax effects.
The main lawsuits related to tax legal obligations, recorded in the heading "Tax Liabilities - Current", fully registered as obligation, are described below:
• PIS and Cofins - R$3,501,464 (2016 - R$3,290,900 and 2015 - R$3,015,147): Banco Santander and its subsidiaries filed lawsuits aiming to eliminate the application of Law 9,718/1998, which modified the calculation basis of PIS and Cofins applied to all revenues of legal entities and not only to those arising from services rendered and sale of goods. Regarding the Banco Santander lawsuit, on April 23, 2015, it was published the STF decision admitting the Extra common Appeal filed by the Federal Government regarding PIS and denying the move forward of the Extra common Appeal of the Federal Public Prosecutor regarding Cofins. Both appealed this decision, without any success, so that the lawsuit relating to Cofins is defined, prevailing the judgment of the Federal Regional Court of the 4th Region of August 2007, favorable to Banco Santander. The eligibility of PIS by Banco Santander and the eligibility of PIS and Cofins by the other controlled companies are pending of final judgment by the STF. In fiscal year 2015, with the decision of the STF, Banco Santander reversed the balance of the provision constituted to cover legal obligations related to Cofins, in the amount of R$7,950 million (R$4,770 million, after tax effects).
• Increase in CSLL tax rate - R$905,113 (2016 - R$851,744 and 2015 - R$795,859) – the Bank Santander and its subsidiaries are discussing the increase in the CSLL tax rate, from 9% to 15%, established by Executive Act 413/2008, subsequently converted into Law 11,727/2008, as from April 2008. The lawsuits are still pending of judgment.
Banco Santander and its subsidiaries are parties in lawsuits and administrative proceedings related to tax and social security matters, which their risk of loss are classified as probable, based on the opinion of legal counsel.
The main topics discussed in these lawsuits are:
• Tax on Services for Financial Institutions (ISS) - R$237,960 (2016 - R$621,437 and 2015 - R$755,211): The Banco Santander and its subsidiaries filed lawsuits and administrative proceedings to challenge some municipalities collection of ISS on certain revenues derived from transactions not usually classified as services.
• Social Security Contribution (INSS) - R$265,022 (2016 - R$266,391 and 2015 - R$527,111): Banco Santander and its subsidiaries got into lawsuits and administrative proceedings to challenge the collection of income tax on social security and education allowance contributions over several funds that, according to the evaluation of legal advisors, do not have nature of salary.
• Provisional Contribution on Financial Transactions (CPMF) on Customer Operations - R$714,604 (2016 – R$689,987 and 2015 – R$657,750): In May 2003, the Federal Revenue Service issued a tax assessment against Santander Distribuidora de Títulos e Valores Mobiliários Ltda. (Santander DTVM) and another tax assessment against Banco Santander Brasil S.A. The tax assessments refer to the collection of CPMF on transactions conducted by Santander DTVM in the cash management of its customers’ funds and clearing services provided by Banco to Santander DTVM in 2000, 2001 and the first two months of 2002. In June 2015 , Bank and DTVM had obtained a non favorable decision at the Board of Tax Appeals (CARF). On July 3rd , 2015 Bank and Produban Serviços de Informática S.A. (actual Santander DTVM company name) filed lawsuit aiming to cancel both tax charges on the period ended December 31, 2017 totaled R$1,431,761 million. Based on the evaluation of legal advisors, it was constituted provision to lawsuits with risk of loss as probable.
BANCO SANTANDER (BRASIL) S.A.
NOTES TO THE CONSOLIDATED FINANCIAL STATEMENTS
(Thousands of Brazilian Reais - R$ - unless otherwise stated)
c.2) Lawsuits and Administrative Proceedings - Labor
These are lawsuits filed by labor Unions, Associations, Public Prosecutors and former employees claiming labor rights they believe are due, especially payment for overtime and other labor rights, including retirement benefit lawsuits.
For claims considered to be similar and usual, provisions are recognized based on the payments and successes historic. Claims that do not fit the previous criteria have their provisions constituted according to individual assessment performed, and provisions being constituted based on the risk of loss as probable, the law and jurisprudence according to the assessment of loss made by legal counsel.
c.3) Lawsuits and Administrative Proceedings - Civil
These contingencies are generally caused by: (1) Lawsuits with a request for revision of contractual terms and conditions or requests for monetary adjustments, including supposed effects of the implementation of various government economic plans, (2) lawsuits deriving of financing agreements, (3) lawsuits of execution; and (4) lawsuits of indemnity by loss and damage. For civil lawsuits considered common and similar in nature, provisions are recorded based on the average of cases closed. Claims that do not fit the previous criteria are provisioned according to individual assessment performed, and provisions are based on the risk of loss as probable, the law and jurisprudence according to the assessment of loss made by legal counsel.
The main lawsuits with the classification of risk of loss as probable are described below:
• Lawsuits for indemnity - seeking indemnity for material and emotional damage, regarding the consumer relationship on matters related to credit cards, consumer credit, bank accounts, collection and loans and other operations. In the civil lawsuits considered to be similar and usual, provisions are recorded based on the average of cases closed. Civil lawsuits that do not fit into the previous criteria are provisioned according to the individual assessment made, being the provisions recognized based on the risk of loss as probable, the law and jurisprudence according to the assessment of loss made by legal counsel.
• Economic Plans – they referred to lawsuits filed by savings accountholders, related to supposed inflation purge arising from the Economic Plans (Bresser, Verão, Collor I and II), based on the understanding that such plans violated acquired rights relating to the application of inflation indexes on Saving Accounts, Lawsuits Deposits and Time Deposits (CDB). Provisions arising from such lawsuits are recorded based on the individual evaluation of loss made by external legal consultants.
The Banco Santander is also party in public class lawsuits on the same matter filed by consumer rights organizations, Public Prosecutor’s Offices and Public Defender’s Offices. The provision is made for the lawsuits with the classification of risk as probable, based on the individual execution orders. The STF is still analyzing the subject and has already ordered the suspension of all the procedures except those that were not already decided in courts or in phase of definitive execution. There are decisions favorable to banks at the STF with regard to the economic phenomenon similar to the savings accounts, as in the case of monetary restatement of time deposits - CDB and agreements (present value table).
However, the Supreme Court´s jurisprudence has not come to a conclusion regarding the constitutionality of the norms that changed Brazil’s monetary standard. On April 14, 2010, the STJ was recently decided that the deadline for the filing of civil lawsuits that argue the government’s purge is five years, but this decision has not been handed down on the lawsuits yet. Thus, with this decision, a majority lawsuits, as they were filed after the period of five years is likely to be rejected, reducing the values involved. Still, the STF decided that the deadline for individual savers to become party on the public civil litigations, is also five years, counted from the final unappealable sentence. Banco Santander believes in the success of the arguments defended in these courts based on their content and the legal basis.
At the end of 2017, the General Union Law (AGU), Bacen, Institute of Consumer Protection (Idec), the Brazilian Front of the Moneysavers (Febrapo), the Brazilian Banks Federation (Febraban) have signed an agreement with the purpose to close all lawsuits related to Economic Plans.
The discussions focused on the definition of the amount that would be paid to each person according to the outstanding balance in the saving account. The total amount of the payments will depend on the number of the additional clients, and also on the number of moneysavers that approved in the courts the existence of their account and balance in the birthday date of the indexes changes. The term of the agreement signed by the parties was submitted to the STF, which is responsible to decide about its viability.
The Management considers that the provision made are enough to cover the risks involved in the economic plans, considering the possible agreement which awaits the Supreme Court decision.
c.4) Civil, Labor, Tax, and Security Social Liabilities Contingent Classified with Loss Risk as Possible:
Refer to lawsuits and administrative proceedings involving tax, labor and civil matters classified by legal counsels with loss risk as possible, which they were not recorded.
The tax lawsuits classification with loss risk as possible, totaled R$18,720 million, being the main lawsuits as follow:
BANCO SANTANDER (BRASIL) S.A.
NOTES TO THE CONSOLIDATED FINANCIAL STATEMENTS
(Thousands of Brazilian Reais - R$ - unless otherwise stated)
• Credit Losses - Bank and its subsidiaries challenged the tax assessments issued by the Federal Revenue Services claiming the deduction for credit losses because they fail to meet the relevant requirements under applicable law. As of December 31, 2017 the amount related to this challenge is approximately R$436 million.
• INSS on Profit Sharing Payments – Bank and the subsidiaries are involved in several lawsuits and administrative proceedings against the tax authorities in connection with the taxation for social security purposes of certain items which are not considered to be employee remuneration. As of December 31, 2017 the amounts related to these proceedings totaled approximately R$3,929 million.
• IRPJ and CSLL - Capital Gain - the Federal Tax Office of Brazil issued infraction notices against Santander Seguros, successor company of ABN AMRO Brasil Dois Participações S.A. (AAB Dois Par), charging income Tax and Social Contribution to related base year 2005. The Federal Tax Office of Brazil claims that capital gain in sales of shares from Real Seguros S.A and Real Vida Previdência S.A. by AAB Dois Par should be taxed by the rate of 34% instead 15%. The assessment was contested administratively based on understanding that tax treatment adopted at the transaction was in compliance with tax laws and capital gain was taxed properly. The administrative lawsuit is awaiting trial. The Banco Santander is responsible for any adverse outcome in this lawsuit as former Zurich Santander Brasil Seguros e Previdência S.A. stockholder. As of December 31, 2017 the amount related to this proceeding is approximately R$292 million.
• ‘Goodwill Amortization of Banco Real - the Federal Tax Office of Brazil issued infraction notices against the Bank to require the income tax and social payments, including late charges, for the period of 2009. The Tax Authorities considered that the goodwill related to acquisition of Banco Real, amortized for accounting purposes prior to the merger, could not be deduced by Banco Santander for tax purposes. The infraction notice was contested. On July 14, 2015, the Police Judging RFB decided favorably to Banco Santander, fully canceling the tax debt. This decision will craft appealed before the CARF. As of December 31, 2017,the balance was approximately R$1,332 million.
• Goodwill amortization of Banco Sudameris – the Tax Authorities have issued infraction notices to require the income tax and social contribution payments, including late charges, relating to tax deduction of amortization of goodwill from the acquisition of Banco Sudameris, related to the period of 2007 to 2012. Banco Santander timely presented its appeals, which are pending. On December 31, 2017, the balance was approximately R$609 million.
• Unrecognized Compensation – The Bank and its affiliates discuss administrative and legal proceedings with the Brazilian Federal Revenue, the not ratification of tax offsets with credits due to overpayment or undue payment. On December 31, 2017, the figure was R$2,230 million.
The labor claims with classification of loss risk as possible totaled R$28.71 million, excluding the lawsuits below:
Semiannual Bonus or PLR - a labor lawsuit relating to the payment of a semiannual bonus or, alternatively, profit sharing, to retired employees from Banco do Estado de São Paulo S.A. - Banespa, that had been hired up to May 22, 1975, filed by Banespa’s Retirees Association. This lawsuit was dismissed against the Bank by the Superior Labor Court. The STF rejected the extra common appeal of the Bank by a monocratic decision maintaining the earlier condemnation. Santander filed a Regimental Appeal which holds STF´s decision. The Regimental Appeal is an internal appeal filed in the STF, in order to refer the monocratic decision to a group of five ministers. The 1st Class of the Supreme Court upheld the appeal by the Bank and denied the Afabesp. The subjects of the extra common appeal of the Bank will move forward to the Supreme Court for decision on overall impact and judgment. The amount related to this claim is not disclosed due to the current stage of the lawsuit and such disclosure may impact the progress of the claim.
Readjustment of Banesprev retirement complements by the IGPDI - lawsuit filed in 2002 in Federal Court by the Association of Retired Employees of the Banco do Estado de São Paulo S.A. - Banespa, requesting the readjustment of the retirement supplementation by the IGPDI for Banespa retirees who have been admitted until May 22, 1975. The judgment granted the correction but only in the periods in which no other form of adjustment could be applied. The Bank and Banesprev have appealed this decision and although the appeals have not yet been judged, the Bank’s success rate in this matter in the High Courts is around 90%. In Provisional Execution, calculations were presented by the Bank and Banesprev with "zero" result due to the exclusion of participants who, among other reasons, are listed as authors in other lawsuits or have already had some type of adjustment. The amount related to this claim is not disclosed due to the current stage of the lawsuit and such disclosure may impact the progress of the claim.
The liabilities related to civil lawsuits with classification of loss risk as possible R$1,356 million, being the main processes as follows:
Indemnity lawsuit arising of the Banco Bandepe - related to mutual agreement on appeal to the Justice Superior Court (STJ - Superior Tribunal de Justiça)
Indemnity lawsuit related to custody services - provided by Banco Santander (Brasil) S.A. at an early stage which was not handed down yet;
Lawsuit arising out of a contractual dispute - the acquisition of Banco Geral do Comércio S.A. on appeal to the Court of the State of São Paulo (TJSP - Tribunal de Justiça do Estado de São Paulo).
BANCO SANTANDER (BRASIL) S.A.
NOTES TO THE CONSOLIDATED FINANCIAL STATEMENTS
(Thousands of Brazilian Reais - R$ - unless otherwise stated)
c.5) Judicial and administrative proceedings under the responsibility of former controlling stockholders
Refer to tax, labor and civil lawsuits in the amounts of R$698,141, R$2,607 and R$6,381 (2016 -R$810,383, R$712 and R$3,830 and 2015 - R$785,837, R$890 and R$3,247), with responsibility of the former controlling stockholders of the bank and acquired entities. Based on the agreements signed these lawsuits have guarantees of full reimbursement by the former controlling stockholders, and amounts reimbursable were recorded under other assets.
25. Tax assets and liabilities
a) Income and Social Contribution Taxes
The total charge for the year can be reconciled to accounting profit as follows:
| Thousand of reais | 2017 | 2016 | 2015 |
| Operating Profit Before Tax | 14,513,684 | 16,383,902 | (3,215,718) |
| Interest on capital(1) | (3,800,000) | (3,850,000) | (1,400,000) |
| Operating Profit Before Tax | 10,713,684 | 12,533,902 | (4,615,718) |
| Rates (25% income tax and 20% social contribution tax in 2015) | (4,821,158) | (5,640,256) | 2,077,073 |
| PIS and COFINS (net of income and social contribution taxes)(2) (8) | (1,427,960) | (1,641,181) | 1,861,767 |
| Non-taxable/Non-deductible: | | | |
| Equity in affiliates | 32,198 | 21,392 | 52,340 |
| Goodwill(3) | (669,963) | (734,952) | (1,252,578) |
| Exchange variation - foreign branches(4) | 440,857 | (3,561,133) | 5,913,741 |
| Net Indeductible Expenses of Non-Taxable Income(8) | 194,737 | - | - |
| Adjustments: | | | |
| Constitution of income and social contribution taxes on temporary differences(5) | 1,138,005 | 605,058 | 1,266,588 |
| Effects of change in rate of social contribution taxes(6)(7) | (1,427,667) | (613,202) | 52,145 |
| Other adjustments(7) | 1,165,315 | 2,645,290 | 3,078,468 |
| Income taxes | (5,375,636) | (8,918,984) | 13,049,544 |
| Of which: | | | |
| Current tax(8) | (4,969,241) | (3,575,099) | 3,631,631 |
| Deferred taxes | (406,395) | (5,343,885) | 9,417,913 |
| Taxes paid in the year | (3,280,230) | (4,240,115) | (1,170,020) |
| (1) | Amount distributed to shareholders as interest attributable to shareholders’ equity. For accounting purposes, although the interest should be reflected in the income statement for tax deduction, the charge is reversed before the calculation of the net income in the financial statements and deducted from the shareholders’ equity since it is considered as dividend. |
| (2) | PIS and COFINS are considered a profit-base component (net basis of certain revenues and expenses), therefore and accordingly to IAS 12 they are recorded as income taxes. |
| (3) | The difference between the tax basis and accounting basis of goodwill on acquisition of Banco ABN Amro Real S.A. is a permanent and definitive difference. Administration in this case the possibility of loss on impairment or disposal is remote and only applies to the entity as a whole and according to the characteristics of the business combination performed, it is not possible to segregate and identify the business originally acquired. Therefore deferred tax liability is not record. |
| (4) | Permanent difference related of foreign currency exchange variation on investments abroad nontaxable/ deductible (see details below). |
| (5) | In 2015, includes the increase in CSLL tax rate |
| (6) | Effect of the rate differential for other non-financial corporations, with a social contribution rate of 9%, as well as the effect of the additional 5% applicable to financial institutions, valid until the end of 2018. |
| (7) | In 2016, includes the IAS 21 amounted to R$575.131 (see Hedge of Investments Abroad below) and non-taxable income/non-deductible expenses R$349.120. |
| (8) | Includes mainly the tax effect on expenses with donations, revenues from judicial deposit updates and other income and other income and expenses that do not qualify as temporary differences. |
Cofins(8)
In June 2015, Banco Santander recorded the reversal of legal liabilities (recorded in the heading of tax liabilities - current) amounted to R$7,950 million related to Cofins. On the Consolidated Income Statements the registration occurred in the heading "Interest expense and similar charges" amounted to R$2,057 million and "Income Taxes", amounted to R$5,893 million (Note 23-c.1). Such gain taxed at the current rates of IR and CSLL, resulted in a R$3,180 of tax expense also recorded in the heading "Income taxes."
With this decision handed down on the lawsuits , the Bank also recognizes the right to offset COFINS paid in the period 1999-2006, in the heading Income taxes of R$381,597 and Interest and similar income update as to tax offset the amount of R$383,560. The amount of taxes on these revenues amounted to R$306,102.
BANCO SANTANDER (BRASIL) S.A.
NOTES TO THE CONSOLIDATED FINANCIAL STATEMENTS
(Thousands of Brazilian Reais - R$ - unless otherwise stated)
Tax Hedge of Grand Cayman and of Santander Brasil EFC
Banco Santander operates an agency in the Cayman Islands and a subsidiary called Santander Brasil Establecimiento Financiero de Credito, EFC, or "Santander Brasil EFC" (an independent subsidiary in Spain), which are used primarily to raise funds in the capital and financial markets to provide the Bank with credit lines that are extended to its clients for foreign trade and working capital financing.
To hedge exposure to exchange rate variations, the Bank uses derivatives and funding. In accordance with Brazilian tax rules, gains or losses arising from the impact of the appreciation or depreciation of the Real on foreign investments are not taxable for PIS / Cofins / IR / CSLL purposes, while the gains or losses of the derivatives used as hedges are taxable. The purpose of these derivatives is to protect net income after taxes.
Tax treatment distinct from such exchange rate differences results in volatility in "Operating Income Before Tax" and "Income taxes". The foreign exchange variations recorded as a result of foreign investments in the exercise ended December 31, 2017 resulted in gain of R$893 million (2016 - loss R$7,408 million and 2015 - gain R$14,779). On the other hand, derivative contracts contracted to cover these positions generated a loss recorded on "Gains (losses) on financial assets and liabilities" of R$1,703 million (2016 - gain R$14,123 million and 2015 - loss R$26,311 million). The tax effect of these derivatives impacted the line of "income tax", generating a gain of R$810 million (2016 - loss R$6,140 million and 2015 - gain R$11,532), composed of R$80 million (2016 - R$657 million and 2015 - R$1,223 million) of PIS / Cofins and R$730 million (2016 - R$6,058 million and 2015 R$10,308 million) of IR / CSLL.
b) Effective tax rate calculation
The effective tax rate is as follows:
| Thousand of reais | 2017 | 2016 | 2015 |
| Operating Profit Before Tax | 14,513,684 | 16,383,902 | (3,215,718) |
| Income tax | 5,375,636 | 8,918,984 | (13,049,544) |
| Effective tax rate(1) | 37.04% | 54.44% | 405.80% |
| (1) | In 2017, 2016 and 2015, considering the tax effect of the exchange variation over foreign branches and the economic hedge, accounted in the Gains (losses) on financial assets and liabilities (net) the effective tax rate would have been 40.4%, 27.1% and -18.3%, respectively. In 2015 there were the gain on the Cofins lawsuit (see disclosure above), which excluding the effects the effective tax rate would be 19.1%. |
c) Tax recognized in equity
In addition to the income tax recognized in the consolidated income statement, the Bank recognized the following amounts in consolidated equity:
| Thousand of reais | 2017 | 2016 | 2015 |
| Tax credited to equity | 3,373,984 | 2,955,552 | 4,943,957 |
| Measurement of available-for-sale securities | 1,016,121 | 963,990 | 2,743,797 |
| Measurement of cash flow hedges | 1,063 | 4,145 | 267,511 |
| Measurement of investment hedges | 562,353 | 562,353 | 1,137,484 |
| Defined benefit plan | 1,794,447 | 1,425,064 | 795,165 |
| Tax charged to equity | (2,541,177) | (1,795,115) | (1,255,867) |
| Measurement of available-for-sale securities | (2,426,459) | (1,701,732) | (1,251,773) |
| Measurement of cash flow hedges | (111,134) | (87,929) | (2,250) |
| Defined benefit plan | (3,584) | (5,454) | (1,844) |
| Total | 832,807 | 1,160,437 | 3,688,090 |
d) Deferred taxes
The detail of the balances of “Tax assets – Deferred” and “Tax liabilities – Deferred” is as follows:
| Thousand of reais | 2017 | 2016 | 2015 |
| Tax assets: | 24,778,078 | 24,437,112 | 30,575,504 |
| Of which: | | | |
| Temporary differences(1) | 23,375,600 | 23,398,886 | 29,538,257 |
| Tax loss carry forwards | 866,579 | 382,867 | 381,888 |
| Social contribution taxes 18% | 535,899 | 655,359 | 655,359 |
| Total deferred tax assets | 24,778,078 | 24,437,112 | 30,575,504 |
| Tax liabilities: | 2,496,531 | 1,268,037 | 817,125 |
| Of which: | | | |
| Excess depreciation of leased assets | 124,909 | 144,623 | 185,531 |
| Adjustment to fair value of trading securities and derivatives | 2,371,622 | 1,123,414 | 631,594 |
| Total deferred tax liabilities | 2,496,531 | 1,268,037 | 817,125 |
| (1) | Temporary differences relate mainly to impairment losses on loans and receivables and provisions for lawsuits and administrative proceedings, and the effect of the fair value of financial instruments. |
BANCO SANTANDER (BRASIL) S.A.
NOTES TO THE CONSOLIDATED FINANCIAL STATEMENTS
(Thousands of Brazilian Reais - R$ - unless otherwise stated)
Based on a technical study for the realization of deferred tax assets and liabilities drawn up by Banco Santander´s Management, these tax credits should be accounted to the extent that it becomes probable that future taxable profit will allow their recovery. In the case of Tax Loss it was considered the limit of 30% to be used of the taxable profit of each period. The controlled companies has not presented any deferred tax liabilities not accounted on 2017, 2016 and 2015.
The changes in the balances of “Tax Assets – Deferred” and “Tax Liabilities – Deferred” in the last three years were as follows:
| Thousand of reais | Balances at December 31, 2016 | Adjustment to Income | Valuation adjustments(1) | Other(2) | Acquisition / Merger | Balances at December 31, 2017 |
| Tax assets: | 24,437,112 | 668,483 | 254,733 | (620,401) | 38,151 | 24,778,078 |
| Temporary differences | 23,398,886 | 304,231 | 254,733 | (620,401) | 38,151 | 23,375,600 |
| Tax loss carry forwards | 382,867 | 483,712 | - | - | - | 866,579 |
| Social contribution taxes 18% | 655,359 | (119,460) | - | - | - | 535,899 |
| Tax liabilities: | 1,268,037 | 262,088 | 582,363 | 378,693 | 5,350 | 2,496,531 |
| Temporary differences | 1,268,037 | 262,088 | 582,363 | 378,693 | 5,350 | 2,496,531 |
| Total | 23,169,075 | 406,395 | (327,630) | (999,094) | 32,801 | 22,281,547 |
| Thousand of reais | Balances at December 31, 2015 | Adjustment to Income | Valuation adjustments(1) | Other(2) | Acquisition / Merger | Balances at December 31, 2016 |
| Tax assets: | 30,575,504 | (5,318,219) | (1,580,025) | 652,599 | 107,253 | 24,437,112 |
| Temporary differences | 29,538,257 | (5,319,198) | (1,580,025) | 652,599 | 107,253 | 23,398,886 |
| Tax loss carry forwards | 381,888 | 979 | - | - | - | 382,867 |
| Social contribution taxes 18% | 655,359 | - | - | - | - | 655,359 |
| Tax liabilities: | 817,125 | 25,666 | 947,628 | (523,182) | 800 | 1,268,037 |
| Temporary differences | 817,125 | 25,666 | 947,628 | (523,182) | 800 | 1,268,037 |
| Total | 29,758,379 | (5,343,885) | (2,527,653) | 1,175,781 | 106,453 | 23,169,075 |
| Thousand of reais | Balances at December 31, 2014 | Adjustment to Income | Valuation adjustments(1) | Other(2) | Acquisition / Merger | Balances at December 31, 2015 |
| Tax assets: | 20,038,000 | 8,866,221 | 1,575,891 | 93,991 | 1,401 | 30,575,504 |
| Temporary differences | 18,333,315 | 9,535,994 | 1,575,891 | 93,991 | (934) | 29,538,257 |
| Tax loss carry forwards | 1,049,326 | (669,773) | - | - | 2,335 | 381,888 |
| Social contribution taxes 18% | 655,359 | - | - | - | - | 655,359 |
| Tax liabilities: | 312,420 | (551,692) | 962,406 | 93,991 | - | 817,125 |
| Temporary differences | 312,420 | (551,692) | 962,406 | 93,991 | - | 817,125 |
| Total | 19,725,580 | 9,417,913 | 613,485 | - | 1,401 | 29,758,379 |
| (1) | It relates to tax recognized in equity. |
| (2) | In 2017, it mainly refers to net of deferred taxes amounted to R$(241,708) (2016 - R$129,147 and 2015 - R$93,991), which have the same counterparty and realization period. |
e) Expected realization of deferred tax assets
| Year | Temporary differences | Tax loss carry forwards | Social contribution taxes 18% |
| 2018 | 2,061,152 | 650,509 | 535,899 |
| 2019 | 3,995,868 | 88,249 | - |
| 2020 | 4,807,491 | 59,473 | - |
| 2021 | 4,522,575 | 36,269 | - |
| 2022 to 2024 | 4,939,011 | 7,471 | - |
| 2025 to 2026 | 2,486,246 | 19,112 | - |
| 2026 to 2027 | 563,257 | 5,496 | - |
| Total | 23,375,600 | 866,579 | 535,899 |
Projections of future taxable income include estimates referring to macroeconomic variables, exchange rate and interest rate fluctuations, the history of recent tax losses, among others, which may vary from the actual amounts."
BANCO SANTANDER (BRASIL) S.A.
NOTES TO THE CONSOLIDATED FINANCIAL STATEMENTS
(Thousands of Brazilian Reais - R$ - unless otherwise stated)
f) Current Taxes
The current tax assets refers to the balance of Income, Social Contribution Taxes, PIS/COFINS Offset.
26. Other liabilities
The breakdown of the balance of “Other Liabilities” is as follows:
| Thousand of reais | 2017 | 2016 | 2015 |
| Accrued expenses and deferred income(1) | 3,036,374 | 2,925,598 | 2,480,666 |
| Transactions in transit | 980,501 | 916,844 | 900,089 |
| Provision for share-based payment | 270,626 | 212,384 | 186,526 |
| Liabilities for insurance contracts | 1,587,603 | 1,584,303 | 1,365,793 |
| Other(2) | 2,138,817 | 2,559,970 | 1,917,122 |
| Total | 8,013,921 | 8,199,099 | 6,850,196 |
| (1) | Corresponds, mainly, to payments to be made - personnel expenses. |
| (2) | Includes credits for funds to be released, such as Administrative expenses, amounts due to associates and suppliers. |
| (3) | Includes mainly the amounts to transfer to the credit card companies (resources in transit) and amount to release referred to the real estate credits. |
27. Other Comprehensive Income
The balances of Other Comprehensive Income include the amounts, net of the related tax effect, of the adjustments to assets and liabilities recognized temporarily in equity stated in the Consolidated Statement of Changes in Equity and Consolidated Statements of Comprehensive Income until they are extinguished or realized, when they are recognized in the consolidated income statement. The amounts attributable to subsidiaries, investments in associates and joint ventures are presented, on a line by line basis, in the appropriate items based on their nature.
It should be noted that the consolidated Statements of Comprehensive Income includes the changes to Other Comprehensive Income as follows:
- Revaluation gains (losses): This includes the amount of the gains, net of losses incurred in the year, recognized directly in equity. The amounts recognized in equity in the year remain under this heading, even if in the same year they are transferred to the income statement or to the initial carrying amount of the assets or liabilities or are reclassified to another heading.
- Amounts transferred to income statement: This includes the amount of the revaluation gains (losses) previously recognized in equity, even in the same year, which are subsequently recognized in the income statement.
- Amounts transferred to the initial carrying amount of hedged objects: This includes the amount of the revaluation gains (losses) previously recognized in Equity, even in the same year, which are recognized in the initial carrying amount of assets or liabilities as a result of cash flow hedges.
- Other transfers: This includes the amount of the transfers made in the year between the various Other Comprehensive Income items.
In the Consolidated Statements of Comprehensive Income the amounts in "Other Comprehensive Income" are recognized gross, including the amount relating to non-controlling interests, and the corresponding tax effect is presented under a separate heading, except in the case of entities accounted for using the equity method, the amounts for which are presented net of the tax effect.
a) Financial assets - available-for-sale
Other Comprehensive Income - Available-for-sale financial assets includes the net amount of unrealized changes in the fair value of assets classified as available-for-sale financial assets (see Notes 7 and 8), net of taxes.
The breakdown, by type of instrument and geographical origin of the issuer, of Other Comprehensive Income Available-for-sale financial assets on December 31, 2017, 2016 and 2015 is as follows:
BANCO SANTANDER (BRASIL) S.A.
NOTES TO THE CONSOLIDATED FINANCIAL STATEMENTS
(Thousands of Brazilian Reais - R$ - unless otherwise stated)
| Thousand of reais | | | | 2017 |
| | Revaluation gains | Revaluation losses | Net revaluation gains/ (losses) | Fair value |
| Debt Instruments | | | | |
| Government debt securities | 1,616,486 | (6,942) | 1,609,544 | 79,462,303 |
| Private-sector debt securities | 10,694 | (2,227) | 8,467 | 5,254,444 |
| Equity instruments | | | | |
| Domestic | 230,722 | (35,159) | 195,563 | 1,106,637 |
| Of which: | | | | |
| Listed | 156,236 | (5,322) | 150,914 | 965,547 |
| Unlisted | 74,486 | (29,837) | 44,649 | 141,090 |
| Total | 1,857,902 | (44,328) | 1,813,574 | 85,823,384 |
| Thousand of reais | | | | 2016 |
| | Revaluation gains | Revaluation losses | Net revaluation gains/ (losses) | Fair value |
| Debt Instruments | | | | |
| Government debt securities | 454,609 | (31,288) | 423,321 | 50,384,382 |
| Private-sector debt securities | 101,593 | (6,501) | 95,092 | 5,445,190 |
| Equity instruments | | | | |
| Domestic | 220,535 | (72,758) | 147,777 | 1,985,473 |
| Of which: | | | | |
| Listed | 147,844 | (50,269) | 97,575 | 1,024,505 |
| Unlisted | 72,691 | (22,489) | 50,202 | 960,968 |
| Total | 776,737 | (110,547) | 666,190 | 57,815,045 |
| Thousand of reais | | | | 2015 |
| | Revaluation gains | Revaluation losses | Net revaluation gains/ (losses) | Fair value |
| Debt Instruments | | | | |
| Government debt securities | 2,110 | (2,692,507) | (2,690,397) | 57,720,858 |
| Private-sector debt securities | 10,585 | (67,277) | (56,692) | 9,382,416 |
| Equity instruments | | | | |
| Domestic | 213,299 | (111,627) | 101,672 | 1,162,332 |
| Of which: | | | | |
| Listed | 119,436 | (99,357) | 20,079 | 77,299 |
| Unlisted | 93,863 | (12,270) | 81,593 | 1,085,033 |
| Total | 225,994 | (2,871,411) | (2,645,417) | 68,265,606 |
At each reporting date, the Bank assesses whether there is any objective evidence indicating that the available-for-sale financial assets (debt securities and equity instruments) are impaired.
This assessment includes but is not limited to an analysis of the following information: i) the issuer’s economic and financial position, any default or late payments, issuer’s solvency, the evolution of its business, short-term projections, trends observed with respect to its earnings and, if applicable, its dividend distribution policy; ii) market-related information such as changes in the general economic situation, changes in the issuer’s industry which might affect its ability to pay; iii) changes in the fair value of the security analyzed, and analysis of the reasons of such changes—whether they are specific to the security or the result of the general uncertainty concerning the economy or the country and iv) independent analysts’ reports and forecasts and other independent market information.
In the case of equity instruments, when the changes in the fair value of the equity instrument subject to analysis are assessed, the duration and significance of the decline in its market price below cost is taken into account. Nevertheless, it should be noted that the Bank assesses, on a case-by-case basis each of the equity instruments that have incurred losses, and monitors the performance of their market prices, recognizing an impairment loss as soon as it is determined that the recoverable amount could be decreased.
BANCO SANTANDER (BRASIL) S.A.
NOTES TO THE CONSOLIDATED FINANCIAL STATEMENTS
(Thousands of Brazilian Reais - R$ - unless otherwise stated)
If, after completing the above assessment, the Bank considers that the presence of one or more of these factors affect recovery of the cost of the financial asset, an impairment loss is recognized in the consolidated income statement for the amount of the loss in equity under Other Comprehensive Income. Also, where the Bank does not intend and/or is not able to hold the investment for a sufficient amount of time to recover the cost, the financial asset is written-off through its fair value.
b) Cash flow hedges
Other Comprehensive Income—Cash flow hedges includes the gains or losses attributable to hedge instruments that qualify as effective hedges. These amounts will remain under this heading until they are recognized in the consolidated income statement in the periods in which the hedged items affect them (see Note 9).
Accordingly, amounts representing valuation losses will be offset in the future by gains generated by the hedged objects.
c) Hedges of net investments in foreign operations and Translation adjustments foreign investment
Other Comprehensive Incomes—Hedges of net investments in foreign operations includes the net amount of changes in the value of hedging instruments in hedges of net investments in foreign operations. In 2017 this hedge was discontinued (Note 9.a5). In 2016 and 2105, no ineffective portion was identified (Note 9.a5).
Other Comprehensive Income—Exchange differences includes the net amount of the differences arising on the translation to Reais of the balances of the consolidated entities whose functional currency is not the Reais (Note 2.a).
28. Non-controlling interests
“Non-controlling interests” include the net amount of the equity of subsidiaries attributable to equity instruments that do not belong, directly or indirectly, to the Bank, including the portion attributed to them of profit for the year.
a) Breakdown
The detail, by company, of the balance of “Equity - Non-controlling interests” is as follows:
| Thousand of reais | 2017 | 2016 | 2015 |
| Santander Leasing S.A. Arrendamento Mercantil | 395 | 441 | 421 |
| Santander Brasil Advisory Services S.A | - | 529 | 516 |
| Super Pagamentos e Administração de Meios Eletrônicos S.A. | - | - | 14,664 |
| Getnet S.A. | 206,105 | 168,863 | 176,278 |
| Olé Consignado S.A. | 82,432 | 30,425 | 5,014 |
| Santander Serviços Técnicos, Administrativos e de Corretagem de Seguros | - | 318,498 | 238,169 |
| BW Guirapá S.A. | - | 68,691 | - |
| Banco PSA Finance Brasil S.A. | 147,295 | 138,057 | - |
| Ipanema Empreendimentos e Participações Ltda. | 667 | - | - |
| Total | 436,894 | 725,504 | 435,062 |
| Thousand of reais | 2017 | 2016 | 2015 |
| Profit attributable to non-controlling interests | 213,984 | 130,355 | 50,086 |
| Of which: | | | |
| Santander Leasing S.A. Arrendamento Mercantil | 48 | 41 | 38 |
| Santander Brasil Advisory Services S.A | - | 34 | 49 |
| Super Pagamentos e Administração de Meios Eletrônicos S.A. | - | - | (2,379) |
| Getnet S.A. | 48,842 | 27,209 | 35,932 |
| Olé Consignado S.A. | 53,286 | 5,432 | 4,996 |
| Santander Serviços Técnicos, Administrativos e de Corretagem de Seguros | 92,365 | 98,717 | 10,859 |
| BW Guirapá S.A. | (776) | (2,957) | - |
| Banco PSA Finance Brasil S.A. | 19,884 | 1,879 | - |
| Ipanema Empreendimentos e Participações Ltda. | 335 | - | - |
| Other companies | - | - | 591 |
BANCO SANTANDER (BRASIL) S.A.
NOTES TO THE CONSOLIDATED FINANCIAL STATEMENTS
(Thousands of Brazilian Reais - R$ - unless otherwise stated)
b) Changes
The changes in the balance of “Non-controlling interests” are summarized as follows:
| Thousand of reais | 2017 | 2016 | 2015 |
| Balance at beginning of year | 725,504 | 435,062 | 380,173 |
| Additions / disposals (net) due to change in the scope of consolidation(1) (2) | (660,230) | 159,469 | 16,608 |
| Incorporation / Acquisition | 296,184 | - | - |
| Dividends paid / Interest on Capital | (133,641) | (18,140) | (2,754) |
| Capital increase(3) | - | 20,000 | - |
| Profit attributable to non-controlling interests | 213,984 | 130,355 | 50,086 |
| Transition Adjustments to the amendments to the IAS 19 | (1,790) | (1,604) | 5,916 |
| Others | (3,117) | 362 | (14,967) |
| Balance at end of year | 436,894 | 725,504 | 435,062 |
| (1) | In 2017 refers mainly to the participation of non-controlling shareholders of BW Guirapá, in 2016 refers to BW Guirapá and Banco PSA Finance Brasil, in 2015 refers to Super. |
| (2) | Includes the acquisition of the shares representing the remaining 50% of the voting capital of Super by Aymoré CFI (note 4.b). |
| (3) | Increase in the share capital of Olé Consignado. |
29. Shareholders’ equity
a) Capital
According to the by-laws, Banco Santander’s share capital may be increased up to the limit of its authorized capital, regardless of statutory reform, by resolution of the Board of Directors and through the issuance of up to 9,090,909,090 (nine billion, ninety million, nine hundred and nine thousand and ninety) shares, subject to the established legal limits on the number of preferred shares. Any capital increase that exceeds this limit will require shareholders` approval.
The capital stock, fully subscribed and paid, is divided into registered book-entry shares with no par value.
| | Thousand of shares |
| | Common | Preferred | 2017 Total | Common | Preferred | 2016 Total |
| Brazilian residents | 66,207 | 91,779 | 157,986 | 67,498 | 92,949 | 160,447 |
| Foreign residents | 3,752,488 | 3,588,057 | 7,340,545 | 3,783,473 | 3,619,163 | 7,402,636 |
| Total shares | 3,818,695 | 3,679,836 | 7,498,531 | 3,850,971 | 3,712,112 | 7,563,083 |
| (-) Treasury shares | (5,845) | (5,845) | (11,690) | (25,786) | (25,786) | (51,572) |
| Total outstanding | 3,812,850 | 3,673,991 | 7,486,841 | 3,825,185 | 3,686,326 | 7,511,511 |
| | Thousand of shares |
| | | | | Common | Preferred | 2015 Total |
| Brazilian residents | | | | 56,306 | 81,280 | 137,586 |
| Foreign residents | | | | 3,794,666 | 3,630,833 | 7,425,499 |
| Total shares | | | | 3,850,972 | 3,712,113 | 7,563,085 |
| (-) Treasury shares | | | | (20,218) | (20,218) | (40,436) |
| Total outstanding | | | | 3,830,754 | 3,691,895 | 7,522,649 |
In 2015, issuance costs of the Global Offering of Shares held in October 2009, have been reclassified from Capital to Reserves heading for a better presentation amounted to R$193,616.
b) Dividends and Interest on Capital
According to the Bank’s by-laws, shareholders are entitled to a minimum dividend equivalent to 25% of net income for the year, adjusted according to legislation. Preferred shares are nonvoting and nonconvertible, but have the same rights and advantages granted to common shares, in addition to priority in the payment of dividends at a rate that is 10% higher than those paid on common shares, and in the capital reimbursement, without premium, in the event of liquidation of the Bank.
Dividend payments have been calculated and paid in accordance with Brazilian Corporate Law.
Prior to the annual shareholders meeting, the Board of Directors may resolve on the declaration and payment of dividends on earnings based on (i) financial statements or earning reserves shown in the last financial statement; or (ii) financial statements issued in the period shorter than 6 months, since the total dividends paid in each half of the fiscal year shall do not exceed the amount of capital reserves. These dividends are fully attributed to the mandatory dividend.
BANCO SANTANDER (BRASIL) S.A.
NOTES TO THE CONSOLIDATED FINANCIAL STATEMENTS
(Thousands of Brazilian Reais - R$ - unless otherwise stated)
| | | | | 2017 |
| | Real per Thousand Shares / Units |
| | Thousand of reais | Common | Preferred | Units |
| Interest on Capital(1) (6) | 500,000 | 63,3780 | 69,7158 | 133,0938 |
| Interest on Capital(2) (6) | 500,000 | 63,5280 | 69,8808 | 133,4088 |
| Interest on Capital(3) (6) | 500,000 | 63,5917 | 69,9509 | 133,5427 |
| Intercalary Dividends(4) (6) | 2,500,000 | 318,2994 | 350,1293 | 668,4287 |
| Interest on Capital(5) (6) | 2,300,000 | 292,8354 | 322,1190 | 614,9544 |
| Total | 6,300,000 | | | |
(1) Established by the Board of Directors in April 2017, Common Shares - R$53,8713, preferred - R$59,2584 and Units - R$113,1297 net of taxes, and was paid from May 26, 2017 without any compensation as monetary correction.
(2) Established by the Board of Directors in July 2017, Common Shares - R$53,9988, preferred - R$59,3987 and Units - R$113,3975 net of taxes, and was paid from August 25, 2017 without any compensation as monetary correction.
(3) Established by the Board of Directors in July 2017, Common Shares - R$54,0530, preferred - R$59,4583 and Units - R$113,5113 net of taxes, and was paid from October 26, 2017 without any compensation as monetary correction.
(4) Established by the Board of Directors in December 2017, and will be paid from February 26, 2018 without any compensation as monetary correction.
(5) Established by the Board of Directors in December 2017, Common Shares - R$248,9101, preferred - R$273,8011 and Units - R$522,7112 net of taxes, will be paid from February 26, 2018 without any compensation as monetary correction.
(6) The amount of interest on shareholders’ equity and interim dividends will be fully charged to the mandatory dividends for the year 2017.
| | | | | 2016 |
| | Real per Thousand Shares / Units |
| | Thousand of reais | Common | Preferred | Units |
| Interest on Capital(1) (4) | 500,000 | 63,4290 | 69,7719 | 133,2009 |
| Intermediate Dividends(2) (5) | 700,000 | 88,8309 | 97,7140 | 186,5448 |
| Intercalary Dividends(2) (5) | 700,000 | 88,8309 | 97,7140 | 186,5448 |
| Interest on Capital(3) (5) | 3,350,000 | 425,1192 | 467,6311 | 892,7503 |
| Total | 5,250,000 | | | |
(1) Established by the Board of Directors in June 2016, Common Shares - R$53,9146, preferred - R$59,3061 and Units - R$113,2207 net of taxes.
(2) Established by the Board of Directors in December 2016.
(3) Established by the Board of Directors in December 2016, Common Shares- R$361,3513, preferred - R$397,4864 and Units - R$758,8377 net of taxes.
(4) ‘The amount of the interest on capital were fully input into the mandatory dividends for the year 2016 and were be paid from August 26, 2016 without any compensation as monetary correction.
(5) The amount of intermediate, intercalary dividends and interest on capital will be fully attributed to supplementary and mandatory dividends for the year 2016 and will be paid from February 23, 2017, without any compensation to the restatement.
| | | | | 2015 |
| | Real per Thousand Shares / Units |
| | Thousand of reais | Common | Preferred | Units |
| Intercalary Dividends(1) (3) | 150,000 | 18,9474 | 20,8421 | 39,7895 |
| Intermediary Dividends(2) (4) | 3,050,000 | 385,8116 | 424,3927 | 810,2043 |
| Intercalary Dividends(3) (7) | 1,600,000 | 202,7412 | 223,0153 | 425,7564 |
| Interest on Capital(4) (7) | 1,400,000 | 177,3985 | 195,1384 | 372,5369 |
| Total | 6,200,000 | | | |
| (1) | Established by the Board of Directors in March 2015. |
| (2) | Established by the Board of Directors in September 2015. |
| (3) | Established by the Board of Directors in December 2015. |
| (4) | Established by the Board of Directors in December 2015, Common Shares - R$150,7887, preferred - R$165,8676 and Units - R$316,6563 net of taxes. |
| (5) | The amount of the interim dividend were fully attributed to supplementary and mandatory dividends, respectively, for the year 2015 and were paid from August 28, 2015, without any compensation as monetary update. |
| (6) | The amount of the interim dividend were fully attributed to supplementary and mandatory dividends, respectively, for the year 2015 and were paid from October 05, 2015, without any compensation as monetary update. |
| (7) | The amount of the interim dividends and interest on capital were fully input into the mandatory dividends for the year 2015 and were paid from February 25, 2016, without any compensation as monetary update. |
BANCO SANTANDER (BRASIL) S.A.
NOTES TO THE CONSOLIDATED FINANCIAL STATEMENTS
(Thousands of Brazilian Reais - R$ - unless otherwise stated)
c) Reserves
The reserves are allocated as follows after the deductions and statutory provisions, from the net income:
Legal reserve
In accordance with Brazilian Corporate Law, 5% is transferred to the legal reserve, until it reaches 20% of the share capital. This reserve is designed to ensure the integrity of the capital and can only be used to offset losses or increase capital.
Capital reserve
The Bank´s capital reserve consists of: goodwill reserve for subscription of shares and other capital reserves, and can only be used to absorb losses that exceed retained earnings and profit reserves, redemption, reimbursement or acquisition of shares for the Bank´s own issue; capital increase, or payment of dividends to preferred shares under certain circumstances.
Reserve for equalization dividend
After the allocation of dividends, the remaining balance if any, may, upon proposal of the Executive Board and approved by the Board of Directors, be allocated to reserve for equalization of dividends, which will be limited to 50% of the capital. This reserve aims to ensure funds for the payment of dividends, including as interest on own capital, or any interim payment to maintain the flow of shareholders remuneration.
d) Treasury shares
In the meeting held on November 01, 2017, the Bank’s Board of Directors approved, in continuation of the buyback program that expired on November 3, 2017, the buyback program of its Units and ADRs, by the Bank or its agency in Cayman, to be held in treasury or subsequently sold.
The Buyback Program will cover the acquisition up to 38,717,204 Units, representing 38,717,204 common shares and 38,717,204 preferred shares, or the ADRs, which, on September 30, 2017, corresponded to approximately 1.03% of the Bank’s share capital. On September 30, 2017, the Bank held 373,269,828 common shares and 401,074,242 preferred shares being traded.
The Buyback has the purpose to (1) maximize the value creation to shareholders by means of an efficient capital structure management; and (2) enable the payment of officers, management level employees and others Bank’s employees and companies under its control, according to the Long Term Incentive Plans. The term of the Buyback Program is 365 days counted from November 6, 2017, and will expire on November 5, 2018.
| | 2017 | 2016 | 2015 |
| | Quantity | Quantity | Quantity |
| | Units | Units | ADRs | Units | ADRs |
| Treasury shares at beginning of the period | 25,786 | 7,080 | 13,138 | 16,531 | 13,081 |
| Shares Acquisitions | 12,768 | 14,284 | - | 13,873 | 57 |
| Cancellation of Shares(1)(2)(3) | (32,276) | 13,138 | 13,138 | (18,879) | - |
| Payment - Share-based compensation | (4,505) | (8,716) | - | (4,446) | - |
| Treasury shares at end of the period | 1,773 | 25,786 | - | 7,080 | 13,138 |
| Balance of Treasury Shares in thousand of reais (2) | R$148,246 | R$513,889 | R$0 | R$106,764 | R$317,094 |
| Emission Costs in thousands of Reais | R$194 | R$145 | R$0 | R$95 | R$0 |
| Balance of Treasury Shares in thousands of reais | R$148,440 | R$514,034 | R$0 | R$106,859 | R$317,094 |
| Cost/Market Value | | | | | |
| Minimum cost | R$7.55 | R$7.55 | US$4,37 | R$11.01 | US$4,37 |
| Weighted average cost | R$24.41 | R$19.93 | US$6,17 | R$14.28 | US$6,17 |
| Maximum cost | R$32.29 | R$26.81 | US$10,21 | R$18.51 | US$10,21 |
| Market value | R$27.64 | R$28.32 | US$8,58 | R$16.04 | US$3,89 |
| (1) | In January 2016 was the transformation of all ADRs that were held in treasury for UNIT’s. |
| (2) | Extraordinary General Meeting held on December 14, 2015 the cancellation of 18,878,954 Units was approved (18,878,954 ON and 18,878,954 PN totaling 37,757,908 treasury shares) equivalent to R$268,573. |
| (3) | At the EGM held on September, 18, 2017, it was approved the cancellation of 64,551,366 treasury shares (equivalent to 32,276 thousand Units) with the counterparty headings Capital Reserves and Profit Reserves, which represent the total of treasury shares registered in the book of common shares at that date, without reduction of the capital and consequent change in the clause 5th from the Bylaws in order to reflect the new quantities of common and preferred shares, nominatives and without value which represent the Banco Santander´s capital. |
Additionally, in the year ended December 31, 2017, treasury shares were sold, that resulted in a loss of R$2,498 (2016 - R$11,574 and 2015 - R$3,918) recorded directly in equity in capital reserves.
BANCO SANTANDER (BRASIL) S.A.
NOTES TO THE CONSOLIDATED FINANCIAL STATEMENTS
(Thousands of Brazilian Reais - R$ - unless otherwise stated)
30. Earnings per share
a) Basic earnings per share
Basic earnings per share is calculated by dividing the net profit attributable to the Parent by the weighted average outstanding shares during the year average number, excluding the average number of own shares held during the year and held in treasury.
| | 2017 | 2016 | 2015 |
| Profit attributable to the Parent | | | |
| Earnings per share (Brazilian Reais) | 8,924,064 | 7,334,563 | 9,783,740 |
| Basic earnings per 1,000 shares (Brazilian Reais) | | | |
| Common shares | 1,133,43 | 929,93 | 1,236,96 |
| Preferred shares | 1,246,77 | 1,022,92 | 1,360,66 |
| Net Profit attributable - Basic (Brazilian Reais) | | | |
| Common shares | 4,332,026 | 3,560,288 | 4,748,896 |
| Preferred shares | 4,592,038 | 3,774,275 | 5,034,844 |
| Weighted average shares outstanding - Basic | | | |
| Common shares | 3,822,057 | 3,828,555 | 3,839,159 |
| Preferred shares | 3,683,145 | 3,689,696 | 3,700,299 |
b) Diluted earnings per share
The diluted earnings per share is calculated by dividing the net profit attributable to the Parent by the weighted average outstanding shares during the year average number, excluding the average number of own shares held during the year and held in treasury, including the effect of dilutive potential programs long-term compensation.
| | 2017 | 2016 | 2015 |
| Profit attributable to the Parent | | | |
| Earnings per share (Brazilian Reais) | 8,924,064 | 7,334,563 | 9,783,740 |
| Diluted earnings per 1,000 shares (Brazilian Reais) | | | |
| Common shares | 1,132,44 | 929,03 | 1,235,79 |
| Preferred shares | 1,245,69 | 1,021,93 | 1,359,36 |
| Net Profit attributable - Basic (Brazilian Reais) | | | |
| Common shares | 4,331,955 | 3,560,222 | 4,748,810 |
| Preferred shares | 4,592,109 | 3,774,341 | 5,034,930 |
| Weighted average shares outstanding (in thousand) - Diluted | | | |
| Common shares | 3,825,313 | 3,832,211 | 3,842,744 |
| Incremental shares from stock options granted under Stock Option Plan - Units | 3,257 | 3,656 | 3,585 |
| | | | |
| Preferred shares | 3,686,401 | 3,693,352 | 3,703,884 |
| Incremental shares from stock options granted under Stock Option Plan - Units | 3,257 | 3,656 | 3,585 |
31. Fair value of financial assets and liabilities
Under IFRS 13, the fair value measurement uses a fair value hierarchy that reflects the model used in the measurement process which should be in accordance with the following hierarchical levels:
Level 1: Determined on the basis of public (unadjusted) quoted prices in active markets for identical assets and liabilities, these include public debt securities, stocks, derivatives listed.
Level 2: They are those derived from inputs other than quoted prices included within Level 1 that are observable for the asset or liability, either directly (as prices) or indirectly (derived from prices).
Level 3: They are those derived from valuation techniques that include inputs for the asset or liability that are not based on observable market data (unobservable inputs).
Trading Financial Assets, Other financial assets at fair value on through income statement, Available-for-sale financial assets and Financial liabilities held for trading
Level 1: The securities with high liquidity and quoted prices in active market are classified as level 1. At this level there were classified most of the Brazilian Government Securities (mainly LTN, LFT, NTN-B, NTN-C and NTN-F), shares in stock exchange and other securities traded in the active market.
BANCO SANTANDER (BRASIL) S.A.
NOTES TO THE CONSOLIDATED FINANCIAL STATEMENTS
(Thousands of Brazilian Reais - R$ - unless otherwise stated)
Level 2: When quoted price cannot be observed, the Management, using its own internal models, make its best estimate of the price that would be set by the market. These models use data based on observable market parameters as an important reference. Various techniques are used to make these estimates, including the extrapolation of observable market data and extrapolation techniques. The best evidence of fair value of a financial instrument on initial recognition is the transaction price, unless the fair value of the instrument can be obtained from other market transactions carried out with the same instrument or similar instruments or can be measured using a valuation technique in which the variables used include only data from observable market, especially interest rates. These securities are classified within Level 2 of the fair value hierarchy and are composed mainly by Private Securities (highlighting the Debenture portfolio) in a market with less liquidity than those classified at Level 1.
Level 3: When there is information that is not based on observable market data, Banco Santander uses internally developed models, from curves generated according to the internal model. Level 3 comprises mainly unlisted shares.
Derivatives
Level 1: Derivatives traded on stock exchanges are classified in Level 1 of the hierarchy.
Level 2: For derivatives traded over the counter, the valuation (primarily swaps and options) usually uses observable market data, such as: exchange rates, interest rates, volatility, correlation between indexes and market liquidity.
When pricing the financial instruments aforementioned, it is used the Black-Scholes Model (exchange rate options, interest rate options; caps and floors) and the present value method (discount of future values by market curves).
Level 3: Derivatives not traded in the stock exchange and that do not have an observable data in a active market were classified as Level 3. These are composed by exotic derivatives.
The following table shows a summary of the fair values of financial assets and liabilities for the period ended December 31, 2017, 2016 and 2015, classified based on several measurement methods adopted by the Bank to determine their fair value:
| Thousand of Reais | 2017 |
| | Level 1(1) | Level 2(1) | Level 3 | Total |
| Financial assets held for trading | 34,380,542 | 18,059,034 | - | 52,439,576 |
| Debt instruments | 33,891,360 | 988,321 | - | 34,879,681 |
| Equity instruments | 489,182 | 588 | - | 489,770 |
| Derivatives | - | 17,070,125 | - | 17,070,125 |
| Financial assets designated at fair value through profit or loss | 1,593,951 | 64,738 | 33,368 | 1,692,057 |
| Debt instruments | 1,593,951 | 64,738 | - | 1,658,689 |
| Equity instruments | - | - | 33,368 | 33,368 |
| Financial assets - available-for-sale | 79,301,016 | 6,382,225 | 140,143 | 85,823,384 |
| Debt instruments | 78,335,629 | 6,381,118 | - | 84,716,747 |
| Equity instruments | 965,387 | 1,107 | 140,143 | 1,106,637 |
| Hedging derivatives (assets) | - | 192,763 | - | 192,763 |
| Financial liabilities held for trading | 32,808,392 | 16,514,154 | - | 49,322,546 |
| Derivatives | - | 16,514,154 | - | 16,514,154 |
| Short positions | 32,808,392 | - | - | 32,808,392 |
| Hedging derivatives (liabilities) | | 163,332 | - | 163,332 |
(1) There was no transfer between levels 1 and 2.
| Thousand of Reais | 2016 |
| | Level 1 | Level 2 | Level 3 | Total |
| Financial assets held for trading | 59,410,908 | 25,462,755 | - | 84,873,663 |
| Debt instruments | 59,034,363 | 960,583 | - | 59,994,946 |
| Equity instruments | 376,545 | 21,916 | - | 398,461 |
| Derivatives | - | 24,480,256 | - | 24,480,256 |
| Financial assets designated at fair value through profit or loss | 1,597,660 | 76,035 | 37,509 | 1,711,204 |
| Debt instruments | 1,592,714 | 76,035 | - | 1,668,749 |
| Equity instruments | 4,946 | - | 37,509 | 42,455 |
| Financial assets - available-for-sale | 51,160,044 | 5,703,389 | 951,612 | 57,815,045 |
| Debt instruments | 50,172,609 | 5,656,963 | - | 55,829,572 |
| Equity instruments | 987,435 | 46,426 | 951,612 | 1,985,473 |
| Hedging derivatives (assets) | - | 222,717 | - | 222,717 |
| Financial liabilities held for trading | 31,694,269 | 19,925,600 | - | 51,619,869 |
| Derivatives | - | 19,925,600 | - | 19,925,600 |
| Short positions | 31,694,269 | - | - | 31,694,269 |
| Hedging derivatives (liabilities) | - | 311,015 | - | 311,015 |
BANCO SANTANDER (BRASIL) S.A.
NOTES TO THE CONSOLIDATED FINANCIAL STATEMENTS
(Thousands of Brazilian Reais - R$ - unless otherwise stated)
| Thousand of Reais | 2015 |
| | Level 1 | Level 2 | Level 3 | Total |
| Financial assets held for trading | 24,952,744 | 25,583,987 | - | 50,536,731 |
| Debt instruments | 24,579,100 | 614,498 | - | 25,193,598 |
| Equity instruments | 373,644 | 31,329 | - | 404,973 |
| Derivatives | - | 24,938,160 | - | 24,938,160 |
| Financial assets designated at fair value through profit or loss | 1,420,332 | 86,238 | 573,664 | 2,080,234 |
| Debt instruments | 1,420,332 | 86,238 | - | 1,506,570 |
| Equity instruments | - | - | 573,664 | 573,664 |
| Financial assets - available-for-sale | 56,497,320 | 10,910,469 | 857,817 | 68,265,606 |
| Debt instruments | 56,250,013 | 10,853,261 | - | 67,103,274 |
| Equity instruments | 247,307 | 57,208 | 857,817 | 1,162,332 |
| Hedging derivatives (assets) | - | 1,312,202 | - | 1,312,202 |
| Financial liabilities held for trading | 20,047,631 | 22,340,137 | - | 42,387,768 |
| Derivatives | - | 22,340,137 | - | 22,340,137 |
| Short positions | 20,047,631 | - | - | 20,047,631 |
| Hedging derivatives (liabilities) | - | 2,376,822 | - | 2,376,822 |
Movements in fair value of Level 3
The following tables demonstrate the movements during 2017, 2016 and 2015 for the financial assets and liabilities classified as Level 3 in the fair value hierarchy:
| Thousand of Reais | Fair Value
2016 | Gains/losses
(Realized Not
Realized) | Transfers in and/ or out of Level 3 | Additions | Settled | Fair value
2017 |
| | | | | | | |
| Financial assets designated at fair value through profit or loss | 37,509 | (2,555) | - | - | (1,586) | 33,368 |
| Financial assets - available-for-sale | 951,612 | 18,474 | - | - | (829,943) | 140,143 |
| Thousand of Reais | Fair Value
2016 | Gains/losses
(Realized Not
Realized) | Transfers in and/ or out of Level 3 | Additions | Settled | Fair value
2017 |
| | | | | | | |
| Financial assets designated at fair value through profit or loss | 573,664 | 2,806 | (14,345) | 111 | (524,727) | 37,509 |
| Financial assets - available-for-sale | 857,817 | (60,934) | (3,085) | 461,185 | (303,371) | 951,612 |
| Thousand of Reais | Fair Value
2016 | Gains/losses
(Realized Not
Realized) | Transfers in and/ or out of Level 3 | Additions | Settled | Fair value
2017 |
| | | | | | | |
| Financial assets held for trading | 3,329 | - | - | - | (3,329) | - |
| Financial assets designated at fair value through profit or loss | 902,794 | (329,130) | - | - | - | 573,664 |
| Financial assets - available-for-sale | 897,956 | (58,008) | - | 54,785 | (36,916) | 857,817 |
Financial assets and liabilities not measured at fair value
The financial assets owned by the Bank are measured at fair value in the accompanying consolidated balance sheets, except for loans and receivables.
Similarly, the Bank’s financial liabilities except for financial liabilities held for trading and those measured at fair value - are measured at amortized cost in the consolidated balance sheets.
i) Financial assets measured at other than fair value
Below is a comparison of the carrying amounts of financial assets of the Bank measured by a value other than the fair value and their respective fair values on December 31, 2017, 2016 and 2015:
BANCO SANTANDER (BRASIL) S.A.
NOTES TO THE CONSOLIDATED FINANCIAL STATEMENTS
(Thousands of Brazilian Reais - R$ - unless otherwise stated)
| Thousand of Reais | 2017 |
| Assets |
Carrying Amount | Fair Value | Level 1 | Level 2 | Level 3 |
| | | | | | |
| Money market investments - Brazilian Central Bank (note 5) | 33,831,521 | 33,914,021 | - | 33,914,021 | - |
| Investments Held-to-Maturity (note 7) | 10,214,454 | 10,587,117 | 7,251,246 | 3,335,871 | - |
Loans and receivables:
Loans and amounts due from credit institutions (note 6) | 32,300,095 | 32,300,095 | - | 32,300,095 | - |
| Loans and advances to customers (note 10) | 272,420,157 | 275,647,324 | - | - | 275,647,324 |
| Loans and receivables - Debt instruments (note 7) | 17,616,515 | 17,127,511 | - | 17,127,511 | - |
| Total | 366,382,742 | 369,576,068 | 7,251,246 | 86,677,498 | 275,647,324 |
| Thousand of Reais | 2016 |
| Assets |
Carrying Amount | Fair Value | Level 1 | Level 2 | Level 3 |
| | | | | | |
| Money market investments - Brazilian Central Bank (note 5) | 46,371,814 | 46,341,971 | - | 46,341,971 | - |
| Investments Held-to-Maturity (note 7) | 10,048,761 | 10,555,437 | 6,942,173 | 3,613,264 | - |
Loans and receivables:
Loans and amounts due from credit institutions (note 6) | 27,762,473 | 27,757,607 | - | 27,757,607 | - |
| Loans and advances to customers (note 10) | 252,002,774 | 253,860,027 | - | - | 253,860,027 |
| Loans and receivables - Debt instruments (note 7) | 16,283,259 | 16,003,885 | - | 16,003,885 | - |
| Total | 352,469,081 | 354,518,927 | 6,942,173 | 93,716,727 | 253,860,027 |
| Thousand of Reais | 2015 |
| Assets |
Carrying Amount | Fair Value | Level 1 | Level 2 | Level 3 |
| | | | | | |
| Money market investments - Brazilian Central Bank (note 5) | 31,316,917 | 31,310,136 | - | 31,310,136 | - |
| Investments Held-to-Maturity (note 7) | 10,097,836 | 9,257,519 | 5,698,211 | 3,559,308 | - |
Loans and receivables:
Loans and amounts due from credit institutions (note 6) | 42,422,638 | 42,381,130 | - | 42,381,130 | - |
| Loans and advances to customers (note 10) | 252,033,449 | 251,319,173 | - | - | 251,319,173 |
| Loans and receivables - Debt instruments (note 7) | 11,812,701 | 11,457,378 | - | 11,457,378 | - |
| Total | 347,683,541 | 345,725,336 | 5,698,211 | 88,707,952 | 251,319,173 |
ii) Financial liabilities measured at other than fair value
Following is a comparison of the carrying amounts of Bank´s financial liabilities measured by a value other than fair value and their respective fair values on December 31 , 2017, 2016 and 2015:
| Thousand of Reais | 2017 |
| Liabilities |
Carrying Amount | Fair Value | Level 1 | Level 2 | Level 3 |
| | | | | | |
| Financial liabilities at amortized cost: | | | | | |
| Deposits from Bacen and credit institutions (note 17) | 79,068,604 | 79,068,564 | - | - | 79,068,564 |
| Customer deposits (note 18) | 258,482,156 | 258,576,177 | - | - | 258,576,177 |
| Marketable debt securities (note 19) | 70,247,012 | 70,245,820 | - | 2,000,552 | 68,245,268 |
| Subordinated liabilities (note 20) | 519,230 | 528,799 | - | - | 528,799 |
| Debt Instruments Eligible to Compose Capital (note 21) | 8,436,901 | 8,436,901 | - | 8,436,901 | - |
| Other financial liabilities (note 22) | 44,260,735 | 43,003,735 | - | - | 43,003,735 |
| Total | 461,014,638 | 459,859,996 | - | 10,437,453 | 449,422,543 |
| | | | | | | |
BANCO SANTANDER (BRASIL) S.A.
NOTES TO THE CONSOLIDATED FINANCIAL STATEMENTS
(Thousands of Brazilian Reais - R$ - unless otherwise stated)
| Thousand of Reais | 2016 |
| Liabilities |
Carrying Amount | Fair Value | Level 1 | Level 2 | Level 3 |
| | | | | | |
| Financial liabilities at amortized cost: | | | | | |
| Deposits from Bacen and credit institutions (note 17) | 78,319,960 | 78,323,271 | - | - | 78,323,271 |
| Customer deposits (note 18) | 231,079,303 | 231,125,526 | - | - | 231,125,526 |
| Marketable debt securities (note 19) | 99,842,955 | 99,671,288 | - | 7,321,870 | 92,349,418 |
| Subordinated liabilities (note 20) | 466,246 | 452,439 | - | - | 452,439 |
| Debt Instruments Eligible to Compose Capital (note 21) | 8,311,918 | 8,311,918 | - | 8,311,918 | - |
| Other financial liabilities (note 22) | 36,879,099 | 35,622,099 | - | - | 35,622,099 |
| Total | 454,899,481 | 453,506,541 | - | 15,633,788 | 437,872,753 |
| | | | | | | |
| Thousand of Reais | 2015 |
| Liabilities |
Carrying Amount | Fair Value | Level 1 | Level 2 | Level 3 |
| | | | | | |
| Financial liabilities at amortized cost: | | | | | |
| Deposits from Bacen and credit institutions (note 17) | 69,306,902 | 69,307,617 | - | - | 69,307,617 |
| Customer deposits (note 18) | 227,462,949 | 227,422,985 | - | - | 227,422,985 |
| Marketable debt securities (note 19) | 94,658,300 | 95,486,114 | - | 13,712,057 | 81,774,057 |
| Subordinated liabilities (note 20) | 8,097,304 | 8,142,296 | - | - | 8,142,296 |
| Debt Instruments Eligible to Compose Capital (note 21) | 9,959,037 | 9,959,037 | - | 9,959,037 | - |
| Other financial liabilities (note 22) | 32,072,645 | 30,815,646 | - | - | 30,815,646 |
| Total | 441,557,137 | 441,133,695 | - | 23,671,094 | 417,462,601 |
| | | | | | | |
The methods and assumptions used to estimate the fair values summarized in the tables above are set forth below:
- Loans and amounts due from credit institutions and from clients – Fair value are estimated for groups of loans with similar characteristics. The fair value was measured by discounting estimated cash flow using the average interest rate of new contracts. That is, the future cash flow of the current loan portfolio is estimated using the contractual rates, and then the new loans spread over the risk free interest rate are incorporated to the risk free yield curve in order to calculate the loan portfolio fair value. In terms of behavior assumptions, it is important to highlight that a prepayment rate is applied to the loan portfolio, thus a more realistic future cash flow is achieved.
- Deposits from Bacen and credit institutions and Client deposits – The fair value of deposits was calculated by discounting the difference between the cash flows on a contractual basis and current market rates for instruments with similar maturities. For variable-rate deposits, the carrying amount was considered to approximates fair value.
- Debt and Subordinated Securities and Debt Instruments Eligible to Compose Capital – The fair value of long-term loans were estimated by cash flow discounted at the interest rate offered on the market with similar terms and maturities.
The valuation techniques used to estimate each level are defined in note 2.e.
32. Operational Ratios
Financial institutions are required to maintain Regulatory Capital (PR), Tier I and Principal Capital consistent with their risk activities, higher than the minimum requirement of the Regulatory Capital Requirement, represented by the sum of the partial credit, market and operational risk.
The minimum Regulatory Capital requirement (PR) was 11% until December 31, 2015, reducing gradually to 8% on January 1, 2019.The minimum Regulatory Capital requirement until December 31, 2016 is 9.875%. The minimum Total Capital Tier I requirement is 6% from January 1, 2015 and the minimum Principal Capital requirement is 4.5% from October 1, 2013.
In July 2008, the regulations governing the measurement of regulatory capital came into force under the Basel II Standardized Approach. These regulations were revoked by Resolution 4,192/2013 and Resolution 4,278/2013, which came into effect in October 2013. Also, Resolutions 4,193 and 4,281 of 2013, which establish the model for calculating minimum requirements for Reference Equity (PR), of Level I and Principal Capital. These Resolutions determine that the composition of the Referential Equity be made through equity, subordinated debt, hybrid capital instruments. The index is calculated on a consolidated basis, as shown below:
BANCO SANTANDER (BRASIL) S.A.
NOTES TO THE CONSOLIDATED FINANCIAL STATEMENTS
(Thousands of Brazilian Reais - R$ - unless otherwise stated)
| | | Financial Conglomerate |
| Thousand of Reais | 2017(1) | 2016(1) | 2015(2) |
| Tier I Regulatory Capital | 56,386,001 | 56,264,021 | 52,785,049 |
| Principal Capital | 52,196,893 | 52,136,837 | 47,840,179 |
| Supplementary capital | 4,189,108 | 4,127,184 | 4,944,870 |
| Tier II Regulatory Capital | 4,250,447 | 4,280,864 | 5,182,065 |
| Regulatory Capital (Tier I and II) | 60,636,448 | 60,544,885 | 57,967,114 |
| Required Regulatory Capital | 383,132,693 | 36,669,570 | 40,531,194 |
| Portion of Credit Risk(3) | 324,696,458 | 31,309,944 | 36,355,897 |
| Market Risk Portions(4) | 25,857,109 | 2,388,626 | 2,300,969 |
| Operational Risk Portion | 32,579,126 | 2,971,000 | 1,874,328 |
| Basel I Ratio | 14.7 | 15.2 | 14.3 |
| Basel Principal Capital | 13.6 | 14.0 | 13.0 |
| Basel | 15.8% | 16.3% | 18.2% |
| (1) | Amounts calculated based on the consolidated information provided by the Consolidated Prudential. |
| (2) | Amounts calculated based on the consolidated information provided by the financial institutions (Financial Conglomerate). |
| (3) | To calculate the capital allocation for credit risk were considered modifications and inclusions of Bacen Circular 3,714 of August 20, 2014, Bacen Circular 3,770 of October 29,2015, which amending Circular 3,644 of March 4, 2013. |
| (4) | Includes portions for market risk exposures subject to variations in rates of foreign currency coupons (PJUR2), price indexes (PJUR3) and interest rate (PJUR1/PJUR4), the price of commodities (PCOM), the price of shares classified as trading portfolios (PACS), and portions for gold exposure and foreign currency transactions subject to foreign exchange (PCAM). |
The risk activity is ruled by the following basic principles, which are aligned with the strategy and business model of the Santander Group, and takes into account the recommendations of the supervisory authorities, regulators and the best market practices.
• Integration in the Culture of Risks;
• Management Involvement;
• Independence of the Risk Function;
• Formulation of Risk Appetite;
• Fully Risk Consideration;
• Anticipation and Predictability;
• Common Management Instruments;
• Decision and Collegiate Bodies;
• Organizational structure;
• Limits Authority and Responsibilities;
• Risks Limitation;
• Efficient Information Channels.
The fundamental principles ruling the risk governance model are:
• Independence of the risk function in relation to the business area;
• Management involvement in decision-making;
• Collegiate decisions and consensus on credit operations.
Based on these principles, the governance structure of the decision-making process is composed of committees that act according to pre-defined levels of authority. The CER - Executive Risk Committee is the local decision forum with representatives of Bank Management, including the CEO, the risk vice president and the other members of the executive committee. The main attributions of this Committee are:
• Follow the evolution of credit and market portfolios;
• Decide on credit proposals;
BANCO SANTANDER (BRASIL) S.A.
NOTES TO THE CONSOLIDATED FINANCIAL STATEMENTS
(Thousands of Brazilian Reais - R$ - unless otherwise stated)
• Define and follow the Risk Appetite fulfilment;
• Define the actions regarding the recommendations formulated by the local regulator;
• Approve the risk regulation as well as the changes in risk policies that impact revenues, margin or provision expenses.
The Capital Policies of Banco Santander establish the general guidelines that should rule the areas involved operations in the capital management and control processes.
The content is structured as follows:
• Strategic Capital Policies;
• Capital Management and Control Policies;
• Operational Capital Policies;
• Organizational Structure and Governance Policies.
All processes related to capital issues follow a governance of approval that is aligned with the standards established in the Risk Governance Model mentioned above.
The definition of committees and approvals are established from the lines of defense:
• 1st Line of Defense: the main functions is the process of capital management coordination, annual capital planning definition, capital structure establishment, annual capital budgets monitoring, etc.;
• 2nd Line of Defense: must ensure effective control of capital risk management and certify that the level of risk appetite is covering the institution’s capital;
• 3rd Line of Defense: represents the role of independent reviewer.
Banco Santander, quarterly disclose information relating to risk management and Required Regulatory Capital (PRE) which is not an extension of the Financial Statements and it isn’t audited. A report with further details of the structure and methodology will be disclosed at the website www.santander.com.br/ri.
Financial institutions are required to maintain investments in tangible assets compatible with adjusted regulatory capital. Funds invested in tangible assets, calculated on a consolidated basis, are limited to 50% of adjusted regulatory capital, as per prevailing regulation. On December 31, 2017, 2016 and 2015 Banco Santander classifies for said index.
33. Interest and similar income
“Interest and similar income” in the consolidated income statement comprises the interest accruing in the year on all financial assets with an implicit or explicit return, calculated by applying the effective interest method, regardless the fair value measurement; and the rectifications of income as a result of hedge accounting. Interest is recognized through its gross value, without deducting any tax withheld at source.
The breakdown of the main items of interest and similar charges accrued in 2017, 2016 and 2015 is as follows:
| Thousand of reais | 2017 | 2016 | 2015 |
| | | | |
| Cash and balances with the Brazilian Central Bank | 5,953,765 | 7,315,570 | 4,625,467 |
| Loans and advances - Credit institutions | 5,107,355 | 7,472,729 | 5,075,636 |
| Loans and advances - Customers | 44,507,217 | 43,977,981 | 41,844,940 |
| Debt instruments | 13,456,802 | 14,783,164 | 14,872,834 |
| Other interest | 2,393,210 | 3,596,633 | 3,451,323 |
| Total | 71,418,349 | 77,146,077 | 69,870,200 |
34. Interest expense and similar charges
“Interest expense and similar charges” in the consolidated income statement includes the interest accruing in the year on all financial liabilities with an implicit or explicit return, including remuneration in kind, calculated by applying the effective interest method, regardless the fair value measurement; the rectifications of cost as a result of hedge accounting; and the interest cost attributable to pension funds.
The breakdown of the main items of interest expense and similar charges accrued in 2017, 2016 and 2015 is as follows:
BANCO SANTANDER (BRASIL) S.A.
NOTES TO THE CONSOLIDATED FINANCIAL STATEMENTS
(Thousands of Brazilian Reais - R$ - unless otherwise stated)
| Thousand of reais | 2017 | 2016 | 2015 |
| | | | |
| Credit institutions deposits | 3,782,781 | 3,369,931 | 4,584,244 |
| Debt securities issued | 19,490,807 | 25,693,236 | 20,666,382 |
| Marketable debt securities and subordinated liabilities: | | | |
| Marketable debt securities (note 19) | 7,901,199 | 12,212,922 | 10,047,874 |
| Subordinated liabilities (note 20) | 52,984 | 731,594 | 1,019,302 |
| Debt Instruments Eligible to Compose Capital (note 21) | 495,188 | 501,748 | 503,290 |
| Provisions for pensions (note 24.b) | 292,628 | 290,920 | 404,171 |
| Other interest(1) | 4,456,273 | 3,759,233 | 1,307,826 |
| Total | 36,471,860 | 46,559,584 | 38,533,089 |
| (1) | In December 31 2015, includes R$2,057 million related to the reversal of legal obligations. |
35. Income from equity instruments
“Income from equity instruments” includes the dividends and payments on equity instruments out of profits generated by investees after the acquisition of the equity interest.
The breakdown of the balance of this item is as follows:
| Thousand of reais | 2017 | 2016 | 2015 |
| | | | |
| Equity instruments classified as: | | | |
| Financial assets held for trading | 18,458 | 21,489 | 44,312 |
| Financial assets - available-for-sale | 64,662 | 237,056 | 85,703 |
| Other financial instruments at fair value through profit or loss | | | 12,866 |
| Total | 83,120 | 258,545 | 142,881 |
36. Fee and commission income
“Fee and commission income” comprises the amount of all fees and commissions accruing in favor of the Bank in the year, except those that form an integral part of the effective interest rate on financial instruments.
The breakdown of the balance of this item is as follows:
| Thousand of reais | 2017 | 2016 | 2015 |
| | | | |
| Collection and payment services: | | | |
| Bills | 970,293 | 789,996 | 654,340 |
| Demand accounts | 2,156,384 | 1,786,175 | 1,496,535 |
| Cards (Credit and Debit) and Acquiring Services | 4,985,306 | 4,090,766 | 3,479,361 |
| Checks and other | 172,718 | 169,100 | 154,400 |
| Orders | 471,763 | 364,102 | 318,322 |
| Total | 8,756,464 | 7,200,139 | 6,102,958 |
| Marketing of non-Banking financial products: | | | |
| Investment funds | 819,748 | 1,014,401 | 982,533 |
| Insurance | 2,414,478 | 2,114,316 | 2,156,230 |
| Capitalization | 363,516 | 325,531 | 15,765 |
| Total | 3,597,742 | 3,454,248 | 3,154,528 |
| Securities services: | | | |
| Securities underwriting and placement | 513,727 | 357,513 | 280,471 |
| Securities trading | 114,015 | 115,334 | 105,979 |
| Administration and custody | 191,987 | 65,667 | 81,154 |
| Asset management | 2,353 | 1,863 | 1,705 |
| Total | 822,082 | 540,377 | 469,309 |
| Other: | | | |
| Foreign exchange | 742,676 | 722,912 | 597,620 |
| Financial guarantees | 672,801 | 634,375 | 507,921 |
| Other fees and commissions | 1,223,778 | 996,430 | 964,855 |
| Total | 2,639,255 | 2,353,717 | 2,070,396 |
| Total | 15,815,543 | 13,548,481 | 11,797,191 |
BANCO SANTANDER (BRASIL) S.A.
NOTES TO THE CONSOLIDATED FINANCIAL STATEMENTS
(Thousands of Brazilian Reais - R$ - unless otherwise stated)
37. Fee and commission expense
“Fee and commission expense” shows the amount of all fees and commissions paid or payable in the year, except those that form an integral part of the effective interest rate on financial instruments.
The breakdown of the balance of this item is as follows:
| Thousand of reais | 2017 | 2016 | 2015 |
| | | | |
| Commissions assigned to third parties(1) | 1,975,379 | 1,620,812 | 1,520,480 |
| Other fees and commissions | 1,118,296 | 950,073 | 793,202 |
| Total | 3,093,675 | 2,570,885 | 2,313,682 |
| (1) Composed, principally, by Credit cards. | | | |
38. Gains or losses on financial assets and liabilities
Gains (losses) on financial assets and liabilities (net) includes the amount of the valuation adjustments of financial instruments, except those attributable to interest accrued as a result of application of the effective interest method and to allowances, and the gains or losses derived from the sale and purchase thereof.
The breakdown of the balance of this item, by type of instrument, is as follows:
| Thousand of reais | 2017 | 2016 | 2015 |
| | | | |
| Gains or losses on financial assets and liabilities held for trading, net(1) | 1,174,111 | 3,166,399 | (19,936,801) |
| Gains or losses on financial assets and liabilities measured at fair value through profit or loss, net(2) | 30,694 | 82,638 | 46,859 |
| Gains or losses on financial assets and liabilities not measured at fair value through profit or loss, net | (122,115) | (115,202) | (120,523) |
| Financial assets - available-for-sale | | | |
| Debt instruments | (156,802) | (108,318) | 385,605 |
| Equity instruments | 34,687 | (6,884) | (506,128) |
| Gains or losses from hedge accounting, net | (113,600) | (117,679) | 7,606 |
| Total | 969,090 | 3,016,156 | (20,002,859) |
| (1) | Includes the fiscal hedge of the Bank’s interest in Cayman, which is a non-autonomous subsidiary (note 25). |
| (2) | Includes the net gain arising from transactions involving debt securities, equity instruments and derivatives included in this portfolio, since the Bank manages its risk in these instruments on a global basis. |
39. Exchange differences (net)
"Exchange differences" demonstrate the gains or losses on foreign currency transactions, the differences that arise on translations of monetary items in foreign currencies to the functional currency, and those disclosed on non-monetary assets in foreign currency at the time of their disposal.
| Thousand of reais | 2017 | 2016 | 2015 |
| | | | |
| Revenue with Exchange variations | 24,008,382 | 16,634,809 | 52,013,425 |
| Expenses with Exchange Variations | (23,403,326) | (12,059,995) | (41,929,005) |
| Total | 605,056 | 4,574,814 | 10,084,420 |
40. Other operating income and expenses
The breakdown of "Other operating income (expense)" is as follows:
| Thousand of reais | 2017 | 2016 | 2015 |
| | | | |
| Other operating income | 896,279 | 690,310 | 566,006 |
| Other operating expense | (1,259,338) | (1,067,560) | (668,444) |
| Contributions to fund guarantee of credit - FGC | (308,954) | (247,321) | (244,685) |
| Total | (672,013) | (624,571) | (347,123) |
BANCO SANTANDER (BRASIL) S.A.
NOTES TO THE CONSOLIDATED FINANCIAL STATEMENTS
(Thousands of Brazilian Reais - R$ - unless otherwise stated)
41. Personnel expenses
a) Breakdown
The breakdown of “Personnel expenses” is as follows:
| Thousand of reais | 2017 | 2016 | 2015 |
| | | | |
| Wages and salaries | 5,713,702 | 5,377,284 | 4,655,400 |
| Social security costs | 1,381,229 | 1,273,486 | 1,316,282 |
| Benefits | 1,309,314 | 1,277,781 | 1,183,902 |
| Defined benefit pension plans (note 24) | 20,081 | 24,480 | 31,332 |
| Contributions to defined contribution pension plans | 87,099 | 86,576 | 78,785 |
| Share-based compensation | 87,293 | 86,963 | 175,976 |
| Training | 58,338 | 62,518 | 92,883 |
| Other personnel expenses | 280,222 | 188,177 | 264,232 |
| Total | 8,937,278 | 8,377,265 | 7,798,792 |
b) Share-Based Compensation
Banco Santander has long-terms compensation plans linked to the market price of the shares. The members of the Executive Board of Banco Santander are eligible for these plans, as well as other members selected by the Board of Directors and informed to the Human Resources, whose selection will take into account seniority of the group. For the Board of Directors members in order to be eligible, it is necessary to exercise Executive Board functions. These amounts are recorded under Other liabilities (note 26) and personnel expenses (Note 41).
b.1) Local Program
The long-term incentive plans SOP 2014, PSP 2013 and SOP 2013 were closed in the year 2016. In 2017, the only stock purchase plan of the Bank that remains open for the year is the Deposit Certificate Purchase Option Plan of Units (SOP 2013), as approved at the EGM of April 29, 2013. In 2017, a new plan for the Private area called the Private Ultra High Long Term Incentive Plan was set up.
(i) Share purchase plans
Long-Term Incentive Plan – SOP 2013: It is a call option plan with 3 years of duration. The period for the exercise comprises between June 30, 2016 to June 30, 2018. The number of Units to be exercised by the participants were determined according to the result of measurement of a performance parameter of the Bank: Total Shareholder Return (TSR) and adjusted by the indicator Return on Assets by Risk (RoRWA), comparison between realized and budgeted in each year. The final result of the plan was 89.61%.
b.1.1) Fair Value and Plans Performance Parameters
For accounting of the Local Program plans, an independent consultant promoted simulations based on Monte Carlo methodology, as presented the performance parameters used to calculate the shares to be granted. Such parameters are associated with their respective probabilities of occurrence, which are updated at the close of each exercise.
| Total Shareholder Return (TSR) rank | SOP 2013(1)
% of Exercisable Shares |
| 1st | | | |
| 2nd | | | 100% |
| 3rd | | | 75% |
| Total | | | 50% |
(1) The percentage of shares determined at the position of TSR is subject to a penalty according to the implementation of the RoRWA.
For fair value measurement the following premises was used:
| SOP 2013 |
| Method of Assessment | Black & Scholes |
| Volatility | 40.00% |
| Rate of Dividends | 3.00% |
| Vesting Period | 3 years |
| Average Exercise Time | 5 years |
| | |
BANCO SANTANDER (BRASIL) S.A.
NOTES TO THE CONSOLIDATED FINANCIAL STATEMENTS
(Thousands of Brazilian Reais - R$ - unless otherwise stated)
| SOP 2013 |
| Risk-Free Rate | 11.80% |
| Probability of Occurrence | 60.27% |
| Fair Value of the Option Shares | R$5.96 |
| | |
The average value of shares SANB11(Shares of the Bank in B3 S.A.) (Current Company Name of BM&FBovespa) in the exercise ended on December 31, 2017 is R$28.47 (2016 - R$19.94 and 2015 - R$14.96 ).
On 2017, no pro rata expenses were recorded (2016 - R$15,789), related to the Stock Option Certificate (SOP). In the same period 2017, there were no expenses related to the Long Term Incentive Plan - Investment in Certificate of Deposit of Shares - Units (2016 - R$9,798).
| | Number of Units | Exercise
Price in Reais | Year Granted | Employees | Date of Commencement of Exercise Period | Expiration Date of Exercise Period |
| | | | | | | |
| Final Balance on December 31, 2015 | 12,663,604 | | | | | |
| Cancelled options (SOP - 2013) | (1,346,779) | 17.92 | 2013 | Executives | 06/30/16 | 06/30/18 |
| Exercised options (SOP - 2013) | (6,377,786) | 17.92 | 2013 | Executives | 06/30/16 | 06/30/18 |
| Granted options (SOP - 2013) | 220,606 | 14.31 | 2013 | Executives | 06/30/16 | 06/30/18 |
| Cancelled options (PSP - 2013) | (298,446) | 12.72 | 2013 | Executives | 08/13/13 | 06/30/16 |
| Granted options (PSP - 2013) | (2,147,515) | - | 2013 | Executives | 08/13/13 | 06/30/16 |
| Cancelled options (SOP - 2014) | (34,196) | 12.84 | 2011 | Executives | 06/30/14 | 06/30/16 |
| Exercised options (SOP - 2014) | (693,230) | - | 2011 | Executives | 06/30/14 | 06/30/16 |
| Final Balance on December 31, 2016 | 1,986,258 | | | | | |
| Exercised options (SOP - 2013) | (869,247) | 12.84 | 2013 | Executives | 06/30/16 | 06/30/18 |
| Final Balance on December 31, 2017 | 1,117,011 | | | | | |
(ii) Local Long-Term Incentive Plan - Cash
Long-Term Incentive Plan - Private Ultra High: aims to align the interests of Banco Santander and the Participant with views, on the one hand, to the growth and profitability of the Private business and, on the other hand, recognition of the Participant’s contribution. The Plan has as its objective the payment by the Bank to the Participants as Variable Remuneration.
Each participant has a target in Reais, if the indicators are reached, the target will be applied on the reference value, the first, paid in March 2020 and the second in March 2021.
Indicators - Phase 1 (Reference Value)
• BAI of 2017.
Indicators - Phase 2 (Calculation of Cash Incentive)
• BAI - 50% (Benefit Indicator before Private Ultra High Segment Taxes);
• MOL - 25% (Private Ultra High Segment Net Margin Indicator); and
• AUM - 25% (Assets Under Management Indicator of Private Ultra High Segment).
In 2017, expenses in the amount of R$2,935, related to the long-term incentive plan - Private Ultra High were registered.
b.2) Global Program
Long-Term Incentive Policy
In 2014, a share delivery plan called Long Term Incentive Global CRDIV - Grant 2014 was released. This plan is subject to achievement of performance indicator Total Shareholder Return (TSR) of the Santander Group, comparing the evolution of the Group in this indicator for the main global competitors and the settlement will be in the World Group Santander shares.
In 2016, a stock delivery plan called Plan 2nd Global Long -Term Incentive CRDIV - Grant 2015 was launched.
BANCO SANTANDER (BRASIL) S.A.
NOTES TO THE CONSOLIDATED FINANCIAL STATEMENTS
(Thousands of Brazilian Reais - R$ - unless otherwise stated)
Global Plan Fair Value
1st Long-Term Incentive Global Plan Grant 2014 - ILP CRDIV
It is assumed that the grantee will not leave the Bank’s employment during the term of each plan. The fair value of the 50% linked to the Bank’s relative TSR position was calculated, on the grant date, on the basis of the report provided by external valuators whose assessment was carried out using a Monte Carlo valuation model, performing 10 thousand simulations to determine the TSR of each of the companies in the Benchmark Group, taking into account the variables set forth below. The results (each of which represents the delivery of a number of shares) are classified in decreasing order by calculating the weighted average and discounting the amount at the risk-free interest rate.
In view of the high correlation between RTA and LPA, it can be considered (in a high percentage of cases) feasible to extrapolate that the RTA value is also valid for LPA. Therefore, it was initially determined that the fair value of the portion of the plans linked to the Bank’s relative LPA position, of the remaining 50% of the options granted, was the same as that of the 50% corresponding to the TSR. This valuation is reviewed and adjusted on a yearly basis, since its refers to a non-market condition.
Long Term Incentive Global CRDIV - Grant 2014
| | 2 years | 3 years | 4 years |
| Future income Dividend | 11.1% | 0.0% | 9.50% |
| Expected Volatility | 32.7% | 0.0% | 36.90% |
| Volatility comparator | 12% - 52% | 0.0% | 16% - 52% |
| Risk-free interest rate | 1.7% | 0.0% | 2.50% |
| Correlation | 0.55 | 0.55 | 0.55 |
The indicator that will be used to measure the achievement of targets will be the comparison of the Total Shareholder Return (TSR) of the Santander Group with the RTA of fifteen leading the Group’s global competitors.
The indicator is calculated in two stages: initially for program verification in 2014 and a second time in the annual payment of each installment (2015, 2016 and 2017).
Each executive has a target in reais that was converted to shares of Santander Group, by the price of R$19.2893. These shares will be delivered in the years 2016, 2017 and 2018, with sale restriction of one year after each delivery.
2nd Long-Term Incentive Global Plan CRDIV - Grant 2015.
The agreed ILP values for each participant will be obtained from the verification of the achievement of indicators in two moments: the first time to determine the eligibility (2015-2016) and a second time to calculate the number of actions due (2016, 2017 and 2018)."
Indicators - First time
• RTA versus Competitors; and
• ROTE Bank versus Budget.
Indicators - Second time
• RTA versus Competitors;
• ROTE Bank versus Budget;
• Employee satisfaction;
• Customer satisfaction; and
• Corporate main bank costumer indicator versus Budget.
Each executive has a target in reais that was converted to shares of Santander Bank Spain by the price of R$17.473. These shares will be delivered in 2019, with sale restriction of one (1) year after the delivery.
BANCO SANTANDER (BRASIL) S.A.
NOTES TO THE CONSOLIDATED FINANCIAL STATEMENTS
(Thousands of Brazilian Reais - R$ - unless otherwise stated)
| Thousand of Reais | 2015 |
| | Number of Shares | Granted Year | Employees | Commencement of the Period | Date of Expiry of Period |
| | | | | | |
| 1st Long-Term Incentive Global CRDIV – Grant 2014 | 1,613,057 | 2014 | Executives | Jan – 2014 | Dec - 2017 |
| 2nd Long-Term Incentive Global Plan CRDIV – Grant 2015 | 1,775,049 | 2016 | Executives | Jan – 2015 | Dec - 2017 |
| Balance Plans on December 31, 2017 | 3,388,106 | | | | |
In 2017, were recognized daily pro-rata expenses amounted to R$4,797 (2016 - no expenses registered), related to costs to the respective dates of the above cycles, for total plans of the Global Program.
Plans do not result in dilution of the share capital of the Bank, because they are paid in shares of Banco Santander Spain.
b.3) Variable Remuneration based in shares
Banco Santander Spain’s General Shareholders Meeting, held on June 11, 2010, approved the new policy relating to executive compensation through the payment referenced in variable compensation shares to the Group companies, including Banco Santander. This new policy, with adjustments applicable to Banco Santander, was approved by the Compensation Committee and the Board of Directors on February 2, 2011.
The plan’s objectives are: (i) to align the compensation program with the principles of the “Financial Stability Board” (FSB) agreed upon at the G20; (ii) to align Banco Santander’s interests with those of the plan’s participants (to achieve the sustainable and recurring growth and profitability of Banco Santander’s businesses and to recognize the participants’ contributions); (iii) to allow the retention of participants; and (iv) to improve Banco Santander’s performance and defend the interests of stockholders’ via a long-term commitment.
The purpose of the plan is the cash or shares payment of part of the variable compensation owed by Banco Santander to the plan’s participants pursuant to the Bank’s compensation policy, based on the future performance of the bank’s shares.
The referenced variable compensation in shares is within the limits of the overall management compensation approved by Banco Santander’s Annual Stockholders’ Meeting.
The total number of shares in which the compensation plan is based will be settled in three installments and equally allocated to each of the three fiscal years following the reference year.
On March 18, 2015, the Board of Directors approved the proposed new incentive plan (deferred) for payment of the variable compensation of directors and certain employees, which was approved in EGM (Extraordinary General Meeting) of April 30, 2015.
On September 29, 2015, the Board of Directors approved the proposed new incentive plan (deferred) for payment of the variable compensation of directors and certain employees, which was approved in EGM (Extraordinary General Meeting) of December 14, 2015.
On March 18, 2015, the Board of Directors approved the proposed new incentive plan (deferred) for payment of the variable remuneration of directors and certain employees, which was approved in AGE (Extraordinary General Meeting) of April 30, 2015.
On October 25, 2016, the Board of Directors approved the proposed new incentive plan (deferred) for payment of the variable compensation of directors and certain employees, which was approved in EGM (Extraordinary General Meeting) of December 21, 2016.
In the fourth quarter of 2017, the Board of Directors approved the proposal for a new Incentive Plan (deferral) to pay the variable remuneration of administrators and certain employees.
This proposal includes certain requirements for deferred payment of part of the future variable compensation due to its managers and other employees, given the financial basis for sustainable long-term adjustments in future payments due to the risks assumed and fluctuations in cost of capital.
The Banco Santander´s variable compensation plan has been assessed and became divided into two programs: (i) Collective Identified and (ii) Collective unidentified.
a) Collective Identified - Participants of the Executive Committee, Statutory Directors and other executives who take significant risks in the Bank and are responsible for the control areas. The deferral will be half in cash, indexed by 100% of CDI and half in shares (SANB11). On the exercise ended on December 31, 2017, was recorded loss amounted to R$81,838 (2016 - R$52,500 and 2015 - R$89,961), regarding the provision of the deferral plan in shares.
b) Collective Unidentified - managerial employees and other employees of the organization that will be benefited from the deferral plan. The deferred amount will be paid 100% cash, indexed by 100% of CDI. On the year ended on December 31, 2017, there were expense of R$124,926 (2016 - R$79,794 and 2015 - R$59,797).
BANCO SANTANDER (BRASIL) S.A.
NOTES TO THE CONSOLIDATED FINANCIAL STATEMENTS
(Thousands of Brazilian Reais - R$ - unless otherwise stated)
42. Other general administrative expenses
a) Breakdown
The detail of Other general administrative expenses is as follows:
| Thousand of reais | 2017 | 2016 | 2015 |
| Property, fixtures and supplies | 1,284,490 | 1,278,556 | 1,268,498 |
| Technology and systems | 1,364,720 | 1,246,809 | 1,192,533 |
| Advertising | 617,563 | 486,772 | 523,343 |
| Communications | 593,272 | 488,799 | 481,217 |
| Per diems and travel expenses | 106,956 | 133,123 | 160,135 |
| Taxes other than income tax | 122,570 | 84,932 | 128,022 |
| Surveillance and cash courier services | 630,466 | 622,362 | 614,596 |
| Insurance premiums | 27,289 | 21,308 | 20,975 |
| Specialized and technical services | 1,901,056 | 1,744,726 | 1,820,657 |
| Technical reports | 370,546 | 437,683 | 406,755 |
| Others specialized and technical services | 1,530,510 | 1,307,043 | 1,413,902 |
| Other administrative expenses | 534,935 | 435,758 | 506,364 |
| Total | 7,183,317 | 6,543,145 | 6,716,340 |
b) Other information
The balance of “Technical reports” includes the fees paid by the consolidated companies to their respective auditors, the detail are as follows:
| Millions of reais | 2017 | 2016 | 2015 |
| Audit of the annual financial statements of the companies audited by external audit(1)(2) (constant scope of consolidation) | 17.5 | 9.2 | 12.0 |
| Audit Related | 3.9 | 0.1 | 1.5 |
| Others | 1.3 | 0.7 | 1.7 |
| Total | 22.7 | 10.0 | 15.2 |
| (1) | On March 18, 2016, the Banco Santander contracted PricewaterhouseCoopers Auditores Independentes (PWC), to act as an independent auditor of the Bank and the companies that compose the Conglomerate Santander in Brazil, to replace Deloitte Touche Tohmatsu Auditores Independentes (Deloitte), which provided an independent audit service for the financial statements related to the year ended December 31, 2015. |
| (2) | In 2017, includes R$2.3 million referring to auditing work for the 2016 fiscal year. |
The approximate value of taxes according to law 12,741/2012 totaled R$3.7 million (2016 - R$1.8 million).
Services provided by other audit firms totaled R$13.2 million (2016 - R$4.9 million and 2015 - R$4.9 million).
43. Gains or losses on non financial assets and investments, net
The breakdown of the balance of this item is as follows:
| Thousands of reais | 2017 | 2016 | 2015 |
| Gains | 1,798 | 12,584 | 787,628 |
| Tangible and intangible assets | 1,798 | 12,575 | 30,478 |
| Investments(1) | - | 9 | 757,150 |
| Losses | (66,100) | (8,768) | (7,013) |
| Tangible and intangible assets | (13,719) | (7,547) | (502) |
| Investments | (52,381) | (1,221) | (6,511) |
| Total | (64,302) | 3,816 | 780,615 |
(1) In 2015 includes a gain of R$750,550, related to the operation with the sale of Santander Securities Services Brasil DTVM S.A. (note 4.a).
(2) In 2017, includes the amount of R$41,999 related to the sale of BW Guirapá I S.A.
44. Gains (losses) on disposal and expenses of non-current assets held for sale not classified as discontinued operations
As of December 31, 2017, it mainly includes R $ 272 million of provisions for devaluations on real estate, constituted from valuation reports prepared by specialized external consulting and at December 31, 2016, basically refers to the result on disposal of assets received in the processes of recovery of loans with customers and the provision for the recoverable amount of these assets.
BANCO SANTANDER (BRASIL) S.A.
NOTES TO THE CONSOLIDATED FINANCIAL STATEMENTS
(Thousands of Brazilian Reais - R$ - unless otherwise stated)
45. Other disclosures
a) Guarantees and commitments
The Bank provides a variety of guarantees to its clients to improve their credit standing and allow them to compete The following table summarizes at December 31, 2017, 2016 and 2015 all of the guarantees.
As required, the “maximum potential amount of future payments” represents the notional amounts that could be considered as a loss if there were a total default by the guaranteed parties, without consideration of possible recoveries from collateral held or pledged, or recoveries under recourse provisions. There is no relationship between these amounts and probable losses on these guarantees. In fact, "maximum potential amount of future payments" significantly exceeds inherent losses.
Thousands of reais Maximum potential amount of future payments Contingent liabilities | 2017 | 2016 | 2015 |
| Guarantees and other sureties | 40,729,544 | 32,629,975 | 42,836,334 |
| Financial guarantees | 37,007,057 | 24,475,507 | 41,183,159 |
| Performance guarantees | 486,091 | 532,232 | 521,373 |
| Financial letters of credit | 3,110,918 | 7,462,761 | 874,661 |
| Other | 125,478 | 159,475 | 257,141 |
| Other contingent exposures | 1,915,492 | 635,055 | 774,383 |
| Documentary Credits | 1,915,492 | 635,055 | 774,383 |
| Total Contingent Liabilities | 42,645,036 | 33,265,030 | 43,610,717 |
| Commitments | | | |
| Loan commitments drawable by third parties(1) | 106,913,219 | 91,251,198 | 91,960,299 |
| Total Commitments | 106,913,219 | 91,251,198 | 91,960,299 |
| Total | 149,558,255 | 124,516,228 | 135,571,016 |
(1) Includes the approved limits and unused overdraft, credit card and others.
Financial guarantees are provided to Bank´s clients in respect of their obligations to third parties. The Bank has the right to seek reimbursement from the clients for any amount it shall have to pay under such guarantee. Additionally, the Bank may hold cash or other highly liquid collateral for these guarantees. These guarantees are subject to the same credit evaluation performed on the origination of loans.
The Bank´s expectation is that many of these guarantees to expire without the need of cash disbursement in advance. Therefore, in the ordinary course of business, the Bank expects that these guarantees will have virtually no impact on its liquidity.
Performance guarantees are issued to guaranteed clients obligations such as to make contractually specified investments, to supply specified products, commodities, or maintenance or warranty services to a third party, completion of projects in accordance with contract terms, etc. Financial standby letters of credit include guarantees of payment of loans, credit facilities, promissory notes and trade acceptances. The Bank always requires collateral to grant this kind of financial guarantees. In Documentary Credits, the Bank acts as a payment intermediary between trading companies located in different countries (import-export transactions). Under a documentary credit transaction, the parties involved deal with the documents rather than the commodities to which the documents may relate. Usually the traded commodities are used as collateral to the transaction and the Bank may provide some credit facilities. Loan commitments draw able by third parties include mostly credit card lines and commercial commitments. Credit card lines are unconditionally cancelable by the issuer. Commercial commitments are mostly 1 year facilities subject to information requirements to be provided by Banks´s clients.
The risk criteria followed to issue all kinds of guarantees, financial standby letters of credit, documentary credits and any risks of signature are in general the same as those used for other products of credit risk, and therefore subject to the same admission and monitoring standards. The guarantees granted on behalf of Bank´s clients are subject to the same credit quality review process as any other risk product. On a regular basis, at least once a year, the solvency of the mentioned clients is checked as well as the probability of those guarantees to be executed. In case that any doubt on the client’s solvency may arise we create allowances with charge to net income, by the amount of the inherent losses even if there is no claim to us.
The provision for losses on the non-recovery guarantees and other securities (Note 10.c) is recorded as "Impairment losses on financial assets (net)” on consolidated income statement and its calculation is described in note 2.i.
Additionally, the liability recognized as deferred revenue for the premium received for providing the above guarantees, which is being amortized into income over the life of the related guarantees is R$446,143 (2016 - R$476,564 and 2015 - R$385,169).
BANCO SANTANDER (BRASIL) S.A.
NOTES TO THE CONSOLIDATED FINANCIAL STATEMENTS
(Thousands of Brazilian Reais - R$ - unless otherwise stated)
b) Off-balance funds under management
Banco Santander has under its management investment funds for which it does not hold any substantial participation interests and does not act as principal over the funds, and it does not own any shares of such funds. Based on the contractual relationship governing the management of such funds, third parties who hold the participation interests in such funds are those who are exposed to, or have rights, to variable returns and have the ability to affect those returns through power over the fund. Moreover, though Santander Brasil acts as fund manager, in analyzing the fund manager’s remuneration regime, the remuneration regime is proportionate to the service rendered, and therefore does not create exposure of such importance to indicate that the fund manager is acting as the principal (Note 2.w).
The funds managed by Banco Santander not recorded in the balance sheet are as follows:
| Thousands of reais | 2017 | 2016 | 2015 |
| Funds under management | 1,747,623 | 1,533,620 | 2,542,286 |
| Total | 1,747,623 | 1,533,620 | 2,542,286 |
c) Third-party securities held in custody
On December 31, 2017, the Bank held in custody debt securities and equity instruments totaling R$40,459,429 (2016 - R$27,772,714 and 2015 - R$38,412,152) entrusted to it by third parties.
d) Residual maturity
The breakdown, by maturity, of the balances of certain items in the consolidated balance sheets is as follows:
| | | | | | | 2017
Thousands of reais |
| Assets | On Demand | Up to 3 Months | 3 to 12 Months | 1 to 3 Years | 3 to 5 Years | After 5 Years | Total |
| Cash and balances with the Brazilian Central Bank | 67,033,452 | 15,071,095 | 18,761,534 | - | - | - | 100,866,081 |
| Debt instruments(2) | 609,220 | 1,887,278 | 21,978,394 | 31,669,850 | 19,379,308 | 45,731,067 | 121,255,117 |
| Equity instruments | 66,187 | 124,304 | 305,073 | 842,090 | - | 292,121 | 1,629,775 |
| Loans and amounts due from credit institutions | 18,709,969 | 1,753,197 | 182,721 | 10,382,061 | 18,166 | 1,253,981 | 32,300,095 |
| Loans and advances to customer | 31,065,824 | 70,301,530 | 61,286,539 | 63,375,203 | 17,796,364 | 28,594,697 | 272,420,157 |
| Loans and Receivables - Debt instruments | 933,175 | 476,158 | 3,520,401 | 7,444,943 | 3,911,776 | 1,330,062 | 17,616,515 |
| Investments Held-to-Maturity | - | - | - | 474,193 | 1,169,450 | 8,570,811 | 10,214,454 |
| Derivatives | - | 426,577 | 1,034,248 | 9,470,073 | 4,357,636 | 1,974,354 | 17,262,888 |
| Total | 118,417,827 | 90,040,139 | 107,068,910 | 123,658,413 | 46,632,700 | 87,747,093 | 573,565,082 |
| Liabilities: | | | | | | | |
| Financial liabilities at amortized cost: | | | | | | | |
| Deposits from credit institutions(1) | 394,396 | 21,636,392 | 44,696,680 | 6,797,838 | 2,717,941 | 3,131,438 | 79,374,685 |
| Customer deposits(1) | 64,512,105 | 103,511,031 | 48,339,761 | 42,494,421 | 17,176,009 | 8,814 | 276,042,141 |
| Marketable debt securities(1) | - | 14,315,305 | 35,636,549 | 17,923,372 | 1,491,866 | 879,920 | 70,247,012 |
| Subordinated liabilities | - | - | 519,230 | - | - | - | 519,230 |
| Debt Instruments Eligible to Compose Capital | - | 114,104 | - | - | - | 8,322,797 | 8,436,901 |
| Other financial liabilities | 11,710,943 | 30,985,465 | 1,537,689 | 26,638 | - | - | 44,260,735 |
| Financial liabilities held for trading: | | | | | | | |
| Short positions | - | - | 466,000 | 8,960,806 | 7,476,079 | 15,905,507 | 32,808,392 |
| Derivatives | - | 769,619 | 975,945 | 8,244,193 | 4,239,198 | 2,448,531 | 16,677,486 |
| Total | 76,617,444 | 171,331,916 | 132,171,854 | 84,447,268 | 33,101,093 | 30,697,007 | 528,366,582 |
| Difference (assets less liabilities) | 41,800,383 | (81,291,777) | (25,102,944) | 39,211,145 | 13,531,607 | 57,050,086 | 45,198,500 |
BANCO SANTANDER (BRASIL) S.A.
NOTES TO THE CONSOLIDATED FINANCIAL STATEMENTS
(Thousands of Brazilian Reais - R$ - unless otherwise stated)
| | | | | | | 2016
Thousands of reais |
| Assets | On Demand | Up to 3 Months | 3 to 12 Months | 1 to 3 Years | 3 to 5 Years | After 5 Years | Total |
| Cash and balances with the Brazilian Central Bank | 14,917,634 | 42,538,383 | 3,833,431 | - | - | 49,315,463 | 110,604,911 |
| Debt instruments | - | 21,709,350 | 10,136,133 | 26,674,215 | 28,135,295 | 30,838,274 | 117,493,267 |
| Equity instruments | 593,594 | 48,054 | 252,087 | 486,408 | 21,313 | 1,024,933 | 2,426,389 |
| Loans and amounts due from credit institutions | 13,614,198 | 2,849,696 | 923,308 | 532,399 | 34,458 | 9,808,414 | 27,762,473 |
| Loans and advances to customer | 30,408,851 | 68,218,474 | 60,047,442 | 54,558,381 | 17,357,244 | 21,412,382 | 252,002,774 |
| Loans and Receivables - Debt instruments | 822,874 | 1,287,372 | 2,960,099 | 5,044,803 | 4,472,758 | 1,695,353 | 16,283,259 |
| Investments Held-to-Maturity | - | - | 12,378 | 371,621 | 1,173,360 | 8,491,402 | 10,048,761 |
| Derivatives | 620,422 | 9,209,421 | 3,571,126 | 3,813,687 | 5,481,210 | 2,007,107 | 24,702,973 |
| Total | 60,977,573 | 145,860,750 | 81,736,004 | 91,481,514 | 56,675,638 | 124,593,328 | 561,324,807 |
| Liabilities: | | | | | | | |
| Financial liabilities at amortized cost: | | | | | | | |
| Deposits from credit institutions(1) | 770,467 | 40,581,025 | 23,315,006 | 8,215,378 | 2,818,095 | 2,934,101 | 78,634,072 |
| Customer deposits(1) | 60,919,032 | 64,154,475 | 68,505,808 | 39,630,274 | 14,003,821 | 231,767 | 247,445,177 |
| Marketable debt securities(1) | - | 21,833,927 | 56,637,880 | 20,620,077 | 312,143 | 438,928 | 99,842,955 |
| Subordinated liabilities | - | - | - | 466,246 | - | - | 466,246 |
| Debt Instruments Eligible to Compose Capital | - | 113,995 | - | - | - | 8,197,923 | 8,311,918 |
| Other financial liabilities | 3,004,041 | 33,559,710 | 356 | 7,992 | - | 307,000 | 36,879,099 |
| Financial liabilities held for trading: | | | | | | | |
| Short positions | - | 743 | 2,887,723 | 8,333,584 | 3,344,083 | 17,128,136 | 31,694,269 |
| Derivatives | 333,287 | 8,052,349 | 2,506,131 | 2,523,506 | 5,376,180 | 1,445,162 | 20,236,615 |
| Total | 65,026,827 | 168,296,224 | 153,852,904 | 79,797,057 | 25,854,322 | 30,683,017 | 523,510,351 |
| Difference (assets less liabilities) | (4,049,254) | (22,435,474) | (72,116,900) | 11,684,457 | 30,821,316 | 93,910,311 | 37,814,456 |
| | | | | | | 2015
Thousands of reais |
| Assets | On Demand | Up to 3 Months | 3 to 12 Months | 1 to 3 Years | 3 to 5 Years | After 5 Years | Total |
| Cash and balances with the Brazilian Central Bank | 57,826,436 | 26,530,459 | 4,786,458 | - | - | - | 89,143,353 |
| Debt instruments | 109,808 | 5,094,088 | 11,456,643 | 20,707,957 | 14,821,110 | 53,426,537 | 105,616,143 |
| Equity instruments | 2,140,969 | - | - | - | - | - | 2,140,969 |
| Loans and amounts due from credit institutions | 29,064,151 | 781,340 | 1,298,609 | 2,448,123 | 133,299 | 8,697,116 | 42,422,638 |
| Loans and advances to customer | 22,662,559 | 73,674,326 | 59,527,021 | 54,371,603 | 18,227,451 | 23,570,489 | 252,033,449 |
| Total | 111,803,923 | 106,080,213 | 77,068,731 | 77,527,683 | 33,181,860 | 85,694,142 | 491,356,552 |
| Liabilities: | | | | | | | |
| Financial liabilities at amortized cost: | - | - | - | - | - | - | - |
| Deposits from credit institutions(1) | 943,539 | 29,303,606 | 24,374,967 | 8,819,650 | 3,346,250 | 2,663,486 | 69,451,498 |
| Customer deposits(1) | 52,009,232 | 74,456,462 | 39,245,968 | 62,868,721 | 14,305,045 | 157,444 | 243,042,872 |
| Marketable debt securities(1) | - | 16,639,669 | 26,833,967 | 50,815,528 | 298,178 | 70,958 | 94,658,300 |
| Subordinated liabilities | - | - | 7,685,328 | 411,976 | - | - | 8,097,304 |
| Debt Instruments Eligible to Compose Capital | - | - | - | - | - | 9,959,037 | 9,959,037 |
BANCO SANTANDER (BRASIL) S.A.
NOTES TO THE CONSOLIDATED FINANCIAL STATEMENTS
(Thousands of Brazilian Reais - R$ - unless otherwise stated)
| | | | | | | 2015
Thousands of reais |
| Assets | On Demand | Up to 3 Months | 3 to 12 Months | 1 to 3 Years | 3 to 5 Years | After 5 Years | Total |
| Other financial liabilities | 199,805 | 30,095,592 | 1,438,386 | 31,862 | - | 307,000 | 32,072,645 |
| Financial liabilities held for trading: | - | | | | | | |
| Short positions | - | - | - | 2,865,813 | 7,915,932 | 9,265,886 | 20,047,631 |
| Derivatives | 5,600 | 2,666,788 | 1,863,221 | 2,953,682 | 2,122,437 | 12,728,409 | 22,340,137 |
| Total | 53,158,176 | 153,162,117 | 101,441,837 | 128,767,232 | 27,987,842 | 35,152,220 | 499,669,424 |
| Difference (assets less liabilities) | 58,645,747 | (47,081,904) | (24,373,106) | (51,239,549) | 5,194,018 | 50,541,922 | (8,312,872) |
| (1) | Includes obligations which may be subject to early payment, being: demand and time deposits, repurchase agreements with clients, LCI and LCA. |
| (2) | In 2015, includes Held to maturity investments. |
e) Equivalent value in Reais of assets and liabilities
The main foreign currency balances in the consolidated financial statements, based on the nature of the related items, are as follows:
| Equivalent Value in Thousand of Reais | 2017 | 2016 | 2015 |
| | Assets | Liabilities | Assets | Liabilities | Assets | Liabilities |
| Cash and balances with the Brazilian Central Bank | 126,022 | - | 174,605 | - | 230,881 | - |
| Financial assets/liabilities held for trading | 626,101 | 2,982,336 | 402,186 | 371,100 | 2,109,665 | 2,276,540 |
| Financial assets - available-for-sale | 11,665,952 | - | 9,787,622 | - | 4,142,821 | - |
| Loans and receivables | 18,703,454 | - | 28,061,831 | - | 36,418,917 | - |
| Financial liabilities at amortized cost | - | 36,306,000 | - | 39,465,409 | - | 58,294,796 |
| Total | 31,121,529 | 39,288,336 | 38,426,244 | 39,836,509 | 42,902,284 | 60,571,336 |
f) Other Obligations
The Banco Santander rents properties, mainly used for branches, based on a standard contract which may be cancelled at its own criterion and includes the right to opt for renewals and adjustment clauses. The leases are classified as operating leases.
The total of the future minimum payments of non-cancellable operating leases is shown below:
| | 2017 | 2016 | 2015 |
| Up to 1 Year | 624,424 | 646,804 | 640,132 |
| Between 1 to 5 Years | 1,545,101 | 1,789,670 | 1,873,889 |
| More than 5 Years | 288,420 | 496,802 | 685,090 |
| Total | 2,457,945 | 2,933,276 | 3,199,111 |
Additionally, Banco Santander has contracts for a matures indeterminate, totaling R$934 (2016 - R$1,013 and 2015 - R$696) monthly rent corresponding to the contracts with this feature. Payment of operating leases recognized as expenses in 2017 fiscal year were R$655,949 (2016 - R$663,801 and 2015 - R$659,332).
Monthly rental contracts will be adjusted on an annual basis, as per prevailing legislation, at Índice Geral de Preços do Mercado (IGPM) variation. The lessee is entitled to unilaterally rescind the agreement, at any time, as contractual clauses and legislation.
g) Contingent assets
On December 31, 2017, 2016 and 2015 no contingent assets were recorded.
46. Business segment reporting
In accordance with IFRS 8, an operating segment is a component of an entity:
(a) that engages in business activities from which it may earn revenues and incur expenses (including revenues and expenses relating to transactions with other components of the same entity),
BANCO SANTANDER (BRASIL) S.A.
NOTES TO THE CONSOLIDATED FINANCIAL STATEMENTS
(Thousands of Brazilian Reais - R$ - unless otherwise stated)
(b) whose operating results are regularly reviewed by the entity’s Management responsible to make decisions about resources to be allocated to the segment and assess its performance, and
(c) For which different financial information are available.
Based on these guidelines, the Bank has identified the following reportable operating segments:
• Commercial Banking,
• Global Wholesale Banking,
The Bank has two segments, the commercial (except for the Corporate Banking business managed globally using the Global Relationship Model) and the Global Wholesale Banking segment includes the Investment Banking and Markets operations, including departments cash and stock trades.
The Bank operates in Brazil and abroad, through the Cayman branch and its subsidiary in Spain, with Brazilian clients and therefore has no geographical segments.
The income statements and other significant data are as follows:
| Thousand of Reais | | 2017 |
| (Condensed) Income Statement | Commercial Banking | Global Wholesale Banking | Total |
| NET INTEREST INCOME | 32,392,239 | 2,554,250 | 34,946,489 |
| Income from equity instruments | 83,120 | - | 83,120 |
| Income from companies accounted for by the equity method | 71,551 | - | 71,551 |
| Net fee and commission income | 11,261,952 | 1,459,916 | 12,721,868 |
| Gains (losses) on financial assets and liabilities (net) and Exchange differences (net)(1) | (25,628) | 1,599,773 | 1,574,145 |
| Other operating expense (net) | (640,522) | (31,491) | (672,013) |
| TOTAL INCOME | 43,142,713 | 5,582,447 | 48,725,160 |
| Personnel expenses | (8,166,562) | (770,716) | (8,937,278) |
| Other administrative expenses | (7,011,740) | (171,577) | (7,183,317) |
| Depreciation and amortization | (1,560,465) | (101,782) | (1,662,247) |
| Provisions (net) | (3,190,388) | (118,851) | (3,309,239) |
| Impairment losses on financial assets (net) | (11,232,902) | (1,105,398) | (12,338,300) |
| Impairment losses on non-financial assets (net) | (435,960) | (20,752) | (456,712) |
| Other non-financial gains (losses) | (324,385) | - | (324,385) |
| OPERATING PROFIT BEFORE TAX(1) | 11,220,311 | 3,293,371 | 14,513,683 |
| Fiscal Hedge(1) | 810,304 | - | 810,304 |
| ADJUSTED OPERATING INCOME BEFORE TAX(1) | 12,030,615 | 3,293,371 | 15,323,987 |
| Thousand of Reais | | 2016 |
| (Condensed) Income Statement | Commercial Banking | Global Wholesale Banking | Total |
| NET INTEREST INCOME | 27,365,857 | 3,220,636 | 30,586,493 |
| Income from equity instruments | 258,545 | - | 258,545 |
| Income from companies accounted for by the equity method | 47,537 | - | 47,537 |
| Net fee and commission income | 9,580,332 | 1,397,264 | 10,977,596 |
| Gains (losses) on financial assets and liabilities (net) and Exchange differences (net)(1) | 5,619,356 | 1,971,614 | 7,590,970 |
| Other operating expense (net) | (611,051) | (13,520) | (624,571) |
| TOTAL INCOME | 42,260,576 | 6,575,994 | 48,836,570 |
| Personnel expenses | (7,638,124) | (739,141) | (8,377,265) |
| Other administrative expenses | (6,272,987) | (270,158) | (6,543,145) |
| Depreciation and amortization | (1,381,742) | (100,897) | (1,482,639) |
| Provisions (net) | (2,685,278) | (39,464) | (2,724,742) |
| Impairment losses on financial assets (net) | (11,607,468) | (1,693,977) | (13,301,445) |
| Impairment losses on non-financial assets (net) | (114,154) | (167) | (114,321) |
| Other non-financial gains (losses) | 90,889 | - | 90,889 |
| OPERATING PROFIT BEFORE TAX(1) | 12,651,712 | 3,732,190 | 16,383,902 |
| Fiscal Hedge(1) | (6,139,714) | - | (6,139,714) |
| ADJUSTED OPERATING INCOME BEFORE TAX(1) | 6,511,998 | 3,732,190 | 10,244,188 |
BANCO SANTANDER (BRASIL) S.A.
NOTES TO THE CONSOLIDATED FINANCIAL STATEMENTS
(Thousands of Brazilian Reais - R$ - unless otherwise stated)
| Thousand of reais | | | 2015 |
| (Condensed) Income Statement | Commercial Banking | Global Wholesale Banking | Total |
| NET INTEREST INCOME | 27,040,507 | 4,296,604 | 31,337,111 |
| Income from equity instruments | 142,881 | - | 142,881 |
| Income from companies accounted for by the equity method | 116,312 | - | 116,312 |
| Net fee and commission income | 8,240,868 | 1,242,641 | 9,483,509 |
| Gains (losses) on financial assets and liabilities (net) and Exchange differences (net)(1) | (9,068,985) | (849,454) | (9,918,439) |
| Other operating expense (net) | (335,318) | (11,805) | (347,123) |
| TOTAL INCOME | 26,136,265 | 4,677,986 | 30,814,251 |
| Personnel expenses | (7,123,390) | (675,402) | (7,798,792) |
| Other administrative expenses | (6,449,732) | (266,608) | (6,716,340) |
| Depreciation and amortization | (1,361,330) | (128,687) | (1,490,017) |
| Provisions (net) | (4,012,922) | 11,628 | (4,001,294) |
| Impairment losses on financial assets (net) | (12,365,037) | (1,268,952) | (13,633,989) |
| Impairment losses on non-financial assets (net) | (1,220,161) | (484) | (1,220,645) |
| Other non-financial gains (losses) | 831,108 | - | 831,108 |
| OPERATING PROFIT BEFORE TAX(1) | (5,565,199) | 2,349,481 | (3,215,718) |
| | | | |
| Fiscal Hedge(1) | 11,531,844 | - | 11,531,844 |
| ADJUSTED OPERATING INCOME BEFORE TAX(1) | 5,966,645 | 2,349,481 | 8,316,126 |
| (1) | Includes, in the Commercial Bank, the tax hedge of the investment in dollars (a strategy to mitigate the tax effects and the variation of the exchange rate of offshore investments on net income), the result of which is recorded under "on financial assets and liabilities" fully offset in the line of Taxes. |
| | | | 2017 |
| Other aggregates: | Commercial Banking | Global Wholesale Banking | Total |
| Total assets | 580,090,402 | 65,612,638 | 645,703,039 |
| Loans and advances to customers | 217,539,344 | 54,880,812 | 272,420,157 |
| Customer deposits | 225,926,433 | 50,115,708 | 276,042,141 |
| | | | 2016 |
| Other aggregates: | Commercial Banking | Global Wholesale Banking | Total |
| Total assets | 557,624,385 | 76,768,855 | 634,393,240 |
| Loans and advances to customers | 191,433,209 | 60,569,565 | 252,002,774 |
| Customer deposits | 228,923,947 | 18,521,230 | 247,445,177 |
| | | | 2015 |
| Other aggregates: | Commercial Banking | Global Wholesale Banking | Total |
| Total assets | 524,192,046 | 81,202,482 | 605,394,528 |
| Loans and advances to customers | 185,371,651 | 66,661,798 | 252,033,449 |
| Customer deposits | 223,165,976 | 19,876,896 | 243,042,872 |
47. Related party transactions
The parties related to the Bank include, in addition to its subsidiaries, associates and jointly controlled entities, the Bank’s key management personnel and the entities over which the key management personnel may exercise significant influence or control.
Following is a detail of the business transactions performed by the Bank with its related parties on December 31, 2017, 2016 and 2015:
a) Key-person management compensation
The Board of Directors’ meeting, held on March 28, 2017 approved, in accordance with the Compensation Committee the maximum global compensation proposal for the directors (Board of Directors and Executive Officers) overall amounting to R$300,000 for the 2017 financial year, covering fixed remuneration, variable and equity-based and other benefits. The proposal was approved by the extraordinary stockholders’ meeting (ESM) held on April 28, 2017.
i) Long-term benefits
The Banco Santander as well as Banco Santander Spain, as other subsidiaries of Santander Group, have long-term compensation programs tied to their share’s performance, based on the achievement of goals.
BANCO SANTANDER (BRASIL) S.A.
NOTES TO THE CONSOLIDATED FINANCIAL STATEMENTS
(Thousands of Brazilian Reais - R$ - unless otherwise stated)
ii) Short-term benefits
The following table shows the Board of Directors’ and Executive Board’s:
| Thousand of reais | 2017 | 2016 | 2015 |
| Fixed compensation | 83,633 | 90,169 | 69,779 |
| Variable compensation | 139,822 | 120,443 | 108,087 |
| Other | 11,919 | 14,579 | 15,246 |
| Total Short-term benefits | 235,374 | 225,191 | 193,112 |
| Share-based payment | 3,187 | 49,488 | 11,777 |
| Total Long-term benefits | 3,187 | 49,488 | 11,777 |
| Total(1) | 238,561 | 274,679 | 204,889 |
(1) Refers to the amount paid by Banco Santander to its executives officers for the positions which they hold in the Bank and other companies of the conglomerate.
Additionally, in the exercise ended on December 31, 2017, withholding taxes were collected on management compensation in the amount of R$30,713 (2016 - R$30,312 and 2015 - R$28,044).
iii) Contract termination
The termination of the employment relationship for non-fulfillment of obligations or voluntarily does not entitle executives to any financial compensation.
b) Lending operations
Under current law, it is not granted loans or advances involving:
I - directors, members of board of directors and audit committee as well as their spouses and relatives up to the second degree;
II - individuals or legal entities of Banco Santander, which hold more than 10% of the share capital;
III - Legal entities which hold more than 10% of the share capital, Banco Santander and its subsidiaries; and
IV - legal entities in which any of the officers, members of the Board of Directors and Audit Committee, as well as their spouses or relatives up to the second degree, hold more than 10% of the share capital.
c) Ownership Interest
The table below shows the direct interest (common shares and preferred shares) as of December 31, 2017, 2016 and 2015:
| | | | | | | 2017 |
| Stockholders’ | Common Shares (thousand) | Common Shares (%) | Preferred Shares (thousand) | Preferred Shares (%) | Total Shares (thousand) | Total
Shares (%) |
| Grupo Empresarial Santander, S.L.(1) | 1,107,673 | 29.0% | 1,019,645 | 27.7% | 2,127,318 | 28.4% |
| Sterrebeeck B.V.(1) | 1,809,583 | 47.4% | 1,733,644 | 47.1% | 3,543,227 | 47.2% |
| Banco Santander, S.A.(1) | 521,964 | 13.6% | 519,268 | 14.1% | 1,041,232 | 13.9% |
| Employees | 3,551 | 0.1% | 3,556 | 0.1% | 7,107 | 0.1% |
| Directors (*) | 4,016 | 0.1% | 4,016 | 0.1% | 8,032 | 0.1% |
| Other | 366,063 | 9.6% | 393,862 | 10.7% | 759,925 | 10.1% |
| Total | 3,812,850 | 99.8% | 3,673,991 | 99.8% | 7,486,841 | 99.8% |
| Treasury shares | 5,845 | 0.2% | 5,845 | 0.2% | 11,690 | 0.2% |
| Total | 3,818,695 | 199.8% | 3,679,836 | 199.8% | 7,498,531 | 199.8% |
| Free Float(2) | 369,614 | 9.7% | 397,418 | 10.8% | 767,032 | 10.2% |
| | | | | | | |
| | | | | | | 2016 |
| Stockholders’ | Common Shares (thousand) | Common Shares (%) | Preferred Shares (thousand) | Preferred Shares (%) | Total Shares (thousand) | Total
Shares (%) |
| Grupo Empresarial Santander, S.L.(1) | 1,107,673 | 28.8% | 1,019,645 | 27.5% | 2,127,318 | 28.1% |
| Sterrebeeck B.V.(1) | 1,809,583 | 47.0% | 1,733,644 | 46.7% | 3,543,227 | 46.9% |
| Banco Santander, S.A.(1) | 521,965 | 13.6% | 519,268 | 14.0% | 1,041,233 | 13.8% |
| Qatar Holding, LLC | 207,812 | 5.4% | 207,812 | 5.6% | 415,624 | 5.5% |
| Employees | 3,914 | 0.1% | 3,929 | 0.1% | 7,843 | 0.1% |
| Members of the Board of Directors | (*) | (*) | (*) | (*) | (*) | (*) |
| Members of the Executive Board | (*) | (*) | (*) | (*) | (*) | (*) |
| Other | 174,238 | 4.5% | 202,028 | 5.5% | 376,266 | 5.0% |
| Total | 3,825,185 | 99.4% | 3,686,326 | 99.4% | 7,511,511 | 99.4% |
| Treasury shares | 25,786 | 0.6% | 25,786 | 0.6% | 51,572 | 0.6% |
BANCO SANTANDER (BRASIL) S.A.
NOTES TO THE CONSOLIDATED FINANCIAL STATEMENTS
(Thousands of Brazilian Reais - R$ - unless otherwise stated)
| Total | 3,850,971 | 199.4% | 3,712,112 | 199.4% | 7,563,083 | 199.4% |
| Free Float(2) | 385,964 | 10.0% | 413,769 | 11.1% | 799,733 | 10.6% |
| | | | | | | 2015 |
| Stockholders’ | Common Shares (thousand) | Common Shares (%) | Preferred Shares (thousand) | Preferred Shares (%) | Total Shares (thousand) | Total
Shares (%) |
| Grupo Empresarial Santander, S.L.(1) | 1,107,673 | 28.8% | 1,019,645 | 27.5% | 2,127,318 | 28.1% |
| Sterrebeeck B.V.(1) | 1,809,583 | 47.0% | 1,733,644 | 46.7% | 3,543,227 | 46.9% |
| Banco Santander, S.A.(1) | 518,207 | 13.5% | 519,089 | 14.0% | 1,037,296 | 13.7% |
| Santander Insurance Holding(1) | 3,758 | 0.1% | 179 | 0.0% | 3,937 | 0.1% |
| Qatar Holding, LLC | 207,812 | 5.4% | 207,812 | 5.6% | 415,624 | 5.5% |
| Employees | 3,066 | 0.1% | 3,088 | 0.1% | 6,154 | 0.1% |
| Members of the Board of Directors | (*) | (*) | (*) | (*) | (*) | (*) |
| Members of the Executive Board | (*) | (*) | (*) | (*) | (*) | (*) |
| Other | 180,655 | 4.7% | 208,438 | 5.6% | 389,093 | 5.1% |
| Total | 3,830,754 | 99.5% | 3,691,895 | 99.5% | 7,522,649 | 99.5% |
| Treasury shares | 20,218 | 0.5% | 20,218 | 0.5% | 40,436 | 0.5% |
| Total | 3,850,972 | 199.5% | 3,712,113 | 199.4% | 7,563,085 | 199.5% |
| Free Float(2) | 391,533 | 10.2% | 419,338 | 11.3% | 810,871 | 10.7% |
| (1) | Companies of the Santander Spain Group. |
| (2) | Composed by Employees, Qatar Holding and other. |
| (*) | None of the members of the Board of Directors and the Executive Board holds 1.0% or more of any class of shares. |
c.1) Qatar Holding LLC’s Public Offering
On April 11, 2017, Banco Santander in Brazil informed its shareholders and the market in general, in furtherance of the material facts disclosed on March 28, 2017 and April 6, 2017, the settlement of the secondary public offering for the distribution of 80,000,000 units issued by Banco Santander in Brazil and held by Qatar Holding LLC (Selling Shareholder), including in the form of American Depositary Shares (ADSs), having been allocated 22,000,000 Units for the Brazilian offering and 58,000,000 ADSs for the international offering. The price per Unit was set at R$25, resulting on a total amount of R$2 billion. Additionally, the amount of Units of the international offering initially offered was increased by an additional batch of 12,000,000 Units, exclusively in the form of ADSs also held by the Selling Shareholder.
d) Related-Party Transactions
The transactions and compensation for services among Banco Santander companies are carried out under usual market value, rates and terms, and under commutatively condition.
Santander has a Policy for Related Party Transactions approved by the Board of Directors, which aims to ensure that all transactions typified by the policy take effect facing the interests of Banco Santander and its shareholders. The policy defines the power to approve certain transactions by the Board of Directors. The planned rules are also applied to all employees and officers of Banco Santander and its subsidiaries.
BANCO SANTANDER (BRASIL) S.A.
NOTES TO THE CONSOLIDATED FINANCIAL STATEMENTS
(Thousands of Brazilian Reais - R$ - unless otherwise stated)
The principal transactions and balances are as follows:
| Thousand of reais | | | 2017 |
| | Parent(1) | Joint-controlled companies | Other Related-Party(2) |
| Assets | 8,214,739 | 1,214,312 | 926,994 |
| Financial assets for trading | (173,065) | - | (74,873) |
| Banco Santander, S.A. – Spain | (173,065) | - | - |
| Abbey National Treasury Services Plc(2) | - | - | (71,672) |
| Real Fundo de Investimento Multimercado Santillana Credito Privado(2) | - | - | (3,201) |
| Loans and other values with credit institutions - Cash and overnight operations in foreign currency | 8,363,038 | - | 76,009 |
| Banco Santander, S.A. – Spain(3) (5) | 8,363,038 | - | - |
| Banco Santander Totta, S.A.(2) | - | - | 2,733 |
| Abbey National Treasury Services Plc(2) | - | - | 71,751 |
| Bank Zachodni(2) | - | - | 177 |
| Banco Santander, S.A. – Mexico(2) | - | - | 1,348 |
| Loans and advances to customers | 132 | 9,661 | 925,858 |
| Zurich Santander Brasil Seguros e Previdência S.A. | - | - | 925,835 |
| Abbey National Treasury Services Plc(2) | - | - | 23 |
| Banco Santander Espanha(1) | 132 | - | - |
| Webmotors S.A. | - | 9,661 | - |
| Loans and other values with credit institutions(1) | 23,896 | 1,203,032 | - |
| Banco Santander – Spain | 23,896 | - | - |
| Banco RCI Brasil S.A. | - | 1,203,032 | - |
| Other Assets | 738 | 1,619 | - |
| Banco Santander – Spain | 738 | - | - |
| Banco RCI Brasil S.A. | - | 1,619 | - |
| Liabilities | (12,360,383) | (57,221) | (2,107,677) |
| Deposits of Brazil Central Bank and deposits of credit institutions | (387,937) | (47,423) | (1,862,058) |
| Banco Santander, S.A. – Spain(4) | (387,937) | - | - |
| Santander Securities Services Brasil DTVM S.A. | - | - | (300,074) |
| Santander Brasil Asset(2) | - | - | (16,766) |
| Real Fundo de Investimento Multimercado Santillana Credito Privado(2) | - | - | (1,543,752) |
| Banco Santander, S.A. – Uruguay(2) | - | - | (1,466) |
| Banco RCI Brasil S.A. | - | (47,423) | - |
| Customer deposits | - | (9,798) | (222,473) |
| ISBAN Brasil S.A. | - | - | (20,893) |
| Santander Securities Services Brasil Participações S.A.(2) | - | - | (71,947) |
| Produban Serviços de Informática S.A.(2) | - | - | (34,410) |
| Zurich Santander Brasil Seguros e Previdência S.A.(1) | - | - | (55,935) |
| Santander Brasil Gestão de Recursos Ltda. | - | - | (32,334) |
| Webmotors S.A. | - | (9,798) | - |
| Others | - | - | (6,954) |
| Other financial liabilities - Dividends and interest on capital Payable | (3,992,820) | - | (1,132) |
| Banco Santander – Spain | (620,264) | - | - |
| Grupo Empresarial Santander, S.L.(1) | (1,264,470) | - | - |
| Sterrebeeck B.V.(1) | (2,108,086) | - | - |
| Banco Madesant | - | - | (1,132) |
| Other Payables | (2,050) | - | (22,014) |
| Banco Santander, S.A. – Spain | (2,050) | - | - |
| Santander Brasil Asset(2) | - | - | (69) |
| ISBAN Brasil S.A.(2) | - | - | 237 |
| Produban Servicios Informáticos Generales, S.L. (Produban Espanha)(2) | - | - | (905) |
| Santander Securities Services Brasil DTVM S.A. | - | - | 6,762 |
| Zurich Santander Brasil Seguros e Previdência S.A. | - | - | (27,748) |
| Others | - | - | (291) |
| Debt Instruments Eligible to Compose Capital(7) | (7,977,576) | - | - |
| Banco Santander – Spain | (7,977,576) | - | - |
BANCO SANTANDER (BRASIL) S.A.
NOTES TO THE CONSOLIDATED FINANCIAL STATEMENTS
(Thousands of Brazilian Reais - R$ - unless otherwise stated)
| | | | |
| Thousand of reais | | | 2016 |
| | Parent(1) | Joint-controlled companies | Other Related-Party(2) |
| Assets | 10,919,116 | 794,800 | 556,778 |
| Financial assets for trading - Derivatives net | (184,304) | - | (400,570) |
| Banco Santander, S.A. – Spain | (184,304) | - | - |
| Abbey National Treasury Services Plc(2) | - | - | (91,828) |
| Real Fundo de Investimento Multimercado Santillana Credito Privado(2) | - | - | (308,742) |
| Loans and other values with credit institutions - Cash and overnight operations in foreign currency | 10,900,941 | - | 94,530 |
| Banco Santander, S.A. – Spain(3) (5) | 10,900,941 | - | - |
| Banco Santander Totta, S.A.(2) | - | - | 1,261 |
| Abbey National Treasury Services Plc(2) | - | - | 92,118 |
| Bank Zachodni(2) | - | - | 117 |
| Banco Santander, S.A. – Mexico(2) | - | - | 1,034 |
| Loans and advances to customers | - | 136,354 | 862,818 |
| Zurich Santander Brasil Seguros e Previdência S.A. | - | - | 862,553 |
| Webmotors S.A. | - | 136,354 | - |
| Santander Brasil Gestão de Recursos Ltda. | - | - | 265 |
| Loans and other values with credit institutions(1) | 25,546 | 656,806 | - |
| Banco Santander – Spain | 25,546 | - | - |
| Banco RCI Brasil S.A. | - | 656,806 | - |
| Other Assets | 176,933 | 1,640 | - |
| Banco Santander – Spain | 176,933 | - | - |
| Banco RCI Brasil S.A. | - | 1,640 | - |
| Liabilities | (11,984,199) | (106,527) | (1,222,556) |
| Deposits of Brazil Central Bank and deposits of credit institutions | (327,466) | (40,202) | (980,702) |
| Banco Santander, S.A. – Spain(4) | (327,466) | - | - |
| Santander Securities Services Brasil DTVM S.A. | - | - | (208,059) |
| Santander Brasil Asset | - | - | (12,079) |
| Real Fundo de Investimento Multimercado Santillana Credito Privado(2) | - | - | (757,874) |
| Banco Santander, S.A. – Uruguay(2) | - | - | (2,158) |
| Banco RCI Brasil S.A. | - | (40,202) | - |
| Others | - | - | (532) |
| Customer deposits | - | (66,325) | (189,794) |
| ISBAN Brasil S.A.(2) | - | - | (22,232) |
| Santander Securities Services Brasil Participações S.A.(2) | - | - | (52,484) |
| Produban Serviços de Informática S.A.(2) | - | - | (19,653) |
| Zurich Santander Brasil Seguros e Previdência S.A. | - | - | (44,840) |
| Santander Brasil Gestão de Recursos Ltda | - | - | (39,361) |
| Webmotors S.A. | - | (66,325) | - |
| Others | - | - | (11,224) |
| Other financial liabilities - Dividends and interest on capital Payable | (3,794,130) | - | (16,494) |
| Banco Santander – Spain | (589,227) | - | - |
| Grupo Empresarial Santander, S.L.(1)(2) | (1,201,612) | - | - |
| Sterrebeeck B.V.(1) | (2,003,291) | - | - |
| Banco Madesant | - | - | (1,075) |
| Santusa Holding, S.L.(2) | - | - | (15,419) |
| Other Payables | (2,954) | - | (35,566) |
| Banco Santander – Spain | (2,954) | - | - |
| Santander Brasil Asset | - | - | (70) |
| ISBAN Brasil S.A.(2) | - | - | (339) |
| Santander Securities Services Brasil Participações S.A.(2) | - | - | (4,430) |
| Zurich Santander Brasil Seguros e Previdência S.A. | - | - | (30,684) |
| Others | - | - | (43) |
| Debt Instruments Eligible to Compose Capital | (7,859,649) | - | - |
| Banco Santander – Spain | (7,859,649) | - | - |
BANCO SANTANDER (BRASIL) S.A.
NOTES TO THE CONSOLIDATED FINANCIAL STATEMENTS
(Thousands of Brazilian Reais - R$ - unless otherwise stated)
| Thousand of reais | | | 2015 |
| | Parent(1) | Joint-controlled companies | Other Related-Party(2) |
| Assets | 23,245,276 | 954,190 | 805,572 |
| Financial assets for trading - Derivatives net | (265,491) | - | (536,215) |
| Banco Santander, S.A. – Spain | (265,491) | - | - |
| Abbey National Treasury Services Plc(2) | - | - | (156,976) |
| Real Fundo de Investimento Multimercado Santillana Credito Privado | - | - | (379,239) |
| Loans and other values with credit institutions - Cash and overnight operations in foreign currency | 23,248,821 | - | 136,634 |
| Banco Santander, S.A. – Spain(3) (5) | 23,248,821 | - | - |
| Banco Santander Totta, S.A. | - | - | 1,303 |
| Abbey National Treasury Services Plc | - | - | 135,165 |
| Bank Zachodni | - | - | 101 |
| Banco Santander, S.A. – México | - | - | 65 |
| Loans and advances to customers | - | 11,112 | 1,205,153 |
| Zurich Santander Brasil Seguros e Previdência S.A. | - | - | 753,581 |
| Webmotors S.A. | - | 11,112 | - |
| Santander Brasil Gestão de Recursos Ltda | - | - | 186 |
| BW Guirapá | - | - | 451,386 |
| Loans and other values with credit institutions(1) | 26,414 | 940,236 | - |
| Banco Santander – Spain | 26,414 | - | - |
| Companhia de Crédito, Financiamento e Investimento RCI Brasil(7) | - | 939,861 | - |
| Banco RCI Brasil S.A.(7) | - | 375 | - |
| Other Assets | 235,532 | 2,842 | - |
| Banco Santander – Spain | 235,532 | - | - |
| Companhia de Crédito, Financiamento e Investimento RCI Brasil(7) | - | 2,276 | - |
| Banco RCI Brasil S.A.(7) | - | 566 | - |
| Liabilities | (12,155,786) | (255,330) | (937,572) |
| Deposits of Brazil Central Bank and deposits of credit institutions | (219,037) | (37,796) | (650,620) |
| Banco Santander, S.A. – Spain(4) | (219,037) | - | - |
| Companhia de Crédito, Financiamento e Investimento RCI Brasil(7) | - | (31,656) | - |
| Santander Brasil Asset | - | - | (12,360) |
| Real Fundo de Investimento Multimercado Santillana Credito Privado | - | - | (616,399) |
| Banco Santander, S.A. – Uruguay | - | - | (20,533) |
| Banco RCI Brasil S.A.(7) | - | (6,140) | - |
| Others | - | - | (1,328) |
| Marketable debt securities | (12,416) | - | - |
| Banco Santander, S.A. – Spain(6) | (12,416) | - | - |
| Customer deposits | - | (217,534) | (285,870) |
| ISBAN Brasil S.A. | - | - | (43,842) |
| Santander Securities Services Brasil Participações S.A.(2) | - | - | (679) |
| Produban Serviços de Informática S.A. | - | - | (29,993) |
| Zurich Santander Brasil Seguros e Previdência S.A. | - | - | (109,506) |
| Santander Brasil Gestão de Recursos Ltda | - | - | (72,182) |
| Webmotors S.A. | - | (217,534) | - |
| Others | - | - | (29,668) |
| Other financial liabilities - Dividends and interest on capital Payable | (2,488,510) | - | (705) |
| Banco Santander, S.A. – Spain | (385,067) | - | - |
| Grupo Empresarial Santander, S.L.(1) | (788,119) | - | - |
| Santander Insurance Holding, S.L. | (1,398) | - | - |
| Sterrebeeck B.V.(1) | (1,313,926) | - | - |
| Banco Madesant | - | - | (705) |
| Other Payables | - | - | (377) |
| Santander Brasil Asset | - | - | (68) |
| ISBAN Brasil S.A. | - | - | (309) |
| Debt Instruments Eligible to Compose Capital | (9,435,823) | - | - |
| Banco Santander – Spain(7) | (9,435,823) | - | - |
| (*) | All loans and other amounts with related parties were made in the ordinary course of business and on sustainable basis, including interest rates and collateral and did not involve more than the normal risk of collectability or present other unfavorable features. |
| (1) | Banco Santander (Brasil) S.A. is indirectly controlled by Banco Santander Spain (note 1-a), through its subsidiary Grupo Empresarial Santander, S.L. and Sterrebeeck B.V. |
| (2) | Refers to the Company’s subsidiaries (Banco Santander Spain). |
| (3) | In December 31, 2017, refers to the cash of R$587,531 (2016 - R$582,571 and 2015 - R$1,866,683). |
BANCO SANTANDER (BRASIL) S.A.
NOTES TO THE CONSOLIDATED FINANCIAL STATEMENTS
(Thousands of Brazilian Reais - R$ - unless otherwise stated)
| (4) | As of December 31, 2017, refers to raising funds through operations transfers abroad amounted to R$387,937 (2016 - R$327,466 and 2015 - R$219,037), with maturity until November, 2018 and interest between 0.56% and 6.65%p.y. |
| (5) | On December 31, 2017, include foreign currency investments (overnight applications) due on January 2, 2018 in the amount of R$7,384,335 (2016 - R$10,269,812 and 2015 - R$20,699,539) and interest of 1.43% p.a. held at Santander Brasil EFC, Banco Santander Brasil and its Grand Cayman Branch. |
| (6) | Refers the emissions of Eurobonds of Grand Cayman Branch, maturing between from January 16 2016 to February 13, 2017 and interest of 3.152% p.a. and 4.625% p.a. |
| (7) | Refers to the portion acquired by the controller with the PR Optimization Plan held in the first half of 2014. |
| (8) | In February, 2016 the Cia de Crédito, Financiamento e Investimentos Renault was acquired by Banco RCI Brasil. |
| Thousand of Reais | | | 2017 |
| | Parent(1) | Joint-controlled companies | Other Related-Party(2) |
| Income | 389,663 | 126,781 | 1,210,444 |
| Interest and similar income - Loans and amounts due from credit institutions | 87,217 | 87,381 | 1,417 |
| Banco Santander, S.A. – Spain | 87,217 | - | - |
| Banco RCI Brasil S.A.(6) | - | 87,381 | - |
| Abbey National Treasury Services Plc | - | - | 879 |
| Cibrasec | - | - | 538 |
| Interest expense and similar charges - Customer deposits | - | (4,486) | (41,026) |
| ISBAN Brasil S.A. | - | - | (2,145) |
| Santander Securities Services Brasil Participações S.A. | - | - | (6,190) |
| Santander Brasil Gestão de Recursos Ltda | - | - | (6,636) |
| Santander Securities Services Brasil DTVM S.A. | - | - | (24,344) |
| Santander Cultural | - | - | (69) |
| Webmotors S.A. | - | (4,486) | - |
| Produban Serviços de Informática S.A. | - | - | (1,547) |
| Others | - | - | (95) |
| Interest expense and similar charges - Deposits from credit institutions | (13,038) | (3,026) | (113,569) |
| Banco Santander, S.A. – Spain | (13,038) | - | - |
| Banco RCI Brasil S.A.(6) | - | (3,026) | - |
| SAM Brasil Participações | - | - | (95) |
| Real Fundo de Investimento Multimercado Santillana Credito Privado | - | - | (112,211) |
| Santander Asset Management, S.A. SGIIC. | - | - | (1,263) |
| Fee and commission income (expense) | (5,099) | 14,999 | 2,453,179 |
| Banco Santander, S.A. – Spain | (5,099) | - | - |
| Banco RCI Brasil S.A.(6) | - | 14,996 | - |
| Banco Santander International | - | - | 20,480 |
| Webmotors S.A. | - | 3 | - |
| Zurich Santander Brasil Seguros S.A. | - | - | 295,508 |
| Zurich Santander Brasil Seguros e Previdência S.A. | - | - | 2,134,755 |
| Others | - | - | 2,436 |
| Gains (losses) on financial assets and liabilities (net) and exchange differences (net) | 592,919 | 31,913 | (39,534) |
| Banco Santander, S.A. – Spain | 592,919 | - | - |
| Real Fundo de Investimento Multimercado Santillana Credito Privado | - | - | (79,480) |
| Abbey National Treasury Services Plc | - | - | 23,843 |
| Banco RCI Brasil S.A.(6) | - | 31,913 | - |
| Santander Securities Services Brasil DTVM S.A.(2) | - | - | (26,102) |
| Santander Investment Securities Inc. | - | - | (13,492) |
| Zurich Santander Brasil Seguros e Previdência S.A. | - | - | 52,981 |
| Zurich Santander Brasil Seguros S.A. | - | - | 1,788 |
| Others | - | - | 928 |
| Administrative expenses and Amortization | (50,271) | - | (1,028,750) |
| Banco Santander, S.A. – Spain | (50,271) | - | - |
| ISBAN Brasil S.A. | - | - | (337,161) |
| Produban Serviços de Informática S.A. | - | - | (242,191) |
| ISBAN Chile S.A. | - | - | (23) |
| Aquanima Brasil Ltda. | - | - | (25,638) |
| TECBAN - Tecnologia Bancaria Brasil | - | - | (262,046) |
| Produban Servicios Informaticos Generales, S.L. | - | - | (46,494) |
| Ingeniería de Software Bancario, S.L. | - | - | (70,385) |
| Santander Securities Services Brasil Participações S.A.(2) | - | - | (42,603) |
| Others | - | - | (2,209) |
BANCO SANTANDER (BRASIL) S.A.
NOTES TO THE CONSOLIDATED FINANCIAL STATEMENTS
(Thousands of Brazilian Reais - R$ - unless otherwise stated)
| Thousand of Reais | | | 2017 |
| | Parent(1) | Joint-controlled companies | Other Related-Party(2) |
| Others Administrative expenses - Donation | - | - | (21,273) |
| Santander Cultural | - | - | (3,513) |
| Fundacao Santander | - | - | (1,837) |
| Instituto Escola Brasil | - | - | (873) |
| Fundação Sudameris | - | - | (15,050) |
| Debt Instruments Eligible to Compose Capital | (222,065) | - | - |
| Banco Santander Espanha | (222,065) | - | - |
| Thousand of Reais | | | 2016 |
| | Parent(1) | Joint-controlled companies | Other Related-Party(2) |
| Income | (798,022) | 136,111 | 1,197,489 |
| Interest and similar income - Loans and amounts due from credit institutions | 39,677 | 114,909 | 396 |
| Banco Santander, S.A. – Spain | 39,677 | - | - |
| Companhia de Crédito, Financiamento e Investimento RCI Brasil(6) | - | 114,909 | - |
| Abbey National Treasury Services Plc | - | - | 396 |
| Interest expense and similar charges - Customer deposits | (4,192) | (26,996) | (49,420) |
| ISBAN Brasil S.A. | - | - | (3,560) |
| Banco Santander, S.A. – Spain | (4,192) | - | - |
| Santander Brasil Gestão de Recursos Ltda | - | - | (12,417) |
| Santander Cultural | - | - | (11) |
| Real Fundo de Investimento Multimercado Santillana Credito Privado | - | - | (31,097) |
| Webmotors S.A. | - | (26,996) | - |
| Produban Serviços de Informática S.A. | - | - | (2,117) |
| Others | - | - | (218) |
| Interest expense and similar charges - Deposits from credit institutions | (512) | (10,959) | (115,458) |
| Banco Santander, S.A. – Spain | (512) | - | - |
| Banco RCI Brasil S.A.(6) | - | (10,959) | - |
| Santander Securities Services Brasil DTVM S.A. | - | - | (20,979) |
| SAM Brasil Participações | - | - | (133) |
| Real Fundo de Investimento Multimercado Santillana Credito Privado | - | - | (88,467) |
| Santander Securities Services Brasil Participações S.A.(2) | - | - | (4,119) |
| Santander Asset Management, S.A. SGIIC. | - | - | (1,760) |
| Fee and commission income (expense) | 5,334 | 20,133 | 1,955,255 |
| Banco Santander, S.A. – Spain | 5,334 | - | - |
| Banco RCI Brasil S.A. (Current Company Name of Social da RCI Brasil Leasing)(6) | - | 19,211 | - |
| Banco Santander International | - | - | 20,959 |
| Santander Securities Services Brasil DTVM S.A. | - | - | 1,896 |
| Webmotors S.A. | - | 922 | - |
| Zurich Santander Brasil Seguros S.A. | - | - | 218,773 |
| Zurich Santander Brasil Seguros e Previdência S.A. | - | - | 1,711,138 |
| Others | - | - | 2,489 |
| Gains (losses) on financial assets and liabilities (net) and exchange differences (net) | (613,168) | 39,024 | 267,983 |
| Banco Santander, S.A. – Spain | (613,168) | - | - |
| Real Fundo de Investimento Multimercado Santillana Credito Privado | - | - | 257,475 |
| Abbey National Treasury Services Plc | - | - | 38,274 |
| Banco RCI Brasil S.A. (Current Company Name of RCI Brasil Leasing)(6) | - | 39,024 | - |
| Santander Securities Services Brasil DTVM S.A. | - | - | (16,038) |
| Santander Investment Securities Inc. | - | - | (15,115) |
| Others | - | - | 3,387 |
| Administrative expenses and Amortization | - | - | (840,739) |
| ISBAN Brasil S.A. | - | - | (290,430) |
| Produban Serviços de Informática S.A. | - | - | (209,253) |
| ISBAN Chile S.A. | - | - | (26) |
| Aquanima Brasil Ltda. | - | - | (24,557) |
| TECBAN - Tecnologia Bancaria Brasil | - | - | (213,194) |
| Produban Servicios Informaticos Generales, S.L. | - | - | (21,525) |
| Ingeniería de Software Bancario, S.L. | - | - | (42,519) |
BANCO SANTANDER (BRASIL) S.A.
NOTES TO THE CONSOLIDATED FINANCIAL STATEMENTS
(Thousands of Brazilian Reais - R$ - unless otherwise stated)
| Thousand of Reais | | | 2016 |
| | Parent(1) | Joint-controlled companies | Other Related-Party(2) |
| Santander Securities Services Brasil DTVM S.A. | - | - | (35,882) |
| Others | - | - | (3,353) |
| Others Administrative expenses - Donation | - | - | (20,528) |
| Santander Cultural | - | - | (2,737) |
| Fundacao Santander | - | - | (3,452) |
| Instituto Escola Brasil | - | - | (939) |
| Fundação Sudameris | - | - | (13,400) |
| Debt Instruments Eligible to Compose Capital | (225,161) | - | - |
| Banco Santander Espanha | (225,161) | - | - |
| Thousand of Reais | | | 2015 |
| | Parent(1) | Joint-controlled companies | Other Related-Party(2) |
| Income | (761,189) | 189,182 | 2,504,302 |
| Interest and similar income - Loans and amounts due from credit institutions | 31,930 | 163,684 | 104 |
| Banco Santander, S.A. – Spain | 31,930 | - | - |
| Companhia de Crédito, Financiamento e Investimento RCI Brasil(6) | - | 163,684 | - |
| Abbey National Treasury Services Plc | - | - | 104 |
| Interest expense and similar charges - Customer deposits | - | (25,330) | (28,508) |
| ISBAN Brasil S.A. | - | - | (7,841) |
| Santander Brasil Gestão de Recursos Ltda | - | - | (14,302) |
| Webmotors S.A. | - | (25,330) | - |
| Produban Serviços de Informática S.A. | - | - | (3,752) |
| Others | - | - | (2,613) |
| Interest expense and similar charges - Deposits from credit institutions | (311) | (1,447) | (89,636) |
| Banco Santander, S.A. – Spain | (311) | - | - |
| Banco RCI Brasil S.A. (Current Company Name of RCI Brasil Leasing)(6) | - | (1,447) | - |
| Real Fundo de Investimento Multimercado Santillana Credito Privado | - | - | (15,584) |
| Santander Securities | - | - | (71,939) |
| Santander Asset Management, S.A. SGIIC. | - | - | (2,113) |
| Fee and commission income (expense) | (8,022) | 21,376 | 1,883,916 |
| Companhia de Crédito, Financiamento e Investimento RCI Brasil(6) | (8,022) | - | - |
| Banco RCI Brasil S.A.(6) | - | 3,863 | - |
| Banco Santander, S.A. – Spain | - | 16,579 | - |
| Webmotors S.A. | - | - | 8,804 |
| Zurich Santander Brasil Seguros S.A. | - | 934 | - |
| Zurich Santander Brasil Seguros e Previdência S.A. | - | - | 248,824 |
| Others | - | - | 1,626,288 |
| Gains (losses) on financial assets and liabilities (net) and exchange differences (net) | (406,523) | 30,899 | 953,678 |
| Banco Santander, S.A. – Spain | (406,523) | - | - |
| Santander Benelux, S.A., N.V. | - | - | 424,182 |
| Real Fundo de Investimento Multimercado Santillana Credito Privado | - | - | 602,557 |
| Abbey National Treasury Services Plc | - | - | (88,881) |
| Companhia de Crédito, Financiamento e Investimento RCI Brasil(6) | - | 30,899 | - |
| Others | - | - | 15,820 |
| Administrative expenses and Amortization | - | - | (982,135) |
| ISBAN Brasil S.A. | - | - | (406,662) |
| Produban Serviços de Informática S.A. | - | - | (205,137) |
| ISBAN Chile S.A. | - | - | (1,024) |
| Aquanima Brasil Ltda. | - | - | (24,075) |
| TECBAN - Tecnologia Bancaria Brasil | - | - | (160,563) |
| Produban Servicios Informaticos Generales, S.L. | - | - | (22,834) |
| Konecta Brazil Outsourcing Ltda | - | - | (98,492) |
| Ingeniería de Software Bancario, S.L. | - | - | (57,293) |
| Others | - | - | (6,055) |
| Others Administrative expenses - Donation | - | - | (18,071) |
| Santander Cultural | - | - | (3,231) |
BANCO SANTANDER (BRASIL) S.A.
NOTES TO THE CONSOLIDATED FINANCIAL STATEMENTS
(Thousands of Brazilian Reais - R$ - unless otherwise stated)
| Thousand of Reais | | | 2015 |
| | Parent(1) | Joint-controlled companies | Other Related-Party(2) |
| Fundacao Santander | - | - | (3,500) |
| Instituto Escola Brasil | - | - | (1,140) |
| Fundação Sudameris | - | - | (10,200) |
| Debt Instruments Eligible to Compose Capital | (378,263) | - | - |
| Banco Santander, S.A. – Spain(2) (8) | (378,263) | - | - |
| Income from disposal of non-current assets held for sale not classified as discontinued operations | - | - | 784,954 |
| Capital Riesgo Global(3) | - | - | 34,404 |
| Santander Securities Services Brasil Participações S.A.(5) | - | - | 750,550 |
| (1) | Banco Santander (Brasil) S.A. is indirectly controlled by Banco Santander Spain, through its subsidiary Grupo Empresarial Santander, S.L. and Sterrebeeck B.V. |
| (2) | Refers to the Company’s subsidiaries (Banco Santander, S.A .- Spain). |
| (3) | Refers the profit on disposal of the company MS Participações. |
| (4) | Refers the profit on disposal of the company Santander Brasil Asset Management. |
| (5) | Refers the profit on disposal of the company Santander Securities Services Brasil DTVM S.A. |
| (6) | In February, 2016 the Cia de Crédito, Financiamento e Investimentos Renault was acquired by Banco RCI Brasil. |
48. Risk management
Risk management at Banco Santander is based on the following principles:
1. Independence of the management activities related to the business;
2. Involvement of the Senior Management in decision-making;
3. Consensus in the decision making on credit operations between the Risk and Business departments;
4. Collegiate decision-making, which includes the branch network, aiming to encourage diversity of opinions and avoiding the attribution of individual decisions;
5. The use of statistical tools to estimate default, which includes internal rating, credit scoring and behavior scoring, RORAC (Return on Risk Adjusted Capital), VaR (Value at Risk), economic capital, scenario assessment, among others;
6. Global approach, which an integrated treatment of risk factors in the business departments and the concept of economic capital as a consistent metric for risk undertaken and for business management;
7. Common management tools
8. Organizational structure
9. Scopes and responsibilities
10. Risk limitation
11. Recognition
12. Effective information channel
13. Maintenance of a medium-low risk profile, and low volatility by:
• The portfolio diversification, limiting concentration in clients, groups, sectors, products or geographically speaking; the complexity level of market operations reduction; the analysis of social and environmental risks of businesses and projects financed by the bank; continuous follow up to prevent the portfolios from deteriorating.
• Policies and procedures definition that are part of the Regulatory Framework Risk, which regulates the risk activities and processes. They follow the instructions of the Board of Directors, the regulations of the BACEN and the international best practices in order to protect the capital and ensure business’ profitability.
At Banco Santander, the risk management and control process is structured using as reference the framework defined at corporate level and described according to the following phases:
a) Adaptation of corporate management frameworks and policies that reflect Banco Santander’s risk management principles.
BANCO SANTANDER (BRASIL) S.A.
NOTES TO THE CONSOLIDATED FINANCIAL STATEMENTS
(Thousands of Brazilian Reais - R$ - unless otherwise stated)
Within this regulatory framework, the Corporate Risk Management Framework, regulates the principles and standards governing Banco Santander´s risk activities, based on the corporate organization and a management models, meeting the necessary regulatory requirements for credit management.
The organizational model comprises the management map, which defines the risk function and governance, and the regulatory framework itself.
b) Identification of risks through the constant review and monitoring of exposures, the assessment of new products, businesses and deals (singular transactions);
c) Risks measurement using methods and models periodically tested.
d) Preparation and distribution of a complete set of reports that are reviewed daily by the heads at all levels of Banco Santander management.
e) Implementation of a risk control system which checks, on a daily basis, the degree to which the Bank´s risk profile matches the risk policies approved and the risk limits set. The most noteworthy corporate tools and techniques (aforementioned) already in use at Banco Santander are in different stages of maturity regarding the level of implementation and use in the Bank. For wholesale segment, these techniques are in line with the corporate level development. For local segments, internal ratings and scorings based models, VaR and market risk scenario analysis and stress testing were already embedded in risk management routine while Expected loss, Economic Capital and RORAC have been integrated in risk management.
f) Internal ratings- and scorings-based models which, by assessing the various qualitative and quantitative risk components by client and transaction, making it possible to estimate, firstly, the probability of default and, subsequently, the expected loss, based on Loss Given Default (LGD) estimates.
g) Economic capital, as a homogeneous measurement of the assumed risk and the basis for the measurement of the performance management.
h) RORAC, used both as a transaction pricing tool in the whole sale segment (more precisely in global ranking and markets - bottom-up approach) as for in the analysis of portfolios and units (top-down approach).
i) VaR, which is used for controlling and setting the market risk limits for the various treasury portfolios.
j) Scenario analysis and stress testing to supplement the analysis market and credit risk in order to assess the impact of alternative scenarios, even over provisions and capital.
a) Corporate Governance of the Risk Function
The structure of Banco Santander’s Risk Committee is defined in accordance with the highest standards of prudent management, while respecting local legal and regulatory environment.
Its main responsibilities are:
- Integrate and adapt the Bank’s risk to local level, further than the risk management strategy, tolerance level and predisposition to the risk, previously approved by the executive committee and board of directors, all matched with corporate standards of Banco Santander Spain;
- Approve the proposals, operations and limits of clients and portfolio;
- Authorize the use of management tools and local risk models and being aware of the result of their internal validation.
- Keeping updated, assessing and monitoring any observations and recommendations periodically formulated by the supervisory authorities regarding their functions.
The organizational structure of the executive vice-presidency consists of areas which are responsible for credit risk management, market and structural, operational and risk model. The credit risk management structure is composed by directors who act from the point of view of retail and wholesale portfolios management. A specific area has the mission to consolidate the portfolios and their respective risks, supporting the management with the integrated risk vision. In addition to this task, it is also responsible for the attendance to regulators, external and internal auditors, as well as the Group’s headquarters in Spain.
It has a department called risk architecture, which includes a set of transverse functions of all risk factors necessary for the construction of an advanced management model. Methodology (development, parameterization models that reach all areas of risk), Governance, Policy and Risk Culture, Capital, Stress Test and Risk MI (responsible for the generation, exploitation and dissemination of information beyond the project information systems) are areas part of this structure.
Further details of the structure, methodologies and control system related to risk management is described in the report available on the website www.santander.com.br.
BANCO SANTANDER (BRASIL) S.A.
NOTES TO THE CONSOLIDATED FINANCIAL STATEMENTS
(Thousands of Brazilian Reais - R$ - unless otherwise stated)
b) Credit Risk
b.1) Introduction to the treatment of credit risk
The Credit Risk Management provides subsidies to define strategies as risk appetite, to establish limits, including exposure analysis and trends as well as the effectiveness of the credit policy. The goal is to maintain a risk profile and adequate minimum profitability to offset the estimated default, both client and portfolio, as defined by the Executive Committee and Board of Directors. Additionally, it is responsible for the risk management systems applied in the identification, measurement, control and reduction of exposure to risk in individual or clustered by similar operations.
The Risk Management is specialized according to each clients’ characteristics, being segregated between individual clients (with the accompanied of dedicated analysts) and customers with similar characteristics (standardized).
• Individualized management: It is performed by a defined risk analyst, which prepares the analysis, and forwards it to the Risk Committee and monitors the client’s progress. It covers the Wholesale segment clients (Corporate and GB&M), financial institutions and certain companies;
• Standardized management: Aimed at individuals and companies not classified as individualized clients. Based on automated models of decision-making and internal risk assessment, complemented by commercial heave and analysts specialized teams to handle exceptions.
Macroeconomic aspects and market conditions, sectored and geographical concentration, as well as client profiling and economic prospects are also evaluated and considered in the appropriate measuring of credit risk.
b.2) Measures and measurement tools
Rating tools
The Bank uses proprietary internal rating models to measure the credit quality of a given customer or transaction. Each rating relates to a certain probability of default or non-payment, determined on the basis of the customer’s historical experience, to predict default. Rating/Scores models are used in the Bank’s loan approval and risk monitoring process.
In some cases the observable data required to estimate the amount of an impairment loss on a financial asset may be limited or no longer fully relevant to current circumstances. In such cases, an entity uses its experienced judgment to estimate the amount of any impairment loss. Similarly an entity uses its experienced judgment to adjust observable data for a group of financial assets to reflect current circumstances.
The classification of loans into different categories is made according to the analysis of economic and financial situation of the client and any other registered information updated frequently. New modes of operation are subject to credit risk evaluation, verification and adaptation to the controls adopted by the Bank.
Ratings assigned to customers are reviewed periodically to include any new financial information available and the experience in the Banking relationship. The frequency of the reviews is increased in case of customers that reach certain levels in the automatic warning systems and of customers classified as requiring special monitoring. The own rating tools are reviewed to qualifications by them awarded are progressively cleared.
Credit risk parameters
The estimative of the risk parameters Probability of Default (PD) and Loss Given Default (LGD) are based on internal experience, i.e. on default observations and on the experience in defaulted loan recoveries during a defined credit cycle.
For low risk portfolios, such as banks, sovereign risk or global wholesale clients, the parameters are based on CDS market data and with global broadness, using Group Santander´s world presence.
For the other portfolios, parameter estimative are based on the Bank’s internal experience.
In addition to the Probability of Default (PD), the Bank is managing its credit portfolio, seeking to make loans to borrowers that have higher volumes of guarantees associated with the operations and also works constantly on strengthening its credit recovery department. These and other actions combined, are responsible for ensuring the adequacy of LGD parameters (Loss Given Default, the loss resulting from the borrower’s default event to honor the principal and/or interest payments).
LGD calculation is based on net losses of non-performing loans, considering the guarantees associated with the transaction, revenues and expenses related to the recovery process and also the timing default.
Besides that , the Loss identification period, or “LIP,” is also considered in the estimation of the risk parameters that is represented by the time period between the occurrence of a loss event and the identification of an objective evidence of this loss. In other words, it represents the time horizon from the credit loss occurrence until the effective confirmation of such loss.
BANCO SANTANDER (BRASIL) S.A.
NOTES TO THE CONSOLIDATED FINANCIAL STATEMENTS
(Thousands of Brazilian Reais - R$ - unless otherwise stated)
The Bank use proprietary internal rating models to measure the credit quality of a given client or transaction. Each rating relates to a certain probability of default or non-payment, determined on the basis of the client’s history, with the exception of certain portfolios classified as “low default portfolios”. These ratings and models are used in loan approval and risk monitoring processes.
The table shown in note 10.b shows the portfolio by the internal risk rating levels and their probability of default.
b.3) Observed loss: measures of credit cost
The Bank monthly estimate losses related to credit risk and then we compare those estimates with actual losses of the month. Periodically conduct tests in order to monitor and maintain control over credit risk.
To complement the use of admission and rating, the Bank use other measures that supports the prudent and effective management of credit risk, based on the loss observed.
The cost of credit is measured by the sum of credit losses and to the average loans portfolio of the same year.
b.4) Credit risk cycle
Banco Santander has a global view of its credit portfolio throughout the various phases of the risk cycle, with a level of detail that allows us to evaluate the current situation of risk and any movements. This mapping is followed by the Board of Directors and the Executive Committee of the bank that no only sets policies and risk procedures, limits and delegates responsibilities. It also approves and supervises the activities of the area.
The risk management process consists of identifying, measuring, analyzing, controlling, negotiating and deciding on, as appropriate, the risks incurred in the Bank’s operations and companies of the conglomerate. The risk cycle comprises three different phases:
• Pre-sale: this phase includes the risk planning and setting targets, determination of the Bank’s risk appetite, approval of new products, risk analysis and credit rating process, and limit setting.
• Sale: this is the decision-making phase for both pre-classified and specific transactions.
• Post-sale: this phase comprises the risk monitoring, measurement and control processes and the recovery process.
Planning and setting risk limits
Risk limit setting is a dynamic process that identifies Banco Santander’s risk appetite by assessing business proposals and its risk attitude. This process is defined through the risk appetite approved by the Bank’s Management and the units.
In the case of individualized risks, the most basic level is the customer, for which individual limits are set.
For GCB clients, a pre-classification model is used based on a system of measurement and monitoring of economic capital. In relation to the Corporate segment, the operational limit model is used in maximum nominal credit amounts.
To the risks of customers with standardized management, the limits of the portfolios are planned using credit management programs (SGP) agreed document for the areas of business and risks, and approved by the Executive Committee. This document contains the results expected for the business in terms of risk and return, beyond the limits which govern the activity and risk management. This client group has a more automated treatment in risks.
Risk analysis and rating process
Risk analysis is a pre-requisite for the approval of loans to clients by the Bank. This analysis consists of examining the counterparty’s ability on meeting its contractual obligations to the Banco Santander, which involves analyzing the client’s credit quality, its risk transactions, solvency, and sustainability of business and the return to be obtained in view of the risk assumed.
The risk analysis is conducted annually, at least, and can be held shortly when client profile indicates (through systems with centralized alerts, managers visits to clients or specific credit analysis), or when operations are not covered by pre-classification.
Decision-Making on Operations
The process of decision making on operations aims to analyze and adopt in accordance with pre-established policies, taking into account risk appetite and any elements of the operation that are important in assessing risk and return.
The Banco Santander uses, among others, the RORAC methodology (profitability on risk-adjusted capital), for risk analysis and pricing in the decision-making process on transactions and deals.
BANCO SANTANDER (BRASIL) S.A.
NOTES TO THE CONSOLIDATED FINANCIAL STATEMENTS
(Thousands of Brazilian Reais - R$ - unless otherwise stated)
Risk monitoring and control
The preventive detection of the operation’s credit quality is from the commercial manager responsibility in conjunction with the risk analyst. Additionally, the risk monitoring is made through a permanent observation process in order to anticipate the identification of incidents which can occur in the evolution of the operations, clients and environment.
This monitoring process may result in the client’s classification in SCAN. This is a system which allows the differentiation of the management level and the action to be taken case-by-case.
Risk control function
The control function is performed by assessing risks from various complementary perspectives, the main pillars are the control by geographical location, business area, management model, product and process, facilitating thus the detection of specific areas requiring measures for which decisions should be taken. To obtain an overview of the bank’s loan portfolio over the various phases of the credit cycle, with a level of detail that allows the assessment of the current risk situation and any movements.
Any changes in the Bank’s risk exposure are controlled on an ongoing and systematic basis. The impacts of these changes in certain future situations, both of an exogenous nature and those arising from strategic decisions, are assessed in order to establish measures that place the profile and amount of the loss portfolio within the parameters set by Executive Commission.
b.5) Credit recovery
"Strategies and action channels are defined according to the days of past due loans and the amounts, that result in a Map of Responsibilities and always look as the first alternative, the client’s recovery.
The Bank uses tools as behavioral scoring to study the collection performance of certain groups, in order to reduce costs and increase recoveries. These models seek to measure the probability of clients becoming overdue adjusting collection efforts so that clients less likely to recover, receive timely actions. In cases the payments is most likely to happen, the focus is given in maintaining a healthy relationship with clients. All clients with severe or rescheduled credits delays values have internal restrictions. "
Clients with higher risks have a model of recovery, with a commercial follow-up and a recovery specialist.
b.6) Credit risk from other perspective
Certain areas and specific views of credit risk deserve a specialist’s attention, complementary to global risk management.
Concentration risk
Concentration risk is an essential factor in the area of credit risk management. The Bank constantly monitors the degree of concentration of its credit risk portfolios, by geographical area/country, economic sector, product and client group.
The risk committee establishes the risk policies and reviews the exposure limits required to ensure adequate management of credit risk portfolio concentration.
From the sectorial standpoint, the distribution of the corporate portfolio is adequately diversified.
The Bank’s Risk Area works closely with the Finance Area in the active management of credit portfolios, which includes reducing the concentration of exposures through several techniques, such as the arrangement of credit derivatives for hedge purposes or the performance of securitization transactions, in order to optimize the risk/return ratio of the total portfolio.
Credit risk from financial market operations
This heading includes the credit risk arising in treasury operations with clients, mainly credit institutions. These operations are performed both via money market financing products with different financial institutions and via derivative instruments arranged for the purpose of serving our clients.
Risk control is performed using an integrated, real-time system that enables the Bank to know at any time the unused exposure limit with respect to any counterparty, any product and maturity and at any Bank unit.
Credit risk is measured at its current market value and its potential value (exposure value considering the future variation in the underlying market factors). Therefore, the equivalent credit risk (CRE) is defined as the sum of net replacement value plus the maximum potential value of the contracts in the future.
BANCO SANTANDER (BRASIL) S.A.
NOTES TO THE CONSOLIDATED FINANCIAL STATEMENTS
(Thousands of Brazilian Reais - R$ - unless otherwise stated)
Environmental risk
"Environmental Risk management for the Wholesale Bank is performed through the analysis of social and environmental practices of customers who have limits or credit risk over R$1 million. This analysis considers items such as contaminated land, deforestation, working conditions and other possible points of environmental attention where there is the possibility of penalties and losses. The procedure is performed by a specialized team, trained in Biology, Health and Safety Engineering, Geology and Chemistry Engineering. A team of financial analysis considers the potential damage and impact that unfavorable environmental condition may compromise the financial condition and client guarantees. The analysis focuses on preserving capital and reputation in the market and the spread of the practice is achieved through the constant training of commercial and credit areas on the application of social and environmental risk patterns in the credit approval process for corporate clients in the Wholesale Bank.
The environmental risk management for suppliers is done throughout the purchasing process and is based on the 10 principles of the Global Compact of the United Nations which considers items such as: human rights, working conditions, environmental and ethical issues. To participate in a bidding process, the company must show respect to these principles. During the approval, the Bank does a technical evaluation that includes social and environmental criteria. Beyond this step, suppliers classified as high impact, include a more detailed assessment of the operational, financial, administrative, fiscal, legal, governance, social and environmental. This step includes a visit to verify the evidence and obtain answers provided by the company during the evaluation."
b.7) Variations in main aggregates in 2016 (unaudited)
The trends observed in 2017 were consistent with those of 2016, where in a challenging economic scenario, the Bank model proved to be effective. The Bank was able to preserve the good quality of the business and reduce the default rate. In December 2017, this index was 6.6% against 7%, 31 in December 2016 and 7% on December 31, 2015.
This income was possible thanks to a combination of factors. Among them, a credit mix with focus on safer lines; partnerships; a deep knowledge and monitoring] of the client’s financial life; and the deployment of strong debt renegotiation campaigns.
The involvement of senior management in decision making (held collectively at our Committees), besides independence Risks relating to the business, allow more assertive decisions and credit risk reduction.
The analysis of credit for projects and companies in the Wholesale segment, continue to integrate opinions of our area of Environmental Risk.
Below is a table showing the evolution of the main credit indicators.
| | 2017 | 2016 | 2015 |
| Credit risk exposure - customers (Thousand of Reais) | 330,474,249 | 301,702,586 | 310,877,166 |
| Loans and advances to customers, gross (note 10) | 287,829,213 | 268,437,556 | 267,266,449 |
| Contingent Liabilities - Guarantees and other sureties (note 45.a) | 42,645,036 | 33,265,030 | 43,610,717 |
| Non-performing loans ratio (%) - unaudited | 6.65% | 7.04% | 7.00% |
| Impairment coverage ratio (%) - unaudited | 95.39% | 96.31% | 82.86% |
| Specific credit loss provisions, net of RAWO (*) (Thousand of Reais) - unaudited | 18,261,638 | 18,191,126 | 15,411,760 |
| Cost of credit (% of risk) - unaudited | 3.98% | 4.52% | 5.07% |
Data prepared on the basis of management criteria and the accounting criteria of the controller unit.
(*) RAWO = Recoveries of Assets Derecognized.
c) Market Risk
Market risk is the exposure to risks such as interest rates, exchange rates, prices of goods, prices in the stock market and others values, according to the type of product, volume of operations, term and conditions of the agreement and underlying volatility.
The Bank operates according to global policies, within the Group’s risk tolerance level, aligned with the objectives in Brazil and in the world.
With this purpose, it has developed its own Risk Management model, according to the following principles:
- Functional independence;
- Executive capacity sustained by knowledge and proximity with the client;
- Global reach of the function (different types of risks);
- Collective decision-making, that evaluates a variety of possible scenarios and do not compromise the results with individual decision (including Brazil Executive Risk Committee - Comitê Executivo de Riscos Brasil). This Committee delimits and approves the operations. The Asset and Liabilities Committee, which responds for the capital management and structural risks, including country-risk, liquidity and interest rates.
BANCO SANTANDER (BRASIL) S.A.
NOTES TO THE CONSOLIDATED FINANCIAL STATEMENTS
(Thousands of Brazilian Reais - R$ - unless otherwise stated)
- Management and improvement of the equation risk/return; and
- Advanced methodologies for risk management, such as Value at Risk – VaR (historical simulation of 521 days with a confidence level of 99% and time horizon of one day), scenarios, financial margin sensibility, equity value and contingency plan.
The Market Risks structure is part of the Vice Presidency of Credit and Market Risks, an independent area that applies risk policies taking into consideration the guidelines of the Board of Directors and the Risks Division of Santander in Spain.
c.1) Activities subject to market risk
The measurement, control and monitoring of the market risk area comprises all operations in which net worth risk is assumed. This risk arises from changes in the risk factors –interest rate, exchange rate, equities, commodity prices and the volatility thereof– and from the solvency and liquidity risk of the various products and markets in which the Bank operates.
The activities are segmented by risk type as follows:
- Trading: this item includes financial services for clients, trading operations and positioning mainly in fixed-income, equity , foreign currency products and shares.
- Balance sheets management: A risk management assessment aims to give stability to interest income from the commercial and economic value of the Bank, maintaining adequate levels of liquidity and solvency. The risk is measured by the balance sheets exposure to movements in interest rates and level of liquidity.
- Structural risks:
i. Structural foreign currency risk/hedges of results: foreign currency risk arising from the currency in which investments in consolidable and non-consolidable companies are made (structural exchange rate). This item also includes the positions taken to hedge the foreign currency risk on future results generated in currencies other than the Real (hedges of results).
ii. Structural equities risk: this item includes equity investments in non-consolidated financial and non-financial companies that give rise to equities risk.
The Financial Management area is responsible for the balance sheet management risk and structural risks through the application of uniform methodologies adapted to the situation of each market in which the Bank operates. Thus, in the convertible currencies area, Financial Management directly manages the Parent’s risks and coordinates the management of the other units operating in these currencies. Decisions affecting the management of these risks are taken through the ALCO (Asset Liability Control committees) in the respective countries.
The Financial Management goal is to ensure the stability and recurring nature of both the net interest margin of the commercial activity and the Bank’s economic value, whilst maintaining adequate liquidity and solvency levels.
Each of these activities is measured and analyzed using different tools in order to reflect their risk profiles as accurately as possible.
Interest rate Risk
The following table aggregates by product the cash flows of the operations of our perimeter of companies that have interest income. The transactions are presented by the book balance at the closing date of the years 2016 and 2017. It is not associated with the risk management of changes in interest rates or indexer mismatches, which is done by monitoring metrics of Marketplace. However, it allows to evaluate the concentrations of term and possible risks and below it, the balances of the same products are presented at the redemption value at maturity, except for the line dealing with receivables and obligations linked to derivative contracts.
| Position of accounts subject to interest rate risk | | | | 2017
In millions of Reais |
| | 0 to 30 days | 31 to 180 days | 181 to 365 days | 1 to 5 years | Above 5 years | Total |
| Interest-earning assets: | | | | | | |
| Financial Assets Held For Trading | 5,541 | 1,779 | 6,556 | 29,968 | 10,194 | 54,038 |
| Debt instruments | 653 | 890 | 5,739 | 16,709 | 8,148 | 32,139 |
| Equity instruments | 490 | - | - | - | - | 490 |
| Trading derivatives | 4,398 | 889 | 818 | 13,259 | 2,046 | 21,410 |
| Available-For-Sale Financial Assets | 2,032 | 1,272 | 17,092 | 46,502 | 23,711 | 90,609 |
| Debt instruments | 925 | 1,272 | 17,092 | 46,502 | 23,711 | 89,503 |
| Equity instruments | 1,107 | - | - | - | - | 1,107 |
| Other Financial Assets At Fair Value Through Profit Or Loss | 72 | 13 | 50 | 479 | 1,008 | 1,622 |
| Debt instruments | 38 | 13 | 50 | 479 | 1,008 | 1,589 |
| Equity instruments | 33 | - | - | - | - | 33 |
| Non-Current Assets Held For Sale | 80 | 168 | 222 | 3,082 | 7,040 | 10,593 |
| Reserves from Brazilian Central Bank | 59,051 | - | - | - | - | 59,051 |
BANCO SANTANDER (BRASIL) S.A.
NOTES TO THE CONSOLIDATED FINANCIAL STATEMENTS
(Thousands of Brazilian Reais - R$ - unless otherwise stated)
| Position of accounts subject to interest rate risk | | | | 2017
In millions of Reais |
| | 0 to 30 days | 31 to 180 days | 181 to 365 days | 1 to 5 years | Above 5 years | Total |
| Loans and Receivables | 22,033 | 81,275 | 34,430 | 86,645 | 71,453 | 295,835 |
| Total | 88,809 | 84,507 | 58,351 | 166,677 | 113,406 | 511,750 |
| Interest-bearing liabilities | | | | | | |
| Deposits from credit institutions | 150,719 | 46,254 | 62,605 | 69,778 | 5,119 | 334,474 |
| Subordinated debts | - | 789 | 257 | 7,784 | - | 8,829 |
| Marketable debt securities | 4,436 | 36,208 | 12,313 | 15,544 | 847 | 69,348 |
| Trading derivatives | 4,618 | 659 | 504 | 12,243 | 2,285 | 20,310 |
| Short positions | 32,531 | - | - | - | - | 32,531 |
| Total | 192,304 | 83,909 | 75,679 | 105,349 | 8,251 | 465,492 |
| Position of accounts subject to interest rate risk | | | | | 2016
In millions of Reais |
| | 0 to 30 days | 31 to 180 days | 181 to 365 days | 1 to 5 years | Above 5 years | Total |
| Interest-earning assets: | | | | | | |
| Financial Assets Held For Trading | 26,960 | 5,242 | 4,593 | 31,938 | 14,918 | 83,651 |
| Debt instruments | 20,232 | 2,370 | 2,711 | 23,479 | 10,335 | 59,127 |
| Equity instruments | 397 | - | - | - | - | 397 |
| Trading derivatives | 6,331 | 2,872 | 1,882 | 8,459 | 4,582 | 24,126 |
| Available-For-Sale Financial Assets | 2,940 | 1,350 | 1,761 | 42,683 | 11,046 | 59,780 |
| Debt instruments | 954 | 1,350 | 1,761 | 42,683 | 11,046 | 57,794 |
| Equity instruments | 1,985 | - | - | - | - | 1,985 |
| Other Financial Assets At Fair Value Through Profit Or Loss | 80 | 14 | 50 | 486 | 981 | 1,611 |
| Debt instruments | 38 | 14 | 50 | 486 | 981 | 1,569 |
| Equity instruments | 42 | - | - | - | - | 42 |
| Non-Current Assets Held For Sale | 79 | 168 | 220 | 2,920 | 6,549 | 9,936 |
| Reserves from Brazilian Central Bank | 58,594 | - | - | - | - | 58,594 |
| Loans and Receivables | 16,435 | 99,924 | 32,590 | 79,467 | 68,120 | 296,536 |
| Total | 105,088 | 106,698 | 39,214 | 157,494 | 101,614 | 510,108 |
| Interest-bearing liabilities: | | | | | | |
| Deposits from credit institutions | 135,457 | 49,973 | 46,686 | 69,605 | 4,987 | 306,708 |
| Subordinated debts | - | 268 | 255 | 8,260 | - | 8,783 |
| Marketable debt securities | 6,214 | 40,229 | 33,336 | 23,647 | 495 | 103,921 |
| Trading derivatives | 6,046 | 1,308 | 1,268 | 7,123 | 4,167 | 19,912 |
| Short positions | 31,551 | - | - | - | - | 31,551 |
| Total | 179,268 | 91,778 | 81,545 | 108,635 | 9,649 | 470,875 |
| Position of accounts subject to interest rate risk | | | | | 2015
In millions of Reais |
| | 0 to 30 days | 31 to 180 days | 181 to 365 days | 1 to 5 years | Above 5 years | Total |
| Interest-earning assets: | | | | | | |
| Financial Assets Held For Trading | 3,399 | 5,288 | 6,917 | 21,436 | 8,149 | 45,189 |
| Debt instruments | 1,225 | 1,806 | 4,542 | 12,038 | 4,182 | 23,793 |
| Equity instruments | 405 | - | - | - | - | 405 |
| Trading derivatives | 1,769 | 3,482 | 2,374 | 9,398 | 3,967 | 20,990 |
| Available-For-Sale Financial Assets | 2,210 | 3,109 | 8,643 | 31,242 | 21,842 | 67,046 |
| Debt instruments | 1,047 | 3,109 | 8,643 | 31,242 | 21,842 | 65,883 |
| Equity instruments | 1,162 | - | - | - | - | 1,162 |
| Other Financial Assets At Fair Value Through Profit Or Loss | 611 | 12 | 48 | 427 | 893 | 1,991 |
| Debt instruments | 38 | 12 | 48 | 427 | 893 | 1,418 |
| Equity instruments | 574 | - | - | - | - | 574 |
| Non-Current Assets Held For Sale | 80 | 163 | 215 | 2,096 | 7,327 | 9,881 |
| Reserves from Brazilian Central Bank | 52,183 | - | - | - | - | 52,183 |
| Loans and Receivables | 20,259 | 79,073 | 40,635 | 82,695 | 59,986 | 282,648 |
| Total | 78,742 | 87,645 | 56,458 | 137,896 | 98,197 | 458,938 |
| Interest-bearing liabilities | | | | | | |
| Deposits from credit institutions | 116,365 | 39,972 | 36,960 | 95,602 | 5,764 | 294,663 |
| Subordinated debts | 44 | 87 | 7,990 | 9,694 | - | 17,815 |
| Marketable debt securities | 8,070 | 24,823 | 12,484 | 52,032 | 52 | 97,461 |
| Trading derivatives | 1,550 | 3,671 | 1,430 | 7,122 | 2,854 | 16,627 |
| Short positions | 20,899 | - | - | - | - | 20,899 |
| Total | 146,928 | 68,553 | 58,864 | 164,450 | 8,670 | 447,465 |
BANCO SANTANDER (BRASIL) S.A.
NOTES TO THE CONSOLIDATED FINANCIAL STATEMENTS
(Thousands of Brazilian Reais - R$ - unless otherwise stated)
Currency Risk
| Position of accounts subject to interest rate risk | | | | 2017
In millions of Reais |
| Asset: | Dollar | Euro | Others | Total |
| Cash/Applications/Debt Instruments | 54,380 | 11,684 | 10,377 | 76,442 |
| Loans and advances to customers | 3,818 | 321 | - | 4,139 |
| Investments in Foreign Subsidiaries and Dependence | 36,613 | 3,010 | - | 39,623 |
| Derivatives | 262,092 | 45,317 | 9,640 | 317,049 |
| Others | 46,200 | 13,028 | 6,237 | 65,465 |
| Total | 403,102 | 73,361 | 26,254 | 502,717 |
| Liabilities: | Dollar | Euro | Others | Total |
| Funding in foreign currency | 32,962 | 3,047 | 17 | 36,025 |
| Derivatives | 277,358 | 54,633 | 9,294 | 341,284 |
| Others | 93,821 | 15,975 | 17,068 | 126,864 |
| Total | 404,140 | 73,654 | 26,378 | 504,173 |
| Position of accounts subject to currency risk | | | | 2016
In millions of Reais |
| Asset: | Dollar | Euro | Others | Total |
| Cash/Applications/Debt Instruments | 4,839 | - | - | 4,839 |
| Loans and advances to customers | 3,485 | - | - | 3,485 |
| Investments in Foreign Subsidiaries and Dependence | 34,337 | 2,662 | - | 36,999 |
| Derivatives | 166,626 | 24,173 | 11,241 | 202,040 |
| Others | 25,273 | 1,020 | - | 26,293 |
| Total | 234,560 | 27,855 | 11,241 | 273,656 |
| Liabilities: | Dollar | Euro | Others | Total |
| Funding in foreign currency | 32,255 | 640 | - | 32,895 |
| Derivatives | 183,277 | 27,973 | 11,426 | 222,676 |
| Others | 19,198 | - | 104 | 19,302 |
| Total | 234,730 | 28,613 | 11,530 | 274,873 |
c.2) Methodologies
Trading
The Bank calculates its market risk capital requirement using a standard model provided by Bacen.
The standard methodology applied to trading activities by the Banco Santander in 2017, 2016 and 2015 was the value at risk (VaR), which measures the maximum expected loss with a given confidence level and time horizon. This methodology was based on a standard historical simulation with a 99% confidence level and a one-day time horizon. Statistical adjustments were made to enable the efficient incorporation of the most recent events that condition the level of risk assumed.
Specifically, the Bank uses a time window of two years or 521 daily data obtained retrospectively from the reference date of the VaR calculation. Two figures are calculated each day, one by applying an exponential decline factor which gives a lesser weighting to more distant observations in time, and another with uniform weightings for all observations. The VaR reported is the higher of these two figures.
VaR is not the only measure. It is used because it is easy to calculate and because it provides a good reference of the level of risk incurred by the Bank. However, other measures are simultaneously being implemented to enable the Bank to exercise greater risk control in all the markets in which it operates.
One of these measures is scenario analysis, which consists of defining behavior scenarios for various financial variables and determining the impact on results of applying them to the Bank’s activities. These scenarios can replicate past events (such as crisis) or, conversely, determine plausible scenarios that are unrelated to past events. A minimum of three types of scenarios are defined (plausible, severe and extreme) which, together with VaR, make it possible to obtain a much more complete view of the risk profile.
The positions are monitored daily through an exhaustive control of changes in the portfolios, aiming to detect possible incidents and correct them immediately. The daily preparation of an income statement is an excellent risk indicator, once it allows the Bank to observe and detect the impact of changes in financial variables on the portfolios. The daily calculation of the result is also an excellent indicator of the risk, as it allows the Bank to observe and detect the impact of changes in financial variables in the portfolios.
BANCO SANTANDER (BRASIL) S.A.
NOTES TO THE CONSOLIDATED FINANCIAL STATEMENTS
(Thousands of Brazilian Reais - R$ - unless otherwise stated)
Lastly, due to their atypical nature, derivatives and credit trading management (actively traded credit – Trading Book) activities are controlled by assessing specific measures on a daily basis. In the case of derivatives, these measures are sensitive to fluctuations in the price of the underlying (delta and gamma), in volatility (vega) and in time (theta). For credit trading management activities, the measures controlled include sensitivity to spread, jump-to-default and position concentrations by rating level.
In respect to the credit risk inherent in the trading portfolios (Credit Trading portfolios), and in keeping with the recommendations made by the Basel Committee of Banking Supervision, an additional measure has been introduced, the Incremental Risk Charge (IRC), in order to cover the default risk which is not properly captured in the VaR, through the variation of the related market prices of credit spreads. The instruments affected are basically fixed-income bonds, derivatives on bonds (forwards, options, etc.) and credit derivatives (credit default swaps, asset-backed securities, etc.). The method used to calculate the IRC, is defined globally at Group level.
c.3) Balance-sheet management
Interest rate risk
The Bank analyses the sensitivity of the net interest margin and market value of equity to changes in interest rates. This sensitivity arises from maturity and interest rate repricing gaps in the various balance sheets items.
On the basis of the balance-sheets interest rate position, and considering the market situation and outlook, the necessary financial measures are adopted to align this position with that desired by the Bank. These measures can range from the taking of positions on markets to the definition of the interest rate features of commercial products.
The measures used by the Bank to control interest rate risk in these activities are the interest rate gap, the sensitivity of net interest margin (NIM) and market value of equity (MVE) to changes in interest rates, the duration of capital, value at risk (VaR), the EaR (Earning At Risk) and scenario analysis.
Interest rate gap of assets and liabilities
The interest rate gap analysis focuses on the mismatches between the reevaluation deadlines of on-balance-sheets assets and liabilities and off-balance-sheets items. This analysis facilitates a basic snapshot of the balance sheet structure and enables concentrations of interest rate risk in the various maturities to be detected. Additionally, it is a useful tool for estimating the possible impact of potential changes in interest rates on the entity’s net interest margin and market value of equity.
The flows of all the on and off-balance sheet headings must be broken down and placed at the point of repricing or maturity. The duration and sensitivity of contracts that do not have a maturity date they are analyzed and estimated using an internal model.
Net interest margin (NIM) sensitivity
The sensitivity of the net interest margin measures the change in the expected accruals for a specific period (12 months) given a shift in the interest rate curve.
The sensitivity of the net interest margin is calculated by simulating the margin both for a scenario of changes in the interest rate curve and for the current scenario. The sensitivity is the difference between the two margins calculated.
Market value of equity (MVE) sensitivity
The sensitivity of the market value of equity is a complementary measure to the sensitivity of the net interest margin.
This sensitivity measures the interest rate risk implicit in the market value of equity based on the effect of changes in interest rates on the present values of financial assets and liabilities.
Value at risk (VaR) and Earnings at Risk (EaR)
It is defined with 99% base points of the MVE’s loss distribution function, calculated considering the market value of the positions, based on the payback obtained in the last two years and with degree of statistical certainty (level of trust) to a defined time horizon.
It is also applied a similar methodology to calculate the maximum loss in NII (EaR), in order to consider the interest rate risk even in economic value impact as in financial margin.
The unit sums the return vectors of the VAR with the return vectors of EaR, resulting the total return vector. The composition is made considering in the metric of EaR the losses in financial margin that occur between the initial moment (reference date) and the holding period of the not-trading portfolio. The losses in the economic value takes in consideration the impact of the ending positions after the holding period.
The value at risk for balance sheet headings and investment portfolios are calculated by applying the same standard as that used for trading: historical simulation with a confidence interval of 99% . Statistical adjustments were made to enable the swift and efficient incorporation of the most recent events that condition the level of risk assumed.
BANCO SANTANDER (BRASIL) S.A.
NOTES TO THE CONSOLIDATED FINANCIAL STATEMENTS
(Thousands of Brazilian Reais - R$ - unless otherwise stated)
c.4) Liquidity risk
Liquidity risk is associated with the Bank’s ability to finance its commitments at reasonable market prices and to carry out its business plans with stable sources of funding. The Bank permanently monitors maximum gap profiles.
The measures used to control liquidity risk in balance sheet management are the liquidity gap, liquidity ratios, stress scenarios and contingency plans.
Liquidity gap
The liquidity gap determines the inflow and outflow of funds for assets, liabilities (note 45-d) and off-balance headings at a given time horizon, making it possible to analyze mismatches between the Bank’s expected inflow and outflow of funds.
A liquidity gap may be prepared and analyzed as divided into local currency liquidity gap and foreign currency liquidity gap, under which cash and cash equivalents, inflows and outflows and strategies are segregated into local and foreign currency, respectively.
The Bank prepares three types of Liquidity Gap analysis:
1 - Contractual liquidity gap
The Contractual Liquidity Gap determines the contractual maturity flows of the Bank’s major products on a consolidated basis, and any existing mismatches. It also informs the available liquidity in one day and the consumption of or increase in liquidity in the period.
2 - Operational liquidity gap
Daily cash monitoring and management considering the market situation, maturities and renewal of assets and liabilities, liquidity requirement and specific events.
3 - Projected liquidity gap
Based on the Contractual Liquidity Gap, new maturity flows are projected considering the Bank’s budget plan.
Liquidity ratios
In addition to the Liquidity Gap analysis, a Structure Liquidity model is also prepared to assess the structure profile of the sources and uses of the Bank’s funds, which includes Liquidity Ratio studies.
The key Liquidity Ratios analyzed are as follows:
• Deposits / Lending operations – measures the Institution’s ability to finance lending operations with more stable and lower-cost funding.
• Stable Liabilities / Permanent Assets – measures the ration between Capital + Other Stable Liabilities and Investments + Other Permanent Assets.
• Market Funding / Total Assets – measures the percentage of the Group’s assets financed with less stable and higher-cost funding.
• Short-term market funding / Market Funding – measures the percentage of probable liquidity loss (less than 90 days) on total less stable funding.
• Net Assets / Short-term Market Funding – measures the commitment ratio of highly-liquid assets and probable liquidity loss (less than 90 days).
Banco Santander uses in its liquidity risk management the Liquidity Coverage Ratio (LCR). LCR is a short-term liquidity ratio for a 30-day stress scenario. Represents the result of the division of the high quality assets and the net cash outflows.
Total High Liquidity Assets - HQLA (Net Assets) is composed mainly of Brazilian federal government bonds and compulsory returns. The net outflows are composed mainly of losses of deposits, offset in part by inflows, mainly loans.
Throughout the three observations in this disclosure (exercise with balances from the end of October, November and December 2017) the institution presented a surplus (difference between net assets and net outflows) of R$14.7 billion, which resulted in an LCR of 123%.
BANCO SANTANDER (BRASIL) S.A.
NOTES TO THE CONSOLIDATED FINANCIAL STATEMENTS
(Thousands of Brazilian Reais - R$ - unless otherwise stated)
Clients Funding
Santander has different sources of funding, both in terms of products and the mix of clients, with emphasis on retail operations of the Time Deposits. Total customer funds are currently at the level of R$356 million and showed a slight decrease compared to volumes at the end of 2016, mainly because of the maturity of some operations (Financial Letters) that were not renewed.
| Customers Funding | 2017 | 2016
In millions of Reais |
| | 0 a 30 days | Total | % | 0 a 30 days | Total | % |
| Demand deposits | 15,252 | 15,252 | 100% | 15,794 | 15,794 | 100% |
| Savings accounts | 40,570 | 40,570 | 100% | 35,901 | 35,901 | 100% |
| Time deposits | 39,549 | 170,570 | 23% | 24,452 | 150,686 | 16% |
| Interbank deposit | 622 | 3,244 | 19% | 944 | 2,379 | 40% |
| Funds from acceptances and issuance of securities | 4,436 | 69,348 | 6% | 6,304 | 105,120 | 6% |
| Borrowings and Onlendings | 5,606 | 48,304 | 12% | 4,114 | 46,124 | 9% |
| Subordinated Debts / Debt Instruments Eligible to Compose Capital | - | 8,829 | 0% | - | 8,784 | 0% |
| Total | 106,035 | 356,117 | 30% | 87,509 | 364,788 | 23% |
| Customers Funding | | | In millions of Reais
2015 |
| | 0 a 30 days | Total | % |
| Demand deposits | 14,990 | 14,990 | 100% |
| Savings accounts | 35,842 | 35,842 | 100% |
| Time deposits | 22,048 | 148,682 | 15% |
| Interbank deposit | 1,896 | 2,855 | 66% |
| Funds from acceptances and issuance of securities | 8,126 | 98,246 | 8% |
| Borrowings and Onlendings | 2,836 | 52,769 | 5% |
| Subordinated Debts / Debt Instruments Eligible to Compose Capital | 234 | 18,006 | 1% |
| Total | 85,972 | 371,390 | 23% |
Assets and liabilities in accordance with the remaining contractual maturities, considering the undiscounted flows are as follows:
| Non-Discounted Future Flows Except Derivatives | | | | | | 2017
In millions of Reais |
| | 0 to 30 days | 31 to 180 days | 181 to 365 days | 1 to 5 years | Above 5 years | Total |
| Interest-earning assets: | | | | | | |
| Financial Assets Held For Trading | 5,051 | 1,788 | 6,737 | 32,841 | 18,848 | 65,265 |
| Debt instruments | 654 | 899 | 5,919 | 19,582 | 16,801 | 43,856 |
| Trading derivatives | 4,398 | 889 | 818 | 13,259 | 2,046 | 21,410 |
| Available-For-Sale Financial Assets | 925 | 1,283 | 12,695 | 56,167 | 50,329 | 121,399 |
| Debt instruments | 925 | 1,283 | 12,695 | 56,167 | 50,329 | 121,399 |
| Other Financial Assets At Fair Value Through Profit Or Loss | 38 | 13 | 51 | 543 | 1,994 | 2,640 |
| Debt instruments | 38 | 13 | 51 | 543 | 1,994 | 2,640 |
| Non-Current Assets Held For Sale | 81 | 169 | 227 | 3,370 | 9,573 | 13,419 |
| Reserves from Brazilian Central Bank | 59,051 | - | - | - | - | 59,051 |
| Loans and Receivables | 74,887 | 93,587 | 45,397 | 117,084 | 84,560 | 415,515 |
| Total | 140,034 | 96,840 | 65,107 | 210,005 | 165,304 | 677,290 |
| Interest-earning assets: | | | | | | |
| Deposits from credit institutions | 150,979 | 50,936 | 66,571 | 84,274 | 8,191 | 360,951 |
| Subordinated Debts / Debt Instruments Eligible to Compose Capital | - | 807 | 257 | 7,784 | - | 8,848 |
| Marketable debt securities | 4,445 | 36,855 | 12,904 | 18,421 | 866 | 73,491 |
| Trading derivatives | 4,618 | 659 | 504 | 12,243 | 2,285 | 20,310 |
| Short positions | 32,531 | - | - | - | - | 32,531 |
| Total | 192,573 | 89,257 | 80,236 | 122,722 | 11,342 | 496,130 |
BANCO SANTANDER (BRASIL) S.A.
NOTES TO THE CONSOLIDATED FINANCIAL STATEMENTS
(Thousands of Brazilian Reais - R$ - unless otherwise stated)
| Non-Discounted Future Flows Except Derivatives | | | | | | 2016
In millions of Reais |
| | 0 to 30 days | 31 to 180 days | 181 to 365 days | 1 to 5 years | Above 5 years | Total |
| Interest-earning assets: | | | | | | |
| Financial Assets Held For Trading | 27,093 | 5,262 | 4,749 | 36,135 | 25,573 | 98,812 |
| Debt instruments | 20,762 | 2,390 | 2,867 | 27,676 | 20,991 | 74,686 |
| Trading derivatives | 6,331 | 2,872 | 1,882 | 8,459 | 4,582 | 24,126 |
| Available-For-Sale Financial Assets | 1,492 | 1,373 | 1,819 | 55,056 | 29,854 | 89,594 |
| Debt instruments | 1,492 | 1,373 | 1,819 | 55,056 | 29,854 | 89,594 |
| Other Financial Assets At Fair Value Through Profit Or Loss | 38 | 14 | 52 | 586 | 1,824 | 2,514 |
| Debt instruments | 38 | 14 | 52 | 586 | 1,824 | 2,514 |
| Non-Current Assets Held For Sale | 79 | 170 | 227 | 3,307 | 9,979 | 13,762 |
| Reserves from Brazilian Central Bank | 58,594 | - | - | - | - | 58,594 |
| Loans and Receivables | 18,151 | 112,337 | 42,763 | 106,518 | 82,770 | 362,539 |
| Total | 105,447 | 119,156 | 49,610 | 201,602 | 150,000 | 625,815 |
| Interest-bearing liabilities: | | | | | | |
| Deposits from credit institutions | 135,725 | 51,098 | 50,024 | 86,535 | 7,444 | 330,826 |
| Subordinated Debts / Debt Instruments Eligible to Compose Capital | - | 347 | 330 | 10,633 | - | 11,310 |
| Marketable debt securities | 6,234 | 41,431 | 35,390 | 27,344 | 521 | 110,920 |
| Trading derivatives | 6,046 | 1,308 | 1,268 | 7,123 | 4,167 | 19,912 |
| Short positions | 31,551 | - | - | - | - | 31,551 |
| Total | 179,556 | 94,184 | 87,012 | 131,635 | 12,132 | 504,519 |
| Non-Discounted Future Flows Except Derivatives | | | | | | 2015
In millions of Reais |
| | 0 to 30 days | 31 to 180 days | 181 to 365 days | 1 to 5 years | Above 5 years | Total |
| Interest-earning assets: | | | | | | |
| Financial Assets Held For Trading | 2,831 | 4,125 | 7,031 | 24,032 | 16,623 | 54,642 |
| Debt instruments | 1,226 | 1,860 | 4,761 | 15,430 | 13,151 | 36,428 |
| Trading derivatives | 1,605 | 2,265 | 2,270 | 8,602 | 3,472 | 18,214 |
| Available-For-Sale Financial Assets | 1,048 | 3,185 | 9,475 | 41,894 | 55,640 | 111,242 |
| Debt instruments | 1,048 | 3,185 | 9,475 | 41,894 | 55,640 | 111,242 |
| Other Financial Assets At Fair Value Through Profit Or Loss | 38 | 12 | 48 | 427 | 893 | 1,418 |
| Debt instruments | 38 | 12 | 48 | 427 | 893 | 1,418 |
| Non-Current Assets Held For Sale | 80 | 163 | 219 | 2,360 | 10,358 | 13,180 |
| Reserves from Brazilian Central Bank | 52,183 | - | 52,183 | | | |
| Loans and Receivables | 22,717 | 89,907 | 51,196 | 110,204 | 73,132 | 347,156 |
| Total | 78,897 | 97,392 | 67,969 | 178,917 | 156,646 | 579,821 |
| Interest-bearing liabilities: | | | | | | |
| Deposits from credit institutions | 116,525 | 40,676 | 40,453 | 128,627 | 8,594 | 334,875 |
| Subordinated Debts / Debt Instruments Eligible to Compose Capital | 297 | 113 | 8,845 | 12,606 | - | 21,861 |
| Marketable debt securities | 8,093 | 25,732 | 13,900 | 67,049 | 116 | 114,890 |
| Trading derivatives | 1,230 | 1,937 | 1,265 | 6,915 | 2,604 | 13,951 |
| Short positions | 20,899 | - | - | - | - | 20,899 |
| Total | 147,044 | 68,458 | 64,463 | 215,197 | 11,314 | 506,476 |
Scenario analysis / Contingency plan
Liquidity management requires an analysis of financial scenarios where possible liquidity issues are evaluated. For this, crisis scenarios are built and then studied. The model used for this analysis is the Liquidity Stress Test.
The Liquidity Stress Test assesses the institution’s financial structure and its ability to resist and respond to the most extreme situations.
The purpose of the Liquidity Stress Test is to simulate adverse market conditions, making it possible assess impacts on the institution’s liquidity and payment ability, so as to take preventive actions or avoid positions that may adversely affect liquidity in worst-case scenarios.
BANCO SANTANDER (BRASIL) S.A.
NOTES TO THE CONSOLIDATED FINANCIAL STATEMENTS
(Thousands of Brazilian Reais - R$ - unless otherwise stated)
Scenarios are determined based on an analysis of the market commitment during prior crisis and future estimates. Four scenarios with different intensity levels are prepared.
Based on an analysis of the stress models, the Minimum Liquidity concept was determined, which is the minimum liquidity required to support the liquidity losses of up to 90% for 90 days in all crisis scenarios simulated.
Based on the results obtained through the Liquidity Stress Test, the Bank prepares its Liquidity Contingency Plan, which is a formal combination of preventive and corrective actions to be taken in liquidity crisis scenarios.
The Liquidity Contingency Plan is primarily intended to the following:
• Crisis identification – the preparation of a Liquidity Contingency Plan requires the determination in advance of a measurable parameter determining the institution’s liquidity condition and structure. This parameter is the Liquidity Minimum Limit determined by the Liquidity Stress Test. When this limit is exceeded, there is a liquidity crisis environment, and thus, the Contingency Plan is used.
• Internal Communication – after the crisis is identified, it is necessary to establish clear communication channels to mitigate the problems raised. People responsible for taking these contingency actions should be notified of the extent of the contingency and measures to be taken.
• Corrective actions – Actions intended to actually generate the funds required to solve or mitigate the effects of crisis, as follows:
- Assess the type and severity of the crisis;
- Identify the most impacted segment;
- Put in practice the measures planned to generate funds, considering the required amount and cost of the additional resource, either financial or image cost.
ALCO reviews and approves stress models, Minimum Liquidity and Contingency Plan on a semi-annual basis.
If adverse market conditions occur, ALCO may review and approve new models, Minimum Liquidity and Contingency Plan when needed.
c.5) Structural foreign currency risk / Hedges of results / Structural equities risk
These activities are monitored by measuring positions, VaR and results.
c.5.1) Complementary measures
Calibration and test measures
Back-testing consists of performing a comparative analysis between VaR estimates and daily “clean” results (profit or loss on the portfolios at the end of the preceding day valued at following-day prices) and “dirty” (managerial income taking into account also the costs, intraday results and loading). The aim of these tests is to verify and provide a measure of the accuracy of the models used to calculate VaR.
Back-testing analyses performed at Banco Santander comply, at the very least, with the BIS recommendations regarding the verification of the internal systems used to measure and manage financial risks. Additionally, the Santander Bank also conducts hypothesis tests: excess tests, normality tests, Spearman’s rank correlation, average excess measures, etc.
The assessment models are regularly calibrated and tested by a specialized unit.
c.6) Control system
Limit setting
The limit setting process is performed together with the budgeting activity and is the tool used to establish the assets and liabilities available to each business activity. Limit setting is a dynamic process that responds to the level of risk considered acceptable by management.
The limits structure requires a process to be performed that pursues, among others, the following objectives:
1. To identify and delimit, in an efficient and comprehensive manner, the main types of financial risk incurred, so that they are consistent with business management and the defined strategy.
2. To quantify and communicate to the business areas the risk levels and profile deemed acceptable by senior management so as to avoid undesired risks.
BANCO SANTANDER (BRASIL) S.A.
NOTES TO THE CONSOLIDATED FINANCIAL STATEMENTS
(Thousands of Brazilian Reais - R$ - unless otherwise stated)
3. To provide flexibility to the business areas for the efficient and timely assumption of financial risks, due to changes in the market and business strategy, and within the risks level considered acceptable by the Bank.
4. To allow business makers to assume risks which, although prudent, are sufficient to obtain the budgeted results.
5. To delimit the range of products and underlying assets with which each Treasury unit can operate, considering features such as assessment model and systems, liquidity of the instruments involved, etc.
c.7) Risks and results in 2017
Financial Intermediation Activities
The average VaR from the Bank´s trading portfolio in 2017 ended in R$1.4 billion (2016 - R$804 million and 2015 – R$926 million). The dynamic management of this profile allows the Bank to change its strategy to capitalize the opportunities offered by a uncertain environment.
c.7.1) Asset and liability management (1)
Interest rate risk
Convertible currencies
At 2017 year-end, the sensitivity of the net interest margin at one year to parallel increases of 100 basis points applied to Banco Santander portfolios was concentrated on the BRL interest rate curve was positive by R$378 million.
Also at 2017 year-end, the sensitivity market value of equity to parallel increases of 100 basis points applied to the Banco Santander in the BRL interest rate curve was positive by R$2.066 million.
Quantitative risk analysis
The interest rate risk in balance sheets management portfolios, measured in terms of sensitivity of the net interest margin (NIM) at one year to a parallel increase of 100 b.p. in the interest rate curve, was at the beginning of 2017 and 2016, reaching a maximum of R$458 million in June. The sensitivity value increased R$386 million during 2017, reaching a maximum of R$2,177 million in September. The main factors that occurred in 2017 and influenced in sensitivity were the volatility of the exchange rate (convexity effect), portfolio’s decay, update of implicit methodology on cash flow of the Bank’s products and liquidity.
| Million of Reais | | | |
| | 2017 | 2016 | 2015 |
| Sensibilities | | | |
| Net Interest Margin | 378 | 385 | 525 |
| Market Value of Equity | 2,066 | 1,680 | 1,800 |
| Value at Risk - Balance | | | |
| VaR | 1,380 | 804 | 926 |
(1) Includes the financial statement total, except for the financial assets and liabilities held for trading.
Structural liquidity management
Structural liquidity management seeks to finance the Bank’s recurring business with optimal maturity and cost conditions, ensuring to the Bank suitable sources of funding, aligned with the strategic plan and assumed risk profile.
The main features of the structural liquidity management in 2017 were as follows:
• Comfortable position of structural liquidity. Since Banco Santander is basically a commercial Bank, client deposits constitute the main source of liquidity in its financing structure. These deposits, combined with capital and other similar instruments, enable the Bank to cover most of its liquidity requirements and, as a result, the financing raised in wholesale markets is moderate with respect to the size of its financial statements.
• In Brazil, the legal reserve requirement takes a considerable part of the funding.
• Obtainment of liquidity through diversification in instruments. Additionally, subordinated and senior debts have an overall long maturity.
• The local financial statement should be self-funded.
• Based on stress test results, a minimum liquidity buffer is maintained.
• Banco Santander reliance in international funding is not considerable.
BANCO SANTANDER (BRASIL) S.A.
NOTES TO THE CONSOLIDATED FINANCIAL STATEMENTS
(Thousands of Brazilian Reais - R$ - unless otherwise stated)
• The aim is that hard currency related activities be funded with third parties hard currency funding.
• Though, given to the potential disruptions in this market, Banco Santander has mechanisms to use the local liquidity in order to support hard currency activities.
• High capacity to obtain on-balance-sheets liquidity. Government bond positions are held for liquidity management purposes.
• The Bank performs control and management functions, which involves planning its funding requirements, structuring the sources of financing to achieve optimum diversification in terms of maturities and instruments, and defining contingency plans.
In practice, the liquidity management performed by the Bank consists of the following:
• Each year, a liquidity plan is prepared on the basis of the financing needs arising from the budgets of each business. Based on these liquidity requirements and considering certain prudential limits on the obtainment of short-term market financing, the Bank establishes an issue and securitization plan for the year.
• Throughout the year the Bank periodically monitors the actual changes in financing requirements and updates this plan accordingly.
• Control and analysis of liquidity risk. The primary objective is to guarantee that the Bank has sufficient liquidity to meet its short- and long-term financing requirements in normal market situations. To this end, the Bank employs certain financial statement control measures, such as the liquidity gap and liquidity ratios.
Simultaneously, different scenarios (or stress-scenarios) analysis are conducted which consider the additional requirements that could arise if certain extreme but plausible events occur. The goal pursued is to cover a broad view of situations that are more or less likely to affect the Bank, thus enabling it to prepare the related contingency plans.
c.8) Sensitivity analysis
The risk management is focused on portfolios and risk factors pursuant to the requirements of regulators and good international practices.
Financial instruments are segregated into trading and Banking portfolios, as in the management of market risk exposure, according to the best market practices and the transaction classification and capital management criteria of the New Standardized Approach of regulators. The trading portfolio consists of all transactions with financial instruments and products, including derivatives, held for trading, and the Banking portfolio consists of core business transactions arising from the different Banco Santander business lines and their possible hedges. Accordingly, based on the nature of Banco Santander’s activities, the sensitivity analysis was presented for trading and Banking portfolios.
Banco Santander performs the sensitivity analysis of the financial instruments in accordance with requirements of regulatory bodies and international best practices, considering the market information and scenarios that would adversely affect the positions and the income of the Bank.
The table below summarizes the stress amounts generated by Banco Santander’s corporate systems, related to the Banking and trading portfolio, for each one of the portfolio scenarios as of December 31, 2017.
Trading portfolio
| | | | | 2017 |
| Risk Factor | Description | Scenario 1 | Scenario 2 | Scenario 3 |
| Interest Rate - Reais | Exposures subject to changes in interest fixed rate | (2,447) | (73,635) | (147,269) |
| Coupon Interest Rate | Exposures subject to changes in coupon rate of interest rate | (944) | (19,373) | (38,746) |
| Inflation | Exposures subject to change in coupon rates of price indexes | (5,032) | (77,354) | (154,707) |
| Coupon - US Dollar | Exposures subject to changes in coupon US Dollar rate | (5,306) | (16,830) | (33,659) |
| Coupon - Other Currencies | Exposures subject to changes in coupon foreign currency rate | (6,399) | (29,576) | (59,152) |
| Foreign currency | Exposures subject to foreign exchange | (4,933) | (123,334) | (246,668) |
| Eurobond/Treasury/Global | Exposures subject to changes in interest rate negotiated roles in international market | (1,469) | (8,734) | (17,469) |
| Shares and Indexes | Exposures subject to change in shares price | (1,768) | (44,194) | (88,388) |
| Total(1) | | (28,298) | (393,030) | (786,058) |
(1) Amounts net of taxes.
BANCO SANTANDER (BRASIL) S.A.
NOTES TO THE CONSOLIDATED FINANCIAL STATEMENTS
(Thousands of Brazilian Reais - R$ - unless otherwise stated)
Scenario 1: a shock of 10 base points on the interest curves and 1% to price changes (currency and stocks);
Scenario 2: a shock of +25% and -25% in all risk factors, are considered the greatest losses per risk factor;
Scenario 3: a shock of +50% and -50% in all risk factors, are considered the greatest losses per risk factor.
Portfolio Banking
| | | | | 2017 |
| Risk Factor | Description | Scenario 1 | Scenario 2 | Scenario 3 |
| Interest Rate - Reais | Exposures subject to changes in interest fixed rate | (57,347) | (1,099,710) | (2,144,967) |
| TR and Long-Term Interest Rate - (TJLP) | Exposures subject to changes in Exchange of TR in TJLP | (17,245) | (327,661) | (638,940) |
| Inflation | Exposures subject to change in coupon rates of price indexes | (34,794) | (661,094) | (1,289,132) |
| Coupon - US Dollar | Exposures subject to changes in coupon US Dollar rate | (7,123) | (135,334) | (263,901) |
| Coupon - Other Currencies | Exposures subject to changes in coupon foreign currency rate | (2,423) | (46,031) | (89,761) |
| Interest Rate Markets International | Exposures subject to changes in interest rate negotiated roles in international market | (10,655) | (202,441) | (394,759) |
| Foreign Currency | Exposures subject to Foreign Exchange | (1,116) | (27,896) | (55,793) |
| Total(1) | Exposures subject to Foreign Exchange | (130,703) | (2,500,167) | (4,877,253) |
Scenario 1: a shock of 10 base points in interest rate curves and 1% price variance (currency);
Scenario 2: a shock of +25% and -25% in all risk factors, are considered the greatest losses per risk factor;
Scenario 3: a shock of +50% and -50% in all risk factors, are considered the greatest losses per risk factor.
d) Independent Structure
The local area, called Operational Risks Control, is responsible for implementing the management and control model of Operational Risks of Banco Santander. It is subordinated to Executive Vice-President of Risks and count with people, structure, standards, methodologies and tools for ensuring adequacy of the management and control model.
The Management is an acting part and is aligned with the mission of the areas, recognizing, participating and sharing responsibility for the continuous improvement of the operational and technological risk management culture. Then they can ensure compliance with the established objectives and goals, as well as the security and quality of the products and services provided by the Bank.
The Bank’s Board of Directors opted to adopt the Alternative Standardized Approach (ASA) to calculate the installment of Required Reference Equity (PRE) related to operational risk.
d.1) Operational Risks Control
It has as mission towards Banco Santander: Support for the achievement of the strategic objectives and the decision-making process, the adequacy and attendance mandatory requirements, the maintenance of solidity, reliability, reduction and mitigation of losses due to operational risks, further on to the implementation, dissemination of the culture of operational risks.
Acts in preventing the operational risk and supports for the continued strengthening of the internal control system, attending the requirements of regulatory agencies, New Basel Agreement – BIS II and resolutions of the National Monetary Council. This model also follows the guidelines established by Santander Spain, which was based on COSO-Committee of Sponsoring Organizations of the Tread way Commission-Internal Control – Integrated Framework 2013.
The procedures developed and adopted are intended to ensure Bank´s continuous presence among the select group of financial institutions recognized as having the best operational risk management practices, thereby helping to continuously improve its reputation, solidity and reliability in the local and international markets.
In the second half of 2014, was consolidated the adoption if the approaches by lines of defense, approved in the Executive Committee.
BANCO SANTANDER (BRASIL) S.A.
NOTES TO THE CONSOLIDATED FINANCIAL STATEMENTS
(Thousands of Brazilian Reais - R$ - unless otherwise stated)
Defense Line Model

Operational Risks Control is the second line of defense in Santander’s model and aims to maintain the fulfillment, alignment and compliance with corporate guidelines of the Santander group, the Basle Accord and resolutions of the National Monetary Council. Also acts in the control and challenge of the activities performed by the first line of Defense, contributing to its strengthening, vision of an integrated approach to risk management.
d.2) Comprehensiveness and Sustainability
The scope of operational risk control and management, exceeds the allocation of regulatory capital, ensuring its sustainable development, including:
• Improvement of operational efficiency and productivity in the activities and processes.
• Compliance with existing regulations: Bacen, Susep, CVM and BIS, as well as new requirements and monitoring the timely fulfillment of requests from regulators.
• Strengthening of the reputation and improvement in the relation of Risk x Return to the public with whom the Bank maintains relationship.
• Maintenance and preservation of the quality and reliability of products and services.
• Identifying and addressing timely the corrections of identified vulnerabilities in processes.
• Dissemination of culture of advanced management and control of Operational Risks, by means of internal communication (intranet, on-site courses, "online" courses and monthly communication by “Boletim de RO” and “Boletim Flash de RO”), with reinforcement in the "Accountability".
This solid and efficient structure permits the continuous enhancement of existing methodologies and the further dissemination of the culture of responsibility in regard to the advanced management of operational risk.
d.3) Differential factor
The Operational Risks Control area invests in the development, training and updating of its professionals so they can keep up with changes in the business environment, in addition to offering training programs for other professionals through the intranet and on-site courses. Among the personal course, we highlight the achievement of training aimed at increasing culture of RO management, training for the capture of operational losses, among others.
This has made a significant contribution to the Bank consistently achieve its strategic and operational goals, by providing knowledge of the exposure to assumed operational risks and the controlled environment, maintaining the Bank’s low-risk profile and ensuring the sustainable development of its operations.
The Bank highlights:
• Mandatory training for all Banco Santander employees through e-learnings ("NetCursos"), addressing the issue of operational risks and business continuity;
• The creation, dissemination and maintenance of Instruction Manuals, promoting corporate values and commitment;
• Coordination of the annual process for projecting losses caused by operational risks, defining action plans to reduce these losses and for accountability;
• Development of key risk indicators, aiming to ensure absolute and relative analyses based on volumetric and market analysis;
BANCO SANTANDER (BRASIL) S.A.
NOTES TO THE CONSOLIDATED FINANCIAL STATEMENTS
(Thousands of Brazilian Reais - R$ - unless otherwise stated)
• Composition of lines of defense creating new functions for the role of operational risk representative: "Coordinator" and "Coordinator Assist" Operational Risk covering the perimeter of RO and "experts" in cases where the operational risk is transverse to the organization.
d.4) Communication Policy
The Operational Risks Control area is part of Santander’s governance structure and produces a series of specific monthly reports for management detailing events that occurred, the main activities undertaken, and the corrective and precautionary action plans identified and monitored, ensuring transparency and providing knowledge for governance forums.
Annually, it prepares the Management Report and Control of Operational, Technological Risk , the Management of Business Continuity and the Evaluation of Internal Controls. Which is presented to the Bank’s Board of Director.
Additional information can be obtained from the Bank’s Social and Annual Reports on its website.
e) Reputational Risk
e.1) Reputational Risk
The reputational risk is defined as a risk of a negative economic impact, current and potential, due to a perception unfavorable of the Bank by its employees, clients, shareholders/investors and society in general.
The reputational risk may arise from multiple sources and, in many cases, is derived from other risk events. In general, these sources might be related to the business and other support activities that are realized by the Bank, the economic context, social or politic, or even by other events arising from other competitors that might affect the Bank.
e.2) Compliance
It is defined as legal risk, of regulatory sanctions, financial loss or reputation that an institution may suffer as a result of failures in the compliance with laws, rules, ethics and conduct codes and good bank practices. The compliance risk management has the goal of being preventive and includes the monitoring, educative processes, Consulting, risk evaluation and corporative communication related to the rules and legislation applicable to each business department.
e.3) Directives
a. Compliance principles – Ethics and Conduct in the Securities Markets
The Bank’s ethical principles and conduct parameters are established in internal policies which are made available to all employees. Conduct Code in the Securities Markets and its formal acknowledgement is mandatory to all staff working close to securities markets. Proper communication channels are in place to clarify doubts and complaints from employees, the monitoring and controlling of these information are conducted in a way that adherence to the rules established is secured.
b. Money Laundering Prevention
The Bank’s money Laundering Prevention policies and terrorism financing prevention are based on the knowledge and rigorousness of the acceptance of new clients, complemented by the continuous scrutiny of all transactions where the Bank are involved in. The importance given to the theme is reflected on the direct involvement of management, namely the Operational Money Laundering Prevention and Compliance Committee, which meets each month to deliberate on issues regarding the theme and to be directly involved with new clients acceptance and suspicious transactions reporting.
c. New products and services and suitability
All new products and services are debated/analyzed internally at various levels until their risks have been fully mitigated, and subsequently approved by the Commercialization Local Committee (CLC), composed of Bank executives. After review and approval, the new products and services are monitored trying to identify them so timely events that may pose reputational risk, which if identified, are reported to the CLC.
f) Compliance with the new regulatory framework
The Banco Santander has assumed a firm commitment to the principles underlying the “Revised Framework of International Convergence of Capital Measurement and Capital Standards” (Basel II). This framework allows entities to make internal estimates of the capital they are required to hold in order to safeguard their solvency against events caused by various types of risk. As a result of this commitment, the Bank has devoted all the human and material resources required to ensure the success of the Basel II implementation plan. For this purpose, a Basel II team was created in the past, consisting of qualified professionals from the Bank’s different departments: mainly Finance, Risks, Technology and Operations, Internal Audit −to verify the whole process, as the last layer of control at the entity−, and Business −particularly as regards the integration of the internal models into management. Additionally, specific work teams have been set up to guarantee the proper management of the most complex aspects of the implementation.
BANCO SANTANDER (BRASIL) S.A.
NOTES TO THE CONSOLIDATED FINANCIAL STATEMENTS
(Thousands of Brazilian Reais - R$ - unless otherwise stated)
Supplementing the efforts of the Basel II operating team, the Bank management has displayed total involvement from the very beginning. Thus, the progress of the project and the implications of the implementation of the New Capital Accord by the Banco Santander have been reported to the management committee and to the board of directors on a regular basis.
In the specific case of credit risk, the implementation of Basel II entails the recognition, for regulatory capital purposes, of the internal models that have been used for management purposes.
The Bank intends to apply, over the next five years, the advanced internal ratings-based (AIRB) approach under Basel II for substantially all of its subsidiaries, until the percentage of net exposure of the loan portfolio covered by this approach is close to 100%.
The additional capital requirements derived from the self-assessment process (Pillar II) should be compensated by the risk profile that characterizes the Bank’s business activities (low average risk), due to its focus on Commercial Bank (small and medium-sized enterprises and Individuals) and the diversification of the business. The Pillar 2 which considers the impact of risks not addressed under Pillar I (regulatory capital) and the benefits arising from the diversification among risks, businesses and geographical locations.
Regarding the other risks addressed under Pillar I of Basel II, Banco Santander is developing internal models for market risk and will remain using the standardized method for operational risk, since it considers the premature use of advanced models (AMA) for this purpose . Regarding the Market Risk, Banco Santander presented his candidacy in the second half of 2011, pending approval with the regulators for the use of internal models for calculating regulatory capital.
Pillar II is another significant line of action under the Basel Corporate Framework. In addition to the methodology supporting the economic capital model review and strengthening, the technology was brought into line with the platform supporting Pillar I, so that all the information on credit risk will come from this source.
Besides the Basel II implementations, Banco Santander complies with the new regulations of Basel III, according to the standards issued by Bacen.
According to the definition proposed by the Basel Committee (Basel III), Credit Valuation Adjustment (CVA) is an adjustment to the fair value of derivative financial instruments in order to measure the credit risk of a counterparty. Thus, the CVA depends on the credit spread of the counterparty, as well as the market risk factors that drives the values of the derivatives and, therefore, their exposure. In an analytical way, the CVA can be defined by the following expression:
CVA = EE * PD * DF * LGD(1)
(1) EE=Expected Exposure; PD=Probability of Default; DF=Discount Factor; LGD=Loss Given Default
Expected Exposure (EE) is the future exposure of the derivative based on the counterparty’s market risk. The probability of default (PD) is calculated based on credit spreads and is also marked to market. The discount factor (DF) is the factor that brings to the present value the projected exposure weighted by its respective probability of default. A Loss Given Default (LGD) is the estimated loss in the event of a credit.
f.1) Internal validation of risk models
"Internal validation is a pre-requisite for the supervisory validation process by Basel II implementation. A specialized team of the Entity, with sufficient independence, obtains a technical opinion on the adequacy of the internal models for the intended internal or regulatory purposes, and concludes on their usefulness and effectiveness. This team must also assess whether the risk management and control procedures are adequate for the Entity’s risk strategy and profile.
In addition to the regulatory requirement compliance, the internal validation department provides an essential support to the risk committee and management, as they are responsible for ensuring that appropriate procedures and systems are in place to monitor and control the entity’s risks. In this case, the internal validation area is responsible for providing a qualified and independent opinion so that the responsible authorities decide on the authorization of the use of models (for management purposes as well as regulatory use).
Internal model validation at Banco Santander encompasses credit risk models, market risk models, ALM, pricing models, stress test models, the economic capital model and other models related to the exercise of ICAAP. The scope of the validation includes not only the more theoretical or methodological aspects, but also the technology systems and the quality of the data they provide, on which their effective operation relies, and, in general, all the relevant aspects of advanced risk management (controls, reporting, uses, involvement of management, etc.). Therefore, the goal of internal validation is to review quantitative, qualitative, technological and corporate governance related to regulatory and management aspects concerning the model risk control.
Among the main functions of the Internal Model Validation department are the following:
i. Establish general validation principles, conducting an independent evaluation process including (I) data quality, (II) use of the methodology and (III) functioning of the models;
BANCO SANTANDER (BRASIL) S.A.
NOTES TO THE CONSOLIDATED FINANCIAL STATEMENTS
(Thousands of Brazilian Reais - R$ - unless otherwise stated)
ii. Propose documents and model validation guides;
iii. Evaluate the methodology and data used in the development of the model and challenge the model and its use, stating the implications and limitations of the model, as well as the associated risks;
iv. Issue a technical opinion on the adequacy of internal models for the intended internal and regulatory effects, concluding on their usefulness and effectiveness; and
v. Provide essential support to risk committees and management of the Bank, through a qualified and independent opinion for responsible decision-making on the authorization of the use of models (for management purposes as well as regulatory use).
It is important to note that Banco Santander’s internal validation function is fully consistent with the independent validation criteria for advanced approach issued by the Basel Committee, the European supervisor ‘home regulator’ (Banco de España and the European Central Bank) and the Bacen in compliance with the rules Circular 3,648 dated March 4, 2013 (Chapter III), Circular Letter 3,565 of September 6, 2012 and Circular 3,547 of July 2011. In this case, the Bank maintains a Segregation of functions between internal validation and internal audit, which is the last layer of Bank control validation.
The Internal Audit is responsible for evaluating and reviewing the internal validation methodology and work and issues opinions with an effective level of autonomy. Internal Audit (third line of defense), as the ultimate control function in the Group, should (i) periodically assess the adequacy of policies, methods and procedures and (ii) confirm that they are effectively implemented in the management .
f.2) Capital Management
Capital management considers the regulatory and economic aspects and its objective is to achieve an efficient capital structure in terms of cost and compliance, meeting the requirements of the regulatory authorities and supporting to accomplish the goals of the classification of rating agencies and investors’ expectations. Details regarding the capital management process can be found at www.ri.santander.com.br Corporate Governance -> Risk Management -> Risk and Capital Management Structure.
g) Economic capital
g.1) Main objectives
The development of economic capital models in finance aims to solve a fundamental problem of regulatory capital, Sensitivity Risk.
In this context, the economic capital models are essentially designed to generate risk-sensitive estimative, allowing greater precision in risk management, as well as better allocation of economic capital by business units of Banco Santander.
The Banco Santander has directed efforts to build a model of robust and integrated economic capital to the business management.
The main objectives of the structure of economic capital of the Banco Santander are:
1 - Consolidate Pillar I and other risks which affect business in a single quantitative model, and determine estimates of capital by establishing correlations between different risks;
2 - Quantify and monitor different types of variations in risk;
3 - Distribute capital consumption between the different portfolios and manage the efficiency of return on capital (RORAC);
4 - Estimating the Economic Value Added for each business unit. Economic profit must exceed the cost of the Bank’s capital;
5 - Accordance with the regulation in locations where the Bank operates in the review process of Pillar II by supervisors.
g.2) The Economic Capital Model
In calculating the economic capital, it is the Bank’s definition of losses to be covered. Thus, it is used a confidence interval necessary to ensure business continuity. The confidence interval for the Banco Santander is 99.90% higher than required by Basel II.
The risk profile in Brazil is distributed by Credit risk, Market, ALM, Business, Operations and tangible assets. However, to successfully anticipate the changes proposed in Basel III, new risks have been incorporated to model: Intangibles, pension funds (defined benefit) and deferred tax assets, which allow the Bank to adopt a position even more conservative and prudent.
BANCO SANTANDER (BRASIL) S.A.
NOTES TO THE CONSOLIDATED FINANCIAL STATEMENTS
(Thousands of Brazilian Reais - R$ - unless otherwise stated)
| % Capital | 2017 | 2016 | 2015 |
| Risk Type | New Methodology | New Methodology | New Methodology |
| Credit | 70% | 62% | 56% |
| Market | 4% | 5% | 4% |
| ALM | 4% | 9% | 9% |
| Business | 8% | 8% | 8% |
| Operational | 6% | 6% | 5% |
| Fixed Assets | 2% | 2% | 1% |
| Intangible Assets | 1% | 1% | 6% |
| Pension Funds | 1% | 1% | 2% |
| Deferred Tax Assets | 4% | 6% | 9% |
| TOTAL | 100% | 100% | 100% |
Still, for being a commercial Bank, credit is the main source of risk in Banco Santander and the evolution of this portfolio is a leading factor for oscillation.
Banco Santander periodically evaluates the level and evolution of RORAC of the main business units. The RORAC is the quotient of the profit generated on allocated capital, using the following formula:
RoRAC=Profit/Economic Capital
Banco Santander also makes the planning of capital in order to obtain future projections of economic and regulatory capital. The estimative obtained for the Bank are incorporated to different scenarios consistently, including its strategic objectives (organic growth, M & A, payout ratio, credits, etc.). Possible management strategies leading to optimize capital and solvency return of the Bank are identified.
RoRAC
Banco Santander has used the RORAC, with the following objectives:
1 – Analyze and set a minimum price for operations (admission) and clients (monitoring).
2 – Estimate capital consumption of each client, economic groups, portfolio or business segment, in order to optimize the allocation of economic capital, maximizing the efficiency of the Bank.
3 – Measure and monitor business performance.
To evaluate the operations of global clients, the calculation of economic capital considers some variables used in the calculation of expected and unexpected losses.
Among these variables are:
1 – Counterparty rating;
2 – Maturity;
3 – Guarantees;
4 – Type of financing;
The return on capital is determined by the cost of capital. To create value for shareholders, the minimum return operation must exceed the cost of capital of Banco Santander.
BANCO SANTANDER (BRASIL) S.A.
NOTES TO THE CONSOLIDATED FINANCIAL STATEMENTS
(Thousands of Brazilian Reais - R$ - unless otherwise stated)
APPENDIX I – RECONCILIATION OF SHAREHOLDERS’ EQUITY AND NET INCOME - BRGAAP vs IFRS
The table below presents a conciliation of stockholders’ equity and net income attributed to the parent between standards adopted in Brazil (BRGAAP) and IFRS, with the conceptual description of the main adjustments:
| Thousand of Reais | Note | 2017 | 2016 | 2015 |
| Shareholders’ equity attributed under to the Parent Brazilian GAAP | | 59,499,954 | 57,771,524 | 54,819,073 |
| IFRS adjustments, net of taxes, when applicable: | | | | |
| Reclassification of financial instruments at fair value through profit or loss | j | 18,301 | 643 | |
| Reclassification of available-for-sale financial instruments" | j | 34,818 | 23,180 | |
| Impairment on loans and receivables | a | (71,091) | 124,787 | 132,878 |
| Category transfers | b | 351,132 | 608,897 | 704,519 |
| Deferral of financial fees, commissions and inherent costs under effective interest rate method | c | 664,204 | 297,720 | 138,314 |
| Reversal of goodwill amortization | d | 26,592,852 | 25,122,573 | 23,344,320 |
| Realization on purchase price adjustments | e | 702,436 | 778,882 | 798,776 |
| Recognition of fair value in the partial sale in subsidiaries | f | 112,052 | 112,052 | 112,052 |
| Option for Acquisition of Equity Instrument | g | (1,287,240) | (1,017,000) | (1,017,000) |
| Goodwill acquisition Santander Services (Santusa) | h | (298,978) | | |
| Others | | 332,267 | 263,797 | 367,290 |
| Shareholders’ equity attributed to the parent under IFRS | | 86,650,707 | 84,087,055 | 79,400,222 |
| Non-controlling interest under IFRS | | 436,894 | 725,504 | 435,062 |
| Shareholders’ equity (including non-controlling interest) under IFRS | | 87,087,601 | 84,812,559 | 79,835,284 |
| Thousand of Reais | Note | 2017 | 2016 | 2015 |
| Net income attributed to the Parent under Brazilian GAAP | | 7,996,577 | 5,532,962 | 6,998,196 |
| IFRS adjustments, net of taxes, when applicable: | | | | |
| Reclassification of financial instruments at fair value through profit or loss | j | 18,775 | 7,960 | |
| Reclassification of available-for-sale financial instruments" | j | (46,160) | (39,234) | |
| Impairment on loans and receivables | a | (195,878) | (8,091) | 4,798 |
| Category transfers | b | (219,829) | (45,314) | |
| Deferral of financial fees, commissions and inherent costs under effective interest rate method | c | 366,484 | 148,450 | 23,534 |
| Reversal of goodwill amortization | d | 1,470,279 | 1,755,750 | 2,783,507 |
| Realization on purchase price adjustments | e | (76,446) | (76,247) | (75,962) |
| Option to Acquire Own Equity Instrument | g | (270,240) | | |
| Others | | (119,498) | 58,327 | 49,667 |
| Net income attributed to the parent under IFRS | | 8,924,064 | 7,334,563 | 9,783,740 |
| Non-controlling interest under IFRS | | 213,984 | 130,355 | 50,086 |
| Net income (including non-controlling interest) under IFRS | | 9,138,048 | 7,464,918 | 9,833,826 |
BANCO SANTANDER (BRASIL) S.A.
NOTES TO THE CONSOLIDATED FINANCIAL STATEMENTS
(Thousands of Brazilian Reais - R$ - unless otherwise stated)
a) Impairment on loans and receivables:
The result refers to the adjustment resulting from the estimate of losses on the loan and receivables portfolio, which was determined based on the history of impairment and other circumstances known at the time of the evaluation, in accordance with guidance provided by IAS 39 "Financial Instruments: Recognition and Measurement". These criteria differ in certain aspects from the criteria adopted under BRGAAP, which uses certain regulatory limits defined by the Central Bank. In the Financial Statements under IFRS, this effect considers the impact related to the provisions of certain debt instruments, which for the purposes of BRGAAP are treated as Securities.
b) Transfer of category
The IAS 39 permits reclassification of the category "available for sale" to "held to maturity" and "available for sale" to "loans and receivables" at any time, provided that the entity has the intention and ability to hold the financial asset in this category. However, for the purpose of local books (BR GAAP), pursuant to art. 5 of BACEN Circular 3,068, the revaluation regarding the classification into categories of securities may only be made when preparing the half-yearly and the yearly financial statements. For purposes of IFRS financial statements of December 2015, Banco Santander reclassified some securities therefore on July 1, 2015 and to Brazilian GAAP purposes due to local requirements mentioned above such change occurred on December 31, 2015. Considering, the measurement effect of other assets that composes different categories between the IFRS and BRGAAP.
c) Deferral of financial fees, commissions and other costs under effective interest rate method:
Under IFRS, in accordance with IAS 39 “Financial Instruments: Recognition and Measurement”, financial fees, commissions and other costs that are integral part of effective interest rate of financial instruments measured at amortized cost are recognized in the income statement over the term of the corresponding contracts. Under BRGAAP these fees and expenses are recognized directly as income when received or paid.
d) Reversal of goodwill amortization:
Under BRGAAP, goodwill is amortized systematically over a period up to 10 years and additionally, the goodwill recorded is measured annually or whenever there is any indication that the asset may be impaired. Under IFRS, in accordance with IAS 38 “Intangible Assets”, goodwill is not amortized, but instead, is tested for impairment, at least annually, and whenever there is an indication that the goodwill may be impaired; comparing its recoverable amount with its carrying value. The tax amortization of goodwill of Banco ABN Amro Real SA represents a difference between book and tax basis of a permanent nature and definitive as the possibility of future use of resources to settle a tax liability is considered remote by management, supported by the opinion of expert external advisors. The tax amortization of goodwill is permanent and definitive, and therefore does not apply to the recognition of a deferred tax liability in accordance with IAS 12, on temporary differences.
e) Realization on purchase price adjustments:
As part of the allocation of the purchase price related to the acquisition of Banco Real, following the requirements of IFRS 3, the Bank has recognized the assets and liabilities of the acquiree to fair value, including identifiable intangible assets with finite lives. Under BRGAAP, in a business combination, the assets and liabilities are kept at their book value. This purchase price adjustment relates substantially to the following items:
• The allocation related to the value of assets in the loan portfolio. The initial recognition of value of the loans at fair value, adjustment to the yield curve of the loan portfolio in comparison to its nominal value, which is recognized by its average realization period.
• The amortization of the identified intangible assets with finite lives over their estimated useful lives.
f) Recognition of fair value in the partial disposal of investments in subsidiaries
Under IFRS, in accordance with IFRS 10 "Consolidated Financial Statements" on partial disposal of a permanent investment, fair value is recognized over the remaining portion (Webmotors). Under BRGAAP, this type of operation, ongoing participation is registered by its book value.
g) Option for Acquisition of Equity Instrument
Within the context of transaction, Banco Santander has granted to the members of Getnet S.A. and Banco Olé Consignado a put option over all shares of Getnet S.A. and Banco Olé Consignado held by them. The overall out in IAS 32, a financial liability was recognized for this commitment, with a specific charge in a heading in stockholders’ equity in the amount of R$950 million and R$67 million, respectively. In 2017, an expense in the consolidated statements of income of R$164 million, was recognized in Getnet S.A. and Banco Olé Consignado.
BANCO SANTANDER (BRASIL) S.A.
NOTES TO THE CONSOLIDATED FINANCIAL STATEMENTS
(Thousands of Brazilian Reais - R$ - unless otherwise stated)
h) Santander Serviços goodwill (Santusa)
According to the IFRS, in line with IFRS 3 "Business Combination", when the owner acquires more shares or other equity instruments of an entity already controlled, it shall consider such amount as an equity reduction. According to the BRGAAP this amount shall be registered in the asset as goodwill or discount on the acquisition of the investment, which is the difference between the acquisition cost and the equity amount of the shares.
i) Reclassification of financial instruments at fair value through profit or loss
Under BRGAAP, all loans, financing and deposits are recorded at amortized cost. In IFRS, in accordance with IAS 39 "Financial Instruments: Recognition and Measurement", financial assets may be measured at fair value and included in the category "Other financial assets at fair value through profit or loss", in order to eliminate or significantly reduce accounting mismatches ( accounting mismatch) of recognition or measurement derived from the measurement of assets or liabilities or from the recognition of gains or losses on these assets / liabilities on a number of bases, which are managed and their performances valued at fair value. Accordingly, the Bank classified loans, financing and deposits that meet these parameters as "fair value through profit or loss", as well as certain debt instruments classified as "available for sale" in BRGAAP. The Bank opted for this classification base in IFRS, since it eliminates an accounting mismatch in the recognition of revenues and expenses.
j) Reclassification of available-for-sale financial instruments
According to the BRGAAP, the Bank registers some investments, for example, debt instruments initially measured at amortized cost and equity instruments at cost. At the time of this balance sheet, the management reviewed the managing strategy of its investments and according to Bacen Circular 3.068, the debt instruments were reclassified to "trading" measured at fair value with changes in the income statement. According to the IFRS, the Bank is classifying this investments as available for sale measuring them at fair value with changes in "other comprehensive income", in line with IAS 39 "Financial Instruments: Recognition and Measurement", which does not allow the reclassification of any financial instrument to fair value with changes in the income statement after the initial recognition.
BANCO SANTANDER (BRASIL) S.A.
NOTES TO THE CONSOLIDATED FINANCIAL STATEMENTS
(Thousands of Brazilian Reais - R$ - unless otherwise stated)
APPENDIX II – STATEMENTS OF VALUE ADDED
The following Statements of value added is not required under IFRS but being presented as supplementary information as required by Brazilian Corporate Law for publicly-held companies, and has been derived from the Bank´s consolidated financial statements prepared in accordance with IFRS.
| | | 2017 | | 2016 | | 2015 |
| Thousand of Reais | | | | | | |
| Interest and similar income | 71,418,349 | | 77,146,077 | | 69,870,200 | |
| Net fee and commission income | 12,721,868 | | 10,977,596 | | 9,483,509 | |
| Impairment losses on financial assets (net) | (12,338,300) | | (13,301,445) | | (13,633,989) | |
| Other income and expense | (3,043,565) | | (751,727) | | (3,867,959) | |
| Interest expense and similar charges | (36,471,860) | | (46,559,584) | | (38,533,089) | |
| Third-party input | (6,728,881) | | (5,804,939) | | (7,061,296) | |
| Materials, energy and others | (495,913) | | (510,961) | | (520,831) | |
| Third-party services | (5,107,077) | | (4,589,468) | | (4,632,346) | |
| Impairment of assets | (456,711) | | (114,321) | | (1,220,645) | |
| Other | (669,180) | | (590,189) | | (687,474) | |
| Gross added value | 25,557,611 | | 21,705,978 | | 16,257,376 | |
| Retention | | | | | | |
| Depreciation and amortization | (1,662,247) | | (1,482,639) | | (1,490,017) | |
| Added value produced | 23,895,364 | | 20,223,339 | | 14,767,359 | |
| Added value received from transfer | | | | | | |
| Investments in affiliates and subsidiaries | 71,551 | | 47,537 | | 116,312 | |
| Added value to distribute | 23,966,915 | | 20,270,876 | | 14,883,671 | |
| Added value distribution | 15,540,106 | | | | | |
| Employee | 7,908,746 | 33.0% | 7,378,374 | 36.4% | 6,829,965 | 45.9% |
| Compensation | 5,795,579 | | 5,455,374 | | 4,824,615 | |
| Benefits | 1,421,910 | | 1,397,711 | | 1,300,788 | |
| Government severance indemnity funds for employees -FGTS | 413,871 | | 352,939 | | 391,608 | |
| Other | 277,386 | | 172,350 | | 312,954 | |
| Taxes | 6,131,544 | 25.6% | 4,659,989 | 23.0% | (2,527,787) | -17.0% |
| Federal | 5,481,969 | | 4,101,629 | | (3,023,224) | |
| State | 1,260 | | 717 | | 659 | |
| Municipal | 648,315 | | 557,643 | | 494,778 | |
| Compensation of third-party capital -rental | 788,577 | 3.3% | 767,595 | 3.8% | 747,667 | 5.0% |
| Remuneration of interest on capital | 9,138,048 | 38.1% | 7,464,918 | 36.8% | 9,833,826 | 66.1% |
| Dividends and interest on capital | 6,300,000 | | 4,550,000 | | 6,200,000 | |
| Profit Reinvestment | 2,624,064 | | 2,784,563 | | 3,583,740 | |
| Profit (loss) attributable to non-controlling interests | 213,984 | | 130,355 | | 50,086 | |
| Total | 23,966,915 | 100.0% | 20,270,876 | 100.0% | 14,883,671 | 100.0% |