UNITED STATES
SECURITIES AND EXCHANGE COMMISSION
Washington, D.C. 20549
FORM 6-K
REPORT OF FOREIGN PRIVATE ISSUER PURSUANT TO RULE 13a-16 OR 15d-16 UNDER THE
SECURITIES EXCHANGE ACT OF 1934
For the month of October, 2016
Commission File Number: 001-34476
BANCO SANTANDER (BRASIL) S.A.
(Exact name of registrant as specified in its charter)
Avenida Presidente Juscelino Kubitschek, 2041 and 2235
Bloco A – Vila Olimpia
São Paulo, SP 04543-011
Federative Republic of Brazil
(Address of principal executive office)
Indicate by check mark whether the registrant files or will file annual reports under cover of Form 20-F or Form 40-F:Form 20-F ___X___ Form 40-F _______ Indicate by check mark if the registrant is submitting the Form 6-K in paper as permitted by Regulation S-T Rule 101(b)(1):
Yes _______ No ___X____
Indicate by check mark if the registrant is submitting the Form 6-K in paper as permitted by Regulation S-T Rule 101(b)(7):
Yes _______ No ___X____
Indicate by check mark whether by furnishing the information contained in this Form, the Registrant is also thereby furnishing the information to the Commission pursuant to Rule 12g3-2(b) under the Securities Exchange Act of 1934:
Yes _______ No ___X____
If “Yes” is marked, indicate below the file number assigned to the registrant in connection with Rule 12g3-2(b): N/A

| CONTENTS |
CONTENTS
MANAGERIAL ANALYSIS OF RESULTS – BR GAAP
| |
| |
| |
| |
KEY CONSOLIDATED DATA | 03 |
| |
sTRATEGY | 04 |
| |
EXECUTIVE SUMMARY | 05 |
| |
SANTANDER BRASIL RESULTS | |
MANAGERIAL INCOME STATEMENT | 06 |
BALANCE SHEET | 10 |
| |
OUR SHARES | 19 |
| |
RATINGS | 20 |
| |
ADDITIONAL INFORMATION – BALANCE SHEET AND MANAGERIAL FINANCIAL STATEMENTS | 21 |
| |
| |
ACCOUNTING AND MANAGERIAL RESULTS RECONCILIANTION | 24 |
| |
| |
| |
KEY CONSOLIDATED DATA |
|
KEY CONSOLIDATED DATA
All information, indicators and comments relating to the Income Statement in this report consider the managerial results, except where indicated otherwise.The reconciliation with the accounting results can be found on pages 24 and 25.It is worth noting that, as of August 1st, the financial statements have consolidated the results and balance sheet of Banco PSA (for further information, please refer to page 5).
| | | | | | | | |
MANAGERIAL¹ ANALYSIS - BR GAAP | | 9M16 | 9M15 | Var. | 3Q16 | 2Q16 | Var. |
| | | 9M16x9M15 | | | 3Q16x2Q16 |
| | | | | | | |
RESULTS (R$ million) | | | | | | | |
Net interest income | | 23,675 | 22,251 | 6.4% | 8,267 | 7,808 | 5.9% |
Fee and commission income | | 9,856 | 8,657 | 13.9% | 3,437 | 3,328 | 3.3% |
Allowance for loan losses | | (7,776) | (6,898) | 12.7% | (2,837) | (2,515) | 12.8% |
General Expenses² | | (13,369) | (12,691) | 5.3% | (4,535) | (4,424) | 2.5% |
Managerial net profit³ | | 5,350 | 5,016 | 6.7% | 1,884 | 1,806 | 4.3% |
Accounting net profit | | 3,996 | 5,831 | -31.5% | 1,436 | 1,347 | 6.5% |
| | | | | | | |
BALANCE SHEET (R$ million) | | | | | | | |
Total assets | | 661,186 | 702,407 | -5.9% | 661,186 | 655,194 | 0.9% |
Securities | | 153,135 | 154,262 | -0.7% | 153,135 | 149,988 | 2.1% |
Loan portfolio | | 247,324 | 261,980 | -5.6% | 247,324 | 244,284 | 1.2% |
Individuals | | 88,440 | 82,786 | 6.8% | 88,440 | 86,826 | 1.9% |
Consumer finance | | 33,868 | 34,057 | -0.6% | 33,868 | 31,961 | 6.0% |
Small and Medium Enterprises | | 32,076 | 35,636 | -10.0% | 32,076 | 32,274 | -0.6% |
Corporate | | 92,940 | 109,501 | -15.1% | 92,940 | 93,222 | -0.3% |
Expanded Credit Portfolio4 | | 310,965 | 331,922 | -6.3% | 310,965 | 308,377 | 0.8% |
Funding from Clients5 | | 291,726 | 287,660 | 1.4% | 291,726 | 287,840 | 1.3% |
Equity6 | | 58,695 | 52,976 | 10.8% | 58,695 | 56,779 | 3.4% |
| | | | | | | |
PERFORMANCE INDICATORS (%) | | | | | | | |
Return on average equity excluding goodwill6 - annualized | | 12.9% | 12.8% | 0.1 p.p. | 13.1% | 13.0% | 0.1 p.p. |
Return on average asset excluding goodwill6 - annualized | | 1.1% | 1.1% | 0.0 p.p. | 1.1% | 1.1% | 0.0 p.p. |
Efficiency Ratio7 | | 48.4% | 49.3% | -0.9 p.p. | 46.2% | 48.5% | -2.2 p.p. |
Recurrence Ratio8 | | 73.7% | 68.2% | 5.5 p.p. | 75.8% | 75.2% | 0.6 p.p. |
BIS ratio9 | | 17.6% | 15.8% | 1.8 p.p. | 17.6% | 17.7% | -0.1 p.p. |
| | | | | | | |
PORTFOLIO QUALITY INDICATORS (%) | | | | | | | |
Delinquency ratio (over 90 days) | | 3.5% | 3.2% | 0.3 p.p. | 3.5% | 3.2% | 0.3 p.p. |
Delinquency ratio (over 60 days) | | 4.4% | 4.0% | 0.3 p.p. | 4.4% | 4.8% | -0.4 p.p. |
Coverage ratio (over 90 days) | | 198.1% | 185.1% | 13.0 p.p. | 198.1% | 209.3% | -11.2 p.p. |
| | | | | | | |
OTHER DATA | | | | | | | |
Assets under management - AUM (R$ million)10 | | 240,304 | 187,085 | 28.4% | 240,304 | 226,179 | 6.2% |
Branches | | 2,255 | 2,255 | - | 2,255 | 2,266 | (11) |
PABs (mini branches) | | 1,153 | 1,181 | (28) | 1,153 | 1,173 | (20) |
Own ATMs | | 13,957 | 14,231 | (274) | 13,957 | 14,127 | (170) |
Shared ATMs | | 19,456 | 17,912 | 1,544 | 19,456 | 18,935 | 521 |
Total Customers (thousand) | | 33,980 | 32,054 | 1,926 | 33,980 | 33,371 | 608 |
Employees | | 48,024 | 50,519 | (2,495) | 48,024 | 48,877 | (853) |
| | | | | | | |
| | | | | | | | |
1. Excludes 100% of the goodwill amortization expense, the tax hedge effect and others as mentioned on pages 24 and 25. |
2. Administrative Expenses exclude 100% of the goodwill amortization expense and personnel expenses include profit sharing. |
3. Managerial net profit corresponds to the accounting net profit, excluding extraordinary results and considering 100% of reversal of goodwill amortization expense ocurred in the period. The goodwill amortization expense in 9M16 was R$ 1,354 million, R$ 2,342 million in 9M15, R$ 448 million in 3Q16 and R$ 459 million in 2Q16. |
4. Includes other credit risk transactions with clients ("debenture", FIDC, CRI, floating rate notes, promissory notes, acquiring activities related assets and guarantees). |
5. Includes savings, demand deposits, time deposits, debenture, LCA, LCI, Treasury Notes (Letras Financeiras - LFT) and Certificates of Structured Operations (COE). |
6. Excludes 100% of the goodwill (net of amortization) that in 3Q16 was R$ 2,625 million, R$ 3,071 million in 2Q16 and R$ 4,625 million in 3Q15. |
7. Efficiency Ratio: General Expenses / (Net Interest Income + Fee and Commission Income + Tax Expenses + Other Operating Income/Expense). |
8. Recurrence: Fee and Commission Income / General expenses. |
9. BIS Ratio as per Brazilian Central Bank criterion. From 2015 on, considers the prudential conglomerate. |
10. According to Anbima (Brazilian Financial and Capital Markets Association) criterion. |
| STRATEGY |
STRATEGY Santander Brasil is a universal bank focused on retail services. The Bank is convinced that the only way to grow in a recurring and sustainable manner is by providing excellent services that enhance the satisfaction of our current customer base, leading to increased levels of engagement and attract new clients. To manifest our vision we strive to be a Simple, Personal and Fair bank. Our strategy is based on a long-term outlook, focusing on efficiently executing the following priorities: ● Increase customer preference and engagement by offering targeted products and services that are simple, modern and efficient, which, through a multi-channel platform, seek to maximize client satisfaction. ● Improve recurrence and sustainability by growing business with more diversified revenue, seeking a balance between credit, funding and services. At the same time, maintaining efficient cost management and rigorous control over risks. ● Be disciplined with capital and liquidity to preserve our strength, adapt to regulatory changes and take advantage of growth opportunities. ● Increase productivity through an intense agenda of commercial improvements that allows the Bank to offer a complete portfolio of services. This strategy prioritizes close and long-lasting relationships with our shareholders,as well as alignment with the country’s social and economic development agenda. In the third quarter of 2016,we continued to make progress on several strategic fronts, including: ● In line with our digital strategy, at the end of September the number of clients making use of biometrics exceeded the 4.4 million mark, while digital channel transactions accounted for 76% of total transactions. Factoring in the contribution from e-commerce, our product sales via digital channels have been experiencing exponential growth. This quarter was also highlighted by another example of our pioneering approach with the launch of Samsung Pay, which allow clients to undertake contact-free payments. ● Through Getnet, we unveiled an acquiring solution for individual clients:Conta Conecta com a Vermelhinha, an alternative that combines a low-cost POS with a Santander current account. ● We also implemented a new commercial model at Santander Financiamentos – “+negócios” is an easier-to-use and more intuitive digital platform which transforms customers’ experience by streamlining and simplifying processes, in addition to strengthening our positioning as a digital bank. The implementation of the new model in stores and branches will be concluded in mid-November. | | ● Since August, ContaSuper, an entirely digital and practical model, has also been available at Santander’s branch network, consistent with our goal of continuously improving customers’ experience. This offering complements our other products and represents a differential to attract new customers. ● In order to diversify revenues and boost the “Consórcio”1 business, this quarter Santander launched “consórcio” – for real estate properties, another financial solution designed to meet our customers’ needs and help build enduring loyalty. ● In the SME segment, we highlight our franchise performance: our number of partnerships jumped from 57 in January to 162 at the close of September, expanding our activities with Brazil’s leading franchise networks. ● In regard to Global Corporate Banking (GCB), we maintained our leadership in financial advisory for project finance in Brazil, according to the latest consolidated ranking published by ANBIMA, the Brazilian Financial and Capital Markets Association, and continued to head the foreign exchange market. We were also ranked in first place for the biggest M&A transactions of the year by Bloomberg. ● For the first time, Santander was included in the “Best Companies to Work for” list published by the consulting firm Great Place to Work (GPTW). The list, which is published every year, is considered a benchmark for the country’s best work environments and reflects the engagement and commitment of our employees.
Santander’s leadership in sustainability remains unscathed: its Microcredit program occupies a prominent position among private banks and its Universities program, continues to actively contribute to the progress of education in the country via the distribution of study scholarships. This quarter, Santander Brasil played an important role in maintaining the Santander Group presence in the Dow Jones Sustainability Index (DJSI) for another year; the Group was ranked 6th (versus 11th in 2015) among financial institutions out of a total of 316 firms that compose the index.
1A purchasing system in which a group of people who want to buy a certain kind of asset (usually a vehicle or real estate property) pool together to fund the purchase by making instalment payments over a previously agreed period of time. Each member of the pool has the chance of receiving the asset before all payments are made either by winning a group lottery or by making part of the payment in advance. |
EXECUTIVE SUMMARY |
|
EXECUTIVE SUMMARY Managerial net profit¹ totaled R$ 5,350 million in the first nine months of 2016, up 6.7% in twelve months and 4.3% in three months. Total revenues reached R$ 33,531 million in 9M16, 8.5% higher in twelve months (or R$ 2,623 million) and 5.1% in threemonths. This performance was driven by net interest income and commissions growth, and shows recurring results generation, in line with our strategy of strengthening commercial activities and increasing loyal customers. Allowance for loan losses amounted to R$ 7,776 million, growing 12.7% in twelve months (or R$ 878 million) and 12.8% in three months, reflecting our active risk management. Revenues net of allowance for loan losses moved up by 7.3% in twelve months and 2.9% in three months. General expenses totaled R$ 13,369 million in 9M16, up 5.3% in twelve months (or R$ 678 million) and 2.5% in three months, rising more slowly than annual inflation and underlining our disciplined and efficient approach to cost management. The efficiency ratio reached 48.4% in 9M16, down 0.9 p.p. in twelve months and 2.2 p.p. in three months. The quarterly improvement is explained by the recurring growth in total revenue, thanks to increased customer transactionality. The total credit portfolio stood at R$ 247,324 million in September 2016, a decrease of 5.6%in twelve months (or R$ 14,656 million) and 1.2% higher in three months. The annual comparison was negatively affected by the exchange rate fluctuation in the period.Excluding this effect, the portfolio would have dropped by 2.7% year-on-year in 3Q16.The expanded credit portfolio totaledR$ 310,965 million, down 6.3% intwelve months (or R$ 20,957 million) and up 0.8% in three months. Excluding the effect of the exchange rate fluctuation in twelve months, the expanded credit portfolio would have fallen by 4.1%. Loans toindividuals were the highlight of the portfolio, endingSeptember 2016 atR$ 88,440 million, representing a 6.8% rise in twelve months (or R$ 5,655 million), mainly due to payroll loans,mortgage and credit cards.In the quarter, growth came to 1.9%. The consumer finance portfolio amounted toR$ 33,868 million in September 2016,down0.6% in twelve months (or R$ 189 million) and up 6.0% in threemonths. The annual and quarterly results were impacted by the incorporation of “Banco PSA”. Excluding this effect, the portfolio would have decreased by 5.7% in twelve months and grown by 0.5% in three months, still outperforming the sector. | | The SME portfolio ended September 2016 atR$ 32,076 million, down 10.0% in twelve months (or R$ 3,560 million) and 0.6% in threemonths. The corporate portfolio came toR$ 92,940 million, down 15.1% in twelve months (or R$ 16,561 million) and 0.3% in three months. The annual comparison was adversely affected by the exchange rate fluctuation. Excluding this effect,the corporate portfolio would have fallen by8.8% in the period. Total funding from clients reached R$ 291,726 million in 9M16, up 1.4% in twelve months and 1.3% in three months.Total funding and assets under management stood atR$ 530,909 million, 3.6%higher than9M15 and 2.0% above the previous quarter. Total equity, excluding R$ 2,625 million related to goodwill, was R$ 58,695 million at the end of September. Return on Average Equity (ROAE), adjusted for goodwill, reached 12.9% in 9M16 and 13.1% in the quarter, up 0.1 p.p. in both periods. The BIS ratio stood at 17.6% at the end of September, while Tier I and II capital came to 16.4% and 1.2%, respectively. The coverage ratio (over 90 days) ended September 2016 at 198.1%. RECENT EVENT On August 1st, 2016, commercial activities arising from the partnership between Banco Santander Brasil and Banque PSA Finance (“Banco PSA”) to operate Banco PSA Finance Brasil S.A. were initiated. The operation also includes the acquisition by Santander Brasil of PSA Finance Arrendamento Mercantil S.A. and an interest in PSA Corretora de Seguros e Serviços Ltda.(For more details, please refer to note 37 in the Financial Statements – Corporate Restructuring).
1. Accounting net profit excluding extraordinary events and considering 100% of the reversal of goodwill amortization expenses. |
| SANTANDER BRASIL RESULTS |
MANAGERIAL ANALYSIS OF RESULTS
Next, we present the analysis of the managerial results.
MANAGERIAL FINANCIAL STATEMENTS¹ (R$ million) | | | | | | | |
| 9M16 | 9M15 | Var. | 3Q16 | 2Q16 | Var. |
| | | 9M16x9M15 | | | 3Q16x2Q16 |
| | | | | | | |
Net Interest Income | | 23,675 | 22,251 | 6.4% | 8,267 | 7,808 | 5.9% |
Allowance for Loan Losses | | (7,776) | (6,898) | 12.7% | (2,837) | (2,515) | 12.8% |
Net Interest Income after Loan Losses | | 15,898 | 15,353 | 3.6% | 5,430 | 5,293 | 2.6% |
Fee and commission income | | 9,856 | 8,657 | 13.9% | 3,437 | 3,328 | 3.3% |
General Expenses | | (13,369) | (12,691) | 5.3% | (4,535) | (4,424) | 2.5% |
Personnel Expenses + Profit Sharing | | (6,377) | (5,877) | 8.5% | (2,163) | (2,082) | 3.9% |
Administrative Expenses2 | | (6,991) | (6,813) | 2.6% | (2,371) | (2,341) | 1.3% |
Tax Expenses | | (2,474) | (2,588) | -4.4% | (835) | (823) | 1.4% |
Investments in Affiliates and Subsidiaries | | 1 | 1 | -1.2% | 0 | 0 | n.a. |
Other Operating Income/Expenses | | (3,447) | (2,571) | 34.1% | (1,065) | (1,185) | -10.2% |
Operating Income | | 6,465 | 6,161 | 4.9% | 2,434 | 2,190 | 11.1% |
Non Operating Income | | 40 | 138 | -71.3% | 19 | (5) | n.a. |
Net Profit before Tax | | 6,505 | 6,299 | 3.3% | 2,453 | 2,186 | 12.3% |
Income Tax and Social Contribution | | (1,014) | (1,132) | -10.4% | (486) | (323) | 50.3% |
Minority Interest | | (142) | (151) | -6.2% | (84) | (56) | 49.1% |
Net Profit | | 5,350 | 5,016 | 6.7% | 1,884 | 1,806 | 4.3% |
| | | | | | | | |
1. Excludes 100% of the goodwill amortization expense, the tax hedge effect and others as mentioned on pages 24 and 25. |
2. Administrative Expenses exclude 100% of the goodwill amortization expense. |
NET INTEREST INCOME
Net interest income, including income from financial operations, totaled R$ 23,675 millionin the first nine months of 2016, up 6.4% year-on-year (or R$ 1,424 million) and 5.9% quarter-on-quarter. The quarterly performance shows excellent dynamics, especially in the deposit margin and market transactions. Revenues from loan operations grew 1.9% in twelve months and dropped 0.1% in three months. The twelve-month upturn results from the increase in the average spread, which was more than enough to offset the reduction in the average loan portfolio. The quarterly decline in the average spread is related to the change in the product mix, with a higher share of collateralized products. Revenues from funding increased by 26.9% in twelve months and 20.1% in three months. The strong quarterly performance reflects our focus on customer loyalty and active liability management. The “others” line, which includes the result of the structural interest rate gap, revenue from customers in treasury activities and others, advanced 13.8% in twelve months and 18.5% in three months, thanks to market activities. | | 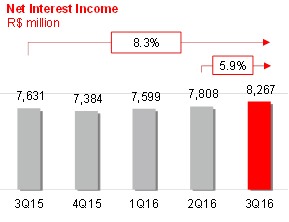 |
SANTANDER BRASIL RESULTS |
|
| | | | | | | | |
NET INTEREST INCOME | | 9M16 | 9M15 | Var. | 3Q16 | 2Q16 | Var. |
(R$ million) | | | | 9M16x9M15 | | | 3Q16x2Q16 |
| | | | | | | |
Net Interest Income | | 23,675 | 22,251 | 6.4% | 8,267 | 7,808 | 5.9% |
Loan | | 16,022 | 15,724 | 1.9% | 5,363 | 5,366 | -0.1% |
Average volume | | 246,268 | 251,596 | -2.1% | 243,559 | 243,772 | -0.1% |
Spread (Annualized) | | 8.7% | 8.4% | 0.31 p.p. | 8.7% | 8.8% | -0.09 p.p. |
Funding | | 2,184 | 1,721 | 26.9% | 847 | 705 | 20.1% |
Average volume | | 219,980 | 217,436 | 1.2% | 223,406 | 218,380 | 2.3% |
Spread (Annualized) | | 1.3% | 1.1% | 0.26 p.p. | 1.5% | 1.3% | 0.18 p.p. |
Others¹ | | 5,469 | 4,806 | 13.8% | 2,058 | 1,737 | 18.5% |
| | | | | | | | |
1. Includes Gains (Losses) on financial transactions and other net interest income. |
FEE AND COMMISSION INCOME
Revenues from fee and commission income amounted to R$ 9,856 million in the first nine months of 2016, up 13.9% in twelve months (R$ 1,199 million) and 3.3% in three months, fueled by our focus on loyalty and increasing profitability. All lines experienced growth in twelve months. In the quarter, some lines were impacted by seasonal factors or specific items such as “Insurance Fees”. The highlights were “Cards”, “Current Account Services” and “Asset Management”.
Commissions from credit cards totaled R$ 2,893 million, up 13.6% in twelve months (or R$ 347 million) and 8.0% in three months, primarily due to higher interchange fees driven by the upturn in revenue.
Current account services fees totaled R$ 1,881 million, up 25.7% in twelve months (or R$ 384 million) and 7.1% in three months, reflecting the continued improvement in customer loyalty and higher transactionality.
Insurance fees were R$ 1,523 million, up 8.8% in twelve months (or R$ 123 million) and down 9.7% in three months. The quarterly change was impacted by the seasonal effect from campaigns conducted in the network during the first half.
Asset management fees totaled R$ 811 million in the same period, up 3.9% in twelve months (or R$ 30 million) and 8.1% in threemonths. The annual increase was chiefly due to the sale of the custody business in the third quarter of 2015. Excluding this effect, that line would have grown 15.4% in twelve months. The strong performance in the quarter basically reflects the increase in funding.
| | | | | | | | |
FEE AND COMMISSION INCOME | | 9M16 | 9M15 | Var. | 3Q16 | 2Q16 | Var. |
(R$ million) | | | | 9M16x9M15 | | | 3Q16x2Q16 |
| | | | | | | |
Cards | | 2,893 | 2,546 | 13.6% | 1,033 | 956 | 8.0% |
Insurance fees | | 1,523 | 1,400 | 8.8% | 492 | 545 | -9.7% |
Current Account Services | | 1,881 | 1,496 | 25.7% | 673 | 629 | 7.1% |
Asset Management | | 811 | 781 | 3.9% | 292 | 271 | 8.1% |
Lending Operations | | 1,056 | 1,019 | 3.6% | 357 | 361 | -1.0% |
Collection Services | | 894 | 749 | 19.4% | 314 | 301 | 4.5% |
Securities Brokerage and Placement Services | | 399 | 383 | 4.1% | 115 | 141 | -18.6% |
Others | | 400 | 283 | 41.2% | 161 | 126 | 27.8% |
Total | | 9,856 | 8,657 | 13.9% | 3,437 | 3,328 | 3.3% |
| | | | | | | | |
| SANTANDER BRASIL RESULTS |
GENERAL EXPENSES (ADMINISTRATIVE + PERSONNEL)
General expenses, including depreciation and amortization, totaled R$ 13,369 million in the first nine months of 2016, posting an increase of 5.3% in twelve months (or R$ 678 million), which is significantly lower than the inflation rate in the same period, thanks to our continued discipline in managing costs. In three months, total general expenses climbed by 2.5%, largely due to higher expenses following the collective bargaining agreement and the incorporation of PSA. Administrative and personnel expenses, excluding depreciation and amortization, reached R$ 12,029 million in 9M16, rising 7.5% in twelve months (or R$ 835 million) and 2.0% over the previous quarter. Personnel expenses, including profit sharing, came to R$ 6,377 million in the first nine months of 2016, advancing 8.5% year-on-year (or R$ 500 million) and 3.9% quarter-on-quarter. The quarterly upturn derived from higher compensation expenses, particularly due to the collective bargaining agreement. Administrative expenses, excluding depreciation and amortization, amounted to R$ 5,652 million in 9M16, up 6.3% (or R$ 335 million) in twelve months and down 0.1% in three months.Depreciation and amortization stood at R$ 1,339 million, down 10.5% in twelve months (or R$ 157 million) and up 7.2% in three months. The efficiency ratio improved to 48.4% in the first nine months of 2016, 0.9 p.p. better in twelvemonths and 2.2 p.p. in three months. This healthy performance was spurred by the increase in revenues and excellent control over expenses. | | 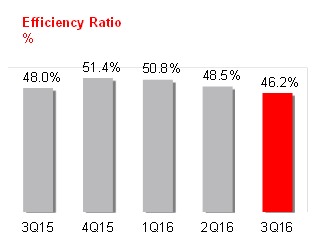 |
| | | | | | | | |
EXPENSES' BREAKDOWN (R$ million) | | 9M16 | 9M15 | Var. | 3Q16 | 2Q16 | Var. |
| | | 9M16x9M15 | | | 3Q16x2Q16 |
| | | | | | | |
Outsourced and Specialized Services | | 1,616 | 1,577 | 2.5% | 548 | 525 | 4.3% |
Advertising, promotions and publicity | | 273 | 262 | 4.6% | 101 | 110 | -7.8% |
Data processing | | 1,162 | 1,052 | 10.5% | 385 | 392 | -1.8% |
Communications | | 366 | 382 | -4.3% | 119 | 125 | -4.9% |
Rentals | | 556 | 542 | 2.6% | 189 | 188 | 0.8% |
Transport and Travel | | 161 | 158 | 2.2% | 53 | 49 | 6.1% |
Security and Surveillance | | 525 | 487 | 8.0% | 173 | 175 | -0.8% |
Maintenance | | 194 | 171 | 12.9% | 66 | 65 | 0.3% |
Financial System Services | | 187 | 181 | 2.9% | 65 | 61 | 7.6% |
Water, Electricity and Gas | | 161 | 156 | 3.2% | 43 | 55 | -21.3% |
Material | | 51 | 58 | -11.3% | 17 | 17 | -1.8% |
Others | | 400 | 292 | 37.0% | 137 | 136 | 1.4% |
Subtotal | | 5,652 | 5,317 | 6.3% | 1,896 | 1,898 | -0.1% |
Depreciation and Amortization1 | | 1,339 | 1,496 | -10.5% | 475 | 443 | 7.2% |
Total Administrative Expenses | | 6,991 | 6,813 | 2.6% | 2,371 | 2,341 | 1.3% |
| | | | | | | |
Compensation² | | 4,084 | 3,689 | 10.7% | 1,402 | 1,324 | 5.8% |
Charges | | 1,119 | 1,121 | -0.2% | 368 | 371 | -0.7% |
Benefits | | 1,092 | 969 | 12.8% | 363 | 361 | 0.7% |
Training | | 53 | 68 | -21.6% | 20 | 18 | 14.4% |
Others | | 28 | 31 | -7.2% | 9 | 8 | 14.8% |
Total Personnel Expenses | | 6,377 | 5,877 | 8.5% | 2,163 | 2,082 | 3.9% |
| | | | | | | |
ADMINISTRATIVE + PERSONNEL EXPENSES (excludes deprec. and amortization) | | 12,029 | 11,194 | 7.5% | 4,060 | 3,980 | 2.0% |
| | | | | | | |
TOTAL GENERAL EXPENSES | | 13,369 | 12,691 | 5.3% | 4,535 | 4,424 | 2.5% |
| | | | | | | | |
1. Excludes 100% of the expenses of goodwill amortization, which in 9M16 was R$ 1,354 million, R$ 2,342 million in 9M15, R$ 448 million in 3Q16 and R$ 459 million in 2Q16. |
2. Includes Profit Sharing. |
SANTANDER BRASIL RESULTS |
|
ALLOWANCE FOR LOAN LOSSES
Allowance for loan losses totaled R$ 7,776 million in the first nine months of 2016, up 12.7% compared to the same period of 2015(or R$ 878 million)and 12.8% in threemonths. The evolution of the allowance for loan losses and credit quality performance are due to our risk management model amid a challenging macro environment.
| | | | | | | | |
ALLOWANCE FOR LOAN LOSSES | | 9M16 | 9M15 | Var. | 3Q16 | 2Q16 | Var. |
(R$ million) | | | | 9M16x9M15 | | | 3Q16x2Q16 |
| | | | | | | |
Gross allowance for loan losses | (9,903) | (8,510) | 16.4% | (3,562) | (3,312) | 7.5% |
Income from recovery of written off loans | 2,126 | 1,611 | 32.0% | 725 | 797 | -9.0% |
Total | | (7,776) | (6,898) | 12.7% | (2,837) | (2,515) | 12.8% |
| | | | | | | | |
OtHER OPERATING INCOME (EXPENSES)
Other net operating expenses came to R$ 3,447 million in 9M16, a 34.1% rise in twelve months (or R$ 876 million) and down 10.2% in three months.
| | | | | | | | |
OTHER OPERATING INCOME (EXPENSES) (R$ million) | | 9M16 | 9M15 | Var. | 3Q16 | 2Q16 | Var. |
| | | 9M16x9M15 | | | 3Q16x2Q16 |
| | | | | | | |
Other operating income (expenses) | | (3,447) | (2,571) | 34.1% | (1,065) | (1,185) | -10.2% |
Expenses from cards | | (885) | (1,053) | -16.0% | (273) | (277) | -1.1% |
Net Income from Capitalization | | 230 | 191 | 20.7% | 79 | 81 | -1.5% |
Provisions for contingencies¹ | | (1,390) | (1,572) | -11.6% | (449) | (480) | -6.4% |
Others | | (1,403) | (137) | n.a | (421) | (509) | -17.3% |
| | | | | | | | |
1. Includes fiscal, civil and labor provisions. |
INCOME TAX expenses
Taxes totaled R$ 1,014 million in the first nine months of 2016, reaching an effective rate of 15.6%, down 2.4 p.p. in twelve months. In the quarter, the effective rate increased 5.0 p.p., mainly attributed to the reduction in the taxable base in 2Q16, prompted by of the payment of interest on capital.
| SANTANDER BRASIL RESULTS |
balance sheet
At the end of September 2016, total assets reached R$ 661,186 million, down 5.9% in twelve months and up 0.9% in three months. In the same period, total equity came to R$ 61,321 million, or R$ 58,695 million excluding goodwill.
| | | | | | | |
ASSETS (R$ million) | | Sep/16 | Sep/15 | Var. | Jun/16 | Var. |
| | | Sep/16xSep/15 | | Sep/16xJun/16 |
| | | | | | |
Current Assets and Long Term Assets | | 647,837 | 689,054 | -6.0% | 642,337 | 0.9% |
Cash and Cash Equivalents | | 6,089 | 6,928 | -12.1% | 5,209 | 16.9% |
Interbank Investments | | 63,960 | 59,264 | 7.9% | 64,278 | -0.5% |
Money Market Investments | | 57,407 | 29,933 | 91.8% | 47,349 | 21.2% |
Interbank Deposits | | 1,596 | 2,341 | -31.8% | 2,446 | -34.8% |
Foreign Currency Investments | | 4,957 | 26,989 | -81.6% | 14,482 | -65.8% |
Securities and Derivative Financial Instruments | | 153,135 | 154,262 | -0.7% | 149,988 | 2.1% |
Own Portfolio | | 62,315 | 29,891 | 108.5% | 42,820 | 45.5% |
Subject to Repurchase Commitments | | 55,444 | 72,895 | -23.9% | 65,301 | -15.1% |
Posted to Central Bank of Brazil | | 3,826 | 8,541 | -55.2% | 4,432 | -13.7% |
Pledged in Guarantees | | 11,992 | 16,330 | -26.6% | 14,032 | -14.5% |
Others | | 19,557 | 26,604 | -26.5% | 23,402 | -16.4% |
Interbank Accounts | | 64,573 | 52,224 | 23.6% | 61,478 | 5.0% |
Interbranch Accounts | | - | - | - | - | - |
Lending Operations | | 230,780 | 246,648 | -6.4% | 227,906 | 1.3% |
Lending Operations | | 247,322 | 262,050 | -5.6% | 244,290 | 1.2% |
Lending Operations Related to Assignment | | 738 | 203 | n.a | 162 | n.a |
(Allowance for Loan Losses) | | (17,280) | (15,605) | 10.7% | (16,546) | 4.4% |
Others Receivables | | 126,839 | 167,419 | -24.2% | 130,637 | -2.9% |
Others Assets | | 2,461 | 2,310 | 6.5% | 2,842 | -13.4% |
Permanent Assets | | 13,349 | 13,353 | 0.0% | 12,857 | 3.8% |
Investments | | 182 | 38 | n.a. | 164 | 11.1% |
Fixed Assets | | 7,612 | 6,733 | 13.0% | 6,825 | 11.5% |
Intangibles | | 5,555 | 6,581 | -15.6% | 5,868 | -5.3% |
Goodwill | | 27,475 | 27,527 | -0.2% | 27,475 | 0.0% |
Intangible Assets | | 8,564 | 6,934 | 23.5% | 8,207 | 4.3% |
(Accumulated Amortization) | | (30,484) | (27,881) | 9.3% | (29,815) | 2.2% |
Total Assets | | 661,186 | 702,407 | -5.9% | 655,194 | 0.9% |
| | | | | | | |
Goodwill (net of the amortization) | | 2,625 | 4,625 | -43.2% | 3,071 | -14.5% |
Total Assets (excluding goodwill) | | 658,561 | 697,782 | -5.6% | 652,123 | 1.0% |
| | | | | | | |
SANTANDER BRASIL RESULTS |
|
| | | | | | | |
LIABILITIES (R$ million) | | Sep/16 | Sep/15 | Var. | Jun/16 | Var. |
| | | Sep/16xSep/15 | | Sep/16xJun/16 |
| | | | | | |
Current Liabilities and Long Term Liabilities | | 597,106 | 642,458 | -7.1% | 593,035 | 0.7% |
Deposits | | 140,865 | 145,585 | -3.2% | 134,548 | 4.7% |
Demand Deposits | | 15,452 | 18,521 | -16.6% | 14,917 | 3.6% |
Savings Deposits | | 34,764 | 35,540 | -2.2% | 34,517 | 0.7% |
Interbank Deposits | | 3,162 | 3,402 | -7.0% | 2,601 | 21.6% |
Time Deposits | | 87,483 | 88,121 | -0.7% | 82,513 | 6.0% |
Money Market Funding | | 152,403 | 138,758 | 9.8% | 152,759 | -0.2% |
Own Portfolio | | 107,834 | 110,909 | -2.8% | 120,342 | -10.4% |
Third Parties | | 17,347 | 11,605 | 49.5% | 6,424 | 170.0% |
Free Portfolio | | 27,221 | 16,243 | 67.6% | 25,992 | 4.7% |
Funds from Acceptance and Issuance of Securities | | 104,295 | 99,202 | 5.1% | 100,247 | 4.0% |
Resources from Real Estate Credit Notes, Mortgage Notes, Credit and Similar | | 95,322 | 81,786 | 16.6% | 92,611 | 2.9% |
Funding from Certificates of Structured Operations | | 1,110 | 682 | 62.7% | 980 | 13.2% |
Securities Issued Abroad | | 6,791 | 15,778 | -57.0% | 5,732 | 18.5% |
Others | | 2,182 | 1,639 | 33.1% | 1,904 | 14.6% |
Interbank Accounts | | 1,729 | 1,626 | 6.3% | 1,651 | n.a. |
Interbranch Accounts | | 3,048 | 2,617 | 16.4% | 2,443 | 24.7% |
Borrowings | | 29,283 | 39,384 | -25.6% | 27,645 | 5.9% |
Domestic Onlendings - Official Institutions | | 16,615 | 14,767 | 12.5% | 15,934 | 4.3% |
Foreign Onlendings | | - | - | n.a. | - | n.a. |
Derivative Financial Instruments | | 15,020 | 29,870 | -49.7% | 18,049 | -16.8% |
Other Payables | | 133,850 | 170,650 | -21.6% | 139,760 | -4.2% |
Deferred Income | | 565 | 396 | 42.7% | 372 | 52.0% |
Minority Interest | | 2,194 | 1,951 | 12.5% | 1,938 | 13.2% |
Equity | | 61,321 | 57,602 | 6.5% | 59,850 | 2.5% |
Total Liabilities | | 661,186 | 702,407 | -5.9% | 655,194 | 0.9% |
| | | | | | | |
| | | | | | | |
Equity (excluding goodwill) | | 58,695 | 52,976 | 10.8% | 56,779 | 3.4% |
| | | | | | | |
SECURITIES
Securities totaled R$ 153,135 million in September 2016, down 0.7% in twelve months and up 2.1% in three months.
| | | | | | | |
SECURITIES (R$ million) | | Sep/16 | Sep/15 | Var. | Jun/16 | Var. |
| | | Sep/16xSep/15 | | Sep/16xJun/16 |
| | | | | | |
Public securities | | 113,674 | 108,204 | 5.1% | 108,253 | 5.0% |
Private securities | | 19,907 | 19,457 | 2.3% | 18,336 | 8.6% |
Financial instruments | | 19,554 | 26,601 | -26.5% | 23,399 | -16.4% |
Total | | 153,135 | 154,262 | -0.7% | 149,988 | 2.1% |
| | | | | | | |
| SANTANDER BRASIL RESULTS |
CREDIT PORTFOLIO
The credit portfolio totaled R$ 247,324 million in September 2016, down 5.6% in twelve months (or R$ 14,656 million) and up 1.2% in three months. In twelve months, the foreign currency credit portfolio was impacted by the BRL fluctuation against the USD. Excluding the effect of exchange rate variation impact fluctuation, the credit portfolio would have decreased by 2.7% in the period.
The foreign currency credit portfolio, including USD-indexed loans, stood at R$ 33,463 million in September 2016, down 34.0% from the R$ 50,707 million recorded in September 2015 and 0.4% higher than the R$ 33,331 million registered in June 2016.
The expanded credit portfolio, which includes other credit risk transactions, acquiring activities and guarantees, ended September 2016 at R$ 310,965 million,falling 6.3% in twelve months (or R$ 20,957 million) and rising 0.8% in three months. Excluding the exchange rate fluctuation impact, the expanded credit portfolio would have declined by 4.1% in twelve months.
| | | | | | | |
MANAGERIAL BREAKDOWN OF CREDIT BY SEGMENT | | Sep/16 | Sep/15 | Var. | Jun/16 | Var. |
(R$ million) | | | | Sep/16xSep/15 | | Sep/16xJun/16 |
| | | | | | |
Individuals | | 88,440 | 82,786 | 6.8% | 86,826 | 1.9% |
Consumer Finance | | 33,868 | 34,057 | -0.6% | 31,961 | 6.0% |
SMEs | | 32,076 | 35,636 | -10.0% | 32,274 | -0.6% |
Corporate | | 92,940 | 109,501 | -15.1% | 93,222 | -0.3% |
Total portfolio | | 247,324 | 261,980 | -5.6% | 244,284 | 1.2% |
Other credit related transactions¹ | | 63,640 | 69,942 | -9.0% | 64,093 | -0.7% |
Total expanded credit portfolio | | 310,965 | 331,922 | -6.3% | 308,377 | 0.8% |
| | | | | | | |
1 - Includes Debenture, FIDC, CRI , Floating Rate Notes, Promissory Notes, acquiring activities related assets and guarantees. |
LOANS TO INDIVIDUALS
Loans to individuals ended September 2016 at R$ 88,440 million, up 6.8% in twelve months (or R$ 5,655 million) and 1.9% in three months. Payroll loans, mortgage and credit cards drove the annual increase. Payroll loans reached R$ 17,666 million, rising 27.2% intwelve months (or R$ 3,780 million) and 6.1% in three months. The balance of mortgage loans totaled R$ 27,075 million, increasing 7.6% intwelve months (or R$ 1,918 million) and 0.4% in three months. The card portfolio stood at R$ 18,804 million, advancing 7.7% in twelve months (or R$ 1,351 million) and 1.7% in three months. | | 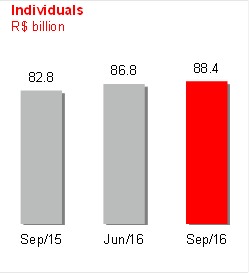 |
SANTANDER BRASIL RESULTS |
|
CONSUMER FINANCE
The consumer finance portfolio, which is originated outside the branch network, ended September 2016 at R$ 33,868 million, down 0.6% intwelve months (or R$ 189 million) and up 6.0% in three months. As previously noted, both the annual and quarterly performances were impacted by the incorporation of “Banco PSA” in the amount of R$ 1.7 billion. Excluding this effect, the portfolio would have fallen 5.7% in twelve months and grown 0.5% in three months, still outperforming the sector. Of this total, R$ 27,638 million refers to vehicle financing for individuals. The total vehicle portfolio for individuals, including operations originated through car dealerships and Santander’s branch network, amounted to R$ 29,596 million in September 2016, a decline of 4.9% in twelve months and growth of 2.9% in three months. In addition, as stated earlier, as of this quarter, Santander Financiamentos’ sales platform will operate under a new digital sales model, strengthening our offering and positioning in this segment by providing a complete solution to our customers through financing, the Webmotors portal (leader in digital advertisements of vehicles) and AutoCompara (web-based tool that allows customers to compare car insurance quotes and acquire insurance from different insurers). | | 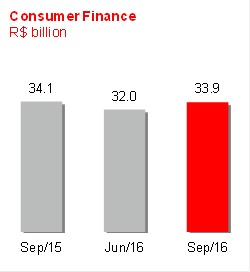 |
CORPORATE AND SMEs
Corporate and SME loans ended September 2016 at R$ 125,016 million, down 13.9% in twelve months (or R$ 20,121 million) and 0.4% in three months. The corporate loan portfolio came toR$ 92,940 million, declining 15.1% in twelve months (or R$ 16,561 million) and 0.3% in three months.It is worth noting that the loan portfolio was impacted by the exchange rate fluctuation in twelve months. Excluding this effect, the portfolio would have fallen by 8.8% in the period. Loans to SMEs totaled R$ 32,076 million, down 10.0% in twelve months (or R$ 3,560 million) and 0.6% in threemonths. | | 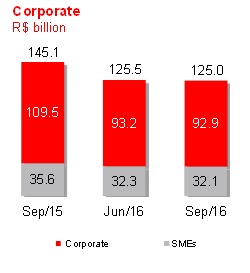 |
| SANTANDER BRASIL RESULTS |
INDIVIDUALS AND CORPORATE LOAN PORTFOLIO BY PRODUCT
| | | | | | | |
MANAGERIAL BREAKDOWN OF CREDIT | | Sep/16 | Sep/15 | Var. | Jun/16 | Var. |
PORTFOLIO BY PRODUCT (R$ million) | | | | Sep/16xSep/15 | | Sep/16xJun/16 |
| | | | | | |
Individuals | | | | | | |
Leasing / Auto Loans¹ | | 1,958 | 2,714 | -27.8% | 2,087 | -6.2% |
Credit Card | | 18,804 | 17,453 | 7.7% | 18,485 | 1.7% |
Payroll Loans | | 17,666 | 13,886 | 27.2% | 16,654 | 6.1% |
Mortgages | | 27,075 | 25,157 | 7.6% | 26,970 | 0.4% |
Agricultural Loans | | 3,494 | 3,475 | 0.5% | 3,258 | 7.2% |
Personal Loans / Others | | 19,443 | 20,101 | -3.3% | 19,372 | 0.4% |
Total Individuals | | 88,440 | 82,786 | 6.8% | 86,826 | 1.9% |
| | | | | | | |
Consumer Finance | | 33,868 | 34,057 | -0.6% | 31,961 | 6.0% |
| | | | | | | |
Corporate and SMEs | | | | | | |
Leasing / Auto Loans | | 2,735 | 3,006 | -9.0% | 2,794 | -2.1% |
Real Estate | | 10,049 | 10,784 | -6.8% | 10,585 | -5.1% |
Trade Finance | | 18,792 | 23,436 | -19.8% | 18,333 | 2.5% |
On-lending | | 14,750 | 11,853 | 24.4% | 14,702 | 0.3% |
Agricultural Loans | | 4,998 | 2,546 | 96.3% | 3,245 | 54.0% |
Working capital / Others | | 73,692 | 93,511 | -21.2% | 75,838 | -2.8% |
Total Corporate and SMEs | | 125,016 | 145,137 | -13.9% | 125,496 | -0.4% |
| | | | | | | |
Total Credit | | 247,324 | 261,980 | -5.6% | 244,284 | 1.2% |
Other Credit Risk Transactions with clients2 | | 63,640 | 69,942 | -9.0% | 64,093 | -0.7% |
| | | | | | | |
Total Expanded Credit Portfolio | | 310,965 | 331,922 | -6.3% | 308,377 | 0.8% |
| | | | | | | |
1. Including loans to individual in the consumer finance segment, auto loan portfolio totaled R$ 29,596 million in Sep/16, R$ 31,128 million in Sep/15 and R$ 28,750 million in Jun/16. |
2. Includes "debenture", FIDC, CRI, floating rate notes, promissory notes, acquiring activities related assets and guarantees. |
SANTANDER BRASIL RESULTS |
|
BALANCE OF ALLOWANCE FOR LOAN LOSSES / COVERAGE RATIO
The balance of allowance for loan losses totaled R$ 17,280 million in September 2016, rising 10.7% in twelve months and 4.4% in three months. In September 2016,the coverage ratio reached 198.1%, up 13.0 p.p. in twelve months and down 11.2 p.p. in three months. The quarterly drop was caused by an increase in the over 90-day balance, attributed to a single case in the Corporate segment. | | 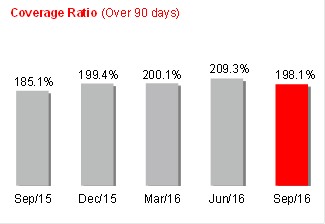 |
RENEGOTIATED PORTFOLIO
Credit renegotiations came to R$ 13,419 million in 9M16, increasing 5.2% intwelve months. These operations comprise loan agreements that were renegotiated and/or amended to enable their payment under conditions agreed upon with the customers, including the renegotiation of previously written-off loans. In the quarter, this portfolio grew by 0.3%.
In September 2016, 55.5% of the portfolio wasprovisioned, a level considered appropriate for these operations.
| | | | | | | |
RENEGOTIATED PORTFOLIO | | Sep/16 | Sep/15 | Var. | Jun/16 | Var. |
(R$ million) | | | | Sep/16xSep/15 | | Sep/16xJun/16 |
| | | | | | |
Renegotiated Portfolio | 13,419 | 12,760 | 5.2% | 13,386 | 0.3% |
Allowance for loan losses over renegotiated portfolio | (7,449) | (7,067) | 5.4% | (7,455) | -0.1% |
Coverage | | 55.5% | 55.4% | 0.1 p.p. | 55.7% | -0.2 p.p. |
| | | | | | | |
| SANTANDER BRASIL RESULTS |
DELINQUENCY RATIO (OVER 90 DAYS) The over-90-day delinquency ratio reached 3.5% of the total credit portfolio, up 0.3 p.p. in twelve and three months. The delinquency ratio of the individuals segment stood at 4.3%, improving 0.3 p.p. in twelve months and 0.1 p.p. in three months. Delinquency in the corporate and SME segments was 2.8%, showing an increase of 0.6 p.p. both year-on-year and quarter-on-quarter. The evolution in both periods was due a specific case in the Corporate segment and does not reflect a general deterioration in the segment. | | 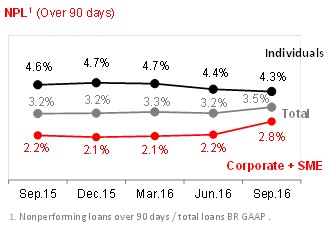 |
| | | |
| | | |
| | | |
| | | |
| | | |
DELINQUENCY RATIO (15-90 DAYS) The 15-to-90-day delinquency ratio came to 5.0% in September 2016, rising 0.7 p.p. in twelve months and declining 0.5 p.p. in three months. The corporate segment grew 0.6 p.p. in twelve months and improved 1.2 p.p. in three months, totaling 3.0%,following the inclusion of the aforementioned case among delinquencies over 90 days. Meanwhile, individual’s delinquency edged up 0.4 p.p. in twelve months and 0.2 p.p. in three months. | | 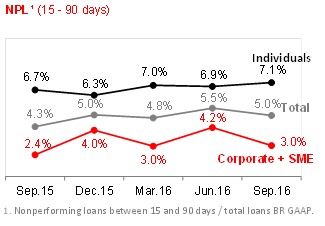 |
SANTANDER BRASIL RESULTS |
|
FUNDING
Funding from clients ended September 2016 at R$ 291,726 million, up 1.4% intwelve months (or R$ 4,065 million) and 1.3% in three months. The highlights in the quarter were Demand and Time Deposits, as well as Treasury Notes.
| | | | | | | |
FUNDING (R$ million) | | Sep/16 | Sep/15 | Var. | Jun/16 | Var. |
| | | Sep/16xSep/15 | | Sep/16xJun/16 |
| | | | | | |
Demand deposits | | 15,452 | 18,521 | -16.6% | 14,917 | 3.6% |
Saving deposits | | 34,764 | 35,540 | -2.2% | 34,517 | 0.7% |
Time deposits | | 87,483 | 88,121 | -0.7% | 82,513 | 6.0% |
Debenture/LCI/LCA¹ | | 87,282 | 88,855 | -1.8% | 90,584 | -3.6% |
Treasury Notes (Letras Financeiras)² | | 66,744 | 56,622 | 17.9% | 65,310 | 2.2% |
Funding from clients | | 291,726 | 287,660 | 1.4% | 287,840 | 1.3% |
| | | | | | | |
1. Debentures repurchase agreement, Real Estate Credit Notes (LCI) and Agribusiness Credit Notes (LCA). |
2. Includes Certificates of Structured Operations. |
CREDIT/FUNDING RATIO
The credit/funding ratio was 84.8% in September 2016, down 6.3 p.p. in twelve months and 0.1 p.p. in three months.
The liquidity metric adjusted for the reserve requirements and medium/long-term funding reached 85.1% in September 2016, advancing 4.5 p.p. in twelve months and 2.2 p.p. in three months.
The bank has a comfortable liquidity position, allied to a stable and adequate funding structure.
| | | | | | |
FUNDING VS. CREDIT (R$ million) | | Sep/16 | Sep/15 | Var. | Jun/16 | Var. |
| | | Sep/16xSep/15 | | Sep/16xJun/16 |
| | | | | | |
Funding from clients (A) | | 291,726 | 287,660 | 1.4% | 287,840 | 1.3% |
(-) Reserve Requirements | | (62,472) | (50,221) | 24.4% | (59,499) | 5.0% |
Funding Net of Reserve Requirements | | 229,254 | 237,439 | -3.4% | 228,341 | 0.4% |
Borrowing and Onlendings | | 17,063 | 14,859 | 14.8% | 16,001 | 6.6% |
Subordinated Debts | | 8,663 | 17,864 | -51.5% | 16,863 | -48.6% |
Offshore Funding | | 35,626 | 55,070 | -35.3% | 33,310 | 7.0% |
Total Funding (B) | | 290,605 | 325,232 | -10.6% | 294,515 | -1.3% |
Assets under management¹ | | 240,304 | 187,085 | 28.4% | 226,179 | 6.2% |
Total Funding and Asset under management | | 530,909 | 512,317 | 3.6% | 520,694 | 2.0% |
Total Credit (C) | | 247,324 | 261,980 | -5.6% | 244,284 | 1.2% |
C / B (%) | | 85.1% | 80.6% | | 82.9% | |
| | | | | | | |
C / A (%) | | 84.8% | 91.1% | | 84.9% | |
| | | | | | | |
1 - According to Anbima criterion. |
| SANTANDER BRASIL RESULTS |
BIS RATIO
The BIS ratio reached 17.6% in 9M16, up 1.8 p.p. in twelve months and down 0.1 p.p. in three months. CET1 came to 15.3%, rising 2.2 p.p. in twelve months and remaining stable in three months. The three-month decline in the BIS ratio was largely due to: (i) the increase in operational-risk RWA, chiefly arising from results with derivatives, partially offset by the upturn in equity, which was primarily driven by the profit achieved in the period, improvement in the unrealized result of securities available for sale and the amortization of goodwill in the quarter. It is worth noting that as of January 2016, as per National Monetary Council Resolution 4,193/2013, the capital requirement was altered from 11% to 9.875% + a capital conservation of 0.625%, totaling 10.5%. For Tier I Capital, it is at 6% and for CET1, 4.5%. | | 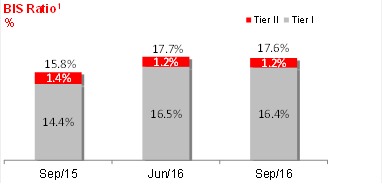
1From 2015 on, considers the prudential conglomerate. |
| | | | | | | |
OWN RESOURCES AND BIS (R$ million) | | Sep/16 | Sep/15 | Var. | Jun/16 | Var. |
| | | Sep/16xSep/15 | | Sep/16xJun/16 |
| | | | | | |
Tier I Regulatory Capital | | 59,112 | 55,960 | 5.6% | 57,317 | 3.1% |
CET1 | | 55,002 | 50,931 | 8.0% | 53,252 | 3.3% |
Additional Tier I | | 4,110 | 5,030 | -18.3% | 4,065 | 1.1% |
Tier II Regulatory Capital | | 4,190 | 5,612 | -25.3% | 4,215 | -0.6% |
Adjusted Regulatory Capital (Tier I and II) | | 63,302 | 61,573 | 2.8% | 61,532 | 2.9% |
Risk Weighted Assets (RWA) | | 359,177 | 389,030 | -7.7% | 347,476 | 3.4% |
Required Regulatory Capital | | 35,469 | 42,793 | -17.1% | 34,378 | 3.2% |
Adjusted Credit Risk Capital requirement | | 30,025 | 36,979 | -18.8% | 30,434 | -1.3% |
Market Risk Capital requirement | | 2,473 | 3,940 | -37.2% | 2,286 | 8.1% |
Operational Risk Capital requirement | | 2,971 | 1,874 | 58.5% | 1,657 | 79.3% |
Basel Ratio | | 17.62% | 15.83% | 1.8 p.p. | 17.71% | -0.1 p.p. |
Tier I | | 16.46% | 14.38% | 2.1 p.p. | 16.50% | 0.0 p.p. |
CET1 | | 15.31% | 13.09% | 2.2 p.p. | 15.33% | 0.0 p.p. |
Tier II | | 1.17% | 1.44% | -0.3 p.p. | 1.21% | 0.0 p.p. |
| | | | | | | |
OUR SHARES |
|
CORPORATE GOVERNANCE
With a free float of 10.5%, Santander Brasil is listed on the traditional trading segment of the Bolsa de Valores, Mercadorias e Futuros S.A. (BM&FBovespa). The Bank adopts the bestcorporate governance practices, such as the holding of periodic meetings with the market, disclosing information on its Investor Relations website and a Board of Directors comprised of 20% independent members, among others. | |  |
SIMPLIFIED OWNERSHIP STRUCTURE
Santander’s ownership structure on September 30th, 2016 was as follows:
| | | | | | | | |
OWNERSHIP STRUCTURE | Common shares | % | Preferred shares | % | Total share capital (thousand) | Total % | |
(thousand) | (thousand) | |
| | | | | | | | |
Santander Group ¹ | 3,443,608 | 89.4% | 3,276,944 | 88.3% | 6,720,552 | 88.9% | |
Treasury Shares | 23,333 | 0.6% | 23,333 | 0.6% | 46,667 | 0.6% | |
Free Float | 384,030 | 10.0% | 411,834 | 11.1% | 795,864 | 10.5% | |
Total | 3,850,971 | 100.0% | 3,712,112 | 100.0% | 7,563,082 | 100.0% | |
| | | | | | | |
1- Includes shareholding of Grupo Empresarial Santander, S.L. ; Sterrebeeck B.V. and Santander Insurance Holding, S.L., as well as Administrators. |
PERFORMANCE
| | | | | | | |
SANB11 | | 9M16 | 9M15 | Var. 9M16x9M15 | 3Q16 | 2Q16 | Var. 3Q16x2Q16 |
| | | | | | | |
Earnings (annualized) per unit (R$) | | 2.85 | 1.78 | 60.3% | 2.00 | 1.92 | 4.3% |
Dividend + Interest on capital per unit¹ (R$) | | 0.27 | 0.85 | -68.7% | 0.00 | 0.13 | n.a. |
Closing price (R$)1 | | 22.0 | 12.6 | 74.5% | 22.0 | 18.2 | 21.0% |
Book Value per unit (R$)2 | | 15.6 | 14.1 | 11.0% | 15.6 | 15.1 | 3.3% |
Market Capitalization(R$ bi)3 | | 82.7 | 47.5 | 74.1% | 82.7 | 68.3 | 21.0% |
1 - Closing price refers to the historical series. |
2 - Book Value calculation excludes the goodwill. |
3 - Market capitalization: total Units (Unit = 1 ON + 1 PN) x last Unit's price in September 30th, 2016. |
19
| RATINGS |
RATING AGENCIES
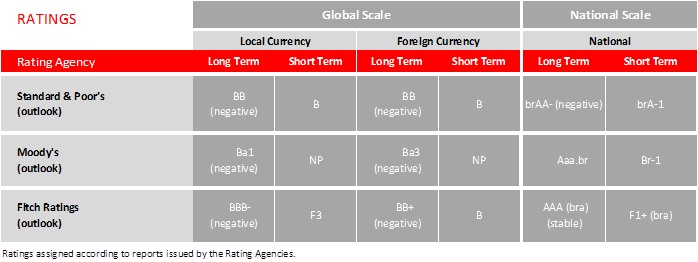
Santander is rated by international rating agencies and the ratings it receives reflect several factors, including the quality of its management, its operating performance and financial strength, as well as other variables related to the financial sector and the economic environment in which the company operates, with its long-term foreign currency rating limited to the sovereign rating.The table below presents the ratings assigned by the main rating agencies.
ADDITIONAL INFORMATION – BALANCE SHEET AND MANAGERIAL INCOME STATEMENTS |
|
BALANCE SHEET
| | | | | | | |
ASSETS (R$ million) | | Sep/16 | Jun/16 | Mar/15 | Dec/15 | Sep/15 |
| | | | | |
| | | | | | |
Current Assets and Long Term Assets | | 647,837 | 642,337 | 655,329 | 663,809 | 689,054 |
Cash and Cash Equivalents | | 6,089 | 5,209 | 5,463 | 6,864 | 6,928 |
Interbank Investments | | 63,960 | 64,278 | 51,481 | 55,810 | 59,264 |
Money Market Investments | | 57,407 | 47,349 | 31,838 | 31,990 | 29,933 |
Interbank Deposits | | 1,596 | 2,446 | 2,248 | 1,989 | 2,341 |
Foreign Currency Investments | | 4,957 | 14,482 | 17,395 | 21,831 | 26,989 |
Securities and Derivative Financial Instrument | | 153,135 | 149,988 | 151,377 | 142,892 | 154,262 |
Own Portfolio | | 62,315 | 42,820 | 30,072 | 36,311 | 29,891 |
Subject to Repurchase Commitments | | 55,444 | 65,301 | 82,498 | 58,961 | 72,895 |
Posted to Central Bank of Brazil | | 3,826 | 4,432 | 6,712 | 6,216 | 8,541 |
Pledged in Guarantees | | 11,992 | 14,032 | 15,036 | 15,390 | 16,330 |
Others | | 19,557 | 23,402 | 17,059 | 26,013 | 26,604 |
Interbank Accounts | | 64,573 | 61,478 | 57,101 | 55,303 | 52,224 |
Restricted Deposits: | | 62,641 | 59,667 | 55,724 | 55,266 | 50,392 |
-Central Bank of Brazil | | 62,472 | 59,499 | 55,555 | 55,096 | 50,221 |
-National Housing System | | 169 | 168 | 169 | 170 | 171 |
Others | | 1,933 | 1,810 | 1,376 | 37 | 1,832 |
Interbranch Accounts | | - | - | - | - | - |
Lending Operations | | 230,780 | 227,906 | 232,145 | 244,460 | 246,648 |
Lending Operations | | 247,322 | 244,290 | 248,360 | 261,083 | 262,050 |
Lending Operations Related to Assignment | | 738 | 162 | 181 | 209 | 203 |
(Allowance for Loan Losses) | | (17,280) | (16,546) | (16,396) | (16,832) | (15,605) |
Other Receivables | | 126,839 | 130,637 | 154,830 | 155,993 | 167,419 |
Foreign Exchange Portfolio | | 69,315 | 70,859 | 93,784 | 91,855 | 101,360 |
Tax Credits | | 27,828 | 26,701 | 30,085 | 33,988 | 32,457 |
Others | | 29,697 | 33,077 | 30,961 | 30,150 | 33,601 |
Others Assets | | 2,461 | 2,842 | 2,932 | 2,486 | 2,310 |
Permanent Assets | | 13,349 | 12,857 | 13,420 | 13,645 | 13,353 |
Investments | | 182 | 164 | 164 | 68 | 38 |
Fixed Assets | | 7,612 | 6,825 | 6,915 | 6,986 | 6,733 |
Intangibles | | 5,555 | 5,868 | 6,341 | 6,591 | 6,581 |
Goodwill | | 27,475 | 27,475 | 27,490 | 27,490 | 27,527 |
Intangible Assets | | 8,564 | 8,207 | 7,960 | 7,751 | 6,934 |
(Accumulated Amortization) | | (30,484) | (29,815) | (29,109) | (28,649) | (27,881) |
Total Assets | | 661,186 | 655,194 | 668,750 | 677,454 | 702,407 |
| | | | | | | |
| ADDITIONAL INFORMATION – BALANCE SHEET AND MANAGERIAL INCOME STATEMENTS |
| | | | | | | |
LIABILITIES (R$ million) | | Sep/16 | Jun/16 | Mar/15 | Dec/15 | Sep/15 |
| | | | | |
| | | | | | |
Current Liabilities and Long Term Liabilities | | 597,106 | 593,035 | 608,360 | 620,293 | 642,458 |
Deposits | | 140,865 | 134,548 | 136,947 | 141,886 | 145,585 |
Demand Deposits | | 15,452 | 14,917 | 14,491 | 15,698 | 18,521 |
Savings Deposits | | 34,764 | 34,517 | 34,964 | 35,985 | 35,540 |
Interbank Deposits | | 3,162 | 2,601 | 2,444 | 3,675 | 3,402 |
Time Deposits | | 87,483 | 82,513 | 85,048 | 86,528 | 88,121 |
Money Market Funding | �� | 152,403 | 152,759 | 148,702 | 134,960 | 138,758 |
Own Portfolio | | 107,834 | 120,342 | 121,355 | 104,218 | 110,909 |
Third Parties | | 17,347 | 6,424 | 5,672 | 10,828 | 11,605 |
Free Portfolio | | 27,221 | 25,992 | 21,675 | 19,915 | 16,243 |
Funds from Acceptance and Issuance of Securities | | 104,295 | 100,247 | 96,863 | 99,848 | 99,202 |
Resources from Real Estate Credit Notes, Mortgage Notes, Credit and Similar | | 95,322 | 92,611 | 88,553 | 84,607 | 81,786 |
Securities Issued Abroad | | 6,791 | 5,732 | 6,443 | 13,472 | 15,778 |
Others | | 2,182 | 1,904 | 1,867 | 1,769 | 1,639 |
Interbank Accounts | | 1,729 | 1,651 | 1,276 | 14 | 1,626 |
Interbranch Accounts | | 3,048 | 2,443 | 2,397 | 3,818 | 2,617 |
Borrowings | | 29,283 | 27,645 | 32,127 | 36,762 | 39,384 |
Domestic Onlendings - Official Institutions | | 16,615 | 15,934 | 16,082 | 16,263 | 14,767 |
National Economic and Social Development Bank (BNDES) | | 9,014 | 8,129 | 7,900 | 7,886 | 6,367 |
National Equipment Financing Authority (FINAME) | | 7,259 | 7,543 | 7,892 | 8,045 | 8,064 |
Other Institutions | | 342 | 262 | 289 | 332 | 337 |
Foreign Onlendings | | - | - | - | - | - |
Derivative Financial Instruments | | 15,020 | 18,049 | 14,297 | 22,883 | 29,870 |
Other Payables | | 133,850 | 139,760 | 159,669 | 163,859 | 170,650 |
Foreign Exchange Portfolio | | 69,235 | 66,533 | 88,552 | 89,330 | 99,537 |
Tax and Social Security | | 11,916 | 11,863 | 11,705 | 10,537 | 10,695 |
Subordinated Debts | | 454 | 8,675 | 8,379 | 8,097 | 7,818 |
Debt Instruments Eligible to Compose Capital | | 8,209 | 8,188 | 9,001 | 9,962 | 10,046 |
Others | | 44,037 | 44,502 | 42,032 | 45,932 | 42,552 |
Deferred Income | | 565 | 372 | 409 | 385 | 396 |
Minority Interest | | 2,194 | 1,938 | 1,928 | 1,956 | 1,951 |
Equity | | 61,321 | 59,850 | 58,053 | 54,819 | 57,602 |
Total Liabilities | | 661,186 | 655,194 | 668,750 | 677,454 | 702,407 |
| | | | | | | |
ADDITIONAL INFORMATION – BALANCE SHEET AND MANAGERIAL INCOME STATEMENTS |
|
MANAGERIAL FINANCIAL STATEMENT SUMMARY
MANAGERIAL FINANCIAL STATEMENT¹ (R$ million) | | | | | | | | |
| 3Q16 | 2Q16 | 1Q16 | 4Q15 | 3Q15 | 2Q15 | 1Q15 |
| | | | | | | |
| | | | | | | | |
Net Interest Income | | 8,267 | 7,808 | 7,599 | 7,384 | 7,631 | 7,480 | 7,140 |
Allowance for Loan Losses | | (2,837) | (2,515) | (2,424) | (2,762) | (2,448) | (2,338) | (2,112) |
Net Interest Income after Loan Losses | | 5,430 | 5,293 | 5,175 | 4,622 | 5,183 | 5,142 | 5,028 |
Fee and commission income | | 3,437 | 3,328 | 3,090 | 3,210 | 2,919 | 2,910 | 2,828 |
General Expenses | | (4,535) | (4,424) | (4,410) | (4,632) | (4,288) | (4,300) | (4,103) |
Personnel Expenses + Profit Sharing | | (2,163) | (2,082) | (2,132) | (2,202) | (2,054) | (1,962) | (1,861) |
Administrative Expenses² | | (2,371) | (2,341) | (2,278) | (2,430) | (2,234) | (2,337) | (2,242) |
Tax Expenses | | (835) | (823) | (817) | (784) | (770) | (889) | (929) |
Investments in Affiliates and Subsidiaries | | 0 | 0 | 0 | 0 | 0 | 0 | 1 |
Other Operating Income/Expenses | | (1,065) | (1,185) | (1,197) | (802) | (844) | (925) | (802) |
Operating Profit | | 2,434 | 2,190 | 1,841 | 1,614 | 2,201 | 1,938 | 2,022 |
Non Operating Income | | 19 | (5) | 25 | (21) | 21 | 39 | 78 |
Net Profit before Tax | | 2,453 | 2,186 | 1,866 | 1,593 | 2,222 | 1,977 | 2,100 |
Income Tax and Social Contribution | | (486) | (323) | (204) | 55 | (431) | (293) | (408) |
Minority Interest | | (84) | (56) | (2) | (40) | (82) | (9) | (60) |
Net Profit | | 1,884 | 1,806 | 1,660 | 1,607 | 1,708 | 1,675 | 1,633 |
| | | | | | | | | |
1. Excludes 100% of the goodwill amortization expense, the tax hedge effect and others as mentioned on pages 24 and 25. |
2. Administrative Expenses exclude 100% of the goodwill amortization expense. |
Under Brazilian income tax rules, gains (losses) resulting from exchange rate fluctuations on foreign currency investments are not taxable (tax deductible). This tax treatment leads to exchange rate exposure in the tax line. A hedge position was set up with the purpose of protecting the net profit from the impact of the foreign exchange fluctuations on the income tax and tax expenses lines.
| | | | | | | | | |
EXCHANGE HEDGE (R$ million) | | 3Q16 | 2Q16 | 1Q16 | 4Q15 | 3Q15 | 2Q15 | 1Q15 |
| | | | | | | |
| | | | | | | | |
Net Interest Income | | (409) | 3,648 | 3,434 | 665 | (8,358) | 882 | (4,721) |
Tax Expenses | | 40 | (357) | (336) | (65) | 871 | (96) | 513 |
Income Tax | | 369 | (3,292) | (3,098) | (600) | 7,487 | (786) | 4,208 |
| | | | | | | | | |
| ACCOUNTING AND MANAGERIAL RESULTS RECONCILIATION |
ACCOUNTING AND MANAGERIAL RESULTS RECONCILIATION
In order to ensure a better understanding of the results in BR GAAP, we present below the reconciliation of the managerial result with the accounting result. It is worth noting that these adjustments, apart from the amortization of goodwill and the non-recurring items,have no effect on net profit.
| | | | | | | | | | |
| | 9M16 | Reclassifications | Others Events5 | 9M16 |
ACCOUNTING AND MANAGERIAL RESULTS RECONCILIATION (R$ million) | | Accounting | Exchange Hedge¹ | Credit Recovery² | Amortization of goodwill³ | Profit Sharing | Foreign exchange variation/Others4 | Managerial |
| | | | | | | | | |
NET INTEREST INCOME | | 31,764 | 6,673 | 2,126 | - | - | (711) | | 23,675 |
Allowance for Loan Losses | | (9,332) | - | (2,126) | - | - | 570 | | (7,776) |
NET INTEREST INCOME AFTER LOAN LOSSES | | 22,431 | 6,673 | - | - | - | (141) | | 15,898 |
Fee and commission income | | 9,856 | - | - | - | - | - | | 9,856 |
General Expenses | | (13,776) | - | - | (1,354) | 947 | - | | (13,369) |
Personnel Expenses + Profit Sharing | | (5,430) | - | - | - | 947 | - | | (6,377) |
Administrative Expenses | | (8,345) | - | - | (1,354) | - | - | | (6,991) |
Tax Expenses | | (3,127) | (653) | - | - | - | - | | (2,474) |
Investments in Affiliates and Subsidiaries | | 1 | - | - | - | - | - | | 1 |
Other Operating Income/Expenses | | (3,307) | - | - | - | - | 141 | | (3,447) |
OPERATING INCOME | | 12,079 | 6,021 | - | (1,354) | 947 | 0 | | 6,465 |
Non Operating Income | | 40 | - | - | - | - | - | | 40 |
NET PROFIT BEFORE TAX | | 12,119 | 6,021 | - | (1,354) | 947 | 0 | | 6,505 |
Income Tax | | (7,035) | (6,021) | - | - | - | - | | (1,014) |
Profit Sharing | | (947) | - | - | - | (947) | - | | - |
Minority Interest | | (142) | - | - | - | - | - | | (142) |
NET PROFIT | | 3,996 | - | - | (1,354) | - | 0 | | 5,350 |
| | | | | | | | | |
| | | | | | | | | | |
| | 9M15 | Reclassifications | Others Events5 | 9M15 |
ACCOUNTING AND MANAGERIAL RESULTS RECONCILIATION (R$ million) | | Accounting | Exchange Hedge¹ | Credit Recovery² | Amortization of goodwill³ | Profit Sharing | Foreign exchange variation | Managerial |
| | | | | | | | | |
NET INTEREST INCOME | | 12,885 | (12,197) | 1,611 | - | - | 1,970 | (750) | 22,251 |
Allowance for Loan Losses | | (10,216) | - | (1,611) | - | - | (804) | (902) | (6,898) |
NET INTEREST INCOME AFTER LOAN LOSSES | | 2,669 | (12,197) | - | - | - | 1,165 | (1,652) | 15,353 |
Fee and commission income | | 8,657 | - | - | - | - | - | - | 8,657 |
General Expenses | | (14,239) | - | - | (2,342) | 793 | - | - | (12,691) |
Personnel Expenses + Profit Sharing | | (5,084) | - | - | - | 793 | - | - | (5,877) |
Administrative Expenses | | (9,155) | - | - | (2,342) | - | - | - | (6,813) |
Tax Expenses | | (1,021) | 1,288 | - | - | - | - | 278 | (2,588) |
Investments in Affiliates and Subsidiaries | | 1 | - | - | - | - | - | - | 1 |
Other Operating Income/Expenses | | 2,240 | - | - | - | - | (1,165) | 5,977 | (2,571) |
OPERATING INCOME | | (1,693) | (10,908) | - | (2,342) | 793 | - | 4,603 | 6,161 |
Non Operating Income | | 889 | - | - | - | - | - | 751 | 138 |
NET PROFIT BEFORE TAX | | (804) | (10,908) | - | (2,342) | 793 | - | 5,354 | 6,299 |
Income Tax | | 7,579 | 10,908 | - | - | - | - | (2,197) | (1,132) |
Profit Sharing | | (793) | - | - | - | (793) | - | - | 0 |
Minority Interest | | (151) | - | - | - | - | - | - | (151) |
NET PROFIT | | 5,831 | - | - | (2,342) | - | - | 3,157 | 5,016 |
| | | | | | | | | |
ACCOUNTING AND MANAGERIAL RESULTS RECONCILIATION |
|
| | | | | | | | | | |
| | 3Q16 | Reclassifications | Others Events5 | 3Q16 |
ACCOUNTING AND MANAGERIAL RESULTS RECONCILIATION (R$ million) | | Accounting | Exchange Hedge¹ | Credit Recovery² | Amortization of goodwill³ | Profit Sharing | Foreign exchange variation | Managerial |
| | | | | | | | | |
NET INTEREST INCOME | | 8,656 | (409) | 725 | - | - | 72 | | 8,267 |
Allowance for Loan Losses | | (3,579) | - | (725) | - | - | (17) | | (2,837) |
NET INTEREST INCOME AFTER LOAN LOSSES | | 5,076 | (409) | - | - | - | 54 | | 5,430 |
Fee and commission income | | 3,437 | - | - | - | - | - | | 3,437 |
General Expenses | | (4,650) | - | - | (448) | 333 | - | | (4,535) |
Personnel Expenses + Profit Sharing | | (1,830) | - | - | - | 333 | - | | (2,163) |
Administrative Expenses | | (2,820) | - | - | (448) | - | - | | (2,371) |
Tax Expenses | | (795) | 40 | - | - | - | - | | (835) |
Investments in Affiliates and Subsidiaries | | 0 | - | - | - | - | - | | 0 |
Other Operating Income/Expenses | | (1,119) | - | - | - | - | (54) | | (1,065) |
OPERATING INCOME | | 1,950 | (369) | - | (448) | 333 | 0 | | 2,434 |
Non Operating Income | | 19 | - | - | - | - | - | | 19 |
NET PROFIT BEFORE TAX | | 1,969 | (369) | - | (448) | 333 | 0 | | 2,453 |
Income Tax | | (117) | 369 | - | - | - | - | | (486) |
Profit Sharing | | (333) | - | - | - | (333) | - | | - |
Minority Interest | | (84) | - | - | - | - | - | | (84) |
NET PROFIT | | 1,436 | - | - | (448) | - | 0 | | 1,884 |
| | | | | | | | | |
| | | | | | | | | | |
| | 2Q16 | Reclassifications | Others Events5 | 2Q16 |
ACCOUNTING AND MANAGERIAL RESULTS RECONCILIATION (R$ million) | | Accounting | Exchange Hedge¹ | Credit Recovery² | Amortization of goodwill³ | Profit Sharing | Foreign exchange variation/Others4 | Managerial |
| | | | | | | | | |
NET INTEREST INCOME | | 11,973 | 3,648 | 797 | - | - | (281) | | 7,808 |
Allowance for Loan Losses | | (3,136) | - | (797) | - | - | 176 | | (2,515) |
NET INTEREST INCOME AFTER LOAN LOSSES | | 8,837 | 3,648 | - | - | - | (105) | | 5,293 |
Fee and commission income | | 3,328 | - | - | - | - | - | | 3,328 |
General Expenses | | (4,586) | - | - | (459) | 296 | - | | (4,424) |
Personnel Expenses + Profit Sharing | | (1,787) | - | - | - | 296 | - | | (2,082) |
Administrative Expenses | | (2,800) | - | - | (459) | - | - | | (2,341) |
Tax Expenses | | (1,179) | (357) | - | - | - | - | | (823) |
Investments in Affiliates and Subsidiaries | | 0 | - | - | - | - | - | | 0 |
Other Operating Income/Expenses | | (1,080) | - | - | - | - | 105 | | (1,185) |
OPERATING INCOME | | 5,319 | 3,292 | - | (459) | 296 | - | | 2,190 |
Non Operating Income | | (5) | - | - | - | - | - | | (5) |
NET PROFIT BEFORE TAX | | 5,314 | 3,292 | - | (459) | 296 | - | | 2,186 |
Income Tax | | (3,615) | (3,292) | - | - | - | - | | (323) |
Profit Sharing | | (296) | - | - | - | (296) | - | | 0 |
Minority Interest | | (56) | - | - | - | - | - | | (56) |
NET PROFIT | | 1,347 | - | - | (459) | - | - | | 1,806 |
| | | | | | | | | |
1.Exchange Hedge: For more details, please refer to page 23.
2.Credit Recovery:Reclassified from Revenue from Loan Operations to Allowance for Loan Losses.
3.Amortization of Goodwill:Reversal of goodwill amortization expenses.
4.Exchange Rate Fluctuation/Others:This also includes, in addition to the effect of exchange rate changes, reclassifications between different lines of the Bank’s results (net interest income, income from the allowance for loan losses, other operating income/expenses and non-operating income) for better comparability with previous quarters.
5.Other Events:
| ACCOUNTING AND MANAGERIAL RESULTS RECONCILIATION |
a) Net Interest Income: adjustment to the valuation of assets corresponding to the impairment of securities.
b) Allowance for Loan Losses: recording of complementary provisions and isolated impacts from large companies.
c) Tax Expenses: reversal of the Cofins provision update for the year 2015.
d) Other Operating Income/Expenses: reversal of Cofins tax provisions totaling R$7.7 billion; impairment of software, amounting to R$363 million, due to systems obsolescence and discontinuity; impairment of payroll assets, totaling R$534 million; and provisions for civil and tax contingencies, amounting to R$735 million.
SIGNATURE
Pursuant to the requirements of the Securities Exchange Act of 1934, the Registrant has duly caused this report to be signed on its behalf by the undersigned, thereto duly authorized.
Date: October 26, 2016
Banco Santander (Brasil) S.A. |
| | |
| By: | /S/ Amancio Acurcio Gouveia
| |
| | Amancio Acurcio Gouveia
Officer Without Specific Designation
| |
| | |
|
| | |
| By: | /S/ Carlos Rey de Vicenti
| |
| | Carlos Rey de Vicenti
Vice - President Executive Officer
| |