SECURITIES AND EXCHANGE COMMISSION
Commission File Number: 001-34476
Bloco A – Vila Olimpia
São Paulo, SP 04543-011
Federative Republic of Brazil
Indicate by check mark if the registrant is submitting the Form 6-K in paper as permitted by Regulation S-T Rule 101(b)(1):
Yes _______ No ___X____
Indicate by check mark if the registrant is submitting the Form 6-K in paper as permitted by Regulation S-T Rule 101(b)(7):
Yes _______ No ___X____
Indicate by check mark whether by furnishing the information contained in this Form, the Registrant is also thereby furnishing the information to the Commission pursuant to Rule 12g3-2(b) under the Securities Exchange Act of 1934:
Yes _______ No ___X____
If “Yes” is marked, indicate below the file number assigned to the registrant in connection with Rule 12g3-2(b): N/A
![]()

2
Data Summary for the Period
All information presented in this report considers the managerial result, except where otherwise indicated. The reconciliation with the accounting result can be found on pages 29 and 30.
MANAGERIAL¹ ANALYSIS - BR GAAP | 1H17 | 1H16 | Var. | 2Q17 | 1Q17 | Var. |
|
| 12M |
|
| 3M | |
RESULTS (R$ million) |
|
|
|
|
|
|
Net interest income | 17,966 | 15,405 | 16.6% | 9,098 | 8,868 | 2.6% |
Fees | 7,501 | 6,200 | 21.0% | 3,792 | 3,709 | 2.2% |
Allowance for loan losses | (4,624) | (4,939) | -6.4% | (2,360) | (2,264) | 4.3% |
General Expenses² | (9,179) | (8,652) | 6.1% | (4,550) | (4,629) | -1.7% |
Personnel Expenses | (4,406) | (4,164) | 5.8% | (2,205) | (2,200) | 0.2% |
Administrative Expenses | (4,773) | (4,488) | 6.4% | (2,344) | (2,429) | -3.5% |
Managerial net profit³ | 4,615 | 3,466 | 33.2% | 2,335 | 2,280 | 2.4% |
Accounting net profit | 3,704 | 2,560 | 44.7% | 1,879 | 1,824 | 3.0% |
|
|
|
|
|
|
|
BALANCE SHEET (R$ million) |
|
|
|
|
|
|
Total assets | 653,050 | 655,194 | -0.3% | 653,050 | 713,517 | -8.5% |
Securities and Derivative Financial Instrument | 168,391 | 149,988 | 12.3% | 168,391 | 166,131 | 1.4% |
Loan portfolio | 256,765 | 244,284 | 5.1% | 256,765 | 257,169 | -0.2% |
Individuals | 97,414 | 86,826 | 12.2% | 97,414 | 93,986 | 3.6% |
Consumer finance | 36,988 | 31,961 | 15.7% | 36,988 | 35,779 | 3.4% |
SMEs | 32,552 | 32,452 | 0.3% | 32,552 | 32,511 | 0.1% |
Corporate | 89,811 | 93,045 | -3.5% | 89,811 | 94,892 | -5.4% |
Expanded Loan Portfolio⁴ | 324,944 | 308,377 | 5.4% | 324,944 | 325,426 | -0.1% |
Funding from Clients⁵ | 300,668 | 287,840 | 4.5% | 300,668 | 300,678 | 0.0% |
Deposits (demand, saving and time) | 175,721 | 131,946 | 33.2% | 175,721 | 145,750 | 20.6% |
Equity⁶ | 59,608 | 56,779 | 5.0% | 59,608 | 58,994 | 1.0% |
|
|
|
|
|
|
|
PERFORMANCE INDICATORS (%) |
|
|
|
|
|
|
Return on average equity excluding goodwill⁶ - annualized | 15.9% | 12.8% | 310 bps | 15.8% | 15.9% | -10 bps |
Return on average asset excluding goodwill⁶ - annualized | 1.3% | 1.0% | 30 bps | 1.4% | 1.3% | 10 bps |
Efficiency Ratio⁷ | 44.2% | 49.1% | -490 bps | 43.4% | 44.9% | -150 bps |
Recurrence Ratio⁸ | 81.7% | 71.7% | 1,000 bps | 83.4% | 80.1% | 330 bps |
BIS ratio | 16.5% | 17.7% | -121 bps | 16.5% | 15.8% | 74 bps |
Tier I | 15.4% | 16.5% | -112 bps | 15.4% | 14.7% | 65 bps |
Tier II | 1.1% | 1.2% | -8 bps | 1.1% | 1.1% | -1 bps |
|
|
|
|
|
|
|
PORTFOLIO QUALITY INDICATORS (%) |
|
|
|
|
|
|
Delinquency ratio (over 90 days) | 2.9% | 3.2% | -30 bps | 2.9% | 2.9% | 0 bps |
Individuals | 3.9% | 4.4% | -50 bps | 3.9% | 4.0% | -10 bps |
Corporate & SMEs | 2.0% | 2.2% | -20 bps | 2.0% | 1.9% | 10 bps |
Delinquency ratio (over 60 days) | 3.8% | 4.8% | -100 bps | 3.8% | 3.9% | -10 bps |
Coverage ratio (over 90 days) | 228.9% | 209.3% | 1,960 bps | 228.9% | 229.3% | -40 bps |
|
|
|
|
|
|
|
OTHER DATA |
|
|
|
|
|
|
Assets under management9 - AUM (R$ million) | 272,118 | 226,179 | 20.3% | 272,118 | 257,362 | 5.7% |
Branches | 2,255 | 2,266 | (11) | 2,255 | 2,254 | 1 |
PABs (mini branches) | 1,170 | 1,173 | (3) | 1,170 | 1,166 | 4 |
Own ATMs | 13,610 | 14,127 | (517) | 13,610 | 13,679 | (69) |
Shared ATMs | 20,809 | 18,935 | 1,874 | 20,809 | 20,516 | 293 |
Total Customers (thousand) | 36,537 | 34,383 | 2,154 | 36,537 | 35,909 | 628 |
Employees | 46,596 | 48,877 | (2,281) | 46,596 | 46,897 | (301) |
¹ Excluding 100% of the goodwill amortization expense, the foreign exchange hedge effect and other adjustments, as described on pages 29 and 30.
² Administrative expenses exclude 100% of the goodwill amortization expense. Personnel expenses include profit-sharing.
³ Managerial net profit corresponds to the corporate net income, excluding the extraordinary result and the 100% reversal of thegoodwill amortization expense that occurred in the period. Goodwill amortization expenses were R$ 456 million in 2Q17, R$ 456 million in 1Q17 and R$ 459 million in 2Q16.
⁴ Including other credit risk transactions (debentures, FDIC, CRI, promissory notes, international distribution promissory notes, acquiring-activities related assets and guarantees).
⁵ Including Savings, Demand Deposits, Time Deposits, Debentures, LCA, LCI, financial bills and Certificates of Structured Operations ("COE").
⁶ Excluding 100% of the goodwill balance (net of amortization), which amounted to R$ 1,249 million in 2Q17, R$ 1,703 million in 1Q17 and R$ 3,071 million in 2Q16.
⁷ Efficiency Ratio: General Expenses / (Net Interest Income + Fees + Tax Expenses + Other Operating Income/Expenses).
⁸ Recurrence: Fees/ General Expenses.
⁹ According to ANBIMA (Brazilian Financial and Capital Markets Association) criteria.
3

4

5

6

7

8

Next, we present our analysis of the managerial results.
MANAGERIAL FINANCIAL STATEMENTS¹ | 1H17 | 1H16 | Var. | 2Q17 | 1Q17 | Var. |
(R$ million) |
|
| 12M |
|
| 3M |
|
|
|
|
|
|
|
Net Interest Income | 17,966 | 15,405 | 16.6% | 9,098 | 8,868 | 2.6% |
Allowance for Loan Losses | (4,624) | (4,939) | -6.4% | (2,360) | (2,264) | 4.3% |
Net Interest Income after Loan Losses | 13,342 | 10,466 | 27.5% | 6,738 | 6,604 | 2.0% |
Fees | 7,501 | 6,200 | 21.0% | 3,792 | 3,709 | 2.2% |
General Expenses | (9,179) | (8,652) | 6.1% | (4,550) | (4,629) | -1.7% |
Personnel Expenses + Profit Sharing | (4,406) | (4,164) | 5.8% | (2,205) | (2,200) | 0.2% |
Administrative Expenses² | (4,773) | (4,488) | 6.4% | (2,344) | (2,429) | -3.5% |
Tax Expenses | (1,798) | (1,614) | 11.4% | (892) | (906) | -1.5% |
Investments in Affiliates and Subsidiaries | 16 | 3 | n.a. | 11 | 5 | 98.1% |
Other Operating Income/Expenses | (2,900) | (2,381) | 21.8% | (1,528) | (1,372) | 11.3% |
Operating Income | 6,983 | 4,022 | 73.6% | 3,572 | 3,411 | 4.7% |
Non Operating Income | (278) | 21 | n.a. | (210) | (68) | n.a. |
Net Profit before Tax | 6,705 | 4,043 | 65.8% | 3,362 | 3,343 | 0.6% |
Income Tax and Social Contribution | (1,899) | (523) | n.a. | (926) | (973) | -4.8% |
Minority Interest | (190) | (53) | n.a. | (101) | (90) | 12.5% |
Net Profit | 4,615 | 3,466 | 33.2% | 2,335 | 2,280 | 2.4% |
¹ Excluding 100% of the goodwill amortization expense, foreign exchange hedge effect and other adjustments, as described on pages 29 and 30. |
| ² Administrative expenses exclude 100% of the goodwill amortization expense. |
Net Interest Income Net interest income totaled R$ 17,966 million in the first half of 2017, growing 16.6% in twelve months (or R$ 2,561 million) and climbing 2.6% in three months. Revenues from loan operations advanced 8.5% in twelve months and increased 6.9% in three months. These changes reflect higher average volume and spread, due to a change in the segment mix, with a greater share of the individuals portfolio. Deposit revenues climbed 45.4% in twelve months, as result of the liability management plan implemented in 2016, as commented earlier. In three months, lower deposit revenues mostly reflect the impact of the Selic rate reduction. The "Other" interest income, which considers the results of the structural gap in the balance sheet interest rate and treasury, among others, grew 30.8% in twelve months, explained by stronger gains from market activities. In three months, it declined by 6.3%, owing to lower income from market activities, which is volatile by nature. | 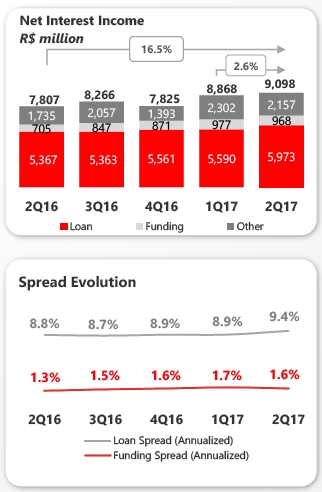 |
9
NET INTEREST INCOME | 1H17 | 1H16 | Var. | 2Q17 | 1Q17 | Var. |
(R$ million) |
|
| 12M |
|
| 3M |
Net Interest Income | 17,966 | 15,405 | 16.6% | 9,098 | 8,868 | 2.6% |
Loan | 11,562 | 10,659 | 8.5% | 5,973 | 5,590 | 6.9% |
Average volume | 254,039 | 247,623 | 2.6% | 255,421 | 252,657 | 1.1% |
Spread (Annualized) | 9.1% | 8.6% | 49 bps | 9.4% | 8.9% | 51 bps |
Funding | 1,945 | 1,338 | 45.4% | 968 | 977 | -0.9% |
Average volume | 240,061 | 218,266 | 10.0% | 245,292 | 234,831 | 4.5% |
Spread (Annualized) | 1.6% | 1.2% | 40 bps | 1.6% | 1.7% | -14 bps |
Other¹ | 4,459 | 3,408 | 30.8% | 2,157 | 2,302 | -6.3% |
| ¹ Including other margins and the result from financial transactions. |
10
FEES INCOME | 1H17 | 1H16 | Var. | 2Q17 | 1Q17 | Var. |
(R$ million) |
|
| 12M |
|
| 3M |
Credit Cards | 2,335 | 1,860 | 25.5% | 1,181 | 1,154 | 2.3% |
Insurance fees | 1,214 | 1,030 | 17.8% | 626 | 588 | 6.5% |
Current Account Services | 1,398 | 1,033 | 35.3% | 744 | 654 | 13.9% |
Asset Management | 509 | 519 | -1.9% | 246 | 263 | -6.4% |
Lending Operations | 740 | 698 | 6.0% | 370 | 370 | 0.1% |
Collection Services | 664 | 580 | 14.4% | 315 | 348 | -9.5% |
Securities Brokerage and Placement Services | 340 | 283 | 20.3% | 161 | 179 | -9.7% |
Other | 301 | 197 | 53.2% | 148 | 153 | -3.3% |
Total | 7,501 | 6,200 | 21.0% | 3,792 | 3,709 | 2.2% |
General Expenses (Administrative + Personnel) General expenses, including depreciation and amortization, came to R$ 9,179 million in the first half of 2017, registering growth of 6.1% (orR$ 527 million) in twelve months, owing to highervariable expenses, in line with the business growth dynamics. Fixed costs remained under control, reflecting continued discipline in expense management. Administrative and personnel expenses, excluding depreciation and amortization, totaled R$ 8,188 million in the first half of 2017, growth of 4.9% in twelve months and 2.2% lower in three months. Personnel expenses, including profit-sharing, amounted to R$ 4,406 million in the first half of 2017, rising 5.8% in twelve months (or R$ 242 million), mainly as consequence of the collective bargaining agreement. In three months, these expenses were practically stable, recording an increase of 0.2%. Administrative expenses, excluding depreciation and amortization, totaled R$ 3,782 million in the first half of 2017, growing 3.8% in twelve months (or R$ 139 million), affected by higher expenses with outsourced and specialized services, financial system services and data processing. In three months, these expenses fell by 4.9%, mostly because of lower expenses with outsourced and specialized services. | Depreciation and amortization expenses were R$ 991 million, increasing 17.3% in twelve months (or R$ 146 million), impacted by the normalization after the write-off of intangible assets occurred in previous periods. In three months, these expenses grew by 2.1%.
|

11
The efficiency ratio reached the lowest level in the last 5 years, standing at 44.2% in the first half of 2017, which means an improvement of 490bps in twelve months. In three months, this indicator came to 43.4%, falling 150bps. The good performance stems from our efforts to grow more efficiently, focused on recurring revenue growth–influenced by our commercial strategy–and on continued discipline in expense management. | 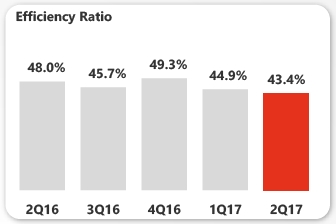 |
EXPENSES' BREAKDOWN | 1H17 | 1H16 | Var. | 2Q17 | 1Q17 | Var. |
(R$ million) |
|
| 12M |
|
| 3M |
Outsourced and Specialized Services | 1,130 | 1,068 | 5.8% | 499 | 631 | -20.9% |
Advertising, promotions and publicity | 187 | 172 | 8.7% | 121 | 66 | 82.0% |
Data processing | 831 | 777 | 6.9% | 403 | 428 | -5.7% |
Communications | 214 | 247 | -13.4% | 104 | 110 | -6.2% |
Rentals | 370 | 367 | 0.8% | 184 | 185 | -0.3% |
Transport and Travel | 88 | 109 | -19.1% | 46 | 42 | 7.9% |
Security and Surveillance | 298 | 352 | -15.4% | 148 | 150 | -1.1% |
Maintenance | 115 | 128 | -10.0% | 58 | 57 | 2.0% |
Financial System Services | 139 | 121 | 14.5% | 70 | 68 | 3.2% |
Water, Electricity and Gas | 96 | 118 | -18.5% | 46 | 50 | -9.5% |
Material | 29 | 35 | -16.2% | 16 | 13 | 28.7% |
Other | 286 | 150 | 90.8% | 148 | 137 | 8.0% |
Subtotal | 3,782 | 3,643 | 3.8% | 1,844 | 1,938 | -4.9% |
Depreciation and Amortization¹ | 991 | 845 | 17.3% | 501 | 490 | 2.1% |
Total Administrative Expenses | 4,773 | 4,488 | 6.4% | 2,344 | 2,429 | -3.5% |
Compensation² | 2,837 | 2,682 | 5.8% | 1,411 | 1,426 | -1.1% |
Charges | 802 | 751 | 6.9% | 402 | 401 | 0.3% |
Benefits | 728 | 729 | -0.1% | 373 | 355 | 4.9% |
Training | 21 | 33 | -37.2% | 12 | 9 | 32.8% |
Other | 17 | (31) | -156.3% | 8 | 9 | -10.4% |
Total Personnel Expenses | 4,406 | 4,164 | 5.8% | 2,205 | 2,200 | 0.2% |
Administrative + Personnel Expenses | 8,188 | 7,807 | 4.9% | 4,049 | 4,139 | -2.2% |
Total General Expenses | 9,179 | 8,652 | 6.1% | 4,550 | 4,629 | -1.7% |
¹ Excluding 100% of the goodwill amortization expenses, which totaled R$ 456 million in 2Q17, R$ 456 million in 1Q17 and R$ 459 million in 2Q16 |
| ² Including Profit-Sharing. |
12
Allowance for Loan Losses Allowance for loan losses totaled R$ 4,624 million in the first half of 2017, down 6.4% in twelve months (or R$ 315 million) and up 4.3% in three months. Provision for loan losses totaled R$ 5,959 million during the first half of 2017, representing a 6.0% decrease in twelve months (or R$ -381 million), and R$ 2,907 million in the second quarter, or 4.8% lower in three months, showing a good performance in both periods against a backdrop of slower economic activity. Income from the recovery of written-off loans amounted to R$ 1,335 million in the first half of 2017 and R$ 547 million in the second quarter of 2017, meaning a reduction of 4.7% in twelve months and a 30.7% decrease in three months, respectively. In summary, the favorable evolution of provisions reflects the strength of our risk models, with greater predictability of the life cycle of our customers, thus keeping the quality indicators of the loan portfolio under control. |  |
Other Operating Income and Expenses
Other net operating income and expenses amounted to R$ 2,900 million in the first half of 2017.
OTHER OPERATING INCOME (EXPENSES) | 1H17 | 1H16 | Var. | 2Q17 | 1Q17 | Var. |
(R$ million) |
|
| 12M |
|
| 3M |
Expenses from credit cards | (776) | (611) | 26.9% | (378) | (398) | -5.1% |
Net Income from Capitalization | 181 | 151 | 19.9% | 93 | 88 | 4.9% |
Provisions for contingencies¹ | (1,144) | (940) | 21.7% | (621) | (524) | 18.6% |
Other | (1,161) | (980) | 18.4% | (622) | (539) | 15.4% |
Other operating income (expenses) | (2,900) | (2,381) | 21.8% | (1,528) | (1,372) | 11.3% |
| ¹ Including tax, civil and labor provisions. |
13
Balance Sheet
Total assets reached R$ 653,050 million at the end of June 2017, a 0.3% reduction in twelve months and falling 8.5% in three months. Total equity was R$ 60,858 million in the same period. Excluding the goodwill balance, total equity came to R$ 59,608 million.
ASSETS | Jun/17 | Jun/16 | Var. | Mar/17 | Var. |
(R$ million) |
|
| 12M |
| 3M |
|
|
|
|
|
|
Current Assets and Long-term Assets | 640,995 | 642,337 | -0.2% | 701,088 | -8.6% |
Cash and Cash Equivalents | 8,261 | 5,209 | 58.6% | 5,405 | 52.9% |
Interbank Investments | 51,599 | 64,278 | -19.7% | 52,642 | -2.0% |
Money Market Investments | 38,900 | 47,349 | -17.8% | 38,271 | 1.6% |
Interbank Deposits | 1,315 | 2,446 | -46.3% | 1,350 | -2.6% |
Foreign Currency Investments | 11,385 | 14,482 | -21.4% | 13,022 | -12.6% |
Securities and Derivative Financial Instruments | 168,391 | 149,988 | 12.3% | 166,131 | 1.4% |
Own Portfolio | 48,112 | 42,820 | 12.4% | 42,842 | 12.3% |
Subject to Repurchase Commitments | 84,360 | 65,301 | 29.2% | 73,180 | 15.3% |
Posted to Central Bank of Brazil | 2,333 | 4,432 | -47.4% | 2,634 | -11.4% |
Pledged in Guarantees | 15,233 | 14,032 | 8.6% | 22,491 | -32.3% |
Other | 18,353 | 23,402 | -21.6% | 24,984 | -26.5% |
Interbank Accounts | 68,135 | 61,478 | 10.8% | 64,369 | 5.8% |
Restricted Deposits: | 65,287 | 59,667 | 9.4% | 61,920 | 5.4% |
-Central Bank of Brazil | 65,012 | 59,499 | 9.3% | 61,751 | 5.3% |
-National Housing System | 275 | 168 | 63.9% | 169 | 63.0% |
Other | 2,848 | 1,810 | 57.3% | 2,449 | 16.3% |
Lending Operations | 240,014 | 227,906 | 5.3% | 240,629 | -0.3% |
Lending Operations | 256,822 | 244,290 | 5.1% | 257,187 | -0.1% |
Lending Operations Related to Assignment | 421 | 162 | 160.2% | 526 | -20.0% |
(Allowance for Loan Losses) | (17,229) | (16,546) | 4.1% | (17,084) | 0.9% |
Other Receivables | 102,050 | 130,637 | -21.9% | 169,123 | -39.7% |
Foreign Exchange Portfolio | 39,750 | 70,859 | -43.9% | 108,323 | -63.3% |
Income Receivable | 27,913 | 26,701 | 4.5% | 26,490 | 5.4% |
Other | 34,387 | 33,077 | 4.0% | 34,309 | 0.2% |
Other Assets | 2,546 | 2,842 | -10.4% | 2,788 | -8.7% |
Permanent Assets | 12,056 | 12,857 | -6.2% | 12,430 | -3.0% |
Temporary Assets | 372 | 164 | 127.3% | 379 | -1.9% |
Fixed Assets | 7,174 | 6,825 | 5.1% | 7,238 | -0.9% |
Intangibles | 4,510 | 5,868 | -23.1% | 4,812 | -6.3% |
Goodwill net of amortization | 1,249 | 3,071 | -59.3% | 1,703 | -26.7% |
Other Assets | 3,260 | 2,797 | 16.6% | 3,109 | 4.9% |
Total Assets | 653,050 | 655,194 | -0.3% | 713,517 | -8.5% |
|
|
|
|
|
|
Total Assets (excluding goodwill) | 651,801 | 652,123 | 0.0% | 711,814 | -8.4% |
14
LIABILITIES | Jun/17 | Jun/16 | Var. | Mar/17 | Var. |
(R$ million) |
|
| 12M |
| 3M |
|
|
|
|
|
|
Current Liabilities and Long-term Liabilities | 589,129 | 593,035 | -0.7% | 649,710 | -9.3% |
Deposits | 178,615 | 134,548 | 32.8% | 148,012 | 20.7% |
Demand Deposits | 16,175 | 14,917 | 8.4% | 14,824 | 9.1% |
Savings Deposits | 37,064 | 34,517 | 7.4% | 36,114 | 2.6% |
Interbank Deposits | 2,894 | 2,601 | 11.3% | 2,262 | 28.0% |
Time Deposits | 122,482 | 82,513 | 48.4% | 94,813 | 29.2% |
Money Market Funding | 150,083 | 152,759 | -1.8% | 160,419 | -6.4% |
Own Portfolio | 120,790 | 120,342 | 0.4% | 131,591 | -8.2% |
Third Parties | 335 | 6,424 | -94.8% | 971 | -65.5% |
Free Portfolio | 28,958 | 25,992 | 11.4% | 27,856 | 4.0% |
Funds from Acceptance and Issuance of Securities | 85,139 | 100,247 | -15.1% | 95,009 | -10.4% |
Resources from Real Estate Credit Notes, Mortgage Notes, Credit and Similar | 79,346 | 92,611 | -14.3% | 89,096 | -10.9% |
Funding from Certificates of Structured Operations | 1,330 | 980 | 35.7% | 1,270 | 4.8% |
Securities Issued Abroad | 3,393 | 5,732 | -40.8% | 3,494 | -2.9% |
Other | 1,071 | 923 | 16.0% | 1,149 | -6.8% |
Interbank Accounts | 1,790 | 1,651 | 8.4% | 1,390 | 28.7% |
Interbranch Accounts | 2,719 | 2,443 | 11.3% | 2,210 | 23.0% |
Borrowings | 28,007 | 27,645 | 1.3% | 28,040 | -0.1% |
Domestic Onlendings - Official Institutions | 16,842 | 15,934 | 5.7% | 16,772 | 0.4% |
National Economic and Social Development Bank (BNDES) | 10,090 | 8,129 | 24.1% | 9,715 | 3.9% |
National Equipment Financing Authority (FINAME) | 6,497 | 7,543 | -13.9% | 6,765 | -4.0% |
Other Institutions | 254 | 262 | -3.0% | 292 | -13.0% |
Derivative Financial Instruments | 16,919 | 18,049 | -6.3% | 21,794 | -22.4% |
Other Payables | 109,015 | 139,760 | -22.0% | 176,064 | -38.1% |
Foreign Exchange Portfolio | 39,635 | 66,533 | -40.4% | 107,967 | -63.3% |
Tax and Social Security | 3,920 | 11,863 | -67.0% | 12,170 | -67.8% |
Subordinated Debts | 494 | 8,675 | -94.3% | 481 | 2.6% |
Debt Instruments Eligible to Compose Capital | 8,438 | 8,188 | 3.1% | 8,014 | 5.3% |
Other | 56,528 | 44,502 | 27.0% | 47,433 | 19.2% |
Deferred Income | 519 | 372 | 39.7% | 543 | -4.3% |
Minority Interest | 2,545 | 1,938 | 31.3% | 2,566 | -0.9% |
Equity | 60,858 | 59,850 | 1.7% | 60,698 | 0.3% |
Total Liabilities | 653,050 | 655,194 | -0.3% | 713,517 | -8.5% |
|
|
|
|
|
|
Equity (excluding goodwill) | 59,608 | 56,779 | 5.0% | 58,994 | 1.0% |
Securities
Total securities amounted to R$ 168,391 million at the end of June 2017, rising 12.3% in twelve months and increasing 1.4% in three months, largely attributed to balance sheet hedge strategies.
SECURITIES | Jun/17 | Jun/16 | Var. | Mar/17 | Var. |
(R$ million) |
|
| 12M |
| 3M |
Public securities | 129,324 | 108,253 | 19.5% | 122,479 | 5.6% |
Private securities | 20,716 | 18,336 | 13.0% | 18,672 | 10.9% |
Financial instruments | 18,350 | 23,399 | -21.6% | 24,981 | -26.5% |
Total | 168,391 | 149,988 | 12.3% | 166,131 | 1.4% |
15
Loan Portfolio
The loan portfolio totaled R$ 256,765 million at the end of June 2017, growing 5.1% in twelve months (or R$ 12,481 million) and remaining practically stable in three months. Disregarding the impact of the exchange rate fluctuation, the total loan portfolio would have grown 4.9% in twelve months and decreased 0.7% in three months.
The balance of the foreign currency portfolio, including dollar-indexed loans, was R$ 30,554 million at the end of June 2017, declining 8.3% in comparison with the balance of R$ 33,331 million in June 2016 and 3.9% relative to the balance of R$ 31,790 million in March of 2017.
The year-over-year growth in the loan portfolio was primarily driven by individuals' portfolios, with credit card, payroll loans, agricultural loans and consumer finance as the highlights, driven by our commercial strategy. The corporate portfolio decreased by 3.5% in twelve months and fell 5.4% in three months, (or 4.1% lower in twelve months and a 6.6% drop in three months, disregarding the impact of the exchange rate fluctuation).

In the first half of 2017, the corporate portfolio accounted for 35% of the total portfolio, a reduction of 300bps in twelve months. Theindividuals’portfolio represented 38% of the total portfolio, rising 200bps in twelve months, the consumer finance portfolio accounted for 14%, up 100bps in twelve months and the SMEs portfolio remained stable.

16
MANAGERIAL BREAKDOWN OF CREDIT BY SEGMENT | Jun/17 | Jun/16 | Var. | Mar/17 | Var. |
(R$ million) |
|
| 12M |
| 3M |
Individuals | 97,414 | 86,826 | 12.2% | 93,986 | 3.6% |
Consumer Finance | 36,988 | 31,961 | 15.7% | 35,779 | 3.4% |
SMEs | 32,552 | 32,452 | 0.3% | 32,511 | 0.1% |
Corporate | 89,811 | 93,045 | -3.5% | 94,892 | -5.4% |
Total portfolio | 256,765 | 244,284 | 5.1% | 257,169 | -0.2% |
Other credit related transactions¹ | 68,179 | 64,093 | 6.4% | 68,257 | -0.1% |
Total expanded credit portfolio | 324,944 | 308,377 | 5.4% | 325,426 | -0.1% |
¹ Includes debenture, FIDC, CRI , international distribution promissory notes, promissory notes, acquiring activities related 27guarantees. |
The expanded loan portfolio, which includes other credit risk transactions, acquiring-activities related assets and guarantees, totaled R$ 324,944 million at the end of June 2017, growing 5.4% in twelve months (or R$ 16,567 million) and remaining roughly stable in three months. Excluding the impact ofexchange rate fluctuation, the expanded loan portfolio would have increased by 5.2% in twelve months decreased by 0.5% in three months.
Loans to Individuals Loans to individuals amounted to R$ 97,414 million at the end of June 2017, expanding 12.2% (or R$ 10,587 million) in twelve months and increasing 3.6% in three months. The products that explain the portfolio growth in twelve months are, chiefly, credit card, payroll loans and agricultural loans. The payroll loans portfolio reached R$ 21,959 million, increasing by 31.9% in twelve months (or R$ 5,305 million) and up 7.3% in three months. The credit card portfolio totaled R$ 20,921 million, rising 13.2% in twelve months (or R$ 2,436 million) and growing 3.0% in three months. The balance of mortgage loans was R$ 27,046 million, up 0.3% in twelve months and remaining virtually stable in three months. In the period, we launched the mortgage portal, a digital platform that will accelerate the financing process. This innovation puts us in a stronger position to capture business opportunities in this segment with the rebound in economic activity in Brazil, in addition to reinforcing our strategy of providing a better experience for our customers. | 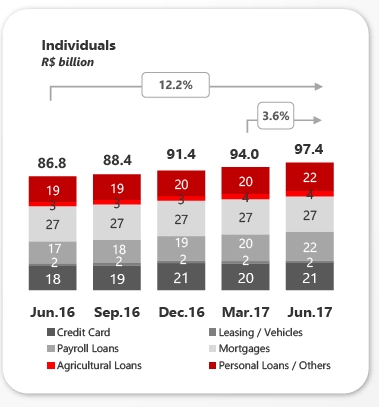 |
17
Consumer Finance The consumer finance portfolio, which is originated outside the branch network, totaled R$ 36,988 million at the end of June 2017, growing 15.7% in twelve months (or R$ 5,027 million) and rising 3.4% in three months. Of the total in this portfolio, R$ 30,868 million refers to vehicle financing for individuals, an increase of 15.8% in twelve months. The total vehicle portfolio for individuals, which includes operations carried out by both the financing unit (correspondent banks) as well as by Santander's branches network, grew 13.6% in twelve months and rose 3.8% in three months, totaling R$ 32,650 million at the end of June 2017. It should be noted that the portfolio growth this quarter already reflects the increase in our sales, thanks to our digital platform +Negócios. This quarter, we expanded this digital model to the consumer goods and services segment (CDC). With +Negócios, we provide a better experience for our customers, especially, at the moment of granting a loan. This platform made us the first choice for car dealers. On top of that, we continue to strengthen our offering and positioning with complete solutions through Webmotors (leading vehicle advertisement portal) and AutoCompara (a web-based tool that allows customers to compare car insurance quotes and acquire insurance from different insurers). | 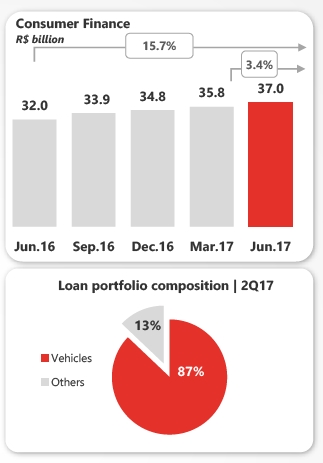 |
Corporate & SMEs Loans
The Corporate & SMEs loan portfolio stood at R$ 122,363 million at the end of June 2017, down 2.5% in twelve months (or R$ 3,134 million) and 4.0% lower in three months.
 | The Corporate loan portfolio totaled R$ 89,811 million at the end of June 2017, falling 3.5% in twelve months (or R$ 3,234 million) and a 5.4% reduction in three months (or a decrease of 4.1% in twelve months and a 6.6% decline in three months, disregarding the effect of exchange rate fluctuation).Loans to the SMEs segment amounted to R$ 32,552million, meaning an increase of 0.3% in twelve months (or R$ 100 million) and growth of 0.1% in three months. In line with our purpose of helping people and businesses prosper, we continue to strengthen our commitment to this segment with differentiated offerings, such as integrated accounts and the Programa Avançar. On top of that, we have broadened the scope of our specialized services and focused on sector-oriented offers. All these actions, associated with the recovery of economic activity, give us an even more solid foundation to expandour portfolio and increase our customer base andclient loyalty. |
18
Individuals and Corporate & SMEs Loan Portfolio by Product
MANAGERIAL BREAKDOWN OF CREDIT | Jun/17 | Jun/16 | Var. | Mar/17 | Var. |
PORTFOLIO BY PRODUCT(R$ million) |
|
| 12M |
| 3M |
Individuals |
|
|
|
|
|
Leasing / Auto Loans¹ | 1,782 | 2,087 | -14.6% | 1,823 | -2.2% |
Credit Card | 20,921 | 18,485 | 13.2% | 20,320 | 3.0% |
Payroll Loans | 21,959 | 16,654 | 31.9% | 20,469 | 7.3% |
Mortgages | 27,046 | 26,970 | 0.3% | 27,059 | -0.1% |
Agricultural Loans | 4,186 | 3,258 | 28.5% | 3,860 | 8.5% |
Personal Loans / Others | 21,519 | 19,372 | 11.1% | 20,456 | 5.2% |
Total Individuals | 97,414 | 86,826 | 12.2% | 93,986 | 3.6% |
Consumer Finance | 36,988 | 31,961 | 15.7% | 35,779 | 3.4% |
Corporate and SMEs |
|
|
|
|
|
Leasing / Auto Loans | 2,727 | 2,794 | -2.4% | 2,737 | -0.4% |
Real Estate | 8,207 | 10,585 | -22.5% | 8,808 | -6.8% |
Trade Finance | 23,201 | 18,333 | 26.6% | 22,815 | 1.7% |
On-lending | 11,193 | 14,702 | -23.9% | 11,017 | 1.6% |
Agricultural Loans | 7,017 | 3,245 | 116.3% | 6,772 | 3.6% |
Working capital / Others | 70,018 | 75,838 | -7.7% | 75,254 | -7.0% |
Total Corporate and SMEs | 122,363 | 125,496 | -2.5% | 127,404 | -4.0% |
Total Credit | 256,765 | 244,284 | 5.1% | 257,169 | -0.2% |
Other Credit Risk Transactions with customers² | 68,179 | 64,093 | 6.4% | 68,257 | -0.1% |
Total Expanded Credit Portfolio | 324,944 | 308,377 | 5.4% | 325,426 | -0.1% |
| ¹ Including consumer finance, the auto loan portfolio for individuals totaled R$ 32,650 million in Jun/17, R$ 31,465 million in Mar/17 and R$ 28,750 million in Jun/16 |
| ² Including debentures, FIDC, CRI, promissory notes, international distribution promissory notes, acquiring-activities related assets and guarantees. |
| Consider the adjusted amounts on the "On-Lending" and "Working Capital / Others" lines for 1Q17, without any effect on the total credit portfolio. |
Coverage Ratio The balance of allowance for loan losses amounted to R$ 17,229 million at the end of June 2017, meaning a 4.1% rise in twelve months and 0.9% increase in three months, in line with our credit portfolio growth. The coverage ratio reached 229% at the end of June 2017, advancing 2,000bps in twelve months and remaining stable in three months. | 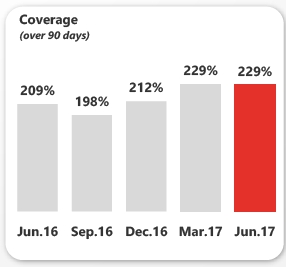 |
19
Renegotiated Loan Portfolio
Loan renegotiations came to R$ 13,219 million at the end of June 2017, decreasing 1.2% in twelve months and increasing 0.4% in three months. These operations include loan agreements that were renegotiated to enable their payment under conditions agreed upon with customers, including renegotiations of loans that had already been written-off in the past.
RENEGOTIATED PORTFOLIO | Jun/17 | Jun/16 | Var. | Mar/17 | Var. |
(R$ million) |
|
| 12M |
| 3M |
Renegotiated Portfolio | 13,219 | 13,386 | -1.2% | 13,172 | 0.4% |
Allowance for loan losses over renegotiated portfolio | (7,571) | (7,455) | 1.6% | (7,631) | -0.8% |
Coverage | 57.3% | 55.7% | 160bps | 57.9% | -60bps |
Credit Portfolio by Risk Level We operate in accordance with our risk culture and international best practices, in order to protect our capital and guarantee the profitability of our businesses. Our credit approval process, particularly the approval of new loans and risk monitoring, is structured according to our classification of customers and products, centered around our retail and wholesale segments. At the end of June 2017, portfolios rated "AA" and "A" accounted for 75% of the total loan portfolio. | 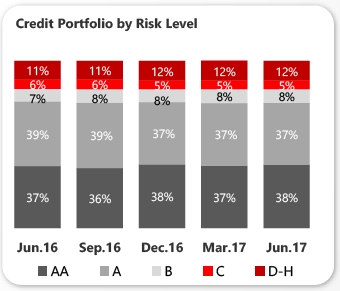 |
 | NPL Formation NPL Formation reached R$ 2,917 million, 7.0% lower in twelve months and 6.1% higher in three months. The ratio between NPL Formation and the loan portfolio in the quarter was 1.1%, falling 20bps in twelve months and remaining stable in three months. |
Note: NPL Formation is obtained from the change in balance of the non-performed portfolio over 90 days and the loan book under renegotiation, disregarding the portfolio written-off as loss in the period.
20
Delinquency Ratio (Over 90 Days) The over-90-day delinquency ratio reached, at the end of June 2017, 2.9% of the total loan portfolio, declining 30bps in twelve months and remaining stable in three months. The indicators remain at controlled levels, which reflects the strength of our risk culture. The delinquency ratio for individuals’segment was 3.9%, down 50bps in twelve months and 10bps lower in three months. In the corporate & SMEs segment, the over-90-day delinquency ratio came to 2.0%, falling 20bps in twelve months and increasing 10bps in three months. |
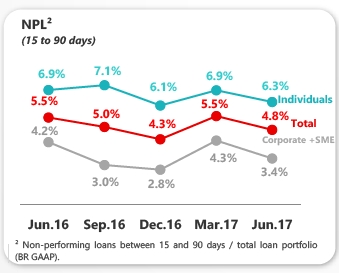 | Delinquency Ratio (15 to 90 Days) The 15-to-90-day delinquency ratio stood at 4.8% at the end of June 2017, reducing 70bps in twelve months and declining 70bps in three months. The improvement of the indicators shows our active and preemptive risk management. Delinquency among individuals decreased by 60bps in twelve months and dropped 60bps in three months, reaching 6.3%. In the corporate & SMEs segment, the ratio declined 80bps in twelve months and fell 90bps in three months, to 3.4%. |
21
FUNDING | Jun/17 | Jun/16 | Var. | Mar/17 | Var. |
(R$ million) |
|
| 12M |
| 3M |
Demand deposits | 16,175 | 14,917 | 8.4% | 14,824 | 9.1% |
Saving deposits | 37,064 | 34,517 | 7.4% | 36,114 | 2.6% |
Time deposits | 122,482 | 82,513 | 48.4% | 94,813 | 29.2% |
Debenture/LCI/LCA¹ | 78,311 | 90,584 | -13.5% | 96,261 | -18.6% |
Financial Bills² | 46,635 | 65,310 | -28.6% | 58,667 | -20.5% |
Funding from clients | 300,668 | 287,840 | 4.5% | 300,678 | 0.0% |
¹ Repo operations backed by Debentures, Real Estate Credit Notes (LCI) and Agricultural Credit Notes (LCA). ² Including Certificates of Structured Operations (COE). | |||||
Total customer funding amounted to R$ 300,668 million at the end of June 2017, growing 4.5% in twelve months (or R$ 12,827 million) and remaining stable in three months. In both periods, deposits evolved favorably. Time deposits were the highlight, showing strong growth on the back of lower funding through financial bills and the Brazilian Central Bank Resolution No. 4,527/16, which restricted the renewal of repurchase agreements involving debentures issued by the Leasing Unit as of May 2017.
Credit/Funding Ratio
FUNDING VS. CREDIT | Jun/17 | Jun/16 | Var. | Mar/17 | Var. |
(R$ million) |
|
| 12M |
| 3M |
Funding from customers (A) | 300,668 | 287,840 | 4.5% | 300,678 | 0.0% |
(-) Reserve Requirements | (65,012) | (59,499) | 9.3% | (61,751) | 5.3% |
Funding Net of Reserve Requirements | 235,656 | 228,341 | 3.2% | 238,927 | -1.4% |
Borrowing and Onlendings | 17,334 | 16,001 | 8.3% | 17,212 | 0.7% |
Subordinated Debts | 8,932 | 16,863 | -47.0% | 8,495 | 5.1% |
Offshore Funding | 30,908 | 33,310 | -7.2% | 31,095 | -0.6% |
Total Funding (B) | 292,829 | 294,515 | -0.6% | 295,728 | -1.0% |
Assets under management¹ | 272,118 | 226,179 | 20.3% | 257,362 | 5.7% |
Total Funding and Asset under management | 564,947 | 520,694 | 8.5% | 553,090 | 2.1% |
Total Credit (C) | 256,765 | 244,284 | 5.1% | 257,169 | -0.2% |
C / B (%) | 87.7% | 82.9% |
| 87.0% |
|
C / A (%) | 85.4% | 84.9% |
| 85.5% |
|
| ¹ According to ANBIMA criteria. |
The loan portfolio to customer funding ratio came to 85.4% at the end of June 2017, rising 50bps in twelve months and remaining stable in three months. The liquidity metric adjusted for the impact of reserve requirements and medium/long-term funding reached 87.7% in June 2017, advancing 480bps in twelve months and rising 70bps in three months. The Bank is in a comfortable liquidity situation, with stable funding sources and an adequate funding structure. |  |
22
BIS Ratio The BIS ratio reached 16.5% at the end of June 2017, down 121bps in twelve months and up 74bps in three months, 600bps higher than the sum of the minimum Regulatory Capital and Capital Conservation requirements. CET1 stood at 14.3%, falling 107bps in twelve months and increasing 56bps in three months. On a quarter-over-quarter basis, the change is largely attributed to the decrease in RWA for Market Risk, the lower exposure of trading portfolio and the profit incorporated in the period. The year-over-year change in the ratio is primarily explained by the increase in RWA for Operational Risk and the impact of capital deductions, according to the Basel III schedule. It is important to note that, as of January 2017, in accordance with CMN Resolution No. 4,193/2013, the capital requirement was altered from 9.875% to 9.250% + conservation capital of 1.250%, totaling 10.5%. ForTier I Capital it is at 7.250%, while for CET1 it is at 5.750%. |  |
OWN RESOURCES AND BIS | Jun/17 | Jun/16 | Var. | Mar/17 | Var. |
(R$ million) |
|
| 12M |
| 3M |
Tier I Regulatory Capital | 57,797 | 57,317 | 0.8% | 57,773 | 0.0% |
CET1 | 53,609 | 53,252 | 0.7% | 53,761 | -0.3% |
Additional Tier I | 4,188 | 4,065 | 3.0% | 4,012 | 4.4% |
Tier II Regulatory Capital | 4,250 | 4,215 | 0.8% | 4,098 | 3.7% |
Adjusted Regulatory Capital (Tier I and II) | 62,047 | 61,532 | 0.8% | 61,871 | 0.3% |
Risk Weighted Assets (RWA) | 375,988 | 347,476 | 8.2% | 392,503 | -4.2% |
Required Regulatory Capital | 34,779 | 34,378 | 1.2% | 36,306 | -4.2% |
Adjusted Credit Risk Capital requirement | 29,216 | 30,434 | -4.0% | 29,162 | 0.2% |
Market Risk Capital requirement | 2,611 | 2,286 | 14.2% | 4,192 | -37.7% |
Operational Risk Capital requirement | 2,952 | 1,657 | 78.2% | 2,952 | 0.0% |
Basel Ratio | 16.50% | 17.71% | -121 bps | 15.76% | 74 bps |
Tier I | 15.37% | 16.50% | -112 bps | 14.72% | 65 bps |
CET1 | 14.26% | 15.33% | -107 bps | 13.70% | 56 bps |
Tier II | 1.13% | 1.21% | -8 bps | 1.14% | -1 bps |
23
Corporate Governance
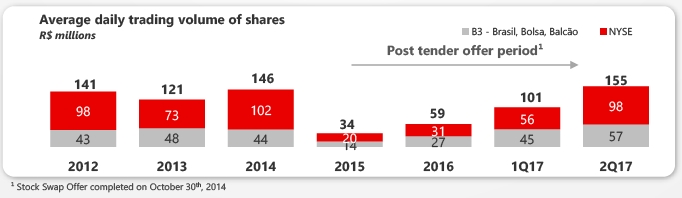
Santander Brasil has a free float of 10.3% and is currently listed on the traditional segment of B3 - Brasil, Bolsa, Balcão. The Bank adopts the best practices in corporate governance, such as holding periodic meetings with the market, disclosing information on its Investor Relations website, Board of Directors comprised of 50% independent members, independent committees reporting to the board, among others. |  |
Simplified Ownership Structure
Ownership Structure
Santander’sownership structure, as of June 30th, 2017:
OWNERSHIP STRUCTURE | Common shares | % | Preferred shares | % | Total shares | Total |
(thousand) |
| (thousand) |
| (thousand) | % | |
Santander Group ¹ | 3,444,206 | 89.4% | 3,277,542 | 88.3% | 6,721,748 | 88.9% |
Treasury Shares | 30,356 | 0.8% | 30,356 | 0.8% | 60,713 | 0.8% |
Free Float | 376,409 | 9.8% | 404,213 | 10.9% | 780,622 | 10.3% |
Total | 3,850,971 | 100.0% | 3,712,112 | 100.0% | 7,563,082 | 100.0% |
| ¹ Considering the shareholding positions of: Grupo EmpresarialSantander S.L. and Sterrebeeck B.V., as well as the shares owned by Management. |
In the quarter,Santander Brasil declared R$ 500 million to be distributed in interest on capital (IoC), which was paid on May 26th, 2017.
Stock Performance
SANB11 | 1H17 | 1H16 | Var. | 2Q17 | 1Q17 | Var. |
|
| 12M |
|
| 3M | |
Earnings (annualized) per unit (R$) | 2.46 | 1.85 | 33.4% | 1.92 | 2.43 | -20.7% |
Dividend + Interest on capital per unit¹ (R$) | 0.13 | 0.13 | 0.2% | 0.13 | - | n.a. |
Closing price (R$)1 | 25.0 | 18.2 | 37.5% | 25.0 | 27.7 | -9.6% |
Book Value per unit (R$)2 | 15.9 | 15.1 | 5.1% | 15.9 | 15.7 | 1.3% |
Market Capitalization (R$ bi)3 | 93.8 | 68.3 | 37.3% | 93.8 | 104.0 | -9.8% |
| ¹ Closing price refers to the historical value. |
| ² Book Value excludes goodwill. |
| ³ Market Capitalization: Total Units (Unit = 1 Common + 1 Preferred) x Unit closing price on June 30th, 2017. |
24

Rating Agencies
Santander is rated by international rating agencies and the ratings it receives reflect several factors, including the quality of its management, its operational performance and financial strength, as well as other variables related to the financial sector and the economic environment in which the company operates, with its long-term foreign currency rating limited to the sovereign rating. The table below presents the ratings assigned by Standard & Poor's and Moody's:
Global Scale | National Scale | ||||||||
Ratings | Local Currency | Foreign Currency | National | ||||||
Long-term | Short-term | Long-term | Short-term | Long-term | Short-term | ||||
Standard & Poor’s (outlook) | BB | B | BB | B | brAA- | brA-1 | |||
|
|
| |||||||
Moody's (outlook) |
| Ba1 | NP |
| Ba3 | NP |
| Aaa.br | Br-1 |
|
|
| |||||||
25

Balance Sheet
ASSETS | Jun/17 | Mar/17 | Dec/16 | Sep/16 | Jun/16 |
(R$ million) |
|
|
|
|
|
|
|
|
|
|
|
Current Assets and Long-term Assets | 640,995 | 701,088 | 688,673 | 647,837 | 642,337 |
Cash and Cash Equivalents | 8,261 | 5,405 | 5,723 | 6,089 | 5,209 |
Interbank Investments | 51,599 | 52,642 | 59,669 | 63,960 | 64,278 |
Money Market Investments | 38,900 | 38,271 | 47,479 | 57,407 | 47,349 |
Interbank Deposits | 1,315 | 1,350 | 1,191 | 1,596 | 2,446 |
Foreign Currency Investments | 11,385 | 13,022 | 11,000 | 4,957 | 14,482 |
Securities and Derivative Financial Instrument | 168,391 | 166,131 | 169,590 | 153,135 | 149,988 |
Own Portfolio | 48,112 | 42,842 | 60,041 | 62,315 | 42,820 |
Subject to Repurchase Commitments | 84,360 | 73,180 | 70,175 | 55,444 | 65,301 |
Posted to Central Bank of Brazil | 2,333 | 2,634 | 3,045 | 3,826 | 4,432 |
Pledged in Guarantees | 15,233 | 22,491 | 12,250 | 11,992 | 14,032 |
Other | 18,353 | 24,984 | 24,079 | 19,557 | 23,402 |
Interbank Accounts | 68,135 | 64,369 | 62,900 | 64,573 | 61,478 |
Restricted Deposits: | 65,287 | 61,920 | 61,368 | 62,641 | 59,667 |
-Central Bank of Brazil | 65,012 | 61,751 | 61,199 | 62,472 | 59,499 |
-National Housing System | 275 | 169 | 170 | 169 | 168 |
Other | 2,848 | 2,449 | 1,532 | 1,933 | 1,810 |
Lending Operations | 240,014 | 240,629 | 239,190 | 230,780 | 227,906 |
Lending Operations | 256,822 | 257,187 | 256,898 | 247,322 | 244,290 |
Lending Operations Related to Assignment | 421 | 526 | 624 | 738 | 162 |
(Allowance for Loan Losses) | (17,229) | (17,084) | (18,333) | (17,280) | (16,546) |
Other Receivables | 102,050 | 169,123 | 148,992 | 126,839 | 130,637 |
Foreign Exchange Portfolio | 39,750 | 108,323 | 87,044 | 69,315 | 70,859 |
Tax Credits | 27,913 | 26,490 | 26,767 | 27,828 | 26,701 |
Other | 34,387 | 34,309 | 35,181 | 29,697 | 33,077 |
Other Assets | 2,546 | 2,788 | 2,609 | 2,461 | 2,842 |
Permanent Assets | 12,056 | 12,430 | 13,031 | 13,349 | 12,857 |
Investments | 372 | 379 | 178 | 182 | 164 |
Fixed Assets | 7,174 | 7,238 | 7,551 | 7,612 | 6,825 |
Intangibles | 4,510 | 4,812 | 5,303 | 5,555 | 5,868 |
Goodwill | 1,249 | 1,703 | 2,174 | 2,625 | 3,071 |
Other Assets | 3,260 | 3,109 | 3,129 | 2,930 | 2,797 |
Total Assets | 653,050 | 713,517 | 701,705 | 661,186 | 655,194 |
|
|
|
|
|
|
Total Assets (excluding goodwill) | 651,801 | 711,814 | 699,531 | 658,561 | 652,123 |
26
LIABILITIES | Jun/17 | Mar/17 | Dec/16 | Sep/16 | Jun/16 |
(R$ million) | |||||
Current Liabilities and Long-term Liabilities | 589,129 | 649,710 | 640,843 | 597,106 | 593,035 |
Deposits | 178,615 | 148,012 | 145,705 | 140,865 | 134,548 |
Demand Deposits | 16,175 | 14,824 | 16,006 | 15,452 | 14,917 |
Savings Deposits | 37,064 | 36,114 | 36,051 | 34,764 | 34,517 |
Interbank Deposits | 2,894 | 2,262 | 3,122 | 3,162 | 2,601 |
Time Deposits | 122,482 | 94,813 | 90,525 | 87,483 | 82,513 |
Money Market Funding | 150,083 | 160,419 | 160,924 | 152,403 | 152,759 |
Own Portfolio | 120,790 | 131,591 | 123,578 | 107,834 | 120,342 |
Third Parties | 335 | 971 | 5,795 | 17,347 | 6,424 |
Free Portfolio | 28,958 | 27,856 | 31,551 | 27,221 | 25,992 |
Funds from Acceptance and Issuance of Securities | 85,139 | 95,009 | 105,170 | 104,295 | 100,247 |
Resources from Real Estate Credit Notes, Mortgage Notes, Credit and Similar | 79,346 | 89,096 | 95,122 | 95,322 | 92,611 |
Funding from Certificates of Structured Operations | 1,330 | 1,270 | 1,236 | 1,110 | 980 |
Securities Issued Abroad | 3,393 | 3,494 | 7,722 | 6,791 | 5,732 |
Other | 1,071 | 1,149 | 1,090 | 1,072 | 923 |
Interbank Accounts | 1,790 | 1,390 | 44 | 1,729 | 1,651 |
Interbranch Accounts | 2,719 | 2,210 | 3,887 | 3,048 | 2,443 |
Borrowings | 28,007 | 28,040 | 30,600 | 29,283 | 27,645 |
Domestic Onlendings - Official Institutions | 16,842 | 16,772 | 16,803 | 16,615 | 15,934 |
National Economic and Social Development Bank (BNDES) | 10,090 | 9,715 | 9,423 | 9,014 | 8,129 |
National Equipment Financing Authority (FINAME) | 6,497 | 6,765 | 7,041 | 7,259 | 7,543 |
Other Institutions | 254 | 292 | 339 | 342 | 262 |
Derivative Financial Instruments | 16,919 | 21,794 | 19,945 | 15,020 | 18,049 |
Other Payables | 109,015 | 176,064 | 157,766 | 133,850 | 139,760 |
Foreign Exchange Portfolio | 39,635 | 107,967 | 86,753 | 69,235 | 66,533 |
Tax and Social Security | 3,920 | 12,170 | 11,594 | 11,916 | 11,863 |
Subordinated Debts | 494 | 481 | 466 | 454 | 8,675 |
Debt Instruments Eligible to Compose Capital | 8,438 | 8,014 | 8,315 | 8,209 | 8,188 |
Other | 56,528 | 47,433 | 50,638 | 44,037 | 44,502 |
Deferred Income | 519 | 543 | 565 | 565 | 372 |
Minority Interest | 2,545 | 2,566 | 2,526 | 2,194 | 1,938 |
Equity | 60,858 | 60,698 | 57,772 | 61,321 | 59,850 |
Total Liabilities | 653,050 | 713,517 | 701,705 | 661,186 | 655,194 |
Equity (excluding goodwill) | 59,608 | 58,994 | 55,598 | 58,695 | 56,779 |
27
Managerial Financial Statement Summary
MANAGERIAL FINANCIAL STATEMENT¹ | 1Q16 | 2Q16 | 3Q16 | 4Q16 | 2016 | 1Q17 | 2Q17 |
(R$ million) | |||||||
Net Interest Income | 7,598 | 7,807 | 8,266 | 7,825 | 31,497 | 8,868 | 9,098 |
Allowance for Loan Losses | (2,424) | (2,515) | (2,837) | (2,680) | (10,456) | (2,264) | (2,360) |
Net Interest Income after Loan Losses | 5,174 | 5,292 | 5,430 | 5,145 | 21,041 | 6,604 | 6,738 |
Fees | 2,984 | 3,216 | 3,322 | 3,740 | 13,263 | 3,709 | 3,792 |
General Expenses | (4,321) | (4,331) | (4,436) | (4,831) | (17,919) | (4,629) | (4,550) |
Personnel Expenses + Profit Sharing | (2,107) | (2,057) | (2,136) | (2,397) | (8,698) | (2,200) | (2,205) |
Administrative Expenses² | (2,214) | (2,274) | (2,300) | (2,434) | (9,222) | (2,429) | (2,344) |
Tax Expenses | (804) | (810) | (822) | (899) | (3,335) | (906) | (892) |
Investments in Affiliates and Subsidiaries | 2 | 1 | 1 | 2 | 7 | 5 | 11 |
Other Operating Income/Expenses | (1,197) | (1,184) | (1,065) | (860) | (4,306) | (1,372) | (1,528) |
Operating Profit | 1,838 | 2,184 | 2,430 | 2,298 | 8,750 | 3,411 | 3,572 |
Non Operating Income | 26 | (5) | 20 | (5) | 36 | (68) | (210) |
Net Profit before Tax | 1,863 | 2,179 | 2,450 | 2,293 | 8,785 | 3,343 | 3,362 |
Income Tax and Social Contribution | (205) | (319) | (482) | (325) | (1,330) | (973) | (926) |
Minority Interest | 1 | (55) | (85) | 21 | (117) | (90) | (101) |
Net Profit | 1,660 | 1,806 | 1,884 | 1,989 | 7,339 | 2,280 | 2,335 |
| ¹ Excluding 100% of the goodwill amortization expense, the tax hedge effect and other adjustments, as stated on pages 29 and 30. |
| ² Administrative expenses exclude 100% of the goodwill amortization expense. |
Under Brazilian tax rules, gains (losses) derived from exchange rate fluctuations on foreign currency investments are not taxable (tax deductible). This tax treatment leads to exchange rate exposure on taxes. An exchange rate hedge position was set up with the purpose of protecting the net profit from the impact of foreign exchange fluctuations related to this exposure on taxes.
EXCHANGE HEDGE | 1Q16 | 2Q16 | 3Q16 | 4Q16 | 2016 | 1Q17 | 2Q17 |
(R$ million) | |||||||
Net Interest Income | 3,434 | 3,648 | (409) | 41 | 6,715 | 967 | (1,665) |
Tax Expenses | (336) | (357) | 40 | (4) | (657) | (95) | 163 |
Income Tax | (3,098) | (3,292) | 369 | (37) | (6,058) | (872) | 1,502 |
28

Accounting and Managerial Results Reconciliation
For a better understanding of BR GAAP results, the reconciliation between the accounting result and the managerial result is presented below. It should be clarified that these adjustments, except for the amortization of goodwill, have no effect on net profit.
ACCOUNTING AND MANAGERIAL | 1H17 | Reclassifications | 1H17 | ||||
RESULTS RECONCILIATION(R$ million) | Accounting | Exchange Hedge¹ | Credit Recovery² | Amort. of goodwill³ | Profit Sharing | FX | Managerial |
Net Interest Income | 18,492 | 698 | (1,335) | - | - | 111 | 17,966 |
Allowance for Loan Losses | (5,961) | - | 1,384 | - | - | (47) | (4,624) |
Net Interest Income after Loan Losses | 12,531 | 698 | 49 | - | - | 64 | 13,342 |
Fees | 7,501 | - | - | - | - | - | 7,501 |
General Expenses | (9,425) | - | - | 911 | (665) | - | (9,179) |
Personnel Expenses | (3,741) | - | - | - | (665) | - | (4,406) |
Administrative Expenses | (5,685) | - | - | 911 | - | - | (4,773) |
Tax Expenses | (1,729) | (68) | - | - | - | - | (1,798) |
Investments in Affiliates and Subsidiaries | 16 | - | - | - | - | - | 16 |
Other Operating Income/Expenses | (2,787) | - | (49) | - | - | (64) | (2,900) |
Operating Income | 6,106 | 630 | - | 911 | (665) | - | 6,983 |
Non Operating Income | (278) | - | - | - | - | - | (278) |
Net Profit before Tax | 5,828 | 630 | - | 911 | (665) | - | 6,705 |
Income Tax and Social Contribution | (1,269) | (630) | - | - | - | - | (1,899) |
Profit Sharing | (665) | - | - | - | 665 | - | - |
Minority Interest | (190) | - | - | - | - | - | (190) |
Net Profit | 3,704 | - | - | 911 | - | - | 4,615 |
ACCOUNTING AND MANAGERIAL | 1H16 | Reclassifications | 1H16 | ||||
RESULTS RECONCILIATION(R$ million) | Accounting | Exchange Hedge¹ | Credit Recovery² | Amort. of goodwill³ | Profit Sharing | FX | Managerial |
Net Interest Income | 23,106 | (7,082) | (1,401) | - | - | 782 | 15,405 |
Allowance for Loan Losses | (5,753) | - | 1,401 | - | - | (587) | (4,939) |
Net Interest Income after Loan Losses | 17,353 | (7,082) | - | - | - | 195 | 10,466 |
Fees | 6,200 | - | - | - | - | - | 6,200 |
General Expenses | (8,944) | - | - | 906 | (614) | - | (8,652) |
Personnel Expenses | (3,550) | - | - | - | (614) | - | (4,164) |
Administrative Expenses | (5,394) | - | - | 906 | - | - | (4,488) |
Tax Expenses | (2,307) | 692 | - | - | - | - | (1,614) |
Investments in Affiliates and Subsidiaries | 3 | - | - | - | - | - | 3 |
Other Operating Income/Expenses | (2,186) | - | - | - | - | (195) | (2,381) |
Operating Income | 10,119 | (6,390) | - | 906 | (614) | - | 4,022 |
Non Operating Income | 21 | - | - | - | - | - | 21 |
Net Profit before Tax | 10,140 | (6,390) | - | 906 | (614) | - | 4,043 |
Income Tax and Social Contribution | (6,913) | 6,390 | - | - | - | - | (523) |
Profit Sharing | (614) | - | - | - | 614 | - | - |
Minority Interest | (53) | - | - | - | - | - | (53) |
Net Profit | 2,560 | - | - | 906 | - | - | 3,466 |
29
ACCOUNTING AND MANAGERIAL | 2Q17 | Reclassifications | 2Q17 | ||||
RESULTS RECONCILIATION(R$ million) | Accounting | Exchange Hedge¹ | Credit Recovery² | Amort. of goodwill³ | Profit Sharing | FX | Managerial |
Net Interest Income | 7,951 | 1,665 | (547) | - | - | 29 | 9,098 |
Allowance for Loan Losses | (2,941) | - | 545 | - | - | 36 | (2,360) |
Net Interest Income after Loan Losses | 5,010 | 1,665 | (1) | - | - | 64 | 6,738 |
Fees | 3,792 | - | - | - | - | - | 3,792 |
General Expenses | (4,660) | - | - | 456 | (346) | - | (4,550) |
Personnel Expenses | (1,860) | - | - | - | (346) | - | (2,205) |
Administrative Expenses | (2,800) | - | - | 456 | - | - | (2,344) |
Tax Expenses | (729) | (163) | - | - | - | - | (892) |
Investments in Affiliates and Subsidiaries | 11 | - | - | - | - | - | 11 |
Other Operating Income/Expenses | (1,465) | - | 1 | - | - | (64) | (1,528) |
Operating Income | 1,959 | 1,502 | - | 456 | (346) | - | 3,572 |
Non Operating Income | (210) | - | - | - | - | - | (210) |
Net Profit before Tax | 1,750 | 1,502 | - | 456 | (346) | - | 3,362 |
Income Tax and Social Contribution | 576 | (1,502) | - | - | - | - | (926) |
Profit Sharing | (346) | - | - | - | 346 | - | - |
Minority Interest | (101) | - | - | - | - | - | (101) |
Net Profit | 1,879 | - | - | 456 | - | - | 2,335 |
ACCOUNTING AND MANAGERIAL | 1Q17 | Reclassifications | 1Q17 | ||||
RESULTS RECONCILIATION(R$ million) | Accounting | Exchange Hedge¹ | Credit Recovery² | Amort. of goodwill³ | Profit Sharing | FX | Managerial |
Net Interest Income | 10,541 | (967) | (789) | - | - | 83 | 8,868 |
Allowance for Loan Losses | (3,020) | - | 839 | - | - | (83) | (2,264) |
Net Interest Income after Loan Losses | 7,521 | (967) | 50 | - | - | - | 6,604 |
Fees | 3,709 | - | - | - | - | - | 3,709 |
General Expenses | (4,765) | - | - | 456 | (319) | - | (4,629) |
Personnel Expenses | (1,881) | - | - | - | (319) | - | (2,200) |
Administrative Expenses | (2,884) | - | - | 456 | - | - | (2,429) |
Tax Expenses | (1,000) | 95 | - | - | - | - | (906) |
Investments in Affiliates and Subsidiaries | 5 | - | - | - | - | - | 5 |
Other Operating Income/Expenses | (1,323) | - | (50) | - | - | - | (1,372) |
Operating Income | 4,147 | (872) | - | 456 | (319) | - | 3,411 |
Non Operating Income | (68) | - | - | - | - | - | (68) |
Net Profit before Tax | 4,078 | (872) | - | 456 | (319) | - | 3,343 |
Income Tax and Social Contribution | (1,845) | 872 | - | - | - | - | (973) |
Profit Sharing | (319) | - | - | - | 319 | - | - |
Minority Interest | (90) | - | - | - | - | - | (90) |
Net Profit | 1,824 | - | - | 456 | - | - | 2,280 |
30

31
Banco Santander (Brasil) S.A. | ||
| By: | /S/ Amancio Acurcio Gouveia | |
Amancio Acurcio Gouveia Officer Without Specific Designation | ||
| By: | /S/ Angel Santodomingo Martell | |
Angel Santodomingo Martell Vice - President Executive Officer | ||