SECURITIES AND EXCHANGE COMMISSION
Commission File Number: 001-34476
Bloco A – Vila Olimpia
São Paulo, SP 04543-011
Federative Republic of Brazil
Indicate by check mark if the registrant is submitting the Form 6-K in paper as permitted by Regulation S-T Rule 101(b)(1):
Yes _______ No ___X____
Indicate by check mark if the registrant is submitting the Form 6-K in paper as permitted by Regulation S-T Rule 101(b)(7):
Yes _______ No ___X____
Indicate by check mark whether by furnishing the information contained in this Form, the Registrant is also thereby furnishing the information to the Commission pursuant to Rule 12g3-2(b) under the Securities Exchange Act of 1934:
Yes _______ No ___X____
If “Yes” is marked, indicate below the file number assigned to the registrant in connection with Rule 12g3-2(b): N/A

Index
1. Message from the Chairman of the Board of Directors | 2 |
|
|
2. Call Notice | 3 |
|
|
3. Participation of the Shareholders in the OGM | 5 |
3.1. Attendance | 5 |
3.2. Representation by attorney-in-fact | 5 |
3.3. Remote Voting Participation | 6 |
3.4. ADRs Holders | 8 |
|
|
4. Matters to be resolved in the OGM | 9 |
4.1. To TAKE the management accounts, examining, discussing and voting the Company’s Financial Statements related to the fiscal year ended on December 31, 2017, together with the Management Report, the balance sheet, other parts of the financial statements, external auditors’ opinion and the Audit Committee Report | 10 |
4.2. To DECIDE on the destination of the net profit of the fiscal year of 2017 and the distribution of dividends | 12 |
4.3. To FIX the annual overall compensation of the Company´s management and members of Audit Committee | 14 |
|
|
EXHIBIT I – COMMENTS OF THE MANAGEMENT TO THE FINANCIAL CONDITION OF THE COMPANY | 15 |
(Pursuant to item III of Article 9 of Normative Instruction CVM 481) | 15 |
|
|
EXHIBIT II | 80 |
BOARD PROPOSAL FOR ALLOCATION OF NET PROFIT FOR THE FISCAL YEAR | 80 |
(Pursuant to item II of the sole paragraph of article 9, Annex 9-1-II to CVM Instruction 481) | 80 |
|
|
EXHIBIT III | 87 |
(Pursuant to item II of Article 12 to CVM Instruction 481) | 87 |
ITEM 13 of Annex 24 of CVM Instruction 481– Reference Form | 87 |
1
1.Message from the Chairman of the Board of Directors
Dear Shareholders,
I am very pleased to invite you, shareholder of Santander Brasil, to participate of the Ordinary General Meeting (“OGM”) of Santander Brasil, called for April 27, 2018 at 3 p.m.,at the Company's headquarters located atAvenida Presidente Juscelino Kubitschek,2041 and2235 – 1st mezzanine –Vila Olímpia - São Paulo, State of São Paulo, Brazil.
This Manual for Participation in the Ordinary General Meetings (“Manual”), was preparedto assist you on the comprehension of the presented matters, to take decisions, anticipating possible clarifications and voting orientations.
Pursuant to the Call Notice turned available, we shall take resolutions on the following matters:
(a)To TAKE the management accounts, examining, discussing and voting the Company’s Financial Statements related to the fiscal year ended on December 31, 2017, together with the Management Report, the balance sheet, other parts of the financial statements, external auditors’ opinion and the Audit Committee Report;
(b)To DECIDE on the destination of the net profit of the fiscal year of 2017 and the distribution of dividends; and
(c)To FIX the annual overall consideration of the Company´s management and members of Audit Committee.
In order to facilitate your analysis and appreciation of the matters to be resolved in the OGM, we attached as exhibits to this Manual all documents related to the matter of the Call Notice into the form of exhibits to this Manual, in attention to the CVM requirements.
Please read this carefully. We are at your disposal to clarify any doubts through our emailsacionistas@santander.com.br for individual investors and non-financial entities andri@santander.com.br for institutional investors.
We hope that this Manual will fulfill its purpose of assisting you with clarification on the matters to be resolved. Your participation in this important event is essential for the Company.
Very truly yours,
Álvaro Antônio Cardoso de Souza
Chairman of the Board of Directors
2
2.Call Notice
[to be published in theDiário Oficial do Estado de São Paulo (Official Gazette of the State of São Paulo) and Valor Econômico, in editions of March 28th, 29th and 30th, 2018]
BANCO SANTANDER (BRASIL) S.A.
Public-Held Company with Authorized Capital
Corporate Taxpayer ID (CNPJ/MF) 90.400.888/0001-42
Company Registration (NIRE) 35.300.332.067
CALL NOTICE-ORDINARY GENERAL MEETING -The shareholders are hereby called to attend the Ordinary General Meeting to be held on April 27, 2018, at 3 p.m., at the Company head offices, located in the City of São Paulo, State of São Paulo, Brazil, at Avenida Presidente Juscelino Kubitschek, 2235, 1º mezzanine, Vila Olímpia, to resolve on the following Agenda:
(a)To TAKE the management accounts, examining, discussing and voting the Company’s Financial Statements related to the fiscal year ended on December 31, 2017, together with the Management Report, the balance sheet, other parts of the financial statements, external auditors’ opinion and the Audit Committee Report;
(b)To DECIDE on the destination of the net profit of the fiscal year of 2017 and the distribution of dividends;
(c)To FIX the annual overall consideration of the Company´s management and members of Audit Committee.
The description and respective justifications of the matters included in the Agenda of this Meeting are set forth in the Manual for Participation in Shareholder´s meeting.
General Instructions:
1. Pursuant to paragraph 2 of Article 161 of Law 6.404/76 and CVM Instruction 324/00, the installation of the Fiscal Council by the General Meeting shall occur at the request of shareholders representing at least 2% of the voting shares, or 1% of the non-voting shares;
2. The shareholders or their legal representatives should attend the Ordinary General Meeting bringing the relevant identity documents. In the event of representation of a shareholder by means of a proxy, the shareholders shall deliver at the Company’s head office, no less than seventy-two (72) hours before the Ordinary General Meeting, a power of attorney granted according to the law;
3. The documents related to the matters to be analyzed at the Ordinary General Meeting are available to shareholders (i) at the Company’s head office, at Avenida Presidente Juscelino Kubitschek, 2235 - Vila Olímpia, São Paulo, State of São Paulo, Brazil, 9th floor - Corporate Law Department, where they can be consulted, on business days, from 10:00 am to 4:00 pm, and also at its website (www.ri.santander.com.br – in Corporate Governance > Minutes and Management Meetings); (ii) at the Brazilian Securities and Exchange Commission (Comissão de Valores Mobiliários- CVM), at Rua Sete de Setembro, 111, 5th Floor, Consultation Center, Rio de Janeiro/RJ or at Rua Cincinato Braga, 340, 2nd to 4th floors, Ed. Delta Plaza, São Paulo, State of São Paulo, Brazil, and on its website(www.cvm.gov.br) and (iii) at the B3 S.A. – Brasil, Bolsa, Balcão, at Rua XV de Novembro, 275, São Paulo, State of São Paulo, Brazil, and on its website (www.bmfbovespa.com.br); and
3
5.Remote Voting Form: the Company implemented the remote voting system in accordance with CVM Instruction 481/09, as amended by CVM Instructions 561 and 570/15, enabling shareholders to send Remote Voting Form directly to the Company, to the Company’s bookkeeper or their respective custody agent, according to the procedures described in the Manual for Participation in the OrdinaryGeneral Meeting.
São Paulo, March 27, 2018 –Álvaro Antonio Cardoso de Souza - Chairman of the Board of Directors.
__________________________________________________
4
3. Participation of the Shareholders in the OGM
The shareholders of Santander Brasil may attend the OGMpersonally, through aduly appointed and established attorney-in-fact or throughRemote Voting.
The following documents will be required from the shareholders to attend the OGM:
Individual | • ID document with photo1 (original or certified copy) •proof of ownership of shares issued by the Company, issued by the custody agent and / or custodian financial institution (original or certified copy) |
Legal entity | • corporate documents that evidence the legal representation of the shareholder (original or certified copy)2 • ID document of the legal representative with photo (original or certified copy) |
3.1. Attendance
The shareholders of Santander Brasil may attend the General Meetings by attending the place of their performance and declaring their vote, according to the kind of shares they hold (common and/or preferred) and the matters to be voted on. Pursuant to the provisions of Article 126 of Law 6.404/76, shareholders must attend the General Meetings, in addition to the identity document, proof of ownership of shares issued by the Company, issued by the depositary financial institution and/or custody agent. The Company recommends that such proof be issued within two (2) business days prior to the date scheduled for the Meeting.
Corporate shareholders, such as Commercial Companies and Investment Funds, must be represented in accordance with their Bylaws, Articles of Incorporation or Regulation, providing documents proving the regularity of the representation, accompanied by a Minutes of the election of the entity’s management members, as the case may be, in place and term indicated in the item below. Before the General Meetings are installed, the shareholders will sign the Attendance Book. Non-voting shareholders may attend General Meetings and discuss all matters submitted for deliberation.
__________________________________________________
3.2. Representation by attorney-in-fact
The shareholder may be represented at the OGM by a proxy, duly constituted by a public or private instrument, and pursuant to article 126, paragraph 1 of the Brazilian Corporation Law, the attorneys-in-fact must have been constituted less than one (1), and should be (i) the Company's shareholders, (ii) the Company's management members, (iii) lawyers, or (iv) financial institutions, with the administrator of to represent the fund’s quotaholders.
The originals or certified copies of the documents referred to above may be delivered at the Company's headquarters until the time of the OGM.
1 The following documents may be presented: (i) General Registration ID Card (RG); (ii) Foreigner Identity Card (RNE); (iii) Valid passport; (iv) Professional Class ID Card valid as a civil identity for legal purpose (e.g.: OAB, CRM, CRC, CREA); or (v) National Driver’s License (CNH) with photo.
2By-Laws/Articles of Association and Minutes/Instruments of election of the legal representatives registered with the pertinent body.
5
However, in order to turn available the access of shareholders at the OGM, we recommend that the delivery of these documents be made at least seventy-two (72) hours prior to the OGM.
In the case of sending the documents by e-mail, the originals or certified copies must be delivered to the Company's headquarters on the day of the OGM.
The documents must be delivered to the Company's registered office at Avenida Presidente Juscelino Kubitschek,2041 and2235 - Vila Olímpia - São Paulo, State of São Paulo, Brazil, 9th floor - Corporate Legal Department, at +55 11 3553-5438 and + 55 11 3553-5641, e-mail:juridsocietario@santander.com.br.
__________________________________________________
3.3. Remote Voting Participation
Pursuant to articles 21-A and following of CVM Instruction 481/2009, the Company's shareholders may also exercise their vote at general meetings by means of remote voting, to be formalized in an electronic document called Remote Voting Form, whose model is available in the Corporate Governance area ofthe Investor Relations website of Santander Brasil (www.ri.santander.com.br) or on the website of the Brazilian Securities and Exchange Commission (CVM) (http://sistemas.cvm.gov.br/?CiaDoc).
A shareholder that elects to exercise his right to vote at a Remote must do so by one of the options described below:
(i) Delivery of Remote Voting Form directly to the Custody Agent
The shareholder that chooses to exercise the remote voting through its custody agent (“Custody Agent”) shall transmit the voting instructions observing the rules determined by the Custody Agent, which shall send such voting manifestations to the Depositary Central ofB3 S.A. – Brasil, Bolsa, Balcão. The Shareholders must contact their respective Custody Agents to verify the procedures established by them for issuance of the voting instructions through the Form, as well as the documents and information required.
The Shareholder shall transmit the instruction for fulfillment of the Form to the Custody Agent untilApril 20th, 2018(including), except if a different term is determined by the Custody Agents.
(ii) Delivery of Remote Voting Form directly to the bookkeeper
The shareholder that chooses to exercise the remote voting through the Company’s bookkeeper must observe the following instructions in order for the Remote Voting Form to be considered valid and the votes counted:
(i) all the blank spaces must be duly fulfilled;
(ii) all the pages must be initialed;
(iii) the last page must be signed by the shareholder or its legal representative(s), as the case may be and pursuant to the applicable legislation in force; and
(iv) the Form must be certified by a notary.
The following documents have to be sent to the Company’s bookkeeper:
(i) original Form, duly fulfilled, initialed and signed; and
6
(ii) certified copies of the documents that follows:
· Individual (shareholder or legal representative): Identification document with picture (Identity Card - RG and CPF/MF; Driver License – CNH or Professional Card issued with public faith and containing the CPF number). For documents issued abroad it is necessary the respective sworn translation duly certified by the competent consulate (“consularization”).
· Legal Entities/Corporations: (i) Articles of Association or Bylaws duly updated, with the document that prove the representation powers (minutes of election); (ii) Identity Card with picture of the representatives (RG and CPF; CNH or Professional Card issued with public faith and containing the CPF number). For documents issued abroad it is necessary the respective sworn translation duly certified by the competent consulate (“consularization”).
The documents must be sent to the Company’s bookkeeper within seven (7) days before the Ordinary General Meeting, in fact,until April 20th, 2018(including), through(i)mail to Banco Santander (Brasil) S.A. –Acionistas –Escrituração de Ações – Rua Amador Bueno, 474 – 2nd floor – Block D – Santo Amaro – São Paulo/SP, Brazil – 04752-005; or(ii) e-mail for: custodiaacionistavotoadistancia@santander.com.br.
After the receipt of such documents, the bookkeeper, within three (3) days, shall inform the shareholder about the receipt of such documents and its acceptance. If the sent documents are not considered proper, the Form shall be deemed invalid, being the shareholder able to regularize ituntil April 20th, 2018.
The Forms received by the bookkeeper afterApril 20th, 2018 shall not be considered for voting purposes.
(iii) Delivery of the Remote Voting Form directly to the Company
The shareholder that chooses to exercise the remote voting directly through the Company observe the following instructions in order for the Remote Voting Form to be considered valid and the votes counted:
(i) all the blank spaces must be duly fulfilled;
(ii) all the pages must be initialed;
(iii) the last page must be signed by the Shareholder or its legal representative(s), as the case may be and pursuant to the applicable legislation in force; and
(iv) the Form must be certified by a notary.
The following documents have to be sent to the Company:
(i) original Form, duly fulfilled, initialed and signed; and
(ii) certified copies of the documents that follows:
· Individual (shareholder or legal representative): Identification document with picture (Identity Card - RG and CPF/MF; Driver License – CNH or Professional Card issued with public faith and containing the CPF number). For documents issued abroad it is necessary the respective sworn translation duly certified by the competent consulate (“consularization”).
· Legal Entities/Corporations: (i) Articles of Association or Bylaws duly updated, with the document that prove the representation powers (minutes of election); (ii) Identity Card with picture of the representatives (RG and CPF; CNHor Professional Card issued with public faith and containing the CPF number). For documents issued abroad it is necessary the respective sworn translation duly certified by the competent consulate (“consularization”).
7
The documents must be sent to the Company within seven (7) days before the Ordinary General Meeting, in fact,until April 20th, 2018(including),through(i) mail to Banco Santander (Brasil) S.A. – Investors Relations – Avenida Presidente Juscelino Kubitschek, 2235 – 26th floor – Vila Olímpia – São Paulo/SP, Brazil –04543-011; or(ii) via e-mail: ri@santander.com.br.
After the receipt of such documents, the Company, within three (3) days, shall inform the shareholder about the receipt of such documents and its acceptance. If the sent documents are not considered proper, the Form shall be deemed invalid, being the shareholder able to regularize it untilApril 20th, 2018.
The Forms received by the Companyafter April 20th, 2018 shall not be considered for voting purposes.
General Information:
ü in accordance with Article 21-S of CVM Instruction 481, the Central Depositary ofB3 S.A. – Brasil, Bolsa, Balcão, upon receiving shareholder voting instructions through its respective custody agent, shall not consider any instructions that differ from the same resolution that have been issued by the same CPF or CNPJ registration number; and
ü after the deadline for remote voting, that is,until April 20th, 2018(including), the shareholder may not change the voting instructions already sent, unless presented at the Ordinary General Meeting or represented by proxy, upon explicit request to not consider the instructions in the Remote Voting Form submitted before the respective Forms were placed.
__________________________________________________
3.4. ADRs Holders
Holders of American Depositary Receipts (ADRs) will be entitled to vote on matters listed on the Agenda, according to the same criteria applied to national investors, according to the type of shares (common or preferred) in which their ADRs are backed. The holders of ADRs will be duly instructed by The Bank of New York Mellon, the depositary financial institution of the ADRs backed by the shares of Santander Brasil.
__________________________________________________
8
4. Matters to be resolved in the OGM
Below you shall find clarifications made by the Company’s management regarding each of the items to be resolved in the OGM.
Pursuant to Article 132 of the Brazilian Corporate Law and Article 6 of the Company’s Bylaws, the Ordinary General Meeting shall be held until April 30th of each year.
According to the Call Notice made available to the shareholders, our OGM shall take resolutions regarding the following matters of the Agenda:
__________________________________________________
9
4.1. To TAKE the management accounts, examining, discussing and voting the Company’s Financial Statements related to the fiscal year ended on December 31, 2017, together with the Management Report, the balance sheet, other parts of the financial statements, external auditors’ opinion and the Audit Committee Report
The documents presented by the management are:
- Management Report showing the operating statistics and the analysis and discussion of the Administrative Officers of the principal accounts of the Statement of Income for the Fiscal Year;
- Comments of the administrative officers on the financial condition of the Company (Exhibit I – Item 10 of the Reference Form);
- Copy of the Financial Statements and Explanatory Notes;
- Opinion of the Independent Auditors;
- Summary of the report of the Audit Committee; and
- Standardized financial statements form – DFP.
The management documents identified above, except for item ii above, were made available to the CVM, via the IPE system, at the time of disclosure of the individual and consolidated financial statements of the Company prepared in accordance with Accounting Practices Adopted in Brazil applicable to institutions authorized to operate by the Brazilian Central Bank, on January 30th, 2018, and for the consolidated financial statements of the Company in accordance with the IFRS as issued by the IASB turned available on February 15th, 2018. These documents can be found on the electronic address of the CVM (www.cvm.gov.br), or of the Company (www.ri.santander.com.brand www.santander.com.br/acionistas),according to information shown inExhibit I of this Manual.
The management accounts are presented by the Executive Board in the Management Report and in the Financial Statements of the Company. Before being disclosed to and approved by the shareholders in the OGM, the accounts must be first approved by the Board of Directors.
The Management Report contains information of financial and non-financial nature, in addition to statistical and operating information, analysis and discussion of the principal accounts of the Statement of Income for the Fiscal Year, as well as information related to the collaborators, to social responsibility, to the capital market and to corporate governance, among others.
The Financial Statements express the economic and financial condition of the Company and the changes in equity occurred in the fiscal year to which they refer. From an analysis of the Financial Statements, it is possible to assess the equity condition, the liquidity ratios, the level of profitability and the level of indebtedness of the Company.
The individual and consolidated Financial Statements prepared in accordance with Accounting Practices Adopted in Brazil applicable to institutions authorized to operate by the Brazilian Central Bank consist of five (5) documents, to wit:
- Balance Sheet;
- Statement of Income for the Fiscal Year;
- Statement of Stockholders’ Equity;
- Statement of Cash Flows; and
- Statement of Aggregated Value.
10
The consolidated financial statements prepared according to IFRS consist of six (6) documents, to wit:
i. Consolidated Balance Sheet;
ii. Consolidated Statement of Income for the Fiscal Year;
iii. Consolidated Statement of Revenues and Expenses;
iv. Consolidated Statement of Stockholders’ Equity;
v. Consolidated Statement of Cash Flows; and
vi. Consolidated Statement of Aggregated Value (following the Brazilian standards, filed with the DFP).
The Explanatory Notes present information on the basis for preparation of the Financial Statements and of the accounting practices applied to businesses and significant events of the Company, provide additional information not shown in the tables of the financial statements and that are considered necessary for proper presentation, and designate:
- The principal criteria for assessment of the equity elements, particularly stocks, of the depreciation, amortization and depletion calculations, of the accrual of provisions for charges or risks, and of the adjustments to recognize the probable losses in the realization of elements of assets;
- The investments in other companies, when relevant;
- The increase of the value of elements of assets resulting from new valuations;
- The real encumbrances created on elements of assets, the guarantees pledged to third parties and other eventual or contingent liabilities;
- The interest rates, the dates of maturity and the guarantees for long-term liabilities;
- The number, kinds and classes of the shares of capital stock;
- The share purchase options granted and exercised in the fiscal year;
- The adjustments to previous fiscal years’ equity.
The shareholders must analyze in detail the Explanatory Notes relative to the Financial Statements of the Company so as to resolve on their approval.
The Financial Statements of the Company have been audited and obtained an opinion without exceptions from PricewaterhouseCoopers Auditores Independentes, the Company’s independent auditors.
Also, the summary of the Audit Committee’s report, which is prepared on a six-monthly basis, contains the activities carried out within the scope of its attributions, an assessment of the effectiveness of the internal control systems, a description of the recommendations presented to the Company’s Executive Board, an assessment of the effectiveness of the independent and internal audits, as well as an assessment of the quality of the Financial Statements. For fiscal year 2017, the Audit Committee concluded that the works conducted are efficacious and confer transparency and quality on the financial statements of the Santander Brasil Group and recommended their approval by the Board of Directors.
The Financial Statements have December 31st, 2017 as their base date and relate to the fiscal year ended on that date.
On January 29th, 2018 the Board of Directors of the Company approved without restrictions the Financial Statements of the Company, elaborated by the BRGAAP criterion, and that they will be forwarded for approval by the shareholders of the Company, according to the applicable legislation.
11
The Financial Statements of the Company, elaborated by the IFRS criterion were subject to approval by the Board of Directors of the Company on February 15th, 2018.
The Financial Statements and the documents on which they were based were prepared based on Accounting Practices Adopted in Brazil, on the terms of the Brazilian Corporate Law, of the norms of the CMN and of the Central Bank, as well as in accordance with the COSIF model and other applicable regulations and legislation. The Financial Statements and the documents that compose them, prepared by the IFRS criterion, were prepared according with the International Financial Reporting Standards (IFRS), issued by the International Accounting Standards Board (IASB) and the interpretations of the Interpretations Committee of the IFRS (current designation of the IFRIC). In this sense, the management recommends their approval without restrictions.
__________________________________________________
4.2. To DECIDE on the destination of the net profit of the fiscal year of 2017 and the distribution of dividends
(a) Net Profit Allocation
The Executive Board presents a proposal for the fiscal year 2017 net profit allocation in compliance with the provisions of Article 9, first paragraph, item II and the respective Annex 9-1-II to CVM Instruction 481. Said proposal is contained inAnnex II to this Manual. We recommend the careful reading of said annex.
Net profit corresponds to the result recorded in the fiscal year, after deductions of accumulated losses, provision for income tax and statutory profits of employees and administrators, if applicable.
The net profit of the Company in the fiscal year 2017 was R$ 7,995,872,037,03.
The allocation of the net profit consists in determining the net profit installments: (i) which will be appropriated to legal and statutory profit reserves, (ii) which will be distributed as dividends, or (iii) retained.
The board shall submit to the Ordinary General Meeting a proposal for allocation to be given to the net profit of the fiscal year, which shall observe the provisions in the Corporations Law and in Article 36 of the Company's Bylaws:
- 5%, at least, to the legal reserve, until reaching 20% of the share capital. In the fiscal year in which the legal reserve balance, added to capital reserve amounts, exceeds 30% of the share capital, the allocation of part of the fiscal year's net profit to the legal reserve will not be mandatory;
- 25% of the annual net income adjusted pursuant to Article 202 of Corporations Law for the payment of mandatory minimum dividends to shareholders; and
- The remaining balance, if there is any, may(a) be allocated to the Reserve for Dividend Equalization, which will be limited to 50% of the share capital and its purpose will be to ensure resources for the payment of dividends, including as interest on own capital, or interim, in order to maintain the flow of remuneration to shareholders, and, upon reaching that limit, the ordinary general meeting shall be responsible for deciding on the balance, either proceeding its distribution to shareholders or to the increase of share capital, or(b) be retained in order to meet capital investment requirements set forth in the Company's general budget submitted by the board to approval by the general meeting and revised annually by said meeting when having a duration of more than one fiscal year.
12
The Reserve balance for Dividend Equalization, added to the balances of other profit reserves, upon implementing unrealized profit reserves and contingency reserves, may not exceed the value of the share capital. Once this maximum limit is reached, the general meeting may decide on the application of the excess in the payment or increase of the share capital, or in the distribution of dividends.
The profits not allocated in the terms above must be distributed as dividends, according to paragraph 6 of Article 202 of Corporations Law.
On the basis of the above, the board proposes the following allocation for the fiscal year 2017 net profit:
1. The value of R$ 399,793,601,85 to the Legal Reserve account;
2. The value of R$ 6,300,000,000,00 as dividends and interest on own capital to shareholders, which have been the object of decision in the meetings of the Board of Directors held on April 25, July 25, September 29 and December 28, 2017, of which R$3,800,000,000,00as interest on net equity charged to the value of the mandatory minimum dividends andR$2,500,000,000,00 in the form of interim dividends; and
3. The balance of the remaining net profit after the distributions above, to the value of R$ 1,296,078,435,18 for the Dividend Equalization Reserve account, pursuant to Article 36, item III-a of the Company's Bylaws.
The board understands that the proposal for allocation of net profits above was formulated in accordance with the legal and statutory obligations applicable to the Company, and is in line with the goals and strategies of the Company, which is why the board recommends its approval without restrictions.
(b) Distribution of Dividends
Dividend is the amount distributed to shareholders of a company, in cash, in proportion to the quantity of shares held resulting from the profits obtained by a company in the current fiscal year or in past fiscal years. Participation in the share profits is an essential right of the shareholder, as provided for in Art. 109 of Corporations Law.
What is mandatory dividend?
Mandatory dividend, as provided for in Article 202 of Corporations Law, corresponds to a share of the net profit which the company cannot fail to distribute to its shareholders, consisting of a commitment to a minimum distribution. In Santander Brasil, the amount related to the mandatory dividend may not be less than 25% of the annual net profit in adjusted pursuant to Article 202 of Corporations Law.
The Company may only pay dividends to the net profit account of the fiscal year, to the accumulated profits and the profit reserve accounts, with the exception of the legal reserve.
13
As better detailed inAnnex II of this Manual, the board has approved the distribution to shareholders in the overall amount of R$ 6,300,000,000,00 as dividends and interest on own capital to shareholders, which have been the object of decision in the meetings of the Board of Directors held on April 25, July 25, September 29 and December 28, 2017, of which R$3,800,000,000,00as interest on net equity charged to the value of the mandatory minimum dividends andR$2,500,000,000,00 as intercalary dividends. These values correspond to 82,94% of the adjusted net profit of the Company, and were paid to shareholders based on their respective shares in the share capital of the Company.
__________________________________________________
4.3. To FIX the annual overall compensation of the Company´s management and members of Audit Committee
The management presents a proposal for compensation of the Company’s management, complying with the provisions of Article 12, items I and II of CVM Instruction 481 and item 13 of the Reference Form of the Company, on the terms ofExhibit III to this Manual.
In 2017, the Ordinary General Meeting, held on April 28, approved a total annual compensation for the managers of the Company, in an amount of up to R$ 300,000,000,00 (three hundred million reais) for the 2017 financial year, and for the Audit Committee in an amount of R$ 3.000.000,00 (three million reais) for the twelve-month (12) period from January 1st, 2017. Effectively, for the period from January to December, 2017 it was paid to the Company’s management members the amount of R$ 233,002,531,69 (two hundred and thirty three million, two thousand, five hundred and thirty one reais and sixty nine cents), being acknowledged that such amount does not include social security duties.
For the period from January to December, 2018, the amount proposed by management as the overall compensation of the Company’s management members (Board of Directors and Executive Board) is up to R$ 300.000.000,00 (three hundred million reais), covering fixed compensation, variable pay and the portion based on shares.
The management members global compensation amount proposed is the same of the cap amount approved for the period from January to December, 2017, without considering the social security duties, which the estimative for the period from January to December 2018 is to reach the amount of R$ 24.000.000,00 (twenty four million reais).
According to Article 17, item IV of the Bylaws of the Company, it is incumbent upon the Board of Directors to establish the compensation, the indirect benefits and the other incentives for the Executive Officers, within the overall limit of management compensation approved by the General Meeting.
In addition, according to Article 6, third paragraph of the Bylaws of the Company, the General Meeting will establish annually the overall amount of the compensation of the Audit Committee and of the Fiscal Council, if installed, together with the compensation of the Company’s management members.
14
The amount proposed by the Board of Directors as overall compensation of the members of the Audit Committee for the twelve (12) months period counting from January 1st, 2018 is of R$ 3.000.000,00 (three million reais).
15
EXHIBIT I – COMMENTS OF THE MANAGEMENT TO THE FINANCIAL CONDITION OF THE COMPANY
(Pursuant to item III of Article 9 of Normative Instruction CVM 481)
10. Officers comments
10.1 Officers should comment on:
a. general financial and equity conditions
(i) 2017
In 2015, the adjustment in economic policy that resulted in additional tightening of monetary policy; adjustment in federal spending and tax increase; significant depreciation of the exchange rate and realignment of the prices of public tariffs, resulted in a significant reduction in disposable income and, consequently, in contraction of the economy. The contraction of GDP growth by 3.5% this year led to the downgrade of Brazil's credit rating to speculative grade status by S & P, Fitch Ratings and Moody between late 2015 and early 2016. Several large Brazilian companies were also downgraded during the same period. Such downgrades have aggravated the conditions of the Brazilian economy and the financial situation of Brazilian companies, especially those that depend on foreign investments. In 2016, the economy again contracted by 3.5% due to the effects of macroeconomic adjustments on the labor market and disposable income. The unemployment rate in 2016 was 12.8% on average.
In 2017, from the second quarter economic activity began to signal recovery and end of the recession. Household consumption increased by 0.6% in the second quarter of 2017 compared to the second quarter of 2016, after nine consecutive quarters of contraction in annual terms. The GDP of 2017 registered growth of 1%, mainly due to the excellent performance of the agricultural sector, which grew 13% in the year and also the recovery of household consumption, which grew 1% in the year. The agricultural performance is due to the record crop, and the growth of household consumption is due to the effects of rebalancing the economy and, mainly, to the first impacts of the monetary loosening started in October 2016. However, despite the resumption of growth Brazil's sovereign credit rating was lowered again in early 2018. This downgrade should continue to constrain the volume of investments in the country.
In the year ended December 31, 2017, the Company reported a consolidated net income of R$9.1 billion, a 22.4% increase compared to 2016. Total assets in the year ended December 31, 2017, reached R$645,703 million, an increase of 1.8% compared to 2016. Shareholders’ equity reached R$87,425 million and the adjusted ROE (excluding effect of goodwill) was of 15.4% in 2017.
The Basel adequacy rate of the Company, according to the Central Bank rules, was 15.8% as of December 31, 2017.
As of December 31, 2017, the gross clients loans and advances portfolio of the Company grew 7.2% and reached R$287,829 million, compared to R$268,438 million as of December 31, 2016.
The chart below presents the management details on the loans and advances portfolio (gross) of the Company per client category on the indicated dates.
16
| For the year ended December, 31 | Variations between December 31, 2017 vs. December 31, 2016 | |||
| 2017 | 2016 | 2015 | R$ million | % |
| (in millions of R$ , except for percentages) | ||||
Individuals | 107,610 | 91,195 | 84,578 | 16,415 | 18.0% |
Consumers financing | 33,170 | 26,608 | 25,850 | 6,562 | 24.7% |
Small and Medium Companies (1) | 46,879 | 42,440 | 43,524 | 4,439 | 10.5% |
Large Companies (2) | 100,171 | 108,195 | 113,315 | (8,024) | (7.4)% |
Total | 287,829 | 268,438 | 267,266 | 19,391 | 7.2% |
(1) Companies with annual gross revenue of up to R$ 200 million.
(2) Companies with annual gross revenue higher than R$ 200 million, including global corporate clients of the Company.
Total funding of the Company as of December 31, 2017 was of R$434,620 million, a 0.02% reduce compared to R$434,700 million on December 31, 2016.
(ii) 2016
In the year ended on December 31, 2016, the Company reported a consolidated net income of R$ 7.5 billion, a 24.1% drop compared to 2015. Total assets in the year ended December 31, 2016, reached R$ 634,393 million, up 4.8% from 2015. Shareholders’ equity reached R$ 85.435 million and the adjusted ROE (excluding effect of spread) was of 13.3% in 2016.
The Basel adequacy rate of the Company, according to the Central Bank rules, was 16.3% as of December 31, 2016.
As of December 31, 2016, the gross clients loans and advances portfolio of the Company grew 0.4% and reached R$ 268,438 million, compared to R$ 267,266 million as of December 31, 2015.
The chart below presents the management details on the loans and advances portfolio (gross) of the Company per client category on the indicated dates.
| For the year ended December, 31 | Variations between December 31, 2016 vs. December 31, 2015 | |||
| 2016 | 2015 | 2014 | R$ million | % |
| (in millions of R$ , except for percentages) | ||||
Individuals | 91,195 | 84,578 | 77,809 | 7.8% | 6,617 |
Consumers financing | 26,608 | 25,850 | 27,686 | 2.9% | 758 |
Small and Medium Companies (1) | 42,440 | 43,524 | 42,191 | (2.5)% | (1,084) |
Large Companies (2) | 108,195 | 113,315 | 101,425 | (4.5)% | (5,120) |
Total | 268,438 | 267,266 | 249,111 | 0.4% | 1,171 |
(1) Companies with annual gross revenue of up to R$ 200 million.
(2) Companies with annual gross revenue higher than R$ 200 million, including global corporate clients of the Company.
Total funding of the Company as of December 31, 2016 was of R$434,700 million, a 2.2% increase compared to R$ 425,209 million on December 31, 2015.
(iii) 2015
In the year ended December 31, 2015, the Company reported a consolidated net income of R$ 9.8 billion, up 72.3% from 2014. Total assets in the year ended December 31, 2015, reached R$ 605,394 million, up 16.4% from 2014.
17
Shareholders’ equity reached R$ 83,532 million and the adjusted ROE (excluding effect of spread) was of 18.5% in 2015.
The Basel adequacy rate of the Company, according to the Central Bank rules, was 15.7% as of December 31, 2015.
As of December 31, 2015, the gross clients loans and advances portfolio of the Company grew 7.3% and reached R$ 267,266 million, compared to R$ 249,111 million as of December 31, 2014.
Total funding of the Company as of December 31, 2015 was of R$ 425,209 million, a 15.3% increase compared to R$ 368,740 million on December 31, 2014.
b. capital structure:
Liability Structure | ||||||
LIABILITIES In million of Real | Dec/17 | % of total liability | Dec/16 | % of total | Dec/15 | % of total liability |
Own Capital - Stockholders' Equity(1) | 87,088 | 13% | 84,813 | 13% | 79,835 | 13% |
Third Capital - Short term(2) | 380,121 | 59% | 387,176 | 61% | 307,762 | 51% |
Third Capital - Long term(3) | 178,494 | 28% | 162,404 | 26% | 217,797 | 36% |
Total Liability | 645,703 | 100% | 634,393 | 100% | 605,395 | 100% |
Further, the chart below shows the direct equity interest (common and preferred shares) as of December 31, 2017:
Shareholder | Common shares (thousands) | Common shares (%) | Preferred shares (thousands) | Preferred shares (%) | Total Shares (thousands) | Total Shares % |
|
| |||||
Sterrebeeck BV(5) | 1,809,583 | 47.39% | 1,733,644 | 47.11% | 3,543,227 | 47.25% |
Grupo Empresarial Santander SL | 1,107,673 | 29.01% | 1,019,645 | 27.71% | 2,127,318 | 28.37% |
Banco Santander, S.A. | 521,964 | 13.67% | 519,268 | 14.11% | 1,041,232 | 13.89% |
Treasury stock(1) | 5,845 | 0.15% | 5,845 | 0.16% | 11,690 | 0.16% |
Banco Madesant | 950 | 0.02% | 950 | 0.03% | 1,900 | 0.03% |
Employees(3) | 7,567 | 0.20% | 7,573 | 0.21% | 15,140 | 0.20% |
Other minority shareholders(4) | 365,113 | 9.56% | 392,912 | 10.68% | 758,024 | 10.11% |
Total | 3,818,695 | 100.00% | 3,679,836 | 100.00% | 7,498,531 | 100.00% |
(1) On December 18, 2017, the Company’s shareholders approved the cancellation of 64,551,366 treasury shares with no capital reduction as a result of such retirement.
(2) Includes members of senior management of the Company.
(3) An affiliate of Santander Group
(i) Equity Capital and Interest of Non-Controlling Shareholders
As of December 31, 2017, the Company’s capital was of R$ 57,000 million, fully paid, and divided into 7,498,531,051 shares, all of them registered, book-entry and with no par value.
Pursuant to the Company’s current Bylaws, the Company’s capital may be increased up to the limit of the authorized capital, irrespective of amendments to the Bylaws, upon a resolution of the Board of Directors of the Company and issuance of up to 9,090,909,090 new shares, whereas the total number of preferred shares shall not exceed 50.0% of the total number of outstanding shares. Any capital increase in excess of such limit requires the approval of the shareholders.
18
(ii) Equity and Third-Parties’ Capital
The revenue from equity capital in the year ended December 31, 2017 totalized R$ 83 million, and recorded an R$ 175 million decreased compared to the R$ 259 million revenue in the year ended December 31, 2016. This decrease is mainly due to a decrease in dividends from investments recorded on financial assets available for sale.
(iii) Reference Assets – Basel Ratio
The Company’s capital management is based on traditional principles and ongoing monitoring of items that affect the Company’s solvency level. The Company must abide by the Brazilian regulations of capital adjustment according to the rules of the Central Bank. In October 2013, the new regulations of capital implementation and the reference assets requirements of the Basel Committee on Banking Supervision (Basel III) came into force in Brazil. The minimum reference assets requirements are currently 11% and may reach 11.75%, considering the maximum amount of the Premium Principal Capital for 2017, of 1.25. The requirement Level I is 6.0%, divided into basic capital of at least 4.5%, mainly comprised of capital stock and reserves of profits, including shares, ownership units, reserves and income earned, and additional capital mainly comprised of certain reserves, and bonds and hybrid instruments as capital authorized by the Central Bank.
According to the new reference assets rules in Brazil, the premium amount in the calculation of the capital base was deducted from the capital base according to the “phase-in” for implementation of Basel III in Brazil, which will be completed until the beginning of 2019. The table below shows the percentage of premium deduction required for each year until 2019:
Basel II Phase in | |||||
2013 | 2014 | 2015 | 2016 | 2017 | 2018 |
0% | 20% | 40% | 60% | 80% | 100% |
Source: Central Bank; Resolution CMN No. 4,192 March, 2013.
Moreover, if the Basel III requirements were fully implemented on this date, the Company would keep a suitable reference assets index according to the Basel III rules those of Central Bank.
The Basel adequacy rate of the Company, according to the Central Bank rules, was 15.8% as of December 31, 2017.
19
| On December 31, | |||||
| 2017(1) | 2016(1) | 2015(1) | |||
| (In millions of R$ , except percentages) | |||||
Level I Reference Assets | 56,386.0 | 56,264,0 | 52,976.6 | |||
Principal Capital | 52,196.9 | 52,136.8 | 48,031.7 | |||
Supplementary Capital | 4,189.1 | 4,127.2 | 4,944.9 | |||
Level II Reference Assets | 4,250.5 | 4,280.8 | 5,182.1 | |||
Reference Assets (Level I and II) | 60,636.4 | 60,544.9 | 58,158.6 | |||
Required Reference Assets | 35,439.8 | 36,669.6 | 40,683.5 | |||
Credit Risk Portion(3) | 30,034.4 | 31,309.9 | 36,508.2 | |||
Market Risk Portion(4) | 2,391.8 | 2,388.6 | 2,301.0 | |||
Operational Risk Portion | 3,013.6 | 2,971.0 | 1,874.3 | |||
Level I Basel Ratio | 14.7% | 15.2% | 14.3% | |||
Basel Ratio Principal Capital | 13.6% | 14.0% | 13.0% | |||
Basel Ratio | 15.8% | 16.3% | 15.7% | |||
|
|
|
| |||
(1) Amounts calculated based on consolidated information by Prudential Consolidated.
(2) Amounts calculated based on consolidated information by financial institutions (Financial Conglomerate).
(3) For the calculation of capital allocation for Credit Risk, the modifications and inclusions of Bacen Official Letter 3714 of August 20, 2014, Bacen Official Letter 3770 of October 29, 2015, which amends Official Letter 3644 of March 4, 2013 were considered.
(4) It includes portions for exposure to market risk subject to variations on coupon rates in foreign currency, or "PJUR2", price indexes or "PJUR3" and interest rate or "PJUR1 / PJUR4", of the price of goods “commodities” or "PCOM”, of the price of shares classified as negotiation portfolios, or "PACS”, and portions for exposure to gold, foreign currency and transactions subject to currency variation, or “PCAM.”
c. ability to pay the financial obligations assumed
The Management Board understands that the Company shows financial and equity conditions sufficiently adequate for the payment of their assumed obligations.
The administration of Company's creditworthiness is made dynamically through the implementation of limits and control models, approved and supervised by the Assets and Liabilities Committee (ALCO), which operates according to guidelines and procedures established by Grupo Santander and the Central Bank. The control and management of the creditworthiness are made through the analysis of cash flow positions, structural liquidity and simulations of potential losses of resources under stress scenarios. Also, a plan is prepared containing funding requirements that consider the best structure for the funding sources, in order to achieve the necessary diversification in terms of maturities, instruments and markets, as well as the establishment of contingency plans. These controls, together with the maintenance of a minimum liquidity margin, guarantee sufficient resources to honor client deposits and other obligations, to give loans and financing to clients, fulfill the specific needs of working capital for investment and to cope with occasional risks related to liquidity crisis.
The Company actively administers the risks intrinsic to the activity of commercial bank, such as structural risks of interest rates, liquidity and foreign exchange rates. The objective of the financial management is to turn the net income with interest from commercial activities more stable and recurring, maintaining adequate levels of liquidity and solvency. Financial management also analyses the risk of structural interest rate derived from the divergences between the maturities and review of assets and liabilities in each currency operated by the Company.
20
The following table shows the intervals between the pricing dates of financial assets and liabilities with different maturity dates, on December 31, 2017, 2016 and 2015, respectively (liquidity position):
|
|
|
|
|
|
| 2017 |
|
|
|
|
|
| Thousands of Reais | |
| On | Up to | 3 to | 1 to | 3 to | After 5 |
|
| Demand | 3 Months | 12 Months | 3 Years | 5 Years | Years | Total |
Assets: |
|
|
|
|
|
|
|
Cash and balances with the Brazilian Central Bank | 67.033 | 15.071 | 18.762 | - | - | - | 100.866 |
Debt instruments (2) | 609 | 1.887 | 21.978 | 31.670 | 19.379 | 45.732 | 121.255 |
Equity instruments | 66 | 124 | 305 | 842 | - | 293 | 1.630 |
Loans and amounts due from credit institutions | 18.710 | 1.753 | 183 | 10.382 | 18 | 1.254 | 32.300 |
Loans and advances to customer | 31.066 | 70.302 | 61.287 | 63.375 | 17.796 | 28.594 | 272.420 |
Loans and Receivables - Debt instruments | 933 | 476 | 3.520 | 7.445 | 3.912 | 1.331 | 17.617 |
Held to maturity investments | - | - | - | 474 | 1.169 | 8.571 | 10.214 |
Derivatives |
|
|
|
|
|
|
|
Total | 118.417 | 90.040 | 107.069 | 123.658 | 46.632 | 87.749 | 573.565 |
Liabilities: |
|
|
|
|
|
|
|
Financial liabilities at amortized cost: | - | - | - | - | - | - | - |
Deposits from credit institutions(1) | 394 | 21.636 | 44.697 | 6.798 | 2.718 | 3.132 | 79.375 |
Customer deposits(1) | 64.512 | 103.511 | 48.340 | 42.494 | 17.176 | 9 | 276.042 |
Marketable debt securities (1) | - | 14.315 | 35.637 | 17.923 | 1.492 | 880 | 70.247 |
Subordinated liabilities | - | - | 519 | - | - | - | 519 |
Debt Instruments Eligible to Compose Capital | - | 114 | - | - | - | 8.323 | 8.437 |
Other financial liabilities | 11.711 | 30.985 | 1.538 | 27 | - | - | 44.261 |
Financial liabilities held for trading: | - | - | - | - | - | - | - |
Short positions | - | - | 466 | 8.961 | 7.476 | 15.905 | 32.808 |
Derivatives | - | 770 | 976 | 8.244 | 4.239 | 2.449 | 16.678 |
Total | 76.617 | 171.331 | 132.173 | 84.447 | 33.101 | 30.698 | 528.367 |
|
|
|
|
|
|
| 2016 |
|
|
|
|
|
| Thousands of Reais | |
| On | Up to | 3 to | 1 to | 3 to | After 5 |
|
| Demand | 3 Months 12 Months | 3 Years | 5 Years | Years | Total | |
Assets: |
|
|
|
|
|
|
|
Cash and balances with the Brazilian Central Bank | 14.918 | 42.538 | 3.833 | - | - | 49.315 | 110.605 |
Debt instruments (2) | - | 21.709 | 10.136 | 26.674 | 28.135 | 30.838 | 117.493 |
Equity instruments | 594 | 48 | 252 | 486 | 21 | 1.025 | 2.426 |
Loans and amounts due from credit institutions | 13.614 | 2.850 | 923 | 532 | 34 | 9.808 | 27.762 |
Loans and advances to customer | 30.409 | 68.218 | 60.047 | 54.558 | 17.357 | 21.412 | 252.003 |
Loans and Receivables - Debt instruments | 823 | 1.287 | 2.960 | 5.045 | 4.473 | 1.695 | 16.283 |
Held to maturity investments | - | - | 12 | 372 | 1.173 | 8.491 | 10.049 |
Total | 60.357 | 136.651 | 78.165 | 87.668 | 51.194 | 122.586 | 536.622 |
Liabilities: |
|
|
|
|
|
|
|
Financial liabilities at amortized cost: |
|
|
|
|
|
| |
Deposits from credit institutions(1) | 770 | 40.581 | 23.315 | 8.215 | 2.818 | 2.934 | 78.634 |
Customer deposits(1) | 60.919 | 64.154 | 68.506 | 39.630 | 14.004 | 232 | 247.445 |
Marketable debt securities (1) | - | 21.834 | 56.638 | 20.620 | 312 | 439 | 99.843 |
Subordinated liabilities | - | - | - | 466 | - | - | 466 |
Debt Instruments Eligible to Compose Capital | - | 114 | - | - | - | 8.198 | 8.312 |
Other financial liabilities | 3.004 | 33.560 | 0 | 8 | - | 307 | 36.879 |
Financial liabilities held for trading: | - | - | - | - | - | - | - |
Short positions | - | 1 | 2.888 | 8.334 | 3.344 | 17.128 | 31.694 |
Derivatives | (287) | (1.157) | (1.065) | (1.290) | (105) | (562) | (4.466) |
Total | 64.406 | 159.087 | 150.282 | 75.983 | 20.373 | 28.676 | 498.807 |
21
|
|
|
|
|
|
| 2015 |
|
|
|
|
|
| Thousands of Reais | |
| On | Up to | 3 to | 1 to | 3 to | After 5 |
|
| Demand | 3 Months 12 Months | 3 Years | 5 Years | Years | Total | |
Assets: |
|
|
|
|
|
|
|
Cash and balances with the Brazilian Central Bank | 57.826 | 26.530 | 4.786 | - | - | - | 89.143 |
Debt instruments | 110 | 5.094 | 11.457 | 30.806 | 14.821 | 53.427 | 115.714 |
Equity instruments | 2.141 | - | - | - | - | - | 2.141 |
Loans and amounts due from credit institutions | 29.064 | 781 | 1.299 | 2.448 | 133 | 8.697 | 42.423 |
Loans and advances to customer | 22.663 | 73.674 | 59.527 | 54.372 | 18.227 | 23.570 | 252.033 |
Total | 111.804 | 106.080 | 77.069 | 87.626 | 33.182 | 85.694 | 501.454 |
Liabilities: |
|
|
|
|
|
|
|
Financial liabilities at amortized cost: |
|
|
|
|
|
| |
Deposits from credit institutions(1) | 944 | 29.304 | 24.375 | 8.820 | 3.346 | 2.663 | 69.451 |
Customer deposits(1) | 52.009 | 74.456 | 39.246 | 62.869 | 14.305 | 157 | 243.043 |
Marketable debt securities(1) | - | 16.640 | 26.834 | 50.816 | 298 | 71 | 94.658 |
Subordinated liabilities | - | - | 7.685 | 412 | - | - | 8.097 |
Debt Instruments Eligible to Compose Capital | - | - | - | - | - | 9.959 | 9.959 |
Other financial liabilities | 200 | 30.096 | 1.438 | 32 | - | 307 | 32.073 |
Financial liabilities held for trading: | - | - | - | - | - | - | - |
Short positions | - | - | - | 2.866 | 7.916 | 9.266 | 20.048 |
Derivatives | 6 | 2.667 | 1.863 | 2.954 | 2.122 | 12.728 | 22.340 |
Total | 53.158 | 153.162 | 101.442 | 128.767 | 27.988 | 35.152 | 499.669 |
(1) Include obligations that may have early enforceability, such as: demand deposits and time deposits, repurchase transactions with clients, LCI and LCA.
(2) In 2015, it includes Investments held to Maturity.
The following table shows the financial assets and liabilities by national currency and foreign currency, on December 31, 2017, 2016 and 2015 (currency position):
| On December 31, | |||||
| 2017 | 2016 | 2015 | |||
| National Currency | Foreign Currency | National Currency | Foreign Currency | National Currency | Foreign Currency |
| (in millions of R$ ) | |||||
Assets |
|
|
|
|
|
|
Cash and balances with the Brazilian Central Bank | 100.740 | 126 | 110.430 | 175 | 88.909 | 234 |
Debt instruments | 137.240 | 11.666 | 134.038 | 9.788 | 109.837 | 5.877 |
Equity securities | 1.624 | 15.364 | 2.426 | — | 2.141 | — |
Loans and other amounts with credit institutions, gross | 17.005 | 15.364 | 25.421 | 2.542 | 18.631 | 23.970 |
Loans and advances to customers, gross | 269.126 | 18.703 | 257.170 | 11.267 | 264.491 | 2.775 |
Total | 525.915 | 45.865 | 529.485 | 23.772 | 484.009 | 32.857 |
|
|
|
|
|
|
|
Liabilities |
|
|
|
|
|
|
Financial liabilities at amortized cost | 56.563 | 22.812 | 51.340 | 27.294 | 33.056 | 36.395 |
Deposits from Brazilian Central Bank and Credit Institutions | 276.042 | — | 247.445 | — | 232.344 | 10.699 |
Customer deposits | 68.335 | 1.912 | 92.132 | 7.711 | 82.507 | 12.151 |
Securities obligations | 519 | — | 466 | — | 8.097 | — |
Subordinated liabilities | 8.435 | — | 8.312 | — | 9.959 | — |
Other financial liabilities | 44.261 | — | 36.879 | — | 32.073 | — |
Total | 454.155 | 24.724 | 436.574 | 35.005 | 398.036 | 59.245 |
Information related to the analysis of sensitivity of operation portfolios and banking generated by the Company’s corporate systems and the structure of risk management is available in items 10.2.b and c.
d. sources of financing for working capital and for investments in non-current assets used
The following table presents details of the capital-raisings made on the indicated dates
22
| On December 31, | ||
| 2017 | 2016 | 2015 |
| (in millions of R$ ) | ||
Customer Deposits | 276,042 | 247,445 | 243,043 |
Checking account | 17,560 | 15,868 | 15,580 |
Savings Account | 40,572 | 36,051 | 35,985 |
Time deposits | 146,818 | 94,479 | 89,986 |
Repurchase agreements | 71,092 | 101,047 | 101,492 |
Transactions backed by Private Bonds(1) | 33,903 | 59,460 | 61,174 |
Transactions backed by Public Bonds(1) | 37,189 | 41,586 | 40,318 |
Deposits from Central Bank and deposits from credit institutions | 79,374 | 78,634 | 69,451 |
Demand deposits(1) | 306,1 | 314 | 145 |
Time deposits(3) | 52,739 | 49,549 | 55,795 |
Repurchase agreements | 26,329 | 28,771 | 13,512 |
Transactions backed by Private Bonds(2) | - | 446 | 85 |
Transactions backed by Public Bonds | 26,329 | 28,324 | 13,427 |
Total deposits | 355,416 | 326,079 | 312,494 |
Debt securities | 70,247 | 99,843 | 94,658 |
Agribusiness Credit Bills(4) | 8,854 | 6,981 | 2,097 |
Financial Bills(5) | 31,686 | 61,157 | 55,301 |
Real Estate Credit Notes(6) | 27,714 | 23,983 | 23,795 |
Eurobonds and other securities | 1,993 | 7,722 | 13,465 |
Debt instruments Eligible to Establish Capital | 8,437 | 8,312 | 9,959 |
Subordinated Debt | 519 | 466 | 8,097 |
Total Funding | 434,619 | 434,700 | 425,209 |
__________________
(1)Non-compensated accounts.
(2) They basically refer to repurchase transactions backed by own debentures.
(3) Includes transactions with credit institutions resulting from debt facilities to export and import, on lending in the country (BNDES and Finame) and from abroad, and other foreign debt facilities.
(4) Agribusiness credit bills are fixed income bonds in which the funds are destined to foster agribusiness. On December 31, 2016 they have maturities from 2017 to 2018 (12/31/2015 - with maturity between 2016 to 2018).
(5) The main characteristics of financial bills are minimum maturity in two years, minimum par value of R$ 300, and permitted early redemption of only 5% of the amount issued. On December 31, 2016 they have maturities from 2017 to 2025 (2015 - with maturity from 2016 to 2025 and 2014 - with maturity between 2015 to 2025).
(6) Real estate credit notes are real estate-backed fixed income securities and secured by mortgage or by fiduciary title of real estate. On December 31, 2016 they have maturities from 2017 to 2026 (31/12/2015 - with maturity between 2016 to 2020).
(i) Deposits
· Customer Deposits. The Company’s balance of customer deposits was R$276.0 billion on December 31, 2017, R$247.4 billion on December 31, 2016, and R$243.0 billion on December 31, 2015, representing 63.5%, 56.9% and 57.2% of the Company’s total funding, respectively.
· Checking Account: The Company’s balance of deposits into checking accounts was R$17.5 billion on December 31, 2017, R$15.9 billion on December 31, 2016 and R$15.6 billion on December 31, 2015, representing 4.9%, 4.9% and 5.0% of total deposits, respectively.
· Savings Account: The Company’s balance of deposits into savings accounts was R$40.6 billion on December 31, 2017, R$36.0 billion on December 31, 2016 and R$36.0 billion on December 31, 2015, representing 11.4%, 11.1% and 11.5% of total deposits, respectively.
23
· Customer Time Deposits: The Company’s balance of time deposits from customers was R$146.8 billion on December 31, 2017, R$ 94.5 billion on December 31, 2016 and R$90.0 billion on December 31, 2015, representing 41.3%, 29.0% and 28.8% of total deposits, respectively.
· Customer Deposits—Repurchase Agreements: The Company maintains a portfolio of debt instruments from the Brazilian public and private sectors, which is used to obtain overnight funds from other financial institutions or investment funds by selling such securities simultaneously agreeing to repurchase them. Due to the short-term (overnight) nature of this funding source, such transactions are volatile, and are composed, generally, of Brazilian public securities and of debentures repurchase agreements. The securities sold under the terms of repurchase agreements reduced to R$71.1 billion as of December 31, 2017, contrary movement to what occurred in previous years, in which there was growth of R$101.0 billion at December 31, 2016 and R$101.5 billion at December 31, 2015, representing 20.0%, 31.0% and 32.5% of total deposits, respectively.
(ii) Deposits from Brazilian Central Bank and Credit Institutions
The balance of deposits from the Central Bank and credit institutions was of R$79.4 billion as of December 31, 2017, R$78.6 billion on December 31, 2016 and R$69.4 billion on December 31, 2015, representing 22.3%, 24.1% and 22.2% of total deposits, respectively.
It also includes Obligations for Loans and Domestic Transfers:
· Obligations for loans. The Company has relations with banks all over the world, providing credit facilities pegged to foreign currencies (both in North-American dollars as a basket of currencies). The Company applies the proceeds from these transactions mainly to U.S. dollar-linked lending operations and in particular to trade finance operations.
· Domestic Transfers.The Company operates in the transfer from public institutions, mainly BNDES and FINAME, for which the Company acts as a financial agent. Funding from these sources in Brazil represents a method of providing long-term loans with attractive average interest rates to certain sectors of the economy. Loans from these funds are allocated by BNDES through banks to specific sectors targeted for economic development. This type of loan is known as “repassing” or “transfer.” Within the scope of this agreement, the Company loans funds from BNDES or FINAME, the subsidiary for funding of BNDES equipment, and transfers them to specific sectors of the economy. These loans are generally granted at rates below the average market rates and have an average maturity of up to five years. Because the transferred funds are generally matched and/or funded by loans from a federal government agency, we take no interest rate or maturity mismatch risk nor charge interest at a fixed margin over its cost of funds. However, the Company retains the commercial credit risk of borrower and, therefore, we have a discretionary power in the credit decision making and application of credit criteria. This type of funding is not affected by compulsory deposit requirements. The transfer is generally secured or guaranteed, although this is not required by the terms of the transfer.
24
(iii) Other Methods of Funding
(iii.1) Debt Instruments
The Company’s balance of debt instruments was R$70.2 billion on December 31, 2017, R$99.8 billion on December 31, 2016 and R$94.7 billion on December 31, 2015, representing 16.7%, 23.0% and 22.3% of the Company’s total funding, respectively.
The Agribusiness Credit Bills are credit instruments freely traded and represent a commitment of future payment, exclusively issued by financial institutions regarding credit rights originated from transactions between rural manufacturers and their cooperatives and other agricultural manufacturing chain agents and exchange acceptances. The Agribusiness Credit Bills reached R$8.9 billion on December 31, 2017, and R$6.9 billion on December 31, 2016, and R$2.1 billion on December 31, 2015.
The financial bills are alternative funding instruments for banks that can be characterized as senior or eligible to form the Reference Assets for purposes of regulation of capital adequacy. Pursuant to CMN Resolution 4,123 of August 23, 2012, its minimum term must be twenty-four (24) months and it must be issued for a minimum amount of R$ 300 thousand for subordinated transactions and R$ 150 thousand for senior transactions that add up to R$ 31,7 billion on December 31, 2017, a decrease of 48% compared to December 2016.
Real Estate Credit Notes, or “LCI,” increased 15.6%, from R$23.9 billion on December 31, 2016 to R$27.7 billion in December 2017.
The Company issues securities, under the Global Medium Term Notes Program of U.S.$ 10,000,000,000,00. The Company’s balance of securities issued abroad was R$2 billion on December 31, 2017. This change took place mainly as a result of the non-replacement of certain debt instruments that reached their maturity.
(iv) Instruments Eligible to compose Level I and Level II
The Company issued debt form the Level I and Level II of the Reference Assets as part of the plan of optimization of its capital. On December 31, 2017, the balance of both instruments (Level I and Level II) was R$8.4 billion, compared to the balance of R$8.3 billion on December 31, 2016.
(v) Subordinated Debt
On December 31, 2017 and 2016, the Company’s subordinated debt included R$0.5 billion in deposit certificates issued by the Company at the local market in several issuances with interest rate indexed to CDI or IPCA, the balance remained practically stable in relation to the balance as of December 31, 2016.
e. Sources of financing for working capital and for investments in non-current assets that it intends to use to cover liquidity deficiencies
Due to the Company’s stable and diversified sources of fund raising, which include a large deposit base of its clients as detailed in item 10.1.d above, the Company historically has not had liquidity problems.
As part of management of the liquidity risk, the Company has a formal plan with measures to be adopted in scenarios of crisis of systemic liquidity and/or arising out of possible risk to the image of the Company. This liquidity contingency plan contains attention parameters, in addition to measures and preventive actions to be taken at moments of liquidity deficiency, if the reserves are below certain parameters.
25
As sources of financing for working capital and for investments in non-current assets that it uses to cover liquidity deficiencies, the following resources may be used: (i) deposit funding; (ii) issuance of bonds; (iii) repurchase transactions with public/private bonds; (iv) review of transfer prices; (v) establishment of more restrictive credit policies; and (vi) release of guarantee margin at BM&F.
f. levels of indebtedness and the characteristics of such debts, describing also:
(i) Relevant loan and financing agreements
There are no loan agreements or other debt instruments that management deems to be relevant to the Company, except for the securities representing debt issued by the Company described in Section 18 of the Reference Form.
(ii) Other long-term relationships with financial institutions
The Company’s primary resource sources are local deposits in the modalities demand, savings and long-term, aligned with other Brazilian banks, as well as fundraising in the open market – own securities and Federal Government securities with buy back commitment ("repurchase agreements").
The Company also has deposits with credit institutions referring to debt facilities to export and import with banks abroad, and to be applied in commercial foreign exchange operations, related to financing of export and import. The Company is also a party to long-term obligations through on lendings,all in accordance with the operational policies of BNDES System.
(ii.1) Eurobonds and Securitization Notes - MT100
External issuance of bonds designated in foreign currency includes bonds and other securities (Eurobonds and Structured Notes). The following table shows the detailed composition of Eurobonds.
26
|
|
|
| Taxa de Juros |
|
|
|
| Emissão Vencimento Moeda |
| (a.a.) | 2017 | 2016 | 2015 | |
Eurobonds | 2011 | 2016 | USD | 4.2% | - | - | 3,268 |
Eurobonds(1) | 2012 | 2016 | CHF | 3.25% | - | - | 604 |
Eurobonds(1) | 2013 | 2016 | BRL | 8.0% | - | - | 1,256 |
Eurobonds(1) | 2012 | 2016 | CLP | 4.6% | - | - | 135 |
Eurobonds | 2014 | 2016 | USD | 1.5% a 2.0% | - | - | 193 |
Eurobonds(1) | 2014 | 2016 | JPY | 1.8% | - | - | 36 |
Eurobonds | 2014 | 2017 | USD | 2.1% a 2.4% | - | - | 27 |
Eurobonds | 2015 | 2016 | USD | 0.4% a 3.0% | - | - | 2,614 |
Eurobonds | 2015 | 2018 | USD | 2.2% | 40 | 40 | 48 |
Eurobonds | 2015 | 2020 | USD | 2.9% | 11 | 10 | 12 |
Eurobonds | 2007 | 2017 | BRL | FIDC | - | 2 | 7 |
Eurobonds | 2015 | 2016 | BRL | 1.6% | - | - | 4 |
Eurobonds | 2015 | 2016 | EUR | 0.8% a 1.0% | - | - | 196 |
Eurobonds | 2016 | 2017 | USD | 0.7% a 2.5% | - | 3.409 | - |
Eurobonds | 2017 | 2018 | USD | Zero Coupon 2.4% | 1,196 | - | - |
Eurobonds | 2017 | 2019 | USD | Libor 3M + 1.0% | 166 | - | - |
Eurobonds | 2017 | 2024 | USD | 6.9% a 10.0% | 541 | - | - |
Eurobonds | 2012 | 2017 | USD | 4.6% | - | 4.116 | 5 |
Outras |
|
|
|
| 39 | 145 | 39 |
Total |
|
|
|
| 1,993 | 7.722 | 13,465 |
(1) On December 31, 2015, it includes R$ 1,995,118 (2014 - R$ 1,960,197) of transactions subject to "hedge" cash flow, being R$ 1,255,841 (2014 - R$ 1,258,363) indexed toReais, R$ 603,889 (2014 - R$ 600,570) indexed foreign currency - Swiss Franc, R$ 135,388 (2014 - R$ 101,264) in Chilean Peso R$ 35,743 (2014 - R$ 364,166) of transactions subject to "hedge" of market risk, being R$ 35,743 (2014 - R$ 24,480) indexed to foreign currency - YEN and on December 31, 2014 the amount of R$ 339,686 indexed to foreign currency - Swiss Franc.
The Securitization Notes regarding the series 2008-1, 2008-2, 2009-2, 2010-1, 2011-1, 20112, pursuant to the specific agreements, were fully redeemed on December 4, 2014, at the amount of US$747 million.
(ii.2) Subordinated debts
The Company uses subordinated debt instruments in its fundraising structure, represented by securities issued according to the rules of Central Bank, which are used as Reference Assets – Level II, in order to form the operational limits, including Subordinated CDBs, deposit certificates issued by the Company in the local market, in several issuances, at interest rates updated by CDI or IPCA. The following table shows the detailed composition of subordinated debts:
Thousands of Reais | Issuance | Maturity (1) | Amount (millions) | Interest rate | 2017 | 2016 | 2015 |
Subordinated Liabilities | jun-06 | jul-16 | R$ 1.500 | 105,0% CDI | - | - | 4,196 |
Subordinated Liabilities | oct-06 | sep-16 | R$ 850 | 104,5% CDI | - | - | 2,267 |
Subordinated Liabilities | jul-06 to oct-06 | jul-16 | R$ 447 | 104,5% CDI | - | - | 1,231 |
Subordinated Liabilities | may-08 | may-15 to may-18 | R$ 283 | CDI (2) | 109 | 98 | 114 |
Subordinated Liabilities | may-08 to jun-08 | may-15 to jun-18 | R$ 268 | IPCA (3) | 410 | 368 | 289 |
Total |
|
|
|
| 519 | 466 | 8,097 |
(1) Subordinated time deposits issued by Banco Santander S.A. with yield paid at the end of the term together with the principal.
(2) Indexed by 100% and 112% of the CDI.
(3) Indexed by the IPCA (extended consumer price index) plus interest of 8.3% p.a. to 8.4% p.a.
(iii) Level of subordination between the debts
27
In case of judicial or extra-judicial liquidation of the Company, there is an order of distribution for payment of the creditors of the bankruptcy estate as provided for in law, which must be respected in accordance with Brazilian legislation in force at the time. Specifically, in regard to the financial debts that form the Company’s indebtedness, the following order of payment must be followed asset-backed debts, unsecured debts and subordinated debts. It is worth mentioning that, as to asset-backed debts, the creditors prefer them to the others up to the limit of the collateral and, to the extent of exceeding, their credits will be included in the payment order of the unsecured creditors. Among unsecured creditors there is no level of subordination, as well as there is no level of subordination among the many subordinated creditors.
(iv) any restrictions imposed on the Company, particularly in relation to limits of indebtedness and contracting of new debts, to distribution of dividends, to sale of assets, to issuance of new securities and to the sale of equity control, and whether the Company has been respecting such restrictions
As to the bonds issued abroad, whose descriptions of transactions and programs are presented inItem 18.10 of the Reference Form (“Securitization Program” and “Medium Term Notes – MTN”), the main restrictions imposed on the issuer, existing in facility agreements, are also described in the same item, more specifically in sessions 18.10.I.h.(v) and 18.10.II.h.(v).
g. limits of loans taken out and percentages already used
The information requested in this item does not apply to financial institutions. However, the Company is subject to he parameters determined by monetary authorities, in accordance with the Basel principles.
h. significant alterations in each item of the financial statements
(i) Assets and Liabilities (in million Reais):
|
|
| Changes |
| Changes |
Assets | 2017 | 2016 | 2017x2016 | 2015 | 2016x2015 |
Cash and Balances With The Brazilian Central Bank | 100,866 | 110,605 | -8.8% | 89,143 | 24.1% |
Financial As sets Held For Trading | 52,440 | 84,874 | -38.2% | 50,537 | 67.9% |
Other Financial As sets At Fair Va lue Through Profit Or Loss | 1,692 | 1,711 | -1.1% | 2,080 | -17.7% |
Available-For-Sale Financial Assets | 85,823 | 57,815 | 48.4% | 68,266 | -15.3% |
Held to meturity investments | 10,214 | 10,049 | 1.6% | 10,098.00 - | 0.00 |
Loans and Receivables | 322,337 | 296,049 | 8.9% | 306,269 | -3.3% |
Hedging Derivatives | 193 | 223 | -13.5% | 1,312 | -83.0% |
Non-Current Assets Held For Sale | 1,155 | 1,338 | -13.7% | 1,237 | 8.2% |
Investments in Associates and Joint Ventures | 867 | 990 | -12.4% | 1,061 | -6.7% |
Tax Assets | 28,826 | 28,753 | 0.3% | 34,770 | -17.3% |
Other Assets | 4,578 | 5,104 | -10.3% | 3,802 | 34.2% |
Tangible As sets | 6,510 | 6,646 | -2.0% | 7,006 | -5.1% |
Intangible Assets | 30,202 | 30,237 | -0.1% | 29,814 | 1.4% |
Total ASSETS | 645,703 | 634,393 | 1.8% | 605,395 | 4.8% |
28
|
|
| Changes |
| Changes |
Liabilities and Shareholders' Equity | 2017 | 2016 | 2017x2016 | 2015 | 2016x2015 |
Financial Li abilities Held For Trading | 49,323 | 51,620 | -4.4% | 42,388 | 21.8% |
Financial Li abilities a t Amortized Cost | 478,881 | 471,579 | 1.5% | 457,282 | 3.1% |
Hedging Derivatives | 163 | 311 | -47.6% | 2,377 | -86.9% |
Provisions | 13,987 | 11,776 | 18.8% | 11,410 | 3.2% |
Tax Liabilities | 8,248 | 6,095 | 35.3% | 5,253 | 16.0% |
Other Liabilities | 8,013 | 8,199 | -2.3% | 6,850 | 19.7% |
Total Liabilities | 558,615 | 549,581 | 1.6% | 525,559 | 4.6% |
Stockholders' Equity | 87,425 | 85,435 | 2.3% | 83,532 | 2.3% |
Other Comprehens ive Income | -774 | -1,348 | -42.6% | -4,132 | -67.4% |
Stockholders' Equity | 86,651 | 84,087 | 3.0% | 79,400 | 5.9% |
Total Stockholders' Equity | 87,088 | 84,813 | 2.7% | 79,835 | 6.2% |
Total Liabilities and Stockholders' Equity | 645,703 | 634,393 | 1.8% | 605,395 | 4.8% |
Please find below the main variations in accounts of the balance sheet for the years 2017, 2016 and 2015.
The Company’s total assets reached, on December 31, 2017, R$645,703 million, an increase of 1.8% compared to 2016, whose total assets reached R$634,393 million, 4.8% greater than the year ended on December 31, 2015, in the amount of R$605,395 million.
The portfolio of loans and advance to gross clients, with no accommodation papers and suretyships, added up to R$290,037 million on December 31, 2017, an increase of 8.0% compared to R$268,438 million on December 31, 2016, and an increase of 8.5% if compared to the balance of R$267,266 million on December 31, 2015. The Individual segment presented an evolution of 18.3% compared to 2016, in contrast, the segment of large companies showed a decrease of 9.8%, maintaining the movement verified in 2016, but the growth of the individuals portfolio sustained growth of the portfolio of loans and advances to gross customers for 2017.
On December 31, 2017, the total deposits reached R$355,417 million, representing 55.0% of the total liabilities and shareholders’ equity. On December 31, 2016, the total deposits reached R$326,079 million, representing 51.4% of the total liabilities. On December 31, 2015, the total deposits reached R$312,494 million, representing 51.6% of the total liabilities. The time deposits represented, on December 31, 2017, 2016 and 2015, respectively, 56.0%, 44.2% and 46.7% of the total deposits.
The balance of deposits on December 31, 2017 had an increase of 9.0% in relation to the previous year, mainly due to the 38.6% growth in time deposit operations and the 25.0% decrease in repo operations. The balance of deposits on December 31, 2016 had an increase of 4.3% in relation to the previous year, basically due to the 12.9% growth in repo operations. The balance of deposits at December 31, 2015 increased by 9.9% in relation to the previous year, basically due to the 18.4% growth in repo operations.
The consolidated shareholders’ equity added up to R$87,088 million on December 31, 2017, R$84,813 million on December 31, 2016 and reached R$79,835 million by the end of 2015, with an increase of 2.7% on December 31, 2017 compared to 2016 and an increase of 6.2% of December 31, 2016 compared to 2015. Evolution in the shareholders’ equity during the net income for the year was mainly due to revenue growth in the Net Income for the period of R$9,138 million and reduced by the highlight of Dividends and Interest on Equity in the amount of R$6,300 million.
10.2 Officers’ comments on:
29
a. results of the Company’s operations:
The following table presents an overview of the certain key aspects of our results of operations for the years ended December 31 2017, 2016 and 2015:
Executive Summary | |
Results | |
Total Income
Our total income amounted to R$48,725 million for the year ended December 31, 2017, a decrease of 0.2% as compared to R$48,837 million in the year ended December 31, 2016. This decrease was primarily due to lower gains/losses on financial assets and liabilities (net) and exchange differences (net) of R$1,576 in the year ended December 31, 2017 as compared to R$7,591 in the year ended December 31, 2016, mainly as a consequence of our results of hedging on investments abroad in 2017. This decrease was offset by an increase in our net interest income of R$4,360, or 14.3% mainly due to an increase in our credit portfolio and spreads, and an increase in net fees and commissions of R$1,744, or 15.9% due to increase in loyal customers and an increase in transactions. Disregarding the effects of the hedge for investment held abroad, our total income would have amounted to R$49,533 million in the year ended December 31, 2017, an increase of 17.6% compared to 2016. Our total income for the year ended December 31, 2015 amounted to R$30,814 million mainly due to the impact of the non-recurring result regarding reversal of tax provisions and tax reimbursement in relation to Cofins.
| Impairment losses on Financial Assets (Net)
Our impairment losses on financial assets (net) reached R$12,338 million for the year ended December 31, 2017, a decrease of R$963, or 7.2% compared to our impairment losses on financial assets (net) in the year ended December 31, 2016. This decrease was primarily due to the same trend of strength of our risk management verified in the last years, maintaining impaired assets under control. In 2016, impairment losses on financial assets (net) decrease R$333, or 2.4%, as compared to our impairment losses on financial assets (net) of R$13,634 in the year ended December 31, 2015 mainly due an increase in other financial instruments not measured at fair value provisions. |
Consolidated Profit for the Year
Our consolidated profit for the year ended December 31, 2017 was R$9,138 million, an increase of R$1,673 million, or 22.4%, as a result of an increase in the volume of transactions primarily due to our expanded digital offering and an increase in the number of loyal customers. For the year ended December 31, 2016, we reported a consolidated profit of R$7,465 million, a decrease of R$2,369 million as compared to the year ended December 31, 2015. This decrease was mainly due to nonrecurring results before taxes of R$7.9 billion related to a reversal of tax provision regarding COFINS and R$765 million of tax reimbursement related to COFINS that did not occur in 2016. | Efficiency
Our efficiency ratio was 33.1% in December 2017, a 2.5 p.p. increase from 30.6% in December 2016. Our efficiency ratio was 30.6% in December 2016, a 16.6 p.p. decrease from 47.1% in December 2015. Disregarding the effect of the hedge for investment abroad on our revenues, our efficiency ratio reached 32.5%, 34.9% and 34.8% in December 2017, 2016 and 2015, respectively. |
Loan Portfolio
Our total loan portfolio reached R$287.8 billion on December 31, 2017, an increase of 7.2% in months, mainly due to an increase in loans to individuals and consumer finance portfolio. Loans to individuals totaled R$107.6 billion, an increase of 18.0%, driven by credit cards, payroll loans and agricultural loans. Our consumer finance loan portfolio grew 24.7% in 2017, mainly due to an increase in vehicle financing greater than the market growth rate. In 2016, our total loan portfolio totaled R$268.4 billion, an increase of 0.4% as compared to the year ended December 31, 2015, driven by loans to individuals (principally payroll loans and mortgages).
| Credit Quality
Our impaired assets to credit risk ratio was 6.7% for the year ended December 31, 2017, a 0.3 p.p. decrease as compared to 7.0% in the years ended December 31, 2016. In 2015 impaired assets to credit risk ratio was 7.0%. Our coverage ratio (provisions for impairment losses as a percentage of impaired assets) was 95.4% in the year ended December 31, 2017, a 0.9 p.p. decrease as compared to 96.3% December 31, 2016. This decrease was principally caused by a specific Global Wholesale Banking customer in the last quarter. In 2015, this ratio was 82.9%, a 13.5p.p. increase as compared to 2016. Our Basel Capital adequacy ratio, calculated in accordance with the regulations and guidance of the Brazilian Central Bank, was 15.8% for the year ended December 31, 2017, a decrease from 16.3%, as of December 31, 2016. For the year ended December 31, 2015 this ratio was 15.7%. |
Deposits
Deposits from Brazilian Central Bank and deposits from credit institutionsplus customer deposits increased by 9.0% to R$355.4 billion on December 31, 2017. For the year ended December 31, 2016, deposits from Brazilian Central Bank and deposits from credit institutionsplus customer deposits amounted to R$326.1 billion, a 4.3% increase compared to R$312.5 billion in the year ended December 31, 2015. | |
30
|
Results of Operations
The following table presents our consolidated results of operations for the years ended December 31 2017, 2016 and 2015:
|
| For the year ended December 31 | |||
|
2017 | 2016 | 2015 | % Change 2017/2016 | %Change 2016/2015 |
|
| (in millions of R$, except percentages) | |||
Net interest income | 34,946 | 30,586 | 31,337 | 14.3 | (2.4) |
Income from equity instruments | 83 | 259 | 143 | (67.9) | 81.0 |
Income from companies accounted for by the equity method | 72 | 48 | 116 | 50.5 | (59.1) |
Net fee and commission income | 12,722 | 10,978 | 9,484 | 15.9 | 15.8 |
Gains/losses on financial assets and liabilities (net) and exchange differences (net) | 1,574 | 7,591 | (9,918) | (79.3) | (176.5) |
Other operating income (expenses) | (672) | (625) | (347) | 7.6 | 79.9 |
Total income | 48,725 | 48,837 | 30,814 | (0.2) | 58.5 |
Administrative expenses | (16,121) | (14,920) | (14,515) | 8.0 | 2.8 |
Depreciation and amortization | (1,662) | (1,483) | (1,490) | 12.1 | (0.5) |
Provisions (net) | (3,309) | (2,725) | (4,001) | 21.5 | (31.9) |
Impairment losses on financial assets (net) | (12,338) | (13,301) | (13,364) | (7.2) | (2.4) |
Impairment losses on other assets (net) | (457) | (114) | (1,221) | 299.5 | (90.6) |
Other nonfinancial gain (losses) | (324) | 91 | 831 | n.d. | (89.1) |
Operating profit before tax | 14,514 | 16,384 | (3,216) | (11.4) | (609.5) |
Income tax | (5,376) | (8,919) | 13,050 | (39.7) | (168.3) |
Consolidated profit for the year | 9,138 | 7,465 | 9,834 | 22.4 | (24.1) |
Consolidated Profit for the Year
Our consolidated profit for the year ended December 31, 2017 was R$9,138 million, an increase of R$1,673 million, or 22.4%, as compared to our consolidated profit of R$7,465 million for the year ended December 31, 2016 as a result of (i) an increase of R$4,360 million in net interest income as a result of an increase in the volume of transactions primarily due to our expanded digital offering and an increase in the number of loyal customers (ii) lower expenses of R$3,543 million tax expenses and (iii) a decrease of 6,017 million in gains/losses on financial assets and liabilities (net) and exchange differences (net), which both variations include the effects of the hedge for investment held abroad (R$6,950 million - gains in tax expenses line and losses in gains/losses on financial assets and liabilities (net) and exchange differences (net).
Our consolidated profit for the year ended December 31, 2016 was R$7,465 million, a 24.1% decrease as compared to the year ended December 31, 2015 for which our consolidated profit was R$9,834 million. This decrease in our consolidated profit was mainly due to an increase of R$21,969 million in the “Income taxes” line item for the year ended December 31, 2016 as compared to the year ended December 31, 2015. This increase can be principally attributed to: (i) gains of R$2.7 billion related to the reversal of tax provisions made to cover the legal and a tax reimbursement related to COFINS in 2015 which did not occur in 2016; (ii) an increase from 15% to 20% in the CSLL tax rate in the fourth quarter of 2015; and (iii) tax expenses of R$17,059 million in the year ended December 31, 2016 arising out of the effects of foreign exchange rate variations affecting certain of our foreign branches and the associated hedging instruments, which was offsetby gains in the same amount on financial assets and liabilities (net) and exchange differences (net). For further information, see “—Other Factors Affecting Our Financial Condition and Results of Operations—Hedging in Foreign Investments.”
32
Net Interest Income
Net interest income for the year ended December 31, 2017 was R$34,946 million, a 14.3% or R$4,360 million increase from R$30,586 million for the year ended December 31, 2016. This increase was mainly due to an increase in the volume of loans extended to customers and spread of which was primarily concentrated in our commercial banking segment. In addition, our revenues from deposits increased as a result of our liability management plan, which included: (i) an increase in the average margins charged on deposit products which we offer, and (ii) an increase in the proportion of products which we offer on which we charge relatively higher margins.
Net interest income for the year ended December 31, 2016 was R$30,586 million, a 2.4%, or R$751 million, decrease from R$31,337 million for the year ended December 31, 2015. This decrease was principally due to a nonrecurring reversal of tax provision and a tax reimbursement in relation to COFINS in an amount of R$2.4 billion in 2015 that did not occur in 2016. For further information, please see note 24.c.1 and note 25 to our audited consolidated financial statements included in this annual report. Despite such decrease, revenues from deposits and others products related to our funding operations increased 31.1% or R$723 million, as compared to the year ended December 31, 2015, as a result of our focus on customer loyalty and active liability management.
Average total earning assets in 2017 were R$556.2 billion, a 10.3% or R$51.9 billion increase from R$504.3 billion in 2016. The principal drivers were an increase of R$38.0 billion, or 15.9%, in the average of loans and advances to customers and a R$18.7 billion increase in average of debt instruments. Net yield (the net interest income divided by average earning assets) was 6.4% in 2017 compared to 6.2% in 2016, an increase of 0.2 p.p. Our average total earning assets in 2016 were R$504.3 billion, a 5.0% or R$23.9 billion increase from R$480.4 billion in 2015. The principal drivers of this increase were an increase of R$32.1 billion, or 47.7%, in the average of cash and balances with the Brazilian Central Bank partially offset by a decrease of R$7.6 billion, or 18.4%, in the average of loans and amounts due from credit institutions. Net yield was 6.2% in 2016, compared to 6.6% in 2015, a decrease of 0.4 p.p.
Average total interest liabilities in 2017 were R$416.8 billion, a 2.1% or R$8.7 billion increase from R$408.1 billion in 2016. The main drivers of this growth were an increase of R$14.7 billion in customer deposits and an increase of R$13.0 billion in deposits from the Brazilian Central Bank and deposits from credit institutions, which were partially offset by a decrease of R$13.7 billion in marketable debt securities and a decrease of R$5.3 billion in subordinated debts. Average total interest bearing liabilities in 2016 were R$408.1 billion, a 5.9% or R$22.9 billion increase from R$385.2 billion in 2015. The main drivers of this growth were an increase of R$12.0 billion in customer deposits, an increase of R$11.6 billion in marketable debt securities and an increase of R$1.4 billion in deposits from the Brazilian Central Bank and deposits from credit institutions offset by R$2.2 billion in other interest bearing liabilities.
Finally, the yield spread (the difference between gross yield on earning assets and the average cost of interest-bearing liabilities) was 4.0% in 2017 and 2016 and 4.7% in 2015.
33
Income from Equity Instruments
Income from equity instruments for the year ended December 31, 2017 totaled R$83 million, a R$175 million decrease from R$259 million for the year ended December 31, 2016. This decrease was mainly due to a decrease in dividends from investments registered in available for sale financial assets. In 2016, totaled R$259 million, a R$116 million increase from R$143 million for the year ended December 31, 2015. This increase was mainly due to an increase in dividends from investments registered in available for sale financial assets.
Income from Companies Accounted for by the Equity Method
Income from companies accounted for by the equity method for the year ended December 31, 2017 was R$72 million, a R$24 million increase from R$48 million for the year ended 2016. This increase was mainly due to the positive results of operations of Banco RCI Brasil S.A., a jointly-controlled company, which were partially offset by negative results of operations of Webmotors S.A., a jointly-controlled company. Income from companies accounted for by the equity method for the year ended December 31, 2016 was R$48 million, a R$69 million decrease from R$116 million for the year ended December 31, 2015. This decrease was mainly due to losses with results of operations at Banco RCI Brasil S.A., a jointly-controlled company.
Net Fee and Commission Income
Net fee and commission income for the year ended December 31, 2017 reached R$12,722 million, a 15.9% or R$1,744 million, increase from R$10,978 million for the year ended December 31, 2016. This increase was mainly due to an increase of R$670 million in revenues from credit and debit cards, R$543 million in revenues from current account services, R$337 million in revenues from insurance and capitalization products and an increase of R$283 million in revenues from capital markets services. Net fees and commissions for the year ended December 31, 2016 reached R$10,978 million, a 15.8%, or R$1,494 million, increase from R$9,484 million for the year ended December 31, 2015. This increase was mainly due to an increase of R$512 million in revenues from credit and debit cards, R$430 million in revenues from banking fees and R$285 million in revenues from insurance and capitalization products.
Net fees and commissions from credit and debit cards totaled R$3,692 million for the year ended December 31, 2017, an increase of 22.2% compared to the year ended December 31, 2016. This increase was primarily due to higher transaction volume (974.2 million in the year ended December 31, 2017 as compared to 810.7 million the year ended December 31, 2016). Net fees and commissions from credit and debit cards totaled R$3,022 million for the year ended December 31, 2016, an increase of 20.4% compared to the year ended December 31, 2015, mainly owing to higher interchange fees due to an increase in transaction volumes.
Net fees and commissions from current account services totaled R$3,544 million for the year ended December 31, 2017, an increase of 18.1% compared to the year ended 2016 primarily due to an increase in the volume of transactions of 20.2%. Net fees and commissions from current account totaled R$3,001 million for the year ended December 31, 2016, an increase of 16.7% compared to the year ended December 31, 2015 primarily due to an increasein higher volume of transactions and realigment of our products offered.
Net fees and commissions from insurance and capitalization products totaled R$2,815 million for the year ended December 31, 2017, a 13.6% increase compared to the year ended December 31, 2016, mainly due to the expansion ofour product portfolio and the growth in credit related insurance products. Net fees and commissions from insurance and capitalization products totaled R$2,478 million for the year ended December 31, 2016, a 13.0% increase compared to the year ended December 31, 2015. This increase was mainly due to the marketing campaigns conducted in the branch network during the first half of 2016.
34
Revenues from fees and commissions charged in connection with capital markets totaled R$873 million for the year ended December 31, 2017, an increase of 47.9% compared to the year ended 2016, mainly due to an increase in revenues from securities placements. For the year ended December 31, 2016, Revenues from fees and commissions charged in connection with capital markets totaled R$590 million, a R$89 million increase compared to the year ended December 31, 2015.
The following table reflects the breakdown of net fee and commission income for the year ended December 31, 2017, 2016 and 2015:
| For the year ended December 31 | ||||
| 2017 | 2016 | 2015 | % Change 2017/2016 | Change% 2016/2015 |
| (in millions of R$, except percentages) | ||||
Current account services | 3,544 | 3,001 | 2,570 | 18.1 | 16.7 |
Collection and payment services | 1,152 | 957 | 816 | 20.4 | 17.3 |
Insurance and capitalization | 2,815 | 2,478 | 2,192 | 13.9 | 13.0 |
Asset Management and pension funds | 824 | 1,174 | 1,028 | (29.8) | 14.2 |
Credit and debit cards | 3,692 | 3,022 | 2,509 | 22.2 | 20.4 |
Capital markets | 873 | 590 | 501 | 47.9 | 17.8 |
Trade finance | 956 | 855 | 701 | 11.8 | 22.0 |
Tax on services | (526) | (515) | (401) | 2.2 | 28.3 |
Others | (608) | (584) | (433) | 4.1 | 35.0 |
Total | 12,722 | 10,978 | 9,484 | 15.9 | 15.8 |
Gains/losses on Financial Assets and Liabilities (net) and Exchange Differences (net)
Gains/losses on financial assets and liabilities (net) and exchange differences (net) for the year ended December 31, 2017 were gains of R$1,574 million, a R$6,017 million decrease from gains of R$7,591 million for the year ended December 31, 2016. This variation is mainly due to a decrease of R$6,950 million in derivatives transactions, as a consequence of our results of hedging on investments abroad, which was offset by the same amount in income taxes. Excluding the effects of the hedge for investment held abroad, gains/losses on financial assets and liabilities (net) and exchange differences (net) were R$2,384 million for the year ended December 31, 2017, a 64.3% increase from R$1,451 million compared to the year ended December 31, 2016, primarily due to positive results in our derivative positions as a result of market volatility. Gains/losses on financial assets and liabilities (net) and exchange differences (net) for the year ended December 31, 2016 were gains of R$7,591 million, a R$17,509 million increase from losses of R$9,918 million for the year ended December 31, 2015. This variation is mainly explained by an increase of R$17,059 million from derivatives transactions, as a consequence of our results of hedging on investments abroad, which was offset by losses in the same amount in income taxes. For further information, see “—Other Factors Affecting Our Financial Condition and Results of Operations—Hedging in Foreign Investments.”
35
| For the year ended December 31 | ||||
| 2017 | 2016 | 2015 | %Change 2017/2016 | %Change 2016/2015 |
| (in millions of R$, except percentages) | ||||
Gains/losses on financial assets and liabilities (net) and exchange differences (net) | 1,574 | 7,591 | (9,918) | (79.3) | (176.5) |
Effects of the hedge for investment held abroad | (810) | 6,140 | (10,919) | (113.2) | (156.2) |
Gains/losses on financial assets and liabilities (net) and exchange differences (net) excluding Hedge Impact | 2,384 | 1,451 | 1,001 | 64.3 | 45.0 |
Other Operating Income/Expenses
Other operating income/expenses for the year ended December 31, 2017 were expenses of R$672 million, an increase of R$47 million compared to expenses of R$625 million for the year ended December 31, 2016 primarily due to an increase of contributions to guaratees of credit fund (FGC – “Fundo Garantidor de Crédito). Other operating income/expenses for the year ended December 31, were expenses of R$625 million, an increase of R$277 million compared to expenses of R$347 million for the year ended December 31, 2015, primarily due to the reversal of losses related to the private pension plan which occurred during the year ended December 31, 2015 that did not occur in the year ended December 31, 2016, and an increase in operational losses relating to fraud.
Administrative Expenses
Administrative expenses for the year ended December 31, 2017 were R$16,121 million, a R$1,200 million increase compared to expenses of R$14,920 million for the year ended December 31, 2016 For the year ended December 31, 2016, our administrative expenses of R$14,920 million reflected a R$405 million increase compared to administrative expenses of R$14,515 million for the year ended December 31, 2015.
Personnel expenses increased R$560 million for the year ended December 31, 2017, as a consequence of the increase in wages and salaries and social security costs, mainly due to higher profit sharing expenses related to the incentive plan expenses aligned with the business performance. In the year ended December 31, 2016, our personnel expenses increased R$578 million compared to the same period in 2015, due principally to higher wage and salaries and the R$155 million lump-sum bonus in connection with the renegotiation of our collective bargaining agreement in October 2016.
The following table sets forth our personnel expenses for each of the periods indicated:
| For the year ended December 31, | ||||
| 2017 | 2016 | 2015 | % Change 2017/2016 | %Change 2016/2015 |
| (in millions of R$, except percentages) | ||||
Wages and salaries | 5,714 | 5,377 | 4,655 | 6.3 | 15.5 |
Social security costs | 1,381 | 1,273 | 1,316 | 8.5 | (3.3) |
Benefits | 1,309 | 1,278 | 1,184 | 2.5 | 7.9 |
Training | 58 | 63 | 93 | (6.7) | (32.7) |
Other personnel expenses | 475 | 386 | 550 | 22.9 | (29.8) |
Total | 8,937 | 8,377 | 7,799 | 6.7 | 7.4 |
36
Other administrative expenses increased R$640 million from R$6,543 million for the year ended December 31, 2016 to R$7,183 million for the year ended December 31, 2017. This increase mostly reflects higher expenses with specialized and technical services, technology and systems, and advertising and communications as a consequence of our commercial actions in line with business transformations. Other administrative expenses decreased R$173 million from R$6,716 million for the year ended December 31, 2015 to R$6,543 million for the year ended December 31, 2016. This decrease was primarily due to lower expenses from specialized and technical services, advertising and per diems and travel expenses.
The following table sets forth our administrative expenses and other administrative expenses for each of the periods indicated:
| For the year ended December 31, | ||||
| 2017 | 2016 | 2015 | % Change 2017/2016 | %Change 2016/2015 |
| (in millions of R$, except percentages) | ||||
Specialized and technical services | 1,901 | 1,745 | 1,821 | 9.0 | (4.2) |
Property, fixtures and supplies | 1,284 | 1,279 | 1,268 | 0.5 | 0.8 |
Technology and systems | 1,365 | 1,247 | 1,193 | 9.5 | 4.6 |
Advertising | 618 | 487 | 523 | 26.9 | (7.0) |
Communications | 593 | 489 | 481 | 21.4 | 1.6 |
Per diems and travel expenses | 107 | 133 | 160 | (19.6) | (16.9) |
Surveillance and cash courier services | 630 | 622 | 615 | 1.3 | 1.3 |
Other administrative expenses | 685 | 542 | 655 | 26.3 | (17.3) |
Total | 7,183 | 6,543 | 6,716 | 9.8 | (2.6) |
The efficiency ratio, which we calculate as total administrative expensesdivided by total income, increased to 33.1% in the year ended December 31, 2017, as compared to 30.6% for the year ended December 31, 2016. For the year ended December 31, 2015 it was 47.1%. Our adjusted efficiency ratio, which excludes the effect of the hedge for investment held abroad, was 32.5%, 34.9% and 34.8% in 2017, 2016 and 2015, respectively.
Depreciation and Amortization
Depreciation and amortization for the year ended December 31, 2017 was R$1,662 million, a R$180 million increase from R$1,483 million for the year ended December 31, 2016. This was principally due to impairment of intangible assets related to software of R$155 million and an increase of R$29 million incurred in connection with lease renewals. For the year ended December 31, 2016, depreciation and amortization amounted to R$1,483 million, a R$7 million decrease from R$1,490 million for the year ended December 31, 2015.
Provisions (Net)
Provisions principally include provisions for tax, civil, and especially labor claims. Provisions (net) totaled R$3,309 million for the year ended December 31, 2017, an increase of R$584 million compared to R$2,725 million for the year ended December 31, 2016. This increase was mainly due to an increase in provisions related to civil and labor contingences and by our participation in the incentive installment payment program related to ISS taxes and the participation in the amnesty program for outstanding taxes and social security debts (in accordance with Provisional Measure No.783/2017). In the year ended December 31, 2016, provisions (net) totaled R$2,725 million, a decrease of R$1,277 million compared toR$4,001 million for the year ended December 31, 2015. This decrease was mainly due to a decrease in provisions related to tax and civil contingencies.
37
Impairment Losses on Financial Assets (Net)
Impairment losses on financial assets (net) for the year ended December 31, 2017 were R$12,338 million, a R$963 million decrease compared to R$13,301 million for the year ended December 31, 2016. This decrease was principally due to:
· A decrease of 7.9%, or R$1,052 million, in impairment loss for loans and receivables to R$12,338 million as of December 31, 2017, from R$13,390 million on December 31, 2016. This improvement is reflects the same trend of strength of our risk management, verified in the last years, maintaining impaired assets under control especially with respect offered to our borrowers the chance to negotiate a restructuring of their debts, adaptation of credit limits for new customers and the development of new loan models with “predictive scoring” enhancements.
· A decrease of R$89 million in other financial instruments not measured at fair value from a revenue of R$88 million in the year ended December 31, 2016 to a loss of R$1 million in the year ended December 31, 2017.
For the year ended December 31, 2016, impairment losses on financial assets (net) were R$13,301 million, a R$333 million decrease compared to R$13,634 million for the year ended December 31, 2015 principally due to:
· An increase of 2.1%, or R$280 million, in impairment losses for loans and receivables from R$13,110 million as of December 31, 2015 to R$13,390 million on December 31, 2016. The increase in impairment losses for loans and receivables was mainly caused by the slowdown in the Brazilian economy observed in the last two years, which affected our portfolio generally and, in particular, our commercial and industrial portfolio. As a result of the increase in impaired assets, we kept in place our measures to manage impaired assets and provisions for impairment losses, especially collection practices with respect to our borrowers whereby we offered certain customers the chance to negotiate a restructuring of their debts.
· A decrease of R$612 million to revenues of R$88 million for the year ended December 31, 2016 in other financial instruments not measured at fair value compared to a loss of R$524 million for the year ended December 31, 2015. This change was mainly due to provisions made in 2015 that did not occur in 2016.
Our credit risk exposure portfolio decreased by approximately R$9,174 billion from R$310.9 billion as of December 31, 2015 to R$301.7 billion as of December 31, 2016. Our impaired assets increased by approximately R$289 million in the same period from R$18.6 billion to R$18.9 billion (see “—Impaired Assets by Type of Loan”). The default rate on all loans and other financial assets increased by 30 basis points in 2016 in comparison to 2015.
Our credit risk exposure portfolio increased by R$28.8 billion to R$330.5 billion as of December 31, 2017 compared to R$301.7 billion as of December 31, 2016. Our credit risk exposure portfolio of R$310.7 billion as of December 31, 2016 was approximately R$9.174 billion lower than our credit risk exposure portfolio of R$310.9 billion as of December 31, 2015. Furthermore, our impaired assets increased R$257 million from R$18.9 billion as of December 31, 2016 to R$19.1 billion for the year ended December 31, 2017. Our impaired assets increased byapproximately R$289 million from R$18.6 billion as of December 31, 2015 to R$18.9 billion as of December 31, 2016 (see “—Impaired Assets by Type of Loan”). The default rate decreased by 47 base points in 2017 in comparison with 2016, and increased by 30 basis points in 2016 in comparison with 2015.
38
The following table shows the ratio of our impaired assets to total credit risk exposure and our coverage ratio as of December 31, 2017 and December 31, 2016 and 2015.
| For the year ended December 31, | ||||
| 2017 | 2016 | 2015 | % Change 2017/2016 | %Change 2016/2015 |
| (in millions of R$, except percentages) | ||||
Loans and advances to customers, gross | 287,829 | 268,438 | 267,266 | 7.2 | 0.4 |
Impaired assets | 19,145 | 18,887 | 18,599 | 1.4 | 1.6 |
Provisions for impairment losses | 18,262 | 18,191 | 15,412 | 0.4 | 18.0 |
Credit risk exposure – customers(1) | 330,474 | 301,703 | 310,877 | 9.5 | (3.0) |
Ratios |
|
|
|
|
|
Impaired assets to credit risk exposure | 5.8% | 6.3% | 6.0% | (0.5) p.p. | 0.3 p.p. |
Coverage ratio(2) | 95.4% | 96.3% | 82.9% | (0.9) p.p. | 13.4 p.p. |
Impairment losses on loans and receivables | (12,338) | (13,390) | (13,110) | (7.9) | 2.1 |
Impairment losses on other financial instruments not measured at fair value through profit for loss(3) | (0) | 88 | (524) | (100.2) | (116.9) |
Total of Impairment losses on financial assets (net)(4) | (12,338) | (13,301) | (13,364) | (7.2) | (2.4) |
(1) Credit risk exposure is a non-GAAP financial measure. Credit risk exposure is the sum of the amortized cost amounts of loans and advances to customers (including impaired assets) amounting to R$287,829 million and guarantees and documentary credits amounting to R$42,645 million. We present the off-balance information to better demonstrate our total managed credit risk.
(2) Provisions for impairment losses as a percentage of impaired assets.
(3) Corresponds to registration of losses of a permanent character in the realization value of bonds and securities classified as “Securities available for sale” currently accounted for “Earnings on financials assets (net).”
(4) As of December 31, 2017, 2016 and December 31, 2015, our total of impairment losses on financial instruments included R$2,784 million, R$144 million and R$1,555 million, respectively, relating to debt instruments.
The following chart shows our impaired assets to credit risk ratio (impairment lossesdivided by loans and advances to customers, gross) from 2012 through 2017:
39

Impaired Assets by Type of Loan
The following table shows our impaired assets by type of loan as of December 31, 2017, 2016 and 2015.
| For the year ended December 31, | ||||
| 2017 | 2016 | 2015 | % Change 2017/2016 | %Change 2016/2015 |
| (in millions of R$, except percentages) | ||||
Commercial and industrial | 11,994 | 11,629 | 10,749 | 3.1 | 8.2 |
Real estate | 782 | 719 | 829 | 8.8 | (13.3) |
Installment loans to individuals | 6,304 | 6,488 | 6,970 | (2.8) | (6.9) |
Lease financing | 65 | 52 | 52 | 25.0 | n.d. |
Total | (19,145) | (18,888) | (18,599) | 1.4 | 1.5 |
For a discussion of the evolution in impairment in our lending portfolios and our methodology for loan loss allowances with respect to the following lending portfolios, see “Item 4. Information on the Company—B. Business Overview—Selected Statistical Information—Assets—Impaired Assets—Methodology for Impairment Losses.” See also “Item 3. Key Information—D. Risk Factors—Risks Relating to Brazil and Macroeconomic and Political Conditions in Brazil and Globally—Ongoing investigations relating to corruption and diversion of public funds that are being conducted by the Brazilian federal police as well as other Brazilian and non-Brazilian regulators and law enforcement officials may adversely affect the growth of the Brazilian economy and could have a material adverse effect on us” and “Item 3. Key Information—D. Risk Factors—Risks Relating to Brazil and Macroeconomic and Political Conditions in Brazil and Globally—The financial problems faced by our customers could adversely affect us.”
Commercial and Industrial
Impaired assets in the portfolio of commercial and industrial loans amounted to R$11,994 million on December 31, 2017, an increase of R$365 million, or 3.1%, compared to 2016. The increase in impaired assets was mainly due to default of specific large companies occurred by deteriorating macroeconomic scenario in Brazil.
40
Impaired assets in the portfolio of commercial and industrial loans amounted to R$11,629 million as of December 31, 2016, an increase of R$880 million, or 8.2%, compared to R$10,749 million as of December 31, 2015. The increase in impaired assets in this portfolio was mainly caused by the slowdown in the Brazilian economy in the last three years, affecting our commercial and industrial portfolio. For further information, please see “Item 4. Information on the Company—B. Business Overview—Selected Statistical Information—Assets—Impaired Assets—Methodology for Impairment Losses.”
Real Estate
Impaired assets in the real estate lending portfolio totaled R$782 million on December 31, 2017, an increase of R$63 million compared to R$ 719 million as of December 31, 2016. The increase was primarily due to deterioration of specificcorporate customers in the real estate construction.
Impaired assets in the real estate lending portfolio totaled R$719 million on December 31, 2016, a decrease of R$111 million compared to R$829 million as of December 31, 2015. The decrease in impaired assets between December 31, 2016 and 2015 was primarily due to better management of this portfolio, with improved options for customers to restructure their debt. For further information, please see “Item 4. Information on the Company—B. Business Overview—Selected Statistical Information—Assets—Impaired Assets—Methodology for Impairment Losses.”
Installment Loans to Individuals
Impaired assets in the installment loans to individuals lending portfolio totaled R$6,304 million as of December 31, 2017, a decrease of R$184 million, or 2.8%, compared to December 31, 2016. The decrease was a result of renegotiation practices for customers during restructuring programs along the year.
On December 31, 2016, our impaired assets in the installment loans to individuals lending portfolio totaled R$6,488 million, with a decrease of R$482 million, or 6.9%, compared to 2015. The decrease in impaired assets reflects the measures adopted by us since late 2012 to manage default rates in this portfolio. For further information, please see “Item 4. Information on the Company—B. Business Overview—Selected Statistical Information—Assets—Impaired Assets—Methodology for Impairment Losses.”
Financial Leasing
Impaired assets in the financial leasing lending portfolio totaled R$65 million as of December 31, 2017, an increase of R$13 million compared to December 31, 2016. The increase in impaired assets was mainly due to default of specific large companies occurred by deteriorating macroeconomic scenario in Brazil.
Impaired assets in the financial leasing lending portfolio amounted to R$52 million as of December 31, 2016 and 2015. For further information, please see “Item 4. Information on the Company—B. Business Overview—Selected Statistical Information—Assets—Impaired Assets—Methodology for Impairment Losses”
Impairment Losses on Other Assets (Net)
Impairment losses on other assets (net) for the year ended December 31, 2017 amounted to losses of R$457 million, an increase of R$342 million as compared to the year ended December 31, 2016. This increase was primarily due to impairment losses of R$306 million related to system acquisition and development that did not occur in 2016. For the year ended December 31, 2016, impairment losses on otherassets (net) amounted to losses of R$114 million, a decrease of R$1,106 million as compared to 2015, mainly due to expenses of R$675 million related to the impairment of software and expenses of R$534 million related to the impairment of payroll services related assets in 2015 that did not recur in 2016.
41
Other Nonfinancial Gains/Losses
Other nonfinancial gains/losses were losses of R$324 million during the year ended December 31, 2017, a negative variation of R$415 million from gains of R$91 million during the year ended December 31, 2016, mainly due to the disposal of property received in the collection process and the provision of the recoverable value of these assets. During the year ended December 31, 2016, other nonfinancial gains/losses were gains of R$91 million, a R$740 million decrease from gains of R$831 million during the year ended December 31, 2015, mainly due to a nonrecurring gain of R$751 million from the sale of SSS DTVM in 2015. History and Development of the Company—Important Events—Sale of Santander Securities Services Brasil DTVM S.A.”
Operating Profit Before Tax
Operating profit before tax for the year ended December 31, 2017 was R$14,514 million, a decrease of R$1,870 or 11.4% as compared to R$16,384 million for the year ended December 31, 2016. In 2015 the operating profit for tax for the year endend was a negative result of R$3,216. Excluding the effects of the hedge for investment held abroad operating profit before tax were R$15,324 million for the year ended December 31, 2017, a 49.6% increase from R$10,244 million compared to the year ended December 31, 2016. In 2015 operating profit before tax was R$7.703 million.
| For the year ended December 31, | ||||
| 2017 | 2016 | 2015 | % Change 2017/2016 | %Change 2016/2015 |
| (in millions of R$, except percentages) | ||||
Operating Profit Before Tax | 14,514 | 16,384 | (3,216) | (11.4) | (609.5) |
Effects of the hedge for investment held abroad | (810) | 6,140 | (10,919) | (113.2) | (156.2) |
Adjusted Operating Profit Before tax | 15,324 | 10,244 | 7,703 | 49.6 | 33.0 |
Income Taxes
Income taxes expense includes income tax, social contribution, PIS and COFINS (which are social contributions due on certain revenues net of some expenses). Income taxes amounted to expenses of R$5,376 million for the year of 2017, a R$3,543 million decrease from losses of R$8,919 million for the year 2016. This decrease is mainly attributable to the following events: (i) foreign exchange gains of R$6,950 million as a consequence of the effects of foreign exchange rate variations on the investment abroad on our foreign branch and subsidiary, and the associated hedging instruments, affecting the “Gains (losses) on financial assets and liabilities (net)” line and (ii) the recognition of certain tax credits during 2017 as a result of the decrease of CSLL rate from 20% to 15% applicable from 2019 onwards.
For the year ended December 31, 2016, income taxes amounted to expenses of R$8,919 million, a R$21,969 million change from a R$13,050 million of tax benefit for the year 2015. This change is principally attributable to the following events: (i) negative variation of R$17,059 million as a consequence of the effects of foreign exchange rate variations affecting certain of our foreign branches, and theassociated hedging instruments, affecting the “Gains (losses) on financial assets and liabilities (net)” line, (ii) gains of R$2.7 billion related to the reversal of a tax provision and a tax reimbursement related to the COFINS in 2015 that did not occur in 2016, and (iii) the recognition of tax credits derived from the increase of the CSLL tax rate from 15% to 20% in August 2015.
42
The following table shows our income taxes and hedge effects for the periods indicated.
| For the year ended December 31, | ||||
| 2017 | 2016 | 2015 | % Change 2017/2016 | %Change 2016/2015 |
| (in millions of R$, except percentages) | ||||
Income taxes | (5,376) | (8,919) | 13,050 | (39.7) | (168.3) |
Effects of the hedge for investment held abroad | 810 | (6,140) | 10,919 | (113.2) | (156.2) |
Income taxes excluding Effects of the hedge for investment held abroad | (6,186) | (2,779) | 2,130 | 122.6 | (230.5) |
Results of Operations by Segment for the Years Ended December 31, 2017, 2016 and 2015
The following tables show our results of operations for the years ended December 31, 2017, 2016 and 2015, for each of our operating segments.
Commercial Banking
| For the year ended December 31, | ||||
| 2017 | 2016 | 2015 | % Change 2017/2016 | %Change 2016/2015 |
| (in millions of R$, except percentages) | ||||
Net interest income | 32,392 | 27,366 | 27,041 | 18.4 | 1.2 |
Income from equity instruments | 83 | 259 | 143 | (67.9) | 81.0 |
Income from companies accounted for by the equity method | 72 | 48 | 116 | 50.0 | (58.6) |
Net fee and commission income | 11,262 | 9,580 | 8,241 | 17.6 | 16.3 |
Gains/losses on financial assets and liabilities (net) and exchange differences (net) | (26) | 5,619 | (9,069) | (100.5) | (162.0) |
Other operating income (expenses) | (641) | (611) | (335) | 4.8 | 82.4 |
Total income | 43,143 | 42,261 | 26,136 | 2.1 | 61.7 |
Personnel expenses | (8,167) | (7,638) | (7,123) | 6.9 | 7.2 |
Other administrative expenses | (7,012) | (6,273) | (6,450) | 11.8 | (2.7) |
Administrative expenses | (15,179) | (13,911) | (13,573) | 9.1 | 2.5 |
Depreciation and amortization | (1,560) | (1,382) | (1,361) | 12.9 | 1.5 |
Provisions (net) | (3,190) | (2,685) | (4,013) | 18.8 | (33.1) |
Impairment losses on financial assets (net) | (11,233) | (11,607) | (12,365) | (3.2) | (6.1) |
Impairment losses on other assets (net) | (436) | (114) | (1,220) | 281.9 | (90.7) |
Other nonfinancial gain (losses) | (324) | 91 | 831 | (456.9) | (89.1) |
Operating profit before tax | 11,220 | 12,652 | (5,565) | (11.3) | (327.3) |
| For the year ended December 31, | ||||
| 2017 | 2016 | 2015 | % Change 2017/2016 | %Change 2016/2015 |
| (in millions of R$, except percentages) | ||||
Operating Profit Before Tax | 11,220 | 12,652 | (5,565) | (11.3) | (327.3) |
Effects of the hedge for investment held abroad | (810) | 6,140 | (10,919) | (113.2) | (156.2) |
Adjusted Operating Profit Before tax | 12,030 | 6,512 | 5,354 | 84.7 | 21.6 |
43
2017 and 2016
Operating profit before tax attributed to the Commercial Banking segment for the year ended December 31, 2017 was R$11.2 billion, a R$1.4 billion decrease from R$12.6 billion for the year ended December 31, 2016. Excluding the effects of hedge for investment held abroad operation profit before taxes is 12.0 billion, 84.7% higher than 2016.
This variation was mainly due to:
· An increase of R$5,026 million in net interest income for the year ended December 31, 2017, compared to the year ended December 31, 2016, as a resultof an increase in volume of loans extended to customers and spreads andan increase in revenues fromdeposits as a result of our liability management plan.
· An increase of R$1,682 million in net fee and commission income for the year ended December 31, 2017, compared to the year ended December 31, 2016, mainly due to (i) an increase in revenues from current account, (ii) an increase in revenues from credit and debit cards, and (iii) an increase in revenues from insurance and capitalization products .
· A decrease of R$375 million in impairment losses on financial assets (net) for the year ended December 31, 2017, compared to the year ended December 31, 2016 primarily due to the same trend of strength of our risk management verified in the last years, maintaining impaired assets under control.
This variation was partially offset by:
· A decrease of R$5,645 million in gains/losses on financial assets and liabilities (net) and exchange differences (net) for the year ended December 31, 2017, compared to the year ended December 31, 2016. This variation is mainly explained by a decrease of R$6,590 million from derivatives transactions, as a consequence of our results of hedgde for investment held abroad.
2016 and 2015
Operating profit before tax attributed to the Commercial Banking segment for the year ended December 31, 2016 was R$12.6 billion, a R$18.2 billion increase from losses of R$5.6 billion for the year ended December 31, 2015.
This variation was mainly due to:
· An increase of R$14,688 million in gains/losses on financial assets and liabilities (net) and exchange differences (net) for the year ended December 31, 2016, compared to the year ended December 31, 2015, mainly due an increase of R$17,059 million from derivatives transactions, as a consequence of our results of hedge for investment held abroad. For further information see “—Other Factors Affecting Our Financial Condition and Results of Operations—Hedging in Foreign Investments.”
44
· A decrease of R$1,328 million in provisions (net) for the year ended December 31, 2016, compared to the year ended December 31, 2015, mainly due to a decrease in provisions expenses principally related to tax and civil contingencies.
· An increase of R$1,339 million in net fee and commission income for the year ended December 31, 2016, compared to the year ended December 31, 2015, mainly due to an increase in revenues from banking fees, revenues from credit and debit cards and an increase in revenues from insurance and capitalization products.
Global Wholesale Banking
For the year ended December 31, | |||||
| 2017 | 2016 | 2015 | % Change 2017/2016 | %Change 2016/2015 |
| (in millions of R$, except percentages) | ||||
Net interest income | 2,554 | 3,221 | 4,297 | (20.7) | (25.0) |
Net fee and commission income | 1,460 | 1,397 | 1,243 | 4.5 | 12.4 |
Gains/losses on financial assets and liabilities (net) and exchange differences (net) | 1,600 | 1,972 | (849) | (18.9) | (332.1) |
Other operating income (expenses) | (31) | (14) | (12) | 132.9 | 14.5 |
Total income | 5,582 | 6,576 | 4,678 | (15.1) | 40.6 |
Administrative expenses | (943) | (1,009) | (942) | (6.5) | 7.1 |
Personnel expenses | (771) | (739) | (675) | 4.3 | 9.4 |
Other administrative expenses | (172) | (270) | (267) | (36.5) | 1.3 |
Depreciation and amortization | (102) | (101) | (129) | 0.9 | (21.6) |
Provisions (net) | (119) | (39) | 12 | n.d. | (439.4) |
Impairment losses on financial assets (net) | (1,105) | (1,694) | (1,269) | (34.7) | 33.5 |
Impairment losses on other assets (net) | (21) | (0) | (0) | n.d. | n.d. |
Operating profit before tax | 3,293 | 3,732 | 2,349 | (11.8) | 58.9 |
2017 and 2016
Profit before tax attributed to the Global Wholesale Banking segment for the year ended December 31, 2017 was R$3.3 billion, a 11.8%, or R$439 million, decrease from R$3.7 billion for the year ended December 31, 2016.
This variation was mainly due to:
· a decrease of R$666 million in net interest income, principally due to lower income from market activities with customers and our proprietary trading; and
· a decrease of R$372 million in gains/losses on financial assets and liabilities (net) and exchange differences (net), mainly explained by a decrease in gains from derivatives and market positions. This variation was partially offset by a decrease of R$589 million in impairment losses on financial assets (net), primarily due to the same trend of strength of our risk management verified in the last years, maintaining impaired assets under control,
45
2016 and 2015
Profit before tax attributed to the Global Wholesale Banking segment for the year ended December 31, 2016 was R$3.7 billion, a 58.9%, or R$1,383 million, increase from R$2.3 billion for the year ended December 31, 2015.
This variation was mainly due to an increase of R$2,821 million in gains on financial assets and liabilities (net) and exchange differences (net), mainly explained by an increase in gains from derivatives and market positions. This variation was partially offset by:
· a decrease of R$1,076 million in net interest income, mainly related to losses on market positions offset in part by gains on financial assets and liabilities (net) and exchange differences (net); and
· an increase of R$425 million in impairment losses on financial assets (net), as a result of additional allowances for certain corporations that were adversely affected by the weak macroeconomic environment.
10.3 Occurred and expected events with material effects on the financial statements:
a. introduction or disposal of operating segment
No introduction or disposal of any operating segment in the Company was carried out over the last three (3) fiscal years.
b. establishment, acquisition or disposal of equity interest
· Sale of Santander Securities Services Brasil DTVM S.A.
On June 19, 2014, we executed preliminary documents containing the main terms and conditions relating to the sale of our qualified custody business operations, and of all of the shares issued by Santander Securities Services Brasil DTVM S.A. (“SSS DTVM”), one of our subsidiaries that was engaged in the rendering of third-party fund administration services. The transaction was completed on August 31, 2015, once all regulatory approvals applicable in Brazil had been obtained. Santander Securities Services Brasil Participações S.A. (“Santander Securities Brasil”), which is indirectly controlled by Santander Spain, became the owner of shares representing 100% of the total share capital of SSS DTVM, and SSS DTVM acquired the qualified custody business from Santander Brasil. The purchase price for the shares was R$859 million. The transaction generated capital gains of approximately R$450 million after taxes.
· Investment Agreement between Santander Brasil and Banco Bonsucesso S.A.
On July 30, 2014, we, through our controlled company Aymoré Crédito, Financiamento e Investimento S.A. (“Aymoré CFI”), and Banco Bonsucesso S.A. (“Banco Bonsucesso”) agreed to form a joint venture in the payroll credit card loan and payroll loan segments, currently known as Banco Olé Bonsucesso Consignado S.A., or “Banco Olé Bonsucesso Consignado.”
46
On February 10, 2015, with the approval of the Brazilian Central Bank, the transaction was completed and Santander Brasil, through Aymoré CFI, became the controlling shareholder of Banco Olé Bonsucesso Consignado, holding 60% of the share capital of the entity. Banco Bonsucesso owns the remaining portion of Banco Olé Bonsucesso Consignado’s share capital (i.e., a 40% interest).
The transaction involved the transfer to Banco Olé Bonsucesso Consignado of the payroll loan business and payroll credit card loans of Banco Bonsucesso, and our investment, through Aymoré CFI, of R$460 million in Banco Olé Bonsucesso Consignado.
Banco Olé Bonsucesso Consignado became the exclusive vehicle of Banco Bonsucesso and its subsidiaries for the offer of payroll loans in Brazil. We also continue to originate payroll loan transactions through our own independent channels.
· Investment in Super Pagamentos e Administração de Meios Eletrônicos S.A.
On December 12, 2014, we, through Aymoré CFI, acquired shares issued by Super Pagamentos e Administração de Meios Eletrônicos S.A. (“Super”) representing 50% of Super’s total and voting capital. Super is a Brazilian digital service provider that offers online payment accounts, prepaid cards and access to simplified financial services.
On January 4, 2016, Aymoré CFI informed the sellers of its decision to exercise the call option for the shares representing the remaining 50% of Super’s total voting capital owned by the sellers, for a value of approximately R$113 million. The transaction was completed on March 10, 2016, following receipt of approval from the Brazilian Central Bank.
· Financial Cooperation and Joint Venture with Banque PSA Finance
On July 24, 2015, and in furtherance of the partnership in Europe between Banque PSA Finance (“Banque PSA”) and Santander Consumer Finance for the joint operation of the vehicle financing business related to PSA Peugeot Citroën (“PSA”) brands (which include Peugeot, Citroën and DS), we entered into binding agreements for a joint venture in Brazil with Banque PSA to offer financial and insurance products to consumers and distributors of PSA brands in Brazil.
After the fulfilment of the applicable conditions precedent, which included obtaining the appropriate regulatory authorizations, the joint venture began its operations on August 1, 2016.
The principal entity around which the partnership is formed in Brazil is Banco PSA Finance Brasil S.A., 50% of which is held by our wholly-owned subsidiary, Aymoré CFI, and 50% of which is owned by Banque PSA. The transaction also contemplates the acquisition by Santander Brasil of 100% of PSA Finance Arrendamento Mercantil S.A. and 50% of PSA Corretora de Seguros e Serviços Ltda., an entity of the PSA group dedicated to the distribution of insurance products in Brazil.
The joint venture adds the network of PSA Group’s distributors in Brazil to the distribution channels of Santander Brasil for the offering of financial and insurance products, especially in the vehicle-financing sector.
47
· Establishment of Credit Intelligence Bureau
On January 20, 2016, we entered into a non-binding memorandum of understanding with Banco Bradesco S.A., Banco do Brasil S.A., Caixa Econômica Federal and Itaú Unibanco S.A., for the creation of a credit intelligence bureau, Gestora de Inteligência de Crédito S.A. (“CIB”). The CIB will be structured as a corporation and each of Santander Brasil, Banco Bradesco S.A., Banco do Brasil S.A., Caixa Econômica Federal and Itaú Unibanco S.A. will have a 20% ownership stake in the corporation.
The purpose of the CIB will be to develop a database that, in conformity with applicable laws, will collect, reconcile and handle the credit information of individuals and legal entities that register with the CIB and expressly authorize the inclusion of their credit information on the CIB’s database. We believe this initiative will lead to an increased degree of efficiency and improvement of our credit management activities, and will also facilitate the disbursement of long- and medium-term lines of credit to participants in the Brazilian Financial System and to other corporate entities.
On April 14, 2017, the definitive documents were signed by the shareholders. The necessary regulatory authorizations, including by the Brazilian Central Bank and the Brazilian Anti-Trust Authority (Conselho Administrativo de Defesa Econômica), or “CADE,” have already been granted. We estimate that the CIB will become fully operational in 2019.
· Joint Venture with Hyundai Capital Services, Inc.
On April 28, 2016, our wholly-owned subsidiary Aymoré CFI entered into a joint venture with Hyundai Capital Services, Inc. (“Hyundai Capital”), for the incorporation of (i) Banco Hyundai Capital Brasil S.A. and (ii) an insurance brokerage company, in order to provide, respectively, auto finance and insurance brokerage services and products to consumers and Hyundai dealerships in Brazil.
Aymoré CFI will own a 50% equity stake in the joint venture entities while Hyundai Capital will have an equity stake of 50% in the joint venture entities.
The incorporation of Banco Hyundai Capital Brasil S.A. and of the insurance brokerage company is subject to certain regulatory approvals, including, in the case of Banco Hyundai Capital Brasil S.A., obtaining the Brazilian Central Bank’s authorization to operate as a banking entity. The Presidential Decree required under Brazilian law has been obtained. We are currently working on the development of the administrative, operational and organizational structures for the joint venture in compliance with applicable legislation.
· Joint Venture with HDI Seguros S.A.
On December 20, 2017, we entered into binding agreements with HDI Seguros S.A. (“HDI Seguros”) for the formation of a partnership through the creation of a new insurance company called Santander Auto S.A. (“Santander Auto”). Sancap Investimentos e Participações S.A., a company controlled by Santander Brasil, will hold 50% of the issued share capital of Santander Auto with the remaining 50% being held by HDI Seguros. Santander Auto will focus on offering motor insurance policies through a 100% digital platform. The closing of the transaction is subject to the fulfillment of certain customary contractual conditions, including obtaining the applicable regulatory approvals. On March 2, 2018 the CADE approval has been granted.
48
· Sale of BW Guirapá I S.A.
On December 22, 2017, our wholly-owned subsidiary Santander Corretora de Seguros, Investimentos e Serviços S.A. (“Santander Investimentos”), Cia. de Ferro Ligas da Bahia – FERBASA S.A. (“FERBASA”) and Brazil Wind S.A. (“Brazil Wind”) entered into an agreement for the sale of 100% of the shares issued by BW Guirapá I S.A. (“BW I”) and owned by Santander Investimentos and Brazil Wind to FERBASA. The transaction also encompasses the seven wind farms organized as special purpose companies held by BW I. The base purchase price for the total shares owned by Santander Investimentos will be up to R$414 million, provided that an additional payment of up to R$35 million may be due if certain future operational milestones set forth in the agreement are achieved. The closing of the transaction is subject to the fulfillment of certain customary contractual conditions. On January 17, 2018 the CADE approval has been granted.
· Acquisition of equity stake of Ipanema Empreendimentos e Participações S.A. and Gestora de Investimentos Ipanema S.A.
On October 16, 2017, Santander Brasil, through its wholly-owned subsidiary Atual Companhia Securitizadora de Créditos Financeiros, acquired a direct equity interest in Ipanema Empreendimentos e Participações S.A. (“Ipanema Credit Management”) and an indirect equity interest in Gestora de Investimentos Ipanema S.A. (“Ipanema Asset” jointly with Ipanema Credit Management, the “Ipanema Entities”), corresponding to 70% of Ipanema Entities’ share capital.
The Ipanema Entities are active in the credit recovery intelligence sector, providing services such as credit portfolio evaluation and pricing, collection, management and recovery of non-performing loans. Ipanema Credit Management focuses on portfolio pricing, collection and credit recovery management while Ipanema Asset, as an authorized asset manager duly licensed by the CVM, is responsible for the management of credit funds in which the portfolios of the Ipanema Entities’ customers are concentrated.
We intend to increase our recovery indicators with regards to non-performing loans by using the know-how of the Ipanema Entities. We also intend for the Ipanema Entities to continue to provide non-performing loan recovery and credit management services to third parties.
· Opening of the branch in Luxembourg
On June 9, 2017, we received authorization from the Brazilian Central Bank to establish a branch in Luxembourg, with a capital in an amount equivalent to U.S$1 billion. The purpose of this branch is to offer international financial services to corporate clients with overseas operations. The branch was authorized by the Minister of Finance of Luxembourg on March 5, 2018.
· Acquisition of Technology Companies
49
On February 19, 2018 and February 28, 2018, Santander Brasil concluded the acquition of the totality of shares of Isban Brasil S.A. and Produban Serviços de Informática S.A. (“Technology Companies”), indirectly controlled by Santander Spain, for a price of approximately R$ 61 million and R$ 43 million, respectively.
The Technology Companies are the main providers of technical support and maintenance services related to software and hardware of Santander Brasil. The transaction shall permit Santander Brasil to directly control local technology services and, upon that, to increase proximity with its business, adoption of time-to-market solutions, flexibility, quality and efficiency, aligned with the operational excellence model.
c. Unusual events or transactions
Nothing to report.
10.4 Officers’ comments on:
a. Significant changes in accounting practices
In fiscal years ended December 31, 2017, 2016 and 2015, the IFRS, issued by IASB, had no significant changes in accounting practices.
b. Significant effects of changes on accounting practices
In fiscal years ended December 31, 2016, 2015 and 2014, the IFRS, issued by IASB, had no significant changes in accounting practices.
c. Auditor’s qualified opinion and highlights
In fiscal years ended December 31, 2017, 2016 and 2015, the auditor in charge issued no qualified opinion and highlights.
10.5 Officers’ indication of key points and comments on:
I. Estimates used
The consolidate results and the ascertainment of the consolidate assets are impacted by accounting policies, premises, estimates and measuring methods the Company’s managers use to prepare financial statements. The Company makes estimates and premises that affect the reported values of assets and liabilities for future periods. All estimate and premises required, in conformity with IFRS, issued by IASB, are the best estimates pursuant to applicable rule.
In consolidate financial statements, estimates are made by the Company’s and consolidate entities’ management in order to quantify certain assets, liabilities, revenues and expenses and disclosure of footnotes.
(i) Critical estimates
The critical estimates and premises that have a more significant impact on the accounting balance of certain assets, liabilities, revenues and expenses and in the disclosure of footnotes, are described below:
i. Provision for losses on credits
50
The accounting value of non-recoverable financial assets is adjusted through record of a provision by recording as debit the losses as “Losses with financial assets (net) - Loans and receivables” in the consolidate income statement. The transfer of losses previously recorded is recognized in the consolidate income statement in the period in which the reduction to the recoverable value drops and may be objectively related to a recovery event.
In order to determine the “Impairment” balance, the Company first evaluate whether there is objective evidence of loss in the recoverable value individually for financial assets that are significant, and individual or collective for financial assets that are not significant.
In order to measure individually the loss for reduction to the recoverable value of loans evaluated as to the reduction to the recoverable value, the Company considers the loan conditions, such as its economic and financial situation, indebtedness level, income generation capacity, cashflow, management, corporate governance and internal quality control, history of payments, experience in the industry, contingencies and credit limits, further to characteristics of assets, such as their nature and purpose, type, sufficiency and guarantees of liquidity level and total credit value and also based on the historic experience in reduction to the recoverable value and other circumstances known at the moment of the evaluation.
In order to measure the loss for reduction to the recoverable value of loans evaluated collectively as to the reduction to the recoverable value, the Company separates the financial assets into groups taking into consideration the characteristics and similarities of credit risk, i.e. pursuant to the segment, type of assets, guarantees and other factors associated to the historic experience of reduction to the recoverable value and other circumstances known at the moment of the evaluation.
ii. Corporate Tax Income (IRPJ) and Social Contribution on Net Profit (CSLL)
Expense with taxes on income is calculated by adding the tax and the current social contribution resulting from the application of the rate adequate to the taxable income for the tax year (net of any deductions allowed for tax purposes) and the mutations in the deferred tax assets and liabilities recognized in the consolidate income statement.
Deferred tax assets and liabilities include temporary differences identified as the values expected to be paid or recovered on differences between accounting values of the assets and liabilities and their respective tax base, and accrued tax credits and losses. Such amounts are measured to the rates expected to be applied in the period the asset is realized or the liability is liquidated. Deferred tax assets are only recognized by temporary differences as it is considered probable that the consolidated entities will have future taxable profits sufficient against which the deferred tax assets may be used, and the deferred tax assets will not result from an initial recognition (except in a business combination) of other assets and liabilities into one operation that does not affect the taxable profit or accounting profit. Other deferred tax assets (accrued tax credits and losses) are only recognized is considered probable that the consolidate entities will have future taxable profits sufficient against which they may be used.
The deferred tax assets and liabilities recognized are re-evaluated on the date of each balance sheet to determine if they still exist by making the adequate adjustments based on the verifications of the analysis made. The expectations inthe realization of the tax credits of the Company is based on projections of future results and based on a technical study.
51
iii. Evaluation of the fair value of certain financial instruments
Financial instruments are initially recognized at their fair value, which is considered to be equivalent to the price of the transaction, and those not measured to the fair value in the result are adjusted to the costs of the transaction until contrary evidence thereto upon the use of the evaluation techniques. This calculation is based on premises that take into consideration the management’s judgment based on information and existing market condition on the date of the balance (footnote 2.e of our Financial Statements).
The Company classifies the measurements of fair value by using the hierarchy of fair value that reflects the model used in the measurement process by separating the financial instruments into Level I, II or III.
The footnotes 2.e & 48.c8 of our Financial Statements present the analysis of sensibility and accounting practice for the Financial Instruments, respectively.
iv. Post-employment benefits
The benefit plans defined are recorded based on actuarial study carried out annually by a specialized company at the end of each tax year, effective for the subsequent period and not recognized in the consolidate income statement in the line of Expenses with interest and the similar and Provisions (net).
The current value of the benefit liability defined is the current value without the deduction of any asset of the plan, of the future payments expected necessary to settle the liability arising from the service rendered by the employee in the current and past periods.
v. Provisions, assets and contingent liabilities
Provisions for judicial and administrative proceedings are made whenever the risk of being defeated in the judicial or administrative proceeding is considered to be ‘probable’ and the amounts involved are measurable with sufficient accuracy based on the nature, complexity and history of the proceedings and on the opinion of in-house or outside legal advisors.
Provisions for judicial and administrative proceedings are made whenever the risk of being defeated in the judicial or administrative proceeding is considered to be ‘probable’ and the amounts involved are measurable with sufficient accuracy based on the best information available. They are either total or partially transferred whenever the liabilities cease to exist or are mitigated. Given the uncertainties arising from the proceedings, it is impractical to determine the time of any cash outflow (financial disbursement).
vi. Premium
The premium recorded is subject to an impairment test, at least once every year or in shorter periods in case of some indication of reduction in the recoverable value of the asset.
The base used for the impairment test is the value in use and, to that effect, it is estimated the cash flow for a 5-year period. The cash flow was prepared based on many factors, such as: (i) macroeconomic projections of interest rate, inflation,exchange rate and others; (ii) behavior and growth estimates of the national financial system; (iii) increase in costs, returns, synergies and investment plans; (iv) client behavior; and (v) growth rate and adjustments made to flows in perpetuity. Adopting such estimates involves the probability of future events taking place and that the change of some of those factors might have a different result. The estimate of the cash flow is based on evaluation prepared by an independent specialized company, on annual basis or whenever there are signs of reduction to its recovery account, which is revised and approved by the Executive Board.
52
II. Functional and presentation currency
The consolidate financial statements are presented in Brazilian Reais,functional and presentation currency of such statements.
For each subsidiary, entity under joint control and investment in non-consolidate company, the Company defined the functional currency. The assets and liabilities of such entities in functional currency different to BrazilianReal are translated as follows:
o assets and liabilities are translated based on the exchange rate on the date of the balance sheet;
o revenues and expenses are translated based on the average monthly exchange rate; and
o gains and losses for translation of the net investment are recorded in the comprehensive income statement, in line with the “exchange variation of the investees located abroad".
III. Basis for consolidation
i. Subsidiaries
“Subsidiaries" means entities over which the Company has control. Control is based on: (i) the power over the investee; (ii) the exposition, or rights to variable returns for its involvement with the investee, and (iii) the capacity of using its power on the investee to affect the quantity of returns, as provided for in law, Bylaws or agreement.
The consolidation of a subsidiary starts when the Company obtains the control over a subsidiary and ends where it loses such control. Specifically, the revenues and expenses of a controlled entity acquired or sold during the exercise are included in the income statement and other comprehensive results as from the date on which the Company obtained the control until the date it ceases to control the subsidiary.
The result and each component of the other comprehensive results are attributed to controllers of the Company and to the non-controlling interest, even if the effect is attributed to the non-controlling interest. The total comprehensive result of the controlled entities is attributed to the owners of the Company and to the non-controlling interest, even if it generates a negative balance for the non-controlling interest. All of the transactions, balances, revenues and expenses among the Santander Group companies are fully eliminated in the consolidate financial statements.
Any change in the interest Santander Group holds in controlled entities that does not result in loss of control by Santander Group over the controlled entities are recorded as capital transactions. The difference between the value based on which the non-controlling interest are adjusted and the fair value of theconsiderations paid or received is registered directly to the net equity and attributed to the owners of the Company.
53
Whenever the Company loses control over a controlled entity, the gain or loss is recognized in the income statement and it is calculated based on the difference between: (i) the sum of the fair value of the considerations received and the fair value of the residual interest; and (ii) the previous balance of the assets (including premium) and liabilities of the controlled company and non-controlling interest, if any. All of the amounts previously recognized in “Other comprehensive results” related to the controlled entity are accounted as if the Company had sold directly the corresponding assets or liabilities of the controlled entity (i.e., reclassified to a result or transferred to another account of the net asset, as required or allowed by the applicable IFRSs, issued by IASB). The fair value of any investment held in the former controlled entity on the date of the loss of control is considered as the fair value in the initial recognition for the subsequent accountability based on the IAS 39 Financial Instruments: Recognition and Measuring or, where applicable, the cost in the initial recognition of an investment in an affiliate or joint venture.
ii. Interest in joint ventures (entities under common control) and affiliates
Joint ventures are interest held in non-subsidiary entities but that are jointly controlled by two or more unrelated entities. This reflects in contractual agreements, under which two or more entities (“entrepreneurs”) buy interest in entities (“entities under joint control”) or have operations or hold assets so the strategic financial and operational decisions affecting the joint venture will depend on a unanimous decision of the entrepreneurs.
Affiliates are entities in which the Company has conditions to exercise a significant influence (significant influence is the power to participate in the decision-making in financial and operational policies of the investee) but does not control nor hold any joint control over it.
In the consolidate financial statements, the interest in entities under joint control and investments in affiliates are accounted based on the equity method, i.e. the Company’s interest in the investee’s net assets, taking into account the dividends paid of the elimination of capital and other products. In case of operations with an affiliate, the results related are eliminated pursuant to the investment by the Company in the affiliate. Relevant information on the company accounted based on the equity method by the Company are given in footnote 12 of our Financial Statements.
iii. Mergers, acquisitions and sales of companies
A combination of business means the union of two or more individual entities or economic units into one single entity or group of entities entered pursuant to the IFRS 3 (“Combination of Businesses”).
The combination of businesses is made in a way that the Company obtains the control over one entity and are recognized on accounting terms as follows:
· The Company calculates the costs with the combination of businesses, defined as the fair value of the assets offered, the liabilities incurred and the ownership instruments, if applicable.
· The fair values of the assets, liabilities and contingent liabilities of the entity or acquired business, including the intangible assets that have not been recognized by the acquired entity are estimated on the date of the acquisition and recognized in the consolidate balance sheet.
54
· The surplus of the costs with the acquisition on the fair value of the identifiable net asset acquired is recognized as premium (footnote 14 of our Financial Statements). The surplus of the fair value of the identifiable net assets on the costs with acquisition is considered as an advantageous purchase and recognized in the result on the date of the acquisition.
Footnote 4 has a description of the most significant transactions that took place in 2016, 2015 and 2014.
iv. Investment funds
It includes the Investment Funds in which the Company and its controlled entities have substantial interest or the total of their shares and on which the Company is exposed, or is entitled to variable returns and has the capacity of affecting such returns through decision-making powers pursuant to IFRS 10 – Consolidate Financial Statements, therefore are consolidated in such Consolidate Financial Statements.
IV. Definitions and classification of the financial instruments
i. Definitions
· “Financial instrument” means any contract that generates a financial asset in an entity and simultaneously a financial liability or financial participation in other entity.
· “Equity instruments” means any contract that represents a residual interest in the asset of the issuing entity after all of its liabilities are deduced.
· “Financial derivative” means the financial instrument whose value changes in response to the changes in an observable market variable (such as interest rate, exchange rate, price of financial instruments, market rate or credit rating), in which the initial investment is very low in comparison to other financial instruments with a similar response to the changes of market factors and is generally settled at a later date.
· “Hybrid financial instruments” are contracts that simultaneously include a non-derivative main contract and a derivative one, known as embedded derivatives, which cannot be transferred separately and whose effect is making part of the cash flows of the hybrid contract vary in a way that is similar to an isolated derivative.
The transactions below are not treated as financial instruments for accounting purposes:
· Investments in subsidiaries, entities jointly controlled and affiliates (footnote 12 of our Financial Statements).
· Rights and obligations by virtue of benefit plans for employees (footnote 23 of our Financial Statements).
ii. Classification of the financial assets for measuring purposes
The financial assets are initially classified in the many categories used for management and measuring purposes, except where it is mandatory its presentation as “Noncurrent assets kept for sale” or if they refer to “Availabilities and reserves in Central Bank”, “Derivatives used as hedge” and “Investment in affiliates”, which are recorded separately.
55
The financial assets are included for measuring purposes in the following categories:
· Financial assets for negotiation (measured at the fair value based on result): this category includes financial assets bought to generate profit on a short term basis resulting from the variation of their price, and the financial derivatives are classified as hedge instruments.
· Other financial assets at fair value of the result: this category includes the hybrid financial assets not kept for negotiation and totally measures to the fair value and the financial assets not kept for negotiation that are included in this category to obtain more relevant information, either to eliminate or reduce significantly the inconsistencies of recognition or measuring (“accounting divergences”) derived from the measuring of assets or liabilities or the recognition of the gains or losses with them on diverse basis, either because there is a group of financial assets or financial liabilities or both that is managed and whose performance is evaluated based on fair value, pursuant to a documented risk or investment management strategy, and the information on the Company is given to key professionals of the Company’s Management on the same basis.
The financial instruments included in this category (and in “Other financial liabilities at the fair value in the result”) are submitted on a permanent basis to a consistent measuring, management and control risk and return system, which allow the monitoring and identification of all of the financial instruments and the verification of an actual risk reduction. The financial assets may only be included in this category on the date they are acquired or generated.
Financial assets available for sale are demonstrated at their fair value. This category does not include debit instruments classified as “Investments kept to maturity”, “Receivable loans” or “Financial assets at fair value in the result”, and equity instruments issued by entities that are not subsidiaries, affiliates or entities under joint control, provided that such instruments have not been classified as “Financial assets for negotiation" or as “Other financial assets at fair value in the result". Results arising from changes in the fair value are recognized in the item adjustment to the market value in the net asset, to the exception of accrued losses due to impairment, which are recognized in the result. When the investment is sold or presents signs of reduction in the fair value due to impairment, the previous result accrued in the account of adjustment to the fair value in the net asset is reclassified for result purposes.
· Loans and receivables: this category includes financings granted to third parties based on their nature, regardless of the type of debtor and the method of financing, including the financial leasing transactions, in which the entities included in the consolidation act as lessors. The entities included in the consolidation have, in general, the intention of keeping the loans and credits that grant up to the final maturity, which, for that reason, are presented in the consolidate balance sheet based on the amortized costs (which includes the necessary adjustments to reflect the losses for estimated non-recoveries).
· Investments kept to maturity: this category includes the debt instruments negotiated in active market, with fixed maturity and fixed or determinable payments, in relation to which the Company intends and has the proven capacity of keeping them up to their maturity. Such investments are measures based on the amortized costs less loss for impairment, with recognized revenue based on effective yield.
56
iii. Classification of the financial assets for presentation purposes
The financial assets are classified based on the nature of the following items in a consolidate balance sheet:
· “Availabilities and reserves in Central Bank”: cash balance and credit balance in cash concerning deposits in the Central Bank.
· “Loans and receivables”: it includes the loans granted by the Company, such as financial leasing credits and other debit balances of financial nature in favor of the Company, such as check drew against financial institutions, credit balances in relation to the chambers of compensation and agencies for settlement per transactions at stock exchange and organized markets, bonus paid in cash, call for payments, credits and rates and commissions for financial guarantees and debit balances resulting from transactions not originated in banking operations and services, such as collection of rentals and similar items.
· “Loans and other amounts with credit institutions”: credits of any nature in the name of financial institutions.
· “Loans and advances to clients”: it includes debit balances from all of the other credits and loans granted by the Company, including operations in the open market by means of centralized counterparties.
· “Debt instruments”: bonus and other bonds that represent debt for the issuer, generate interest and are issued on a hard copy or through registration.
· “Equity instruments”: financial instruments issued by other entities, such as stock with nature of equity instruments for the issuer, except investments in subsidiaries, entities under joint control or affiliates. The shares in investment funds not consolidated are included in this item.
· “Derivatives”: it includes the fair value in favor of the Company of the derivatives that are not part of the hedge instruments.
· “Derivatives used as hedge”: it includes the fair value in favor of the Company of the derivatives designed as hedge instruments.
· “Interest in affiliates and joint business”: it includes investments in entities or associates under joint control.
iv. Classification of the financial assets for measuring purposes
The financial assets are classified, for measuring purposes, into the following categories:
· Financial assets for negotiation (measured at the fair value based on result): this category includes financial assets issued to generate short-term profit resulting from the variation of their price, the financial derivatives not considered as “hedge accounting” and the financial liabilities resulting from the direct sale of financial assets bought upon resale or loan commitments (“Positions sold”).
· Other financial assets at fair value of the result: this category includes the financial liabilities whenever there is no further relevant information obtained, either to eliminate or reduce significantly the inconsistencies of recognition or measuring (“accounting divergences”) derived from the measuring of assets or liabilities or the recognition of the gains or losses with them on diverse basis, either because there is a group of financial assets or financial liabilities that is managed and whose performance is evaluated based on fair value, pursuant to a documented risk or investment management strategy, and the information on the Company is given to key professionals of the Company’s management on the same basis.
57
· Financial liability at amortized cost: financial liabilities regardless of their method and maturity not included in any of the previous categories and resulting from the taking out of financing made by financial institutions.
v. Classification of the financial liabilities for presentation purposes
The financial liabilities are classified based on the nature of the following items in a consolidate balance sheet:
· “Central Bank Deposits”: deposits of any nature received from the Central Bank.
· “Deposits from credit institutions”: deposits of any nature, including liabilities due to loans and transfers of capital raising in the open market, received from credit institutions.
· “Deposits from clients”: it includes deposits of any nature such as in cash, savings and on term, including open market operations received from clients.
· “Liabilities for bonds and securities”: it includes the bonus amount and other debts represented by negotiable bonds, except subordinated liabilities.
· “Derivatives”: it includes the fair value with Company’s negative balance of the derivatives that are not part of the hedge accounting.
· “Positions sold”: it includes financial liabilities resulting from the direct sale of financial assets bought upon resale or loan commitments.
· “Subordinated debts”: value of the financings received that, for the purpose of payment priority, are below the common debts. This category also includes the financial instruments issued by the Company that, although they constitute actions for legal purposes, they do not meet the requirements to be classified as actions.
· “Other financial liabilities”: it includes the amount of payment liabilities with the nature of financial liabilities not included in the other items and the liabilities subject to financial guarantee agreements, except if they are classified as doubtful.
· “Derivatives used as hedge”: it includes the fair value of the Company’s liability concerning the derivatives designed as hedge instruments.
V. Capital raisings, issues and other liabilities
The capital raising instruments are initially recognized at their fair value basically considered as the transaction price. They are subsequently measured at the amortized cost (accrual method) with the inherent expenses recognized as a financial benefit.
Among the criteria for an initial recognition of liabilities, it should be mentioned those composed-nature instruments that are classified as such because of the existence of a (liability) debt instrument and a component of embedded net equity (derivative).
The record of composed instrument consists in the joining of (i) a main instrument, which is recognized as a genuine liability of the entity (debt) and (ii) an equity component (derivative of convertibility into ordinary shares).
The issue of “Notes” must be registered in a specific account of the liability and updated pursuant to the rates adjusted and covenanted based on the exchange variation effect, where denominated in foreign currency. All of the compensation concerning such instruments, such as interest and exchange variation (difference between the functional currency and the currency in which the instrument wasdenominated) must be entered as expenses for the period subject to the accrual regime.
58
The details concerning issuance of such debt instruments eligible to capital are described in footnote 21 of our Financial Statements.
VI. Measurement of financial assets and liabilities and recognition of changes in fair value
In general, financial assets and liabilities are initially recognized at fair value, which is considered to be equivalent, until contrary evidence, to the transaction price. The financial instruments are measured at fair value in the result are adjusted based on the transaction costs. The financial assets and liabilities are subsequently measured at the end of each tax year, as follows:
i. Measurement of financial assets
Financial assets are measured at fair value, without deducting estimated transaction costs that may be incurred in disposing of them, with the exception of loans and receivables, investments held to maturity and equity instruments for which a fair value cannot be ascertained with sufficient reliability, and financial derivatives related to equity instruments of this kind and which are to be closed out upon delivery of these instruments.
The “fair value” of a financial instrument on a specific date is the price that would be received for the sale of an asset, or paid for the transfer of a liability, in an orderly transaction between market participants on the measurement date. The most objective and commonest reference for the fair value of a financial instrument is the price which would be paid for it in an active, transparent and substantial market (“quoted price” or “market price”).
If there is no market price for a particular financial instrument, its fair value is estimated on the basis of the valuation techniques normally used by the international financial community, taking into account the specific characteristics of the instrument to be measured, and, above all, the different kinds of risk associated with it.
All derivatives are recognized in the balance sheet at fair value as from the dealing date. When the fair value is positive, the instruments are recognized as assets; when it is negative, as liabilities. Changes in the fair value of derivatives after the dealing date are recognized under the heading “Gains (losses) on financial assets and liabilities” in the consolidated statement of income. Specifically, the standard fair value of financial derivatives included in the portfolios of financial assets and liabilities held for trading is considered to be equivalent to its daily quoted price; if, for exceptional reasons, it is impossible to obtain a quoted price on a specific date, these derivatives are measured using methods similar to those used for measuring derivatives traded on an over-the-counter market.
The fair value of derivatives traded on an over-the-counter market is taken to be the sum of future cash flows from the instrument, discounted to present value on the measurement date (“present value” or “theoretical closing price”), using the valuation techniques usually adopted in financial markets: Net Present Value (NPV), options pricing models and other methods.
“Loans and receivables” and “Investments held to maturity” are measured at amortized cost, using the effective interest rate method. “Amortized cost” is the cost of acquisition of a financial asset or liability, plus or minus (as appropriate) thepayments of principal and accumulated amortization (included in the income statement) of the difference between the initial cost and the maturity value. In the case of financial assets, amortized cost also includes any impairment losses or bad debts. In the case of loans and receivables subject to a fair value hedge, changes in their fair value are recognized in relation to the risk(s) hedged.
59
The “Effective interest rate” is the discount rate corresponding exactly to the initial value of a financial instrument in respect of all its estimated cash flows, of every kind, throughout its remaining useful life. In the case of fixed income financial instruments, the effective interest rate is the contractual rate defined on the contract date plus commission and transaction costs, as applicable, which by their nature form part of the financial return. In the case of floating rate financial instruments, the effective interest rate is the rate of return obtained on all the commitments up to the reference date following the latest rollover date.
Equity instruments for which a fair value cannot be ascertained with sufficient reliability are measured at acquisition cost, adjusted by impairment losses if any.
The values for which financial assets are recognized represent, in all material respects, the Company’s maximum exposure to credit risk on the date of the financial statements. In addition, the Company has taken security and other credit increments to mitigate its exposure to credit risk, principally in the shape of mortgages, pledges of cash, equity instruments, sureties, asset leases and rental agreements, securities purchased on a repo basis, and securities and derivatives loans.
ii. Measurement of financial liabilities
Most financial liabilities are measured at amortized cost, as defined above, except those shown under the heading of "Financial liabilities for trading” and “Other financial liabilities at fair value through income”, and financial liabilities designated as the object of a fair value hedge, which are measured at fair value.
iii. Recognition of changes in fair value
As a general rule, changes in the book value of financial assets and liabilities are recognized in the consolidated statement of income. A distinction is made between those arising from provisioning for interest and similar gains – recognized under the heading “Interest and similar revenues” or “Interest and similar expenses”, as appropriate – and those arising for other reasons, which are recognized at their net value under the heading “Gains (losses) on financial assets and liabilities, net”.
Adjustments for changes in fair value in financial assets available for sale are recognized temporarily in shareholders’ equity under the heading “Other comprehensive income". Items debited or credited to this account remain in the Company’s consolidated shareholders’ equity until the corresponding assets are written off, and then they are debited to the consolidated statement of income.
iv. Hedging transactions
The group uses financial derivatives for the following purposes: (i) to provide these instruments to customers who ask for them to manage their market and credit risks; (ii) for use in managing the risk of the Company’s own positions and of the assets and liabilities of its subsidiaries (Derivatives used for hedging); or (iii) to obtain gains from the fluctuations in price of these derivatives (Derivative financial instruments).
60
Financial derivatives that do not qualify as hedge accounting transactions are treated, for accounting purposes, as derivatives for trading.
A derivative is booked as hedge accounting if all the following conditions are met:
1. The derivative provides protection against one of the following three types of exposure:
a. Changes in fair value of assets and liabilities due, among other things, to fluctuations in interest or exchange rates affecting the position or the balance to be protected (fair value hedge).
b. Changes in estimated cash flows due to financial assets and liabilities, commitments and transactions which are highly likely to occur (cash flow hedge).
c. A net investment in a foreign operation (“hedge of a net investment in a foreign operation”).
2. When it is effective in offsetting the exposure inherent in the item or position protected during the entire expected period of the hedge, i.e.:
a. On the contract date it is expected that the hedge, under normal conditions, will be highly effective (“prospective effectiveness”).
b. There is sufficient evidence that the hedge was effective during the entire period for which the item or position covered existed (“retrospective effectiveness”).
3. There must be adequate documentation showing the designation of the financial derivative as a hedge for specific balances or transactions, and how it is anticipated that protection will be achieved and measured, provided that this is consistent with the Company’s own risk management procedures. Changes in value of financial instruments used in hedge accounting are recognized as follows:
a. Gains or losses on fair value hedges, both on the hedge instruments and the items protected (attributable to the type of risk being hedged) are recognized directly in the consolidated statement of income.
b. For cash flow hedges, the effective portion of a change in the value of the hedging instrument is recognized temporarily in shareholders’ equity, under the heading of “Other comprehensive income – Cash flow hedges” until the proposed transactions take place, and then this portion is recognized in the consolidated statement of income, unless the transactions result in recognition of non-financial assets or liabilities, in which case this portion is included in the cost of these assets or liabilities. The non-effective portion of changes in the value of derivatives for currency hedging is recognized directly in the consolidated statement of income.
c. The non-effective portion of gains and losses on cash flow hedging instruments, and hedges of a net investment in a foreign operation, is recognized directly in “Gains (losses) on financial assets and liabilities, net” in the consolidated statement of income.
If a derivative designated as a hedging instrument ceases to meet the requirements described above due to maturity, ineffectiveness or any other reason, it will be classified as a derivative for trading.
When the booking of hedge transactions at fair value is reversed, adjustments previously recognized on the protected item are transferred to income, at theeffective interest rate recalculated on the date of reversal of the hedge. The adjustments must be amortized in full at maturity.
61
When cash flow hedges are reversed, any cumulative gain or loss on the hedging instrument that has been recognized in shareholders’ equity under the heading of “Other comprehensive income” (since the time when the hedge became effective) remains in this account until the proposed transaction takes place, and is then recognized in income. If the transaction is no longer expected to take place, any cumulative gain or loss is recognized immediately in income.
VII. Write-off of financial assets and financial liabilities
The accounting treatment of transfers of financial assets depends on the extent in which the risks and rewards relating to the assets transferred are transferred to third parties:
1. If the Company substantially transfers all risks and rewards to third parties – unconditional sale of financial assets, sale of financial assets based on an agreement that provides for its repurchase at fair value on repurchase date, sale of financial assets through purchase of a call option or sale of a put option that is significantly outside the price range, securitization of assets where the transferor does not retain a subordinated debt or grants a credit improvement to the new holders and other similar events – the financial asset transferred is written off and any rights or obligations retained or created on transfer are simultaneously recognized.
2. If the Company substantially retains all risks and rewards associated with the financial asset transferred – sale of financial assets based on an agreement that provides for its repurchase at a fixed price or sales price plus interest, a security lending agreement whereby the borrower undertakes to return the same assets or similar assets and other similar events – the financial asset transferred is not written off and continues to be measured using the same criteria used before transfer. However, the following items are recognized:
a. A corresponding financial liability, at an amount equal to the consideration received; such liability is subsequently measured at amortized cost.
b. The revenue from the financial asset transferred not written off and any expense incurred with the new financial liability.
3. If the Company neither transfers nor retains substantially all risks and rewards associated with the financial asset transferred – sale of financial assets using a call option in a long position or put option in a short position that is not substantially outside the price range, securitization of assets where the transferor retains a subordinated debt or grants a credit improvement with respect to a portion of the asset transferred and other similar events – the following distinction is made:
a. If the transferor does not retain the control of the financial asset transferred, the asset is written off and any rights or obligations retained or created on transfer are recognized.
b. If the transferor retains the control, he/she continues to recognize the financial asset transferred at an amount equivalent to its exposure to changes in value and recognizes a financial liability associated with the financial asset transferred. The net carrying amount of the asset transferred and related liability corresponds to the amortized cost of rights and obligations retained, if the assettransferred is measured at amortized cost, or the fair value of the rights and obligations retained, if the asset transferred is measured at fair value.
62
Therefore, financial assets are only written off when the rights on cash flows generated are extinguished or when substantially all relevant risks and rewards are transferred to third parties. Likewise, financial liabilities are only written off when the obligations that generate them are extinguished or when they are acquired with the intention of being cancelled or resold.
VII. Offset of assets and liabilities
Financial assets and liabilities are offset, i.e., accounted for in the balance sheet at their net amounts, only if the Company and its subsidiaries have a currently legally enforceable right to offset the amounts recognized and have the intention to settle them on a net basis, or realize the asset and settle the liability simultaneously.
As of December 31st, 2017, 2016 and 2015, the Company did not have financial instruments that meet the conditions to be recognized on a net basis.
VIII. Regular purchase of financial assets
Regular purchases of financial assets normally are recognized on transaction date. Assets are reversed when the rights to receive cash flows expire or when the Company has substantially transferred all risks and rewards of ownership.
(i) Impaired financial assets
i. Definition
A financial asset is impaired when there is objective evidence of events that:
· Result in an adverse impact on estimated future cash flows on the transaction date, in the case of debt instruments (borrowings and debt securities).
· Cause their carrying amounts not be fully recovered, in the case of equity instruments.
· Arise from breach of borrowing terms or conditions, and
· Due to a bankruptcy process.
In general, whenever the abovementioned events are identified, the carrying amount of impaired financial assets is adjusted by recognizing an allowance for impairment losses charged as expense in “Losses on financial assets (net)” in the consolidated income statement. The reversal of losses previously recorded is recognized in the consolidated income statement when the impairment loss decreases and can be objectively related to a recovery event.
ii. Debt instruments stated at amortized cost
The amount of the impairment loss incurred on a debt instrument measured at amortized cost is equal to the difference between its carrying amount and the present value of the estimated future cash flows (excluding future credit losses not incurred), discounted at the original effective interest rate of the financial asset (ie, the effective interest rate calculated upon initial recognition), and is presented as a reduction of asset and recognized in the income statement.
63
When estimating future cash flows of debt instruments, the following factors are taken into consideration:
· All amounts expected to be obtained over the remaining life of the instrument, including collaterals offered, where applicable.
· The impairment losses also take into account the probability of accumulated interest receivables;
· The various types of risks to which each instrument is subject; and
· The circumstances based on which collections will probably be made.
These cash flows are subsequently adjusted using the effective interest rate of the transaction.
With respect to losses of recoverable amounts arising from the materialization of debtors' insolvency risk (credit risk), a debt instrument will be irrecoverable due to insolvency when there is evidence of a deterioration of the debtor's ability to pay due to being overdue or for other reasons.
The Company applies, through its risk area, policies, methods and procedures to mitigate its exposure to credit risk arising from insolvency attributable to counterparties.
These policies, methods and procedures are applied on granting, analysis and documentation of debt instruments, contingent liabilities and other obligations, identification of the recoverable value and calculation of the amounts necessary to cover the related credit risk.
The procedures applied on the identification, measurement, control and decrease of the exposure to the credit risks are applied individually or by grouping similar credit risk characteristics:
· Customers with individual management: customers in the Wholesale sector, financial institutions and certain companies. Risk is managed through an analysis supplemented by tools in order to assist the internal risk assessment procedure based on the decision-making model.
· Customers with standard management: individuals and legal entities not classified as individual customers. Risk management models based on automated decision making and risk assessment procedures, supplemented, when the model is not comprehensive or accurate enough, by analyst teams specialized on this type of risk. Receivables relating to standard customers are normally considered as uncollectible when they have a history of losses and are past-due over 90 days.
Regarding the provision for impairment losses from credit risk, the Company evaluates all loans. Loans are individually analyzed with respect to impairment or jointly analyzed with respect to impairment. Loans accounted for at amortized cost, which are not individually analyzed with respect to impairment, are jointly analyzed with respect to impairment, and grouped considering risk similarity. Loans individually analyzed with respect to impairment are not included in balances jointly analyzed with respect to impairment.
First, the Company assesses whether there is objective evidence of impairment individually for financial assets that are individually significant, or individually or collectively for financial assets that are not individually significant.
64
To individually measure impairment losses on loans analyzed with respect to impairment, the Company considers the borrower’s conditions, such as economic and financial condition, level of indebtedness, profit generation capacity, cash flow, management, corporate governance and internal control quality, history of payments, experience in the sector, contingencies and credit limits, as well as the characteristics of assets, their nature and purpose, type, sufficiency and liquidity-level guarantees and total credit amount, and also based on past experience of impairment and other circumstances know at the time of the analysis.
To measure the impairment loss on loans collectively analyzed for impairment, the Company segregates financial assets into groups considering the characteristics and similarity of credit risk; in other words, according to segment, the type of assets, guarantees and other factors associated with the history of impairment and other circumstances known at the time of the analysis.
In these cases, the entity uses its judgmental experience to estimate the value of any impairment losses and to adjust the observable data of a group of financial assets to reflect the current circumstances.
The impairment loss is calculated using statistical models that take into consideration the following factors:
· Exposure at default or “EAD” is the amount of the risk exposure on the date borrower is in default.
· In accordance with the IFRS, the exposure on the date of default used for this calculation is the current exposure, as reported in the balance sheet.
· Probability of default or “PD” means the probability of the borrower not performing its obligations to pay the principal and/or interest. PD is measured on a one-year period basis; i.e., it measures the probability of default by the borrower over the next year. There will be default if the principal or interest is past due over ninety (90) days or if the loan is outstanding but there are doubts with respect to the counterparty’s solvency (subjective doubtful assets).
· Loss given default, or “LGD”, is the loss incurred in case of default. In addition to assessing IP, we manage our portfolio for loans to which borrowers will provide higher amounts of collateral related to operations and will also act to constantly strengthen the loan recovery area. These and other combined actions are responsible for ensuring the adequacy of the LGI parameters (loss resulting from the default event by the borrower in relation to the satisfaction of principal and / or interest payments). LGD calculation is based on the net charge offs on defaulted loans, taking into account the guarantees/collateral associated with the loans, the income and expenses associated with the recovery process and the timing of delinquency.
· The loss identification period, or “LIP”, is the period of time between the moment a loss takes place and the identification of objective evidence of that loss. In other words, it represents the period of time from the credit loss until the actual confirmation of that loss.
· In addition, before writing off past-due loans (which is made only after the Company makes all collection efforts) a full allowance is created for the remaining debt balance of the loan so that our allowance for loan losses fully cover our losses. Hence, the Company believes that its methodology for provision for impairment was developed to adjust its risk metrics and capture loans that may become irrecoverable.
iii. Debt or equity instruments classified as available for sale
65
The difference between the amortized cost and fair value of debt or equity instruments classified as available for sale is recorded in equity in line item “Other Comprehensive Income”.
When there is objective evidence that the abovementioned differences arise from the loss considered due to the decrease in fair value due to impairment, they are no longer recognized in equity and are classified in the consolidated income statement at the cumulative amount on that date. Losses considered permanent relating to an investment in equity instruments are not reversed in subsequent periods.
IX. Repurchase agreements
Purchases (sales) of financial assets based on a non-optional fixed price repurchase agreement are recognized in the consolidated balance sheet as investments in repurchase agreements, based on the nature of the debtor (creditor), under the heading “Availabilities and reserves at the Central Bank”, “Loans and other amounts with credit institutions” or “Loans and advances to customers” ("Deposits from the Central Bank", “Deposits from credit institutions" or "Deposits from customers").
Differences between the purchase and sale prices are recognized as interest over the term of the agreement.
X. Lease accounting
i. Finance leases
Finance leases are leases that transfer to the lessor substantially all risks and rewards of ownership of the leased asset.
When the consolidated entities act as the lessors of an asset, all types of finance leases have a guaranteed residual value, and the sum of the present value of the lease payments receivable from the lessee plus the guaranteed residual value -which is generally the exercise price of the call option of the lessee at the end of the lease term - is recognized as a loan to third parties and is therefore included in line item “Loans and receivables” in the consolidated balance sheet.
The finance income arising from these agreements is credited to “Interest income and similar” in the consolidated income statement so as to obtain a constant rate of return on the lease term.
XI. Noncurrent assets held for sale
Noncurrent assets held for sale include the carrying amount of individual items, or groups of disposal or items that are part of a business unit for disposal (“Discontinued transactions”), whose sale “as is” is highly probable and which is expected to occur within one year. Properties or other noncurrent assets received by consolidated entities upon full or partial settlement of payment obligations of borrowers are considered as noncurrent assets held for sale through auctions that normally take place within one year.
Noncurrent assets held for sale are measured as the lower of the fair value less costs to sell and the carrying amount on the date in which they are classified in this category. Noncurrent assets held for sale are not depreciated.
66
Impairment losses on an asset or group of disposal as a result of a decrease in its carrying amount to the fair value (less costs to sell) are recognized in “Profit/loss on disposal of and expenses of noncurrent assets held for sale not classified as discontinued transactions” in the consolidated income statement. Gains on a noncurrent asset held for sale arising from subsequent increases in the fair value (less costs to sell) increase their carrying amount and are recognized in the consolidated income statement until the amount corresponding to impairment losses previously recognized.
XII. Residual maturity periods and average interest rates
An analysis of the maturity of the balances of certain items in the consolidated balance sheets and the average interest rates at the end of the years 2017, 2016 and 2015 is informed in note 45-d of our Financial Statements.
XIII. Tangible assets
Tangible assets include the amount of buildings, land, furniture, vehicles, IT equipment (hardware) and other tools owned by the Company, including tangible assets received by the Company upon full or partial settlement of financial assets corresponding to accounts receivable from third parties for the purpose of continuing use, and tangible assets acquired based on finance leases, presented at cost less the related accumulated depreciation and any impairment losses (net carrying amount higher than the recoverable amount).
Depreciation is calculated on a linear basis based on the acquisition cost less its residual value. Land upon which buildings and other structures with indefinite useful lives are built, therefore, are not depreciated.
Depreciation expenses on the tangible asset are recognized in the consolidated income statement and basically calculated using the following depreciation rates (based on the average of years of estimated useful life of different assets):
|
|
|
|
|
|
|
|
|
|
|
|
|
| Annual rate | |||
Buildings for one´s own use | 4% | ||||||||||||||||
Furniture | 10% | ||||||||||||||||
Fixtures | 10% | ||||||||||||||||
Office and computing equipment | 20% | ||||||||||||||||
Improvements to third party properties | 10% or until expiration of the agreement. | ||||||||||||||||
The Company determines, at the end of each period, if there is any indication that tangible assets might be impaired, i.e., an asset with a carrying amount above the realizable value, either through use or sale.
Once the impairment of the tangible asset is identified, it is adjusted until reaching its realizable value through the recognition of an impairment loss recorded in "Losses on other assets (net)". In addition, the depreciation amount of the aforesaid asset is recalculated so as to adjust the useful life of the asset.
In case of any evidence or indication of impairment of a tangible asset, the Company recognizes the reversal of the impairment loss recorded in prior years andshould adjust future depreciation expenses based on the useful life value of the asset. Under no circumstance can the reversal of an impairment loss of an asset increase its carrying amount above the amount that would have been obtained had no impairment loss be recognized in prior fiscal years.
67
Upkeep and maintenance expenses relating to the own use property are recognized as expenses in the period in which they are incurred.
XIV. Intangible assets
Intangible assets refer to non-monetary identifiable assets (separable from other assets) with physical substance that result from a legal transaction or internally developed software. Only assets whose cost can be reliably estimated and based on which consolidated entities consider as probable that future economic benefits will be generated are recognized.
Intangible assets are initially recognized at acquisition or production cost and are subsequently measured less of any accumulated amortization and any accumulated impairment losses.
i. Goodwill
Upon acquisition of an investment in subsidiary, any difference between the investment cost and the investor’s share in the net fair value of the identifiable assets, liabilities and contingent liabilities of the investee (subsidiary or associate) is accounted for under IFRS 3 - Business Combination.
Goodwill is recognized only when the amount of the consideration obtained from the investee exceeds the fair value on acquisition date and, therefore, represents a payment made by the buyer in consideration for future economic benefits of assets of the acquiree that cannot be identified individually and recognized separately.
At the end of each reporting period or whenever there is an indication of impairment, the goodwill is tested for impairment (recoverability test) and if there is any loss, goodwill is written off upon recognition as “Losses on other assets (net) – Other intangible assets” in the consolidated income statement.
The adjustment to the net fair value of the identifiable assets, liabilities and contingent liabilities of the investee with respect to their carrying amounts are individually allocated to the identifiable assets acquired and liabilities assumed that comprise it based on the respective fair values on the acquisition date.
In case of business combinations made in phases, the prior interest in the acquiree at fair value on acquisition date that such acquiree’s control is obtained is measured again.
II - Other intangible assets
Refers to an identifiable non-monetary asset with no physical substance. It basically derives from the development of software, as well as the acquisition of rights that are capable of generating economic benefits to the Bank. They could be definite or indefinite.
Other intangible assets have indefinite useful life when, based on an analysis of all relevant factors, it is concluded that there is a predictable limit for the periodover which the asset is expected to generate cash inflows for the Company, or a finite useful life in all other cases.
68
Intangible assets with an indefinite useful life are not amortized, on the contrary, at the end of each period, the entity reviews the remaining useful life of the assets in order to determine if it continues to be indefinite and, if not, the change should be accounted for as a change in accounting estimates.
Intangible assets with finite useful life are amortized over such useful life using methods similar to those used to depreciate tangible assets. Amortization expenses are recognized in line item "Depreciation and amortization" in the consolidated income statement.
The Company determines, at the end of each period, if there is any indication that intangible assets might be impaired, i.e., an asset with a carrying amount above the realizable value. After identifying any impairment, this is adjusted until reaching its realizable value.
The measurement of the recoverable value of other intangible assets - software is made based on the value in use, as well as on the analysis of the discontinuance of the asset with respect to the Company´s activities.
Software acquisition and development expenses are amortized over a maximum period of five (5) years.
XV. Other assets
Includes the balance of all advances and revenues accrued (excluding accrued interest), lists of acquired clients, the net amount of the difference between pension plan obligations and the amount of the plan’s assets with a balance on behalf the entity, if the net amount is to be disclosed in the consolidated balance sheet, and the amount of any other properties and assets not included in other items.
The Company uses the value in use of the lists of customers to determine the recoverable value since it is not reasonably possible to determine the net sales amount, because there is no basis to make a reliable estimate of the amount to be obtained in consideration for the sale of the assets in an arm’s length transaction between knowledgeable, willing parties. The value in use of lists of customers acquired related to the purchase of “payrolls” is determined individually. An analysis is prepared by the business areas which is intended to show the expected generation of future economic benefits and the present value of expected cash flows. On a quarterly basis, these analyses are reviewed based on actual cash flows of each business (value in use), which are compared to the carrying amount, verifying whether or not there is a need to account for an impairment loss.
XVI. Liabilities for insurance agreements
Liabilities for insurance agreements are comprised mainly of mathematical provisions of benefits granted and to be granted (PMBaC and PMBC). Insurance agreements are agreements where the Company accepts a significant risk – other than the financial risk – of an insured and accepts to compensate the beneficiary in the event of future uncertain events where the beneficiary will be adversely affected.
Insurance liabilities are recognized when the agreement is accounted for and the premium is collected. Agreements that are classified as insurance are notsubsequently reclassified. Liabilities are written off when the agreements is terminated or cancelled.
69
All valuation methods used by the subsidiaries are based on general principles that the carrying amount of the net liability needs to be sufficient to cover any projected obligation resulting from insurance agreements. Investment assumptions are also determined by the local regulatory agency or based on management’s future expectation. In the latter case, the anticipated return of the future investment is defined by management considering available market information and economic indicators. An assumption significantly related to the estimated gross profit on variable annuities is the annual long-term growth rate of the underlying assets.
Tests are carried out to verify that the mathematical provisions are adequate for each fiscal period.
In the years ended on December 31, 2017, 2016 and 2015, as determined by IFRS 4 and subsequent amendments, the adequacy of the technical provisions constituted were evaluated through the TAP (Passive Suitability Test).
On December 31, 2017, TAP (Passive Suitability Test) indicated the need to create additional technical provisions of R$ 130.307 (12/31/2016 - R$ 85.395) for FGB-type plans.
XVII. Provisions, contingent assets and contingent liabilities
The Company and its subsidiaries are parties to lawsuits and administrative proceedings of a tax, labor and civil nature, arising from the normal course of their activities.
Provisions include legal obligations, lawsuits and administrative proceedings relating to tax and social security obligations, whose validity or constitutionality can be challenged and which, regardless of the assessment about the likelihood of loss, amounts are fully recognized in the financial statements. Provisions are revalued at each balance sheet date to reflect the current best estimate and may be fully or partially reversed or reduced when the outflows of resources and obligations relevant to the process are no longer probable, including decay of legal deadlines,res judicata of processes, among others.
Provisions for judicial and administrative contingencies are recorded when the risk of loss of a legal or administrative action is assessed as probable and the amounts involved are measurable with sufficient confidence, based on the nature, complexity, history of the actions and the opinion of the legal advisors, and on the basis of the best available information. For contingencies for which a risk of loss is possible, provisions are not recorded and the information is disclosed in the notes to the financial statements (Note 24.c.4 of our Financial Statements) and for the contingencies for which the risk of loss is remote, no disclosure is required. In the case of irreversible judgments favorable to the Company, the counterparty has the right, in the event of specific legal requirements, to file an action for relief from judgment within a period determined by legislation in force. Actions for relief from judgment are considered new actions and will be evaluated for contingent liability purposes if and when they are filed.
Contingent assets are not accounted for, except when there are collaterals or favorable final and unappealable legal decisions, which characterize the gain as virtually certain. Contingent assets with a probable favorable outcome, if any, are only disclosed in the financial statements.
70
XVIII. Other obligations
Other obligations include the balance of all provisioned and deferred income, excluding accrued interest, and the value of any other obligations not included in other categories.
XIX. Share-based compensation
The Company offers long-term compensation plans with acquisition conditions. The main acquisition conditions are: (1) Conditions of service, provided that the participant remains employed during the term of the Plan to acquire conditions to exercise his/her rights; (2) performance conditions, the number of Units exercisable by participants is determined by the Company’s performance in terms of: Total Shareholder Return (TSR) and can be reduced, if the goals of the reduction of Return on Risk-adjusted Capital (RORAC) are not attained, comparison between realized and budgeted at each year, as set by the Board of Directors and (3) market conditions since some parameters are contingent on the market price of the Company’s shares. The Company measures the fair value of the services provided by reference to the fair value of equity instruments granted on grant date, taking into account market conditions for each plan when the fair value is estimated.
Settlement through shares
The Company measures the fair value of the services provided by reference to the fair value of equity instruments granted on grant date, taking into account market conditions for each plan when the fair value is estimated. In order to recognize personnel expenses as a balancing item to capital reserves during the effective period, as services are received, the Company considers the treatment of service conditions and recognizes the amount for the services received during the effective period based on the best assessment of the estimate for the number of equity instruments that it is expected to grant.
Settlement in cash
For share-based payments settled in cash (in the form of share appreciation), the Company measures the fair value of the services rendered and the corresponding liability incurred based on the appreciation of the shares on the grant date and until the liability is settled. The Company reassesses the fair value of the liability at the end of each reporting period and the date of its settlement, with any changes in the fair value recognized in the income statement for the period. In order to recognize personnel expenses as a balancing item to provisions in “other liabilities” during the validity period, reflecting in the period how services are received, the Company determined total liabilities based on the best estimate of the number of appreciation rights of the shares acquired at the end of the validity period and recognizes the amount of services received during the validity periods based on the best estimate available. On a periodic basis, the Company analyzes such estimate of the number of share appreciation rights to be acquired at the end of the grace period.
XX. Recognition of income and expenses
The most significant criteria adopted by the Company to recognized its income and expenses are summarized below:
71
i. Interest income and expenses and similar
Interest income and expenses and similar are generally recognized on an accrual basis, using the effective interest method. Dividends received from other companies are recognized as revenue when the right to receive them arises for consolidated entities.
ii. Commissions, fees and similar items
Income and expenses from fees and commissions are recognized in the consolidated income statement using criteria that vary according to their nature (note 36 of our Financial Statements). The main criteria are:
· Income and expenses from fees and commissions, relating to financial assets and liabilities measured at fair value through profit or loss, are recognized when paid;
· Those resulting from transactions or services performed over a period of time are recognized throughout the life of such transactions or services; and
· Those relating to services provided through one single action are recognized upon the performance of any such action.
iii. Non-financial income and expenses
Recognized for accounting purposes on an accrual basis.
iv. Deferred collections and payments
Recognized for accounting purposes at the amount resulting from the discount of expected cash flows at market rates.
v. Contractual loan rates
Contractual loan rates, particularly in loan requests and granting rates, are accrued and recognized over the loan term. Regarding loan granting rates, the portion relating to direct related costs incurred under the loan agreement is immediately recognized in the consolidated income statement.
XXI. Collaterals
i. Financial Guarantees
Financial guarantees are defined as agreements whereby an entity undertakes to make specific payments on behalf of a third party, if the third party fails to do so, regardless of the various legal forms that they might have, such as collaterals, irrevocable documentary credits issued or confirmed by the entity, etc.
The Company initially recognizes financial guarantee commissions as liabilities in the consolidated balance sheet at fair value, which is generally the present value of fees, commissions or interest receivable from these contracts over its term.
Financial guarantees, regardless of the guarantor, instrument or other circumstances, are reviewed periodically to determine the credit risk to which they are exposed and, if applicable, to consider whether a provision is necessary. The credit risk is determined by applying criteria similar to those established for quantifying impairment losses on debt instruments measured at amortized cost.
72
Provisions recognized for these transactions are recognized in line item “Provisions – Provisions for contingent liabilities, obligations and other provisions” in the consolidated balance sheet (note 24 of our Financial Statements).
If a specific provision is necessary for financial guarantees, the related unrecognized commissions in line item “Financial liabilities at amortized cost – Other financial liabilities” in the consolidated balance sheet are reclassified to the adequate provision.
ii. Guarantees and credit risk mitigation policy
The Company's practice is to control credit risk through the use of guarantees in its operations. Each business unit is responsible for managing credit risk and formalizes the use of guarantees in its credit policies.
The Company uses guarantees with the purpose of increasing its recoverability in operations subject to credit risk. The guarantees used may be fiduciary, real, legal structures with mitigating power and compensation agreements. The Company periodically reviews its guarantee policy, through technical and normative parameters and also its historical basis, to determine if the guarantee is legally exercisable and feasible.
Credit limits are continuously monitored and changed based on customer behavior. Thus, the potential loss amounts represent a fraction of the available amount.
XXII. Assets under management and investment and pension funds managed by the Company
Third-party assets managed by the consolidated entities are not presented in the body of the consolidated balance sheet. The management fees are included under the heading "Fee and commission income" in the consolidated statement of income. Note 45-b of our Financial Statements contains information on the third-party assets managed by the Company.
Investment funds and pension funds managed by the consolidated entities are not recorded in the consolidated balance sheet, since the respective assets are owned by third parties. Fees and commissions earned during the fiscal year for services rendered by the Company's entities to these funds (asset management and custody services) are recognized under the heading "Fee and commission income" in the consolidated statement of income.
XXIII. Post-employment benefits
Post-employment benefit plans comprise undertakings assumed by the Company of: (i) benefits additional to those under the public pension system; and (ii) health care, in cases of retirement, permanent disability or death for eligible employees and their direct beneficiaries.
Defined contribution plans
A defined contribution plan is the post-employment benefit plan based on which the Company and its subsidiaries, as the sponsoring entity, pay fixed contributions to a pension fund, with no legal or constructive obligation of paying additional contributions if the fund does not have sufficient assets to honor all benefits relating to the services provided in the current and prior periods.
73
Contributions made in this sense are recognized as “Expenses with Interest and similar” in the consolidated income statement.
Defined benefit plans
Defined benefit plan is a post-employment benefit plan that is not a defined contribution plan, and is presented in note 23 of our Financial Statements. For this type of plan, the obligation of the sponsoring entity is to provide the benefits agreed with the employees, assuming the actuarial risk that the benefits will cost more than expected.
For defined benefit plans, the latest version of IAS 19 established fundamental changes in the accounting and disclosure of post-employment benefits such as the removal of the corridor mechanism from the registration of plan obligations, as well as changes in the criteria for recognition of remunerative interest of plan assets (valorization based on the discount rate of the actuarial obligation).
In addition, there is full recognition of liabilities when unrecognized actuarial losses (actuarial deficits) occur as a counter entry to the shareholders' equity account ("Other Comprehensive Income").
Main Definitions
The present value of the defined benefit obligation is the present value without deduction of any plan assets from the expected future payments required to settle the obligation resulting from the employee's service in current and past periods.
Deficit or surplus is: (a) the present value of the obligation of defined benefit; less (b) fair value of the plan assets
The sponsoring entity may recognize the plan assets in the balance sheet when they meet the following characteristics: (i) the assets of the fund are sufficient to meet all employee benefit obligations of the plan or the sponsoring entity; or (ii) the assets are returned to the sponsoring entity in order to reimburse it for benefits already paid to employees.
Actuarial losses and earnings are changes in the present value of the defined benefit obligation resulting from: (a) adjustments by experience (effects of the differences between actuarial assumptions adopted and what actually occurred); and (b) effects of changes in actuarial assumptions.
Cost of current service is the increase in the present value of the defined benefit obligation resulting from the service provided by the employee in the current period.
The past service cost is the change in the present value of the defined benefit obligation for service provided by employees in previous periods, resulting from a change in plan or a reduction in the number of employees covered.
Post-employment Benefits are recognized in the statement of income in the lines of Expenses with Interest and similar and provisions (net).
74
The defined benefit plans are accounted for based on actuarial study performed annually by an outside consulting company, at the end of each year effective for the subsequent period.
XXIV. Other long-term benefits to employees
Other long-term benefits to employees defined as obligations to early retirement beneficiaries - considered as those who no longer provide services to an entity, but who, without being legally retired, continue to have economic rights with respect to the entity until they acquire the legal status of retirees – bonuses for length of service, obligations for spousal death or disability before retirement, that rely on the employee’s length of service in the entity, and other similar items, are treated for accounting purposes, as the case may be, as previously set forth for defined benefit post-employment plans, except that all costs of past services and actuarial gains and losses are immediately recognized.
XXV. Severance benefits
Severance benefits are recognized when there is a formal detailed plan identifying the basic changes to be made, provided that the plan implementation has begun, its main characteristics have been publicly announced or objective facts relating to its implementation have been disclosed.
(a) Corporate Income Tax (IRPJ) and Social Contribution Tax (CSLL)
The IRPJ charge is calculated at the rate of 15%, plus the additional 10%, applied to the profit, after effecting the adjustments determined by tax legislation. CSLL is calculated at the rate of 20% for financial institutions (15% until August 2015) and 9% for other companies, on profit, after considering the adjustments determined by tax legislation. The CSLL rate for financial institutions, private insurance corporations and capitalization companies was raised from 15% to 20% for the base period from September 1, 2015 to December 31, 2018, pursuant to Law 13.169/2015 (a result of the conversion of Provisional Measure 675/2015 into law).
Income tax expenses are recognized in the consolidated income statement, except when they result from a transaction directly recognized in equity and, in any such case, the tax effect is also recognized in equity.
Current income tax expenses are calculated as the sum of current income tax resulting from the application of the proper tax rate to the taxable income for the year (less any deductions permitted for tax purposes) and changes in deferred tax assets and liabilities recognized in the consolidated income statement.
Tax credits classified as “Current” are tax values to be recovered in the next 12 months.
Tax liabilities include the amount of all tax liabilities (except for provisions for taxes), classified as “Current” – amount payable with respect to the income tax on taxable income for the year and other taxes within the next twelve (12) months.
Deferred tax assets and liabilities include temporary differences identified as the amounts expected to be paid or recovered on differences between the carrying amounts of assets and liabilities and their related taxbases, and accumulated tax credits and losses. These amounts are measured at the rates expected to be applied in the period in which the asset is realized or the liability is settled.
75
Deferred tax assets are only recognized for temporary differences to the extent that it is probable that consolidated entities will have sufficient future taxable income against which deferred taxes assets can be utilized, and deferred tax assets do not result from initial recognition (except in a business combination) of other assets and liabilities in a transaction that does not affect taxable income or book profit. Other deferred tax assets (accumulated tax credits and losses) are only recognized if it is probable that consolidated entities will have sufficient taxable income against which they can be utilized.
Due to the change in the CSLL rate, the group companies re-measured their deferred tax credits and liabilities at the rates applicable to the period in which the asset is realized and the liability is settled.
Income and expenses directly recognized in equity are accounted for as temporary differences.
Deferred tax assets and liabilities are revalued on the balance sheet date to determine if they still exist, by making the proper adjustments based on the analyses performed.
The expectation of realization of the Company's tax credits is based on projections of future results and based on a technical study, as shown in note 25 of our Financial Statements.
Taxes on revenues (PIS and COFINS) are calculated at a combined tax rate of 4.65% on certain gross income and expenses. Financial institutions can deduct certain finance costs in the determination of PIS and COFINS tax bases. PIS and COFINS are considered as profit components (net of certain revenues and expenses); Therefore, and in accordance with IAS 12, they are accounted for as income taxes
(b) Consolidated Statement of Cash Flows
The following terms are used in the consolidated statement of cash flows with the following meanings:
· Cash Flows: Cash inflows and outflows and cash equivalents, which are highly liquid financial investments subject to an insignificant risk of changes in value and usually with a maturity of about three months or less from the date of original acquisition.
· Operating Activities: The main revenue generating activities of financial institutions and other activities that are not financing or investment activities.
· Investment Activities: The acquisition and sale of long-term assets and other investments not included in cash and cash equivalents.
· Financing activities: Activities that result in changes in the amount and composition of shareholders' equity and liabilities that are not operating activities.
In preparing the consolidated statement of cash flows, highly liquid financial investments with insignificant risk of changes in their values were classified as "Cash and cash equivalents". The Company classifies as cash and cash equivalents the balances recorded under the item "Cash and cash equivalents and reserves at the Central Bank" and "Loans and other amountswith credit institutions" in the consolidated balance sheet, except for restricted use resources and long-term operations.
76
Interest paid and received basically corresponds to the Company's operating activities.
The Company's Management decided to include the item "Exchange Variation on Cash and Cash Equivalents" and the respective impacts on the net cash flow from operating activities, consequently the Consolidated Statements of Cash Flows were reclassified for the year ended December 31 2014, with the objective of better presentation of this accounting report. From 2015, the Company’s management considered such reclassifications to be immaterial.
10.6 Officers description of relevant items not evinced in the financial statements of the Company:
a. the assets and liabilities held by the issuer, directly or indirectly, which are not shown in its balance sheet (off-balance sheet items), such as:
i. commercial operating leases, assets and liabilities
On December 31, 2017, the Company leased properties, which are mainly used as branches, based on a standard agreement, which may be cancelled at its discretion and includes a renewal option and adjustment clauses, classified under the concept of commercial operating lease. The total minimum future payments due on non-cancellable commercial operating leases on December 31, 2017 is of R$ 2,458 million, of which R$ 624 million in up to one (1) year, R$ 1,545 million between 1 to 5 years and R$ 288 million in more than 5 years. Additionally, the Company has open-ended agreements amounting to R$ 934,00 corresponding to the monthly rent of the agreements with such characteristic. An amount of R$ 656 million was recorded as expenses during the fiscal year 2017, in respect of commercial operating lease payments.
Lease agreements are adjusted annually according to the current legislation, with the highest percentage being calculated according to variation in the General Market Price Index (IGPM). Lessee is assured of the right to unilateral termination of these agreements at any time, as provided for in the contract clauses and in the current legislation.
ii. written-off receivables portfolios in relation to which the entity is exposed to risks and responsibilities, indicating the respective liabilities
Not applicable, since there are no such assets off balance sheet.
iii. agreements for future purchase and sale of products or services
Not applicable, since there are no such assets off balance sheet.
iv. unfinished construction contracts
Not applicable, since there are no such assets off balance sheet.
v. agreements for future receivables from loans
Not applicable, since there are no such assets off balance sheet.
77
b. other items not evidenced in the financial statements
The Company grants a series of guarantees for its clients to have a better credit position and to enable them to be competitive. As required, the “maximum potential amount of future payments” represents the notional amounts that could be lost in the event of a total default by the guaranteed parties, without considering possible recoveries from suretyships held or pledged, or recoveries under recourse provisions.
There is no relationship between these amounts and probable losses on these guarantees.
In fact, “maximum potential amount of future payments” significantly exceeds inherent losses.
The table below presents all the guarantees as of December 31, 2017, 2016 and 2015.
(In millions ofReais) | 2017 | 2016 | 2015 |
Maximum potential amount of future payments | |||
| |||
Contingent liabilities | |||
Guarantees and other suretyships | 40.730 | 32.630 | 42.836 |
Financial guarantees | 37.007 | 24.476 | 41.183 |
Performance guarantees | 486 | 532 | 521 |
Financial letters of credit | 3.111 | 7.463 | 875 |
Others | 125 | 159 | 257 |
Other contingent exposures | 1.915 | 635 | 774 |
Documentary credits | 1.915 | 635 | 774 |
Total contingent liabilities | 42.645 | 33.265 | 43.611 |
The investment funds under management of the Company, which are not recorded in the Company’s balance sheet are detailed below:
(In millions ofReais) | 2017 | 2016 | 2015 |
Managed funds | 1.748 | 1,534 | 2,542 |
Total | 1.748 | 1,534 | 2,542 |
Lastly, the Company is the custodian of debt instruments and securities of third parties in the total amount of R$ 40,459 million in 2017, R$ 27,773 million in 2016 and R$ 38,412 million in 2015.
78
10.7 Comments on items not evinced in the financial statements:
a. how do such items alter or may alter the revenues, expenses, operational result, financial expenses or other items of the financial statements of the Company.
There are no additional effects to be evidenced, except for those presented in Section 10.6 of this document.
b. nature and the purpose of the operation
There are no additional effects to be evidenced, except for those presented in Section 10.6 of this document
c. the nature and amount of obligations assumed and the rights generated in favor of the Company by virtue of the operation.
There are no additional effects to be evidenced, except for those presented in Section 10.6 of this document.
10.8 Officers’ comments and indications of main aspects of the Company’s business plan, exploiting specifically the following items
a. investments, including:
i. quantitative and qualitative description of current and expected investments
The main capital expenditures of the Company consist of investments in information technology. The Company's information technology platform focuses on its customers and supports the Company's business model. In 2017, 2016 and 2015, total investments in information technology totalized R$ 1.132 million, R$ 895 million, and R$ 858 million, respectively.
In 2017, 2016 and 2015, the Company continued to improve the technology platform through investments in infrastructure systems and hardware upgrades. In the last 18 months, we have implemented more than 80 new technologies and processes in several areas such as cyber security, CRM (Customer Relationship Management), Big Data transformation, increased automation in systems development and implementation cycles, intelligence platforms and use of cloud solutions.
ii. sources of investment financing
The sources of financing of the investments referred to above is mainly the cash flow from operating activities. The investments in progress consist mainly of investments in technology.
iii. material current divestitures and expected divestitures
The main divestments in the last three fiscal years were the sale of BW I in 2017 and the sale, in August 2015, of the Company's custody business, upon the the sale of the entire shares of Santander Securities Services Brasil DTVM S.A to Santander Securities Services Brasil Participações S.A.
79
b. so long as it has already been disclosed, to indicate the acquisition of plants, equipment, patents, or other assets that are expected to materially affect the Company's production capacity
On January 4, 2016, Aymoré CFI notified the sellers of its decision to exercise the option to purchase 50% of the remaining shares of Super owned by the sellers for approximately R$ 112 million. The transaction was closed on March 10, 2016.
On July 5, 2017, Atual Securitizadora, a wholly-owned subsidiary of the Company, entered into a purchase and sale agreement to acquire a corporate interest equivalent to 70% of the quotas representing Ipanema Empreendimentos e Participações Ltda., Gestora de Investimentos Ipanema Ltda. and the Fundo Investimento Ipanema NPLV. On September 19, 2017, the Central Bank authorized the acquisition and, after fulfilling the other conditions precedent, the parties concluded the transaction on October 16, 2017.
On December 20, 2017, we entered into binding agreements with HDI Seguros S.A. (“HDI Seguros”) for the formation of a partnership through the creation of a new insurance company called Santander Auto S.A. (“Santander Auto”). Sancap Investimentos e Participações S.A., a company controlled by Santander Brasil, will hold 50% of the issued share capital of Santander Auto with the remaining 50% being held by HDI Seguros. Santander Auto will focus on offering motor insurance policies through a 100% digital platform. The closing of the transaction is subject to the fulfillment of certain customary contractual conditions, including obtaining the applicable regulatory approvals. On March 2, 2018 the CADE approval has been granted.
On February 19, 2018 and February 28, 2018, Santander Brasil concluded the acquisition of the totality of shares of Isban Brasil S.A. and Produban Serviços de Informática S.A. (“Technology Companies”), indirectly controlled by Santander Spain, for a price of approximately R$ 61 million and R$ 43 million, respectively.
The Technology Companies are the main providers of technical support and maintenance services related to software and hardware of Santander Brasil. The transaction shall permit Santander Brasil to directly control local technology services and, upon that, to increase proximity with its business, adoption of time-to-market solutions, flexibility, quality and efficiency, aligned with the operational excellence model.
c. new products and services, indicating:
i. description of ongoing research already disclosed
Not applicable
ii. total amounts spent by the Company on research for development of new products or services
Not applicable
iii. ongoing projects already disclosed
Not applicable
iv. total amounts spent by the Company on development of new products or services
Not applicable, since the amounts spent on the development of new products or services are considered in item 10.8.a (i) above.
80
10.9 Comments of the Officers regarding other factors that highly influenced the operational performance and that were not indentified ou commented in the other items of this section
The balance of amounts spent with other administrative expenses for 2017 was of R$ 7,183,317,000,00, of which R$ 617,563,000,00 are attributed as expenses with publicity.
The breakdown of balance of other administrative expenses for the years 2017, 2016 and 2015 is as follows:
A composição do saldo deste item é a seguinte: |
|
|
|
| ||||
|
|
|
|
|
|
|
|
|
Em milhares de Reais |
|
|
| 2017 | 2016 | 2015 | ||
|
|
|
|
|
|
|
|
|
Imóveis, instalações e materiais |
|
| 1,284,490.00 | 1,278,556.00 | 1,268,498.00 | |||
Tecnologia e sistemas |
|
|
| 1,364,720.00 | 1,246,809.00 | 1,192,533.00 | ||
Publicidade |
|
|
|
| 617,563.00 | 486,772.00 | 523,343.00 | |
Comunicações |
|
|
|
| 593,272.00 | 488,799.00 | 481,217.00 | |
Ajudas de custo e despesas de viagem |
|
| 106,956.00 | 133,123.00 | 160,135.00 | |||
Tributos exceto imposto de renda |
|
| 122,570.00 | 84,932.00 | 128,002.00 | |||
Serviços de vigilância e transporte de valores |
| 630,466.00 | 622,362.00 | 614,596.00 | ||||
Prêmio de seguros |
|
|
|
| 27,289.00 | 21,908.00 | 20,975.00 | |
Serviços técnicos especializados |
|
| 1,901,056.00 | 1,744,726.00 | 1,820,657.00 | |||
| Relatórios técnicos |
|
|
| 370,546.00 | 437,683.00 | 406,755.00 | |
| Outros serviços técnicos e especializados |
| 1,530,510.00 | 1,307,043.00 | 1,413,902.00 | |||
Outras despesas administrativas |
|
| 534,935.00 | 435,758.00 | 506,364.00 | |||
Total |
|
|
|
|
| 7,183,317.00 | 6,543,145.00 | 6,716,340.00 |
There is no other information pertaining to this topic and deemed relevant by the Company which has not been described in other items of this Section 10.
__________________________________________________
81
EXHIBIT II
BOARD PROPOSAL FOR ALLOCATION OF NET PROFIT FOR THE FISCAL YEAR
(Pursuant to item II of the sole paragraph of article 9, Annex 9-1-II to CVM Instruction 481)
1. Inform the net profit for the fiscal year
The net profit for the fiscal year 2017 was R$7,995,872 thousand in the individual financial statements, and R$7,996,577thousand in the consolidated statement.
The calculation of net profit and reserve allocations, as well as the values available for distribution of dividends and interest on net equity are performed on the basis of the individual financial statements of the Company prepared in accordance with Accounting Practices Adopted in Brazil, and this may differ from the consolidated net profit, mainly due to the unrealized results recorded between consolidated companies.
2. Inform the overall amount and the value per share of dividends, including anticipated dividends and interest on net equity that has already been declared
At each shareholder ordinary general meeting, the Board of Directors shall make a recommendation on the allocation of the net profit of the previous fiscal year, which will be the object of decision.
In 2017, the Board of Directors has approved the payment of interest on net equity to our shareholders in the amount of R$ 3,800 million, and dividends in the amount of R$ 2,500 million, ad referendum of the ordinary general meeting. These values were paid in May 26, August 25, October 26, 2017 and February 26, 2018, as shown in the table below in summarized form:
FY 2017 | Highlight date | Gross Amount (in thousand BRL) | Gross Value per share (in BRL) | Net Value per share (in BRL) | Payment Date | ||||
ON | PN | Unit | ON | PN | Unit | ||||
Interest on already declare own capital | 4/25/17 | 500,000 | 63.37800118 | 69.71580130 | 133.09380248 | 53.87130100 | 59.25843111 | 113.12973211 | 5/26/17 |
Interest on already declare own capital | 7/25/17 | 500,000 | 63.52799946 | 69.88079941 | 133.40879887 | 53.99879954 | 59.39867950 | 113.39747904 | 8/25/17 |
Interest on already declare own capital | 9/29/17 | 500,000 | 63.59174383 | 69.95091821 | 133.54266204 | 54.05298226 | 59.45828048 | 113.51126274 | 10/26/17 |
Interest on already declare own capital | 12/28/17 | 2,300,000 | 292.83542142 | 322.11896356 | 614.95438498 | 248.91010821 | 273.80111902 | 522.71122723 | 2/26/18 |
Intercalary Dividends | 12/28/17 | 2,500,000 | 292.83542142 | 322.11896356 | 614.95438498 | 292.83542142 | 322.11896356 | 614.95438498 | 2/26/18 |
|
|
|
|
|
|
|
|
|
|
| Total | 6,300,000 | 776.16858731 | 853.78544604 | 1629.95403335 | 703.6686124 | 774.0354737 | 1477.70408609 |
|
3. Inform the net profit percent for the distributed fiscal year
In the fiscal year 2017, 82.94% of the Company’s net profit was distributed, after allocation to the legal reserve, according to individual financial statement, drawn up in accordance with the Accounting Practices Adopted in Brazil, configured by the Corporations Law, associated to the CMN, Central Bank and CVM standards as demonstrated below.
82
Description | 2017 | 2016 | 2015 |
Net Profit | 7,995,872 | 5,521,636 | 6,982,898 |
(-) Legal Reserve | 399,794 | 276,082 | 349,235 |
(=) Net Profit Adjusted for the purpose of Dividends (i) | 7,596,078 | 5,245,555 | 6,633,663 |
Mandatory Minimum Dividend (25%) | 1,899,020 | 1,311,389 | 1,658,416 |
Interest on Own Capital (JCP) | 3,800,000 | 3,850,000 | 1,400,000 |
Prepaid Dividends | 2,500,000 | 700,000 | 1,750,000 |
Total (JCP + Dividends) (ii) | 6,300,000 | 4,550,000 | 3,150,000 |
Dividend | 4,400,980 | 3,238,611 | 1,491,584 |
|
|
|
|
% of Distributed Profit (ii) / (i) | 82.94% | 86.74% | 47.49% |
4. Inform the overall amount and the value per share of dividends distributed on the basis of profit from previous fiscal years.
In 2017, no interim dividends were approved.
5. Inform, minus anticipated dividends and interest on net equity that has already been declared:
a. the gross dividend value and interest on net equity, in segregated form, by the action of each kind and class
In 2017, interest on net equity in the amount of R$ 3,800 million and dividends in the amount of R$ 2,500 million, as mentioned in item 2 above, were declared in advance. After deducting these amounts, there were no other declaration of dividends and/or interest on net equity referring to net profits for the year 2017.
b. the form and the deadline for payment of dividends and interest on net equity
Not applicable
c. possible incidence of update and interest on the dividends and interest on net equity
Not applicable
d. declaration date for dividend payment and interest on net equity considered for identification of shareholders who are entitled to the receipt thereof
Not applicable
6. In case of declaration of dividends or interest on net equity on the basis of profits recorded in half-yearly balance sheets or in shorter periods
a. inform the amount of dividends or interest on net equity that has already been declared
b. inform the date of the respective payments
In 2017, the Board of Directors has approved,ad referendumof the Ordinary General Meeting to be held until April 30, 2018, the Executive Board proposal related to the declaration of the following earnings:
· Interest on net Equity, pursuant to article 17, XVIII of the Company's Bylaws, in the gross amount of R$ 500,000,000.00, corresponding to R$63.3780011815 per common share, R$ 69.7158013014 per preferred share and R$ 133.0938024829 per Unit, which after deduction of the corresponding Withholding Income Tax, according to the applicable law, became the net amount equivalent to R$ 53.871301004275 per common share, R$ 59.25843110619 per preferred share, and R$ 113.129732110465 per Unit, except for tax exempt shareholders.
83
Shareholders who were registered in the Company's books at the end of May 5, 2017 were entitled to the Interest on net Equity approved at the meeting held on April 25, 2017. As of May 6, 2017 (including the same), shares of Santander Brasil were traded "ex- Interest on net Equity ". The Interest on net Equity were paid in May 26, 2017.
· Interest on net Equity, pursuant to article 17, XVIII of the Company's Bylaws, in the gross amount of R$ 500,000,000.00, corresponding to R$ 63.5279994606 per common share, R$ 69.880799406 per preferred share and R$ 133.4087988666 per Unit, which after deduction of the corresponding Withholding Income Tax, according to the applicable law, became the net amount equivalent to R$ 53.99879954151 per common share, R$ 59.3986794951 per preferred share, and R$ 113.39747903661 per Unit, except for tax exempt shareholders.
Shareholders who were registered in the Company's books at the end of August 2, 2017 were entitled to the Interest on net Equity approved at the meeting held on July 25, 2017. As of August 3, 2017 (including the same), shares of Santander Brasil were traded "ex- Interest on net Equity ". The Interest on net Equity were paid in August 25, 2017.
· Interest on net Equity, pursuant to article 17, XVIII of the Company's Bylaws, in the gross amount of R$ 500,000,000.00, corresponding to R$ 63.5917438308 per common share, R$ 69.950918213 per preferred share and R$ 133.5426620438 per Unit, which after deduction of the corresponding Withholding Income Tax, according to the applicable law, became the net amount equivalent to R$ 54.05298225618 per common share, R$ 59.45828048105 per preferred share, and R$ 113.51126273723 per Unit, except for tax exempt shareholders.
Shareholders who were registered in the Company's books at the end of October 6, 2017 were entitled to the Interest on net Equity approved at the meeting held on September 29, 2017. As of October 7, 2017 (including the same), shares of Santander Brasil were traded "ex- Interest on net Equity ". The Interest on net Equity were paid in October 26, 2017.
· Interest on net Equity, pursuant to article 17, XVIII of the Company's Bylaws, in the gross amount of R$ 2,300,000,000.00, corresponding to R$ 292.8354214183 per common share, R$ 322.1189635577 per preferred share and R$ 614.954384976 per Unit, which after deduction of the corresponding Withholding Income Tax, according to the applicable law, became the net amount equivalent to R$ 248.910108205555 per common share, R$ 273.801119024045 per preferred share, and R$ 522.7112272296 per Unit, except for tax exempt shareholders.
84
Interim Dividends, in the amount of R$ 2,500,000,000.00, pursuant to Article 37, item I, of the Company's Bylaws, based on profits registered in a balance sheet specifically prepared for this purpose, on November 30, 2017, equivalent to R$ 292,8354214183 per common share, R$ 322,1189635577 per preferred share, sand R$ 614,954384976.
Shareholders who were registered in the Company's books at the end of January 5, 2018 were entitled to the Interest on net Equity approved at the meeting held on December 28, 2017. As of January 6, 2018 (including the same), shares of Santander Brasil were traded "ex- Interest on net Equity ". The Interest on net Equity were paid in February 26, 2018.
Below is a summary of dividends and interest on net equity anticipated in 2017:
FY 2017 | Highlight date | Gross Amount (in thousand BRL) | Gross Value per share (in BRL) | Net Value per share (in BRL) | Payment Date | ||||
ON | PN | Unit | ON | PN | Unit | ||||
Interest on already declare own capital | 4/25/17 | 500,000 | 63.37800118 | 69.71580130 | 133.09380248 | 53.87130100 | 59.25843111 | 113.12973211 | 5/26/17 |
Interest on already declare own capital | 7/25/17 | 500,000 | 63.52799946 | 69.88079941 | 133.40879887 | 53.99879954 | 59.39867950 | 113.39747904 | 8/25/17 |
Interest on already declare own capital | 9/29/17 | 500,000 | 63.59174383 | 69.95091821 | 133.54266204 | 54.05298226 | 59.45828048 | 113.51126274 | 10/26/17 |
Interest on already declare own capital | 12/28/17 | 2,300,000 | 292.83542142 | 322.11896356 | 614.95438498 | 248.91010821 | 273.80111902 | 522.71122723 | 2/26/18 |
Intercalary Dividends | 12/28/17 | 2,500,000 | 292.83542142 | 322.11896356 | 614.95438498 | 292.83542142 | 322.11896356 | 614.95438498 | 2/26/18 |
|
|
|
|
|
|
|
|
|
|
| Total | 6,300,000 | 776.16858731 | 853.78544604 | 1629.95403335 | 703.6686124 | 774.0354737 | 1477.70408609 |
|
7. Provide comparative table indicating the following values per share of each type and class
a. net profit for the fiscal year and the 3 (three) previous fiscal years
The net profit for the last three (3) fiscal years is shown below as the Company's individual financial statement, drawn up in accordance with the Accounting Practices Adopted in Brazil, configured by the Corporations Law, associated to the CMN, Banco Central and CVM standards:
Description | 2017 | 2016 | 2015 |
Net Profit (in thousand R$ ) | 7,995,872 | 5,521,636 | 6,982,898 |
|
|
|
|
Profit per Share (in R$ ) |
|
|
|
Common Share | 1.06633 | 0.73008 | 0.92329 |
Preferred Share | 1.06633 | 0.73008 | 0.92329 |
|
|
|
|
Common Shares (in thousands) | 3,818,695 | 3,850,971 | 3,850,971 |
Preferred Shares (in thousands) | 3,679,836 | 3,712,112 | 3,712,112 |
b. dividend and interest on net equity distributed in three (3) previous fiscal years
85
FY 2017 | Highlight date | Gross Amount (in | Gross Value per share (in BRL) | Net Value per share (in BRL) | Payment Date | ||||
|
| thousand BRL) | ON | PN | Unit | ON | PN | Unit |
|
Interest on already declare own capital | 4/25/17 | 500,000 | 63.37800118 | 69.71580130 | 133.09380248 | 53.87130100 | 59.25843111 | 113.12973211 | 5/26/17 |
Interest on already declare own capital | 7/25/17 | 500,000 | 63.52799946 | 69.88079941 | 133.40879887 | 53.99879954 | 59.39867950 | 113.39747904 | 8/25/17 |
Interest on already declare own capital | 9/29/17 | 500,000 | 63.59174383 | 69.95091821 | 133.54266204 | 54.05298226 | 59.45828048 | 113.51126274 | 10/26/17 |
Interest on already declare own capital | 12/28/17 | 2,300,000 | 292.83542142 | 322.11896356 | 614.95438498 | 248.91010821 | 273.80111902 | 522.71122723 | 2/26/18 |
Intercalary Dividends | 12/28/17 | 2,500,000 | 292.83542142 | 322.11896356 | 614.95438498 | 292.83542142 | 322.11896356 | 614.95438498 | 2/26/18 |
|
|
|
|
|
|
|
|
|
|
| Total | 6,300,000 | 776.16858731 | 853.78544604 | 1629.95403335 | 703.66861243 | 774.03547366 | 1477.70408609 |
|
|
|
|
|
|
|
|
|
|
|
FY 2016 | Highlight date | Gross Amount (in | Gross Value per share (in BRL) | Net Value per share (in BRL) | Payment Date | ||||
|
| thousand BRL) | ON | PN | Unit | ON | PN | Unit |
|
Intercalary Dividends | 12/29/16 | 700,000 | 0.08883087 | 0.09771396 | 0.18654483 | 0.08883087 | 0.09771396 | 0.18654483 | 2/23/17 |
Interest on already declare own capital | 6/29/16 | 500,000 | 0.06342899 | 0.06977189 | 0.13320087 | 0.05391464 | 0.05930610 | 0.11322074 | 8/26/16 |
Interest on already declare own capital | 12/29/16 | 3,350,000 | 0.42511918 | 0.46763110 | 0.89275028 | 0.36135130 | 0.39748643 | 0.75883774 | 2/23/17 |
|
|
|
|
|
|
|
|
|
|
| Total | 4,550,000 | 0.57737904 | 0.63511695 | 1.21249599 | 0.50409682 | 0.55450650 | 1.05860331 |
|
|
|
|
|
|
|
|
|
|
|
FY 2015 | Highlight date | Gross Amount (in | Gross Value per share (in BRL) | Net Value per share (in BRL) | Payment Date | ||||
|
| thousand BRL) | ON | PN | Unit | ON | PN | Unit |
|
Intercalary Dividends | 3/27/15 | 150,000 | 0.01894737 | 0.02084210 | 0.03978947 | 0.01894737 | 0.02084210 | 0.03978947 | 8/28/15 |
Intercalary Dividends | 12/30/15 | 1,600,000 | 0.20274115 | 0.22301527 | 0.42575642 | 0.20274115 | 0.22301527 | 0.42575642 | 2/25/16 |
Interest on already declare own capital | 12/30/15 | 1,400,000 | 0.17739851 | 0.19513836 | 0.37253687 | 0.15078873 | 0.16586761 | 0.31665634 | 2/25/16 |
|
|
|
|
|
|
|
|
|
|
| Total | 3,150,000 | 0.39908703 | 0.43899573 | 0.83808276 | 0.37247725 | 0.40972498 | 0.78220223 |
|
8. In case there is allocation of profits to legal reserve
a. identify the amount intended for the legal reserve
Of the net profit for the fiscal year 2017, which totaled the amount of R$ 7,995,872 thousand, the value of R$ 399,794 thousand, equivalent to 5% of the net profits, was allocated in the legal reserve.
b. detail the legal reserve calculation method
Pursuant to Article 193 of the Corporations Law, there is an obligation to constitute the legal reserve to which 5% of the net profits of each fiscal year must be allocated, until the total amount of the reserve reaches 20% of the share capital. However, the allocation of resources in the legal reserve may not occur in any fiscal year in which the legal reserve, whenever it is added to other created capital reserve, is over 30% of the company’s share capital. Future net losses may be deducted from the legal reserve.
9. If the company has preferred shares entitled to fixed or minimum dividends
a. describe the calculation method for the fixed or minimum dividends
The Company does not have preferred shares entitled to fixed or minimum dividends. The Company’s preferred shares shall ensure their holders, among other rights, priority in the dividends distribution, as well as dividends in an amount 10% higher than those given to ordinary shares.
b. inform whether the profit for the fiscal year is sufficient for the full payment of fixed or minimum dividends
Not applicable.
c. identify whether any unpaid installment is cumulative
Not applicable.
d. identify the global value of fixed or minimum dividends to be paid to each class of preferred shares
Not applicable.
e. identify the fixed or minimum dividends to be paid per preferred share of each class
86
Not applicable.
10. In relation to the mandatory dividend
a. describe the calculation method provided for in the Bylaws
The Company's Bylaws provides that an amount corresponding to not less than 25% of the net profits, deducted from allocations for legal and contingency reserves, must be available for distribution as dividends or interest on net equity in every fiscal year. This amount represents the mandatory dividends. The calculation of net profit and allocations for reservations, as well as the values available for distribution, are performed with basis on our financial statements prepared in accordance with the Accounting Practices Adopted in Brazil.
b. inform whether it is being paid in full
In the fiscal year 2017 the mandatory dividend was fully paid as shown in the worksheet below:
Description | 2017 | 2016 | 2015 |
Net Profit | 7,995,872 | 5,521,636 | 6,982,898 |
(-) Legal Reserve | 399,794 | 276,082 | 349,235 |
(=) Net Profit Adjusted for the purpose of Dividends (i) | 7,596,078 | 5,245,555 | 6,633,663 |
Mandatory Minimum Dividend (25%) | 1,899,020 | 1,311,389 | 1,658,416 |
Interest on Own Capital (JCP) | 3,800,000 | 3,850,000 | 1,400,000 |
Prepaid Dividends | 2,500,000 | 700,000 | 1,750,000 |
Total (JCP + Dividends) (ii) | 6,300,000 | 4,550,000 | 3,150,000 |
Dividend | 4,400,980 | 3,238,611 | 1,491,584 |
c. inform any amount withheld
There was no minimum mandatory dividend withholding
11. In case there is mandatory dividend withholding due to the company's financial situation
a. inform the withholding amount
Not applicable.
b. describe in detail the company's financial situation, additionally addressing aspects related to liquidity analysis, working capital and positive cash flows
Not applicable.
c. justify the withholding of dividends
Not applicable.
12. In case there is an allocation of results for contingency reserve
a. identify the amount intended for the reserve
There was no allocation of results for constituting contingency reserve in the Company.
b. identify the loss deemed probable and the cause thereof
Not applicable.
87
c. explain why the loss has been deemed probable
Not applicable.
d. justify the reserve constitution
Not applicable.
13. In case there is an allocation of results for unrealized profit reserve
a. inform the amount intended for the unrealized profits reserve
There was no allocation of results for unrealized profits reserve in the Company.
b. inform the nature of unrealized profits that originated the reserve
Not applicable.
14. In case there is an allocation of results for statutory reserves
a. describe the statutory clauses that establish the reserve
The Company's Bylaws establish that, after deduction of the values intended for legal reserve and the mandatory dividends, is possible to allocate the remaining amounts from the adjusted net profit in the dividend equalization reserve, which may not exceed 50% of the Company’s share capital.
b. identify the amount intended for the reserve
In the profit allocation proposal for fiscal year 2017, after allocations to the legal reserve account, as well as dividends and interest on net equity distribution, the remaining amount of the net profits corresponding to R$ 1,296,078 thousand was allocated to the dividend equalization reserve account.
c. describe how the amount was calculated
It is the remaining profit balance for the fiscal year 2017, after allocations to the legal reserve account, to dividends and interest on net equity.
15. In case profit withholding is provided for in the capital budget
a. identify the withholding amount
There was no profit retention in the Company, in accordance with the capital budget.
b. provide copy of capital budget
Not applicable.
16. In case there is an allocation of results for tax incentives reserve
a. inform the amount intended for the reserve
There was no allocation of results for constituting tax incentives reserve in the Company.
b. explain the nature of the allocation
Not applicable.
___________________________________________________
88
EXHIBIT III
(Pursuant to item II of Article 12 to CVM Instruction 481)
ITEM 13 of Annex 24 of CVM Instruction 481– Reference Form
13. Remuneration of the Executives
13.1. Describe the Policy or Practice of Remuneration of the Board of Directors, Statutory and Non-Statutory Officers, Supervisory Board, Statutory Committees, and Audit, Risk, Finance and Remuneration Committees
A. Board of Directors
All members of the Board of Directors are entitled to a fixed compensation including monthly fees and benefits. In extraordinary and fully justified situations, the Chairman of the Board of Directors may also receive an annual variable compensation for the tasks performed, upon a resolution from the Compensation Committee and from the Board of Directors, and always within the global limit of the annual compensation approved in general meeting.
It is important to emphasize that, in case a member of the Board of Director is also a member of Company´s Auditing Committee, in terms of applicable regulation and the internal ruling of the Auditing Committee, such member shall opt for the compensation from one of the bodies. In relation to other Advisory Committees, in case one of the members or the Chairman of the Board of Directors become part of them, he/she shall be entitled to the compensation attributed to him/her as a member or Chairman of the Board and he/she shall receive an extra payment for each meeting in such Advisory Committee approved in the Compensation Committee.
B. Executive Board
The members of the Executive Board are entitled to: fixed compensation that includes monthly payments, benefits, social security and variable compensation, always within the global limit of the annual compensation approved in a general meeting.
D. Compensation Committees, Appointment, Governance and Compliance, Sustainability and Society, and Risks - Advisory Committees
In the meeting of the Board of Directors, held on May 28, 2015, the compensation of the members of the Advisory Committee was approved under a meeting that was held, but the only ones entitled to that compensation are those members not holding a position in the Executive Board.
It is important to emphasize that, in case a member of the Board of Director is also a member of Company´s Auditing Committee, in terms of applicable regulation and the internal ruling of the Auditing Committee, such member shall opt for the compensation from one of the bodies. In relation to other Advisory Committees, in case one of the members or the Chairman of the Board of Directors become part of them, he/she shall be entitled to the compensation attributed to him/her as a member or Chairman of the Board and he/she shall receive an extra payment for each meeting in such Advisory Committee approved in the Compensation Committee.
89
The members of the Advisory Committee are not entitled to any other type of compensation or benefit.
a. Goals of the compensation policy or practice, informing if the compensation policy has been formally approved, body responsible for its approval, date of approval and, if the issuer discloses the policy, locations in the worldwide computer network where the document can be consulted.
The Company has a Compensation Policy approved by the Board of Directors meeting held on March 18th, 2015.
The compensation policy of the Board of Directors aims to ensure the following assumptions:
· To ensure the interests alignments among the shareholders and the public with who the Company relates with, and
· To promote the good performance of the Company and to ensure the shareholders interests by means a long-term commitment.
The purpose of the Executive Board compensation policy/practice is to support the company´s strategy, aiming to:
· Promote the Company´s recurrent good performance and to assure the shareholders interest through the long-term compliance of the members of the Executive Board;
· To recognize the meritocracy, differentiating the individual contributions of the areas and the Company in the fulfillment of the objectives and in the execution of the strategies of the business, proposed by the Executive Board and approved by the Board of Directors; and
· To maintain the competitiveness of the compensation paid by the Company in comparison to the main competitors, with the purpose to retain the key-executives.
b. Breakdown compensation, appointing:
(i) Description of the elements of compensation and the objectives of each of them
The compensation of the Board of Directors is composed as follows:
· Fixed Compensation: The fixed compensation includes monthly fees, based on market research data prepared by a specialized external advisory firm, with a maximum global amount being annually approved in a general meeting. The fixed compensation aims to attract and retain professionals with the necessary skills and experience for the position.
· Annual variable compensation (Programa Próprio Gestão - PPG):If a variable compensation is granted to the Chairman of the Board, the calculation of this variable compensation shall take into account the individual performance, performance of the business units and the overall performance of the entity. It shall consider the payment form and the different deferral percentages, according to the variable compensation level received in the fiscal year, and according tomalusclause, with a possibility of decrease in up to 100% of the variable compensation amount under the estimated hypothesis. The objective of the variable compensation is to mobilize and recognize, through meritocracy, the organization performance.
90
· Benefits:The Company grants for the Independent Directors and for the Directors without position in Company´s Executive Board or in other company of Santander Group, benefits aligned with the dimension of the position and the market practices, including health and dental care and life insurance. For expatriated members of the Board, the organization may also offers expatriation benefits, including car, payment of rent, children´s schools and living costs. The purpose of the benefits is to attract and retain professionals with the necessary skills and experience for the job.
· Private Pension Plan: The pension plan is a tool for financial planning, aiming to ensure future supplementary income. The main pension plan offered by the Company is the SantanderPrevi which is currently the only one opened for new adhesions. Up to the present moment, the members of the Board of Directors that have not been holding executive positions are not entitled to private pension plan. The purpose of the pension plan is to attract and retain professionals with necessary skills and experience for the job.
· Share-based compensation:Up to the present moment no share-based compensation has been defined to the members that are part of this body.
The compensation of the Executive Board includes a fixed part and another one that is variable, as detailed below:
· Fixed Compensation: The fixed compensation includes a contractual salary to each executive. The salary is linked to the job position that is held and has as reference the range of the correspondent level. The individual salary includes the performance history and the seniority of the individuals holding the positions and it is aligned with the market practices, being periodically measured through salary researches performed by specialized Advisory firms. The purpose of the fixed compensation is to attract and retain professionals with the necessary skills and experience for the job.
· Benefits:They are aligned with the scope of the position held and the market practices, including Medical Healthcare, Dental Care, Life Insurance and Vehicle Insurance for transportation or a specific benefit for that purpose. The purpose of the benefits is to attract and retain professionals with the necessary skills and experience for the job.
· Private Pension Plan: The pension plan is a tool for financial planning, aiming to ensure future supplementary income. The main pension plan offered by the Company is the SantanderPrevi which is currently the only one opened for new adhesions. An executive is entitled for thePlano Gerador de Benefícios Livres (Free Benefit Generating Plan) - PGBL, promoted by Santander with Zurich Santander. The purpose of the private pension plan is to attract and retain professionals with the necessary skills and experience for the job.
· Variable Compensation:The variable compensation includes the annual Variable Income program (Schedule Self Management[Programa Próprio Gestão] - PPG) and the Long-Term Incentive Plans (ILP).
(i.1) Schedule Self Management (PPG)
The purpose of the PPG is to mobilize and recognize, through the meritocracy, the performances within the Company. This program, to which theExecutive Board members are elective, takes into account the individual performance, measured through the institutional tool of performance evaluation (Driven by Goals [Direção por Objetivos] - DPO) and includes quantitative and qualitative indicators, the performance of the business unit, measured through the DPO of the area, and reflects the goals of the area in the fiscal year and in the Company´s overall performance.
91
As from 2017, the variable income shall be calculated as follows:
 |
Key:
Quantitative Metrics
Qualitative Assessment
Bank Income
--------------------
For the fiscal year 2017, the Quantitative Metrics evaluated were the following:
| |

Key:
Subject
Customers
Employees
Company
Shareholders
Indicators
Customers´ Satisfaction
Linked Customers
Digital Customers
Engagement
Microcredit
Risks
Capital
Profitability
Ponderation
--------------------
By recommendation of the Compensation Committee, the Board of Directors shall perform a qualitative assessment of each quantitative metric, taking into account the form upon which each target was reached and other relevant and context aspects that are not directly contemplated by each indicator. This assessment my increase or decrease the result of each metric in up to 25%.
In the specific case of the members of the Executive Board, the variable income shall be affected also by the result of Santander Group.
92
The annual variable compensation for the statutory directors is paid as follows:
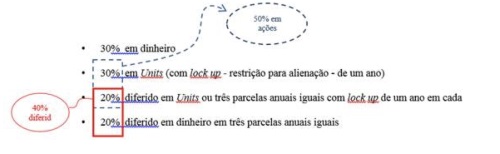
50% in shares
30% in cash
30% in Units (with lock up of one year)
40% deferred
20% deferred in Units, or three equal annual installments with one year lock-up each
20% deferred in cash, in three equal annual installments
--------------------
In case of the chief executive officer, the deferral in such program is of at least 50%, with at least 25% for each of the abovementioned items.
The deferral percentage depends on the variable compensation level received in the fiscal year (it includes the ILP for the granting year, valuated at the granting price). In case the variable compensation is between R$ 5.5 mm and R$ 8 mm, the deferral shall be 50%, being 25% of each of the deferral installment paid in cash. In case the variable compensation amount is equal or above R$ 8 mm, the deferral will be of 60%, being 30% of each installment deferral and 20% of each installment paid in cash.
As from 2015, in case of the Chief Executive Officer or in case the variable compensation is above R$ 5.5 mm, the payment of the deferral installments turns from three to five annual and equal installments, being kept the lock-up conditions.
As from the year 2017, in case of three-year deferral plan of the Executive Board and other executives chosen by the Executive Board, the payment of the last deferral installment shall be subject to the compliance of four indicators (detailed in the table below) during a period of three years. In the case of five-year deferral plan, the payment of the last three deferral installments will be subject to the compliance with the same indicators during a period of five years.
| |

Key:
Subject
Profitability
Capital
Risks
Indicators
Earnings per Share
Total Shareholder Return
Capital ratio (CET1 – Fully Loaded)
RORWA
Ponderation
--------------------
The plan is still subject to a malus clause, i.e., the Company´s Board of Directors, upon recommendation of the Compensation Committee (CR), may approve a decrease of up to 100% of the amount of each participant under the following hypothesis:
93
· Company´s weak financial performance;
· not compliance by the participant of the internal regulations, in special with those related to risks;
· material changes in the company´s financial statements, which were considered by the independent auditors, except if they arise from changes in the accounting standards. in case the board of directors understands that it is necessary, the Santander Group financial statements may also be considered in this analysis;
· material variations in the share capital or in the qualitative evaluation of Santander Brasil risks. in case the board of directors understands that it is necessary, the variations in the share capital of Santander Group may also be considered in this analysis.
(i.2) Long-Term Incentive Plans (ILP)
The purpose of the ILP is to align the interests of the Company with the interests of the participating, promoting the long-term retention of the professionals.
There are three ILPs in effect, being one of them the stock option plan, the sop 2013 and two (2) global stock option plans (ILP CRDIV).
The Stock Option Plan - Units has a term of three years and an exercise term of two years. The quantity of exercisable units by the participants was determined according to the result of the calculation of a Company´s performance parameter, the total shareholder return (RTA), and adjusted for the achievement of the RoRWA (Return On Risk Weighted Assets) - comparison between the accrual and the budgeted in each year, as determined by the Board of Directors. Additionally, it was necessary that the participant remained in the company during the plan effective term in order to acquire the condition to exercise the correspondent options.
The plan shall be settled in Units, by the difference among the closing price on the fiscal year date and the strike price already net of individual income tax (IRPF). Further, the plan is subject to a malus clause, i.e., the Company´s Board of Directors, upon recommendation from the Compensation Committee, may approve to decrease up to 100% from the amount of each participant under the hypothesis set forth.
The plan also includes an additional deferral of up to 40% (or 50% for the ChiefExecutiveOfficer) of the exercised units in three equal annual installments and with a subsequent one-year retention.
(i.3) GlobalPlans – ILP CRDIV
In 2014 a plan for delivery of shares was presented, called global long-term incentive CRDIV - grant 2014. The plan is subject to achievement of performance indicator of total shareholder return (RTA) of Santander group, in comparison to evolution of the group for this indicator, related to the main global competitors and settlement shall be performed with shares of Santander group.
The Global Long-Term Incentive Program - grant 2014 sets forth the delivery of shares from achievement of the program in three annual installments,in 2016, 2017 and 2018, with additional sale restriction of one year after each delivery, subject to the achievement of the total shareholder return of Santander Group in comparison the main competitors worldwide.
94
In 2016 a plan for delivery of shares was presented, called Global Long-Term Incentive CRDIV - Grant 2015. Such plan is subject to achievement of several indicators, including Total Shareholder Return of Santander Group, Return on Tangible Equity (ROTE), Client Satisfaction, Satisfaction of Employees and Relations with Clients of Companies.
The Global Long-Term Incentive Program - Grant 2015 sets forth the delivery of shares from achievement of the program in 2019, with additional sale restriction of one year after each delivery.
(ii). In relation to the three last fiscal years, the proportion of each element in the total compensation
The estimated proportion of each element in the total compensation is the following:
Board of Directors | 2015 | 2016 | 2017 |
Fixed compensation | 99,66% | 89,96% | 98,05% |
Benefits | 0,34% | 10,04% | 1,95% |
Executive Board (Officers) | 2015 | 2016 | 2017 |
Fixed compensation | 28,99% | 28,32% | 29,84% |
Benefits | 5,75% | 3,71% | 3,14% |
Social Security | 1,66% | 1,78% | 2,86% |
Variable Compensation | 57,87% | 60,67% | 32,08% |
Share-based compensation | 5,74% | 5,52% | 32,08% |
Audit Committee | 2015 | 2016 | 2017 |
Fixed compensation | 99,66% | 89,96% | 98,19% |
Benefits | 0,34% | 10,04% | 1,81% |
(iii) Calculation methodology and adjustment of each of the compensation elements
· Fixed Compensation: There is no automatic methodology for adjustment. Annual researches are performed with the market to evaluate the competitiveness of the Directors/Officers and members of the Audit Committee´compensation. In case any material difference is identified in relation to the market, the Compensation Committee evaluates the need to propose adjustment to the Board of Directors.
· Variable Compensation: There is no automatic methodology for adjustment. Market researches are performed annually in order to evaluate the competitiveness of the compensation of the Directors/ Officers. In case any material difference is identified in relation to the market, the Compensation Committee evaluates the need to propose adjustment to the Board of Directors. It does not apply to members of the Audit Committee.
95
· Benefits: There is no automatic methodology for adjustment. Annual researches are performed with the market to evaluate the competitiveness of the compensation of the Directors/Officers and members of the Audit Committee, including benefits. In case any material difference is identified in relation to the market, the Compensation Committee evaluates the need to propose adjustment to the Board of Directors.
· Social Security:It does not apply to the Directors and members of the Audit Committee. For the Officers, as defined in the plan's regulation. See Item 13.10 of the Reference Form.
· Share-based compensation: It does not apply to the Directors and members of the Audit Committee. To the Officers, as defined in the regulation of each plan. See item 13.4 of the Reference Form.
(iv) reasons that justify the composition of thecompensation
The proposed compensation considers the experience of the members of the Board of Directors, Board of Officers and Audit Committee the need to retain the talents in a competitive market and the promotion of the Company´s good performance and alignment with the shareholders' strategy, and with respect to the members of the Executive Board, through a long-term commitment.
(v) The existence of members with no compensation on the part of the issuer and the reason for that
There are two types of members of the Board of Directors without compensation, the representatives of Santander Spain. They receive compensation in the Controlling company for their executive positions that they hold there.
There are no unpaid members on the Executive Board.
There are no unpaid members on the Audit Committee.
c. Main performance indicators taken into consideration in the determination of each compensation element
The definition of the maximum amounts is approved in the general meeting taking into accounts the Company´s income in the last year and the expected results for the current year, including, without limitation, the net profit.
For the members of the Board of Executive Officers, the following are also considered:
· Fixed Compensation: without linked indicator.
· Variable Compensation: it is based in the Company´s indicators of results of the areas and the individual performance.
For the fiscal year 2017, the Quantitative Metrics evaluated were the following:
| |

96
Subject
Customers
Employees
Company
Shareholders
Indicators
Customers´ Satisfaction
Linked Customers
Digital Customers
Engagement
Microcredit
Risks
Capital
Profitability
Ponderation
--------------------
For the individual evaluation, it is considered both, the quantitative factors, which depends on the area, and the qualitative ones (behaviors aligned to the bank culture).
· Benefits: without linked indicator.
· Social Security: without linked indicator.
· Share-based compensation: Scheme ILP, as described in item 13.4 of this Reference Form.
d. How the compensation is structured in order to reflect the evolution of the performance indicators
The compensation of the members of the Board of Directors is defined taking into account the responsibility and seniority of each of the members.
For the Executive Board, the Board of Directors evaluates the compliance with the defined goals and the budget, with the purpose to check if the results justify the distribution of amounts up to the proposed limits.
The compensation of the Audit Committee members is defined annually by the general meeting and is not directly related to the short and medium-term performance.
e. How the compensation policy or practice aligns with the interests of issuer in the short, medium and long terms
The compensation policy is aligned with the interests of the Company as it establishes the assumptions that are compatible with the risk management as it does not promote behaviors that increase the risk exposure above the levels which is considered prudent in the strategies of short, medium and long terms, adopted by the Company, disclosing concepts, criteria and responsibilities related to theforms of fixed and variable compensation, promoting the high performances of them, always aligned with the Company´s and shareholders´ interests.
97
The Company´s compensation policy offers to the members of the Executive Board schemes such as Self Management Schedule (PPG), ILP Plans (global and local) and Deferral Program with the purpose to align the interests of the Company and the executives. It is aimed, in one hand, to the growth of the sustainable profitability of the business of the Company and, on the other hand, to the recognition of the contribution of the executives to the development of the Company.
f. Existence of compensation borne by subsidiaries, controlled companies or direct or indirect controlling companies
The compensation of the Members of the Board of Directors and Audit Committee is not supported by the subsidiaries, controlled companies or direct or indirect controlling companies of the Company. However, the members of the Board of Director who also holds executive positions in Santander Spain, the Company´s indirect controlling company or in other companies controlled by Santander Spain are paid, as a result of such positions, directly by the related companies, according to activities held by them.
The compensation of the Executive Board members is not supported by the subsidiaries, controlled companies, direct or indirect controlling companies. Therefore, the results of the subsidiaries and the affiliated companies influence the Company´s consolidated income and, consequently, the variable compensation of the Executive Board members.
g. Existence of any compensation or benefit bound to the occurrence of a certain shareholding event, such as the disposal of the share control of issuer
There are no compensations or benefits related to the occurrence of a shareholding event.
13.2. Total remuneration of the Board of Directors, Statutory Board and Audit Committee
The number of members per body corresponds to the yearly average determined on a monthly basis.
Total Remuneration Expected for the Current FY 2018 - Annual Values | |||||
| Board of Directors | Executive Board | Audit Committee | Compensation Committee | Total |
Total Number of Members | 10 | 44 | 4 | 4 | 62 |
Number of Remunerated Numbers | 5 | 44 | 4 | 4 | 57 |
Annual Fixed Remuneration |
|
|
|
| - |
Salary or Compensation | 4.700.000,00 | 76.000.000,00 | 2.800.000,00 |
| 83.500.000,00 |
Direct and Indirect Benefits | 300.000,00 | 17.000.000,00 | 200.000,00 |
| 17.500.000,00 |
Participation in Committees |
|
|
|
| - |
Other |
| 43.000.000,00 |
|
| 43.000.000,00 |
Other INSS | 1.057.500,00 | 23.180.000,00 | 630.000,00 | 72.900,00 | 24.940.400,00 |
Variable Remuneration |
|
|
|
| - |
Bonus |
| - |
|
| - |
Participation in Income |
| 79.500.000,00 |
|
| 79.500.000,00 |
Attendance at Meetings |
|
|
| 324.000,00 | 324.000,00 |
Commissions |
|
|
|
| - |
Other INSS |
|
|
|
| - |
Other |
|
|
|
| - |
Post-Employment |
|
|
|
| - |
Extinction of Job |
|
|
|
| - |
Stock-Based | - | 79.500.000,00 |
|
| 79.500.000,00 |
Total Remuneration | 6.057.500,00 | 318.180.000,00 | 3.630.000,00 | 396.900,00 | 328.264.400,00 |
98
Remuneração total para o Exercício Social em 31/12/2017 - Valores anuais - | ||||||
| Board of Directors | Executive Board | Audit Committee | Compensation Committee | Total |
|
Total Number of Members | 10 | 44 | 5 | 4 | 63 |
|
Number of Remunerated Numbers | 4,17 | 40,50 | 3,42 | 3,3 | 51,4 |
|
Annual Fixed Remuneration |
|
|
|
|
|
|
Salary or Compensation | 3.074.000,00 | 69.199.989,52 | 2.580.000,00 |
| 74.853.989,52 |
|
Direct and Indirect Benefits | 61.050,80 | 7.276.334,75 | 47.587,52 |
| 7.384.973,07 |
|
Participation in Committees |
|
|
|
| - |
|
Other |
| 4.595.710,07 |
|
| 4.595.710,07 |
|
Other INSS | 691.650,00 | 21.105.996,80 | 580.500,00 | 101.250,00 | 22.479.396,80 |
|
Variable Remuneration |
|
|
|
| - |
|
Bonus |
|
|
|
| - |
|
Participation in Income |
| 74.397.250,00 |
|
| 74.397.250,00 |
|
Attendance at Meetings |
|
|
| 450.000,00 | 450.000,00 |
|
Commissions |
|
|
|
| - |
|
Other INSS |
|
|
|
| - |
|
Other |
|
|
|
| - |
|
Post-Employment |
|
|
|
| - |
|
Extinction of Job |
|
|
|
| - |
|
Stock-Based | - | 74.398.196,55 |
|
| 74.398.196,55 |
|
Total Remuneration | 3.826.700,80 | 250.973.477,70 | 3.208.087,52 | 551.250,00 | 258.559.516,02 |
|
Remuneração total para o Exercício Social em 31/12/2016 - Valores anuais - | ||||||
| Board of Directors | Executive Board | Audit Committee | Compensation Committee | Total |
|
Total Number of Members | 9,83 | 44,08 | 3 | 2,75 | 59,66 |
|
Number of Remunerated Numbers | 4,83 | 44,08 | 3 | 2 | 53,91 |
|
Annual Fixed Remuneration |
|
|
|
| - |
|
Salary or Compensation | 14.840.000,00 | 64.453.748,68 | 2.280.000,00 |
| 81.573.748,68 |
|
Direct and Indirect Benefits | 1.704.851,22 | 8.441.566,84 | 53.071,02 |
| 10.199.489,07 |
|
Participation in Committees |
|
|
|
| - |
|
Other |
| 4.044.709,23 |
|
| 4.044.709,23 |
|
Other INSS | 4.661.620,00 | 19.658.393,35 | 695.400,00 |
| 25.015.413,35 |
|
Variable Remuneration |
|
|
|
| - |
|
Bonus |
| - |
|
| - |
|
Participation in Income |
| 138.051.000,00 |
|
| 138.051.000,00 |
|
Attendance at Meetings | 444.000,00 |
|
| 84.000,00 | 528.000,00 |
|
Commissions |
|
|
|
| - |
|
Other INSS | 621.220,95 | 3.832.257,90 |
|
| 4.453.478,85 |
|
Other |
|
|
|
| - |
|
Post-Employment |
|
|
|
| - |
|
Extinction of Job |
|
|
|
| - |
|
Stock-Based | 2.036.790,00 | 12.564.780,00 |
|
| 14.601.570,00 |
|
Total Remuneration | 24.308.482,17 | 251.046.455,99 | 3.028.471,02 | 84.000,00 | 278.467.409,18 |
|
99
Remuneração total para o Exercício Social em 31/12/2015 - Valores anuais - | |||||
| Board of Directors | Executive Board | Audit Committee | Compensation Committee | Total |
Total Number of Members | 10 | 42,08 | 3 | 3 | 58,08 |
Number of Remunerated Numbers | 5 | 42,08 | 3 | 2 | 52,08 |
Annual Fixed Remuneration |
|
|
|
| - |
Salary or Compensation | 10.063.066,67 | 59.536.421,47 | 2.160.000,00 |
| 71.759.488,14 |
Direct and Indirect Benefits | 34.526,09 | 11.811.178,32 | 77.591,17 |
| 11.923.295,58 |
Participation in Committees |
|
|
|
| - |
Other |
| 3.400.385,26 |
|
| 3.400.385,26 |
Other INSS | 3.687.504,00 | 21.433.111,73 | 777.600,00 | - | 25.898.215,73 |
Variable Remuneration |
|
|
|
| - |
Bonus |
|
|
|
| - |
Participation in Income |
| 118.833.834,00 |
|
| 118.833.834,00 |
Attendance at Meetings | 180.000,00 |
|
| 84.000,00 | 264.000,00 |
Commissions |
|
|
|
|
|
Other INSS |
| 4.240.045,57 |
|
| 4.240.045,57 |
Other |
|
|
|
| - |
Post-Employment |
|
|
|
| - |
Extinction of Job |
|
|
|
| - |
Stock-Based |
| 11.777.904,36 |
|
| 11.777.904,36 |
Total Remuneration | 13.965.096,76 | 231.032.880,70 | 3.015.191,17 | 84.000,00 | 248.097.168,63 |
13.3. In relation to the variable remuneration in the last 3 fiscal years and expected remuneration for the current fiscal year of the Board of Directors and Statutory Board
The tables below show the variable compensation of the members of the Company management bodies in the fiscal years of 2015, 2016, and 2017, as well as the review for the fiscal year of 2018:
Variable compensation – fiscal year ended on December 31, 2015
100
| Board of Directors | Executive Board | Audit Committee | Compensation Committee | Total |
a. Body: |
|
|
|
|
|
b. Total number of members | 10 | 42.08 | 3 | 3 | 58 |
c. No. of Members compensated | 5 | 42.08 | 3 | 2 | 52 |
d. in relation to the Bonus | - | - | - | - | - |
i. minimum amount set forth in the compensation plan | - | - | - | - | - |
ii. maximum amount set forth in the compensation plan | - | 36,000,000.00 | - | - | 36,000,000.00 |
iii. amount payable under the compensation plan, in case the goals are reached | - | 30,000,000.00 | - | - | 30,000,000.00 |
iv. Amount actually acknowledged in the income of the fiscal year | - | - | - | - | - |
e. in relation to the profit sharing |
|
|
|
|
|
i. minimum amount set forth in the compensation plan | - | - | - | - | - |
ii. maximum amount set forth in the compensation plan | 10,000,000 | 110,000,000.00 | - | - | 110,000,000.00 |
iii. amount payable under the compensation plan, in case the goals are reached | - | 100,000,000.00 | - | - | 100,000,000.00 |
iv. Amount actually acknowledged in the income of the fiscal year | - | 118,833,834.00 | - | - | 118,833,834.00 |
Note: The number of members of each Body corresponds to the annual average monthly ascertained.
Variable compensation – fiscal year ended on December 31, 2016
| Board of Directors | Executive Board | Audit Committee | Compensation Committee | Total |
a. Body: |
|
|
|
|
|
b. Total number of members | 9.83 | 44.08 | 3.00 | 2.75 | 59.66 |
c. No. of Members compensated | 4.83 | 44.08 | 3.00 | 2.00 | 53.91 |
d. in relation to the Bonus | - | - | - | - | - |
i. minimum amount set forth in the compensation plan | - | - | - | - | - |
ii. maximum amount set forth in the compensation plan | - | 9,000,000.00 | - | - | 9,000,000.00 |
iii. amount payable under the compensation plan, in case the goals are reached | - | 5,000,000.00 | - | - | 5,000,000.00 |
iv. Amount actually acknowledged in the income of the fiscal year | - | - | - | - | - |
e. in relation to the profit sharing |
|
|
|
| - |
i. minimum amount set forth in the compensation plan | - | - | - | - | - |
ii. maximum amount set forth in the compensation plan | - | 145,000,000.00 | - | - | 145,000,000.00 |
iii. amount payable under the compensation plan, in case the goals are reached | - | 120,000,000.00 | - | - | 120,000,000.00 |
iv. Amount actually acknowledged in the income of the fiscal year | - | 138,051.000.00 | - | - | 138,051.000.00 |
101
Note: The number of members of each Body corresponds to the annual average monthly ascertained.
Variable compensation – fiscal year ended on December 31, 2017
| Board of Directors | Executive Board | Audit Committee | Compensation Committee | Total |
a. Body: |
|
|
|
|
|
b. Total number of members | 10,00 | 44,00 | 5,00 | 4,00 | 63,00 |
c. No. of Members compensated | 4,17 | 40,50 | 3,42 | 3,33 | 51,42 |
d. in relation to the Bonus | - | - | - | - | - |
i. minimum amount set forth in the compensation plan | - | - | - | - | - |
ii. maximum amount set forth in the compensation plan | - | 9.000.000,00 | - | - | 9.000.000,00 |
iii. amount payable under the compensation plan, in case the goals are reached | - | 5.000.000,00 | - | - | 5.000.000,00 |
iv. Amount actually acknowledged in the income of the fiscal year | - | - | - | - | - |
e. in relation to the profit sharing |
|
|
|
|
|
i. minimum amount set forth in the compensation plan | - | - | - | - | - |
ii. maximum amount set forth in the compensation plan | - | 145,000,000.00 | - | - | 145,000,000.00 |
iii. amount payable under the compensation plan, in case the goals are reached | - | 120,000,000.00 | - | - | 120,000,000.00 |
iv. Amount actually acknowledged in the income of the fiscal year | - | 148,795,446.55 | - | - | 148,795,446.55 |
102
Note: The number of members of each Body corresponds to the annual average monthly ascertained.
Variable compensation – planned for fiscal year 2018 – Annual Values
| Board of Directors | Executive Board | Audit Committee | Compensation Committee | Total |
a. Body: |
|
|
|
|
|
b. Total number of members | 10,00 | 44,00 | 4,00 | 4,00 | 62,00 |
c. No. of Members compensated | 5,00 | 44,00 | 4,00 | 4,00 | 57,00 |
d. in relation to the Bonus | - | - | - | - | - |
i. minimum amount set forth in the compensation plan | - | - | - | - | - |
ii. maximum amount set forth in the compensation plan | - | 9.000.000,00 | - | - | 9.000.000,00 |
iii. amount payable under the compensation plan, in case the goals are reached | - | 5.000.000,00 | - | - | 5.000.000,00 |
iv. Amount actually acknowledged in the income of the fiscal year | - | - | - | - | - |
e. in relation to the profit sharing |
|
|
|
|
|
i. minimum amount set forth in the compensation plan | - | - | - | - | - |
ii. maximum amount set forth in the compensation plan | - | 160,000,000.00 | - | - | 160,000,000.00 |
iii. amount payable under the compensation plan, in case the goals are reached | - | 140,000,000.00 | - | - | 140,000,000.00 |
iv. Amount actually acknowledged in the income of the fiscal year | - | - | - | - | - |
103
Note: The number of members of each Body corresponds to the annual average monthly ascertained.
13.4. Compensation plan based on the actions of the Board of Directors and the Statutory Board, in force in the last fiscal year and estimated for the current fiscal year
a. general terms and conditions
The Company offers three (3) long term compensation schemes related to the market performance of its shares: Local Long-Term Incentive Program, Global Long-Term Incentive Program and Deferral Program.
Managers and employees not acting in management positions, which have been indicated by the Board of Directors of the Company, are eligible to these plans. The Plans have terms of three years, promoting a commitment of the eligible positions to the long-term results.
(i) Local Programs
In the Local Long-Term Incentive program the Company had two (2) different plans: Stock Option Plan for executives (SOP) and the Share Performance Plan (PSP). SOP is a stock option plan of Company’s units (Units SANB11) for managers and PSP is an Incentive plan for executives of all areas. The purpose of these plans is to maintain the commitment of collaborators for Long-Term results.
· Stock Option Plan - SOP: SOP is an option plan for Units. The exercise period for the options is of two (2) years. The participants of the plan shall continue in the Company during the term of the plan, in order to be eligible to exercise the options on their corresponding Units.
· SOP 2013: On April, 2013, the shareholders approved the concession of SOP Plan 2013, with exercise period between June 30, 2016 and June 30, 2018. The quantity of exercisable options by participants was determined in accordance with the result of assessment of performance parameter of the Company, Total Shareholder Return (TSR) and adjusted by achievement of the indicator Return on Risk-Weighted Assets (RoRWA), in comparison with the amount realized and expected in each fiscal year.
(ii) Global Programs
(ii.1) Global Programs – ILP CRDIV
In 2014 a plan for delivery of shares was presented, called Global Long-Term Incentive CRDIV - Grant 2014. The plan is subject to achievement of performance indicator of Total Shareholder Return (RTA) of Santander Group, in comparison to evolution of the Group for this indicator, related to the main global competitors and settlement shall be performed with shares of Santander Group.
The Global Long-Term Incentive Program - Grant 2014 sets forth the delivery of shares from achievement of the program in three annual installments, in 2016, 2017 and 2018, with additional sale restriction of one year after each delivery.
104
In 2016 a plan for delivery of shares was presented, called Global Long-Term Incentive CRDIV - Grant 2015. Such plan is subject to achievement of several indicators, including Total Shareholder Return of Santander Group, Return on Tangible Equity (ROTE), Client Satisfaction, Satisfaction of Employees and Relations with Clients of Companies.
The Global Long-Term Incentive Program CRDIV - Grant 2015 sets forth the delivery of shares from achievement of the program in 2019, with additional sale restriction of one year after each delivery.
(ii.2) Deferral Programs
Deferral Programs are available for Statutory Officers, executives with management positions and other eligible employees. As part of the Deferral program, the participants receive part of variable compensation in a period of three or five years.
Deferral Programs are renewed and updated annually. There are four plans in force: one for each fiscal year of 2014, 2015, 2016 e 2017.
(iii) Deferral Program
Deferral plans are divided into two (2) programs:
· Collective Identified: Statutory and Executive Officers. Statutory and Executive Officers which assume significant risks for the Company and are responsible for control areas. Deferred compensation is paid 50% in cash and 50% in Units (Units SANB11).
· Collective Not-identified: Employees. Managerial employees and some other employees are eligible for such program. Deferred compensation if fully paid in cash.
b. primary purposes of the plans
The main purposes of the plans are:
· To align the interests of the Company and of the participants in order both to stimulate the growth and profitability of Company business and to recognize the contribution of the participants in the development of its activities;
· To enable the Company to retain the participants on its staff, offering them, as an additional advantage, the opportunity to become or to increase their interest as shareholders of the Company; and
· To promote the Company’s performance and the interests of the shareholders by creating a long-term commitment on the part of the participants.
c. how does the plans contribute to objectives
The plans contribute for achievement of the objectives provided above, encouraging executives to seek achievement of indicators: Total Shareholder Return (TSR), comparison between net income expected and realized, Return on Risk-Weighted Assets (RoRWA) and growth of Earnings per Share (EPS) The indicators listed above are defined in the corresponding Plan regulations.
d. how the plans are inserted in the compensation policy of the issuer
105
The plans are a key element of the Company’s compensation strategy, representing effective instruments for recognizing and retaining members of the Executive Board in the short, medium and long terms, in addition to aligning interests of the executives to the interests of the Company.
e. how the plans align the interests of managers and issuer in the short, medium and long terms
The plans align the short, medium and long term interests of the members of the Executive Board with those of the Company, since the options are only exercised, and the shares received, if the strategic objectives of the Company are consistently attained during the respective Plan cycles.
106
f. Maximum number of shares covered

Key:
Share-based compensation plan set forth for the current fiscal year (2018)
Maximum number of shares
Board of Directors
PSP 2013
SOP delivery
SOP 2013
DEFERRAL - 3rd
DEFERRAL - 4th
DEFERRAL - 5th
DEFERRAL - 6th
DEFERRAL - 7th
DEFERRAL - 8th
Executive Board
* Until February 10 of each of the three fiscal years subsequent to the base year, the Board of Directors of the Company may change the maximum quantity of Units per year, increasing them in the proportion that the Company distributes dividends and/or interest on equity to its shareholders, in an amount equivalent to dividends and/or interest on equity that the participant would be entitled to, if he/she had the Company’s Units.
107
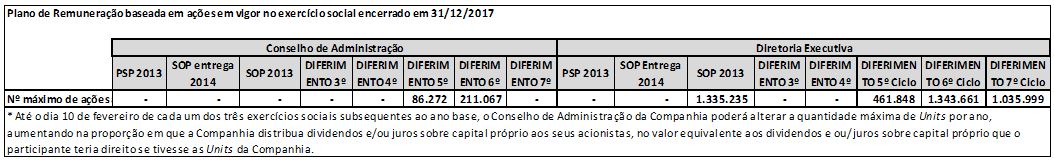
Key:
Share-based compensation plan set forth for the fiscal year ended 12/31/2017
Maximum number of shares
Board of Directors
PSP 2013
SOP delivery 2014
SOP 2013
DEFERRAL - 3rd
DEFERRAL - 4th
DEFERRAL - 5th
DEFERRAL - 6th
DEFERRAL - 7th
Executive Board
* Until February 10 of each of the three fiscal years subsequent to the base year, the Board of Directors of the Company may change the maximum quantity of Units per year, increasing them in the proportion that the Company distributes dividends and/or interest on equity to its shareholders, in an amount equivalent to dividends and/or interest on equity that the participant would be entitled to, if he/she had the Company’s Units.
108

Key:
Share-based compensation plan set forth for the fiscal year ended 12/31/2016
Maximum number of shares
Board of Directors
6th Cycle
GLOBAL
LOCAL PSP
PSP 2013
SOP delivery 2014
SOP 2013
DEFERRAL - 1st
DEFERRAL - 2nd
DEFERRAL - 3rd
DEFERRAL - 4th Cycle
DEFERRAL - 5th Cycle
DEFERRAL - 6th Cycle
6th Cycle
Executive Board
* Until February 10 of each of the three fiscal years subsequent to the base year, the Board of Directors of the Company may change the maximum quantity of Units per year, increasing them in the proportion that the Company distributes dividends and/or interest on equity to its shareholders, in an amount equivalent to dividends and/or interest on equity that the participant would be entitled to, if he/she had the Company’s Units.
--------------------
109

Key:
Share-based compensation plan set forth for the fiscal year ended 12/31/2015
Maximum number of shares
Board of Directors
6th Cycle
GLOBAL
LOCAL PSP
PSP 2013
SOP delivery 2014
SOP 2013
DEFERRAL - 1st
DEFERRAL - 2nd
DEFERRAL - 3rd
DEFERRAL - 4th Cycle
6th Cycle
Executive Board
* Until February 10 of each of the three fiscal years subsequent to the base year, the Board of Directors of the Company may change the maximum quantity of Units per year, increasing them in the proportion that the Company distributes dividends and/or interest on equity to its shareholders, in an amount equivalent to dividends and/or interest on equity that the participant would be entitled to, if he/she had the Company’s Units.
--------------------
110
g. maximum number of options to be granted

Key:
Share-based compensation plan set forth for the current fiscal year (2018)
Maximum number of shares
Board of Directors
GLOBAL
PSP 2013
SOP delivery
SOP 2013
DEFERRAL - 3rd
DEFERRAL - 4th
DEFERRAL - 5th
DEFERRAL - 6th
DEFERRAL - 7th
DEFERRAL - 8th
Executive Board
DEFERRAL - 8th Cycle
* Until February 10 of each of the three fiscal years subsequent to the base year, the Board of Directors of the Company may change the maximum quantity of Units per year, increasing them in the proportion that the Company distributes dividends and/or interest on equity to its shareholders, in an amount equivalent to dividends and/or interest on equity that the participant would be entitled to, if he/she had the Company’s Units.
--------------------
111
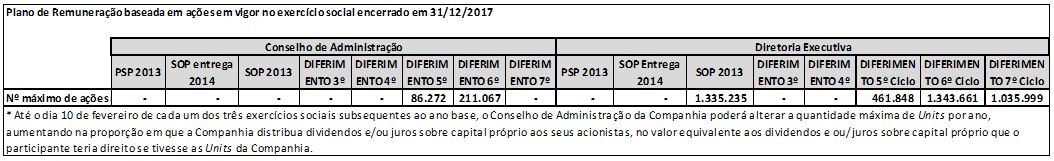
Key:
Share-based compensation plan set forth for the fiscal year ended 12/31/2017
Maximum number of shares
Board of Directors
PSP 2013
SOP delivery 2014
SOP 2013
DEFERRAL - 3rd
DEFERRAL - 4th
DEFERRAL - 5th
DEFERRAL - 6th
DEFERRAL - 7th
Executive Board
* Until February 10 of each of the three fiscal years subsequent to the base year, the Board of Directors of the Company may change the maximum quantity of Units per year, increasing them in the proportion that the Company distributes dividends and/or interest on equity to its shareholders, in an amount equivalent to dividends and/or interest on equity that the participant would be entitled to, if he/she had the Company’s Units.
--------------------
112
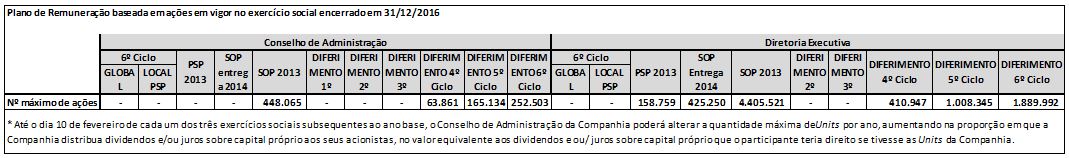
Key:
Share-based compensation plan set forth for the fiscal year ended 12/31/2016
Maximum number of shares
Board of Directors
6th Cycle
GLOBAL
LOCAL PSP
PSP 2013
SOP delivery 2014
SOP 2013
DEFERRAL – 1sd
DEFERRAL – 2nd
DEFERRAL - 3rd
DEFERRAL - 4th Cycle
DEFERRAL - 5th Cycle
DEFERRAL - 6th Cycle
6th Cycle
Executive Board
* Until February 10 of each of the three fiscal years subsequent to the base year, the Board of Directors of the Company may change the maximum quantity of Units per year, increasing them in the proportion that the Company distributes dividends and/or interest on equity to its shareholders, in an amount equivalent to dividends and/or interest on equity that the participant would be entitled to, if he/she had the Company’s Units.
--------------------
113
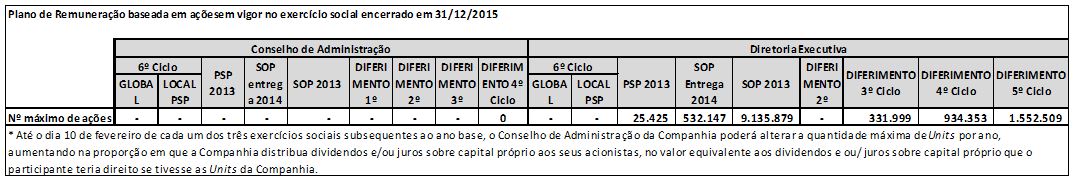
Key:
Share-based compensation plan set forth for the fiscal year ended 12/31/2015
Maximum number of shares
Board of Directors
6th Cycle
GLOBAL
LOCAL PSP
PSP 2013
SOP delivery 2014
SOP 2013
DEFERRAL - 3rd Cycle
DEFERRAL - 4th Cycle
DEFERRAL - 5th Cycle
6th Cycle
Executive Board
* Until February 10 of each of the three fiscal years subsequent to the base year, the Board of Directors of the Company may change the maximum quantity of Units per year, increasing them in the proportion that the Company distributes dividends and/or interest on equity to its shareholders, in an amount equivalent to dividends and/or interest on equity that the participant would be entitled to, if he/she had the Company’s Units.
--------------------
114
h. conditions for acquisition of the shares
(i) Local Programs
· SOP 2013: The quantity of exercisable Units by the participants was determined according to the result of the calculation of a Company´s performance parameter, the Total Shareholder Return (TSR), and adjusted for the achievement of the Return on Risk-Weighted Assets (RoRWA), comparison between the realized and the expected amounts in each fiscal year, as determined by the Board of Directors. In addition to that, it is necessary for the participant to continue in the Company during the term of Plan, in order to exercise the Units corresponding to its compensation. In order to be entitle to receive options, the goals set forth in Regulations shall be achieved.
(ii) Global Programs
· ILP Global CRDIV Plan – Grant 2014: The plan, started in 2014, is subject to achievement of performance indicator of Total Shareholder Return (TSR) of Santander Group, comparing the evolution of the Group for this indicator, related to the main global competitors and settlement shall be performed with shares of Worldwide Santander Group. The Global Long-Term Incentive Program - Grant 2014 sets forth the delivery of shares from achievement of the program in three annual installments, in 2016, 2017 and 2018, with additional sale restriction of one year after each delivery.
· ILP Global CRDIV Plan – Grant 2015: This plan was started in 2016 and is subject to achievement of several indicators, including Total Shareholder Return of Santander Group, Return on Tangible Equity (ROTE), Client Satisfaction, Satisfaction of Employees and Relations with Clients of Companies. The Global Long-Term Incentive Program CRDIV - Grant 2015 sets forth the delivery of shares from achievement of the program in 2019, with additional sale restriction of one year after each delivery.
(iii) Deferral Programs
· Deferral - 5th Cycle (2014), 6th Cycle (2015), 7th Cycle (2016) and 8th Cycle (2017):The Plan is subject to the current regulations applicable to the Company, in particular Resolution No. 3921 of the National Monetary Council, dated November 25, 2010 ("Resolution No. 3921/10"), which requires financial institutions to observe certain procedures in deferring payment of a portion of the Variable Compensation owing to their managers and other employees, taking into account sustainable long-term financial bases and adjustments of future payments according to the risks assumed and variations in the cost of capital.
i. criteria for setting the price of acquisition or exercise
(i) Local Programs
· SOP 2013: The price of options issued is R$ 12.8423 per Unit.
115
(ii) Global Programs
The cycles last for three years, covering three fiscal years, to encourage commitment to long-term results on the part of the Executive Officers.
(iii) Deferral Program (5th, 6th, 7th and 8th cycles)
The total number of Units in reference is settled in three installments and equally allocated for the three fiscal years subsequent to the base year.
j. Criteria for setting the time for exercise
(i) Local Programs
· SOP 2013: The quantity equivalent to 40% of the Units resulting from the Bonus (“Lock-Up Percentage”) of each Participant and 50% (in case of the Company’s Chief Executive Officer), shall not be disposed of during the following terms (“Lock-Up Period”), including in case of termination of the agreement:
o 1/3 of the Lock-up Percentage for two years from the date of receipt of each Unit;
o 1/3 of the Lock-up Percentage for three years from the date of receipt of each Unit;
o 1/3 of the Lock-up Percentage for four years from the date of receipt of each Unit.
(ii) Global Programs
In the Global Plans - ILP CRDIV there is a restriction on the transfer of shares for one year after they are received. In the other global plans there is no restriction on the transfer of shares after they have been received.
(iii) Deferral Plan(1st, 2nd, 3rd, 4th, 5th, 6th and 7th Deferral Cycles)
5th, 6th, 7th and 8th Deferral Cycles: Administrators belonging to the aforementioned Collective Identity may not dispose of the Units received in this plan during the term of one year from the date of receipt of each lot of Units.
k. Form of settlement
(i) Local Programs
· SOP 2013: inUnits
(ii) Global Programs
Payroll bonus for mandatory purchase of shares.
(iii) Deferral Programs
116
· 5th, 6th, 7th and 8th Cycles: is made directly in Units (installment deferred in Units)
l. Lock-up on the transfer of shares
(i) Local Programs
· SOP 2013: The quantity equivalent to 40% of the Units resulting from the Bonus (“Lock-Up Percentage”) of each Participant and 50% (in case of the Company’s Chief Executive Officer), shall not be disposed of during the following terms (“Lock-Up Period”), including in case of termination of the agreement:
o 1/3 of the Lock-up Percentage for two years from the date of receipt of each Unit;
o 1/3 of the Lock-up Percentage for three years from the date of receipt of each Unit;
o 1/3 of the Lock-up Percentage for four years from the date of receipt of each Unit.
(ii) Global Programs
In the Global Plans - ILP CRDIV there is a lock-up on the transfer of shares for one year after their receipt. In the other global plans there is no lock-up on the transfer of shares after they are received.
(iii) Deferral Program
· 5th, 6th, 7th and 8th Cycles of Deferral: Managers belonging to the above-mentioned Identified Collective may not dispose of the Units received under this plan for a period of one year from the date of receipt of each lot of Units.
m. criteria and events that, when verified, cause the suspension, change or cancellation of the plan
(i) Local Programs
· 2013: Any material change in the corporate law and/or in the tax effects applicable to the Company or the participants may lead to a partial or total revision of the plan, or even to its suspension or cancellation, at the discretion of the Board of Directors. In addition, the Board of Directors may, at its sole discretion, approve the release of all or part of the options under the SOP 2013, in the event of direct or indirect disposal by the controlling shareholders of the Company of a number of shares implying a change in control of the Company, whether in a single transaction or in successive transactions. The Board of Directors may determine special rules allowing the shares related to the options to be sold in the case of a takeover bid.
(ii) Global Programs
The plan may be amended for legal or regulatory reasons.
(iii) Deferral Programs
117
The Plans may be cancelled, suspended or amended by the Board of Directors at any time. In the case of suspension or cancellation, the rights of participants holding bonus allocations of Units receivable must be respected, in line with the following provisions:
· In order to preserve the objectives of the plan, the total number of Units shall be adjusted up or down in the event of: a split, reverse split or bonus issue of shares, merger, takeover, spin-off or other similar procedures of a material nature; and
· The Human Resources Executive Board, under the supervision of the Executive Committee, shall carry out the corresponding quantitative adjustments using the procedures followed by the B3 for similar adjustments in the share markets.
(iii.1) Deferral – 5th, 6th, 7th and 8th Cycles
The Plan is subject to aMalus clause, i.e., the Company’s Board of Directors, upon recommendation from the Compensation Committee, may approve to decrease up to 100% from the amount of each participant under the hypothesis set forth:
· Company’s weak financial performance;
· non-compliance by the Participant of the internal regulations, in special with those related to risks;
· material changes in the financial statements of Santander Brasil, which were considered by the independent auditors, except if they arise from changes in the accounting standards. In case the Board of Directors understands that it is necessary, the Santander Group financial statements may also be considered in this analysis; and
· material variations in the share capital or in the qualitative evaluation of Santander Brasil risks. In case the Board of Directors understands that it is necessary, the variations in the share capital of Santander Group may also be considered in this analysis.
n. effects of the exit of the manager from the bodies of the issuer over his/her rights set in the share-based compensation plan
(i) Local Programs
SOP delivery 2013
The ILP Plan shall be cancelled in advance and the participant shall lose the right to benefit from it, forfeiting all rights to receive options or shares, if the participant resigns voluntarily or is dismissed from the Company for just cause or removed from office.
If the participant's employment contract is terminated as a result of actions of the Company, in terms of article 483 of the Consolidated Labor Laws, in the case of dismissal without just cause, by mutual accord in the case of a participant without a formal employment relationship, or in the event of retirement, the participant shall receive a bonus in an amount proportional to the length of membership in the ILP Plan, at the same time as the other participants in the same cycle of the ILP Plan are paid, taking into account the percentage of performance indicators achieved.
If the participant dies or becomes permanently disabled, the options or shares shall be delivered at the same time of those of other participants in the same ILP Plan cycle, without any proportionality in respect of length of membership of theparticipant in the applicable cycle of the plan, but with the percentage of performance indicators being applied normally. In the event of death, delivery shall be made to the participant’s heirs.
118
(ii) Global Programs
In case of retirement, if a participant leaves the company after dismissal without just cause, leave, permanent disability or in the event of the participant’s death, the right to receive shares will not be affected, as if none of the events above had happened, except as follows:
· In the event of death, the right shall pass to the beneficiary’s heirs;
· The number of shares to be delivered shall be calculated by multiplying the maximum number of shares receivable by the quotient obtained by dividing the number of days from the date of launching of the plan to the date of death, retirement, pre-retirement, dismissal, write-off or other circumstance that determined the application of this rule, both including, by the number of days of effectiveness of the plan; and
· If a participant resigns voluntarily, the right to the plan is lost.
(iii) Deferral Programs
The plan shall be cancelled in advance, by virtue of law, and the participant shall lose the right to participate in the plan, forfeiting the right to receive future benefits, in the case of voluntary resignation or dismissal for just cause in terms of article 482 of the Consolidated Labor Laws, or removal from statutory office by unilateral decision on the part of the Company.
If the participant's employment contract is terminated as a result of actions of the Company, in terms of article 483 of the Consolidated Labor Laws, in the case of dismissal without just cause, or in the event of retirement or death, the participant shall receive the amount of the portion of the corresponding bonus in Units, at the same time as the other participants in the same cycle of the Plan are paid. In the event of death, delivery shall be made to the participant’s heirs. In the event that the participant shall become permanently disabled, subject to confirmation by two medical reports (public and private institutions), the participant shall receive the amount of the portion of the corresponding bonus in Units, at the same time as the other participants in the same cycle of the Plan are paid.
If an employment contract is suspended owing to illness or work accident, the participant shall receive the amount of the portion of the corresponding bonus in Units at the same time as the other participants in the same cycle of the Plan are paid.
119
13.5. In relation to stock-based compensation recognized in the outcome of the last 3 financial years and planned for the current fiscal year, the Board of Directors and the Statutory Board:
2018
Share-based compensation set forth for the current fiscal year (2018) | ||||||||||||||
| Board of Directors | |||||||||||||
| 5th CYCLE | 6th CYCLE | PSP 2013 | 1st CYCLE - DEFERRAL | 2nd CYCLE - DEFERRAL | 3rd CYCLE - DEFERRAL | 4th CYCLE - DEFERRAL | 5th CYCLE - DEFERRAL | 6th CYCLE - DEFERRAL | 7th CYCLE - DEFERRAL | SOP delivery 2014 | SOP 2013 | ||
| GLOBAL | LOCAL PSP | GLOBAL | LOCAL PSP | ||||||||||
Number of members | 10 | |||||||||||||
Number of compensated members | 5 | |||||||||||||
Granting of shares purchase options |
|
| ||||||||||||
Date of grant | 2011 | 2012 | 2013 | 2011 | 2012 | 2013 | 2014 | 2015 | 2016 | 2017 | 2011 | 2013 | ||
Quantity of options granted | 0 | 0 | 0 | 0 | 0 | 0 | 0 | 0 | 0 | 86.272 | 211.068 | 0 | 0 | 0 |
Time for the options to become exercisable | 2013 | 2014 | 2016 | 2011 | 2012 | 2013 | 2014 | 2015 | 2016 | 2017 | 2014 | 2016 | ||
Maximum term to exercise the options | None | None | None | 2014 | 2015 | 2016 | 2017 | 2018 | 2019 | 2020 | 2016 | 2018 | ||
Lock-up period for the transfer of shares | None | |||||||||||||
Weighted average price for the fiscal year: | None | |||||||||||||
(a) Of the outstanding options in the beginning of the fiscal year | None | |||||||||||||
(b) Of the forfeited options during the fiscal year | None | |||||||||||||
(c) Of the options exercised during the fiscal year | None | |||||||||||||
(f) Of the options expired during the fiscal year | None | |||||||||||||
Fair value of the options on the date of grant | none** | R$ 7.08 | R$ 5.96 | |||||||||||
Potential dilution in case of exercise of all options granted |
| |||||||||||||
| Executive Board | |||||||||||||||||
| 4th Cycle | 5th Cycle | 6th Cycle | 7th Cycle | 1st CYCLE - DEFERRAL | 2nd CYCLE - DEFERRAL | 3rd CYCLE - DEFERRAL | 4th CYCLE - DEFERRAL | 5th CYCLE - DEFERRAL | 6th CYCLE - | 7th CYCLE - DEFERRAL | SOP delivery 2014 | SOP 2013 | |||||
| LOCAL - SOP | GLOBAL | LOCAL SP | GLOBAL | LOCAL PSP | GLOBAL | LOCAL PSP | |||||||||||
Number of members | 44 | |||||||||||||||||
Number of compensated members | 44 | |||||||||||||||||
Granting of shares purchase options |
|
| ||||||||||||||||
Date of grant | 2010 | 2011 | 2012 | 2013 | 2013 | 2011 | 2012 | 2013 | 2014 | 2015 | 2016 | 2017 | 2011 | 2013 | ||||
Quantity of options granted | 0 | 0 | 0 | 0 | 0 |
| 0 | 0 | 0 | 0 | 0 | 513.703 | 1,439,796 | 1,054,808 | 0 | 1,439,980 | ||
Time for the options to become exercisable |
| 2013 | 2014 |
| 2016 | 2011 | 2012 | 2013 | 2014 | 2015 | 2016 | 2017 | 2014 | 2016 | ||||
Maximum term to exercise the options | 20147 | None | None |
| None | 2014 | 2015 | 2016 | 2017 | 2018 | 2021 | 2022 | 2016 | 2018 | ||||
Lock-up period for the transfer of shares | None | 4 years | None | |||||||||||||||
Weighted average price for the fiscal year: | None | R$ 12.72 | None | |||||||||||||||
(a) Of the outstanding options in the beginning of the fiscal year | None | R$ 12.72 | None | |||||||||||||||
(b) Of the forfeited options during the fiscal year | None | None | None | |||||||||||||||
(c) Of the options exercised during the fiscal year | None | R$ 12.72 | None | |||||||||||||||
(f) Of the options expired during the fiscal year | None | None | None | |||||||||||||||
Fair value of the options on the date of grant | R$ 7.19 | none ** |
| R$ 7.08 | R$ 5.96 | |||||||||||||
Potential dilution in case of exercise of all options granted | 0.5%*** |
| ||||||||||||||||
** The Global plans and the Local plan - PSP grant shares and not purchase options. Thus, there is no fair value; | ||||||||||||||||||
*** Maximum dilution. | ||||||||||||||||||
120
2017
Share-based compensation set forth for the fiscal year ended on 12/31/2017 | ||||||||||||||
| Board of Directors | |||||||||||||
| 5th CYCLE | 6th CYCLE | PSP 2013 | 1st CYCLE | 2nd CYCLE | 3rd CYCLE | 4th CYCLE | 5th CYCLE | 6th CYCLE | 7th CYCLE | SOP delivery 2014 | SOP 2013 | ||
| GLOBAL | LOCAL PSP | GLOBAL | LOCAL PSP | ||||||||||
Number of members | 10 | |||||||||||||
Number of compensated members | 5 | |||||||||||||
Granting of shares purchase options |
|
| ||||||||||||
Date of grant | 2011 | 2012 | 2013 | 2011 | 2012 | 2013 | 2014 | 2015 | 2016 | 2017 | 2011 | 2013 | ||
Quantity of options granted | 0 | 0 | 0 | 0 | 0 | 0 | 0 | 0 | 0 | 86.272 | 211.068 | 0 | 0 | 0 |
Time for the options to become exercisable | 2013 | 2014 | 2016 | 2011 | 2012 | 2013 | 2014 | 2015 | 2016 | 2017 | 2014 | 2016 | ||
Maximum term to exercise the options | None | None | None | 2014 | 2015 | 2016 | 2017 | 2018 | 2019 | 2020 | 2016 | 2018 | ||
Lock-up period for the transfer of shares | None | |||||||||||||
Weighted average price for the fiscal year: | None | |||||||||||||
(a) Of the outstanding options in the beginning of the fiscal year | None | |||||||||||||
(b) Of the forfeited options during the fiscal year | None | |||||||||||||
(c) Of the options exercised during the fiscal year | None | |||||||||||||
(f) Of the options expired during the fiscal year | None | |||||||||||||
Fair value of the options on the date of grant | none** | R$ 7.08 | R$ 5.96 | |||||||||||
Potential dilution in case of exercise of all options granted |
| |||||||||||||
121
| Executive Board | |||||||||||||||||
| 4th Cycle | 5th Cycle | 6th Cycle | 7th Cycle | 1st CYCLE - DEFERRAL | 2nd CYCLE - DEFERRAL | 3rd CYCLE - DEFERRAL | 4th CYCLE | 5th CYCLE - DEFERRAL | 6th CYCLE | 7th CYCLE | SOP delivery 2014 | SOP 2013 | |||||
| LOCAL - SOP | GLOBAL | LOCAL SP | GLOBAL | LOCAL PSP | GLOBAL | LOCAL PSP | |||||||||||
Number of members | 44 | |||||||||||||||||
Number of compensated members | 44 | |||||||||||||||||
Granting of shares purchase options |
|
| ||||||||||||||||
Date of grant | 2010 | 2011 | 2012 | 2013 | 2013 | 2011 | 2012 | 2013 | 2014 | 2015 | 2016 | 2017 | 2011 | 2013 | ||||
Quantity of options granted | 0 | 0 | 0 | 0 | 0 |
| 0 | 0 | 0 | 0 | 0 | 513.703 | 1,439,796 | 1,054,808 | 0 | 1,439,980 | ||
Time for the options to become exercisable |
| 2013 | 2014 |
| 2016 | 2011 | 2012 | 2013 | 2014 | 2015 | 2016 | 2017 | 2014 | 2016 | ||||
Maximum term to exercise the options | 20147 | None | None |
| None | 2014 | 2015 | 2016 | 2017 | 2018 | 2021 | 2022 | 2016 | 2018 | ||||
Lock-up period for the transfer of shares | None | 4 years | None | |||||||||||||||
Weighted average price for the fiscal year: | None | R$ 12.72 | None | |||||||||||||||
(a) Of the outstanding options in the beginning of the fiscal year | None | R$ 12.72 | None | |||||||||||||||
(b) Of the forfeited options during the fiscal year | None | None | None | |||||||||||||||
(c) Of the options exercised during the fiscal year | None | R$ 12.72 | None | |||||||||||||||
(f) Of the options expired during the fiscal year | None | None | None | |||||||||||||||
Fair value of the options on the date of grant | R$ 7.19 | none ** |
| R$ 7.08 | R$ 5.96 | |||||||||||||
Potential dilution in case of exercise of all options granted | 0.5%*** |
| ||||||||||||||||
** The Global plans and the Local plan - PSP grant shares and not purchase options. Thus, there is no fair value; | ||||||||||||||||||
*** Maximum dilution. | ||||||||||||||||||
122
2016
Share-based compensation - fiscal year ended on 12/31/2016 | ||||||||||||||
| Board of Directors | |||||||||||||
| 5th CYCLE | 6th CYCLE | PSP 2013 | 1st CYCLE - DEFERRAL | 2nd CYCLE - DEFERRAL | 3rd CYCLE - DEFERRAL | 4th CYCLE - DEFERRAL | 5th CYCLE - DEFERRAL | 6th CYCLE - DEFERRAL |
| SOP delivery 2014 | SOP 2013 | ||
| GLOBAL | LOCAL PSP | GLOBAL | LOCAL PSP | ||||||||||
Number of members | 9.83 | |||||||||||||
Number of compensated members | 4.83 | |||||||||||||
Granting of shares purchase options |
|
| ||||||||||||
Date of grant | 2011 | 2012 | 2013 | 2011 | 2012 | 2013 | 2014 | 2015 | 2016 |
| 2011 | 2013 | ||
Quantity of options granted | 0 | 0 | 0 | 0 | 0 | 0 | 0 | 0 | 63.861 | 165.134 | 252.503 |
| 0 | 448.085 |
Time for the options to become exercisable | 2013 | 2014 | 2016 | 2011 | 2012 | 2013 | 2014 | 2015 | 2016 |
| 2014 | 2016 | ||
Maximum term to exercise the options | None | None | None | 2014 | 2015 | 2016 | 2017 | 2018 | 2019 |
| 2016 | 2018 | ||
Lock-up period for the transfer of shares | None | |||||||||||||
Weighted average price for the fiscal year: | None | |||||||||||||
(a) Of the outstanding options in the beginning of the fiscal year | None | |||||||||||||
(b) Of the forfeited options during the fiscal year | None | |||||||||||||
(c) Of the options exercised during the fiscal year | None | |||||||||||||
(f) Of the options expired during the fiscal year | None | |||||||||||||
Fair value of the options on the date of grant | none** | R$ 7.08 | R$ 5.96 | |||||||||||
Potential dilution in case of exercise of all options granted |
| |||||||||||||
| Executive Board | |||||||||||||||||
| 4th Cycle
| 5th Cycle
| 6th Cycle
| 7th Cycle
| 1st CYCLE - DEFERRAL | 2nd CYCLE - DEFERRAL | 3rd CYCLE - DEFERRAL | 4th CYCLE - DEFERRAL | 5th CYCLE - DEFERRAL | 6th CYCLE - DEFERRAL |
| SOP delivery 2014 | SOP 2013 | |||||
| LOCAL - SOP | GLOBAL | LOCAL SP | GLOBAL | LOCAL PSP | GLOBAL | LOCAL PSP | |||||||||||
Number of members | 44.08 | |||||||||||||||||
Number of compensated members | 44.08 | |||||||||||||||||
Granting of shares purchase options |
|
| ||||||||||||||||
Date of grant | 2010 | 2011 | 2012 | 2013 | 2013 | 2011 | 2012 | 2013 | 2014 | 2015 | 2016 |
| 2011 | 2013 | ||||
Quantity of options granted | 0 | 0 | 0 | 0 | 0 | 0 | 158.759 | 0 | 0 | 0 | 410.947 | 1,008,345 | 1,889,992 |
| 425.250 | 4,405,521 | ||
Time for the options to become exercisable |
| 2013 | 2014 |
| 2016 | 2011 | 2012 | 2013 | 2014 | 2015 | 2016 |
| 2014 | 2016 | ||||
Maximum term to exercise the options | 2014 | None | None |
| None | 2014 | 2015 | 2016 | 2017 | 2018 | 2019 |
| 2016 | 2018 | ||||
Lock-up period for the transfer of shares | None | 4 years | None | |||||||||||||||
Weighted average price for the fiscal year: | None | R$ 12.72 | None | |||||||||||||||
(a) Of the outstanding options in the beginning of the fiscal year | None | R$ 12.72 | None | |||||||||||||||
(b) Of the forfeited options during the fiscal year | None | None | None | |||||||||||||||
(c) Of the options exercised during the fiscal year | None | R$ 12.72 | None | |||||||||||||||
(f) Of the options expired during the fiscal year | None | None | None | |||||||||||||||
Fair value of the options on the date of grant | R$ 7.19 | none ** |
| R$ 7.08 | R$ 5.96 | |||||||||||||
Potential dilution in case of exercise of all options granted | 0.5%*** |
| ||||||||||||||||
** The Global plans and the Local plan - PSP grant shares and not purchase options. Thus, there is no fair value; | ||||||||||||||||||
*** Maximum dilution. | ||||||||||||||||||
123
2015
Share-based compensation - fiscal year ended on 12/31/2015 | ||||||||||||||
| Board of Directors | |||||||||||||
| 5th CYCLE | 6th CYCLE | PSP 2013 | 1st CYCLE - DEFERRAL | 2nd CYCLE - DEFERRAL | 3rd CYCLE - DEFERRAL |
|
|
|
| SOP delivery 2014 | SOP 2013 | ||
| GLOBAL | LOCAL PSP | GLOBAL | LOCAL PSP | ||||||||||
Number of members | 9 | |||||||||||||
Number of compensated members | 4 | |||||||||||||
Granting of shares purchase options |
|
| ||||||||||||
Date of grant | 2011 | 2012 | 2013 | 2011 | 2012 | 2013 |
|
|
|
| 2011 | 2013 | ||
Quantity of options granted | 0 | 0 | 0 | 0 | 0 | 0 | 0 | 0 |
|
|
|
| 0 | 0 |
Time for the options to become exercisable | 2013 | 2014 | 2016 | 2011 | 2012 | 2013 |
|
|
|
| 2014 | 2016 | ||
Maximum term to exercise the options | None | None | None | 2014 | 2015 | 2016 |
|
|
|
| 2016 | 2018 | ||
Lock-up period for the transfer of shares | None | |||||||||||||
Weighted average price for the fiscal year: | None | |||||||||||||
(a) Of the outstanding options in the beginning of the fiscal year | None | |||||||||||||
(b) Of the forfeited options during the fiscal year | None | |||||||||||||
(c) Of the options exercised during the fiscal year | None | |||||||||||||
(f) Of the options expired during the fiscal year | None | |||||||||||||
Fair value of the options on the date of grant | none** | R$ 7.08 | R$ 5.96 | |||||||||||
Potential dilution in case of exercise of all options granted |
| |||||||||||||
124
| Executive Board | ||||||||||||||||
| 4th Cycle
| 5th Cycle
| 6th Cycle
| 7th Cycle
| 1st CYCLE - DEFERRAL | 2nd CYCLE - DEFERRAL | 3rd CYCLE - DEFERRAL | 4th CYCLE - DEFERRAL | 5th CYCLE - DEFERRAL |
|
| SOP delivery 2014 | SOP 2013 | ||||
| LOCAL - SOP | GLOBAL | LOCAL SP | GLOBAL | LOCAL PSP | GLOBAL | LOCAL PSP | ||||||||||
Number of members | 49 | ||||||||||||||||
Number of compensated members | 49 | ||||||||||||||||
Granting of shares purchase options | |||||||||||||||||
Date of grant | 2010 | 2011 | 2012 | 2013 | 2013 | 2011 | 2012 | 2013 | 2014 | 2015 |
|
| 2011 | 2013 | |||
Quantity of options granted | 0 | 0 | 0 | 0 | 0 |
| 25.425 | 0 | 0 | 664.418 | 1,402,013 | 1,708,817 |
|
| 1,388,647 | 9,135,879 | |
Time for the options to become exercisable |
| 2013 | 2014 |
| 2016 | 2011 | 2012 | 2013 | 2014 | 2015 |
|
| 2014 | 2016 | |||
Maximum term to exercise the options | 2014 | None | None |
| None | 2014 | 2015 | 2016 | 2017 | 2018 |
|
| 2016 | 2018 | |||
Lock-up period for the transfer of shares | None | 4 years | None | ||||||||||||||
Weighted average price for the fiscal year: | None | R$ 12.72 | None | ||||||||||||||
(a) Of the outstanding options in the beginning of the fiscal year | None | R$ 12.72 | None | ||||||||||||||
(b) Of the forfeited options during the fiscal year | None | None | None | ||||||||||||||
(c) Of the options exercised during the fiscal year | None | R$ 12.72 | None | ||||||||||||||
(f) Of the options expired during the fiscal year | None | None | None | ||||||||||||||
Fair value of the options on the date of grant | R$ 7.19 | none ** |
| R$ 7.08 | R$ 5.96 | ||||||||||||
Potential dilution in case of exercise of all options granted | 0.5%*** |
| |||||||||||||||
** The Global plans and the Local plan - PSP grant shares and not purchase options. Thus, there is no fair value; | |||||||||||||||||
*** Maximum dilution. | |||||||||||||||||
125
13.6. Regarding the outstanding options of the Board of Directors and Statutory Board at the end of last fiscal year:
On December 31, 2017, the managers members of the 2013 SOP plan have, together, 465,988 outstanding options. These options on Units may be exercised until June 30, 2018, at the price of R$ 12.8423 per option.
We present below the information on options held by the Executive Board members of the Company:
a. Organization | Executive Board |
b. Number of Members | 44 |
c. Not Exercised Options | |
I. Number | 0 |
II. Data the options became exercisable | 0 |
III. Maximum term for execution of options | 0 |
IV. Term of restriction on transfer of shares | 0 |
V. Average weighted price of the FY | 0 |
VI. Fair value of options on the last day of the FY | 0 |
d. Exercisable Options | |
I. Number | 465.988 |
II. Maximum term for execution of options | 30/06/2018 |
III. Term of restriction on transfer of shares | 4 years |
IV. Average weighted price of the FY | 12,8423 |
V. Fair value of options on the last day of the FY | R$ 5,96 per option |
VI. Total fair value of options on the last day of the FY | R$ 2.777.288 |
On December 31, 2017, the members of the Company’s Board of Directors did not have outstanding options.
13.7. In relation to options exercised and shares delivered regarding the stock-based remuneration for the Board of Directors and Statutory Board in the last three (3) fiscal years
(i) ILP Global Program
In the last three fiscal years, payments to the members of the Board of Directors and Executive Board were not made, considering the scope of global compensation plans in stock options.
(ii) Local Program
The right to exercise options related to the third cycle for Local, SOP 2013 was exercised, according to information described in tables below:
| Opções exercidas - exercício social encerrado em 31/12/2017 | ||
| Conselho de Administração | Diretoria Executiva | |
| SOP 2013 | SOP 2013 | |
| Nº de membros | 6,00 | 44,00 |
| Nº de membros remunerados | 4,17 | 40,50 |
| Opções exercidas | ||
| Número de ações | - | 869.247 |
| Preço médio ponderado de exercício | - | 12,8423 |
| Diferença entre o valor de exercício e o valor de mercado das ações relativas às opções exercidas | - | 19,69 |
| Ações entregues | ||
| Número de ações entregues | - | 140.639 |
| Preço médio ponderado de aquisição | - | 12,8423 |
| Diferença entre o valor de aquisição e o valor de mercado das ações adquiridas | - | 19,69 |
126
Key:
Exercised options - fiscal year ended 12/31/2017
No. of Members
No. of Members compensated
Options exercised
Number of shares
Weighted average price for the fiscal year
Difference between the exercise amount and the market value of shares related to options exercised
Shares delivered
Number of shares delivered
Weighted average price of acquisition
Difference between the value of acquisition and the market value of the shares acquired
Board of Directors
Executive Board
--------------------
13.8. Brief description of information needed to comprehend the data disclosed in items 13.5 to 13.7,such as the explanation of shares and options value pricing method
A. Global Program
a. Pricing model
Fair value calculated using the pricing model of Monte Carlo Method (MCM). It is a statistic method which simulates the price generation process, based on the assumption of risk neutrality.
b. Data and assumptions used in the pricing model, including the average weighted price of the shares, exercise price, expected volatility, option life term, expected dividends and risk-free interest rate
Below are the assumptions used in the pricing model.
The exercise price in every cycle and cases where the objectives provided by regulations are met, shall be the market price on exercise date.
For ILP CRDIV Plan, the parameters used in pricing were as follows:
127
| Suposição | 2 anos | 3 anos | 4 anos |
| Futuro rendimentos | 11,1% aa | 11,8% aa | 9,5% aa |
| Volatilidade | 32,7% aa | 34,7% aa | 36,9% aa |
| Taxa Livre de Risco | 1,7% aa | 2,1% aa | 2,5% aa |
| Correlação de preço comparado | 55% | 55% | 55% |
Key:
Assumption
2 years
3 years
4 years
Future earnings
Volatility
Risk-free Rate
Relation of compared price
p.a
--------------------------------------------
c. Method used and premises assumed to incorporate the expected effects of early exercise
Not applicable, since the model does not allow early exercise.
d. Method to determine the expected volatility
Estimated based on past volatility for the corresponding period.
e. Whether any other characteristic of the option was incorporated in the measurement of the fair value
Not applicable, considering that no other characteristics of the option were included in the measurement of its fair value.
B. Local Program
B.2.SOP 2013
a. Pricing model
Fair value calculated by using the pricing model of Black&Scholes. It is based on the construction of a tree with the price history, in order to determine the value of a share on a future date.
b. Data and assumptions used in the pricing model, including the average weighted price of the shares, exercise price, expected volatility, option life term, dividends expected and risk-free interest rate
The following data was used in the pricing model:
128
Performance Conditions | SOP 2013 |
Assessment Method | Black&Scholes |
Volatility | 40.00% |
Dividend Rate | 3.00% |
“Vesting” Period | 2 years |
“Average” Exercise Term | 5 years |
Risk-free Rate | 11.80% |
Probability of Occurrence | 60.27% |
Fair Value for Shares | R$ 5.96 |
c. Method used and premises assumed to incorporate the expected effects of early exercise
Not applicable, since the model does not allow early exercise.
d. Method to determine the expected volatility
Estimated based on past volatility for the corresponding period.
e. Whether any other characteristic of the option was incorporated in the measurement of the fair value
Not applicable to ILP Plans, as no other characteristic of the option was included in the measurement of its fair value.
Not applicable to deferment Plans, as the purpose is the payment, in Units, of part of the Variable Compensation due by the Company to the participants pursuant to its compensation policy.
13.9.Inform the number of shares or shares directly or indirectly held, in Brazil or abroad, and other securities convertible into shares or units issued by the issuer, their direct or indirect controllers, their subsidiaries or companies under common control, by members of the Board of Directors, the Statutory Board or the Audit Committee
Issued by: Banco Santander (Brasil) S.A. | ||
Board of Directors | ||
Security/Derivative | Characteristics of the Securities | Quantity |
Shares | Common | 4.639 |
Shares | Preferred | 4.636 |
Shares | Units | 948.758 |
Issued by: Banco Santander (Brasil) S.A. | ||
Executive Board | ||
Security/Derivative | Characteristics of the Securities | Quantity* |
Shares | Common | 382 |
Shares | Preferred | 383 |
Shares | Units: | 3.065.857 |
BDR | BSAN | 14.060 |
Base Date: 12.31.2017
(*) contemplates the balance of persons with similar status
129
13.10. Pension Plans in force, granted to members of the board and executive officers
The Company’s main retirement plan in effect is SantanderPrevi.
Participation in the Santander Previ Retirement Plan is optional and the participant’s monthly contribution shall be equivalent to 2% of the Salary* (limited to 13 UPs – R$ 5,978.31) + 2% to 9% (to be chosen) of the salary minus 13 UPs.
Such amount shall be added with a contribution amount made by the Company itself (named matching or corresponding entry) which varies from 100% to 150% over the years, as shown on the table below.

(*) Counting of time started as from merger of the Benefit policies of Grupo Santander Brasil, in June/2009.
An executive takes part in a Free Benefit Generating Plan - PGBL, established by the Company with Zurich Santander, where the Company bears the Funding of the Company Base Account, and the contribution amount is defined according to the percentage on the Applicable Salary portion.
The table below shows details made available by the Company on the amounts contributed to the SantanderPrevi retirement plan and to the supplementary plans in 2017.
| Conselho deAdministração | Diretoria Estatutária | |
| Nº de membros | 0 | 35 |
| Nome do plano | Plano de Aposentadoria daSantanderprevi | Plano de Aposentadoria daSantanderprevi e Zurich |
| Quantidade de administradores que reúnem condições para seaposentar | não se aplica | não se aplica |
| Condições para se aposentar antecipadamente | não se aplica | não se aplica |
| Valor acumulado atualizado das contribuições acumuladas até oencerramento do último exercício social, descontada a parcelarelativa às contribuições feitas diretamente pelosadministradores | 0 | 39.162.851 |
| Valor total acumulado das contribuições realizadas durante oúltimo exercício social, descontada a parcela relativa acontribuições feitas diretamente pelos administradores | 0 | 6.521.584 |
| Possibilidade de resgate antecipado e condições | não se aplica | não se aplica |
Key:
Board of Directors – Executive Board
Number of members
Name of plan
Number of administrators who qualify for retirement
Conditions for early retirement
Accumulated amount of contributions accrued up to the end of the last fiscal year, less the portion related to contributions made directly by the administrators
130
Accumulated total amount of contributions made during the last fiscal year, less the portion related to contributions made directly by the administrators
Possibility of early redemption and conditions
-----------------------
The aggregate amount on December 31, 2017 comprises the balance of the amounts contributed and redeemed up to such date.
13.11 –Maximum, minimum and medium individual remuneration of the board of directors, the executive board and the audit committee
Justification for not filling this frame:
Item not disclosed because of injunction granted by Justice of the 5th Federal Court of Rio de Janeiro, in records of case No. 2010.510102888-5, aiming to preserve safe the management members. The decision not to disclose information regarding this section was taken by the Company’s Executive Board.
13.12. Describe the contractual arrangements, insurance policies or other instruments that structure remuneration or compensation mechanisms to officers in the case of removal from a position or retirement, indicating the financial consequences to the issuer
Most managers entered into a garden leave agreement with the Company, which sets forth that the executives will undertake not to perform any professional activity in any other company or financial institution during a period of three months after termination, upon payment of a consideration by the Company. Such obligation will always be applicable in case of a voluntary termination of the executive, and at the discretion of the Company in case of an involuntary termination. The consideration corresponds to three (3) months of the monthly fixed salary of the executive.
The Company has a D&O (Directors & Officers) Liability Insurance which is renewed every year, for purposes of assuring its officers and managers the payment of indemnities resulting from claims requiring redress of damage caused to third parties or to the Company by virtue of performance of their duties. The total insurance premium paid in 2017 was of R$ 751,927,55 and the amount corresponding to year 2018 is yet to be defined.
As approved by our board of directors at the meeting held on December 23, 2009, we indemnify our directors and executive officers and members of the Audit Committee from actions that occupy their respective positions, which relate exclusively to administrative or procedural costs and to attorney's fees, except in cases of bad faith, gross negligence, willful misconduct, or maladministration by our directors or executive officers. This letter of indemnity was also disclosed to members of the audit committee and to the compensation committee.
There are no contractual arrangements, insurance policies or other instruments structuring mechanisms for remuneration or indemnification to managers in case of removal from office or retirement.
13.13. In relation to the last three (3) fiscal years, indicate the total remuneration percentage of each body recognized in the income of the issuer in reference to members of the board of directors, executive board or fiscal committee who are related parties to direct or indirect controllers, as defined by the accounting standards that treat this issue
131
In years 2015, 2016 and 2017, no payment was made to members of the Board of Directors or Executive Board who were parties related to the direct or indirect controlling shareholders of the Company.
13.14 In relation to the last three (3) fiscal years, indicate the values recognized in the income of the issuer as remuneration to the members of the board of directors, statutory board or fiscal committee, grouped by body, for any reason other than the function occupied, such as, for example, commissions and consulting or assistance services rendered
Not applicable, as there is no value recorded in the result as compensation earned by the members of the Board of Directors of the Company, Executive Board or Fiscal Council in the last three fiscal years other than as a result of the position they held.
13.15. In relation to the last 3 fiscal years, indicate the recognized values in the income of controllers, directly or indirectly, of companies under common control and controlled by issuer, such as remuneration of members of the board of directors, of the statutory board, or of the fiscal committee of the issuer, grouped by body, specifying within which meaning those values were attributed to those individuals
The members of the Board of Directors of the Company who hold executive offices at Santander Spain, the holding company of Company, as well as all other directors and officers, do not receive compensation abroad concerning the office held in Brazil.
In year 2015, three non-executive members of the Board of Directors of Company held executive offices at Santander Spain, the holding company of Company, and were paid EUR 20,908,556 as compensation for such offices.
In year 2016, three non-executive members of the Board of Directors of Company held executive offices at Santander Spain, the holding company of Company, and were paid EUR 5,376,210 as compensation for such offices.
In year 2017, three non-executive members of the Board of Directors of Company held executive offices at Santander Spain, the holding company of Company, and were paid EUR 14,829,613 as compensation for such offices.
Fiscal Year |2015 | ||||
Board of Directors | Executive Board | Fiscal Council | Total | |
Direct and indirect controlling shareholders | 20,908,556 EUR | 0 | 0 | 20,908,556 EUR |
Controlled companies of issuer | 0 | 0 | 0 | 0 |
Companies under common control | 0 | 0 | 0 | 0 |
Fiscal Year 2016 | ||||
Board of Directors | Executive Board | Audit Committee | Total | |
Direct and indirect controlling shareholders | 5,376,210 EUR | 0 | 0 | 5,376,210 EUR |
Controlled companies of issuer | 0 | 0 | 0 | 0 |
Companies under common control | 0 | 0 | 0 | 0 |
132
Fiscal Year 2017 | ||||
Board of Directors | Executive Board | Audit Committee | Total | |
Direct and indirect controlling shareholders | 14,829,613 EUR | 0 | 0 | 14,829,613 EUR |
Controlled companies of issuer | 0 | 0 | 0 | 0 |
Companies under common control | 0 | 0 | 0 | 0 |
13.16. Provide other information as deemed relevant by the issuer
There are no other information pertaining to this topic and deemed relevant by the Company which has not been described in other items of this Section 13 of the Reference Form.
__________________________________________________
133
Banco Santander (Brasil) S.A. | ||
| By: | /S/ Amancio Acurcio Gouveia | |
Amancio Acurcio Gouveia Officer Without Specific Designation | ||
| By: | /S/ Angel Santodomingo Martell | |
Angel Santodomingo Martell Vice - President Executive Officer | ||