SECURITIES AND EXCHANGE COMMISSION
Commission File Number: 001-34476
Bloco A – Vila Olimpia
São Paulo, SP 04543-011
Federative Republic of Brazil
Indicate by check mark if the registrant is submitting the Form 6-K in paper as permitted by Regulation S-T Rule 101(b)(1):
Yes _______ No ___X____
Indicate by check mark if the registrant is submitting the Form 6-K in paper as permitted by Regulation S-T Rule 101(b)(7):
Yes _______ No ___X____
Indicate by check mark whether by furnishing the information contained in this Form, the Registrant is also thereby furnishing the information to the Commission pursuant to Rule 12g3-2(b) under the Securities Exchange Act of 1934:
Yes _______ No ___X____
If “Yes” is marked, indicate below the file number assigned to the registrant in connection with Rule 12g3-2(b): N/A

Table of Contents
Managerial Analysis of Results–BR GAAP
2
All information presented in this report considers the managerial result, except where otherwise indicated. The reconciliation with the accounting result can be found on pages 27 and 28.
MANAGERIAL¹ ANALYSIS - BR GAAP | 1Q18 | 1Q17 | Var. | 1Q18 | 4Q17 | Var. |
|
| 12M |
|
| 3M | |
RESULTS (R$ million) |
|
|
|
|
|
|
Net interest income | 10,163 | 8,868 | 14.6% | 10,163 | 9,498 | 7.0% |
Fees | 4,134 | 3,709 | 11.5% | 4,134 | 4,239 | -2.5% |
Allowance for loan losses | (2,652) | (2,264) | 17.1% | (2,652) | (2,656) | -0.1% |
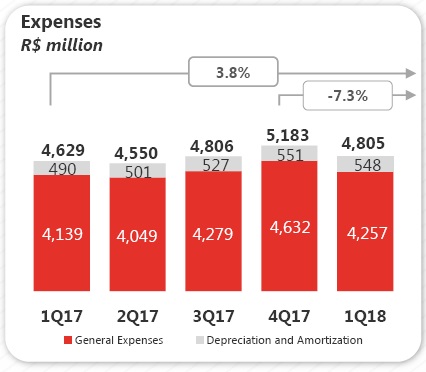
General Expenses2 | (4,805) | (4,629) | 3.8% | (4,805) | (5,183) | -7.3% |
Personnel Expenses | (2,309) | (2,200) | 4.9% | (2,309) | (2,367) | -2.4% |
Administrative Expenses | (2,496) | (2,429) | 2.8% | (2,496) | (2,816) | -11.3% |
Managerial net profit3 | 2,859 | 2,280 | 25.4% | 2,859 | 2,752 | 3.9% |
Accounting net profit | 2,820 | 1,824 | 54.6% | 2,820 | 2,498 | 12.9% |
|
|
|
|
|
|
|
BALANCE SHEET (R$ million) |
|
|
|
|
|
|
Total assets | 724,348 | 713,517 | 1.5% | 724,348 | 683,732 | 5.9% |
Securities and Derivative Financial Instruments | 193,149 | 166,131 | 16.3% | 193,149 | 171,730 | 12.5% |
Loan portfolio | 280,398 | 257,169 | 9.0% | 280,398 | 272,562 | 2.9% |
Individuals | 113,700 | 93,986 | 21.0% | 113,700 | 108,115 | 5.2% |
Consumer finance | 43,611 | 35,779 | 21.9% | 43,611 | 41,884 | 4.1% |
SMEs | 34,320 | 32,511 | 5.6% | 34,320 | 34,288 | 0.1% |
Corporate | 88,766 | 94,892 | -6.5% | 88,766 | 88,275 | 0.6% |
Expanded Loan Portfolio4 | 353,920 | 325,493 | 8.7% | 353,920 | 347,907 | 1.7% |
Funding from Clients5 | 316,818 | 300,678 | 5.4% | 316,818 | 307,619 | 3.0% |
Deposits (demand, saving and time) | 217,586 | 145,750 | 49.3% | 217,586 | 200,230 | 8.7% |
Equity6 | 61,384 | 58,994 | 4.1% | 61,384 | 58,570 | 4.8% |
|
|
|
|
|
|
|
PERFORMANCE INDICATORS (%) |
|
|
|
|
|
|
Return on average equity excluding goodwill6 - annualized | 19.1% | 15.9% | 3.2 p.p. | 19.1% | 18.3% | 0.7 p.p. |
Return on average asset excluding goodwill6 - annualized | 1.6% | 1.3% | 0.3 p.p. | 1.6% | 1.6% | 0.0 p.p. |
Efficiency ratio7 | 40.0% | 44.9% | -4.9 p.p. | 40.0% | 44.3% | -4.3 p.p. |
Recurrence ratio8 | 86.0% | 80.1% | 5.9 p.p. | 86.0% | 81.8% | 4.2 p.p. |
BIS ratio | 15.3% | 15.8% | -0.5 p.p. | 15.3% | 15.8% | -0.6 p.p. |
Tier I | 14.2% | 14.7% | -0.5 p.p. | 14.2% | 14.7% | -0.5 p.p. |
Tier II | 1.0% | 1.1% | -0.1 p.p. | 1.0% | 1.1% | -0.1 p.p. |
CET1 - Fully Loaded | 13.0% | 12.7% | 0.2 p.p. | 13.0% | 12.7% | 0.2 p.p. |
|
|
|
|
|
|
|
PORTFOLIO QUALITY INDICATORS (%) |
|
|
|
|
|
|
Delinquency ratio (over 90 days) | 2.9% | 2.9% | 0.0 p.p. | 2.9% | 3.2% | -0.2 p.p. |
Individuals | 3.7% | 4.0% | -0.2 p.p. | 3.7% | 3.7% | 0.0 p.p. |
Corporate & SMEs | 2.0% | 1.9% | 0.1 p.p. | 2.0% | 2.5% | -0.6 p.p. |
Coverage ratio (over 90 days) | 216.2% | 229.3% | -13.1 p.p. | 216.2% | 202.5% | 13.7 p.p. |
Delinquency ratio (over 60 days) | 3.6% | 3.9% | -0.3 p.p. | 3.6% | 4.0% | -0.3 p.p. |
|
|
|
|
|
|
|
OTHER DATA |
|
|
|
|
|
|
Assets under management9 - AUM (R$ million) | 298,943 | 257,362 | 16.2% | 298,943 | 292,715 | 2.1% |
Branches | 2,258 | 2,254 | 4 | 2,258 | 2,255 | 3 |
PABs (mini branches) | 1,226 | 1,166 | 60 | 1,226 | 1,211 | 15 |
Own ATMs | 13,512 | 13,679 | (167) | 13,512 | 13,522 | (10) |
Shared ATMs | 21,442 | 20,516 | 926 | 21,442 | 21,195 | 247 |
Employees10 | 48,855 | 46,897 | 1,958 | 48,855 | 47,404 | 1,451 |
1Excluding 100% of the goodwill amortization expense, the foreign exchange hedge effect and other adjustments, as described on pages 27 and 28.
2Administrative expenses exclude 100% of the goodwill amortization expense. Personnel expenses include profit-sharing.
3Managerial net profit corresponds to the corporate net profit, excluding the extraordinary result and the 100% reversal of the goodwill amortization expense that occurred in the period. Goodwill amortization expenses were R$ 69 million in 1Q18, R$ 166 million in 4Q17 and R$ 456 million in 1Q17.
4Including other credit risk transactions (debentures, FDIC, CRI, promissory notes, international distribution promissory notes, acquiring-activities related assets and guarantees).
5Including Savings, Demand Deposits, Time Deposits, Debentures, LCA, LCI, Financial Bills and Certificates of Structured Operations ("COE").
6Excluding 100% of the goodwill balance (net of amortization), which amounted to R$ 863 million in 1Q18, R$ 930 million in 4Q17 and R$ 1,703 million in 1Q17.
7Efficiency Ratio: General Expenses / (Net Interest Income + Fees + Tax Expenses + Other Operating Income/Expenses).
8 Recurrence Ratio: Fees / General Expenses.
9According to ANBIMA (Brazilian Financial and Capital Markets Association) criteria.
10As of 1Q18, it includes technology companies Produban and Isban.
3
Banco Santander Brasil is the only international bank with scale in the country. We are convinced that the best way to grow in a profitable, recurring and sustainable manner is by providing excellent services to enhance customer satisfaction levels and attract more customers, making them more loyal. Our actions are based on establishing close and long -lasting relationships with customers, suppliers and shareholders. To accomplish that goal, our purpose is to help people and businesses prosper by being a Simple, Personal and Fair Bank, guided by the following strategic priorities:
|
|
|
| |||
| Increase customer | Improve the | Be disciplined with | Boost productivity | |||
| preference and | profitability, | capital and | through an | |||
| loyalty by offering | recurrence and | liquidity to | intense agenda of | |||
| targeted, simple, | sustainability of our | preserve our | commercial | |||
| digital and | results by growing in | solidity, face | improvements | |||
| innovative | businesses with | regulatory | that enable us to | |||
| products and | greater revenue | changes and seize | offer a complete | |||
| services through a | diversification, aiming | growth | portfolio of | |||
| multi-channel | to strike a balance | opportunities. | services. | |||
| platform. | between loan, funding | |||||
| and services, while | ||||||
| maintaining a | ||||||
| preemptive risk | ||||||
| management | ||||||
| approach and | ||||||
| rigorous cost control. |


Higher profitability, underpinned by a customer -centric model, which is premised upon improving customer experience and satisfaction, remains our strategic focus. This quarter, we made progress in strengthening our internal culture, continued to consistently refine our products and services through innovative solutions, and achieved profitable market share gains. Among the initiatives in the period, we highlight:
 People
- We believe that employee engagement and commitment provide greater sustainability for our business.Hence, we highlight our actions on the following key fronts:
- Communication:Senior management closer to employees, providing opportunities for monthly dialogues.
- Meritocracy:We believe results speak louder and, for this reason, last year we paid a record amount in variable compensation to employees, which was aligned with the performance of results.
- Culture and leadership:We support the development, intrapreneurship and protagonism of our employees.
- Santander Academy:With the goal of disseminating knowledge through courses and development tools, the Academy encourages individual protagonism in the technical training of our employees. Since its launch, just over a year ago, it has already achieved prominent indicators:
(i) 73% of trainings were performed by internal multipliers;
(ii) 95% of employees participated in trainings, with more than 220 thousand mobile accesses and over 1.3 million computer accesses.
As a result of all our actions, we reached 88% engagement in 2017 and, for the second consecutive year, we ranked among the best companies to work for, according to GPTW (Great Place to Work).
 Customer loyalty:
Growing our customer base and transactionality continue to be the main drivers of our results. Thus, one year ago we implemented the Net Promoter Score* (NPS), a methodology that
* Methodology that makes daily evaluations of the likelihood of customers recommending Banco Santander based on their experience with the Bank, across the entire branch network and service channels.
4
measures customer satisfaction, which reached 49 points this quarter, improving by 5 points in twelve months, reflecting our commercial actions. We are convinced that using the NPS will contribute to the continuous improvement of the customer experience and evolution of the Financial System. As a result of our actions, the base of active current account holders has been growing for 33 consecutive months.
This quarter, we continued to make strides in strategic actions, as illustrated by the following achievements:
|
| We have completed one year of offering AAdvantage® cards, maintaining a high average activation rate. Santander Way still holds high ratings in app stores (4.8 stars on Apple and 4.5 on Google Play), and this quarter it unveiled a new feature called "Supercrédito", which allows single product customers to apply for personal loans directly from the app. This quarter, we intensified media campaigns to promote Santander Pass (NFC technology bracelet and sticker for contactless payments), enabling the possibility to request the card and Santander Pass simultaneously through our institutional portal.
In line with our strategy of improving customer experience, we launched Santander One Pay FX, a disruptive service platform that allows international transfers to individual customers based on blockchain technology. With this innovation, our customers will be able to make these transactions in a more agile, simple and safe way. |

 Retail
 Santander Broker Dealer ranked 1st in stock picking in 2018 by Brazilian newspaper Valor Econômico.
 Santander One Pay FX
1 Source: Brazilian Central Bank, as of February 2018.
5
|
| With that, we remain concentrated on offering a simpler and more agile service, with digital solutions and a better experience for customers.
On the sustainability front, Santander continues to hold a prominent spot in the Santander Prospera Microcredit Program, which totaled R$ 448 million in the loan portfolio at the end of March 2018. In the higher education segment, we have awarded around 9.7 thousand scholarships since 2015, actively contributing to the advancement of education in the country. 1 Source: Brazilian Central Bank, as of February 2018. |
 Agro
Agro Getnet
 SMEs
SMEs Strengthening leading businesses
 Sustainability:
6
| ExecutiveSummary | |
 | In the first quarter of 2018 our profitability reached 19.1%, an increase of 3.2 p.p. in twelve months, reflecting the effectiveness of our business model. As mentioned earlier, one year ago we implemented the Net Promoter Score (NPS) indicator with the mission of pursuing a high level of satisfaction among our customers in relation to the products and services we offer. We remain focused on productivity and cost control, and we reinforce our commitment to maximizing the generation of results. |
Managerial net profit totaled R$ 2,859 million in the first quarter of 2018, reaching the highest level in our history, growing 25.4% in twelve months and rising 3.9% in three months. This performance continues to be supported by an increase in our customer loyalty and greater transactionality. Total revenues amounted to R$ 14,298 million in the first quarter of 2018, advancing 13.7% in twelve months (or R$ 1,721 million) and climbing 4.1% in three months. Net interest income reached R$ 10,163 million in the first quarter of 2018, a rise of 14.6% in twelve months and growth of 7.0% in three months, due to higher revenues from loan operations and market activities. These increases compensated the lower funding revenues, which were impacted by the sharp drop in interest rates. Fees came to R$ 4,134 million, up 11.5% in twelve months, on the back of greater customer loyalty and transactionality, highlighted by revenues from credit cards and acquiring activities, current account services and insurance fees. In three months, these revenues decreased by 2.5%, attributed to the seasonality of cards and insurance in the period. | Profitability The return on average equity (ROAE), adjusted for goodwill, was 19.1%, or 3.2 p.p. higher in twelve months. This evolution illustrates the recurring growth of our total revenues and efficiency gains. Allowance for loan losses reached R$ 2,652 million in the first quarter of 2018, or a 17.1% rise in twelve months. This performance is primarily explained by higher level of recovery of written-off loans in the first quarter of 2017, which contributed to a lower level of provisions for that period. In three months, allowance for loan losses remained flat. General expenses were R$ 4,805 million in the first quarter of 2018, up 3.8% in twelve months, primarily because of higher personnel expenses, given the highlighted distribution of profit-sharing aligned to the business performance. In three months, expenses dropped by 7.3%, largely attributed to higher spending on technology and marketing in the previous quarter. The efficiency ratio was 40.0% in the quarter, reaching the best level in our history, representing improvements of 4.9 p.p. in twelve months and 4.3 p.p. in three months. |
7
 | BALANCE SHEET AND INDICATORS |
The total loan portfolio amounted to R$ 280,398 million at the end of March 2018, an increase of 9.0% in twelve months (or up 8.4%, if we disregard the foreign exchange fluctuation effect). The loan portfolio continues to outgrow our peers, which has allowed us to gain market share in a profitable manner. In three months, the portfolio expanded by 2.9%, with growth in virtually all segments, highlighted by individuals and consumer finance, which grew 5.2% and 4.1%, respectively. The corporate loan portfolio recorded a 0.6% increase in three months, while the SME portfolio remained stable in the same period. The expanded loan portfolio reached R$ 353,920 million, growing 8.7% in twelve months and increasing 1.7% in three months. Funding from clients amounted to R$ 316,818 million at the end of March 2018, climbing 5.4% in twelve months and increasing 3.0% in three months. We maintained the growth trend in time deposits, 68.1% in twelve months and 11.9% in three months, given the reduction in funding through debentures and financial bills over the last few quarters. Savings deposits rose 14.7% in twelve months and grew 2.1% in three months. | Total equity excluding R$ 863 million related to the goodwill balance, was R$ 61,384 million at the end of March 2018, up 4.1% in twelve months and 4.8% higher in three months. Quality indicators The over-90-day delinquency ratio reached 2.9% in March 2018, remaining stable in twelve months. In three months, this ratio improved by 0.2 p.p. due to the conclusion, in this quarter, of a one-off case that impacted the corporate segment during the fourth quarter of 2017. The cost of credit was 3.4% in March 2018, rising 0.3 p.p. in twelve months and down 0.1 p.p. in three months. The coverage ratio came to 216% in March 2018, decreasing 13.1 p.p. in twelve months. In three months, this ratio recorded a 13.7 p.p. increase, explained by the aforementioned one-off case. Portfolio quality indicators remain under control, supported by the effectiveness of our risk models. Capital indicators The BIS ratio stood at 15.3% in March 2018, decreasing 0.5 p.p. in twelve months and 0.6 p.p. lower in three months. The fully-loaded CET1 ratio reached 13.0%, rising 0.2 p.p. in both periods. |
8
Next, we present our analysis of the managerial results.
MANAGERIAL FINANCIAL STATEMENTS¹ | 1Q18 | 1Q17 | Var. | 1Q18 | 4Q17 | Var. |
(R$ million) |
|
| 12M |
|
| 3M |
|
|
|
|
|
|
|
Net Interest Income | 10,163 | 8,868 | 14.6% | 10,163 | 9,498 | 7.0% |
Allowance for Loan Losses | (2,652) | (2,264) | 17.1% | (2,652) | (2,656) | -0.1% |
Net Interest Income after Loan Losses | 7,511 | 6,604 | 13.7% | 7,511 | 6,843 | 9.8% |
Fees | 4,134 | 3,709 | 11.5% | 4,134 | 4,239 | -2.5% |
General Expenses | (4,805) | (4,629) | 3.8% | (4,805) | (5,183) | -7.3% |
Personnel Expenses + Profit Sharing | (2,309) | (2,200) | 4.9% | (2,309) | (2,367) | -2.4% |
Administrative Expenses² | (2,496) | (2,429) | 2.8% | (2,496) | (2,816) | -11.3% |
Tax Expenses | (964) | (906) | 6.5% | (964) | (955) | 1.0% |
Investments in Affiliates and Subsidiaries | 3 | 5 | n.a. | 3 | (1) | n.a. |
Other Operating Income/Expenses | (1,334) | (1,372) | -2.8% | (1,334) | (1,084) | 23.0% |
Operating Income | 4,545 | 3,411 | 33.2% | 4,545 | 3,859 | 17.8% |
Non Operating Income | 13 | (68) | n.a. | 13 | 53 | n.a. |
Net Profit before Tax | 4,557 | 3,343 | 36.3% | 4,557 | 3,912 | 16.5% |
Income Tax and Social Contribution | (1,615) | (973) | 66.0% | (1,615) | (1,067) | 51.4% |
Minority Interest | (83) | (90) | -7.0% | (83) | (93) | -10.7% |
Net Profit | 2,859 | 2,280 | 25.4% | 2,859 | 2,752 | 3.9% |
1 Excluding 100% of the goodwill amortization expense, foreign exchange hedge effect and other adjustments, as described on page 27 and 28.
2 Excluding 100% of the goodwill amortization expense.
Net Interest Income Net interest income totaled R$ 10,163 million in the first quarter of 2018, which represents increases of 14.6% in twelve months (or R$ 1,296 million) and 7.0% in three months. Revenues from loan operations advanced 20.0% in twelve months and 2.9% in three months. This positive performance reflects an increase in the average loan portfolio volume and the positive effect of a greater contribution from retail in the results. Funding revenues fell by 17.6% in twelve months and 23.6% in three months. These figures are primarily explained by the interest rate reduction in the period, as well as by changes in the segment mix. "Other" interest income, which comprises the result of the structural gap in the balance sheet interest rate and activities with treasury clients, among others, expanded by 15.1% in twelve months and 37.8% in three months, owing to higher revenue from market activities, which are volatile by nature. |
|

9
NET INTEREST INCOME | 1Q18 | 1Q17 | Var. | 1Q18 | 4Q17 | Var. |
(R$ million) |
|
| 12M |
|
| 3M |
Net Interest Income | 10,163 | 8,868 | 14.6% | 10,163 | 9,498 | 7.0% |
Loan | 6,709 | 5,590 | 20.0% | 6,709 | 6,522 | 2.9% |
Average volume | 271,035 | 252,657 | 7.3% | 271,035 | 266,917 | 1.5% |
Spread (Annualized) | 10.0% | 8.9% | 1.2 p.p. | 10.0% | 9.7% | 0.3 p.p. |
Funding | 805 | 977 | -17.6% | 805 | 1,054 | -23.6% |
Average volume | 269,042 | 234,831 | 14.6% | 269,042 | 271,981 | -1.1% |
Spread (Annualized) | 1.2% | 1.7% | -0.5 p.p. | 1.2% | 1.6% | -0.4 p.p. |
Other¹ | 2,649 | 2,302 | 15.1% | 2,649 | 1,922 | 37.8% |
¹ Including other margins and the result from financial transactions.
Fees–Revenues from Banking Services Revenues from banking services and fees totaled R$ 4,134 million in the first quarter of 2018, rising 11.5% in twelve months and declining 2.5% in three months, primarily due to the seasonality of cards and insurance. Cards and acquiring fees totaled R$ 1,360 million in the quarter, a growth of 17.8% in twelve months, as result of an increase in average turnover, driven by the innovations and partnerships we made over the last year. In three months, these revenues went down 3.5%, owing to the seasonal effect of year-end sales. Current account service fees came to R$ 798 million, advancing 22.0% in twelve months and 4.4% in three months. The performance in both periods stems from greater customer transactionality and increase in our customer base. |
Insurance fees stood at R$ 662 million in the first quarter of 2018, climbing 12.6% in twelve months. In three months, these revenues declined by 8.2%, impacted by the seasonal effect of policy renewals, which are concentrated in the fourth quarter of the year. Collection services reached R$ 373 million in the quarter, representing growth of 7.2% in twelve months and 2.2% in three month. Securities placement, custody and brokerage fees totaled R$ 162 million in the first quarter of 2018, decreasing by 9.6% in twelve months and 19.3% in three months. This result reflects a lower activity in the capital market. |

¹ Including Revenues from Asset Management, Securities Placement, Custody and Brokerage Services and Others. For more details, please refer to the Table of Revenues from Banking Services and Fees on page 11.
10
FEES INCOME | 1Q18 | 1Q17 | Var. | 1Q18 | 4Q17 | Var. |
(R$ million) |
|
| 12M |
|
| 3M |
Cards and Acquiring | 1,360 | 1,154 | 17.8% | 1,360 | 1,410 | -3.5% |
Insurance fees | 662 | 588 | 12.6% | 662 | 721 | -8.2% |
Current Account Services | 798 | 654 | 22.0% | 798 | 764 | 4.4% |
Asset Management | 252 | 263 | -4.3% | 252 | 249 | 1.2% |
Lending Operations | 386 | 370 | 4.2% | 386 | 373 | 3.4% |
Collection Services | 373 | 348 | 7.2% | 373 | 365 | 2.2% |
Placement, Custody and Brokerage of Securities | 162 | 179 | -9.6% | 162 | 200 | -19.3% |
Other | 143 | 153 | -6.8% | 143 | 157 | -9.1% |
Total | 4,134 | 3,709 | 11.5% | 4,134 | 4,239 | -2.5% |
General Expenses (Administrative + Personnel) General expenses, including depreciation and amortization, came to R$ 4,805 million in the first quarter of 2018, rising 3.8% (or R$ 176 million) in twelve months, primarily because of higher personnel expenses, given the highlighted distribution of profit-sharing aligned to the business performance. In three months, these expenses fell by 7.3%, largely attributed to higher administrative expenses in the fourth quarter of 2017.Administrative and personnel expenses, excluding depreciation and amortization, totaled R$ 4,257 million in the first quarter of 2018, meaning a growth of 2.9% in twelve months and a 8.1% reduction in three months. Personnel expenses, including profit-sharing, amounted to R$ 2,309 million in the first quarter of 2018, rising 4.9% in twelve months (or R$ 109 million), mostly owing to higher profit-sharing payments, aligned with the performance of results. In three months, expenses fell by 2.4%, largely explained by higher variable compensation expenses, which were concentrated in the last quarter of the year. Administrative expenses, excluding depreciation and amortization, stood at R$ 1,948 million in the first quarter of 2018, growing 0.5% in twelve months (or R$ 10 million). In three months, these expenses were 14.0% lower (or R$ 317 million), given higher expenses in the fourth quarter of 2017 from data processing to support the new level of transactions, and increased advertising expenses due to marketing campaigns in the period. Depreciation and amortization expenses were R$ 548 million, up 11.8% in twelve months and down 0.5% in three months. |
|
11
The efficiency ratio reached 40.0% in the first quarter of 2018, showing improvements of 4.9 p.p. in twelve months and 4.3 p.p. in three months, reaching the best level in our history. |
|

EXPENSES' BREAKDOWN | 1Q18 | 1Q17 | Var. | 1Q18 | 4Q17 | Var. |
(R$ million) |
|
| 12M |
|
| 3M |
Outsourced and Specialized Services | 515 | 631 | -18.4% | 515 | 494 | 4.2% |
Advertising, promotions and publicity | 99 | 66 | 49.8% | 99 | 218 | -54.4% |
Data processing³ | 518 | 428 | 21.2% | 518 | 678 | -23.6% |
Communications | 104 | 110 | -6.2% | 104 | 109 | -4.7% |
Rentals | 181 | 185 | -2.4% | 181 | 180 | 0.4% |
Transport and Travel | 40 | 42 | -4.7% | 40 | 42 | -5.0% |
Security and Surveillance | 154 | 150 | 3.1% | 154 | 159 | -3.1% |
Maintenance | 59 | 57 | 4.3% | 59 | 62 | -4.0% |
Financial System Services | 78 | 68 | 14.6% | 78 | 74 | 5.8% |
Water, Electricity and Gas | 49 | 50 | -2.1% | 49 | 47 | 5.3% |
Material | 13 | 13 | 5.1% | 13 | 18 | -26.6% |
Other | 137 | 137 | -0.6% | 137 | 184 | -25.7% |
Subtotal | 1,948 | 1,938 | 0.5% | 1,948 | 2,265 | -14.0% |
Depreciation and Amortization¹ | 548 | 490 | 11.8% | 548 | 551 | -0.5% |
Total Administrative Expenses | 2,496 | 2,429 | 2.8% | 2,496 | 2,816 | -11.3% |
Compensation² | 1,489 | 1,426 | 4.4% | 1,489 | 1,597 | -6.8% |
Charges | 445 | 401 | 11.1% | 445 | 429 | 3.8% |
Benefits | 362 | 355 | 1.8% | 362 | 316 | 14.4% |
Training | 11 | 9 | 26.0% | 11 | 22 | -49.3% |
Other | 2 | 9 | n.a. | 2 | 3 | n.a. |
Total Personnel Expenses³ | 2,309 | 2,200 | 4.9% | 2,309 | 2,367 | -2.4% |
Administrative + Personnel Expenses | 4,257 | 4,139 | 2.9% | 4,257 | 4,632 | -8.1% |
Total General Expenses | 4,805 | 4,629 | 3.8% | 4,805 | 5,183 | -7.3% |
1 Excluding 100% of the goodwill amortization expenses, which totaled R$ 69 million in 1Q18 , R$ 166 million in 4Q17 and R$ 456 million in 1Q17.
2 Including Profit-Sharing.
3 As of 1Q18, expenses for Isban Brasil S.A. and Produban Serviços de Informática S.A., which were previously consolidated in the Data processing expense line, will be recorded as Personnel and Administrative Expenses under the General Expenses line. For more information, please refer to the Material Fact - Acquisition of Isban Brasil S.A. and Produban Serviços de Informática S.A., released on February 20th, 2018.
12
Allowance for Loan Losses Allowance for loan losses totaled R$ 2,652 million in the first quarter of 2018, advancing 17.1% in twelve months (or R$ 388 million) and remained flat in three months. Provision for loan losses amounted to R$ 3,204 million in the first quarter of 2018, meaning an increase of 5.0% in twelve months (or R$ 152 million), mostly explained by the loan portfolio growth in the period. In three months, provision for loan losses declined by 3.0%. Income from the recovery of written-off loans came to R$ 552 million in the first quarter of 2018, representing a 30.0% decrease in twelve months and 14.7% in three months, affected by higher income from the recovery of written-off loans in the first and fourth quarter of 2017, respectively. |
|

Other Operating Income and Expenses
Other net operating income and expenses came to R$ 1,334 million in the first quarter of 2018.
OTHER OPERATING INCOME (EXPENSES) | 1Q18 | 1Q17 | Var. | 1Q18 | 4Q17 | Var. |
(R$ million) |
|
| 12M |
|
| 3M |
|
|
|
|
|
|
|
Expenses from credit cards | (477) | (398) | 19.9% | (477) | (507) | -5.9% |
Net Income from Capitalization | 94 | 88 | 6.4% | 94 | 87 | 7.6% |
Provisions for contingencies¹ | (272) | (524) | -48.0% | (272) | (518) | -47.5% |
Other | (678) | (539) | 25.9% | (678) | (146) | n.a |
Other operating income (expenses) | (1,334) | (1,372) | -2.8% | (1,334) | (1,084) | 23.0% |
1 Including tax, civil and labor provisions.
13
Balance Sheet
Total assets reached R$ 724,348 million at the end of March 2018, growing 1.5% in twelve months and rising 5.9% in three months. Total equity was R$ 62,247 million in the same period. Excluding the goodwill balance, total equity stood at R$ 61,384 million.
ASSETS | Mar/18 | Mar/17 | Var. | Dec/17 | Var. |
(R$ million) |
|
| 12M |
| 3M |
Current Assets and Long-term Assets | 713,329 | 701,088 | 1.7% | 672,561 | 6.1% |
Cash and Cash Equivalents | 10,658 | 5,405 | 97.2% | 11,234 | -5.1% |
Interbank Investments | 44,335 | 52,642 | -15.8% | 46,761 | -5.2% |
Money Market Investments | 38,570 | 38,271 | 0.8% | 34,484 | 11.8% |
Interbank Deposits | 2,933 | 1,350 | 117.3% | 2,862 | 2.5% |
Foreign Currency Investments | 2,832 | 13,022 | -78.3% | 9,415 | -69.9% |
Securities and Derivative Financial Instruments | 193,149 | 166,131 | 16.3% | 171,730 | 12.5% |
Own Portfolio | 66,357 | 42,842 | 54.9% | 59,203 | 12.1% |
Subject to Repurchase Commitments | 84,346 | 73,180 | 15.3% | 71,038 | 18.7% |
Posted to Central Bank of Brazil | 2,086 | 2,634 | -20.8% | 2,368 | -11.9% |
Pledged in Guarantees | 15,612 | 22,491 | -30.6% | 12,483 | 25.1% |
Other | 24,748 | 24,984 | -0.9% | 26,637 | -7.1% |
Interbank Accounts | 81,953 | 64,369 | 27.3% | 82,504 | -0.7% |
Restricted Deposits: | 61,872 | 61,920 | -0.1% | 63,057 | -1.9% |
-Central Bank of Brazil | 61,601 | 61,751 | -0.2% | 62,781 | -1.9% |
-National Housing System | 272 | 169 | 60.8% | 276 | -1.5% |
Other | 20,081 | 2,449 | n.a. | 19,447 | n.a. |
Lending Operations | 262,811 | 240,629 | 9.2% | 255,486 | 2.9% |
Lending Operations | 280,459 | 257,187 | 9.0% | 272,642 | 2.9% |
Lending Operations Related to Assignment | 99 | 526 | -81.2% | 306 | -67.6% |
(Allowance for Loan Losses) | (17,747) | (17,084) | 3.9% | (17,462) | 1.6% |
Other Receivables | 117,606 | 169,123 | -30.5% | 102,540 | 14.7% |
Foreign Exchange Portfolio | 69,846 | 108,323 | -35.5% | 55,048 | 26.9% |
Income Receivable | 25,661 | 26,490 | -3.1% | 26,160 | -1.9% |
Other | 22,099 | 34,309 | -35.6% | 21,332 | 3.6% |
Other Assets | 2,816 | 2,788 | 1.0% | 2,306 | 22.1% |
Permanent Assets | 11,019 | 12,430 | -11.3% | 11,172 | -1.4% |
Temporary Assets | 434 | 379 | 14.4% | 371 | 17.0% |
Fixed Assets | 6,305 | 7,238 | -12.9% | 6,396 | -1.4% |
Intangibles | 4,281 | 4,812 | -11.0% | 4,405 | -2.8% |
Goodwill net of amortization | 863 | 1,703 | -49.3% | 930 | -7.2% |
Other Assets | 3,418 | 3,109 | 9.9% | 3,475 | -1.6% |
Total Assets | 724,348 | 713,517 | 1.5% | 683,732 | 5.9% |
Total Assets (excluding goodwill) | 723,485 | 711,814 | 1.6% | 682,802 | 6.0% |
14
LIABILITIES | Mar/18 | Mar/17 | Var. | Dec/17 | Var. |
(R$ million) |
|
| 12M |
| 3M |
Current Liabilities and Long-term Liabilities | 659,629 | 649,710 | 1.5% | 621,824 | 6.1% |
Deposits | 221,268 | 148,012 | 49.5% | 203,532 | 8.7% |
Demand Deposits | 16,799 | 14,824 | 13.3% | 17,177 | -2.2% |
Savings Deposits | 41,409 | 36,114 | 14.7% | 40,572 | 2.1% |
Interbank Deposits | 3,678 | 2,262 | 62.6% | 3,292 | 11.7% |
Time Deposits and Others | 159,382 | 94,813 | 68.1% | 142,491 | 11.9% |
Money Market Funding | 134,834 | 160,419 | -15.9% | 129,962 | 3.7% |
Own Portfolio | 99,791 | 131,591 | -24.2% | 97,173 | 2.7% |
Third Parties | 2,223 | 971 | 128.8% | 258 | n.a. |
Free Portfolio | 32,820 | 27,856 | 17.8% | 32,531 | 0.9% |
Funds from Acceptance and Issuance of Securities | 81,441 | 95,009 | -14.3% | 76,656 | 6.2% |
Resources from Real Estate Credit Notes, Mortgage Notes, Credit and Similar | 73,958 | 89,096 | -17.0% | 71,496 | 3.4% |
Funding from Certificates of Structured Operations | 2,225 | 1,270 | 75.2% | 1,990 | 11.8% |
Securities Issued Abroad | 4,035 | 3,494 | 15.5% | 1,993 | 102.5% |
Other | 1,223 | 1,149 | 6.4% | 1,177 | 3.9% |
Interbank Accounts | 1,752 | 1,390 | 26.0% | 264 | n.a. |
Interbranch Accounts | 2,879 | 2,210 | 30.3% | 4,275 | -32.6% |
Borrowings | 32,231 | 28,040 | 14.9% | 33,471 | -3.7% |
Domestic Onlendings - Official Institutions | 15,592 | 16,772 | -7.0% | 16,636 | -6.3% |
National Economic and Social Development Bank (BNDES) | 8,722 | 9,715 | -10.2% | 9,460 | -7.8% |
National Equipment Financing Authority (FINAME) | 6,513 | 6,765 | -3.7% | 6,845 | -4.8% |
Other Institutions | 357 | 292 | 22.0% | 330 | 8.0% |
Derivative Financial Instruments | 21,072 | 21,794 | -3.3% | 20,681 | 1.9% |
Other Payables | 148,560 | 176,064 | -15.6% | 136,347 | 9.0% |
Foreign Exchange Portfolio | 69,639 | 107,967 | -35.5% | 55,318 | 25.9% |
Tax and Social Security | 4,332 | 12,170 | -64.4% | 4,870 | -11.1% |
Subordinated Debts | 534 | 481 | 10.9% | 519 | 2.8% |
Debt Instruments Eligible to Compose Capital | 8,407 | 8,014 | 4.9% | 8,440 | -0.4% |
Other | 65,649 | 47,433 | 38.4% | 67,200 | -2.3% |
Deferred Income | 470 | 543 | -13.4% | 511 | -8.1% |
Minority Interest | 2,002 | 2,566 | -22.0% | 1,897 | 5.5% |
Equity | 62,247 | 60,698 | 2.6% | 59,500 | 4.6% |
Total Liabilities | 724,348 | 713,517 | 1.5% | 683,732 | 5.9% |
Equity (excluding goodwill) | 61,384 | 58,994 | 4.1% | 58,570 | 4.8% |
Securities
Total securities amounted to R$ 193,149 million at the end of March 2018, climbing 16.3% in twelve months and advancing 12.5% in three months, with both periods being influenced by growth in public securities.
SECURITIES | Mar/18 | Mar/17 | Var. | Dec/17 | Var. |
(R$ million) |
|
| 12M |
| 3M |
Public securities | 152,051 | 122,479 | 24.1% | 130,106 | 16.9% |
Private securities | 19,402 | 18,672 | 3.9% | 20,080 | -3.4% |
Financial instruments | 21,696 | 24,981 | -13.1% | 21,544 | 0.7% |
Total | 193,149 | 166,131 | 16.3% | 171,730 | 12.5% |
15
Loan Portfolio
The loan portfolio totaled R$ 280,398 million at the end of March 2018, growing 9.0% in twelve months (or increase of 8.4% disregarding the impact of the exchange rate fluctuation) and expanding by 2.9% in three months. Over the past few quarters, we have outperformed the market, primarily due to the individuals and consumer finance portfolios, which - on an annual comparison basis - have been exceeding our total portfolio growth for nine consecutive quarters.
The expanded loan portfolio, which includes other credit risk transactions, acquiring-activities related assets and guarantees, totaled R$ 353,920 million at the end of March 2018, a 8.7% increase in twelve months (or increase of 8.3% disregarding the impact of the exchange rate fluctuation) and growth of 1.7% in three months.
The balance of the foreign currency portfolio, including dollar-indexed loans, was R$ 32,271 million at the end of March 2018, an increase of 1.5% relative to the balance of R$ 31,790 million recorded in March 2017 and growth of 11.6% compared to the balance of R$ 28,904 million in December 2017.
MANAGERIAL BREAKDOWN OF CREDIT BY SEGMENT | Mar/18 | Mar/17 | Var. | Dec/17 | Var. |
(R$ million) |
|
| 12M |
| 3M |
|
|
|
|
|
|
Individuals | 113,700 | 93,986 | 21.0% | 108,115 | 5.2% |
Consumer Finance | 43,611 | 35,779 | 21.9% | 41,884 | 4.1% |
SMEs | 34,320 | 32,511 | 5.6% | 34,288 | 0.1% |
Corporate | 88,766 | 94,892 | -6.5% | 88,275 | 0.6% |
Total portfolio | 280,398 | 257,169 | 9.0% | 272,562 | 2.9% |
Other credit related transactions¹ | 73,522 | 68,324 | 7.6% | 75,345 | -2.4% |
Total expanded credit portfolio | 353,920 | 325,493 | 8.7% | 347,907 | 1.7% |
¹ Including debentures, FIDC, CRI, promissory notes, international distribution promissory notes, acquiring-activities related assets and guarantees.
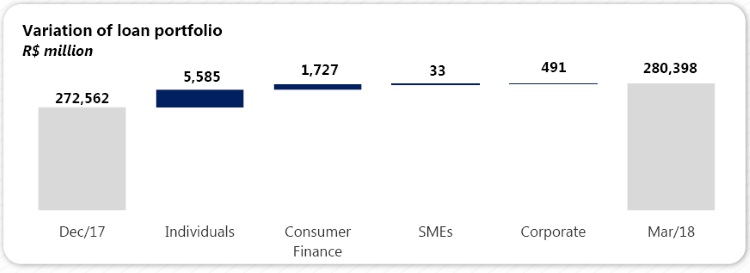
In three months, growth in our loan portfolio was mostly influenced by the Individuals and Consumer Finance portfolios, as mentioned. This quarter, we recorded growth in the Corporate portfolio, while the SMEs portfolio remained stable.
16
In the first quarter of 2018, the Corporate portfolio accounted for 31.7% of the total portfolio, a reduction of 5.2 p.p. in twelve months. On the other hand, the Individuals portfolio reached a 40.5% share of the total portfolio, rising 4.0 p.p. in twelve months, while the Consumer Finance portfolio represented 15.6% of the portfolio, growing 1.6 p.p. in comparison with the previous year. The SMEs portfolio accounted for 12.2% of the portfolio, down 0.4 p.p. in twelve months.

Loans to Individuals Loans to individuals amounted to R$ 113,700 million at the end of March 2018, expanding by 21.0% (or R$ 19,714 million) in twelve months, as credit card and payroll loans remain the highlights fueling growth in the loan portfolio. In three months, loans to individuals increased by 5.2%, mainly influenced by payroll loans. The payroll loans portfolio came to R$ 28,449 million, climbing 39.0% in twelve months (or R$ 7,980 million) and 11.1% in three months. This product continues to be the top performer, driven by the retail performance and the digital channel experience. The credit card portfolio reached R$ 24,422 million, representing growth of 20.2% in twelve months (or R$ 4,102 million) as consequence of the continuous announcement of partnerships and launch of innovative solutions. In three months, the portfolio remained stable, affected by the seasonal effect of year-end sales. The mortgage loan balance was R$ 29,117 million, expanding by 7.6% in twelve months and rising 3.6% in three months. We remain focused on offering simpler and faster services, with digital solutions to provide an improved experience for our customers. | |

17
| Consumer Finance | |
The consumer finance portfolio, which is originated outside the branch network, totaled R$ 43,611 million at the end of March 2018, growing 21.9% in twelve months (or R$ 7,833 million) and 4.1% in three months. Of this total portfolio, R$ 36,292 million refers to vehicle financing for individuals, showing an increase of 22.4% in twelve months. The total vehicle portfolio for individuals, which includes operations carried out by both the financing unit (correspondent banks) as well as by Santander's branch network, climbed 21.4% in twelve months and 5.4% in three months, amounting to R$ 38,185 million in March 2018. Growth in the portfolio reflects the increase in our sales, mainly owing to our vehicle financing platform (+Negócios), which continued to experience a strong rise of 33% in unique simulations compared to March 2017. As mentioned (page 06), in this quarter we launched the Cockpit platform, which reinforces our focus on offering a simpler and more agile service, with digital solutions and a better experience for our customers. |
|

Corporate & SMEs Loans
The Corporate & SMEs loan portfolio stood at R$ 123,086 million in March 2018, down 3.4% in twelve months (or R$ 4,318 million) and up 0.4% in three months.
| The Corporate loan portfolio totaled R$ 88,766 million, falling 6.5% (or R$ 6,126 million) in twelve months and growing 0.6% in three months (decreasing 7.9% in twelve months and advancing 0.4% in three months, disregarding the effect of exchange rate fluctuation). Loans to the SMEs segment amounted to R$ 34,320 million, representing increases of 5.6% (or R$ 1,809 million) in twelve months and 0.1% in three months. In line with our purpose of helping people and businesses prosper, we continue to strengthen our commitment to this segment with differentiated offerings, such as "Conta Integrada" and "Programa Avançar". On top of that, we also broadened the scope of our specialized services and focused on sector-oriented offers. All these actions, associated with the rebound in economic activity, place us in an even better position to expand our portfolio, as well as to increase our customer base and loyalty. |

18
Individuals and Corporate & SMEs Loan Portfolio by Product
MANAGERIAL BREAKDOWN OF CREDIT | Mar/18 | Mar/17 | Var. | Dec/17 | Var. |
PORTFOLIO BY PRODUCT(R$ million) |
|
| 12M |
| 3M |
Individuals |
|
|
|
|
|
Leasing / Auto Loans¹ | 1,893 | 1,823 | 3.9% | 1,852 | 2.3% |
Credit Card | 24,422 | 20,320 | 20.2% | 24,421 | 0.0% |
Payroll Loans | 28,449 | 20,469 | 39.0% | 25,616 | 11.1% |
Mortgages | 29,117 | 27,059 | 7.6% | 28,112 | 3.6% |
Agricultural Loans | 5,329 | 3,860 | 38.1% | 5,239 | 1.7% |
Personal Loans / Others | 24,490 | 20,456 | 19.7% | 22,875 | 7.1% |
Total Individuals | 113,700 | 93,986 | 21.0% | 108,115 | 5.2% |
Consumer Finance | 43,611 | 35,779 | 21.9% | 41,884 | 4.1% |
Corporate and SMEs |
|
|
|
|
|
Leasing / Auto Loans | 2,852 | 2,737 | 4.2% | 2,784 | 2.4% |
Real Estate | 5,802 | 8,808 | -34.1% | 6,577 | -11.8% |
Trade Finance | 24,256 | 22,815 | 6.3% | 17,379 | 39.6% |
On-lending | 11,119 | 11,017 | 0.9% | 13,919 | -20.1% |
Agricultural Loans | 6,271 | 6,772 | -7.4% | 6,320 | -0.8% |
Working capital / Others | 72,787 | 75,254 | -3.3% | 75,584 | -3.7% |
Total Corporate and SMEs | 123,086 | 127,404 | -3.4% | 122,563 | 0.4% |
Total Credit | 280,398 | 257,169 | 9.0% | 272,562 | 2.9% |
Other Credit Risk Transactions with customers² | 73,522 | 68,324 | 7.6% | 75,345 | -2.4% |
Total Expanded Credit Portfolio | 353,920 | 325,493 | 8.7% | 347,907 | 1.7% |
1 Including consumer finance, the auto loan portfolio for individuals totaled R$ 38,185 million in Mar/18 , R$ 36,238 million in Dec/17 and R$ 31,465 million in Mar/17.
2 Including debentures, FIDC, CRI, promissory notes, international distribution promissory notes, acquiring-activities related assets and guarantees.
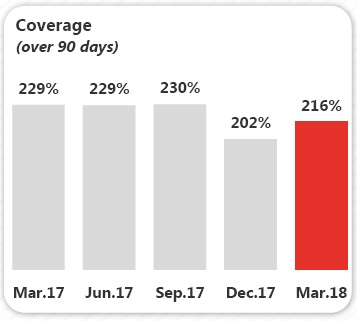
Coverage Ratio The balance of allowance for loan losses amounted to R$ 17,747 million at the end of March 2018, increasing 3.9% in twelve months and up 1.6% in three months. Our performance reflects the solid management of our risk models. The coverage ratio reached 216% at the end of March 2018, with a decline of 13.1 p.p. in twelve months. In three months, the ratio rose 13.7 p.p. due to the conclusion, in this quarter, of the one-off case in the corporate segment that impacted this indicator in the fourth quarter of 2017. |
19
Renegotiated Loan Portfolio Loan renegotiations totaled R$ 13,772 million at the end of March 2018, increasing by 4.6% in twelve months and 0.9% in three months. These operations comprise loan agreements that were renegotiated to enable their payment under conditions agreed upon with customers, including renegotiations of loans that had already been written-off in the past. At the end of March 2018, the coverage ratio of the renegotiated portfolio reached 58.0%, a level considered adequate for these types of operations, and remained stable relative to the previous quarter. |
|
| Credit Portfolio by Risk Level We operate in accordance with our risk culture and international best practices, in order to protect our capital and guarantee the profitability of our businesses. Our credit approval process, particularly the approval of new loans and risk monitoring, is structured according to our classification of customers and products, centered around our retail and wholesale segments. At the end of March 2018, portfolios rated "AA" and "A" accounted for 76% of the total loan portfolio. |
NPL Formation NPL Formation came to R$ 2,707 million, declining 1.5% in twelve months. In three months, this ratio was 28.9% lower due to the impact of a one-off case in the Corporate segment in the fourth quarter of 2017. The ratio between NPL Formation and the loan portfolio reached 1.0%, down 0.1 p.p. in twelve months and falling 0.4 p.p. in three months. |
|


Note: NPL Formation is obtained from the change in balance of the non-performed portfolio over 90 days and the loan book under renegotiation, disregarding the portfolio written-off as loss in the period.
20
Delinquency Ratio (Over-90-Day) The over-90-day delinquency ratio reached 2.9% at the end of March 2018, stable in comparison with the same quarter of last year and 0.2 p.p. lower in three months. This reduction is due to the conclusion, in this quarter, of the one-off case in the corporate segment that impacted the fourth quarter of 2017. Portfolio quality indicators remain under control, supported by the effectiveness of our risk models. Delinquency in the Corporate and SMEs segment came to 2.0% in the period, a increase of 0.1 p.p. in twelve months. In three months, this ratio decreased 0.6 p.p., explained by the conclusion of the one-off case that took place in the final quarter of last year, as noted above. Among Individuals, this delinquency ratio stood at 3.7%, falling 0.2 p.p. in twelve months and remaining stable in three months. | 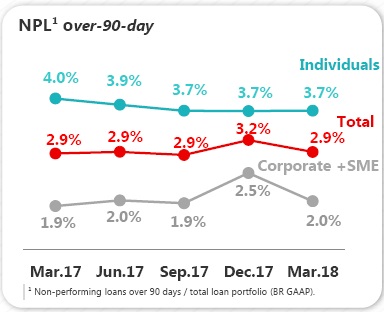 |
| Delinquency Ratio (15-to-90 Day) The 15-to-90-day delinquency ratio stood at 4.3% at the end of March 2018, down 1.3 p.p. in twelve months and rising 0.1 p.p. in three months. The yearly improvement reflects our active and preemptive risk management, with deeper knowledge of the customer life cycle. Individuals' delinquency decreased by 0.9 p.p. in twelve months. In three months, this indicator went up 0.3 p.p., reaching 6.0% owing to the typical early-year seasonality in this segment. In the Corporate & SMEs segment, this ratio dropped by 2.0 p.p. in twelve months and was 0.2 p.p. lower in three months, at 2.2%. |

21
Funding
FUNDING | Mar/18 | Mar/17 | Var. | Dec/17 | Var. |
(R$ million) |
|
| 12M |
| 3M |
Demand deposits | 16,799 | 14,824 | 13.3% | 17,177 | -2.2% |
Saving deposits | 41,409 | 36,114 | 14.7% | 40,572 | 2.1% |
Time deposits | 159,378 | 94,813 | 68.1% | 142,481 | 11.9% |
Debenture/LCI/LCA¹ | 59,651 | 96,261 | -38.0% | 70,470 | -15.4% |
Financial Bills² | 39,581 | 58,667 | -32.5% | 36,918 | 7.2% |
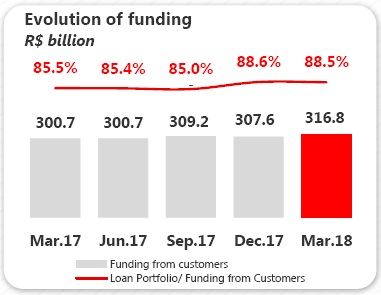
Funding from clients | 316,818 | 300,678 | 5.4% | 307,619 | 3.0% |
1 Repo operations backed by Debentures, Real Estate Credit Notes (LCI) and Agricultural Credit Notes (LCA).
2 Including Certificates of Structured Operations (COE).
Total customer funding amounted to R$ 316,818 million at the end of March 2018, growing 5.4% in twelve months (or R$ 16,140 million) and advancing 3.0% in three months. Time deposits rose 68.1% in twelve months and 11.9% in three months, primarily owing to the reduction in funding through financial bills and the Brazilian Central Bank's Resolution (nº 4,527), in effect since May 2017, which impacted debentures in the period. Savings deposits went up 14.7% in twelve months and 2.1% in three months.
Credit/Funding Ratio
FUNDING VS. CREDIT | Mar/18 | Mar/17 | Var. | Dec/17 | Var. |
(R$ million) |
|
| 12M |
| 3M |
Funding from customers (A) | 316,818 | 300,678 | 5.4% | 307,619 | 3.0% |
(-) Reserve Requirements | (61,601) | (61,751) | -0.2% | (62,781) | -1.9% |
Funding Net of Reserve Requirements | 255,217 | 238,927 | 6.8% | 244,838 | 4.2% |
Borrowing and Onlendings | 16,207 | 17,212 | -5.8% | 17,251 | -6.0% |
Subordinated Debts | 8,940 | 8,495 | 5.2% | 8,959 | -0.2% |
Offshore Funding | 35,651 | 31,095 | 14.7% | 34,848 | 2.3% |
Total Funding (B) | 316,016 | 295,728 | 6.9% | 305,895 | 3.3% |
Assets under management¹ | 298,943 | 257,362 | 16.2% | 292,715 | 2.1% |
Total Funding and Asset under management | 614,959 | 553,090 | 11.2% | 598,611 | 2.7% |
Total Credit (C) | 280,398 | 257,169 | 9.0% | 272,562 | 2.9% |
C / B (%) | 88.7% | 87.0% |
| 89.1% |
|
C / A (%) | 88.5% | 85.5% |
| 88.6% |
|
1 According to ANBIMA criteria.
The loan portfolio to customer funding ratio was 88.5% at the end of March 2018, meaning a 3.0 p.p. increase in twelve months and a 0.1 p.p. reduction in three months. The liquidity metric adjusted for the impact of reserve requirements and medium/long-term funding came to 88.7% in March of 2018, growing 1.7 p.p. in twelve months and falling 0.4 p.p. in three months. The Bank is in a comfortable liquidity situation, with stable funding sources and an adequate funding structure. |
|
22
BIS Ratio The BIS ratio reached 15.3% at the end of March 2018, a reduction of 0.5 p.p. in twelve months and of 0.6 p.p. in three months. The change in the BIS ratio in both periods is primarily explained by the impact on capital deductions under the Basel III schedule, from 80% in 2017 to 100% in 2018. It is worth noting that BIS ratio is 4.2 p.p. higher than the sum of the minimum Regulatory Capital and Capital Conservation requirements. It is important to note that, in January 2018, the capital requirement changed from 9.25% to 8.625% + conservation capital of 1.875% + additional CET1 for systemically important financial institutions in the Brazilian market of 0.5%, totaling 11%. Tier Capital I is 8.375% and CET1 is 6.875%. CET1 (Fully Loaded) stood at 13.0%, up by 0.2 p.p. for both periods. |  |
In March 2013, the Brazilian Central Bank issued the Basel III rules of capital definition and risk management. These criteria will be implemented gradually by 2019. If we were to apply these Basel III rules immediately and in full, our CET1 would have reached 13.0 % in March 2018.
OWN RESOURCES AND BIS | Mar/18 | Mar/17 | Var. | Dec/17 | Var. |
(R$ million) |
|
| 12M |
| 3M |
Tier I Regulatory Capital | 57,799 | 57,773 | 0.0% | 56,386 | 2.5% |
CET1 | 53,590 | 53,761 | -0.3% | 52,197 | 2.7% |
Additional Tier I | 4,209 | 4,012 | 4.9% | 4,189 | 0.5% |
Tier II Regulatory Capital | 4,198 | 4,098 | 2.4% | 4,250 | -1.2% |
Adjusted Regulatory Capital (Tier I and II) | 61,997 | 61,871 | 0.2% | 60,636 | 2.2% |
Risk Weighted Assets (RWA) | 405,945 | 392,503 | 3.4% | 383,133 | 6.0% |
Required Regulatory Capital | 35,013 | 36,306 | -3.6% | 35,440 | -1.2% |
Adjusted Credit Risk Capital requirement | 28,989 | 29,162 | -0.6% | 30,034 | -3.5% |
Market Risk Capital requirement | 2,800 | 4,192 | -33.2% | 2,392 | 17.1% |
Operational Risk Capital requirement | 3,223 | 2,952 | 9.2% | 3,014 | 7.0% |
Basel Ratio | 15.27% | 15.76% | -0.49 p.p. | 15.83% | -0.55 p.p. |
Tier I | 14.24% | 14.72% | -0.48 p.p. | 14.72% | -0.48 p.p. |
CET1 | 13.20% | 13.70% | -0.50 p.p. | 13.62% | -0.42 p.p. |
Tier II | 1.03% | 1.14% | -0.11 p.p. | 1.11% | -0.08 p.p. |
23
| Our shares | |
We are committed to the best Corporate Governance practices: | |
Santander Brasil has a free float of 10.3% and is currently listed on the traditional segment of B3 - Brasil, Bolsa, Balcão, under the tickers SANB3 (common shares), SANB4 (preferred shares) and SANB11 (units). Our unit is composed by one common share and one preferred share. |
|
Ownership Structure | Free-float Breakdown1
OWNERSHIP STRUCTURE | Common | % | Preferred | % | Total | Total |
|
(thousand) |
| (thousand) |
| (thousand) | % | ||
Santander Group ² | 3,444,748 | 90.21% | 3,278,085 | 89.08% | 6,722,833 | 89.66% | |
Treasury Shares | 2,833 | 0.07% | 2,833 | 0.08% | 5,665 | 0.08% | |
Free Float | 371,114 | 9.72% | 398,919 | 10.84% | 770,033 | 10.27% | |
Total | 3,818,695 | 100.00% | 3,679,836 | 100.00% | 7,498,531 | 100.00% |

1 Santander's ownership structure, as of March 31st, 2018
2 Considering the shareholding positions of: Grupo Empresarial Santander S.L. and Sterrebeeck B.V., as well as shares owned by Management.
Stock Performance
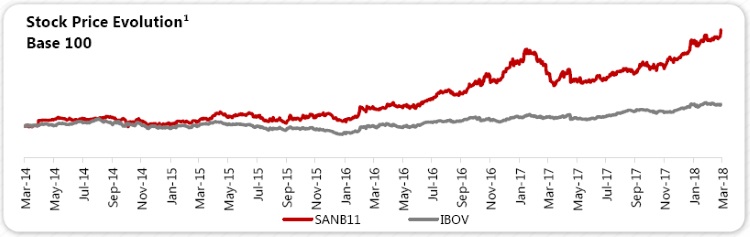
The chart above illustrates that a R$100 investment in Santander Brasil shares on March 31st, 2014 would have increased in value to R$403 on March 29th, 2018, with reinvestments of the dividend and interest on capital payments. The chart illustrates that the same amount of investment in the IBOV index (B3's main stock index) during the same period, would have increased in value to R$169. |  |
1 Historical prices excluding dividends and interest on capital. Source: Bloomberg.
2 Stock Swap Offer completed on October 30th, 2014
24
Our shares
Indicators

1 Considers the number of Units disregarding treasury shares at the end of the period.
2 Closing price at the end of the period.
3 Market Capitalization: Total Units (Unit = 1 Common + 1 Preferred) x Unit closing price at the end of the period.
4 Book Value excludes goodwill.
Earnings Distribution
In the quarter, Santander Brasil apportioned R$600 million as Interest on capital (JCP), payable on April 26th, 2018.
25
Rating Agencies
Santander is rated by international rating agencies and the ratings it receives reflect several factors, including the quality of its management, its operational performance and financial strength, as well as other variables related to the financial sector and the economic environment in which the company operates, with its long-term foreign currency rating limited to the sovereign rating. The table below presents the ratings assigned by Standard & Poor's and Moody's:
Global Scale | National Scale | ||||||||
Ratings | Local Currency | Foreign Currency | National | ||||||
Long-term | Short-term | Long-term | Short-term | Long-term | Short-term | ||||
Standard & Poor’s¹ | BB- | B | BB- | B | brAA- | brA-1+ | |||
|
|
| |||||||
Moody's² |
| Ba1 | NP |
| Ba3 | NP |
| Aaa.br | Br-1 |
|
|
| |||||||
1 Latest Credit Rating Analysis: January 12th, 2018.
2 Latest Credit Rating Analysis: April 10th, 2018.
26
Accounting and Managerial Results Reconciliation
For a better understanding of BR GAAP results, the reconciliation between the accounting result and the managerial result is presented below.
ACCOUNTING AND MANAGERIAL | 1Q18 | Reclassifications | 1Q18 | |||||
RESULTS RECONCILIATION(R$ million) | Accounting | Exchange Hedge¹ | Credit Recovery² | Amort. of goodwill³ | Profit Sharing | FX | Other events5 | Managerial |
Net Interest Income | 10,549 | 167 | (552) | - | - | - | - | 10,163 |
Allowance for Loan Losses | (3,291) | - | 656 | - | - | - | - | (2,635) |
Net Interest Income after Loan Losses | 7,258 | 167 | 104 | - | - | - | - | 7,528 |
Fees | 4,134 | - | - | - | - | - | - | 4,134 |
General Expenses | (4,408) | - | - | 69 | (466) | - | - | (4,805) |
Personnel Expenses | (1,843) | - | - | - | (466) | - | - | (2,309) |
Administrative Expenses | (2,566) | - | - | 69 | - | - | - | (2,497) |
Tax Expenses | (948) | (16) | - | - | - | - | - | (964) |
Investments in Affiliates and Subsidiaries | 3 | - | - | - | - | - | - | 3 |
Other Operating Income/Expenses | (1,197) | - | (104) | - | - | - | (46) | (1,346) |
Operating Income | 4,842 | 150 | - | 69 | (466) | - | (46) | 4,549 |
Non Operating Income | 13 | - | - | - | - | - | - | 13 |
Net Profit before Tax | 4,854 | 150 | - | 69 | (466) | - | (46) | 4,562 |
Income Tax and Social Contribution | (1,485) | (150) | - | - | - | - | 16 | (1,619) |
Profit Sharing | (466) | - | - | - | 466 | - | - | - |
Minority Interest | (83) | - | - | - | - | - | - | (83) |
Net Profit | 2,820 | - | - | 69 | - | - | (30) | 2,859 |
ACCOUNTING AND MANAGERIAL | 1Q17 | Reclassifications | 1Q17 | |||||
RESULTS RECONCILIATION(R$ million) | Accounting | Exchange Hedge¹ | Credit Recovery² | Amort. of goodwill³ | Profit Sharing | FX | Other events5 | Managerial |
Net Interest Income | 10,541 | (967) | (789) | - | - | 83 | - | 8,868 |
Allowance for Loan Losses | (3,020) | - | 839 | - | - | (83) | - | (2,264) |
Net Interest Income after Loan Losses | 7,521 | (967) | 50 | - | - | - | - | 6,604 |
Fees | 3,709 | - | - | - | - | - | - | 3,709 |
General Expenses | (4,765) | - | - | 456 | (319) | - | - | (4,629) |
Personnel Expenses | (1,881) | - | - | - | (319) | - | - | (2,200) |
Administrative Expenses | (2,884) | - | - | 456 | - | - | - | (2,429) |
Tax Expenses | (1,000) | 95 | - | - | - | - | - | (906) |
Investments in Affiliates and Subsidiaries | 5 | - | - | - | - | - | - | 5 |
Other Operating Income/Expenses | (1,323) | - | (50) | - | - | - | - | (1,372) |
Operating Income | 4,147 | (872) | - | 456 | (319) | - | - | 3,411 |
Non Operating Income | (68) | - | - | - | - | - | - | (68) |
Net Profit before Tax | 4,078 | (872) | - | 456 | (319) | - | - | 3,343 |
Income Tax and Social Contribution | (1,845) | 872 | - | - | - | - | - | (973) |
Profit Sharing | (319) | - | - | - | 319 | - | - | - |
Minority Interest | (90) | - | - | - | - | - | - | (90) |
Net Profit | 1,824 | - | - | 456 | - | - | - | 2,280 |
27
ACCOUNTING AND MANAGERIAL | 4Q17 | Reclassifications | 4Q17 | |||||
RESULTS RECONCILIATION(R$ million) | Accounting | Exchange Hedge¹ | Credit Recovery² | Amort. of goodwill³ | Profit Sharing | FX | Other events5 | Managerial |
Net Interest Income | 8,435 | 1,469 | (648) | - | - | (250) | 492 | 9,498 |
Allowance for Loan Losses | (2,805) | - | 615 | - | - | 26 | (492) | (2,656) |
Net Interest Income after Loan Losses | 5,630 | 1,469 | (33) | - | - | (224) | - | 6,843 |
Fees | 4,239 | - | - | - | - | - | - | 4,239 |
General Expenses | (5,001) | - | - | 166 | (357) | - | 9 | (5,183) |
Personnel Expenses | (2,009) | - | - | - | (357) | - | - | (2,367) |
Administrative Expenses | (2,991) | - | - | 166 | - | - | 9 | (2,816) |
Tax Expenses | (811) | (144) | - | - | - | - | - | (955) |
Investments in Affiliates and Subsidiaries | (1) | - | - | - | - | - | - | (1) |
Other Operating Income/Expenses | (1,494) | - | 33 | - | - | 224 | 154 | (1,084) |
Operating Income | 2,562 | 1,326 | (0) | 166 | (357) | - | 163 | 3,859 |
Non Operating Income | 53 | - | - | - | - | - | - | 53 |
Net Profit before Tax | 2,615 | 1,326 | (0) | 166 | (357) | - | 163 | 3,912 |
Income Tax and Social Contribution | 334 | (1,326) | - | - | - | - | (75) | (1,067) |
Profit Sharing | (357) | - | - | - | 357 | - | - | - |
Minority Interest | (93) | - | - | - | - | - | - | (93) |
Net Profit | 2,498 | - | (0) | 166 | - | - | 88 | 2,752 |
1 Foreign Exchange Hedge: under Brazilian tax rules, gains (losses) derived from exchange rate fluctuations on foreign currency investments are not taxable (tax deductible). This tax treatment leads to exchange rate exposure to taxes. An exchange rate hedge position was set up with the purpose of protecting the net profit from the impact of foreign exchange fluctuations related to this tax exposure.
2 Credit Recovery: reclassified from revenue from loan operations to allowance for loan losses and, from 2017 onwards, it includes provision for guarantees provided.
3 Amortization of Goodwill: reversal of goodwill amortization expenses.
4 Exchange Rate Fluctuation: includes, in addition to the effect of the exchange rate fluctuation, reclassifications between different lines of the Bank's results (other operating income/expenses, allowance for loan losses and non-operating result) for better comparability with previous quarters.
5 Other events:
2017
3Q17:
Adhesion to the installment payment program for outstanding taxes and social security debts (in accordance with Provisional Measure No. 783/2017).
4Q17:
Net Interest Income and Allowance for Loan Losses: reclassification between the lines referring to the adjustment in the valuation of assets related to the impairment of securities.
Administrative Expenses and Other Operating Income and Expenses: adhesion to the installment payment program by the cities of São Paulo and Rio de Janeiro (R$ 9 million in administrative expenses, R$ 27 million in other operating expenses and R$ 179 million reversal in other operating income) and write-down of intangible assets due to impairment in the amount of R$ 306 million.
2018
1Q18:
Adhesion effect to the installment payment program for outstanding taxes and social security debts (in accordance with Provisional Measure No. 783/2017).
28

29

1 Cards turnover do not include withdrawal transactions, it only considers purchase volumes.
2 Individuals' origination.
3 Ratio between Loans and Collateral Value.
30

1 Vehicle portfolio for Individuals, considers the Individuals' portfolio generated by the internal channel as well as by the Individuals' portfolio from the Consumer Finance segment.
2 Brazilian Central Bank. ³ ABECS.
31

Banco Santander (Brasil) S.A. | ||
| By: | /S/ Amancio Acurcio Gouveia | |
Amancio Acurcio Gouveia Officer Without Specific Designation | ||
| By: | /S/ Angel Santodomingo Martell | |
Angel Santodomingo Martell Vice - President Executive Officer | ||
32