SECURITIES AND EXCHANGE COMMISSION
Commission File Number: 001-34476
Bloco A – Vila Olimpia
São Paulo, SP 04543-011
Federative Republic of Brazil
Indicate by check mark if the registrant is submitting the Form 6-K in paper as permitted by Regulation S-T Rule 101(b)(1):
Yes _______ No ___X____
Indicate by check mark if the registrant is submitting the Form 6-K in paper as permitted by Regulation S-T Rule 101(b)(7):
Yes _______ No ___X____
Indicate by check mark whether by furnishing the information contained in this Form, the Registrant is also thereby furnishing the information to the Commission pursuant to Rule 12g3-2(b) under the Securities Exchange Act of 1934:
Yes _______ No ___X____
If “Yes” is marked, indicate below the file number assigned to the registrant in connection with Rule 12g3-2(b): N/A

Table of Contents
Managerial Analysis of Results–BR GAAP
2
 |
All information presented in this report considers the managerial result, except where otherwise indicated. The reconciliation with the accounting result can be found on pages 27 and 28.
MANAGERIAL¹ ANALYSIS - BR GAAP | 1H18 | 1H17 | Var. | 2Q18 | 1Q18 | Var. |
|
| 12M |
|
| 3M | |
RESULTS (R$ million) |
|
|
|
|
|
|
Net interest income | 20,623 | 17,966 | 14.8% | 10,460 | 10,163 | 2.9% |
Fees | 8,409 | 7,501 | 12.1% | 4,275 | 4,134 | 3.4% |
Allowance for loan losses | (5,256) | (4,624) | 13.7% | (2,604) | (2,652) | -1.8% |
General Expenses² | (9,672) | (9,179) | 5.4% | (4,867) | (4,805) | 1.3% |
Personnel Expenses | (4,595) | (4,406) | 4.3% | (2,286) | (2,309) | -1.0% |
Administrative Expenses | (5,077) | (4,773) | 6.4% | (2,581) | (2,496) | 3.4% |
Managerial net profit³ | 5,884 | 4,615 | 27.5% | 3,025 | 2,859 | 5.8% |
Accounting net profit | 5,792 | 3,704 | 56.4% | 2,972 | 2,820 | 5.4% |
|
|
|
|
|
|
|
BALANCE SHEET (R$ million) |
|
|
|
|
|
|
Total assets | 739,071 | 653,050 | 13.2% | 739,071 | 724,348 | 2.0% |
Securities and Derivative Financial Instruments | 187,417 | 168,391 | 11.3% | 187,417 | 193,149 | -3.0% |
Loan portfolio | 290,479 | 256,765 | 13.1% | 290,479 | 280,398 | 3.6% |
Individuals | 119,837 | 97,414 | 23.0% | 119,837 | 113,700 | 5.4% |
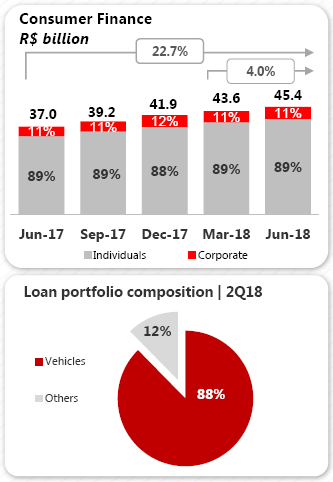
Consumer finance | 45,369 | 36,988 | 22.7% | 45,369 | 43,611 | 4.0% |
SMEs | 35,319 | 32,552 | 8.5% | 35,319 | 34,320 | 2.9% |
Corporate | 89,954 | 89,811 | 0.2% | 89,954 | 88,766 | 1.3% |
Expanded Loan Portfolio⁴ | 368,245 | 325,014 | 13.3% | 368,245 | 353,920 | 4.0% |
Funding from Clients⁵ | 324,879 | 300,668 | 8.1% | 324,879 | 316,818 | 2.5% |
Deposits (demand, saving and time) | 237,551 | 175,721 | 35.2% | 237,551 | 217,586 | 9.2% |
Equity⁶ | 62,529 | 59,608 | 4.9% | 62,529 | 61,384 | 1.9% |
|
|
|
|
|
|
|
PERFORMANCE INDICATORS (%) |
|
|
|
|
|
|
Return on average equity excluding goodwill⁶ - annualized | 19.3% | 15.9% | 3.4 p.p. | 19.5% | 19.1% | 0.5 p.p. |
Return on average asset excluding goodwill⁶ - annualized | 1.6% | 1.3% | 0.3 p.p. | 1.7% | 1.6% | 0.0 p.p. |
Efficiency ratio⁷ | 39.8% | 44.2% | -4.3 p.p. | 39.6% | 40.0% | -0.4 p.p. |
Recurrence ratio⁸ | 86.9% | 81.7% | 5.2 p.p. | 87.8% | 86.0% | 1.8 p.p. |
BIS ratio | 14.8% | 16.5% | -1.7 p.p. | 14.8% | 15.3% | -0.5 p.p. |
Tier I | 13.6% | 15.4% | -1.8 p.p. | 13.6% | 14.2% | -0.6 p.p. |
Tier II | 1.2% | 1.1% | 0.0 p.p. | 1.2% | 1.0% | 0.1 p.p. |
CET1 - Fully Loaded | 12.4% | 13.3% | -0.9 p.p. | 12.4% | 13.0% | -0.6 p.p. |
|
|
|
|
|
|
|
PORTFOLIO QUALITY INDICATORS (%) |
|
|
|
|
|
|
Delinquency ratio (over 90 days) | 2.8% | 2.9% | -0.1 p.p. | 2.8% | 2.9% | -0.1 p.p. |
Individuals | 3.8% | 3.9% | -0.1 p.p. | 3.8% | 3.7% | 0.0 p.p. |
Corporate & SMEs | 1.7% | 2.0% | -0.3 p.p. | 1.7% | 2.0% | -0.2 p.p. |
Coverage ratio (over 90 days) | 219.4% | 228.9% | -9.5 p.p. | 219.4% | 216.1% | 3.3 p.p. |
Delinquency ratio (over 60 days) | 3.7% | 3.8% | -0.1 p.p. | 3.7% | 3.6% | 0.1 p.p. |
|
|
|
|
|
|
|
OTHER DATA |
|
|
|
|
|
|
Assets under management9 - AUM (R$ million) | 302,162 | 272,118 | 11.0% | 302,162 | 298,943 | 1.1% |
Branches | 2,262 | 2,255 | 7 | 2,262 | 2,258 | 4 |
PABs (mini branches) | 1,228 | 1,170 | 58 | 1,228 | 1,226 | 2 |
Own ATMs | 13,516 | 13,610 | (94) | 13,516 | 13,512 | 4 |
Shared ATMs | 22,103 | 20,809 | 1,294 | 22,103 | 21,442 | 661 |
Employees10 | 48,008 | 46,596 | 1,412 | 48,008 | 48,855 | (847) |
1Excluding 100% of the goodwill amortization expense, the foreign exchange hedge effect and other adjustments, as described on pages 27 and 28.
2Administrative expenses exclude 100% of the goodwill amortization expense. Personnel expenses include profit-sharing.
3Managerial net profit corresponds to the corporate net profit, excluding the extraordinary result and the 100% reversal of the goodwill amortization expense that occurred in the period. Goodwill amortization expenses were R$ 70 million in 2Q18, R$ 69 million in 1Q18 and R$ 456 million in 2Q17.
4Including other credit risk transactions (debentures, FDIC, CRI, promissory notes, international distribution promissory notes, acquiring-activities related assets and guarantees).
5Including Savings, Demand Deposits, Time Deposits, Debentures, LCA, LCI, Financial Bills and Certificates of Structured Operations ("COE").
6Excluding 100% of the goodwill balance (net of amortization), which amounted to R$ 796 million in 2Q18, R$ 863 million in 1Q18 and R$ 1,249 million in 2Q17.
7Efficiency Ratio: General Expenses / (Net Interest Income + Fees + Tax Expenses + Other Operating Income/Expenses).
8 Recurrence Ratio: Fees / General Expenses.
9According to ANBIMA (Brazilian Financial and Capital Markets Association) criteria.
10As of 1Q18, it includes technology companies Produban and Isban.
3
 |
Banco Santander Brasil is the only international bank with scale in the country. We are convinced that the best way to grow in a profitable, recurring and sustainable manner is by providing excellent services to enhance customer satisfaction levels and attract more customers, making them more loyal. Our actions are based on establishing close and long-lasting relationships with customers, suppliers and shareholders. To accomplish that goal, our purpose is to help people and businesses prosper by being a Simple, Personal and Fair Bank, guided by the following strategic priorities:
|
|
|
| |||
| Increase customer | Improve the | Be disciplined with | Boost productivity | |||
| preference and | profitability, recurrence | capital and | through an | |||
| loyalty by offering | and sustainability of | liquidity to | intense agenda of | |||
| targeted, simple, | our results by growing | preserve our | commercial | |||
| digital and | in businesses with | solidity, face | improvements | |||
| innovative | greater revenue | regulatory | that enable us to | |||
| products and | diversification, aiming | changes and seize | offer a complete | |||
| services through a | to strike a balance | growth | portfolio of | |||
| multi-channel | between loan, funding | opportunities. | services. | |||
| platform. | and services, while | |||||
| maintaining a | ||||||
| preemptive risk | ||||||
| management approach | ||||||
| and rigorous cost | ||||||
| control. |
We remain focused on generating recurring results through a customer-focused and improved satisfaction strategy. In this sense, in 2Q18, we continued to bring innovative solutions to support business generation, which contributed to our profitable increase in market share and consistent growth in the customer base. Our strategy is based on strengthening our internal culture and engaging employees. Among the initiatives in the period, we highlight:
 Innovations
- "Meus compromissos"
Starting this quarter, our Santander app has a new functionality in which the client will have access, in a simple and practical way, to details of its financial comitments. This initiative reinforces our role in the financial education and transparent communication with our customers. - SuperGet and sales management app
In our acquiring business, we launched SuperGet, which caters mainly to individuals and entrepreneurs. The main purpose of this product is to offer rent-free POS machines, at competitive sales prices, attractive rates and new delivery deadline. Additionally, we also enhanced the Getnet app, turning into a more complete tool to support establishments in their sales management. - Select Direct
We launched an option for customers seeking for time flexibility and the ability to execute most transactions through digital channels. Thus, we positioned ourselves in the market with a complete offer for high income individuals and reached regions where we are not physically present, increasing our capillarity. - Itinerant mini-branch
This quarter, we launched an itinerant mini- branch, which enables us to offer a full range of services immediately after we open a new payroll account. As a result, we will be able to build closer customer relationships from the very beginning, even before a regular mini branch is built on site, providing quality services and increasing loyalty.
4
 |
These innovations contribute with the improvement in customer experience and engagement. We continue to use the NPS (Net Promoter Score) indicator to track satisfaction levels and improve our services and processes. In the quarter, the indicator reached 51 points versus 49 points from 1Q18. As a result of our actions, the base of active current account holders has been growing for 37 consecutive months.
|
|
|
1 Source: ABECS – “Monitor bandeiras”, as of March 2018. Methodology includes all acquirings. 2 Source: Brazilian Central Bank, between January and May 2018 3 Source: Brazilian Central Bank, as of May 2018.
5
 |
|
| Global Corporate Banking (GCB):We continue to be recognized as leaders in the following areas:
1 Source: ABECS - "Monitor bandeiras", as of March 2018. Methodology includes all acquirings. |
6
 |
| ExecutiveSummary | |
 | Our performance reinforces the sustainability of our business model, which is focused on our customers and creates greater value for our shareholders. Despite the slow recovery in the macroeconomic environment, we were able to deliver annual growth in our loan portfolio for the sixth consecutive quarter, with quality indicators at controlled levels. This boosted our net interest income, which, combined with good dynamics in fees, provided for a solid expansion in our total revenues. On the cost front, we are committed to increasing efficiency, which reached the best level in its history this quarter. As a result of all these factors, our profitability grew for another consecutive quarter. |
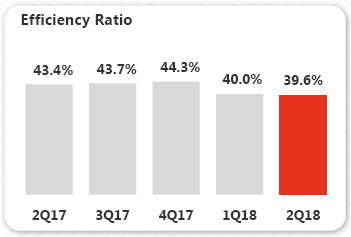
Managerial net profit totaled R$ 5,884 million in the first half of 2018, growing 27.5% in twelve months and up by 5.8% in three months. Our solid results continue to be supported by the growth in customer base, focused on experience and satisfaction. Total revenues reached R$ 29,032 million in the first half of 2018, up by 14.0% in twelve months (or R$ 3,564 million) and by 3.1% in three months. Net interest income totaled R$ 20,623 million in the first half of 2018, increasing by 14.8% in twelve months, due to higher revenues from loan operations and market activities. In three months, net interest income grew by 2.9%. Fees amounted to R$ 8,409 million, a 12.1% growth in twelve months, backed by the increase in customer base and higher loyalty. The highlights remain credit cards, acquiring activities, banking account services and insurance fees. In three months, these revenues increased by 3.4%. | Profitability The return on average equity (ROAE), adjusted for goodwill, reached 19.3%, in the first half of 2018, an increase by 3.4 p.p. in twelve months. This evolution illustrates the recurring growth of our revenues and efficiency gains. Allowance for loan losses reached R$ 5,256 million in the first half of 2018, rising by 13.7% in twelve months, following the loan portfolio growth. The strength of our risk management is reflected in the evolution of our credit indicators. In three months, allowance for loan losses reduced by 1.8%. General expenses totaled R$ 9,672 million in the first half of 2018, up by 5.4% compared to the same period of last year and 1.3% in three months. This variation is mainly due to higher variable expenses related to our commercial activities. The efficiency ratio reached 39.8% in the first half of 2018, our best level in history, representing improvements of 4.3 p.p. in twelve months and 0.4 p.p. in three months. |
7
 |
 | BALANCE SHEET AND INDICATORS |
The total loan portfolio reached R$ 290,479 million at the end of June 2018, representing a 13.1% increase in twelve months (or up by 11% when excluding effects from foreign exchange fluctuations). We continue to highlight the individuals and consumer finance segments, which increased by 23.0% and 22.7% in twelve months, respectively. Both segments, individuals and consumer finance, have outperformed the total loan portfolio for 11 and 8 consecutive quarters, respectively. In three months, the total loan portfolio increased by 3.6% showing positive variations among segments. The expanded loan portfolio reached R$ 368,245 million, increasing by 13.3% in twelve months and by 4.0% in three months. Funding from clients amounted to R$ 324,879 million at the end of June 2018, climbing 8.1% in twelve months and up by 2.5% in three months. We maintained the growth trend in funding; time deposits has been gaining representativeness in total funding, with a 45.0% rise in twelve months and a 11.4% rise in three months. Savings deposits increased by 14.9% compared to June 2017 and by 2.8% in three months. | Total equity excluding R$ 796 million related to the goodwill balance, was R$ 62,529 million at the end of June 2018, up 4.9% in twelve months and 1.9% higher in three months. Quality indicators The over 90 day delinquency ratio reached 2.8% in June 2018, down by 0.1 p.p. in both the twelve and three months periods. The cost of credit in the second quarter of 2018 was 3.2%, stable over the last twelve months and down by 0.2 p.p. in three months; The coverage ratio reached 219% in June 2018, representing a drop of 9.5 p.p. in twelve months and up by 3.3 p.p. in three months. Portfolio quality indicators remain under control, supported by the effectiveness of our risk models. Capital indicators The BIS ratio reached 14.8% in June of 2018, decreasing 1.7 p.p. in twelve months and 0.5 p.p. in three months. The fully-loaded CET1 ratio reached 12.4%, reduction of 0.9 p.p. in twelve months and 0.6 p.p in three months. |
8
 |
Next, we present our analysis of the managerial results.
MANAGERIAL FINANCIAL STATEMENTS¹ | 1H18 | 1H17 | Var. | 2Q18 | 1Q18 | Var. |
(R$ million) |
|
| 12M |
|
| 3M |
|
|
|
|
|
|
|
Net Interest Income | 20,623 | 17,966 | 14.8% | 10,460 | 10,163 | 2.9% |
Allowance for Loan Losses | (5,256) | (4,624) | 13.7% | (2,604) | (2,652) | -1.8% |
Net Interest Income after Loan Losses | 15,367 | 13,342 | 15.2% | 7,856 | 7,511 | 4.6% |
Fees | 8,409 | 7,501 | 12.1% | 4,275 | 4,134 | 3.4% |
General Expenses | (9,672) | (9,179) | 5.4% | (4,867) | (4,805) | 1.3% |
Personnel Expenses + Profit Sharing | (4,595) | (4,406) | 4.3% | (2,286) | (2,309) | -1.0% |
Administrative Expenses² | (5,077) | (4,773) | 6.4% | (2,581) | (2,496) | 3.4% |
Tax Expenses | (1,988) | (1,798) | 10.6% | (1,024) | (964) | 6.2% |
Investments in Affiliates and Subsidiaries | 9 | 16 | n.a. | 6 | 3 | n.a. |
Other Operating Income/Expenses | (2,766) | (2,900) | -4.6% | (1,432) | (1,334) | 7.4% |
Operating Income | 9,359 | 6,983 | 34.0% | 4,814 | 4,545 | 5.9% |
Non Operating Income | 27 | (278) | n.a. | 15 | 13 | 17.3% |
Net Profit before Tax | 9,386 | 6,705 | 40.0% | 4,829 | 4,557 | 6.0% |
Income Tax and Social Contribution | (3,329) | (1,899) | 75.3% | (1,714) | (1,615) | 6.1% |
Minority Interest | (173) | (190) | -9.0% | (90) | (83) | 8.1% |
Net Profit | 5,884 | 4,615 | 27.5% | 3,025 | 2,859 | 5.8% |
1 Excluding 100% of the goodwill amortization expense, foreign exchange hedge effect and other adjustments, as described on page 27 and 28.
2 Excluding 100% of the goodwill amortization expense
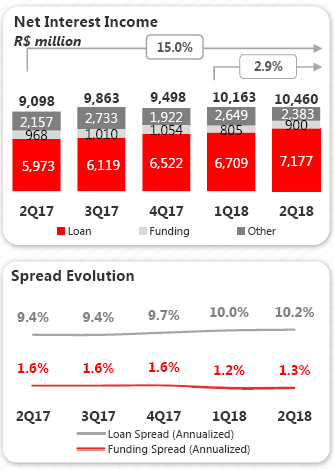
Net Interest Income Net interest income totaled R$ 20,623 million in the first half of 2018, increasing by 14.8% in twelve months (or R$ 2,657 million) and by 2.9% in three months. Revenues from loan operations expanded by 20.1% in twelve months and by 7.0% in three months. This performance in both periods reflects the increase in the average loan portfolio and the greater contribution of the retail segment to the results. Funding revenues reduced by 12.3% in twelve months due to lower interest rates for the period. In three months, funding revenues increased 11.8% on the back of higher volumes. “Other” interest income, which comprises the result of the structural gap in the balance sheet interest rate and activities with treasury clients, among others, increased by 12.9% in twelve months due to higher revenues from market activities. In three months, “other” interest income fell by 10.0%. |
|
9
 |
NET INTEREST INCOME | 1H18 | 1H17 | Var. | 2Q18 | 1Q18 | Var. |
(R$ million) |
|
| 12M |
|
| 3M |
|
|
|
|
|
|
|
Net Interest Income | 20,623 | 17,966 | 14.8% | 10,460 | 10,163 | 2.9% |
Loan | 13,886 | 11,562 | 20.1% | 7,177 | 6,709 | 7.0% |
Average volume | 277,258 | 254,039 | 9.1% | 283,480 | 271,035 | 4.6% |
Spread (Annualized) | 10.1% | 9.1% | 1.0 p.p | 10.2% | 10.0% | 0.2 p.p |
Funding | 1,705 | 1,945 | -12.3% | 900 | 805 | 11.8% |
Average volume | 277,450 | 240,061 | 15.6% | 285,857 | 269,042 | 6.3% |
Spread (Annualized) | 1.2% | 1.6% | -0.4 p.p | 1.3% | 1.2% | 0.1 p.p |
Other¹ | 5,032 | 4,459 | 12.9% | 2,383 | 2,649 | -10.0% |
¹ Including other margins and the result from financial transactions
Fees–Revenues from Banking Services Revenues from banking services and fees totaled R$ 8,409 million in the first half of 2018, rising by 12.1% in comparison to the same period of the previous year and by 3.4% in three months. This result reflects the greater amount of transactionality and loyalty from our customers, mainly driven by cards, current accounts and insurance. Cards and acquiring fees totaled R$ 2,767 million in the first half of 2018, up by 18.5% in twelve months, backed by double-digit annual growth for the ninth consecutive quarter. This performance is explained in large part by the increase in turnover for both cards and acquiring services. In three months, these fees increased by 3.5%. Current account service fees reached R$ 1,624 million in the first half of 2018, increasing by |
16.2% in twelve months and by 3.6% in three months. This performance is a result of the increase in our customer base and higher transactionality levels. Insurance fees stood at R$ 1,338 million in the first half of 2018, a 10.2% increase in twelve months, accompanying the expansion of the loan portfolio. In three months, the increase was by 2.1%. Collection services reached R$ 753 million in the first half of 2018, increasing by 13.4% in twelve months due to the higher transactionality levels of our customers and the pricing adjustments. In three months, a 1.5% increase was recorded. Securities placement, custody and brokerage fees totaled R$ 353 million in the first half of 2018, increasing by 3.8% in twelve months. In three months, we recorded a 18.6% rise in fees, primarily owing to transactions in the securities placement market. |
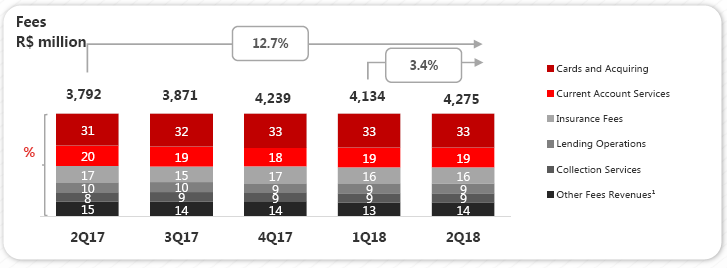
¹ Including Revenues from Asset Management, Securities Placement, Custody and Brokerage Services and Others. For more details, please refer to the Table of Revenues from Banking Services and Fees on page 11.
10
 |
FEES INCOME | 1H18 | 1H17 | Var. | 2Q18 | 1Q18 | Var. |
(R$ million) |
|
| 12M |
|
| 3M |
|
|
|
|
|
|
|
Cards and Acquiring | 2,767 | 2,335 | 18.5% | 1,407 | 1,360 | 3.5% |
Insurance fees | 1,338 | 1,214 | 10.2% | 676 | 662 | 2.1% |
Current Account Services | 1,624 | 1,398 | 16.2% | 826 | 798 | 3.6% |
Asset Management | 510 | 509 | 0.1% | 258 | 252 | 2.7% |
Lending Operations | 785 | 740 | 5.9% | 399 | 386 | 3.5% |
Collection Services | 753 | 664 | 13.4% | 379 | 373 | 1.5% |
Placement, Custody and Brokerage of Securities | 353 | 340 | 3.8% | 192 | 162 | 18.6% |
Other | 280 | 301 | -6.9% | 138 | 143 | -3.7% |
Total | 8,409 | 7,501 | 12.1% | 4,275 | 4,134 | 3.4% |
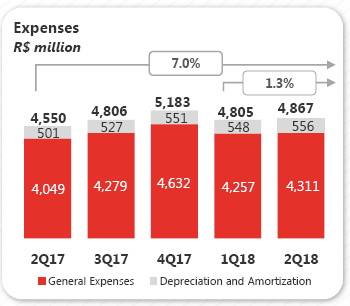
General Expenses (Administrative + Personnel) General expenses, including depreciation and amortization, amounted to R$ 9,672 million in the first half of 2018, rising 5.4% in twelve months (or R$ 493 million) due to higher expenses with data processing, marketing and personnel, in line with the performance of our business. In three months, general expenses increased by 1.3%. Administrative and personnel expenses, excluding depreciation and amortization, totaled R$ 8,568 million in the first half of 2018, up by 4.6% compared to the same period of the previous year and by 1.3% in three months. Personnel expenses, including profit-sharing, amounted to R$ 4,595 million in the first half of 2018, increasing by 4.3% in twelve months (or R$ 189 million) mainly due to increases in profit-sharing, in line with our meritocracy model and performance of our businesses. In three months, these expenses fell by 1.0%. Administrative expenses, excluding depreciation and amortization, stood at R$ 3,973 million in the first half of 2018, up by 5.1% in twelve months (or R$ 191 million). This variation is largely explained by the increase in expenses with data processing to support the new level of customer transactionality of our business. In three months, administrativeexpenses increased by 3.9% due to expenses with specialized technical and third parties services. We had increases in advertising, promotions and publicity expenses in both periods due to marketing actions to promote our business. Depreciation and amortization expenses came in atR$ 1,104 million in the first half of 2018, up by 11.4% in twelve months and by 1.4% in three months. |
|
11
 |
The efficiency ratio reached 39.8% in the first half of 2018, a 4.3 p.p. reduction in twelve months and down by 0.4 p.p. in three months. This is our lowest historical level, which reinforces our commitment to increasing productivity and controlling costs. |
|
EXPENSES' BREAKDOWN | 1H18 | 1H17 | Var. | 2Q18 | 1Q18 | Var. |
(R$ million) |
|
| 12M |
|
| 3M |
Outsourced and Specialized Services | 1,097 | 1,130 | -3.0% | 582 | 515 | 12.9% |
Advertising, promotions and publicity | 232 | 187 | 23.9% | 133 | 99 | 33.3% |
Data processing³ | 999 | 831 | 20.3% | 481 | 518 | -7.1% |
Communications | 204 | 214 | -4.6% | 101 | 104 | -2.8% |
Rentals | 363 | 370 | -1.9% | 182 | 181 | 0.8% |
Transport and Travel | 83 | 88 | -5.8% | 43 | 40 | 5.5% |
Security and Surveillance | 305 | 298 | 2.5% | 151 | 154 | -2.1% |
Maintenance | 124 | 115 | 8.1% | 65 | 59 | 9.3% |
Financial System Services | 158 | 139 | 13.9% | 80 | 78 | 1.9% |
Water, Electricity and Gas | 97 | 96 | 0.6% | 47 | 49 | -4.1% |
Material | 26 | 29 | -10.7% | 13 | 13 | -5.7% |
Other | 285 | 286 | -0.2% | 149 | 137 | 9.0% |
Subtotal | 3,973 | 3,782 | 5.1% | 2,025 | 1,948 | 3.9% |
Depreciation and Amortization¹ | 1,104 | 991 | 11.4% | 556 | 548 | 1.4% |
Total Administrative Expenses | 5,077 | 4,773 | 6.4% | 2,581 | 2,496 | 3.4% |
Compensation² | 2,984 | 2,837 | 5.2% | 1,495 | 1,489 | 0.4% |
Charges | 865 | 802 | 7.8% | 420 | 445 | -5.7% |
Benefits | 715 | 728 | -1.8% | 353 | 362 | -2.3% |
Training | 27 | 21 | 29.2% | 16 | 11 | 38.8% |
Other | 5 | 17 | n.a. | 2 | 2 | n.a. |
Total Personnel Expenses³ | 4,595 | 4,406 | 4.3% | 2,286 | 2,309 | -1.0% |
Administrative + Personnel Expenses | 8,568 | 8,188 | 4.6% | 4,311 | 4,257 | 1.3% |
Total General Expenses | 9,672 | 9,179 | 5.4% | 4,867 | 4,805 | 1.3% |
1 Excluding 100% of the goodwill amortization expenses, which totaled R$ 70 million in 2Q18 , R$ 69 million in 1Q18 and R$ 456 million in 2Q17.
2 Including Profit-Sharing.
3 As of 1Q18, expenses for Isban Brasil S.A. and Produban Serviços de Informática S.A., which were previously consolidated in the Data processing expense line, will be recorded as Personnel and Administrative Expenses under the General Expenses line. For more information, please refer to the Material Fact - Acquisition of Isban Brasil S.A. and Produban Serviços de Informática S.A., released on February 20th, 2018.
12
 |
Allowance for Loan Losses Allowance for loan losses stood at R$ 5,256 million in the first half of 2018, up by 13.7% in twelve months (or R$ 631 million) and down by 1.8% in three months. Allowance for loan losses amounted to R$ 6,385 million in the first half of 2018, representing an increase of 7.1% in twelve months and a decrease of 0.7% in three months. It is worth noting that our loan portfolio remains in good shape, as demonstrated by our portfolio quality indicators. Income from the recovery of written-off loans came to R$ 1,129 million in the first half of 2018, down by 15.4% in twelve months, impacted by higher income from loan recovery in 1Q17 (R$ 789 millions). In three months, this income increased by 4.4%. |
|
Other Operating Income and Expenses
Other net operating income and expenses came to R$ 2,766 million in the first semester of 2018.
OTHER OPERATING INCOME (EXPENSES) | 1H18 | 1H17 | Var. | 2Q18 | 1Q18 | Var. |
(R$ million) |
|
| 12M |
|
| 3M |
Expenses from credit cards | (1,059) | (776) | 36.5% | (582) | (477) | 22.0% |
Net Income from Capitalization | 186 | 181 | 2.8% | 92 | 94 | -2.1% |
Provisions for contingencies¹ | (463) | (1,144) | -59.6% | (190) | (273) | -30.4% |
Other | (1,430) | (1,161) | 23.2% | (752) | (678) | 10.9% |
Other operating income (expenses) | (2,766) | (2,900) | -4.6% | (1,432) | (1,334) | 7.4% |
1 Including tax, civil and labor provisions.
13
 |
Balance Sheet
Total assets reached R$ 739,071 million at the end of June 2018, growing 13.2% in twelve months and rising 2.0% in three months. Total equity was R$ 63,325 million in the same period. Excluding the goodwill balance, total equity stood at R$ 62,529 million.
ASSETS | Jun-18 | Jun-17 | Var. | Mar-18 | Var. |
(R$ million) |
|
| 12M |
| 3M |
Current Assets and Long-term Assets | 728,300 | 640,995 | 13.6% | 713,329 | 2.1% |
Cash and Cash Equivalents | 11,884 | 8,261 | 43.9% | 10,658 | 11.5% |
Interbank Investments | 53,295 | 51,599 | 3.3% | 44,335 | 20.2% |
Money Market Investments | 40,290 | 38,900 | 3.6% | 38,570 | 4.5% |
Interbank Deposits | 3,423 | 1,315 | 160.3% | 2,933 | 16.7% |
Foreign Currency Investments | 9,582 | 11,385 | -15.8% | 2,832 | 238.3% |
Securities and Derivative Financial Instruments | 187,417 | 168,391 | 11.3% | 193,149 | -3.0% |
Own Portfolio | 58,103 | 48,112 | 20.8% | 66,357 | -12.4% |
Subject to Repurchase Commitments | 90,633 | 84,360 | 7.4% | 84,346 | 7.5% |
Posted to Central Bank of Brazil | 1,943 | 2,333 | -16.7% | 2,086 | -6.8% |
Pledged in Guarantees | 16,792 | 15,233 | 10.2% | 15,612 | 7.6% |
Other | 19,946 | 18,353 | 8.7% | 24,748 | -19.4% |
Interbank Accounts | 90,695 | 68,135 | 33.1% | 81,953 | 10.7% |
Restricted Deposits: | 69,687 | 65,287 | 6.7% | 61,872 | 12.6% |
-Central Bank of Brazil | 69,416 | 65,012 | 6.8% | 61,601 | 12.7% |
-National Housing System | 271 | 275 | -1.5% | 272 | -0.1% |
Other | 21,008 | 2,848 | n.a. | 20,081 | n.a. |
Lending Operations | 272,496 | 240,014 | 13.5% | 262,811 | 3.7% |
Lending Operations | 290,529 | 256,822 | 13.1% | 280,459 | 3.6% |
Lending Operations Related to Assignment | 63 | 421 | -85.1% | 99 | -36.7% |
(Allowance for Loan Losses) | (18,096) | (17,229) | 5.0% | (17,747) | 2.0% |
Other Receivables | 109,859 | 102,050 | 7.7% | 117,606 | -6.6% |
Foreign Exchange Portfolio | 59,516 | 39,750 | 49.7% | 69,846 | -14.8% |
Income Receivable | 28,562 | 27,913 | 2.3% | 25,661 | 11.3% |
Other | 21,782 | 34,387 | -36.7% | 22,099 | -1.4% |
Other Assets | 2,654 | 2,546 | 4.3% | 2,816 | -5.7% |
Permanent Assets | 10,771 | 12,056 | -10.7% | 11,019 | -2.3% |
Temporary Assets | 440 | 372 | 18.3% | 434 | 1.4% |
Fixed Assets | 6,346 | 7,174 | -11.6% | 6,305 | 0.6% |
Intangibles | 3,985 | 4,510 | -11.6% | 4,281 | -6.9% |
Goodwill net of amortization | 796 | 1,249 | -36.3% | 863 | -7.8% |
Other Assets | 3,189 | 3,260 | -2.2% | 3,418 | -6.7% |
Total Assets | 739,071 | 653,050 | 13.2% | 724,348 | 2.0% |
|
|
|
|
|
|
Total Assets (excluding goodwill) | 738,275 | 651,801 | 13.3% | 723,485 | 2.0% |
14
 |
LIABILITIES | Jun-18 | Jun-17 | Var. | Mar-18 | Var. |
(R$ million) |
|
| 12M |
| 3M |
Current Liabilities and Long-term Liabilities | 673,248 | 589,129 | 14.3% | 659,629 | 2.1% |
Deposits | 241,754 | 178,615 | 35.3% | 221,268 | 9.3% |
Demand Deposits | 17,369 | 16,175 | 7.4% | 16,799 | 3.4% |
Savings Deposits | 42,571 | 37,064 | 14.9% | 41,409 | 2.8% |
Interbank Deposits | 4,199 | 2,894 | 45.1% | 3,678 | 14.2% |
Time Deposits and Others | 177,615 | 122,482 | 45.0% | 159,382 | 11.4% |
Money Market Funding | 133,155 | 150,083 | -11.3% | 134,834 | -1.2% |
Own Portfolio | 100,998 | 120,790 | -16.4% | 99,791 | 1.2% |
Third Parties | 12,275 | 335 | n.a. | 2,223 | n.a. |
Free Portfolio | 19,882 | 28,958 | -31.3% | 32,820 | -39.4% |
Funds from Acceptance and Issuance of Securities | 77,045 | 85,139 | -9.5% | 81,441 | -5.4% |
Resources from Real Estate Credit Notes, Mortgage Notes, Credit and Similar | 68,447 | 79,346 | -13.7% | 73,958 | -7.5% |
Funding from Certificates of Structured Operations | 2,253 | 1,330 | 69.3% | 2,225 | 1.3% |
Securities Issued Abroad | 5,079 | 3,393 | 49.7% | 4,035 | 25.9% |
Other | 1,266 | 1,071 | 18.2% | 1,223 | 3.5% |
Interbank Accounts | 1,732 | 1,790 | -3.2% | 1,752 | -1.2% |
Interbranch Accounts | 2,854 | 2,719 | 5.0% | 2,879 | -0.9% |
Borrowings | 46,559 | 28,007 | 66.2% | 32,231 | 44.5% |
Domestic Onlendings - Official Institutions | 14,329 | 16,842 | -14.9% | 15,592 | -8.1% |
National Economic and Social Development Bank (BNDES) | 7,816 | 10,090 | -22.5% | 8,722 | -10.4% |
National Equipment Financing Authority (FINAME) | 6,267 | 6,497 | -3.5% | 6,513 | -3.8% |
Other Institutions | 246 | 254 | -3.4% | 357 | -31.1% |
Derivative Financial Instruments | 17,793 | 16,919 | 5.2% | 21,072 | -15.6% |
Other Payables | 138,027 | 109,015 | 26.6% | 148,560 | -7.1% |
Foreign Exchange Portfolio | 58,853 | 39,635 | 48.5% | 69,639 | -15.5% |
Tax and Social Security | 3,271 | 3,920 | -16.6% | 4,332 | -24.5% |
Subordinated Debts | - | 494 | -100.0% | 534 | -100.0% |
Debt Instruments Eligible to Compose Capital | 9,835 | 8,438 | 16.6% | 8,407 | 17.0% |
Other | 66,069 | 56,528 | 16.9% | 65,649 | 0.6% |
Deferred Income | 423 | 519 | -18.6% | 470 | -10.0% |
Minority Interest | 2,076 | 2,545 | -18.4% | 2,002 | 3.7% |
Equity | 63,325 | 60,858 | 4.1% | 62,247 | 1.7% |
Total Liabilities | 739,071 | 653,050 | 13.2% | 724,348 | 2.0% |
|
|
|
|
|
|
Equity (excluding goodwill) | 62,529 | 59,608 | 4.9% | 61,384 | 1.9% |
|
|
|
|
|
|
Securities
Total securities amounted to R$ 187,417 million at the end of June 2018, increasing by 11.3% in twelve months, mainly driven by growth in government securities. In three months, total securities fell by 3.0%.
SECURITIES | Jun-18 | Jun-17 | Var. | Mar-18 | Var. |
(R$ million) |
|
| 12M |
| 3M |
Public securities | 147,323 | 129,324 | 13.9% | 152,051 | -3.1% |
Private securities | 21,280 | 20,716 | 2.7% | 19,402 | 9.7% |
Financial instruments | 18,813 | 18,350 | 2.5% | 21,696 | -13.3% |
Total | 187,417 | 168,391 | 11.3% | 193,149 | -3.0% |
15
 |
Loan Portfolio
The loan portfolio totaled R$ 290,479 million at the end of June 2018, a 13.1% growth in twelve months (or up by 11.0% excluding the impact of exchange rate fluctuations) and 3.6% in three months. Our performance in recent quarters has consistently outperformed the market, especially in the individuals and consumer finance segments, allowing us to expand our market share.
The expanded loan portfolio, which includes other credit risk transactions, acquiring-activities related assets and guarantees, reached R$ 368,245 million at the end of June 2018, up by 13.3% in twelve months (or up by 11.7% excluding exchange rate fluctuations) and grew by 4.0% in three months.
The balance of the foreign currency portfolio, including dollar-indexed loans, totaled R$ 37,655 million at the end of June 2018, up by 23.2% compared to the balance of R$ 30,554 million in June 2017 and 16.7% versus the balance of R$ 32,271 million in March 2018.
MANAGERIAL BREAKDOWN OF CREDIT BY SEGMENT | Jun-18 | Jun-17 | Var. | Mar-18 | Var. |
(R$ million) |
|
| 12M |
| 3M |
Individuals | 119,837 | 97,414 | 23.0% | 113,700 | 5.4% |
Consumer Finance | 45,369 | 36,988 | 22.7% | 43,611 | 4.0% |
SMEs | 35,319 | 32,552 | 8.5% | 34,320 | 2.9% |
Corporate | 89,954 | 89,811 | 0.2% | 88,766 | 1.3% |
Total portfolio | 290,479 | 256,765 | 13.1% | 280,398 | 3.6% |
Other credit related transactions¹ | 77,766 | 68,249 | 13.9% | 73,522 | 5.8% |
Total expanded credit portfolio | 368,245 | 325,014 | 13.3% | 353,920 | 4.0% |
¹ Including debentures, FIDC, CRI, promissory notes, international distribution promissory notes, acquiring-activities related assets and guarantees.
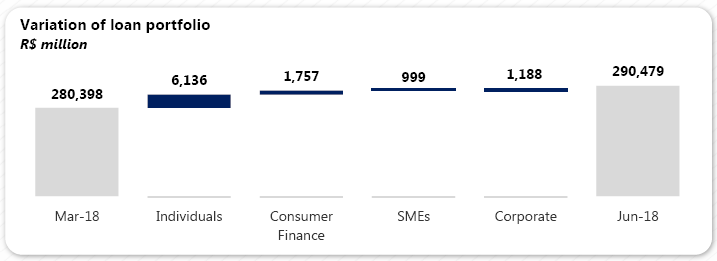
The growth of our total loan portfolio, when compared to the previous quarter, continues to be driven by the individuals and consumer finance portfolios. The SME segment provided a positive contribution for the fifth consecutive quarter, while this quarter's growth in the corporate segment was mainly caused by the impact of the exchange rate fluctuation.
16
 |
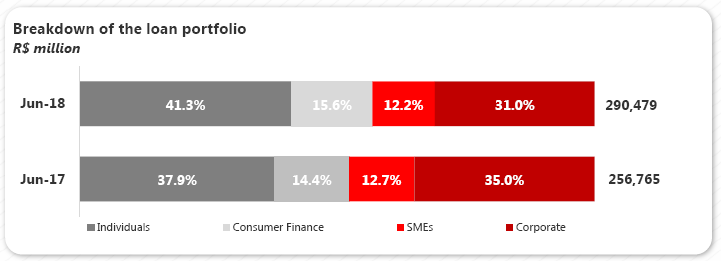
At the end of June 2018, the individuals portfolio accounted for 41.3% of the total portfolio, up by 3.3 p.p. in twelve months. The consumer finance segment, which reached a 15.6% share of the total portfolio at the end of the second quarter of 2018, also gained representativeness, increasing 1.2 p.p. in twelve months. During the same period, the corporate segment fell by 4.0 p.p. to 31.0% and SMEs reduced 0.5 p.p. to 12.2%.
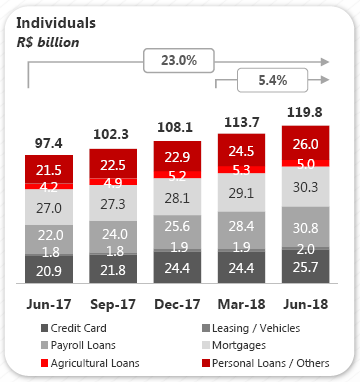
Loans to Individuals Loans to individuals amounted to R$ 119,837 million at the end of June 2018, a 23.0% growth in twelve months (or R$ 22,423 million) and up by 5.4% in three months. The performance in both periods was mainly driven by the expansion of payroll loans, credit card and mortgages. The payroll loans portfolio reached R$ 30,803 million in June 2018, up by 40.3% in twelve months (or R$ 8,843 million) and by 8.3% in three months. This product continues to be the top performer due to its dynamics and the digital channel experience. The credit card portfolio reached R$ 25,727 million, up by 23.0% in twelve months (or R$ 4,805 million) and by 5.3% in three months. This performance reflects the intensity of our promotional partnerships and innovative solutions during the period. The mortgage loan balance reached R$ 30,331, a 12.1% increase in twelve months (or R$ 3,285 million) and up by 4.2% in three months. Since last year, we have positioned ourselves in this product with competitive rates and providing digital solutions that enhance our customers’ experience. | |
17
 |
| Consumer Finance | |
The consumer finance portfolio, which is originated outside the branch network, totaled R$ 45,369 million at the end of June 2018, increasing by 22.7% in twelve months (or R$ 8,380 million) and by 4.0% in three months. Of this total portfolio, R$ 37,784 million refers to vehicle financing for individuals, which has grown by 22.4% in twelve months. The total vehicle portfolio for individuals, which includes operations carried out by both the financing unit (correspondent banks) as well as by the Bank's branch network, grew 21.8% in twelve months and 4.2% in three months, reaching R$ 39,772 million at the end of June 2018. The performance of this portfolio can be partially attributed the financing platforms +Negócios, focused on vehicles segment, and +Vezes that allows us to capture market opportunities in the consumer goods segment. |
|
Corporate & SMEs Loans
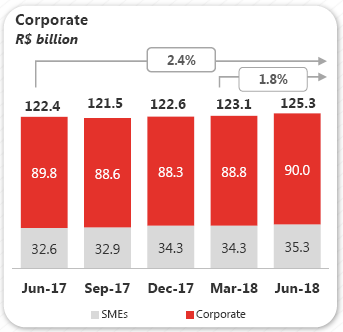
The corporate & SMEs loan portfolio reached R$ 125,273 million in June 2018, up by 2.4% in twelve months (or R$ 2,911 million) and by 1.8% in three months.
| The corporate loan portfolio totaled R$ 89,954 million, a 0.2% increase in twelve months (or R$ 143 million) and up by 1.3% in three months. Excluding the effect of exchange rate fluctuations, the portfolio reduced by 5.2% in twelve months and by 4.0% in three months. Loans to the SMEs segment reached R$ 35,319 million, a 8.5% increase in twelve months (or R$ 2,767 million) and up by 2.9% in three months. This segment has specialized services and sector-oriented offers, as well as a non-financial proposal offered through the “Programa Avançar”. This makes us well positioned to expand our portfolio and increase our customer base and loyalty levels.
|
18
 |
Individuals and Corporate & SMEs Loan Portfolio by Product
MANAGERIAL BREAKDOWN OF CREDIT | Jun-18 | Jun-17 | Var. | Mar-18 | Var. |
PORTFOLIO BY PRODUCT(R$ million) |
|
| 12M |
| 3M |
Individuals |
|
|
|
|
|
Leasing / Auto Loans¹ | 1,988 | 1,782 | 11.5% | 1,893 | 5.0% |
Credit Card | 25,727 | 20,921 | 23.0% | 24,422 | 5.3% |
Payroll Loans | 30,803 | 21,959 | 40.3% | 28,449 | 8.3% |
Mortgages | 30,331 | 27,046 | 12.1% | 29,117 | 4.2% |
Agricultural Loans | 5,005 | 4,186 | 19.5% | 5,329 | -6.1% |
Personal Loans / Others | 25,984 | 21,519 | 20.7% | 24,490 | 6.1% |
Total Individuals | 119,837 | 97,414 | 23.0% | 113,700 | 5.4% |
Consumer Finance | 45,369 | 36,988 | 22.7% | 43,611 | 4.0% |
Corporate and SMEs |
|
|
|
|
|
Leasing / Auto Loans | 2,923 | 2,727 | 7.2% | 2,852 | 2.5% |
Real Estate | 5,120 | 8,207 | -37.6% | 5,802 | -11.8% |
Trade Finance | 26,608 | 23,201 | 14.7% | 24,256 | 9.7% |
On-lending | 10,654 | 11,193 | -4.8% | 11,119 | -4.2% |
Agricultural Loans | 6,228 | 7,017 | -11.3% | 6,271 | -0.7% |
Working capital / Others | 73,741 | 70,018 | 5.3% | 72,787 | 1.3% |
Total Corporate and SMEs | 125,273 | 122,363 | 2.4% | 123,086 | 1.8% |
|
|
|
|
|
|
Total Credit | 290,479 | 256,765 | 13.1% | 280,398 | 3.6% |
Other Credit Risk Transactions with customers² | 77,766 | 68,249 | 13.9% | 73,522 | 5.8% |
Total Expanded Credit Portfolio | 368,245 | 325,014 | 13.3% | 353,920 | 4.0% |
1 Including consumer finance, the auto loan portfolio for individuals totaled R$ 39,772 million in Jun-18 , R$ 38,185 million in Mar-18 and R$ 32,650 million in Jun-17.
2 Including debentures, FIDC, CRI, promissory notes, international distribution promissory notes, acquiring-activities related assets and guarantees.
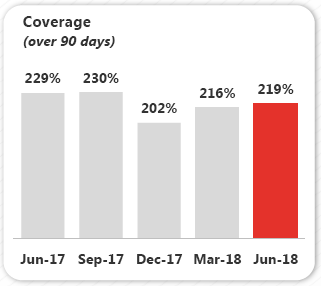
Coverage Ratio The balance of allowance for loan losses amounted to R$ 18,096 million at the end of June 2018, up by 5.0% in twelve months and by 2.0% in three months, reflecting the growth dynamic of our loan portfolio. The coverage ratio reached 219% at the end of June 2018, a 9.5 p.p. drop in twelve months and up by 3.3 p.p. in three months. |
19
 |
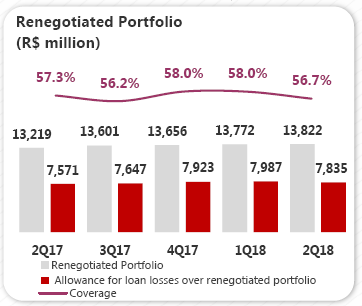
Renegotiated Loan Portfolio Loan renegotiations totaled R$ 13,822 million at the end of June 2018, a 4.6% growth in twelve months and up by 0.4% in three months. These operations comprise loan agreements that were renegotiated to enable their payment under conditions agreed upon with customers, including renegotiations of loans that had already been written-off in the past. At the end of June 2018, the coverage ratio of the renegotiated portfolio reached 56.7%, a level that is considered adequate for these types of transactions. |
|
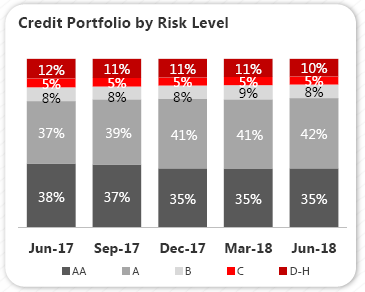
| Credit Portfolio by Risk Level We operate in accordance with our risk culture and international best practices, in order to protect our capital and guarantee the profitability of our businesses. Our credit approval process, particularly the approval of new loans and risk monitoring, is structured according to our classification of customers and products, centered around our retail and wholesale segments. At the end of June 2018, portfolios rated “AA” and “A” accounted for 77% of the total loan portfolio. |
NPL Formation NPL Formation came to R$ 2,937 million, increasing by 0.7% in twelve months and by 8.4% in three months. The ratio between NPL Formation and the loan portfolio reached 1.0%, down by 0.1 p.p. in twelve months and remaining stable in three months. |
|
Note: NPL Formation is obtained from the change in balance of the non-performed portfolio over 90 days and the loan book under renegotiation, disregarding the portfolio written-off as loss in the period.
20
 |
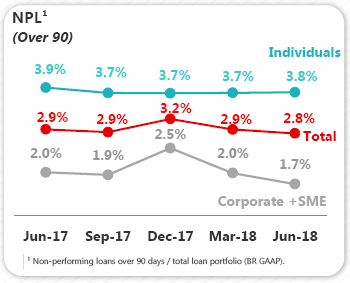
Delinquency Ratio (Over-90-Day) The over-90-day delinquency ratio reached its lowest level at 2.8% in the end of June 2018, down by 0.1 p.p. for both the twelve and three month periods. The performance of the indicators reflect the assertive and our preemptive risk management models. Delinquency in the individuals segment reached 3.8% in the period, down by 0.1 p.p. in twelve months and up by 0.1 p.p. when compared to the past quarter. Delinquency in the corporate and SMEs segment reached 1.7%, falling by 0.3p.p. in the twelve and three month periods.
|  |
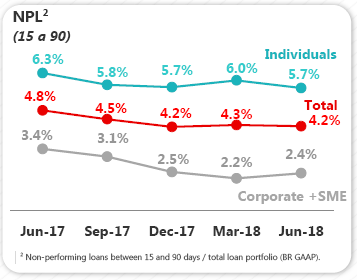
| Delinquency Ratio (15-to-90 Day) The 15-to-90-day delinquency ratio came to 4.2% at the end of June 2018, down by 0.6 p.p. in twelve months and by 0.1p.p. in three months. In the individuals segment, the ratio reached 5.7%, representing a 0.6 p.p. drop in twelve months and down by 0.3 p.p. in three months. In the corporate & SMEs segment at the end of June 2018 came to 2.4%, down by 1.0 p.p. in twelve months and up by 0.2 p.p. versus March 2018. |
21
 |
Funding
FUNDING | Jun-18 | Jun-17 | Var. | Mar-18 | Var. |
(R$ million) |
|
| 12M |
| 3M |
Demand deposits | 17,369 | 16,175 | 7.4% | 16,799 | 3.4% |
Saving deposits | 42,571 | 37,064 | 14.9% | 41,409 | 2.8% |
Time deposits | 177,611 | 122,482 | 45.0% | 159,378 | 11.4% |
Debenture/LCI/LCA¹ | 53,980 | 78,311 | -31.1% | 59,651 | -9.5% |
Financial Bills² | 33,348 | 46,635 | -28.5% | 39,581 | -15.7% |
Funding from clients | 324,879 | 300,668 | 8.1% | 316,818 | 2.5% |
1 Repo operations backed by Debentures, Real Estate Credit Notes (LCI) and Agricultural Credit Notes (LCA)
2 Including Certificates of Structured Operations (COE).
Total customer funding amounted to R$ 324,879 million at the end of 2018, growing by 8.1% in twelve months (or R$ 24,211 million) and by 2.5% in three months. Time deposits continue to record improved performances, increasing by 45.0% in twelve months and by 11.4% in three months. Savings deposits increased by 14.9% in twelve months and by 2.8% in three months.
Credit/Funding Ratio
FUNDING VS. CREDIT | Jun-18 | Jun-17 | Var. | Mar-18 | Var. |
(R$ million) |
|
| 12M |
| 3M |
Funding from customers (A) | 324,879 | 300,668 | 8.1% | 316,818 | 2.5% |
(-) Reserve Requirements | (69,416) | (65,012) | 6.8% | (61,601) | 12.7% |
Funding Net of Reserve Requirements | 255,463 | 235,656 | 8.4% | 255,217 | 0.1% |
Borrowing and Onlendings | 14,450 | 17,334 | -16.6% | 16,207 | -10.8% |
Subordinated Debts | 9,835 | 8,932 | 10.1% | 8,940 | 10.0% |
Offshore Funding | 51,517 | 30,908 | 66.7% | 35,651 | 44.5% |
Total Funding (B) | 331,265 | 292,829 | 13.1% | 316,016 | 4.8% |
Assets under management¹ | 302,162 | 272,118 | 11.0% | 298,943 | 1.1% |
Total Funding and Asset under management | 633,427 | 564,947 | 12.1% | 614,959 | 3.0% |
Total Credit (C) | 290,479 | 256,765 | 13.1% | 280,398 | 3.6% |
C / B (%) | 87.7% | 87.7% |
| 88.7% |
|
C / A (%) | 89.4% | 85.4% |
| 88.5% |
|
1 According to ANBIMA criteria.
The loan portfolio to customer funding ratio was 89.4% at the end of June 2018, growing by 4.0 p.p. in twelve months and 0.9 p.p. in three months. The liquidity metric adjusted for the impact of reserve requirements and medium/long-term funding came to 87.7% in June 2018, remaining stable in twelve months and reducing by 1.0 p.p. in three months. The Bank is in a comfortable liquidity situation, with stable funding sources and an adequate funding structure. |
|
22
 |
BIS Ratio The BIS ratio reached 14.8% at the end of June 2018, declining by 1.7 p.p. in twelve months. This change is mostly explained by the impact on capital deductions under the Basel III schedule, which increased from 80% in 2017 to 100% in 2018. Relative to the previous quarter, this ratio fell by 0.5 p.p., affected by the credit RWA in the period, given the expansion of our loan portfolio. It is worth noting that the BIS ratio is 3.8 p.p. higher than the sum of the minimum Regulatory Capital and Capital Conservation requirements. It is important to mention that, as of the second quarter of 2018, the use of the internal model for Market Risk was approved by the Brazilian Central Bank. Thus, the calculation of this portion is now obtained from the maximum value between the internal methodology and 90% of the standardized approach. It should be noted that, since January 2018, the capital requirement has been changed from 9.25% to 8.625% + conservation capital of 1.875% + additional CET1 for systemically important financial institutions in the Brazilian market of 0.5%, totaling 11%. Tier I Capital is 8.375% and CET1 is 6.875%. | 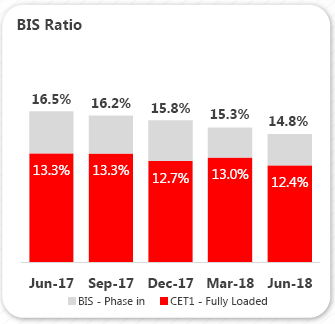 |
In March 2013, the Brazilian Central Bank issued the Basel III rules of capital definition and risk management. These criteria will be implemented gradually by 2019. If we were to apply these Basel III rules immediately and in full, our CET1 would have reached 12.4 % in June 2018, down 0.9 p.p. in twelve months and 0.6 p.p. in three months. The reduction in both periods is mainly attributed to growth in the credit RWA.
OWN RESOURCES AND BIS | Jun-18 | Jun-17 | Var. | Mar-18 | Var. |
(R$ million) |
|
| 12M |
| 3M |
Tier I Regulatory Capital | 57,153 | 57,797 | -1.1% | 57,799 | -1.1% |
CET1 | 52,271 | 53,609 | -2.5% | 53,590 | -2.5% |
Additional Tier I | 4,882 | 4,188 | 16.6% | 4,209 | 16.0% |
Tier II Regulatory Capital | 4,953 | 4,250 | 16.6% | 4,198 | 18.0% |
Adjusted Regulatory Capital (Tier I and II) | 62,106 | 62,047 | 0.1% | 61,997 | 0.2% |
Risk Weighted Assets (RWA) | 420,588 | 375,988 | 11.9% | 405,945 | 3.6% |
Credit Risk Capital requirement | 354,414 | 315,851 | 12.2% | 336,105 | 5.4% |
Market Risk Capital requirement | 28,802 | 28,223 | 2.1% | 32,468 | -11.3% |
Operational Risk Capital requirement | 37,372 | 31,914 | 17.1% | 37,372 | 0.0% |
Basel Ratio | 14.77% | 16.50% | -1.74 p.p. | 15.27% | -0.51 p.p. |
Tier I | 13.59% | 15.37% | -1.78 p.p. | 14.24% | -0.65 p.p. |
CET1 | 12.43% | 14.26% | -1.83 p.p. | 13.20% | -0.77 p.p. |
Tier II | 1.18% | 1.13% | 0.05 p.p. | 1.03% | 0.14 p.p. |
23
 |
1 Historical prices excluding dividends and interest on capital. Source: Bloomberg.
2 Stock Swap Offer completed on October 30th, 2014
24
 |
Our shares
Indicators
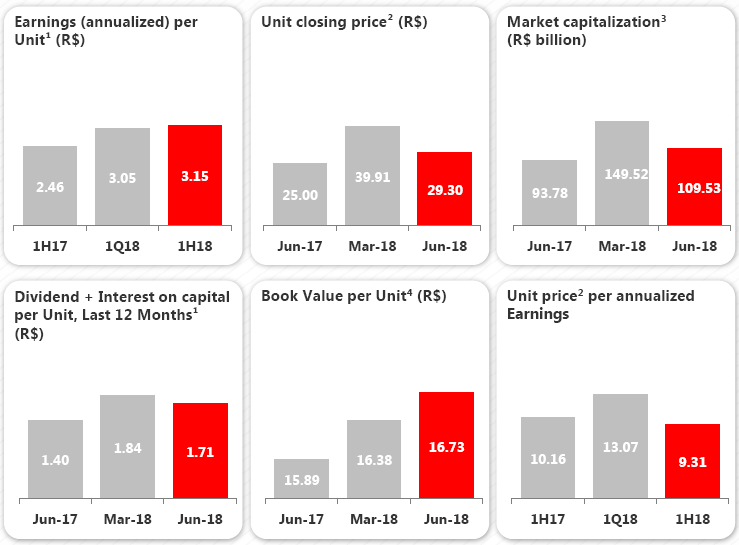
1 Considers the number of Units disregarding treasury shares at the end of the period.
2 Closing price at the end of the period.
3 Market Capitalization: Total Units (Unit = 1 Common + 1 Preferred) x Unit closing price at the end of the period.
4 Book Value excludes goodwill.
Earnings Distribution
In the quarter, Santander Brasil apportioned R$600 million as dividend payable on July 27th, 2018. As a result, in the first half of 2018 earnings distribution totaled R$ 1.2 billion.
25
 |
Rating Agencies
Santander is rated by international rating agencies and the ratings it receives reflect several factors, including the quality of its management, its operational performance and financial strength, as well as other variables related to the financial sector and the economic environment in which the company operates, with its long-term foreign currency rating limited to the sovereign rating. The table below presents the ratings assigned by Standard & Poor's and Moody's:
|
| Global Scale | National Scale | ||||||
|
| ||||||||
Ratings |
| Local Currency | Foreign Currency | National | |||||
| Long-term | Short-term |
| Long-term | Short-term |
| Long-term | Short-term | |
Standard & Poor’s¹ (outlook) | BB- (stable) | B |
| BB- (stable) | B |
| brAAA (stable) | brA-1+ | |
|
|
| |||||||
Moody's² (outlook) |
| Ba1 (stable) | NP |
| Ba3 (stable) | NP |
| Aaa.br | Br-1 |
|
|
| |||||||
1 Last update on July 11th, 2018.
2 Last update on April 10th, 2018.
26
 |
Accounting and Managerial Results Reconciliation
For a better understanding of BR GAAP results, the reconciliation between the accounting result and the managerial result is presented below.
ACCOUNTING AND MANAGERIAL | 1H18 | Reclassifications | 1H18 | |||||
RESULTS RECONCILIATION(R$ million) | Accounting | Exchange Hedge¹ | Credit Recovery² | Amort. of goodwill³ | Profit Sharing | FX | Other events5 | Managerial |
Net Interest Income | 15,856 | 5,897 | (1,129) | - | - | - | - | 20,623 |
Allowance for Loan Losses | (6,490) | - | 1,235 | - | - | - | - | (5,256) |
Net Interest Income after Loan Losses | 9,365 | 5,897 | 106 | - | - | - | - | 15,367 |
Fees | 8,409 | - | - | - | - | - | - | 8,409 |
General Expenses | (8,911) | - | - | 139 | (900) | - | - | (9,672) |
Personnel Expenses | (3,695) | - | - | - | (900) | - | - | (4,595) |
Administrative Expenses | (5,216) | - | - | 139 | - | - | - | (5,077) |
Tax Expenses | (1,512) | (476) | - | - | - | - | - | (1,988) |
Investments in Affiliates and Subsidiaries | 9 | - | - | - | - | - | - | 9 |
Other Operating Income/Expenses | (2,458) | - | (106) | - | - | - | (203) | (2,766) |
Operating Income | 4,902 | 5,420 | - | 139 | (900) | - | (203) | 9,359 |
Non Operating Income | 27 | - | - | - | - | - | - | 27 |
Net Profit before Tax | 4,929 | 5,420 | - | 139 | (900) | - | (203) | 9,386 |
Income Tax and Social Contribution | 1,936 | (5,420) | - | - | - | - | 155 | (3,329) |
Profit Sharing | (900) | - | - | - | 900 | - | - | - |
Minority Interest | (173) | - | - | - | - | - | - | (173) |
Net Profit | 5,792 | - | - | 139 | - | - | (47) | 5,884 |
ACCOUNTING AND MANAGERIAL | 1H17 | Reclassifications | 1H17 | |||||
RESULTS RECONCILIATION(R$ million) | Accounting | Exchange Hedge¹ | Credit Recovery² | Amort. of goodwill³ | Profit Sharing | FX | Other events5 | Managerial |
Net Interest Income | 18,492 | 698 | (1,335) | - | - | 111 | - | 17,966 |
Allowance for Loan Losses | (5,961) | - | 1,384 | - | - | (47) | - | (4,624) |
Net Interest Income after Loan Losses | 12,531 | 698 | 49 | - | - | 64 | - | 13,342 |
Fees | 7,501 | - | - | - | - | - | - | 7,501 |
General Expenses | (9,425) | - | - | 911 | (665) | - | - | (9,179) |
Personnel Expenses | (3,741) | - | - | - | (665) | - | - | (4,406) |
Administrative Expenses | (5,685) | - | - | 911 | - | - | - | (4,773) |
Tax Expenses | (1,729) | (68) | - | - | - | - | - | (1,798) |
Investments in Affiliates and Subsidiaries | 16 | - | - | - | - | - | - | 16 |
Other Operating Income/Expenses | (2,787) | - | (49) | - | - | (64) | - | (2,900) |
Operating Income | 6,106 | 630 | - | 911 | (665) | - | - | 6,983 |
Non Operating Income | (278) | - | - | - | - | - | - | (278) |
Net Profit before Tax | 5,828 | 630 | - | 911 | (665) | - | - | 6,705 |
Income Tax and Social Contribution | (1,269) | (630) | - | - | - | - | - | (1,899) |
Profit Sharing | (665) | - | - | - | 665 | - | - | - |
Minority Interest | (190) | - | - | - | - | - | - | (190) |
Net Profit | 3,704 | - | - | 911 | - | - | - | 4,615 |
27
 |
ACCOUNTING AND MANAGERIAL | 2Q18 | Reclassifications | 2Q18 | |||||
RESULTS RECONCILIATION(R$ million) | Accounting | Exchange Hedge¹ | Credit Recovery² | Amort. of goodwill³ | Profit Sharing | FX | Other events5 | Managerial |
Net Interest Income | 5,307 | 5,730 | (577) | - | - | - | - | 10,460 |
Allowance for Loan Losses | (3,199) | - | 596 | - | - | - | - | (2,604) |
Net Interest Income after Loan Losses | 2,107 | 5,730 | 19 | - | - | - | - | 7,856 |
Fees | 4,275 | - | - | - | - | - | - | 4,275 |
General Expenses | (4,503) | - | - | 70 | (434) | - | - | (4,867) |
Personnel Expenses | (1,852) | - | - | - | (434) | - | - | (2,286) |
Administrative Expenses | (2,650) | - | - | 70 | - | - | - | (2,581) |
Tax Expenses | (564) | (460) | - | - | - | - | - | (1,024) |
Investments in Affiliates and Subsidiaries | 6 | - | - | - | - | - | - | 6 |
Other Operating Income/Expenses | (1,261) | - | (19) | - | - | - | (152) | (1,432) |
Operating Income | 60 | 5,270 | - | 70 | (434) | - | (152) | 4,814 |
Non Operating Income | 15 | - | - | - | - | - | - | 15 |
Net Profit before Tax | 75 | 5,270 | - | 70 | (434) | - | (152) | 4,829 |
Income Tax and Social Contribution | 3,421 | (5,270) | - | - | - | - | 135 | (1,714) |
Profit Sharing | (434) | - | - | - | 434 | - | - | - |
Minority Interest | (90) | - | - | - | - | - | - | (90) |
Net Profit | 2,972 | - | - | 70 | - | �� - | (17) | 3,025 |
ACCOUNTING AND MANAGERIAL | 1Q18 | Reclassifications | 1Q18 | |||||
RESULTS RECONCILIATION(R$ million) | Accounting | Exchange Hedge¹ | Credit Recovery² | Amort. of goodwill³ | Profit Sharing | FX | Other events5 | Managerial |
Net Interest Income | 10,549 | 167 | (552) | - | - | - | - | 10,163 |
Allowance for Loan Losses | (3,291) | - | 639 | - | - | - | - | (2,652) |
Net Interest Income after Loan Losses | 7,258 | 167 | 87 | - | - | - | - | 7,511 |
Fees | 4,134 | - | - | - | - | - | - | 4,134 |
General Expenses | (4,408) | - | - | 69 | (466) | - | - | (4,805) |
Personnel Expenses | (1,843) | - | - | - | (466) | - | - | (2,309) |
Administrative Expenses | (2,566) | - | - | 69 | - | - | - | (2,497) |
Tax Expenses | (948) | (16) | - | - | - | - | - | (964) |
Investments in Affiliates and Subsidiaries | 3 | - | - | - | - | - | - | 3 |
Other Operating Income/Expenses | (1,197) | - | (87) | - | - | - | (51) | (1,334) |
Operating Income | 4,842 | 150 | - | 69 | (466) | - | (51) | 4,545 |
Non Operating Income | 13 | - | - | - | - | - | - | 13 |
Net Profit before Tax | 4,854 | 150 | - | 69 | (466) | - | (51) | 4,557 |
Income Tax and Social Contribution | (1,485) | (150) | - | - | - | - | 20 | (1,615) |
Profit Sharing | (466) | - | - | - | 466 | - | - | - |
Minority Interest | (83) | - | - | - | - | - | - | (83) |
Net Profit | 2,820 | �� - | - | 69 | - | - | (30) | 2,859 |
1 Foreign Exchange Hedge:under Brazilian tax rules, gains (losses) derived from exchange rate fluctuations on foreign currency investments are not taxable (tax deductible). This tax treatment leads to exchange rate exposure to taxes. An exchange rate hedge position was set up with the purpose of protecting the net profit from the impact of foreign exchange fluctuations related to this tax exposure.
2 Credit Recovery: reclassified from revenue from loan operations to allowance for loan losses and, from 2017 onwards, it includes provision for guarantees provided.
3 Amortization of Goodwill: reversal of goodwill amortization expenses.
4 Exchange Rate Fluctuation: includes, in addition to the effect of the exchange rate fluctuation, reclassifications between different lines of the Bank’s results (other operating income/expenses, allowance for loan losses and non-operating result) for better comparability with previous quarters.
5 Other events:
2018
1Q18:
Adhesion effect to the installment payment program for outstanding taxes and social security debts (in accordance with Provisional Measure No. 783/2017).
2Q18:
Includes a gain of R$ 816 MM from the adjustment of post-employment benefits, additional provisions for contingencies in the amount of R$ 358 MM, impairment of intangible assets (systems acquisition and development) in the amount of R$ 306 MM and a write-off of tax credits in the amount of R$ 74 MM.
28
 |

29
 |
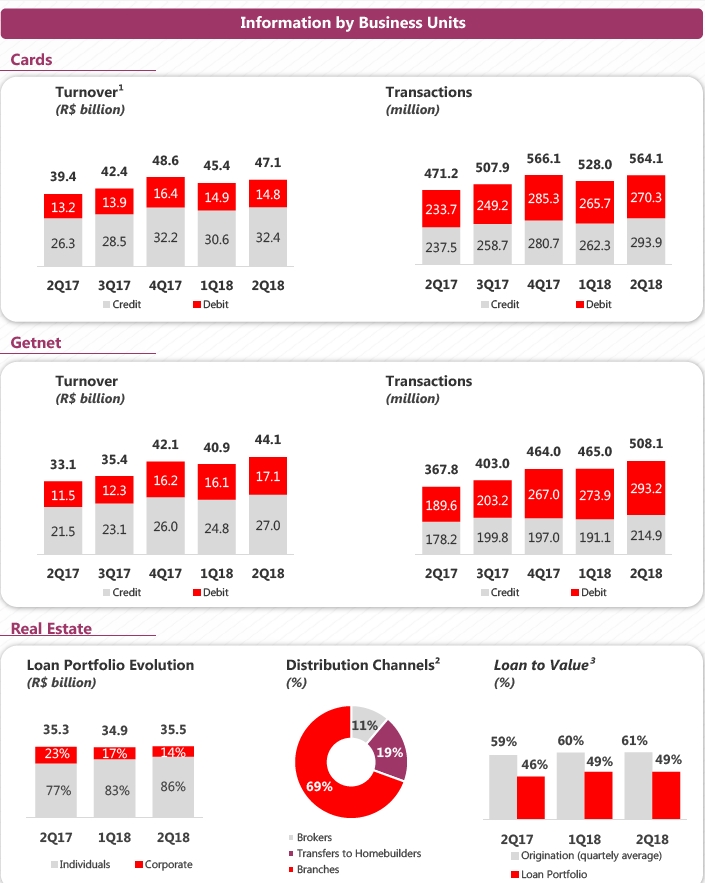
1 Cards turnover do not include withdrawal transactions, it only considers purchase volumes.
2 Individuals' origination. ³ Ratio between Loans and Collateral Value.
30
 |
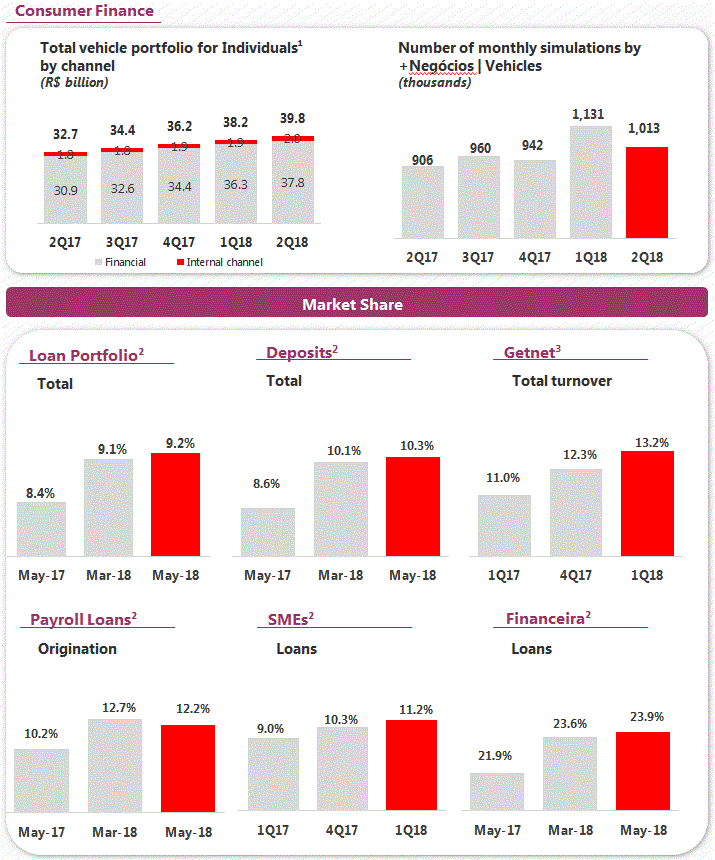
1 Vehicle portfolio for Individuals, considers the Individuals' portfolio generated by the internal channel as well as by the Individuals' portfolio from the Consumer Finance segment.
2 Brazilian Central Bank. ³ ABECS - Acquiring
31
 |

Banco Santander (Brasil) S.A. | ||
| By: | /S/ Amancio Acurcio Gouveia | |
Amancio Acurcio Gouveia Officer Without Specific Designation | ||
| By: | /S/ Angel Santodomingo Martell | |
Angel Santodomingo Martell Vice - President Executive Officer | ||
32


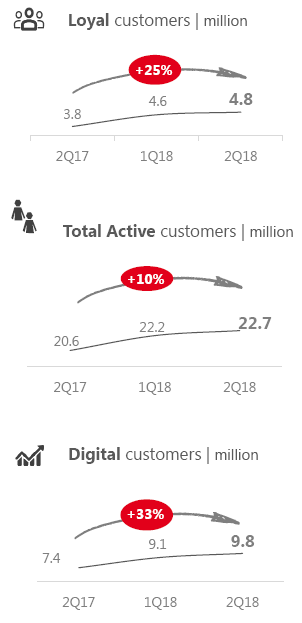
 Customer loyalty:
 Retail
 Agro
Agro Getnet
 SMEs
SMEs Strengthening leading businesses
 Sustainability: