UNITED STATES
SECURITIES AND EXCHANGE COMMISSION
Washington, D.C. 20549
FORM 6-K
REPORT OF FOREIGN PRIVATE ISSUER PURSUANT TO RULE 13a-16 OR 15d-16 UNDER THE
SECURITIES EXCHANGE ACT OF 1934
For the month of October, 2018
Commission File Number: 001-34476
BANCO SANTANDER (BRASIL) S.A.
(Exact name of registrant as specified in its charter)
Avenida Presidente Juscelino Kubitschek, 2041 and 2235
Bloco A – Vila Olimpia
São Paulo, SP 04543-011
Federative Republic of Brazil
(Address of principal executive office)
Indicate by check mark whether the registrant files or will file annual reports under cover of Form 20-F or Form 40-F:Form 20-F ___X___ Form 40-F _______ Indicate by check mark if the registrant is submitting the Form 6-K in paper as permitted by Regulation S-T Rule 101(b)(1):
Yes _______ No ___X____
Indicate by check mark if the registrant is submitting the Form 6-K in paper as permitted by Regulation S-T Rule 101(b)(7):
Yes _______ No ___X____
Indicate by check mark whether by furnishing the information contained in this Form, the Registrant is also thereby furnishing the information to the Commission pursuant to Rule 12g3-2(b) under the Securities Exchange Act of 1934:
Yes _______ No ___X____
If “Yes” is marked, indicate below the file number assigned to the registrant in connection with Rule 12g3-2(b): N/A

Table of Contents
Managerial Analysis of ResultsBR GAAP
2
Data Summary for the Period
The information presented in this report excludes the non-recurring events that can be found on pages 27 and 28(Accounting and Managerial Results Reconciliation).
MANAGERIAL1 ANALYSIS - BR GAAP | 9M18 | 9M17 | Var. | 3Q18 | 2Q18 | Var. |
| | | | 12M | | 3M |
RESULTS (R$ million) | | | | | | |
Net interest income | 31,253 | 27,829 | 12.3% | 10,629 | 10,460 | 1.6% |
Fees | 12,544 | 11,372 | 10.3% | 4,135 | 4,275 | -3.3% |
Allowance for loan losses | (7,874) | (7,053) | 11.6% | (2,618) | (2,604) | 0.6% |
General Expenses² | (14,692) | (13,985) | 5.1% | (5,020) | (4,867) | 3.2% |
Personnel Expenses | (6,926) | (6,725) | 3.0% | (2,331) | (2,286) | 2.0% |
Administrative Expenses | (7,767) | (7,260) | 7.0% | (2,690) | (2,581) | 4.2% |
Managerial net profit³ | 8,992 | 7,201 | 24.9% | 3,108 | 3,025 | 2.8% |
Accounting net profit | 8,831 | 5,499 | 60.6% | 3,039 | 2,972 | 2.2% |
| | | | | | |
BALANCE SHEET (R$ million) | | | | | | |
Total assets | 769,990 | 676,768 | 13.8% | 769,990 | 739,071 | 4.2% |
Securities and Derivative Financial Instruments | 179,682 | 182,557 | -1.6% | 179,682 | 187,417 | -4.1% |
Loan portfolio | 298,433 | 262,965 | 13.5% | 298,433 | 290,479 | 2.7% |
Individuals | 125,336 | 102,263 | 22.6% | 125,336 | 119,837 | 4.6% |
Consumer finance | 47,274 | 39,178 | 20.7% | 47,274 | 45,369 | 4.2% |
SMEs | 36,269 | 32,945 | 10.1% | 36,269 | 35,319 | 2.7% |
Corporate | 89,554 | 88,579 | 1.1% | 89,554 | 89,954 | -0.4% |
Expanded Loan Portfolio⁴ | 380,713 | 336,475 | 13.1% | 380,713 | 368,245 | 3.4% |
Funding from Clients⁵ | 336,997 | 309,244 | 9.0% | 336,997 | 324,879 | 3.7% |
Deposits (demand, saving and time) | 246,476 | 201,417 | 22.4% | 246,476 | 237,551 | 3.8% |
Equity⁶ | 64,824 | 61,564 | 5.3% | 64,824 | 62,529 | 3.7% |
| | | | | | |
PERFORMANCE INDICATORS (%) | | | | | | |
Return on average equity excluding goodwill⁶ - annualized | 19.4% | 16.3% | 3.1 p.p. | 19.5% | 19.5% | 0.0 p.p. |
Return on average asset excluding goodwill⁶ - annualized | 1.6% | 1.4% | 0.2 p.p. | 1.6% | 1.7% | -0.1 p.p. |
Efficiency ratio⁷ | 39.8% | 44.0% | -4.2 p.p. | 39.7% | 39.6% | 0.1 p.p. |
Recurrence ratio⁸ | 85.4% | 81.3% | 4.1 p.p. | 82.4% | 87.8% | -5.4 p.p. |
BIS ratio | 15.3% | 16.2% | -0.9 p.p. | 15.3% | 14.8% | 0.5 p.p. |
Tier I | 14.1% | 15.2% | -1.1 p.p. | 14.1% | 13.6% | 0.5 p.p. |
Tier II | 1.1% | 1.0% | 0.1 p.p. | 1.1% | 1.2% | -0.1 p.p. |
CET1 - Fully Loaded | 12.6% | 13.3% | -0.7 p.p. | 12.6% | 12.4% | 0.2 p.p. |
| | | | | | |
PORTFOLIO QUALITY INDICATORS (%) | | | | | | |
Delinquency ratio (over 90 days) | 2.9% | 2.9% | 0.0 p.p. | 2.9% | 2.8% | 0.1 p.p. |
Individuals | 3.8% | 3.7% | 0.1 p.p. | 3.8% | 3.8% | 0.0 p.p. |
Corporate & SMEs | 1.9% | 1.9% | 0.0 p.p. | 1.9% | 1.7% | 0.2 p.p. |
Coverage ratio (over 90 days) | 207.1% | 229.7% | -22.6 p.p. | 207.1% | 219.4% | -12.3 p.p. |
Delinquency ratio (over 60 days) | 3.7% | 3.6% | 0.1 p.p. | 3.7% | 3.7% | 0.0 p.p. |
| | | | | | |
OTHER DATA | | | | | | |
Assets under management9 - AUM (R$ million) | 301,541 | 296,043 | 1.9% | 301,541 | 302,162 | -0.2% |
Branches | 2,276 | 2,255 | 21 | 2,276 | 2,262 | 14 |
PABs (mini branches) | 1,168 | 1,169 | (1) | 1,168 | 1,228 | (60) |
Own ATMs | 13,607 | 13,507 | 100 | 13,607 | 13,516 | 91 |
Shared ATMs | 22,447 | 20,940 | 1,507 | 22,447 | 22,103 | 344 |
Employees10 | 47,836 | 46,734 | 1,102 | 47,836 | 48,008 | (172) |
| | | | | | |
1 Excluding 100% of the goodwill amortization expense, the foreign exchange hedge effect and other adjustments, as described on pages 27 and 28.
2 Administrative expenses exclude 100% of the goodwill amortization expense. Personnel expenses include profit-sharing.
3 Managerial net profit corresponds to the corporate net profit, excluding the extraordinary result and the 100% reversal of the goodwill amortization expense that occurred in the period. Goodwill amortization expenses were R$ 70 million in 3Q18, R$ 70 million in 2Q18 and R$ 457 million in 3Q17.
4 Including other credit risk transactions (debentures, FDIC, CRI, promissory notes, international distribution promissory notes, acquiring-activities related assets and guarantees).
5 Including Savings, Demand Deposits, Time Deposits, Debentures, LCA, LCI, Financial Bills and Certificates of Structured Operations ("COE").
6 Excluding 100% of the goodwill balance (net of amortization), which amounted to R$ 727 million in 3Q18, R$ 796 million in 2Q18 and R$ 795 million in 3Q17.
7 Efficiency Ratio: General Expenses / (Net Interest Income + Fees + Tax Expenses + Other Operating Income/Expenses).
8 Recurrence Ratio: Fees / General Expenses.
9 According to ANBIMA (Brazilian Financial and Capital Markets Association) criteria.
10 As of 1Q18, it includes technology companies Produban and Isban.
3
Strategy
Banco Santander Brasil is the only international bank with scale in the country. We are convinced that the best way to grow in a profitable, recurring and sustainable manner is by providing excellent services to enhance customer satisfaction levels and attract more customers, making them more loyal.Our actions are based on establishing close and long-lasting relationships with customers, suppliers and shareholders. To accomplish that goal, our purpose is to help people and businesses prosper by being a Simple, Personal and Fair Bank, guided by the following strategic priorities:

| 
| 
| 
|
Increase customer
preference and
loyalty by offering
targeted, simple,
digital and
innovative
products and
services through a
multi-channel
platform. | Improve the
profitability, recurrence
and sustainability of
our results by growing
in businesses with
greater revenue
diversification, aiming
to strike a balance
between loan, funding
and services, while
maintaining a
preemptive risk
management approach
and rigorous cost
control. | Be disciplined with
capital and
liquidity to
preserve our
solidity, face
regulatory
changes and seize
growth
opportunities. | Boost productivity
through an
intense agenda of
commercial
improvements
that enable us to
offer a complete
portfolio of
services. |
|
|
|
|
|
|
|
|
|
|
|
|
|
|
In this quarter we highlight the solid profitability performance, which reflects our sustainable business model and our focus on improving customer experience and satisfaction. As a result, we increased our client base and expanded our NPS (Net Promoter Score) indicator, which proves the improvement in our services. We continue to capture the synergies of our ecosystem along with the continuous strive for operational excellence that is already showing results. All these achievements are derived from the high engagement level of our employees and strong internal culture. Among our initiatives in the quarter, we highlight: |
 |  |
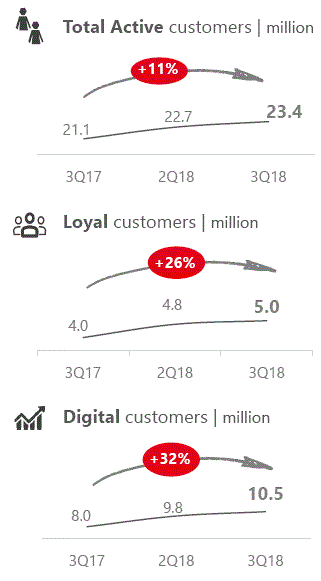
| Engaged employees foster the sustainability of our business.We continued to work on keyfronts, such as cultivating clear and horizontalcommunication of top management withemployees, promoting meritocracy, encouragingindividual leadership in technical training andintrapreneurship. | The high level of employee engagement,combined with our innovations and continuousquest for operational efficiency, points us in theright direction towards excellence in our services.This quarter, our NPS (Net Promoter Score), a toolused to gauge customer experience, reached 55points, which represents 4.0 points rise comparedto the previous quarter. |
 During the quarter, we were recognized, forthe 3rdconsecutive year, as one of the bestcompanies to work for in Brazil, accordingto the GPTW (Great Place to Work) survey.The jump of 14 positions from last yearshows the consolidation of our internalculture and employee engagement. During the quarter, we were recognized, forthe 3rdconsecutive year, as one of the bestcompanies to work for in Brazil, accordingto the GPTW (Great Place to Work) survey.The jump of 14 positions from last yearshows the consolidation of our internalculture and employee engagement. | As a result of our actions, we further expandedour customer base, highlighted by active currentaccount holders, who have been growing for 40months in a row. |
4
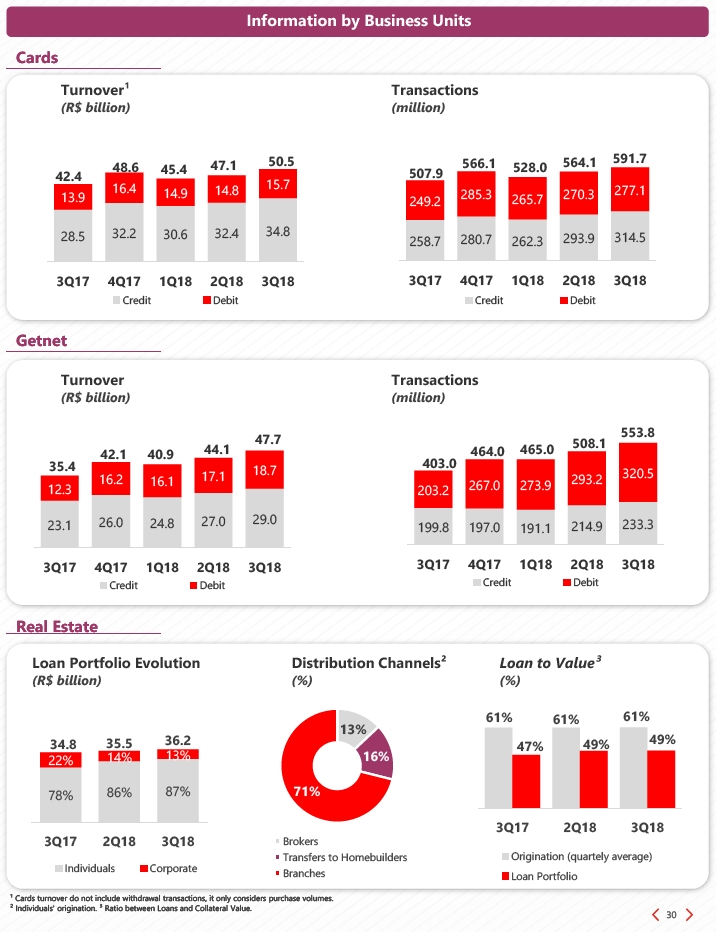
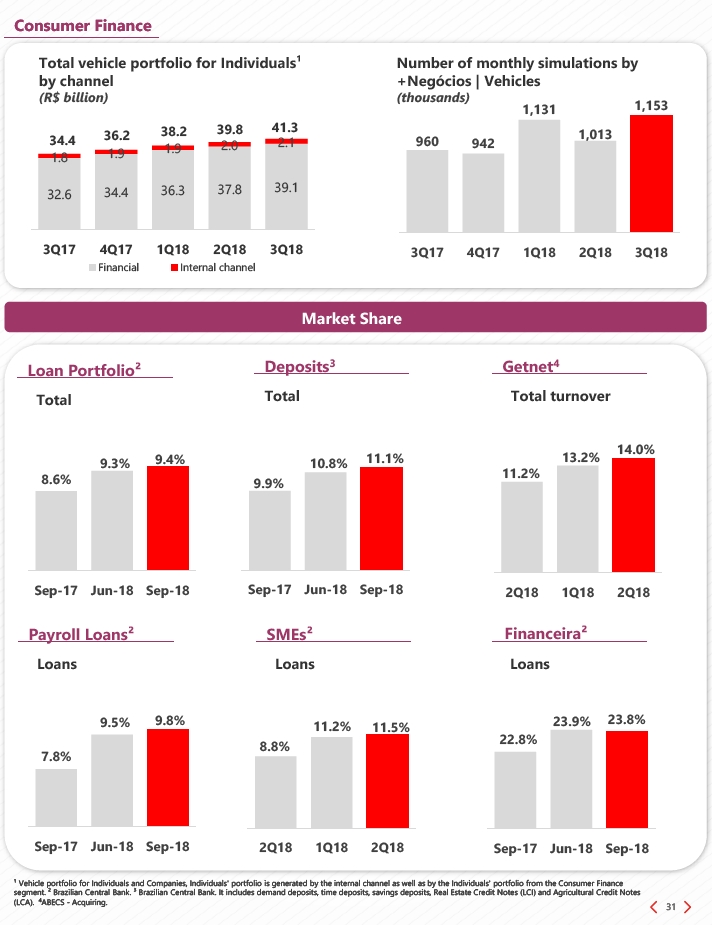
| | Payroll Loans: the high production level allowed us to expand our loan market share to 9.8%1, a 2.0 p.p. increase in twelve months. In the quarter, the number of contracts generated through our digital channels advanced 1.3x QoQ, reflecting good costumer acceptance. |
| Real Estate: mortgage origination increased by 2.3²x in comparison with the same period of the previous year. The industrialization of our internal processes already shows advances in efficiency: lead time³ reduced 18% while agreements issued4 increased by 1.1x. |
| 
We maintained our position as the agribusiness partner bank by providing quality services and an assertive offering catered to the entire production chain. During the quarter, we announced the winners of the Novo Agro Award, in partnership with Esalq-USP, which recognizes and celebrates the good practices of national producers and entrepreneurship. We also inaugurated two agribusiness-dedicated stores, totaling 18 spaces at the end of September 2018. As a result of the improvement of our processes, lead time3 fell 26% and agreements issued4 increased by 2.9x. |
| 
We were recognized by the Visão Agro Centro-Sul Award5 as the biggest supporter of transformation in the sugarcane agribusiness in Brazil. |

Cards: we continued to accelerate our business opportunities by launching the NFC tag (technology for contactless payments) for watch bands, which complements the Santander Pass offering. In addition to that, as of this quarter, non-account holders are able to sign up for the credit card at our branches. With the purpose of broadening our product offering, the AAdvantage® credit card has incorporated the debit function and is being marketed at special rates for current account holders. Total turnover grew 19% YoY in 3Q18, the eleventh consecutive quarter of double-digit growth. The market share in credit portfolio reached 12.9%¹, went up 1.2 p.p. YoY. | | 
In this quarter, total revenue grew 35% in twelve months while market share expanded 2.8 p.p. YoY reaching 14.0%6. To support the e-commerce segment we launched in this quarter a platform that provides the financial intermediation between the marketplace and storekeepers also includes several financial services. Among the financial services provided, we highlight the acceptance and generation of bills, sales conciliation, anti-fraud system, among others. Thus, we strengthen our position in e-commerce. |
¹ Source: Brazilian Central Bank, as of September/18.
² Source: Brazilian Central Bank, cumulative figures between January and September of 2018.
³ Comparison between Jan-18 and Sept-18 4 Comparison between the average of the last vintages between Jan-18 and Sept-18 5 Executed by AR Empreendimentos and supervised by GEGIS (Grupo de estudos do setor sucroenergético) and Revista Visão da Agroindústria. 6 Source: ABECS – Acquirers, as of June 2018.
5
In addition, we announced the digital POS that will assist our clients in managing their businesses and our strategy is to offer customized solutions to market niches. In order to reach more clients, in this quarter we included service kiosks in street markets to offer Superget among others financial products. | | sales conversion. Since its launch, 86% of leads received information on buyers from the Cockpit. |

• We continued to gain market share, which reached 11.5%7 (+2.7 p.p. YoY). Our strategy is based on sector-oriented offers, with specialized service, and a non-financial offering through the "Avançar" Program. This quarter, we included basic education in our sector-oriented portfolio through a monthly tuition payment solution via credit card, which was developed in collaboration with Getnet. Moreover, it also includes non-financial offerings, such as access to Universia and the learning management platform. Within the scope of the "Avançar" Program, we inaugurated 5 spaces to hold events and entrepreneur meetings. All of these factors help us keep expanding our customer base and strengthening loyalty. | | We are still recognized as leaders: • Santander Corporate & Investment Banking (SCIB):
Financial advisory for financing and concession auctions and finance structuring, according to Anbima9 and advisor in Brazil and LATAM according to Dealogic9.
In the foreign exchange market according to the Brazilian Central Bank10.
 Santander Corretora was ranked11 in the 1st place in stock recommendation by newspaper Valor Econômico. |

• Santander Financiamentos: the market share reached 23.8%8 (+1.0 p.p. in twelve months), sustaining our leadership in the segment. This quarter, we were once again pioneers in the sector with the launch of +Fidelidade, an incentive model to store owners based on their level of loyalty and relationship with Santander Brasil. In addition, we enhanced the customer's after-sales process, through several functionalities in an online portal that provides autonomy and practicality. As a result, we have already seen an increase in the segment's NPS, as well as greater operational efficiency. | | 
• In the Sustainability space, we maintained our leadership in the microcredit market through the “Prospera” program, whose credit portfolio at the end of September 2018 grew 47% in twelve months. In Universidades segment (higher education), we held “Preparadão Universia,” an education event that had workshops, booths with educational institutions and the biggest class in the world. This reinforces Grupo Santander's position as the company that invests the most in education in the world – in Brazil alone, we have awarded around 11.3 thousand scholarships since 2015. •We expanded our activities in the promotion of clean energy through a new credit line which finances solar energy equipment and can be hired directly at the branches. We believe in this market’s potential in the upcoming years and thus we are strengthening our positioning.
|
• Webmotors:the Cockpit tool maintains a good implementation pace in stores and a high level of activation, reaching 78%. This platform brings together several solutions for the entire process of buying and selling vehicles and one of its functions is to improve | | ¹ Source: Brazilian Central Bank, as of September/18. ² Source: Brazilian Central Bank, cumulative figures between January and September of 2018. 3 Comparison between Jan-18 and Sept-18 4 Comparison between the average of the last vintages between Jan-18 and Sept-18 5 Executed by AR Empreendimentos and supervised by GEGIS (Grupo de estudos do setor sucroenergético) and Revista Visão da Agroindústria. 6 Source: ABECS – Acquirers, as of June 2018. 7 Source: Brazilian Central Bank, as of June 2018. 8 Source: Brazilian Central Bank, as of September of 2018. Total market share of vehicles (considering individuals and companies). 9 Financial Advisory in the Americas. Dealogic. 9M18 and Financial Advisory – leadership since 2008, ANBIMA 2017. 10 Cumulative between Jan-18 and Sept-18 11 Considering the performance from January through August 2018. |
6
ExecutiveSummary

| Our performance is a testament to the sustainability of our business model, with afocus on the customer and on generating greater value to shareholders. Although economic activity indicators still point to weak domestic demand, we continue to expand our loan portfolio through profitable market share gains. This annual expansion of the loan balancefor the seventh consecutive quarter derived from solidrisk management and the effectiveness of our models, maintaining quality indicatorsat controlled levels. As a result, our total revenue has grown steadily on a year-on-year basis since 1Q15, with positive contributions from both net interest income and fees.At the same time, our industrial operating model enables the constant improvement of the efficiency ratio. Due to the combination of all these factors, our profitability has remained with yearly growth and consistent. |
Managerial net profit totaled R$ 8,992 million in the first nine months of 2018, growing 24.9% in twelve months and 2.8% in three months. | | Profitability The return on average equity (ROAE), adjusted for goodwill, was 19.4%, in the first nine months of 2018, representing a twelve-month increase of 3.1 p.p. This performance stems from the rise in revenues, through the expansion of our customer base, and greater operational efficiency. |
Total revenues amounted to R$ 43,797 in the first nine months of 2018, rising 11.7% in twelve months (or R$ 4,596 million) and 0.2% in three months. Net interest income reached R$ 31,253 million in the first nine months of 2018, meaning a 12.3% increase in twelve months, influenced by growth in the average loan balance and a stronger participation of retail segments. In three months, net interest income rose 1.6% due to higher revenues from market activities and deposits, while the loan margin was affected by the tightening of spreads. Fees came to R$ 12,544 million, advancing 10.3% in twelve months, driven by an increased customer base and loyalty. Among the revenues that comprise this result, the highlights continue to be credit cards and acquiring activities, alongside current account services and insurance fees. In three months, fees fell by 3.3%, largely explained by fees revisions according to market guidelines and reduced activity in capital markets. | | Allowance for loan losses reached R$ 7,874 million in the year through September 2018, a 11.6% increase, below of the growth of the loan portfolio. In three months, allowance for loan losses rose 0.6%. This evolution in both periods reflects the strength of our risk management and the effectiveness of our mathematical models. |
| General expenses totaled R$ 14,692 million in the first nine months of 2018, climbing 5.1% in twelve months and 3.2% in three months. This rise in both periods is primarily attributed to higher data processing expenses and personnel expenses. It is worth mention that the expansion of our customer base alongside increased transactionality affect our data processing expenses. The efficiency ratio reached 39.7% in the third quarter of 2018, went up 0.1 p.p. in three months. In the first nine months of 2018, the ratio was 39.8% meaning an improvement of 4.2 p.p. in twelve months. |
7
 | BALANCE SHEET AND INDICATORS |
The total loan portfolio amounted to R$ 298,433 million at the end of September 2018, expanding by 13.5% in twelve months (or a 10.4% increase, disregarding the exchange rate fluctuation effect). This quarter, the Individuals and Consumer Finance segments were once again the growth highlights, advancing 22.6% and 20.7% in twelve months, respectively. It is important to note our profitable market share gain in Brazil's total credit market, which reached 9.4% in September of 2018 (+0.8 p.p. in twelve months). In three months, the total portfolio grew 2.7%. The expanded loan portfolio reached R$ 380,713 million, meaning growth of 13.1% in twelve months and 3.4% in three months. | | Total equity excluding R$ 727 million related to the goodwill balance, was R$ 64,824 million at the end of September 2018, climbing 5.3% in twelve months and 3.7% in three months. |
Funding from clientstotaled R$ 336,997 million at the end of September 2018, rising 9.0% in twelve months and 3.7% in three months. In both periods, the performance was chiefly influenced by the increase in time deposits, which went up 25.7% in twelve months and 3.9% in three months. Savings deposits also made a positive contribution, with growth of 15.2% in twelve months and 4.4% compared to June 2018. | | Quality indicators The over-90-day delinquency ratio stood at 2.9% in September 2018, stable in twelve months. In three months, this ratio was 0.1 p.p. higher due to a one-off case in the Corporate segment. The cost of credit hit 3.1% in the third quarter of 2018, which represents a decrease of 0.2 p.p. in twelve months and a 0.1 p.p. decline in three months. The coverage ratio came to 207% in September 2018, falling 22.6 p.p. in twelve months and 12.3 p.p. in three months. The performance in both periods was impacted by the one-off case mentioned above. Portfolio quality indicators remain under control, owing to the effectiveness of our models and the strength of our risk management.
|
| Capital indicators The BIS ratio stood at 15.3% in September 2018, meaning a reduction of 0.9 p.p. in twelve months and an increase of 0.5 p.p. in three months. The fully-loaded CET1 ratio reached 12.6%, down 0.7 p.p. in twelve months and up 0.2 p.p. in three months. |
8
Next, we present our analysis of the managerial results. MANAGERIAL FINANCIAL STATEMENTS¹ | 9M18 | 9M17 | Var. | 3Q18 | 2Q18 | Var. |
(R$ million) | | 12M | | | 3M |
| | | | | | |
Net Interest Income | 31,253 | 27,829 | 12.3% | 10,629 | 10,460 | 1.6% |
Allowance for Loan Losses | (7,874) | (7,053) | 11.6% | (2,618) | (2,604) | 0.6% |
Net Interest Income after Loan Losses | 23,379 | 20,776 | 12.5% | 8,011 | 7,856 | 2.0% |
Fees | 12,544 | 11,372 | 10.3% | 4,135 | 4,275 | -3.3% |
General Expenses | (14,692) | (13,985) | 5.1% | (5,020) | (4,867) | 3.2% |
Personnel Expenses + Profit Sharing | (6,926) | (6,725) | 3.0% | (2,331) | (2,286) | 2.0% |
Administrative Expenses² | (7,767) | (7,260) | 7.0% | (2,690) | (2,581) | 4.2% |
Tax Expenses | (2,992) | (2,712) | 10.3% | (1,004) | (1,024) | -2.0% |
Investments in Affiliates and Subsidiaries | 14 | 26 | -47.1% | 5 | 6 | -24.6% |
Other Operating Income/Expenses | (3,878) | (4,735) | -18.1% | (1,113) | (1,432) | -22.3% |
Operating Income | 14,373 | 10,743 | 33.8% | 5,014 | 4,814 | 4.2% |
Non Operating Income | 33 | (313) | -110.7% | 6 | 15 | -58.0% |
Net Profit before Tax | 14,407 | 10,430 | 38.1% | 5,020 | 4,829 | 4.0% |
Income Tax and Social Contribution | (5,154) | (2,929) | 76.0% | (1,825) | (1,714) | 6.5% |
Minority Interest | (261) | (300) | -13.2% | (87) | (90) | -3.0% |
Net Profit | 8,992 | 7,201 | 24.9% | 3,108 | 3,025 | 2.8% |
¹ Excluding 100% of the goodwill amortization expense, foreign exchange hedge effect and other adjustments, as described on page 27 and 28.
² Excluding 100% of the goodwill amortization expense.
Net Interest Income Net interest income totaled R$ 31,253 million in the first nine months of 2018, growing 12.3% in twelve months (or R$ 3,424 million) and 1.6% in three months. Revenues from loan operations advanced 19.2% in the year to date compared with the same period last year, given the increase in the average volume of the loan portfolio and greater participation of retail segments. In three months, these revenues were slightly higher, by 0.1%, as consequence of stronger volumes, which were partially offset by tighter spreads, in part attributed to regulatory changes in credit cards. Funding revenues in the first nine months of 2018 fell by 10.0% in twelve months, influenced by the decline in the benchmark interest rate in the period. In three months, these revenues experienced a 6.3% increase due to higher volumes. Otherinterest income, which comprises the result of the structural gap in the balance sheet interest rate and activities with treasury clients, among others, expanded by 4.6% in twelve months and 4.5% in three months, thanks to higher revenues from market activities. | 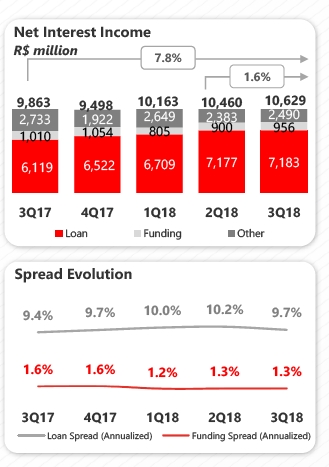
|
9
NET INTEREST INCOME | 9M18 | 9M17 | Var. | 3Q18 | 2Q18 | Var. |
(R$ million) | | 12M | | |
Net Interest Income | 31,253 | 27,829 | 12.3% | 10,629 | 10,460 | 1.6% |
Loan | 21,069 | 17,681 | 19.2% | 7,183 | 7,177 | 0.1% |
Average volume | 282,694 | 255,839 | 10.5% | 293,568 | 283,480 | 3.6% |
Spread (Annualized) | 10.0% | 9.2% | 0.8 p.p | 9.7% | 10.2% | -0.4 p.p |
Funding | 2,661 | 2,955 | -10.0% | 956 | 900 | 6.3% |
Average volume | 283,345 | 244,973 | 15.7% | 295,135 | 285,857 | 3.2% |
Spread (Annualized) | 1.3% | 1.6% | -0.4 p.p | 1.3% | 1.3% | 0.0 p.p |
Other¹ | 7,523 | 7,192 | 4.6% | 2,490 | 2,383 | 4.5% |
¹ Including other margins and the result from financial transactions.
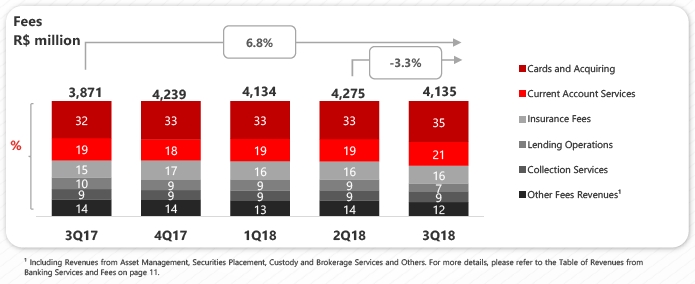
FeesRevenues from Banking Services Revenues from banking services and fees totaled R$ 12,544 million in the year to date, representing a 10.3% rise in twelve months, mostly driven by credit cards and acquiring activities, current account services and insurance fees. In the quarter, these revenues declined by 3.3%. Cards and acquiring fees amounted to R$ 4,227 million in the first nine months of 2018, rising 18.1% relative to the same period of 2017, recording the tenth consecutive quarter of double-digit annual growth. This result is mainly attributed to higher card and acquiring turnover. In the quarter, these revenues went up 3.8%. Current account service fees came to R$ 2,475 million in the year to date, advancing 15.4% in twelve months and 3.0% in three months, in line with the growing base of active current account holders, which has been expanding for 40 consecutive months. | | Insurance fees stood at R$ 1,989 million in the first nine months of 2018, representing growth of 10.8% in twelve months, supported by the credit dynamics in the period. In three months, these revenues declined by 3.6%, given the greater concentration of campaigns that normally occur in the second quarter and affect the comparison. Collection service fees reached R$ 1,120 million in the year to date, climbing 9.4% in twelve months and dropping 3.1% in three months. Lending fees were R$ 1,081 million in the first nine months of 2018, down 3.4% in twelve months and 25.7% in three months. This performance is mostly explained by fee revisions according to market guidelines. Securities placement, custody and brokerage fees totaled R$ 464 million in the year to date, decreasing by 7.1% in twelve months. In three months, these revenues saw a 42.1% drop due to lower capital market activities on the back of the political-economic scenario in the period. |
|
10
FEES INCOME (R$ million) | 9M18 | 9M17 | Var. 12M | 3Q18 | 2Q18 | Var. 3M |
|
|
| | | | | | |
Cards and Acquiring | 4,227 | 3,580 | 18.1% | 1,460 | 1,407 | 3.8% |
Insurance fees | 1,989 | 1,795 | 10.8% | 651 | 676 | -3.6% |
Current Account Services | 2,475 | 2,144 | 15.4% | 851 | 826 | 3.0% |
Asset Management | 758 | 760 | -0.3% | 248 | 258 | -4.0% |
Lending Operations | 1,081 | 1,119 | -3.4% | 296 | 399 | -25.7% |
Collection Services | 1,120 | 1,023 | 9.4% | 367 | 379 | -3.1% |
Placement, Custody and Brokerage of Securities | 464 | 500 | -7.1% | 111 | 192 | -42.1% |
Other | 430 | 451 | -4.6% | 150 | 138 | 9.1% |
Total | 12,544 | 11,372 | 10.3% | 4,135 | 4,275 | -3.3% |
General Expenses (Administrative + Personnel) General expenses, including depreciation and amortization, amounted to R$ 14,692 million in the first nine months of 2018, meaning increases of 5.1% in twelve months (or R$ 708 million) and 3.2% in three months. The performance in both periods is primarily attributed to higher data processing and personnel expenses, accompanying the business dynamics. Administrative and personnel expenses, excluding depreciation and amortization, came to R$ 13,020 million in the year to date, rising 4.4% in twelve months and 3.3% relative to the previous quarter. Personnel expenses, including profit-sharing, reached R$ 6,926 million between January and September 2018, climbing 3.0% in twelve months (or R$ 201 million), largely owing to higher labor charges and compensation expenses, in line with our meritocratic culture and the performance of our business. In three months, these expenses rose 2.0%. Both periods were also impacted by the collective bargaining agreement that took place in September 2018. | | Administrative expenses, excluding depreciation and amortization, stood at R$ 6,094 million in the first nine months of 2018, advancing 6.1%, in twelve months (or R$ 353 million) and 4.8% in comparison with the prior quarter. These increases were largely due to higher data processing expenses, givengreater transactionality and growth in our customer base. Some of these changes were offset by lower expenses with outsourced and specialized services. Depreciation and amortization expenses were R$ 1,672 million in the year to date, up 10.1% in twelve months and 2.3% in three months. 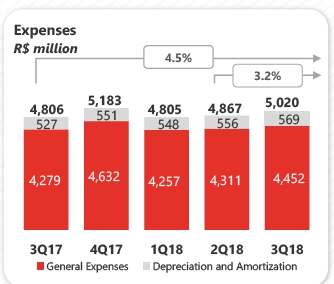
|
11
The efficiency ratio reached 39.7% in the third quarter of 2018, went up 0.1 p.p. in three months. In the first nine months of the year, the ratio was 39.8% meaning a 4.2 p.p. decline in twelve months. Our industrial operating model reinforces our commitment to continually strive for excellence in efficiency. | 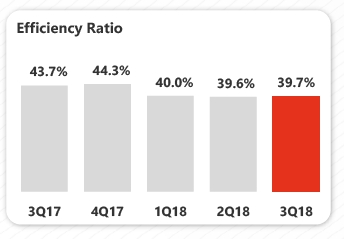
|
EXPENSES' BREAKDOWN | 9M18 | 9M17 | Var. | 3Q18 | 2Q18 | Var. |
| |
(R$ million) | 12M | | | 3M |
Outsourced and Specialized Services | 1,639 | 1,693 | -3.1% | 543 | 582 | -6.7% |
Advertising, promotions and publicity | 366 | 355 | 3.2% | 134 | 133 | 1.1% |
Data processing³ | 1,584 | 1,249 | 26.8% | 585 | 481 | 21.5% |
Communications | 312 | 326 | -4.2% | 108 | 101 | 6.9% |
Rentals | 547 | 548 | -0.3% | 184 | 182 | 1.0% |
Transport and Travel | 126 | 134 | -6.5% | 43 | 43 | 0.3% |
Security and Surveillance | 452 | 452 | 0.1% | 147 | 151 | -2.5% |
Maintenance | 185 | 171 | 8.0% | 61 | 65 | -6.5% |
Financial System Services | 252 | 209 | 20.5% | 93 | 80 | 17.2% |
Water, Electricity and Gas | 142 | 134 | 5.4% | 45 | 47 | -4.6% |
Material | 42 | 46 | -8.7% | 16 | 13 | 26.9% |
Other | 449 | 425 | 5.6% | 163 | 149 | 9.6% |
Subtotal | 6,094 | 5,742 | 6.1% | 2,121 | 2,025 | 4.8% |
Depreciation and Amortization¹ | 1,672 | 1,518 | 10.1% | 569 | 556 | 2.3% |
Total Administrative Expenses | 7,767 | 7,260 | 7.0% | 2,690 | 2,581 | 4.2% |
Compensation² | 4,471 | 4,399 | 1.6% | 1,487 | 1,495 | -0.6% |
Charges | 1,324 | 1,209 | 9.5% | 459 | 420 | 9.4% |
Benefits | 1,081 | 1,067 | 1.3% | 366 | 353 | 3.6% |
Training | 44 | 38 | 16.3% | 17 | 16 | 7.5% |
Other | 7 | 12 | -42.8% | 2 | 2 | 7.0% |
Total Personnel Expenses³ | 6,926 | 6,725 | 3.0% | 2,331 | 2,286 | 2.0% |
| | | | | | | |
Administrative + Personnel Expenses
(excludes depreciation and amortization) | 13,020 | 12,467 | 4.4% | 4,452 | 4,311 | 3.3% |
| | | | | | | |
Total General Expenses | 14,692 | 13,985 | 5.1% | 5,020 | 4,867 | 3.2% |
¹ Excluding 100% of the goodwill amortization expenses, which totaled R$ 70 million in 3Q18, R$ 70 million in 2Q18 and R$ 457 million in 3Q17.
² Including Profit-Sharing.
³ As of 1Q18, expenses for Isban Brasil S.A. and Produban Serviços de Informática S.A., which were previously consolidated in the Data processing expense line, will be recorded as Personnel and Administrative Expenses under the General Expenses line. For more information, please refer to the Material Fact - Acquisition of Isban Brasil S.A. and Produban Serviços de Informática S.A., released on February 20th, 2018. 12
Allowance for Loan Losses Allowance for loan losses amounted to R$ 7,874 million in the first nine months of 2018, a twelve-month rise of 11.6% (or R$ 821 million) and 0.6% higher in three months. The good evolution of provisions illustrates the strength of our risk models, with assertiveness in the customer's life cycle. Provision for loan losses totaled R$ 9,511 million in the year to date, up 5.6% in twelve months and down 1.7% in three months. Income from the recovery of written-off loans came to R$ 1,637 million in the year to date, declining 16.4% in twelve months and 11.9% in three months. | | 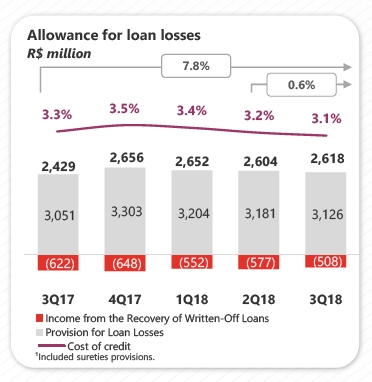
|
Other Operating Income and Expenses
Other net operating income and expenses reached R$ 3.878 million in the year to date, a 18.1% reduction in twelve months and 22.3% lower in three months.
OTHER OPERATING INCOME (EXPENSES) | 9M18 | 9M17 | Var. | 3Q18 | 2Q18 | Var. |
(R$ million) | | 12M | | | 3M |
Expenses from credit cards | (1,655) | (1,192) | 38.8% | (595) | (582) | 2.3% |
Net Income from Capitalization | 292 | 270 | 8.0% | 106 | 92 | 15.1% |
Provisions for contingencies¹ | (947) | (1,519) | -37.7% | (484) | (190) | 154.8% |
Other | (1,569) | (2,293) | -31.6% | (139) | (752) | -81.5% |
Other operating income (expenses) | (3,878) | (4,735) | -18.1% | (1,113) | (1,432) | -22.3% |
¹ Including tax, civil and labor provisions
13
Balance Sheet
Total assets stood at R$ 769,990 million at the end of September 2018, growing 13.8% in twelve months and 4.2% in three months. Total equity was R$ 65,551 million in the same period. Excluding the goodwill balance, total equity reached R$ 64,824 million.
ASSETS | Sep-18 | Sep-17 | Var. | Jun-18 | Var. |
(R$ million) | | | 12M | | 3M |
| | | | | | |
Current Assets and Long-term Assets | 759,235 | 664,984 | 14.2% | 728,300 | 4.2% |
Cash and Cash Equivalents | 14,945 | 7,080 | 111.1% | 11,884 | 25.8% |
Interbank Investments | 56,923 | 49,963 | 13.9% | 53,295 | 6.8% |
Money Market Investments | 44,892 | 43,787 | 2.5% | 40,290 | 11.4% |
Interbank Deposits | 3,729 | 1,503 | 148.2% | 3,423 | 8.9% |
Foreign Currency Investments | 8,302 | 4,673 | 77.7% | 9,582 | -13.4% |
Securities and Derivative Financial Instruments | 179,682 | 182,557 | -1.6% | 187,417 | -4.1% |
Own Portfolio | 69,809 | 69,296 | 0.7% | 58,103 | 20.1% |
Subject to Repurchase Commitments | 70,049 | 73,001 | -4.0% | 90,633 | -22.7% |
Posted to Central Bank of Brazil | 918 | 2,179 | -57.9% | 1,943 | -52.8% |
Pledged in Guarantees | 18,353 | 18,007 | 1.9% | 16,792 | 9.3% |
Other | 20,553 | 20,074 | 2.4% | 19,946 | 3.0% |
Interbank Accounts | 92,619 | 68,277 | 35.7% | 90,695 | 2.1% |
Restricted Deposits: | 70,162 | 66,423 | 5.6% | 69,687 | 0.7% |
-Central Bank of Brazil | 69,891 | 66,149 | 5.7% | 69,416 | 0.7% |
-National Housing System | 271 | 274 | -1.0% | 271 | 0.0% |
Other | 22,457 | 1,854 | 1111.2% | 21,008 | 6.9% |
Lending Operations | 280,894 | 246,068 | 14.2% | 272,496 | 3.1% |
Lending Operations | 299,079 | 263,040 | 13.7% | 290,529 | 2.9% |
Lending Operations Related to Assignment | 39 | 355 | -89.0% | 63 | -37.6% |
(Allowance for Loan Losses) | (18,224) | (17,327) | 5.2% | (18,096) | 0.7% |
Other Receivables | 131,545 | 108,572 | 21.2% | 109,859 | 19.7% |
Foreign Exchange Portfolio | 80,947 | 46,004 | 76.0% | 59,516 | 36.0% |
Income Receivable | 28,974 | 26,915 | 7.7% | 28,562 | 1.4% |
Other | 21,624 | 35,654 | -39.3% | 21,782 | -0.7% |
Other Assets | 2,626 | 2,467 | 6.5% | 2,654 | -1.1% |
Permanent Assets | 10,754 | 11,784 | -8.7% | 10,771 | -0.2% |
Temporary Assets | 477 | 391 | 22.2% | 440 | 8.5% |
Fixed Assets | 6,266 | 7,060 | -11.2% | 6,346 | -1.2% |
Intangibles | 4,011 | 4,334 | -7.5% | 3,985 | 0.6% |
Goodwill net of amortization | 727 | 795 | -8.6% | 796 | -8.7% |
Other Assets | 3,284 | 3,539 | -7.2% | 3,189 | 3.0% |
Total Assets | 769,990 | 676,768 | 13.8% | 739,071 | 4.2% |
| | | | | |
Total Assets (excluding goodwill) | 769,263 | 675,973 | 13.8% | 738,275 | 4.2% |
14
LIABILITIES | Sep-18 | Sep-17 | Var. | Jun-18 | Var. |
(R$ million) | | | 12M | | 3M |
| | | | | | |
Current Liabilities and Long-term Liabilities | 701,989 | 611,637 | 14.8% | 673,248 | 4.3% |
Deposits | 250,593 | 204,118 | 22.8% | 241,754 | 3.7% |
Demand Deposits | 17,421 | 15,980 | 9.0% | 17,369 | 0.3% |
Savings Deposits | 44,429 | 38,570 | 15.2% | 42,571 | 4.4% |
Interbank Deposits | 4,111 | 2,701 | 52.2% | 4,199 | -2.1% |
Time Deposits and Others | 184,631 | 146,867 | 25.7% | 177,615 | 4.0% |
Money Market Funding | 117,545 | 141,526 | -16.9% | 133,155 | -11.7% |
Own Portfolio | 77,356 | 104,607 | -26.1% | 100,998 | -23.4% |
Third Parties | 14,003 | 2,457 | 469.8% | 12,275 | 14.1% |
Free Portfolio | 26,187 | 34,461 | -24.0% | 19,882 | 31.7% |
Funds from Acceptance and Issuance of Securities | 82,221 | 78,143 | 5.2% | 77,045 | 6.7% |
Resources from Real Estate Credit Notes, Mortgage Notes, Credit and Similar | 73,391 | 72,758 | 0.9% | 68,447 | 7.2% |
Funding from Certificates of Structured Operations | 2,481 | 1,540 | 61.1% | 2,253 | 10.1% |
Securities Issued Abroad | 5,045 | 2,700 | 86.8% | 5,079 | -0.7% |
Other | 1,304 | 1,145 | 13.8% | 1,266 | 3.0% |
Interbank Accounts | 1,918 | 1,571 | 22.1% | 1,732 | 10.8% |
Interbranch Accounts | 3,593 | 3,051 | 17.8% | 2,854 | 25.9% |
Borrowings | 50,697 | 26,235 | 93.2% | 46,559 | 8.9% |
Domestic Onlendings - Official Institutions | 13,531 | 16,934 | -20.1% | 14,329 | -5.6% |
National Economic and Social Development Bank (BNDES) | 7,612 | 9,577 | -20.5% | 7,816 | -2.6% |
National Equipment Financing Authority (FINAME) | 5,413 | 7,070 | -23.4% | 6,267 | -13.6% |
Other Institutions | 506 | 287 | 76.4% | 246 | 106.0% |
Derivative Financial Instruments | 16,932 | 18,952 | -10.7% | 17,793 | -4.8% |
Other Payables | 164,958 | 121,107 | 36.2% | 138,027 | 19.5% |
Foreign Exchange Portfolio | 80,422 | 46,426 | 73.2% | 58,853 | 36.6% |
Tax and Social Security | 4,050 | 5,185 | -21.9% | 3,271 | 23.8% |
Subordinated Debts | - | 505 | n.a. | - | n.a. |
Debt Instruments Eligible to Compose Capital | 10,125 | 8,011 | 26.4% | 9,835 | 2.9% |
Other | 70,362 | 60,980 | 15.4% | 66,069 | 6.5% |
Deferred Income | 355 | 506 | -29.8% | 423 | -16.1% |
Minority Interest | 2,095 | 2,268 | -7.6% | 2,076 | 0.9% |
Equity | 65,551 | 62,359 | 5.1% | 63,325 | 3.5% |
Total Liabilities | 769,990 | 676,768 | 13.8% | 739,071 | 4.2% |
| | | | | |
Equity (excluding goodwill) | 64,824 | 61,564 | 5.3% | 62,529 | 3.7% |
| | | | | |
| | | | | |
Securities
Total securities amounted to R$ 179,682 million at the end of September 2018, falling 1.6% in twelve months and 4.1% in three months, mostly explained by the performance of public securities.
SECURITIES | Sep-18 | Sep-17 | Var. | Jun-18 | Var. |
(R$ million) | | | 12M | | 3M |
| | | | | | |
Public securities | 137,020 | 142,346 | -3.7% | 147,323 | -7.0% |
Private securities | 23,350 | 20,139 | 15.9% | 21,280 | 9.7% |
Financial instruments | 19,312 | 20,072 | -3.8% | 18,813 | 2.7% |
Total | 179,682 | 182,557 | -1.6% | 187,417 | -4.1% |
15
Loan Portfolio
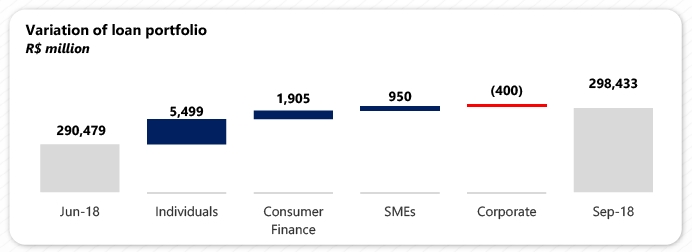
The loan portfolio totaled R$ 298,433 million at the end of September 2018, rising 13.5% in twelve months (or an increase of 10.4% disregarding the exchange rate fluctuation effect) and 2.7% in three months. The highlights continue to be the individuals and consumer finance segments, which have recorded year-on-year expansion for twelve and eight consecutive quarters, respectively, exceeding the total portfolio growth.
The expanded loan portfolio, which includes other credit risk transactions, acquiring-activities related assets and guarantees, amounted to R$ 380,713 million at the end of September 2018, a 13.1% increase in twelve months (or a 10.7% rise disregarding the exchange rate fluctuation effect) and a 3.4% growth in three months.
The balance of the foreign currency portfolio, including dollar-indexed loans, was R$ 38,961 million at the end of September 2018, climbing 29.5% relative to the balance of R$ 30,093 million recorded in September 2017 and growing 3.5% compared to the balance of R$ 37,655 million in June 2018.
MANAGERIAL BREAKDOWN OF CREDIT BY SEGMENT | Sep-18 | Sep-17 | Var. | Jun-18 | Var. |
(R$ million) | | | 12M | | 3M |
| | | | | | |
Individuals | 125,336 | 102,263 | 22.6% | 119,837 | 4.6% |
Consumer Finance | 47,274 | 39,178 | 20.7% | 45,369 | 4.2% |
SMEs | 36,269 | 32,945 | 10.1% | 35,319 | 2.7% |
Corporate | 89,554 | 88,579 | 1.1% | 89,954 | -0.4% |
Total portfolio | 298,433 | 262,965 | 13.5% | 290,479 | 2.7% |
Other credit related transactions¹ | 82,280 | 73,510 | 11.9% | 77,766 | 5.8% |
Total expanded credit portfolio | 380,713 | 336,475 | 13.1% | 368,245 | 3.4% |
¹ Including debentures, FIDC, CRI, promissory notes, international distribution promissory notes, acquiring-activities related assets and guarantees.
In the quarter, growth in our loan portfolio was especially spurred by the individuals and consumer finance portfolios. The SME segment made a positive contribution for the sixth consecutive quarter. In the same period, the Corporate portfolio registered a decrease compared to June 2018.
16
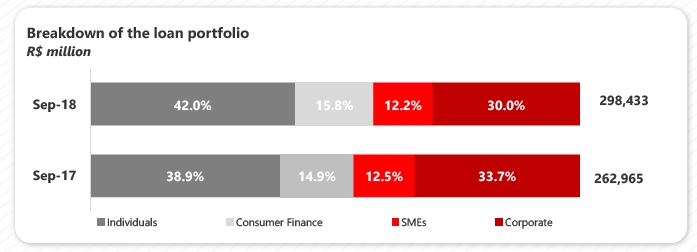
At the end of September 2018, the individuals portfolio accounted for 42.0% of the total portfolio, meaning an increase of 3.1 p.p. in twelve months. Furthermore, the consumer finance segment, which reached 15.8% of the total portfolio at the end of September 2018, also expanded its share, by 0.9 p.p. in twelve months. In the same period, the corporate portfolio reduced by 3.7 p.p. in twelve months to 30.0%, while the SME portfolio fell by 0.4 p.p. to 12.2%.
Loans to Individuals
Loans to individuals amounted to R$ 125,336 million at the end of September 2018, expanding by 22.6% in twelve months (or R$ 23,073 million) and 4.6% in three months. The products that contributed the most to this performance in both periods were payroll loans, credit card and mortgages. The payroll loans portfolio came to R$ 32,329 million at the end of September 2018, climbing 35.0% in twelve months (or R$ 8,379 million) and 5.0% in three months. This performance is explained by the higher demand in our digital channels and strong commercial dynamics in our network. The credit card portfolio reached R$ 26,771 million, representing growth of 22.5% in twelve months (or R$ 4,922 million) and 4.1% in three months. The increase in both periods reflects the enhanced customer experience, the expansion of our customer base and through partnerships. The mortgage loan portfolio totaled R$ 31,495 million, up 15.6% in twelve months (or R$ 4,244 million) and 3.8% in three months. We continue to move forward with our strategy of offering attractive rates and perfecting the customer journey. | 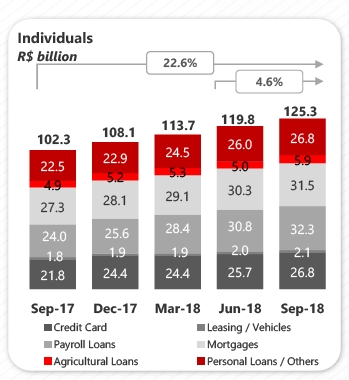
|
17
Consumer Finance
The Consumer Finance portfolio, which is originated outside the branch network, stood at R$ 47,274 million at the end of September 2018, growing 20.7% in twelve months (or R$ 8,096 million) and 4.2% in three months. Of this total portfolio, R$ 39,142 million refers to vehicle financing for individuals, which represents a 20.0% increase in twelve months. The total vehicle portfolio for individuals, which includes operations carried out by both the financing unit (correspondent banks) as well as by Santander's branch network, advanced 19.9% in twelve months and 3.7% in three months, amounting to R$ 41,256 million at the end of September 2018. The performance of this portfolio can be partially attributed to the +Negócios platform, focused on the vehicles segment in which we offer a better customer journey. | 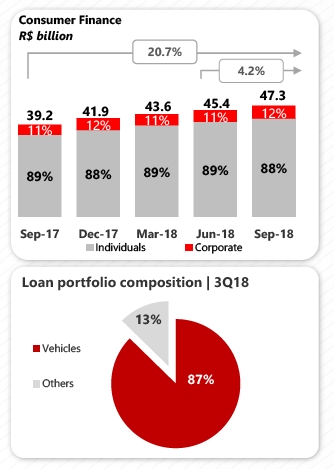
|
Corporate & SMEs Loans
The corporate & SME loan portfolio reached R$ 125,823 million in September 2018, rising 3.5% in twelve months (or R$ 4,299 million) and 0.4% in three months.
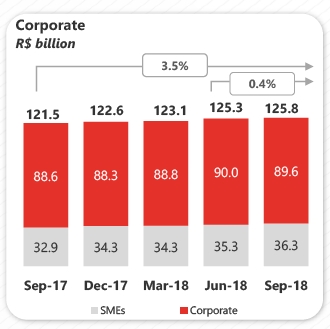
| The corporate loan portfolio totaled R$ 89,554 million, representing growth of 1.1% in twelve months (or R$ 975 million) and a 0.4% reduction in three months. Disregarding the exchange rate fluctuation effect, the portfolio decreased by 7.2% in twelve months and 1.9% in three months. The SME loan portfolio amounted to R$ 36,269 million, meaning an expansion of 10.1% in twelve months (or R$ 3,324 million) and 2.7% in three months. We maintain our positioning of providing sector-oriented offers which included the education segment starting from this quarter. In addition, we provide specialized services and a non-financial offering through the "Avançar" Program. That way, we have been able to grow our customer base and strengthen our customer loyalty. |
18
Individuals and Corporate & SMEs Loan Portfolio by Product
MANAGERIAL BREAKDOWN OF CREDIT | Sep-18 | Sep-17 | Var. | Jun-18 | Var. |
PORTFOLIO BY PRODUCT(R$ million) | | | 12M | | 3M |
| | | | | | |
Individuals | | | | | |
Leasing / Auto Loans¹ | 2,114 | 1,813 | 16.6% | 1,988 | 6.3% |
Credit Card | 26,771 | 21,850 | 22.5% | 25,727 | 4.1% |
Payroll Loans | 32,329 | 23,950 | 35.0% | 30,803 | 5.0% |
Mortgages | 31,495 | 27,251 | 15.6% | 30,331 | 3.8% |
Agricultural Loans | 5,850 | 4,854 | 20.5% | 5,005 | 16.9% |
Personal Loans / Others | 26,777 | 22,546 | 18.8% | 25,984 | 3.1% |
Total Individuals | 125,336 | 102,263 | 22.6% | 119,837 | 4.6% |
Consumer Finance | 47,274 | 39,178 | 20.7% | 45,369 | 4.2% |
Corporate and SMEs | | | | | |
Leasing / Auto Loans | 3,125 | 2,747 | 13.8% | 2,923 | 6.9% |
Real Estate | 4,734 | 7,530 | -37.1% | 5,120 | -7.5% |
Trade Finance | 28,821 | 22,821 | 26.3% | 26,608 | 8.3% |
On-lending | 9,734 | 11,603 | -16.1% | 10,654 | -8.6% |
Agricultural Loans | 6,061 | 7,068 | -14.3% | 6,228 | -2.7% |
Working capital / Others | 73,349 | 69,755 | 5.2% | 73,741 | -0.5% |
Total Corporate and SMEs | 125,823 | 121,523 | 3.5% | 125,273 | 0.4% |
| | | | | |
Total Credit | 298,433 | 262,965 | 13.5% | 290,479 | 2.7% |
Other Credit Risk Transactions with customers² | 82,280 | 73,510 | 11.9% | 77,766 | 5.8% |
| | | | | | |
Total Expanded Credit Portfolio | 380,713 | 336,475 | 13.1% | 368,245 | 3.4% |
¹ Including consumer finance, the auto loan portfolio for individuals totaled R$ 41,256 million in Sept-18, R$ 39,772 million in Jun-18 and R$ 34,419 million in Sept-17.
² Including debentures, FIDC, CRI, promissory notes, international distribution promissory notes, acquiring-activities related assets and guarantees.
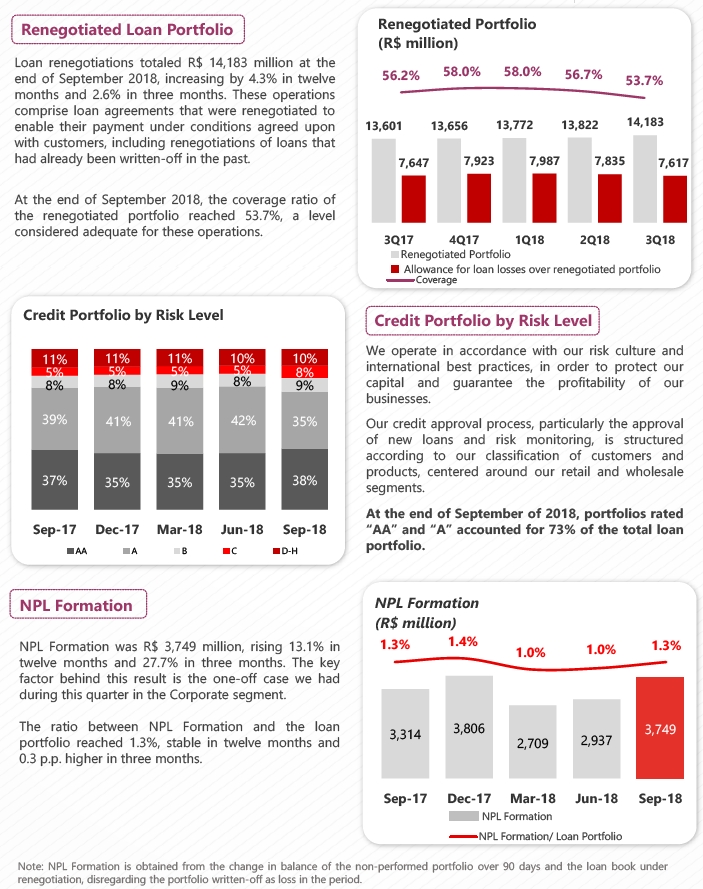
Coverage Ratio The balance of allowance for loan losses came to R$ 18,224 million at the end of September 2018, increasing 5.2% in twelve months and 0.7% in three months. This evolution is in line with the expansion dynamics of our loan portfolio and shows that the provisioning levels are adequate. The coverage ratio stood at 207% at the end of September 2018, or a decline of 22.6 p.p. in twelve months and 12.3 p.p. lower in three months. These figures were impacted by a one-off case in the Corporate segment that occurred in this quarter. | 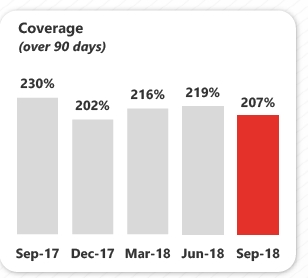
|
19
20
Delinquency Ratio over-90-Day The over-90-day delinquency ratio stood at 2.9% at the end of September 2018, stable in twelve months and a 0.1 p.p. rise in three months. The ratio remains at a controlled level, attesting to the effectiveness of our models and our preventive risk management. Delinquency in the Individuals segment was 3.8% in the period, advancing 0.1 p.p. in twelve months and remaining stable compared with the previous quarter. Delinquency in the Corporate and SME segment came to 1.9% at the end of September 2018, stable in twelve months. In the quarter, this ratio increased by 0.2 p.p., owing to the one-off case discussed earlier in this report. | 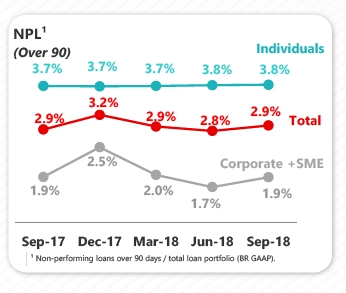
|
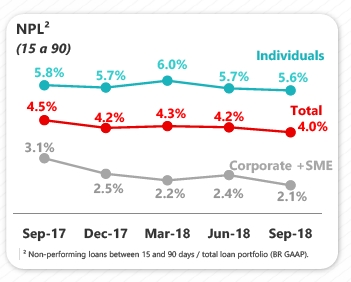
| Delinquency Ratio 15-to-90-day The 15-to-90-day delinquency ratio reached 4.0% at the end of September 2018, dropping 0.5 p.p. in twelve months and 0.2 p.p. in three months. In the Individuals segment, the ratio stood at 5.6%, which represents a decline of 0.2 p.p. in twelve months and a 0.1 p.p. decline in three months. In the Corporate & SME segment, this ratio came to 2.1% at the end of September 2018, falling 1.0 p.p. in twelve months and 0.3 p.p. compared to the prior quarter. |
21
Funding
FUNDING | Sep-18 | Sep-17 | Var. | Jun-18 | Var. |
(R$ million) | | | 12M | | 3M |
| | | | | | |
Demand deposits | 17,421 | 15,980 | 9.0% | 17,369 | 0.3% |
Saving deposits | 44,429 | 38,570 | 15.2% | 42,571 | 4.4% |
Time deposits | 184,626 | 146,867 | 25.7% | 177,611 | 3.9% |
Debenture/LCI/LCA¹ | 54,472 | 68,731 | -20.7% | 53,980 | 0.9% |
Financial Bills² | 36,050 | 39,095 | -7.8% | 33,348 | 8.1% |
Funding from clients | 336,997 | 309,244 | 9.0% | 324,879 | 3.7% |
¹ Repo operations backed by Debentures, Real Estate Credit Notes (LCI) and Agricultural Credit Notes (LCA).
² Including Certificates of Structured Operations (COE).
Total customer funding amounted to R$ 336,997 million at the end of September 2018, growing 9.0% in twelve months (or R$ 27,754 million) and 3.7% in three months. Growth in both periods was especially fueled by time deposits, which went up 25.7% in twelve months and 3.9% in three months, as well as savings deposits, which increased by 15.2% in twelve months and 4.4% relative to June 2018.
Credit/Funding Ratio
FUNDING VS. CREDIT | Sep-18 | Sep-17 | Var. | Jun-18 | Var. |
(R$ million) | | | 12M | | 3M |
| | | | | | |
Funding from customers (A) | 336,997 | 309,244 | 9.0% | 324,879 | 3.7% |
(-) Reserve Requirements | (69,891) | (66,149) | 5.7% | (69,416) | 0.7% |
Funding Net of Reserve Requirements | 267,106 | 243,095 | 9.9% | 255,463 | 4.6% |
Borrowing and Onlendings | 13,639 | 17,419 | -21.7% | 14,450 | -5.6% |
Subordinated Debts | 10,125 | 8,516 | 18.9% | 9,835 | 2.9% |
Offshore Funding | 55,634 | 28,450 | 95.6% | 51,517 | 8.0% |
Total Funding (B) | 346,504 | 297,481 | 16.5% | 331,265 | 4.6% |
Assets under management¹ | 301,541 | 296,043 | 1.9% | 302,162 | -0.2% |
Total Funding and Asset under management | 648,046 | 593,524 | 9.2% | 633,427 | 2.3% |
Total Credit (C) | 298,433 | 262,965 | 13.5% | 290,479 | 2.7% |
C / B (%) | 86.1% | 88.4% | | 87.7% | |
C / A (%) | 88.6% | 85.0% | | 89.4% | |
¹ According to ANBIMA criteria.
The loan portfolio to customer funding ratio was 88.6% at the end of September 2018, meaning a 3.6 p.p. increase in 12 months and a 0.8 p.p. reduction in three months. The liquidity metric adjusted for the impact of reserve requirements and medium/long-term funding reached 86.1% in September 2018, down 2.3 p.p. in twelve months and 1.6 p.p. in three months. The Bank is in a comfortable liquidity situation, with stable funding sources and an adequate funding structure. | 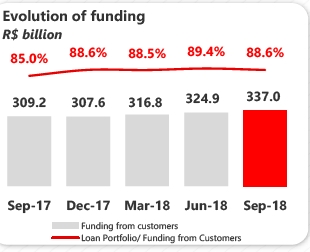
|
22
The BIS ratio stood at 15.3% at the end of September 2018, a reduction of 0.9 p.p. in twelve months. This change is chiefly explained by the impact on capital deductions under the Basel III schedule, which went from 80% in 2017 to 100% in 2018. In the quarter, the ratio rose 0.5 p.p., driven by an improved CET1 ratio, given the increase in retained earnings and better deduction levels, which offset the RWA growth in the period. It is important to mention that the use of the internal model for Market Risk was approved in the second quarter of 2018 by the Brazilian Central Bank. Thus, the calculation of this portion is now obtained from the maximum value between the internal methodology and 90% of the standardized approach. Since January 2018, the capital requirement has been changed from 9.25% to 8.625% + conservation capital of 1.875% + additional CET1 for systemically important financial institutions in the Brazilian market of 0.5%, totaling 11%. Tier I Capital is 8.375% and CET1 is 6.875%. | 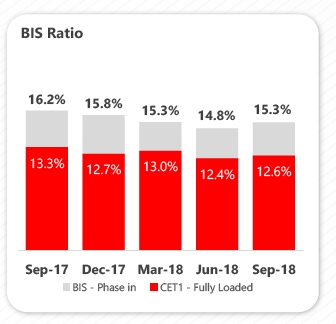
|
In March 2013, the Brazilian Central Bank issued the Basel III rules on capital definition and risk management. These criteria will be gradually implemented by 2019. If we were to apply Basel III rules immediately and in full, our CET1 would have reached 12.6% in September 2018, down 0.7 p.p. in twelve months, affected by the RWA increase. In the quarter, the ratio rose 0.2 p.p., owing to the capital improvement arising from higher retained earnings and better deduction levels. |
OWN RESOURCES AND BIS | Sep-18 | Sep-17 | Var. | Jun-18 | Var. |
(R$ million) | | | 12M | | 3M |
| | | | | | |
Tier I Regulatory Capital | 62,042 | 60,428 | 2.7% | 57,153 | 8.6% |
CET1 | 56,973 | 56,417 | 1.0% | 52,271 | 9.0% |
Additional Tier I | 5,069 | 4,011 | 26.4% | 4,882 | 3.8% |
Tier II Regulatory Capital | 5,055 | 4,000 | 26.4% | 4,953 | 2.1% |
Adjusted Regulatory Capital (Tier I and II) | 67,098 | 64,428 | 4.1% | 62,106 | 8.0% |
Risk Weighted Assets (RWA) | 439,784 | 398,302 | 10.4% | 420,588 | 4.6% |
Credit Risk Capital requirement | 371,254 | 328,972 | 12.9% | 354,414 | 4.8% |
Market Risk Capital requirement | 26,155 | 36,751 | -28.8% | 28,802 | -9.2% |
Operational Risk Capital requirement | 42,376 | 32,579 | 30.1% | 37,372 | 13.4% |
Basel Ratio | 15.26% | 16.18% | -0.92 p.p. | 14.77% | 0.49 p.p. |
Tier I | 14.11% | 15.17% | -1.06 p.p. | 13.59% | 0.52 p.p. |
CET1 | 12.95% | 14.16% | -1.21 p.p. | 12.43% | 0.53 p.p. |
Tier II | 1.15% | 1.01% | 0.14 p.p. | 1.18% | -0.03 p.p. |
23
24
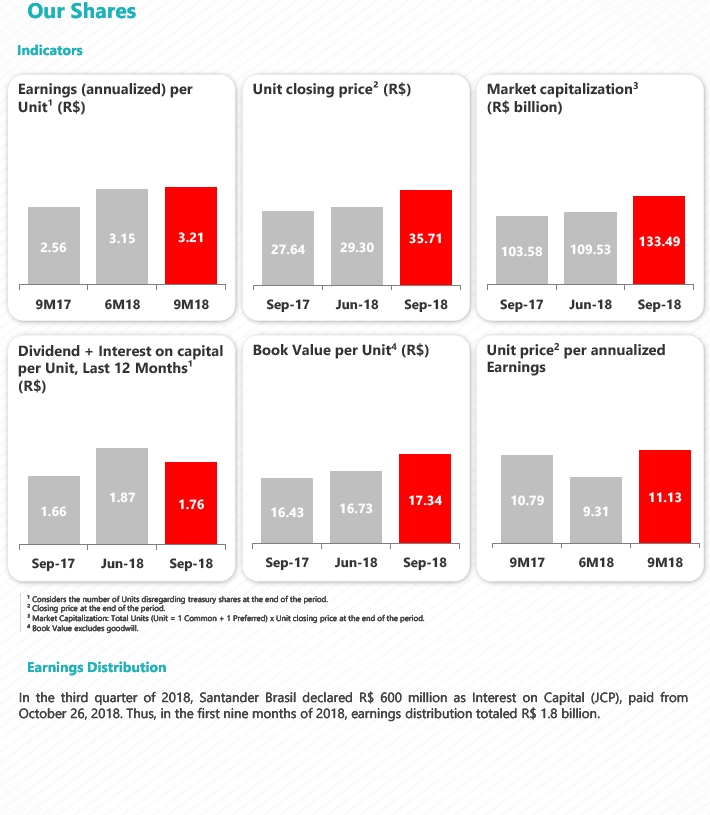
25
Rating Agencies
Santander is rated by international rating agencies and the ratings it receives reflect several factors, including the quality of its management, its operational performance and financial strength, as well as other variables related to the financial sector and the economic environment in which the company operates, with its long-term foreign currency rating limited to the sovereign rating. The table below presents the ratings assigned by Standard & Poor's and Moody's:
| | Global Scale | | National Scale |
| | | | | | | | | |
Ratings | | Local Currency | | Foreign Currency | | National |
| Long-term | Short-term | | Long-term | Short-term | | Long-term | Short-term |
Standard & Poor’s¹
(outlook) | | BB- (stable) | B | | BB- (stable) | B | | brAAA (stable) | brA-1+ |
| | |
Moody's²
(outlook) | | Ba1 (stable) | NP | | Ba3 (stable) | NP | | Aaa.br | Br-1 |
| | |
¹ Last update on July 11th, 2018.
² Last update on August 20th, 2018
26
Accounting and Managerial Results Reconciliation
For a better understanding of BRGAAP results, the reconciliation between the accounting result and the managerial result is presented below.
ACCOUNTING AND MANAGERIAL | 9M18 | Reclassifications | |
9M18 |
| |
RESULTS RECONCILIATION(R$ million) | Accounting | Exchange Hedge¹ | Credit Recovery² | Amort. of goodwill³ | Profit Sharing | FX
variation4 | Other events5 | Managerial |
| | | | | | | | | |
Net Interest Income | 25,178 | 7,411 | (1,637) | - | - | - | 300 | 31,253 |
Allowance for Loan Losses | (9,454) | - | 1,753 | - | - | - | (173) | (7,874) |
Net Interest Income after Loan Losses | 15,724 | 7,411 | 116 | - | - | - | 127 | 23,379 |
Fees | 12,544 | - | - | - | - | - | - | 12,544 |
General Expenses | (13,549) | - | - | 209 | (1,352) | - | - | (14,692) |
Personnel Expenses | (5,573) | - | - | - | (1,352) | - | - | (6,926) |
Administrative Expenses | (7,976) | - | - | 209 | - | - | - | (7,767) |
Tax Expenses | (2,586) | (406) | - | - | - | - | - | (2,992) |
Investments in Affiliates and Subsidiaries | 14 | - | - | - | - | - | - | 14 |
Other Operating Income/Expenses | (3,433) | - | (116) | - | - | - | (329) | (3,878) |
Operating Income | 8,714 | 7,005 | - | 209 | (1,352) | - | (203) | 14,373 |
Non Operating Income | 33 | - | - | - | - | - | - | 33 |
Net Profit before Tax | 8,748 | 7,005 | - | 209 | (1,352) | - | (203) | 14,407 |
Income Tax and Social Contribution | 1,696 | (7,005) | - | - | - | - | 155 | (5,154) |
Profit Sharing | (1,352) | - | - | - | 1,352 | - | - | - |
Minority Interest | (261) | - | - | - | - | - | - | (261) |
Net Profit | 8,831 | - | - | 209 | - | - | (47) | 8,992 |
| | | | | | | | | |
| | | | | | | | | |
| | | | | | | | | |
| |
| |
ACCOUNTING AND MANAGERIAL | 9M17 | Reclassifications | 9M17 |
RESULTS RECONCILIATION(R$ million) | Accounting | Exchange Hedge¹ | Credit Recovery² | Amort. of goodwill³ | Profit Sharing | FX
variation4 | Other events5 | Managerial |
| | | | | | | | | |
Net Interest Income | 30,291 | (661) | (1,958) | - | - | 156 | - | 27,829 |
Allowance for Loan Losses | (8,974) | - | 2,004 | - | - | (83) | - | (7,053) |
Net Interest Income after Loan Losses | 21,317 | (661) | 46 | - | - | 73 | - | 20,776 |
Fees | 11,372 | - | - | - | - | - | - | 11,372 |
General Expenses | (14,355) | - | - | 1,369 | (1,103) | - | 105 | (13,985) |
Personnel Expenses | (5,622) | - | - | - | (1,103) | - | - | (6,725) |
Administrative Expenses | (8,733) | - | - | 1,369 | - | - | 105 | (7,260) |
Tax Expenses | (2,777) | 65 | - | - | - | - | - | (2,712) |
Investments in Affiliates and Subsidiaries | 26 | - | - | - | - | - | - | 26 |
Other Operating Income/Expenses | (4,757) | - | (46) | - | - | (73) | 142 | (4,735) |
Operating Income | 10,826 | (596) | - | 1,369 | (1,103) | - | 247 | 10,743 |
Non Operating Income | (313) | - | - | - | - | - | - | (313) |
Net Profit before Tax | 10,514 | (596) | - | 1,369 | (1,103) | - | 247 | 10,430 |
Income Tax and Social Contribution | (3,612) | 596 | - | - | - | - | 87 | (2,929) |
Profit Sharing | (1,103) | - | - | - | 1,103 | - | - | - |
Minority Interest | (300) | - | - | - | - | - | - | (300) |
Net Profit | 5,499 | - | - | 1,369 | - | - | 334 | 7,201 |
27
ACCOUNTING AND MANAGERIAL | 3Q18 | Reclassifications | 3Q18 |
RESULTS RECONCILIATION(R$ million) | Accounting | Exchange Hedge¹ | Credit Recovery² | Amort. of goodwill³ | Profit Sharing | FX
variation4 | Other events5 | Managerial |
| | | | | | | | | |
Net Interest Income | 9,323 | 1,515 | (508) | - | - | - | 300 | 10,629 |
Allowance for Loan Losses | (2,964) | - | 519 | - | - | - | (173) | (2,618) |
Net Interest Income after Loan Losses | 6,359 | 1,515 | 11 | - | - | - | 127 | 8,011 |
Fees | 4,135 | - | - | - | - | - | - | 4,135 |
General Expenses | (4,638) | - | - | 70 | (452) | - | - | (5,020) |
Personnel Expenses | (1,879) | - | - | - | (452) | - | - | (2,331) |
Administrative Expenses | (2,759) | - | - | 70 | - | - | - | (2,690) |
Tax Expenses | (1,074) | 70 | - | - | - | - | - | (1,004) |
Investments in Affiliates and Subsidiaries | 5 | - | - | - | - | - | - | 5 |
Other Operating Income/Expenses | (975) | - | (11) | - | - | - | (127) | (1,113) |
Operating Income | 3,812 | 1,585 | - | 70 | (452) | - | (0) | 5,014 |
Non Operating Income | 6 | - | - | - | - | - | - | 6 |
Net Profit before Tax | 3,818 | 1,585 | - | 70 | (452) | - | (0) | 5,020 |
Income Tax and Social Contribution | (240) | (1,585) | - | - | - | - | - | (1,825) |
Profit Sharing | (452) | - | - | - | 452 | - | - | - |
Minority Interest | (87) | - | - | - | - | - | - | (87) |
Net Profit | 3,039 | - | - | 70 | - | - | (0) | 3,108 |
| | | | | | | | | |
| | | | | | | | | |
| | | | | | | | | |
ACCOUNTING AND MANAGERIAL | 2Q18 | Reclassifications | 2Q18 |
RESULTS RECONCILIATION(R$ million) | Accounting | Exchange Hedge¹ | Credit Recovery² | Amort. of goodwill³ | Profit Sharing | FX
variation4 | Other events5 | Managerial |
| | | | | | | | | |
Net Interest Income | 5,307 | 5,730 | (577) | - | - | - | - | 10,460 |
Allowance for Loan Losses | (3,199) | - | 596 | - | - | - | - | (2,604) |
Net Interest Income after Loan Losses | 2,107 | 5,730 | 19 | - | - | - | - | 7,856 |
Fees | 4,275 | - | - | - | - | - | - | 4,275 |
General Expenses | (4,503) | - | - | 70 | (434) | - | - | (4,867) |
Personnel Expenses | (1,852) | - | - | - | (434) | - | - | (2,286) |
Administrative Expenses | (2,650) | - | - | 70 | - | - | - | (2,581) |
Tax Expenses | (564) | (460) | - | - | - | - | - | (1,024) |
Investments in Affiliates and Subsidiaries | 6 | - | - | - | - | - | - | 6 |
Other Operating Income/Expenses | (1,261) | - | (19) | - | - | - | (152) | (1,432) |
Operating Income | 60 | 5,270 | - | 70 | (434) | - | (152) | 4,814 |
Non Operating Income | 15 | - | - | - | - | - | - | 15 |
Net Profit before Tax | 75 | 5,270 | - | 70 | (434) | - | (152) | 4,829 |
Income Tax and Social Contribution | 3,421 | (5,270) | - | - | - | - | 135 | (1,714) |
Profit Sharing | (434) | - | - | - | 434 | - | - | - |
Minority Interest | (90) | - | - | - | - | - | - | (90) |
Net Profit | 2,972 | - | - | 70 | - | - | (17) | 3,025 |
| | | | | | | | | |
¹ Foreign Exchange Hedge:under Brazilian tax rules, gains (losses) derived from exchange rate fluctuations on foreign currency investments are not taxable (tax deductible). This tax treatment leads to exchange rate exposure to taxes. An exchange rate hedge position was set up with the purpose of protecting the net profit from the impact of foreign exchange fluctuations related to this tax exposure.
² Credit Recovery:reclassified from revenue from loan operations to allowance for loan losses and, from 2017 onwards, it includes provision for guarantees provided.
³ Amortization of Goodwill:reversal of goodwill amortization expenses.
4Exchange Rate Fluctuation:includes, in addition to the effect of the exchange rate fluctuation, reclassifications between different lines of theBank sresults (other operating income/expenses, allowance for loan losses and non-operating result) for better comparability with previous quarters.
5Other events:
2017
3Q17: Adhesion effect to the installment payment program for outstanding taxes and social security debts (in accordance with Provisional Measure No. 783/2017).
2018
1Q18: Adhesion effect to the installment payment program for outstanding taxes and social security debts (in accordance with Provisional Measure No. 783/2017).
2Q18: Includes a gain of R$ 816 MM from the adjustment of post-employment benefits, additional provisions for contingencies in the amount of R$ 358 MM, impairment of intangible assets (systems acquisition and development) in the amount of R$ 306 MM and a write-off of tax credits in the amount of R$ 74 MM.
3Q18: Net Interest Income, Allowance for Loan Losses and Other Operating Income and Expenses: reclassifications between the lines referring to adjustments in the valuation of assets related to the impairment of securities (R$ 173 MM) and derivative instruments (R$ 127 MM)
28

29

32
SIGNATURE
Pursuant to the requirements of the Securities Exchange Act of 1934, the Registrant has duly caused this report to be signed on its behalf by the undersigned, thereto duly authorized.
Date: October 31, 2018
Banco Santander (Brasil) S.A. |
| | |
| By: | /S/ Amancio Acurcio Gouveia
| |
| | Amancio Acurcio Gouveia
Officer Without Specific Designation
| |
| | |
|
| | |
| By: | /S/ Angel Santodomingo Martell
| |
| | Angel Santodomingo Martell
Vice - President Executive Officer
| |


 During the quarter, we were recognized, forthe 3rdconsecutive year, as one of the bestcompanies to work for in Brazil, accordingto the GPTW (Great Place to Work) survey.The jump of 14 positions from last yearshows the consolidation of our internalculture and employee engagement.


