SECURITIES AND EXCHANGE COMMISSION
Commission File Number: 001-34476
Bloco A – Vila Olimpia
São Paulo, SP 04543-011
Federative Republic of Brazil
Indicate by check mark if the registrant is submitting the Form 6-K in paper as permitted by Regulation S-T Rule 101(b)(1):
Yes _______ No ___X____
Indicate by check mark if the registrant is submitting the Form 6-K in paper as permitted by Regulation S-T Rule 101(b)(7):
Yes _______ No ___X____
Indicate by check mark whether by furnishing the information contained in this Form, the Registrant is also thereby furnishing the information to the Commission pursuant to Rule 12g3-2(b) under the Securities Exchange Act of 1934:
Yes _______ No ___X____
If “Yes” is marked, indicate below the file number assigned to the registrant in connection with Rule 12g3-2(b): N/A


SUMMARY
| 1. Message from the Chairman of the Board of Directors | 3 |
| 2. Call Notice | 4 |
| 3. Participation of shareholders in the OGM | 6 |
| 3.1. In-person Participation | 6 |
| 3.2. Participation by Proxy | 7 |
| 3.3. Remote Voting Participation | 7 |
| 3.4. ADS holders | 10 |
| 4. Matters to be resolved at the OGM | 11 |
| EXHIBIT I: POWER OF ATTORNEY | 15 |
| EXHIBIT II: COMMENTS OF THE MANAGEMENT TO THE FINANCIAL CONDITION OF THE COMPANY (Pursuant to item III of article 9 of CVM Instruction 481) | 17 |
| EXHIBIT III: BOARD PROPOSAL FOR ALLOCATION OF NET PROFIT FOR THE FISCAL YEAR (Pursuant to item II of the sole paragraph of article 9, Annex 9-1-II to CVM Instruction 481) | 119 |
| EXHIBIT IV: PROPOSAL FOR ELECTION OF THE COMPANY'S BOARD OF DIRECTORS (Information on compliance with items 12.5 to 12.10 of Appendix 24 of CVM Instruction 480, pursuant to Annex A of CVM Instruction 552) | 127 |
| EXHIBIT V: ITEM 13 of Annex 24 of CVM Instruction 481 (Pursuant to item II of Article 12 to CVM Instruction 481) | 137 |
| 2 |
| |
1. Message from the Chairman of the Board of Directors
Dear Shareholder,
It is with great pleasure that I invite you, a shareholder of Banco Santander (Brasil) S.A. (“Santander Brasil” or “Company”), to participate in our Ordinary General Meeting (“OGM”), to be held on April 30, 2021, at 3:00 P.M.
Besides this Management Proposal (“Proposal”) a Manual for Participation in the OGM (“Manual”) was prepared to assist you in understanding the matters presented, providing a conscious and reasoned decision-making process, anticipating possible clarifications and voting guidelines.
Pursuant to the Call Notice made available, we shall take resolutions on the following matters:
(i) To TAKE the management accounts, to examine, discuss and vote on the Company’s Financial Statements related to the fiscal year ended on December 31, 2020, accompanied by the Management Report, the balance sheet, other parts of the financial statements, external auditors’ opinion and the Audit Committee Report;
(ii) To DECIDE on the allocation of net income for the year 2020 and the distribution of dividends;
(iii) To FIX the number of members that will compose the Board of Directors in the mandate from 2021 to 2023;
(iv) To ELECT the members of the Company's Board of Directors for a term of office from 2021 to 2023; and
(v) To FIX the annual global compensation of the Company´s management and members of Audit Committee.
As established by the Brazilian Securities and Exchange Commission (CVM), in order to facilitate its analysis and evaluation of the matters to be resolved, this Proposal includes exhibits containing the information made available in addition to the Call Notice.
We are at your disposal to clarify any questions through the emails acionistas@santander.com.br oriented at non-financial individual and corporate investors and ri@santander.com.br for institutional investors.
We hope that this Proposal and the Manual fulfills its purpose in assisting your decision making. Your participation is essential for the Company.
Sincerely,
Álvaro Antônio Cardoso de Souza
Chairman of the Board of Directors
| 3 |
| |
2. Call Notice of Meeting
[to be published in the newspaper “Valor Econômico” in editions of March 29, 30 and 31, 2021; and in the “Official Gazette of the State of São Paulo”, in editions of March 27, 30 and 31, 2021]
BANCO SANTANDER (BRASIL) S.A.
Publicly-Held Company of Authorized Capital
CNPJ/ME 90.400.888/0001-42 - NIRE 35.300.332.067
NOTICE OF MEETING – ORDINARY GENERAL MEETING - Shareholders are hereby invited to attend the Ordinary General Meeting (“OGM”) to be held on April 30, 2021, at 3:00 PM, at the principal place of business of Banco Santander (Brasil) S.A. (“Santander Brasil” or “Company”), located at Avenida Presidente Juscelino Kubitschek No. 2235 and 2014 – 2nd mezzanine, Vila Olímpia, São Paulo/SP, to resolve upon the following Agenda:
(i) To TAKE the management accounts, to examine, discuss and vote on the Company’s Financial Statements related to the fiscal year ended on December 31, 2020, accompanied by the Management Report, the balance sheet, other parts of the financial statements, external auditors’ opinion and the Audit Committee Report;
(ii) To DECIDE on the allocation of net income for the year 2020 and the distribution of dividends;
(iii) To FIX the number of members that will compose the Board of Directors in the mandate from 2021 to 2023;
(iv) To ELECT the members of the Company's Board of Directors for a term of office from 2021 to 2023; and
(v) To FIX the annual global compensation of the Company´s management and members of Audit Committee.
Note:
Considering the effects of the Covid-19 Pandemic (the new Coronavirus) and the measures taken by health and government authorities to contain the spread of such disease at the time of publication of this Notice, the Company has intensified its sanitation protocols and measures in the physical reception environments , at the place where the OGM will take place, for the benefit of the shareholders who choose to vote in person.
Our recommendation to the shareholders is to make use of remote voting instruments, either by the electronic means available or by sending written votes to the Company, or granting standardized powers of attorney with voting guidance, according to the instructions provided in the Manual.
| 4 |
| |
General Instructions:
| 1. | The shareholders or their legal representatives shall appear at the OGM with the appropriate identity documents. In the event of representation of a shareholder by an attorney-in-fact, shareholders shall leave at the Company's principal place of business, at least seventy-two (72) hours before the OGM is held, a power of attorney granted according to the applicable law; and |
| 2. | The documents related to the matters to be examined and resolved at the OGM are available to shareholders (i) at the Company's principal place of business, at Avenida Presidente Juscelino Kubitschek No. 2041 and 2235 - Bloco A, Vila Olímpia, São Paulo/SP, 9th floor - Corporate Legal Department, where they can be consulted, on working days, from 10:00 a.m. until 4:00 p.m., and on its website (www.ri.santander.com.br – at Corporate Governance >> Minutes of the Meeting); (ii) on the website of the Brazilian Securities and Exchange Commission (www.cvm.gov.br) and (iii) on the website of B3 S.A. - Brasil, Bolsa, Balcão (http://www.b3.com.br). |
| 3. | Remote Voting Ballot: the Company implemented the remote voting system pursuant to CVM Ruling 481/09, allowing shareholders to send remote voting ballots directly to the Company, to the bookkeeper or their respective custody agents, according to the procedures described in the Manual for Participation. |
São Paulo, March 26, 2021 – Álvaro Antônio Cardoso de Souza – Chairman of the Board of Directors.
___________________________________________________
| 5 |
| |
3. Participation of shareholders in the OGM
Santander Brasil shareholders may participate in the OGM in person or by proxy, as specified in item 3.2 below.
Shareholders will be required to provide the following documents to participate in the OGM:
Individual:
| · identity document with photo[1] (original or copy) · proof of ownership of the shares issued by the Company, issued by the depository and/or custodian financial institution (original or copy) |
| Legal entity: | · corporate documents that prove the legal representation of the shareholder (original or copy)[2] · legal representative's identity document with photo (original or copy) |
| Investment fund | · identity document of the legal representative of the Investment Fund’s manager (or of the manager, as the case may be) with photo (original or copy) · simple copy of the last consolidated bylaws of the fund and of the Articles of Association or Organization of its manager, in addition to the corporate documentation granting powers of representation (minutes of election of the officers and/or power of attorney) |
3.1. In-person Participation
Santander Brasil shareholders may participate in the OGM by attending the place where it will be held and declaring their vote, according to the types of shares they own (common and/or preferred), and the matters to be voted on. In accordance with the provisions of Article 126 of Law No. 6,404/76, shareholders shall attend the Shareholders' Meeting presenting, in addition to the identity document, proof of ownership of the shares issued by the Company, issued by the depository and/or custodian financial institution. The Company recommends that said proof be issued within two (2) business days before the date scheduled for the Meeting.
Corporate shareholders, such as companies and investment funds, shall be represented in accordance with their Articles of Association, Articles of Organization or Bylaws, delivering documents proving the regularity of the representation, accompanied by the Minutes of the election of the Managers, if applicable, at the place and term indicated in the item below. Prior to the OGM, the shareholders shall sign the Attendance Book. Shareholders without voting rights may attend the OGM and discuss all matters submitted for resolution.
[1] The cash net of bank overdrafts position is represented by the balances of cash and cash equivalents being deducted the balance of bank overdrafts. The cash net of debt position is represented by the cash net of bank overdrafts position added by balances of current financial investments and being deducted the balances of loans and financings. Both the cash net of bank overdrafts position and the cash net of debt position are performance indicators used by the Company, and they are not measures according to the Accounting Practices Adopted in Brazil or according to IFRS.
[2] The Company calculates the net debt as the balances of loans and financings being deducted the balances of current financial investments and cash net of bank overdrafts. The net debt/EBITDA is a performance indicator used by the Company, and it is not a measure according to the Accounting Practices Adopted in Brazil or according to IFRS.
| 6 |
| |
3.2. Participation by Proxy
The shareholder may be represented at the OGM by an attorney-in-fact, duly appointed under a public or private instrument, and pursuant to article 126, § 1 of the Corporations Act, the attorneys-in-fact shall have been appointed less than one (1) year ago, and they shall be (i) shareholders of the Company, (ii) managers of the Company, (iii) lawyers, or (iv) financial institutions, with the investment fund’s manager being responsible for representing the quotaholders.
The originals or copies of the documents mentioned above may be delivered at the Company's principal place of business by the time the OGM is held.
However, in order to facilitate shareholders' access to the OGM, we recommend that the delivery of such documents be made at least seventy-two (72) hours before the OGM is held.
In the case of submittal of documents via email, we request that the shareholder contact the Company, so that the originals or copies can be delivered by the day the OGM is held.
In case the Shareholder is unable to attend the OGM or cannot yet be represented by an attorney-in-fact of his/her/their choice, the Company will make available an attorney-in-fact to vote for the shareholder, in accordance with his/her/their voting instructions, according to the power of attorney template in Exhibit 1 to this Proposal.
Furthermore, it should be noted that in addition to the power of attorney, the shareholder shall forward the documents required by the Company to participate in the OGM, as provided for in item 3 above.
The documents shall be delivered at the Company’s principal place of business, at Avenida Presidente Juscelino Kubitschek, No. 2041 and 2235 – Bloco A - Vila Olímpia - São Paulo – SP, 9th floor – Corporate - Legal Department, through the telephone Nos. +55 11 3553-5438 and +55 11 3553- 3854, email: acamargo@santander.com.br.
3.3. Remote Voting Participation
Pursuant to articles 21-A et seq. of CVM Ruling No. 481/2009, the Company's shareholders may also vote at shareholders’ meetings by means of remote voting, to be formalized through the “remote voting ballot” (“Ballot”), the template of which is available in the Corporate Governance area of the Company’s Investor Relations website (www.ri.santander.com.br), or on the website of the Brazilian Securities and Exchange Commission – CVM (http://sistemas.cvm.gov.br/?CiaDoc).
| 7 |
| |
The shareholder that chooses to exercise his/her/their voting rights remotely shall do so by one of the options described below:
(I) Submittal of the Ballot to Custody agents
The Shareholder that chooses to cast remote voting through his/her/its respective custodian agent (“Custodian") shall convey his/her/their voting instructions in accordance to the rules determined by the Custodian, which shall forward said voting ballots to the Central Depository of B3 S.A. - Brasil, Bolsa, Balcão. Shareholders shall contact his/her/their respective Custodians to check the procedures established by them for issuance of ballot voting instructions, as well as the documents and information required to do so.
The Shareholder shall convey the instructions for completion of the Ballot to his/her/their Custody agents by 04/23/2021 (including), unless defined otherwise by them.
(II) Submittal of the Ballot by the Shareholder to the Bookkeeper
The Shareholder who chooses to cast the remote vote through the Company's Bookkeeper shall observe the following instructions, so that the Ballot can be deemed valid and the votes are counted:
(i) all fields shall be duly completed;
(ii) all pages shall be initialed;
(iii) the last page shall be signed by the Shareholder or his/her/their legal representative(s), as applicable, and in accordance with the applicable legislation.
The following documents shall be forwarded to the Bookkeeper:
(i) original copy of the Ballot, duly completed, initialed and signed; and
(ii) copy of the following documents:
- Individual (Shareholder or legal representative): Identity document with photo (RG and CPF; CNH or Professional Card duly attested by the competent authorities, containing CPF number).
- Legal entity: (i) Articles of Organization or Bylaws duly updated, with the documents proving the powers of representation (minutes of election); (ii) Identity document with photo of the representatives (RG and CPF; CNH or Professional Card duly attested by the competent authorities, containing CPF number).
- Investment fund: (i) Latest consolidated Regulations for the fund, as well as the Bylaws or Articles of Organization of its manager, in addition to the corporate documentation that grants proxy powers (minutes of officers’ election and/or power of attorney); (ii) Identity Card with a photograph of the representatives (RG and CPF; CNH (driver’s license) or official Professional Card containing the CPF enrollment number)
| 8 |
| |
The documents shall be sent to the Bookkeeper within 7 days before the date of the OGM, in other words, by 04/23/2021 (including) (i) at the following address: Banco Santander (Brasil) S.A. – Shareholders – Bookkeeping of Shares – Rua Amador Bueno, 474 – 2nd floor – Setor vermelho - Santo Amaro – São Paulo/SP – CEP 04752- 005; or (ii) via email, to the electronic address custodiaacionistavotodistancia@santander.com.br.
After receiving the documents, the Bookkeeper, within three (3) days, will inform the Shareholder regarding the receipt of the documents and their acceptance. If the submitted documentation is not considered suitable, the Ballot shall be considered invalid, and the Shareholder may regularize it by 04/23/2021.
Ballots received by the Bookkeeper after 04/23/2021 shall be disregarded.
(III) Submittal of the Ballot directly to the Company
The Shareholder who chooses to cast the remote vote through the Company shall observe the following instructions, so that the Ballot can be deemed valid and the votes are counted:
(i) all fields shall be duly completed;
(ii) all pages shall be initialed;
(iii) the last page shall be signed by the Shareholder or his/her/its legal representative(s), as applicable, and in accordance with the applicable legislation.
The following documents shall be forwarded to the Company:
(i) original copy of the Ballot, duly completed, initialed and signed; and
(ii) copy of the following documents:
- Individual (Shareholder or legal representative): Identity document with photo (RG and CPF; CNH or Professional Card duly attested by the competent authorities, containing CPF number).
- Legal entity: (i) Articles of Organization or Bylaws duly updated, with the documents proving the powers of representation (minutes of election); (ii) Identity document with photo of the representatives (RG and CPF; CNH or Professional Card duly attested by the competent authorities, containing CPF number).
- Investment fund: (i) Last consolidated bylaws of the fund and of the Articles of Association or Organization of its manager, in addition to the corporate documentation granting powers of representation (minutes of election of the officers and/or power of attorney) (ii) Identity document with photo of the representatives (RG and CPF; CNH or Professional Card duly attested by the competent authorities, containing CPF number).
| 9 |
| |
The documents shall be sent to the Company within 7 days before the date of the OGM, in other words, by 04/23/2021 (including) (i) at the following address: Banco Santander (Brasil) S.A. - Investor Relations - Avenida Presidente Juscelino Kubitscheck, 2235 - 26th floor - Vila Olímpia - São Paulo/SP - CEP 04543-011; or (ii) via email, to the electronic address ri@santander.com.br.
After receiving the documents, the Company, within three (3) days, will inform the Shareholder regarding the receipt of the documents and their acceptance. If the submitted documentation is not considered suitable, the Ballot shall be considered invalid, and the Shareholder may regularize it by 04/23/2021.
Ballots received by the Company after 04/23/2021 shall be disregarded.
General Information:
Ø in accordance with Article 21-S of CVM Ruling No. 481, the Central Depository of B3 S.A. - Brasil, Bolsa, Balcão, upon receiving the voting instructions from the shareholders through their respective custody agents shall disregard any diverging instructions in relation to the same resolution that has been issued by the same CPF or CNPJ registration number; and
Ø upon termination of the deadline for remote voting, in other words, by 04/23/2021 (including), the shareholder will not be able to change the voting instructions already sent, except if attending the Shareholders' Meeting or represented by power of attorney, upon express request for disregard of the voting instructions sent through the Ballot, before the respective matter(s) is subject to voting.
3.4. ADS holders
Holders of American Depositary Shares (ADSs) shall be given the right to vote on the matters listed on the Agenda, subject to the same criteria applied in relation to national investors, according to the type of shares (common or preferred) on which their ADSs are backed. ADS holders will be duly instructed by The Bank of New York Mellon, depository institution for ADSs backed by Santander Brasil shares.
| 10 |
| |
4. Matters to be resolved at the OGM
Below you shall find clarifications made by the Company’s management regarding each of the items to be resolved in the OGM. According to the Call Notice made available to the shareholders, our OGM shall take resolutions regarding the following matters of the Agenda:
4.1. To TAKE the management accounts, to examine, discuss and vote on the Company’s Financial Statements related to the fiscal year ended on December 31, 2020, accompanied by the Management Report, the balance sheet, other parts of the financial statements, external auditors’ opinion and the Audit Committee Report
The documents presented by the management are:
- Management Report showing the operating statistics and the analysis and discussion of the Administrative Officers of the principal accounts of the Statement of Income for the Fiscal Year;
- Comments of the administrative officers on the financial condition of the Company (Exhibit II – Item 10 of the Reference Form);
- Copy of the Financial Statements and Explanatory Notes;
- Opinion of the Independent Auditors;
- Summary of the report of the Audit Committee; and
- Standardized financial statements form – DFP.
The management documents identified above, except for item ii above, were made available to the CVM, via the IPE system, at the time of disclosure of the individual and consolidated financial statements of the Company prepared in accordance with Accounting Practices Adopted in Brazil applicable to institutions authorized to operate by the Brazilian Central Bank, on February 3rd, 2021, and for the consolidated financial statements of the Company in accordance with the IFRS as issued by the IASB made available on February 26th, 2021. These documents can be found on the electronic address of the CVM (www.cvm.gov.br), or of the Company (www.ri.santander.com.brand www.santander.com.br/acionistas), according to information shown in Exhibit II of this Proposal.
The Company's management proposes that the shareholders examine in detail the management accounts and the Company's Financial Statements so that they can deliberate about their approval.
| 11 |
| |
4.2. To DECIDE on the allocation of net income for the year 2020 and the distribution of dividends;
(a) Net Profit Allocation
The Executive Board presents a proposal for the fiscal year 2020 net profit allocation in compliance with the provisions of Article 9, first paragraph, item II and the respective Annex 9-1-II to CVM Instruction 481. Said proposal is contained in Exhibit III to this Proposal. We recommend the careful reading of said exhibit.
The net profit of the Company in the fiscal year 2020 was R$ 14,056,148,344.49.
Management proposes the following allocation for net income for the year 2020:
1. The amount of R$ 702,807,417.22 to the Company’s legal reserve account;
2. The amount of R$ 3,837,085,231.82, as dividends and Interest on Equity to shareholders, which have been the object of decision in the meetings of the Board of Directors held on April 27, 2020, July 28, 2020, October 26, 2020, December, 28 2020 and February 02, 2021, of which R$ 3,325,000,000.00 as and Interest on Equity allocated within the mandatory minimum dividends and R$ 512,085,231.82 as interim dividends; and
3. The balance of the remaining net profit after the distributions above, to the value of R$ 9,516,255,695.45 for the Dividend Equalization Reserve account, pursuant to Article 36, item III-a of the Company's Bylaws
The board understands that the proposal for allocation of net profits above was formulated in accordance with the legal and statutory obligations applicable to the Company, and is in line with the goals and strategies of the Company, which is why the board recommends its approval without restrictions.
(b) Distribution of Dividends
As better detailed in Exhibit III of this Proposal, the Company management has approved the distribution to its shareholders the global amount of R$ 3,837,085,231.82 as dividends and Interest on Equity to the shareholders, which have been the object of decision in the meetings of the Board of Directors held on April 27, 2020, July 28, 2020, October 26, 2020, December, 28 2020 and February 02, 2021, of which R$ 3,325,000,000.00 as and Interest on Equity allocated within the mandatory minimum dividends and R$ 512,085,231.82 as interim dividends. These values correspond to 28.74% of the adjusted net profit of the Company, and were paid to shareholders based on their respective shares in the share capital of the Company.
4.3. To FIX the number of members that will compose the Board of Directors in the mandate from 2021 to 2023;
The Company’s management proposes that the Board of Directors comprise 9 members for a term of office to be effective between the OGM of 2021 and the Ordinary General Meeting of 2023.
| 12 |
| |
4.4. To ELECT the members of the Company's Board of Directors for a term of office from 2021 to 2023; and
After complying with the applicable governance approvals, the Company proposes to the OGM the election for a new term of two (2) years, of the following candidates recommended by the controlling shareholders to compose the Board of Directors of the Company:
| Name | Position |
| Álvaro Antônio Cardoso de Souza | Chairman and Independent Director |
| Sergio Agapito Lires Rial | Vice-Chairman |
| Deborah Patricia Wright | Independent Director |
| Deborah Stern Vieitas | Independent Director |
| Jose Antonio Alvarez Alvarez | Director |
| José de Paiva Ferreira | Director |
| José García Cantera | Director |
| Marília Artimonte Rocca | Independent Director |
| Pedro Augusto de Melo | Independent Director |
The information related to the election of the members of the Board of Directors of the Company, pursuant to article 10 of CVM Instruction 481, can be found on Exhibit IV of this Proposal.
4.5. To FIX the annual global compensation of the Company´s management and members of Audit Committee.
The management presents a proposal for remuneration of the Company’s management, complying with the provisions of Article 12, items I and II of CVM Instruction 481 and item 13 of the Reference Form of the Company, on the terms of Exhibit V to this Proposal.
In 2020, the Ordinary General Meeting, held on April 30, approved an annual global compensation for the Company’s management, in an amount of up to R$ 400,000,000.00 (four hundred million Brazilian Reais) for the 2020 financial year, and for the Audit Committee in an amount of R$ 4,000,000.00 (four million Brazilian Reais) for the same period. Effectively, for the period from January to December, 2020 it was paid to the Company’s management members the amount of R$ 285,371,012.82 (two hundred and eighty-five million, three hundred and seventy-one thousand and twelve Brazilian Reais and eighty-two cents), being acknowledged that such amount does not include social security duties.
For the period from January to December, 2021, the amount proposed by the management as the annual global compensation for the Company’s management (Board of Directors and Executive Board) is of up to R$ 433,940,000.00 (four hundred and thirty-three million, nine hundred and forty thousand Brazilian Reais), covering fixed remuneration, variable remuneration and the stock base remuneration.
| 13 |
| |
The management members annual global compensation amount proposed is superior of the cap amount approved for the period from January to December, 2020, without considering the social security duties, which the estimative for the period from January to December 2021 is to reach the amount of up to R$ 29,440,000.00 (twenty-nine million, four hundred and forty thousand Brazilian Reais).
The amount proposed by the Board of Directors as annual global compensation of the members of the Audit Committee for the twelve (12) months period counting from January 1st, 2021 is of up to R$ 4,832,500.00 (four million, eight hundred and thirty-two thousand, five hundred Brazilian Reais).
| 14 |
| |
EXHIBIT I:
POWER OF ATTORNEY
POWER OF ATTORNEY
[SHAREHOLDER], [QUALIFICATION] (“Grantor”), appoints as his/her/its attorneys-in-fact Messrs. CAROLINA SILVIA ALVES NOGUEIRA TRINDADE, Brazilian, married, registered with OAB/RJ under no. 182.414 and under the CPF/ME under no. 124.143.167.13; and RAFAEL TRIDICO FARIA, Brazilian, married, registered with OAB/SP 358.447 and under the CPF/ME under no. 409.544.508-41, both of them lawyers, with firms in the Capital City of the State of São Paulo, at Avenida Presidente Juscelino Kubitschek Nos. 2041 and 2235 - Bloco A - Vila Olímpia (“Grantees”) to represent, collectively or individually, regardless of the order of appointment, the Grantor, as shareholder of Banco Santander (Brasil) S.A. ("Company"), at the Company's Ordinary General Meeting to be held, on first call, on April 30, 2021, at 3:00 PM, at the Company's principal place of business, at Avenida Presidente Juscelino Kubitschek No. 2235 and 2041 - 2nd mezzanine, Vila Olímpia, São Paulo/SP, and if necessary on second call, on a date to be informed in due course, to whom powers are granted to attend the meeting and vote, on behalf of the Grantor, in accordance with the voting guidelines set forth below for each of the items on the Agenda:
(i) To TAKE the management accounts, to examine, discuss and vote on the Company’s Financial Statements related to the fiscal year ended on December 31, 2020, accompanied by the Management Report, the balance sheet, other parts of the financial statements, external auditors’ opinion and the Audit Committee Report;
( ) For ( ) Against ( ) Abstention
(ii) To DECIDE on the allocation of net income for the year 2020 and the distribution of dividends;
( ) For ( ) Against ( ) Abstention
(iii) To FIX the number of members that will compose the Board of Directors in the mandate from 2021 to 2023;
( ) For ( ) Against ( ) Abstention
(iv) To ELECT the members of the Company's Board of Directors for a term of office from 2021 to 2023;
( ) For ( ) Against ( ) Abstention
| 15 |
| |
(v) To FIX the annual global compensation of the Company´s management and members of Audit Committee;
( ) For ( ) Against ( ) Abstention
The Grantees are hereby authorized to abstain from any resolution or act for which they have not received, at their discretion, sufficiently specific voting guidelines. The Grantor shall hold the Grantees above harmless and free from any and all claims, disputes, demands, losses, or damages, of any nature, arising from the fulfillment of this instrument, except in cases of acts performed in an abusive and excessive manner, pursuant to the legislation in effect.
This power of attorney shall only be valid for the Company's Ordinary General Meeting mentioned above.
[Place], [month] [day], 2021.
_____________________________________________
[Signature of Grantor]
| 16 |
| |
EXHIBIT II:
COMMENTS OF THE MANAGEMENT TO THE FINANCIAL CONDITION OF THE COMPANY
(Pursuant to item III of article 9 of CVM Instruction 481)
10. Officers comments
10.1 Officers should comment on:
a. general financial and equity conditions
We assessed that in the fourth quarter of 2020, the global scenario continued to be marked by the developments of the COVID-19 pandemic, with the first affected countries facing the so-called "second wave" of contamination in the wake of the slowdown in social distancing policies. However, we also highlight the rapid evolution in the process of developing vaccines against the disease, with some countries having already started an immunization program for their citizens and several formulating the same initiative for the first months of 2021. Despite the uncertainties brought by the pandemic, the fiscal and monetary stimulus packages implemented by the vast majority of economies continued to see the release of indicators of economic activity signaling the continued trend of resumption after the sharp downturn observed in the second quarter of 2020. We assessed that these fiscal and monetary stimuli continued to help support the prices of financial assets. For example, the U.S. S&P500 index, which had retreated from 3,200 points to 2,500 points between December 2019 and March 2020, advanced to approximately 3,100 points at the end of June, ended the third quarter close to 3,400 points and advanced to near 3,800 points in the fourth quarter (up 11.7% in the last three months of 2020).
In the country, we consider that the misfortunes generated by COVID-19 diverted the focus from discussions on structural reforms to the debates on measures to combat the economic impacts caused by the pandemic, mainly for actions directed at the poorest layers of the population and to the business segments most exposed to the misfortunes caused by social distancing policies. In our view, such temporary measures were essential to mitigate the impact of the crisis, but will result in a substantial increase in public expenditure throughouth and 2021 and, consequently, will cause a significant increase in the level of indebtedness of the Brazilian government. We believe that this framework only reinforces the need to resume discussions on structural reforms after overcoming the pandemic to prevent the trajectory of Brazilian public indebtedness from becoming unsustainable.
After a widespread initial wave of revisions to the GDP projections in 2020 against first quarter expectations, we observed the stimulus granted to cause strong recovery in some segments of the Brazilian economy – namely in the retail segment. This more intense reaction than many imagined caused economic agents to project less intense declines to Brazilian GDP this year and this trend has continued in recent months. While the median projection indicated a 6.6% decline in Brazilian GDP at the end of the second quarter of 2020, at the end of the fourth quarter, the median expectation was that the Brazilian economy will fall by 4.36% in 2020. We believe that, although less intense, the prospect of a sharp contraction in Brazilian GDP in 2020, followed by a gradual recovery in later years – the median expectations for GDP growth in 2021 and 2022 were 3.4% and 2.5%, respectively, at the end of the fourth quarter – they continued to justify the general perception that the variation of the IPCA will converge to the targets stipulated in the relevant horizon for monetary policy, despite having ended 2020 above the target set for the year in the wake of temporary shocks – the annual change of the IPCA in 2020 reached 4.5%, while the target was 4.0%. The combination of prospects for gradual economic recovery and inflation compatible with the established targets is what we believe has provided space to the Central Bank of Brazil to maintain the basic interest rate at the historic minimum level of the country (2.00% p.a.) at the end of 2020, in addition to signaling the permanence of the Selic rate at this level for much of 2021.
| 17 |
| |
In our view, the situation of slow growth and high public indebtedness is something that has kept international investors worried about the acquisition of Brazilian financial assets. However, this attitude was not an obstacle for the trajectories recorded by both the 5-year CDS in Brazil and the exchange rate to perform favorably in the fourth quarter. In the first case, the instrument of protection regarding insolvency problems of the Brazilian government ended the period at 143 basis points, a level similar to the average level recorded in the first quarter (therefore, before the pandemic declaration), when the indicator was around 150 points – a level lower than the 250 points recorded at the end of the third quarter. In the case of the exchange rate, we saw a similar process with parity against the dollar retreating from R$5.60/US$ at the end of September 2020 to R$5.20/US$ at the end of the fourth quarter of last year, even though it was traded close to R$5.80/US$ over the period. In both cases, we evaluated that the trigger for the improvement recorded over the period concerns the reduction of doubts regarding the Brazilian fiscal dynamics for the coming years, in the wake of official statements that signaled the willingness to respect the rules imposed by the legal framework of the public spending ceiling.
Therefore, in order to improve further the performance of these indicators, we evaluate that measures will be necessary that signal even greater commitment of the Brazilian government to the reversal of the upward trajectory of public spending expected for the years ahead. This will only be possible for us with the resumption of structural reforms.
| (i)2020 |
For the year ended December 31, 2020, we reported a consolidated net income of R$13.4billion, a reduction of 19.1% compared to 2019. Total assets for the year ended December 31, 2020, reached R$936,201 million, an increase of 22.8%over 2019. Shareholders' equity reached R$106,090 million and adjusted ROAE (excluding goodwill) was 18.4% in 2020.
Our Basel capital adequacy ratio, in accordance with Central Bank standards, was 15.3% as of December 31, 2020.
| 18 |
| |
As of December 31, 2020, our portfolio of loans and advances to gross customers grew 20.3%, reaching R$417,822 million, compared to R$347,257 million as of December 31, 2019.
The following table provides a managerial breakdown of our portfolio of loans and advances to customers (gross) by customer category on the dates indicated.
For the year ended December 31 | Variations between December 31, 2020 vs. December 31, 2019 | ||||
2020 | 2011 | 2018 | R$ million | % | |
| (in millions of R$, except percentages) | |||||
| Individual | 174,042 | 156,177 | 133,603 | 17,865 | 11.4% |
| Consumer finance | 51,637 | 48,421 | 40,964 | 3,216 | 6.6% |
| Small and Medium Enterprises(1) | 54,525 | 53,119 | 49,624 | 1,406 | 2.6% |
| Large Enterprises (2) | 137,618 | 89,539 | 97,112 | 48,079 | 53.7% |
| Total | 417,822 | 347,257 | 321,303 | 70,565 | 20.3% |
| (1) | Companies with annual gross revenue of up to R$ 200 million. |
| (2) | Companies with annual gross revenue higher than R$ 200 million, including global corporate clients of the Company. |
Our total funding as of December 31, 2020 was R$647,465 million, an increase of 24.5% compared to R$519,664 million as of December 31, 2019.
| (ii) | 2019 |
For the year ended December 31, 2019, a Company reported consolidated net income of R$16.6 billion, an increase of 29.9% compared to 2018. Total assets, for the year ended December 31, 2019 December 2019, reached R$762,237 million, an increase of 5.3% in relation to 2018. Shareholders' equity reached R$97.209 million and the adjusted ROAE (excluding the goodwill effect) was 21.3% in 2019.
The Company's Basel capital adequacy index, according to the Brazilian Central Bank rules, was 15.0%, as of December 31, 2019.
As of December 31, 2019, the Company's loan and advances portfolio to customers grew 10.6%, reaching R$347,257 million, compared to R$321,933 million on December 31, 2018.
The following table provides a managerial breakdown of the Company's loans and advances to customers (gross) portfolio by customer category on the dates indicated.
| 19 |
| |
For the year ended December, 31 | Variations between December 31, 2019 vs. December 31, 2018 | ||||
2019 | 2018 | 2017 | R$ million | % | |
| (in millions of R$ , except for percentages) | |||||
| Individuals | 156,177 | 133,603 | 107,610 | 22,574 | 16.9% |
| Consumers financing | 48,421 | 40,964 | 33,170 | 7,457 | 18.2% |
| Small and Medium Companies | 53,119 | 49,624 | 46,879 | 3,495 | 7.0% |
| Large Companies (1) | 89,539 | 97,112 | 100,171 | (7,573) | (0.1)% |
| Total | 347,257 | 321,303 | 287,829 | 25,953 | 8.1% |
| (1) | Companies with annual gross revenue higher than R$ 200 million, including global corporate clients of the Company. |
Total funding of the Company as of December 31, 2019 was of R$519,664 million, a 4.5% increase compared to R$497,512 million on December 31, 2018.
| (iii) | 2018 |
In the year ended December 31, 2018, the Company reported a consolidated net income of R$12.8 billion, a 28.9% increase compared to 2017. Total assets in the year ended December 31, 2018, reached R$723,865 million, an increase of 10.8% compared to 2017. Shareholders’ equity reached R$91,882 million and the adjusted ROE (excluding effect of goodwill) was of 21.0% in 2018.
The Basel adequacy rate of the Company, according to the Brazilian Central Bank rules, was 15.1% as of December 31, 2018.
As of December 31, 2018, the gross client’s loans and advances portfolio of the Company grew 10.6% and reached R$321,933 million, compared to R$287,829 million as of December 31, 2017.
The chart below presents the management details on the loans and advances portfolio (gross) of the Company per client category on the indicated dates.
For the year ended December, 31 | Variations between December 31, 2018 vs. December 31, 2017 | ||||
2018 | 2017 | 2016 | R$ million | % | |
| (in millions of R$ , except for percentages) | |||||
| Individuals | 133,603 | 107,610 | 91,195 | 25,993 | 24.2% |
| Consumers financing | 40,964 | 33,170 | 26,608 | 7,794 | 23.5% |
| Small and Medium Companies (1) | 49,624 | 46,879 | 42,440 | 2,746 | 5.9% |
| Large Companies (2) | 97,112 | 100,171 | 108,195 | (3,059) | (3,1)% |
| Total | 321,303 | 287,829 | 268,438 | 33,474 | 11,6% |
| (1) | Companies with annual gross revenue of up to R$ 200 million. |
| (2) | Companies with annual gross revenue higher than R$ 200 million, including global corporate clients of the Company. |
Total funding of the Company as of December 31, 2018 was of R$497,512 million, a 14.5% increase compared to R$434,620 million on December 31, 2017
| 20 |
| |
b. capital structure:
| Liability Structure | ||||||
Liabilities In million of Real | Dez/20 | % of total liability | Dez/19 | % of total liability | Dez/18 | % of total liability |
| Own Capital – Shareholders Equity (1) | 106,089 | 11% | 97,209 | 13% | 91,595 | 13% |
| Third Capital – Short term (2) | 593,880 | 63% | 410,492 | 54% | 415,720 | 57% |
| Third Capital – Long term (3) | 236,232 | 25% | 254,536 | 33% | 216,550 | 30% |
| Total liability | 936,201 | 100% | 762,237 | 100% | 723,865 | 100% |
(1) Includes Non-Controlling Interest
(2) Current Liabilities
(3) Total liabilities, except Shareholders' Equity and Current Liabilities
Debt ratio, according to the formula: third capitals / total assets x 100, is 89.
Furthermore, the following table shows the direct shareholding interest (common and preferred shares) as of December 31, 2020:
Shareholder
| Common shares (thousands) |
Common shares (%) | Preferred shares (thousands) |
Preferred shares (%) |
Total shares (thousands) |
Total shares (%) |
| Sterrebeeck BV (2) | 1,809,583 | 47.39% | 1,733,644 | 47.11% | 3,543,227 | 47.25% |
| Grupo Empresarial Santander SL | 1,627,891 | 42.63% | 1,539,863 | 41.85% | 3,167,755 | 42.25% |
| Banco Santander, S.A. | 2,696 | 0.07% | - | 0.00% | 2,696 | 0.04% |
| Treasury Stock | 18,829 | 0.49% | 18,829 | 0.51% | 37,658 | 0.50% |
| Employees (1) | 6,265 | 0.16% | 6,273 | 0.17% | 12,538 | 0.16% |
| Other minority shareholders | 353,430 | 9.26% | 381,227 | 10.36% | 734,657 | 9.80% |
| Total | 3,818,695 | 100% | 3,679,836 | 100% | 7,498,531 | 100% |
| (1) | It includes members of the Company's senior management. |
| (2) | An affiliate of Santander Group |
| (i) | Equity and Participation of Non-Controlling Shareholders |
As of December 31, 2019, the Company’s capital was of R$57,000,000,000.00, fully paid up and divided into 7,498,531,051 shares, all of them registered, book-entry and with no par value.
Pursuant to the current Bylaws, may be increased up to the limit of the authorized capital, irrespective of amendments to the Bylaws, upon a resolution of the Board of Directors of the Company and issuance of up to 9,090,909,090 new shares, whereas the total number of preferred shares shall not exceed 50.0% of the total number of outstanding shares. Any capital increase in excess of such limit requires the approval of the shareholders.
| 21 |
| |
(ii) Equity and Third-Party
Revenue from equity instruments for the year ended December 31, 2020 totaled R$ 34 million, an increase of R$ 15 million compared to R$ 19 million in the year ended December 31, 2019, mainly due to the dividends received from “Santander Fundo de Investimento Amazonas Multimercado Crédito Privado Investimento no Exterior” as the result of gains in stock positions for hedge of derivatives.
(iii) Benchmark Equity - Basel Ratio
Our capital management is based on conservative principles with continuous monitoring of items that affect our solvency level. We must abide by the Brazilian regulations of capital adjustment according to the rules of the Brazilian Central Bank. In October 2013, the new capital implementation regulations and regulatory capital requirements of the Basel Banking Supervision Committee (Basel III) entered into force in Brazil. The minimum regulatory capital requirement is currently 11%. The Tier I requirement is 6.0%, divided into basic capital of at least 4.5%, consisting mainly of share capital and profit reserves, including shares, units of ownership, reserves and income earned, and additional capital consisting mainly of certain reserves, earned revenues and securities and hybrid instruments such as capital authorized by the Central Bank of Brazil.
According to the new rules on regulatory capital in Brazil, the value of goodwill for the calculation of the capital base was deducted according to the "phase-in" for the implementation of Basel III in Brazil, which was concluded on January 1, 2019. The following table shows the percentage of goodwill deduction required for each year through 2019:
Basel III Phase in | |||||
2015 | 2016 | 2017 | 2018 | 2019 | 2020 |
| 40% | 60% | 80% | 100% | 100% | 100% |
Source: Central Bank of Brazil; Resolution No. 4,192 of the Central Bank of Brazil of March 2013.
The Basel adequacy ratio of the Company, according to the Brazilian Central Bank rules was 15.3% at December 31, 2020.
| 22 |
| |
On December 31, | ||||||
2020(1) | 2019(1) | 2018(1) | ||||
| (In millions of R$, except percentages) | ||||||
| Level I Reference Assets | 77,571.5 | 66,481.7 | 61,476.7 | |||
| Principal Capital | 71,006.3 | 61,389.5 | 56,581.5 | |||
| Supplementary Capital | 6,565.2 | 5,092.2 | 4,895.2 | |||
| Level II Reference Assets | 6,554.4 | 5,083.8 | 4,887.2 | |||
| Reference Assets (Level I and II) | 84,125.9 | 71,565.5 | 66,363.9 | |||
| Required Reference Assets | 551,569.1 | 475,986.9 | 440,562.9 | |||
| Credit Risk Portion (2) | 478,303.5 | 407,786.2 | 358,955.6 | |||
| Market Risk Portion (3) | 15,846.2 | 20,235.2 | 39,231.8 | |||
| Operational Risk Portion | 57,419.4 | 47,965.5 | 42,375.6 | |||
| Level I Basel Ratio | 14.06% | 13.97% | 13.95% | |||
| Basel Ratio Principal Capital | 12.87% | 12.90% | 12.84% | |||
| Basel Ratio | 15.25% | 15.04% | 15.06% | |||
| (1) | Amounts calculated based on consolidated information by Prudential Consolidated. |
| (2) | For the calculation of capital allocation for Credit Risk, the modifications and inclusions of Brazilian Central Bank (“BACEN”) Official Letter 3714 of August 20, 2014, Bacen Official Letter 3770 of October 29, 2015, which amends Official Letter 3644 of March 4, 2013 were considered. |
| (3) | It includes portions for exposure to market risk subject to variations on coupon rates in foreign currency, or "PJUR2", price indexes or "PJUR3" and interest rate or "PJUR1 / PJUR4", of the price of goods “commodities” or "PCOM”, of the price of shares classified as negotiation portfolios, or "PACS”, and portions for exposure to gold, foreign currency and transactions subject to currency variation, or “PCAM.” |
(c) ability to pay the financial obligations assumed
The administration of Company's creditworthiness is made dynamically through the implementation of limits and control models, approved and supervised by the Assets and Liabilities Committee (ALCO), which operates according to guidelines and procedures established by Santander Group and the Brazilian Central Bank. The control and management of the creditworthiness are made through the analysis of cash flow positions, structural liquidity and simulations of potential losses of resources under stress scenarios. Also, a plan is prepared containing funding requirements that consider the best structure for the funding sources, in order to achieve the necessary diversification in terms of maturities, instruments and markets, as well as the establishment of contingency plans. These controls, together with the maintenance of a minimum liquidity margin, guarantee sufficient resources to honor client deposits and other obligations, to give loans and financing to clients, fulfill the specific needs of working capital for investment and to cope with occasional risks related to liquidity crisis.
The Company actively managers the risks intrinsic to the activity of commercial bank, such as structural risks of interest rates, liquidity and foreign exchange rates. The objective of the financial management is to turn the net income with interest from commercial activities more stable and recurring, maintaining adequate levels of liquidity and solvency. Financial management also analyses the risk of structural interest rate derived from the divergences between the maturities and review of assets and liabilities in each currency operated by the Company.
The following table shows the intervals between the pricing dates of financial assets and liabilities with different maturity dates, on December 31, 2019, 2018 and 2017, respectively (liquidity position):
| 23 |
| |
| 2020 | In millions of Reais | ||||||
| On Demand | Up to 3 months | 3 to 12 months | 1 to 3 years | 3 to 5 years | After 5 years | Total | |
| Assets: | |||||||
| Cash and balances with the Brazilian Central Bank | 7,374 | 12,775 | - | - | - | - | 20,149 |
| Debt instruments (2) | 433 | 13,196 | 33,904 | 64,226 | 70,183 | 48,162 | 230,102 |
| Equity instruments | - | - | - | - | - | 2,329 | 2,329 |
| Loans and amounts due from credit institutions | 57,722 | 2,778 | 36,783 | 15,155 | 363 | 48 | 112,850 |
| Loans and advances to customer | 29,386 | 80,282 | 93,750 | 98,550 | 47,161 | 44,640 | 393,768 |
| Derivatives | - | 14,558 | 1,994 | 6,727 | 1,870 | 3,721 | 28,871 |
| Total | 94,914 | 123,588 | 166,431 | 184,658 | 119,576 | 98,901 | 788,069 |
| Liabilities: | |||||||
| Financial liabilities at amortized cost: | |||||||
| Deposits of credit institutions (1) | - | 83,923 | 43,315 | 3,764 | - | 655 | 131,657 |
| Customer deposits (1) | 85,433 | 139,191 | 121,805 | 62,769 | 36,578 | 38 | 445,814 |
| Marketable debt securities (1) | - | 8,815 | 18,736 | 28,158 | 747 | 418 | 56,876 |
| Debt Instruments Eligible to Compose Capital | - | 220 | - | 12,899 | - | - | 13,120 |
| Other financial liabilities | 23 | 21,859 | 20,730 | 17,203 | 5 | 2 | 59,823 |
| Short positions | - | 45,808 | - | - | - | - | 45,808 |
| Derivatives | - | 2,047 | 1,974 | 8,011 | 7,744 | 12,204 | 31,980 |
| Total | 85,457 | 301,863 | 206,560 | 132,804 | 45,075 | 13,317 | 785,077 |
| 2019 | In millions of Reais | ||||||
| On Demand | Up to 3 Months | 3 to 12 Months | 1 to 3 Years | 3 to 5 Years | After 5 Years | Total | |
| Assets: | |||||||
| Cash and balances with the Brazilian Central Bank | 6,549 | 13,578 | - | - | - | - | 20,127 |
| Debt instruments (2) | 7,748 | 1,174 | 22,926 | 45,058 | 35,118 | 61,307 | 173,331 |
| Equity instruments | - | - | - | - | - | 2,358 | 2,358 |
| Loans and amounts due from credit institutions | 69,135 | 1,943 | 21,065 | 14,525 | 2,411 | 153 | 109,232 |
| Loans and advances to customer | 9,452 | 84,840 | 43,181 | 89,624 | 34,093 | 65,511 | 326,701 |
| Derivatives | 6,806 | ||||||
| Total | 99,690 | 103,428 | 89,822 | 152,754 | 73,573 | 132,929 | 652,196 |
| Liabilities: | |||||||
| Financial liabilities at amortized cost: | - | - | - | - | - | - | - |
| Deposits from credit institutions(1) | 391 | 16,584 | 49,098 | 25,656 | 4,877 | 2,666 | 99,272 |
| Customer deposits(1) | 69,049 | 130,872 | 76,245 | 43,396 | 16,923 | 30 | 336,515 |
| Marketable debt securities (1) | - | 10,675 | 695 | 37,269 | 3,900 | 21,163 | 73,702 |
| Subordinated liabilities | - | - | - | - | - | - | - |
| Debt Instruments Eligible to Compose Capital | - | 171 | - | 10,005 | - | - | 10,176 |
| Other financial liabilities | 10 | 24,361 | 14,510 | 16,679 | 5 | 2 | 55,567 |
| Financial liabilities held for trading: | 6,777 | 9,094 | 1,961 | 5,953 | 6,250 | 16,230 | 46,265 |
| Short positions | - | 4,749 | 1,554 | 1,256 | 3,748 | 12,529 | 23,836 |
| Derivatives | 6,776 | 4,345 | 406 | 4,697 | 2,502 | 3,702 | 22,428 |
| Total | 76,226 | 191,757 | 142,508 | 138,958 | 31,955 | 40,092 | 621,496 |
| 24 |
| |
| 2018 | In millions of Reais | ||||||
| On Demand | Up to 3 Months | 3 to 12 Months | 1 to 3 Years | 3 to 5 Years | After 5 Years | Total | |
| Assets: | |||||||
| Cash and balances with the Brazilian Central Bank | 31,324 | 393 | - | - | - | - | 31,717 |
| Debt instruments (2) | 27 | 51,256 | 25,903 | 13,186 | 26,368 | 58,693 | 175,433 |
| Equity instruments | 840 | 34 | 232 | - | - | - | 1,106 |
| Loans and amounts due from credit institutions | 57,528 | 8,449 | 845 | 12,740 | 11 | 34 | 79,607 |
| Loans and advances to customer | - | 112,215 | 75,101 | 63,044 | 21,398 | 29,933 | 301,691 |
| Derivatives | - | 13,816 | 1,240 | 1,114 | 1,075 | 1,118 | 18,363 |
| Total | 89,719 | 186,163 | 103,321 | 90,084 | 48,852 | 89,778 | 607,917 |
| Liabilities: | |||||||
| Financial liabilities at amortized cost: | |||||||
| Deposits from credit institutions(1) | 1 | 55,873 | 18,564 | 19,851 | 2,598 | 2,136 | 99,023 |
| Customer deposits(1) | 65,242 | 102,942 | 76,988 | 42,400 | 16,624 | 2 | 304,198 |
| Marketable debt securities (1) | 9,886 | 11,105 | 26,741 | 22,479 | 5,854 | 8,447 | 84,512 |
| Subordinated liabilities | - | - | - | - | - | - | - |
| Debt Instruments Eligible to Compose Capital | - | - | - | - | - | 9,780 | 9,780 |
| Other financial liabilities | 66 | 31,567 | 36 | 18,086 | - | 28 | 49,783 |
| Financial liabilities held for trading: | 206 | 7,640 | 8,864 | 32,419 | 605 | 1,428 | 51,162 |
| Short positions | 206 | - | 1,140 | 31,349 | - | - | 32,695 |
| Derivatives | - | 7,640 | 7,724 | 1,070 | 605 | 1,428 | 18,467 |
| Total | 75,607 | 216,767 | 140,057 | 167,654 | 26,286 | 23,249 | 649,620 |
(1) Include obligations that may have early enforceability, such as: demand deposits and time deposits, repurchase transactions with clients, LCI and LCA.
The following table shows financial assets and liabilities by national and foreign currency as of December 31, 2020, 2019 and 2018 (currency position):
| 25 |
| |
On December 31, | ||||||
2020 | 2019 | 2018 | ||||
National Currency | Foreign Currency | National Currency | Foreign Currency | National Currency | Foreign Currency | |
| (in millions of R$) | ||||||
| Assets | ||||||
| Cash and balances with the Brazilian Central Bank | 4,531 | 15,617 | 4,878 | 15,250 | 16,651 | 15,065 |
| Debt instruments | 226,787 | 3,315 | 164,447 | 8,885 | 166,743 | 8,690 |
| Equity securities | 1,675 | — | 2,358 | — | 1,106 | — |
| Loans and other amounts with credit institutions, gross | 109,339 | 3,520 | 107,694 | 1,553 | 79,167 | 17,902 |
| Loans and advances to customers, gross | 396,950 | 20,822 | 326,421 | 20,835 | 304,031 | — |
| Total | 739,283 | 43,275 | 605,798 | 46,523 | 567,698 | 42,111 |
| Liabilities | ||||||
| Financial liabilities at amortized cost | ||||||
| Deposits from Brazilian Central Bank and Credit Institutions | 86,564 | 45,093 | 58,283 | 40,988 | 74,160 | 24,863 |
| Customer deposits | 445,900 | — | 336,515 | — | 304,198 | — |
| Securities obligations | 45,476 | 9,399 | 64,987 | 8,715 | 70,109 | 4,517 |
| Subordinated liabilities | — | — | — | — | 9,886 | — |
| Capital-Eligible Debt Instruments | — | 13,120 | — | 10,176 | — | 9,780 |
| Other financial liabilities | 66,727 | 153 | 60,885 | — | 51,729 | — |
| Total | 646,667 | 67,766 | 520,670 | 59,879 | 510,082 | 39,160 |
d. sources of financing for working capital and for investments in non-current assets used
The following table shows the composition of the captures n the dates indicated:
On December 31, | ||||
2020 | 2019 | 2018 | ||
(in millions of R$) | ||||
| Customer Deposits | 445,813 | 336,515 | 304,198 | |
| Checking account | 35,550 | 29,524 | 18,854 | |
| Savings Account | 62,210 | 49,040 | 46,068 | |
| Time deposits | 269,929 | 175,994 | 190,983 | |
| Repurchase agreements | 78,124 | 81,957 | 48,293 | |
| Transactions backed by Private Bonds (1) | 14,944 | 8,743 | 6,978 | |
| Transactions backed by Public Bonds (1) | 63,180 | 73,214 | 41,315 | |
| Deposits from the Brazilian Central Bank and deposits from credit institutions | 131,657 | 99,271 | 99,023 | |
| Demand deposits (1) | 296 | 685 | 710 | |
| Time deposits (2) | 76,489 | 56,602 | 47,227 | |
| Repurchase agreements | 54,872 | 41,984 | 51,086 | |
| Transactions backed by Private Bonds (1) | 13,844 | 9,506 | 6,978 | |
| Transactions backed by Public Bonds(1) | 41,028 | 32,478 | 44,108 | |
| Total deposits | 577,470 | 435,786 | 403,221 | |
| Debt securities | 56,875 | 73,702 | 74,626 | |
| Agribusiness Credit Bills | 14,747 | 14,777 | 11,925 | |
| Financial Bills | 12,750 | 27,587 | 30,721 | |
| Real Estate Credit Notes | 19,979 | 21,266 | 27,160 | |
| Eurobonds and other securities | 9,399 | 10,072 | 4,820 | |
| Debt instruments Eligible to Establish Capital | 13,120 | 10,176 | 9,780 | |
| Subordinated Debt | - | - | 9,886 | |
| Total Funding | 647,465 | 519,664 | 497,513 | |
| __________________ |
| (1) | They basically refer to repurchase transactions backed by own debentures. |
(2) Includes transactions with credit institutions resulting from debt facilities to export and import, on lending in the country (BNDES and Finame) and from abroad, and other foreign debt facilities.
| 26 |
| |
(i) Deposits
· Customer Deposits: Our clients' deposit balance was R$445.9 billion as of December 31, 2020, R$336.5 billion at December 31, 2019 and R$304.2 billion as of December 31, 2018, representing 68.9%, 64.8% and 61.1% of total our funding, respectively.
· Current Accounts: The balance of our current account deposits was R$35.7 at December 31, 2020, R$29.5 billion at December 31, 2019 and R$18.9 billion as of December 31, 2018, representing 6.2%, 6.8% and 4.7% of total deposits, respectively.
· Customer Savings Deposits: Our customers' savings deposits were R$62.2 billion as of December 31, 2020, R$49.0 billion at December 31, 2019 and R$46.1 billion in December 31,2018, representing 10.8%, 11.3% and 11.4% of total deposits, respectively.
· Customer Time Deposits: The balance of term deposits of our customers was R$269.9 billion at December 31, 2020, R$176.0 billion at December 31,2019, R$191.0 billion as of December 31, 2018, representing 46.7%, 40.4% and 47.4% of total deposits, respectively.
· Customer Deposits—Repurchase Agreements: We maintain a portfolio of Brazilian public and private sector debt instruments, which is used to obtain short-term (overnight) resources from other financial institutions or investment funds through the sale of these securities with simultaneous repurchase commitment. Due to the short-term (overnight) nature of this source of resources, these transactions are volatile and are generally composed of Brazilian government bonds and operations committed with ballast in debentures. Securities sold in committed transactions decreased to R$78.1 billion at December 31, 2020, from R$82.0 billion at December 31, 2019 and R$48.3 billion as of December 31, 2018, representing 13.5%, 18.8% and 12.0% of total deposits, respectively.
(ii) Deposits from Brazilian Central Bank and Credit Institutions
Our deposit balance of the Central Bank of Brazil and credit institutions was R$131.7 billion as of December 31, 2020, R$99.3 billion at December 31, 2019 and R$99.0 billion as of December 31, 2018, representing 22.8%, 22.8% and 24.6% of total deposits, respectively.
It also includes National Loan and Transfers Obligations:
· Loan obligations. We have relationships with banks around the world, providing credit lines tied to foreign currencies (both the U.S. dollar and a basket of foreign currencies). We apply the resources of these operations, mainly in credit concessions tied to the U.S. dollar and, in particular, to financing to trade operations.
| 27 |
| |
· National transfers. We work in the transfer of public institutions, mainly BNDES and FINAME, for which we act as a financial agent. The financing of these sources in Brazil represents a method of providing long-term loans with medium competitive interest rates for some sectors of the economy. Loans of these funds are allocated by BNDES through banks to specific sectors directed to economic development. This type of loan is known as "transfer". Under this agreement, we borrow funds from BNDES or FINAME, the BNDES equipment financing subsidiary, and pass them on to specific sectors of the economy. These loans are usually granted at rates below average market rates and have an average term of up to five years. Because the funds passed on are generally married and/or financed by loans from a federal government agency, we do not assume any risk of interest rate or risk of mismarriage of deadlines, nor do we charge interest at a fixed margin on the costs of the funds. However, we retain the borrower's commercial credit risk and therefore have discretion in the credit decision and application of the credit criteria. This type of financing is not affected by compulsory deposit requirements. The transfer is generally guaranteed, although this is not required by the terms of the transfer.
(iii) Other Methods of Funding
| (iii.1) | Marketable Debt Securities |
Our balance in debt securities was R$56.9 billion as of December 31, 2020, R$73.7 billion as of December 31, 2019 and R$74.6 billion as of December 31, 2018, representing 8.8%, 14.2% and 15.0% of all our borrowings, respectively.
Agribusiness Letters of Credit are freely traded credit instruments and represent a future payment commitment, issued exclusively by financial institutions related to credit rights arising from transactions between rural producers and their cooperatives and other agents of the agricultural production chain and foreign exchange acceptances. Agribusiness Letters of Credit reached R$14.7 billion as of December 31, 2020, R$14.8 billion at December 31, 2019 and R$11.9 billion as of December 31, 2018.
Financial bills are alternative funding instruments for banks that may be characterized as senior or eligible to make up the Reference Equity for capital adequacy regulation purposes. According to CMN Resolution 4.733 of June 2019, its minimum term must be 24 months and must be issued for a minimum amount of R$300,000 for subordinated transactions and R$50,000 for senior transactions totaling R$12.8 billion at December 31, 2020, a 53.8% drop from December 2019.
The Real Estate Credit Bills, or "LCI," reduced 6.1%, from R$21.3 billion in December 2019 to R$20.0 billion as of December 31, 2020.
| 28 |
| |
We issue securities under the Global Medium Term Notes program. Our balance of securities issued abroad was R$9.4 billion as of December 31, 2020 and R$10.1 billion as of December 31, 2019. This change occurred mainly due to the non-substitution of certain debt instruments that reached their maturity.
(iv) Debt Instruments Eligible to Compose Tier 1 and Tier 2 Capital
We issue U.S. dollar-denominated Notes that constitute Level 1 and Level 2 regulatory capital as part of our plan to optimize our capital structure. As of December 31, 2020, the balance of Tier 1 and Level 2 debt instruments was R$13.1 billion, compared to R$10.2 billion as of December 31, 2019. This variation occurred due to the exchange rate differences resulting from the devaluation of the Real against the U.S. dollar in 2020 compared to 2019.
(v) Subordinated Debt
As of December 31, 2020, we had no subordinated debts.
e. Sources of financing for working capital and for investments in non-current assets that it intends to use to cover liquidity deficiencies
Due to our stable and diversified sources of funds, which include a large deposit base of its customers as detailed in the above 10.1.d item, we have historically had no liquidity issues.
As part of our liquidity risk management, we have a formal plan with measures to be taken in scenarios of systemic liquidity crisis and/or arising from possible risk of our corporate image. This liquidity contingency plan contains parameters of attention, in addition to preventive measures and actions to be triggered in times of liquidity deficiency, if the reserves fall below certain parameters.
As sources of financing for working capital and for investments in non-current assets used to cover liquidity shortties, the following resources may be used: (i) deposit capture; (ii) bond issues; (iii) transactions committed with public/private securities; (iv) transfer pricing review; (v) the establishment of more restrictive credit policies; and (vi) release of guarantee margin at B3 S.A. – Brasil Bolsa, Balcão.
f. levels of indebtedness and the characteristics of such debts, describing also :
(i) Relevant loan and financing agreements
There are no loan agreements or other debt instruments that our management deems relevant to us, with the exception of the debt-representing securities of our issue described in Section 18 of the Reference Form.
| 29 |
| |
(ii) Other long-term relationships with financial institutions
Our primary resource sources are local deposits in the modalities demand, savings and long-term, aligned with other Brazilian banks, as well as fundraising in the open market – own securities and Federal Government securities with buy back commitment ("repurchase agreements").
We also have deposits in credit institutions related to export and import financing lines taken from banks abroad and intended for application in commercial foreign exchange operations related to export and import financing. We are also party to long-term obligations via transfers, all in accordance with the operational policies of the BNDES system.
| (ii.1) | Eurobonds and Securitization Notes - MT100 |
External issues of securities denominated in foreign currency include securities and other securities (Eurobonds and Structured Notes). The following table shows the detailed composition of Eurobonds:
| Issuance | Maturity | Currency | 2020 | 2019 | 2018 | ||
| Eurobonds | 2017 | 2019 | USD | LIBOR 3M | - | - | 194 |
| Eurobonds | 2017 | 2021 | BRL | 4.40% | 14 | 63 | 855 |
| Eurobonds | 2017 | 2024 | USD | 2.4% to 10.0% | 854 | 665 | 19 |
| Eurobonds | 2018 | 2019 | USD | Zero Coupon to 9% | 0 | 0 | 197 |
| Eurobonds | 2018 | 2019 | USD | LIBOR 3M + 0.95% | 0 | 0 | 35 |
| Eurobonds | 2018 | 2020 | USD | Up to 3.5% | 0 | 37 | 1,211 |
| Eurobonds | 2018 | 2019 | USD | LIBOR 1M + 1.5% | 0 | 0 | 1,288 |
| Eurobonds | 2017 | 2020 | BRL | 4,40% | 0 | 929 | 639 |
| Eurobonds | 2018 | 2020 | USD | Above 3.5% | 0 | 35 | 0 |
| Eurobonds | 2018 | 2024 | USD | 6.6% to 6.7% | 1,625 | 1,260 | 0 |
| Eurobonds | 2018 | 2025 | USD | Up to 9% | 1,720 | 1,428 | 0 |
| Eurobonds | 2019 | 2020 | USD | 0% to 4.4% | 0 | 3,557 | 0 |
| Eurobonds | 2019 | 2027 | USD | CDI + 6.4% | 1,280 | 727 | 0 |
| Eurobonds | 2020 | 2021 | USD | CDI + 1.9% | 170 | 0 | 0 |
| Eurobonds | 2020 | 2021 | USD | 0% to 4% | 3,252 | 0 | 0 |
| Eurobonds | 2020 | 2022 | USD | 0% to 4% | 17 | 0 | 0 |
| Eurobonds | 2020 | 2022 | USD | CDI + 1.9% | 122 | 0 | 0 |
| Eurobonds | 2020 | 2023 | SUD | 0% to 8% | 23 | 0 | 0 |
| Eurobonds | 2020 | 2023 | USD | CDI + 1.9% | 223 | 0 | 0 |
| Eurobonds | 2020 | 2024 | USD | CDI + 1.9% | 98 | 0 | 0 |
| Others | 0 | 14 | 78 | ||||
| Total | 9,399 | 8,715 | 4,517 |
| (ii.2) | Subordinated debts |
We use subordinated debt instruments in its borrowing structure, represented by securities issued in the lines of the Central Bank standards, which are used as Reference Equity - Level 2, for the calculation of operational limits, including Subordinated CDBs, deposit certificates issued by us on the local market, in various issues, at interest rates updated by the CDI or the IPCA. The following table shows the detailed composition of subordinated debts:
| 30 |
| |
| In thousands of Reais | Issuance | Maturity (1) | Value (in millions) | Interest Rate | 2020 | 2019 | 2018 |
| Subordinate DS | May/08 | May/15 to May/18 | R$ 283 | CDI (2) | - | - | - |
| Subordinate DS | May/08 to Jun/08 | May/15 to Jun/18 | R$ 268 | IPCA (3) | - | - | - |
| Tier I (4) | Jan/14 | Without term (Perpetual) | R$ 3,000 | 7,375% | - | - | 4,907 |
| Tier II (4) | Jan/14 | Jan/24 | R$ 3,000 | 6,000% | - | - | 4,979 |
| Total | - | - | 9,886 |
| (1) | Subordinated time deposits issued by Banco Santander S.A. with yield paid at the end of the term together with the principal. |
| (2) | Indexed by 100% and 112% of the CDI. |
| (3) | Indexed by the IPCA (extended consumer price index) plus interest of 8.3% p.a. to 8.4% p.a. |
| (4) | On December 18, 2018, the Bank issued an approval for the repurchase of the Notes issued on January 29, 2014, which resulted in the reclassification of these instruments from the Series of Eligible Debt Instruments to Subordinated Debt Capital. |
(iii) Level of subordination between the debts
In case of our judicial or extrajudicial settlement there is a preference order regarding the payment of the various creditors of the mass provided for by law, which must be respected in accordance with the Brazilian legislation in force at the time. Specifically, with regard to the financial debts that make up our debt, the following payment order should be observed: debts guaranteed by real guarantee, chiropractic debts and subordinated debts. It is worth saying that, in relation to debts with real guarantee, creditors prefer the others up to the limit of the asset given in guarantee and, as it rises, they will have their claims included in the order of payment of the quirography creditors. Among the chiropractic creditors there is no degree of subordination, as well as there is no degree of subordination between the various subordinated creditors.
(iv) any restrictions imposed on the Company, particularly in relation to limits of indebtedness and contracting of new debts, to distribution of dividends, to sale of assets, to issuance of new securities and to the sale of equity control, and whether the Company has been respecting such restrictions
Regarding securities issued abroad, the descriptions of operations and programs described in session 18.10 of the Reference Form ("Securitization Program" and "Medium Term Notes – MTN"), the main restrictions imposed on the issuer, existing in financing agreements, are also described in the same item, more specifically in sessions 18.10.I.h.(v) and 18.10.II.h.(v).
g. limits of loans taken out and percentages already used
The information requested in this item does not apply to financial institutions. However, the Company is subject to the parameters determined by monetary authorities, in accordance with the Basel principles.
| 31 |
| |
h. significant alterations in each item of the financial statements
| (i) | Assets and Liabilities (in millions Reais): |
| Assets | 2020 | 2019 | Var. 2020x2019 | 2018 | Var. 2019x2018 |
| Cash and Balances With The Brazilian Central Bank | 20,149 | 20,127 | 0.1% | 19,464 | -3.41% |
| Financial Assets Held For Trading | 0 | 0 | 0.0% | 0 | -100.0% |
| Financial Assets Measured At Fair Value Through Profit Or Loss | 60,900 | 32,342 | 88.3% | 43,712 | -26.0% |
| Financial Assets Measured At Fair Value Through Profit Or Loss Held For Trading | 98,467 | 57,021 | 72.7% | 68,852 | -17.2% |
| Non-Trading Financial Assets Mandatorily Measured At Fair Value Through Profit Or Loss | 500 | 171 | 192.4% | 917 | -81.4% |
| Other Financial Assets At Fair Value Through Profit Or Loss | 0 | 0 | 0.0% | 0 | -100.0% |
| Available-For-Sale Financial Assets | 0 | 0 | 0.0% | 0 | -100.0% |
| Financial Assets Measured At Fair Value Through Other Comprehensive Income | 109,740 | 96,120 | 14.2% | 85,437 | 12.5% |
| Held to Maturity Investments | 0 | 0 | 0.0% | 0 | -100.0% |
| Loans and Receivables | 0 | 0 | 0.0% | 0 | -100.0% |
| Financial Assets Measured At Amortized Cost | 554,925 | 474,681 | 16.9% | 429,731 | 10.4% |
| Hedging Derivatives | 743 | 340 | 118.5% | 344 | -1.2% |
| Non-Current Assets Held For Sale | 1,093 | 1,325 | -17.5% | 1,380 | -3.9% |
| Investments in Associates and Joint Ventures | 1,095 | 1,071 | 2.2% | 1,053 | 1.7% |
| Tax Assets | 41,064 | 33,599 | 22.2% | 31,566 | 6.4% |
| Other Assets | 7,222 | 5,062 | 42.7% | 4,800 | 5.4% |
| Tangible Assets | 9,537 | 9,782 | -2.5% | 6,589 | 48.4% |
| Intangible Assets | 30,766 | 30,596 | 0.5% | 30,020 | 1.9% |
| Total Assets | 936,201 | 762,237 | 22.8% | 723,865 | 5.3% |
| Liabilities and Stockholders' Equity | 2020 | 2019 | Var. 2020x2019 | 2018 | Var. 2019x2018 |
| Financial Liabilities Held For Trading | 77,643 | 0 | 100.0% | 0 | 0.0% |
| Financial Liabilities Measured At Fair Value Through Profit Or Loss Held For Trading | - | 46,065 | -100.0% | 50,939 | -9.5% |
| Financial Liabilities Measured At Fair Value Through Profit Or Loss | 7,038 | 5,319 | 32.0% | 1,946 | 173.3% |
| Financial Liabilities at Amortized Cost | 707,289 | 575,230 | 23.0% | 547,295 | 5.1% |
| Hedging Derivatives | 145 | 201 | -27.9% | 224 | -10.3% |
| Provisions | 13,815 | 16,332 | -15.4% | 14,696 | 11.1% |
| Tax Liabilities | 10,130 | 10,960 | -7.6% | 8,075 | 35.7% |
| Other Liabilities | 14,051 | 10,921 | 28.7% | 9,095 | 20.1% |
| Total Liabilities | 830,111 | 665,028 | 24.8% | 632,270 | 5.2% |
| Stockholders' Equity | 106,205 | 96,736 | 9.8% | 91,944 | 5.2% |
| Other Comprehensive Income | -428 | -86 | 397.7% | -879 | -90.2% |
| Stockholders' Equity Attributable to the Parent | 105,777 | 96,650 | 9.4% | 91,065 | 6.1% |
| Total Stockholders' Equity | 106,090 | 97,209 | 9.1% | 91,595 | 6.1% |
| Total Liabilities and Stockholders' Equity | 936,201 | 762,237 | 22.8% | 723,865 | 5.3% |
| 32 |
| |
The following are the main changes in balance sheet accounts for the years 2020, 2019 and 2018.
Our total assets reached $936,201 millions as of December31, 2020, a growth of 22,8% compared to 2019, whose total assets reached R$762. 237 million, 5,3% higher than the year ended December 31, 2018, in the amount of R$723,865 million.
The portfolio of loans and advances to gross clients, without guarantees and guarantees, totaled R$417,822 as of December 31, 2020, an increase of 20.3% compared to R$347,257 million as of December 31, 2019, an increase of 7.9% compared to R$321,933 million as of December 31, 2018. The Individual segment showed an evolution of 11.6% compared to 2019, followed by an increase of 15.3% in the segment of consumer financing.
Consolidated shareholders' equity totaled R$105,777 million as of December 31, 2020, R$96,650 million as of December 31, 2019 and R$91,065 million as of December 31, 2018, up 9.4% as of December 31, 2020 compared to 2019 and an increase of 6.1% as of December 31, 2019 compared to 2018. The evolution of shareholders' equity in the year is mainly due to revenue growth, net income for the period in the amount of R$13,451 million and reduced by the highlight of Dividends and Interest on Equity in the amount of R$3,837 million.
| 33 |
| |
10.2. Directors should comment:
a. Results of the Company's operations:
Results of Operations for years ended December 31,2020,2019 and 2018
The following table provides an overview of the main central aspects of our operating results in the financial years ended in December 31, 2020, 2019 and 2018
| Executive Summary - Santander Brasil Results | |
Total Revenues totaled R$48,242 million in 2020, a reduction of 17.9% compared to the year ended December 31, 2019, mainly due to the impact of the COVID-19 pandemic on the Brazilian economy. Excluding the effects of overseas investment hedging, which had a major impact in 2020 due to exchange rate variation, our total revenue would be$61.825 million in the year, an increase of 3.0% over the same period a year earlier. For more information, see "Item 3. Key Information — A. Selected Financial Data — Reconciliation of Non-GAAP Measures and Indices With IFRS Most Directly Comparable Financial Measures."
Consolidated Profit for 2020 totaled R$13,451 million for the year ended December 31, 2020, down19.1%from the year ended December 31, 2019, as a result of an increase in net interest income, net fees and commissions and reduced losses on gains/losses on financial assets and liabilities (net) and exchange rate variations (net). | The Client Loan Portfolio totaled R$418 billion in December 20, an increase of 20.3%compared to December 31, 2019, mainly due to an increase in loans to individuals and the consumer financing portfolio.
Credit Quality remains at reasonable levels and supports our growth. The ratio of non-recoverable assets to credit risk was5.0% for the year ended December 31,2020, down 0.1 p.p. from the previous year. The Coverage Index was 110.6% for the year ended December 31, 2020, down from 14.0 p.p. to 96. The Basel Capital Adequacy Ratio was 15.3% for the year ended 31 December 2020, a reduction of 0.3% compared to the year ended 31 December 2019.
The Deposits of the Central Bank of Brazil and the deposits of credit institutions plus deposits of customers increased 32,5%, to$578 billion in 2020. |
| 34 |
| |
Results of Operations
The following table presents our consolidated operating results for the years ended December 31, 2020, 2019 and 2018:
| For the year ended December 31, | ||||||
| 2020 | 2019 | 2018 | Var % | Var % | ||
| 2020/2019 | 2019/2018 | |||||
| (in millions of R$, except percentages) | ||||||
| Net interest income | 44,443 | 44,321 | 41,921 | 0.3 | 5.7 | |
| Income from equity instruments | 34 | 19 | 33 | 78.9 | (42.0) | |
| Income from companies accounted for by the equity method | 112 | 149 | 66 | (24.8) | 126.6 | |
| Net fee and commission income | 16,229 | 15,713 | 14,132 | 3.3 | 11.2 | |
| Gains/losses on financial assets and liabilities (net) and exchange differences (net) | (11,703) | (326) | (5,589) | 3,489.9 | (94.2) | |
| Other operating income (expenses) | (873) | (1,108) | (1,056) | (21.3) | 4.9 | |
| Total income | 48,242 | 58,769 | 49,507 | (17.9) | 18.7 | |
| Administrative expenses | (17,115) | (16,942) | (16,792) | 1.0 | 0.9 | |
| Depreciation and amortization | (2,579) | (2,392) | (1,740) | 7.8 | 37.5 | |
| Provisions (net) | (1,657) | (3,682) | (2,000) | (55.0) | 84.1 | |
| Impairment losses on financial assets (net) | (17,450) | (13,370) | (12,713) | 30.5 | 5.2 | |
| Impairment losses on other assets (net) | (85) | (131) | (508) | (35.1) | (74.1) | |
| Other nonfinancial gain (losses) | 308 | 20 | 156 | 1,440.0 | (86.9) | |
| Operating profit before tax | 9,664 | 22,273 | 15,910 | (56.6) | 40.0 | |
| Income tax | (3,787) | (5,642) | (3,110) | (167.1) | 81.4 | |
| Consolidated profit for the year | 13,451 | 16,631 | 12,800 | (19.1) | 29.9 | |
Our consolidated profit for the year ended December 31, 2020 was R$13,451 million, a reduction of R$3,180 million, or 19.1%, compared to our consolidated profit of R$16,631 million for the year ended December 31, 2019 as a result of an increase of R$ 4,080 in losses due to a reduction in the recoverable value in financial assets (net) mainly due to the covid-19 global pandemic that resulted in an additional provision of R$ 3,200 million for potential loan losses. This was partially offset by the growth of the credit chain.
Our consolidated profit for the year ended December 31, 2019 was R$16,631 million, an increase of R$3,832 million, or 29.9%, compared to our consolidated profit of R$12,800 million for the year ended December 31, 2018 as a result of:
| 35 |
| |
| (i) | an increase of R$2,400 million in net interest income, mainly due to the growth of our loan portfolio driven by our commercial banking segment; |
| (ii) | increase of R$1,581 million in net fees and commissions, mainly as a result of an increase of R$722 million in credit and debit card revenues, an increase of R$417 million in revenues from sales of insurance and securities premiums, an increase of R$295 million in revenues from the capital market and an increase of R$138 million in current account service revenues. These increases were explained by the expansion of our customer base, greater linkage, and greater transactionality. |
Net interest income
Net interest income for the year ended December 31, 2020 was R$44,443 million, an increase of 0.3% or R$122 million compared to R$44,321 million for the year ended December 31, 2019. This increase was mainly explained by a 20.3% increase in the volume of our credit portfolio, a 12% increase in the number of linked customers.
The total average profitable assets in 2020 were R$750.1 billion, an increase of 14.5% or R$94.9 billion compared to R$655.2 billion in 2019. The main carrying factors were an increase of R$61.2 billion, or 18.9%, in the average of loans and amounts owed by credit institutions, an increase of R$24.8 billion in the average of debt instruments. Net income (net interest income divided by average profitable assets) was 5.9% in 2020, compared to 6.8% in 2019, a reduction of 0.8 p.p.
The average total of onerous liabilities in 2020 was R$572.0 billion, an increase of 6.5% or R$80.8 billion, compared to R$491.2 billion in 2019. The main boosts of this growth were an increase of R$109.4 billion in client deposits, given the shift in investors' assets toward more stable instruments.
Finally, the income spread (the difference between the gross income of profitable companies and the average cost of onerous liabilities) was 5.2% in 2020, mainly due to the lower participation of our Commercial Banking segment in our total results and the effect of reducing the SELIC interest rate from 4.5% in 2019 to 2.0% in 2020.
Net interest income for the year ended December 31, 2019 was R$44,321 million, an increase of 5.7% or R$2,400 million, compared to R$41,921 million for the year ended December 31, 2018. This increase was primarily due to a 7.9% increase in the volume of our credit portfolio, driven by individuals and consumer credit.
Profitable assets in 2019 were R$ 655.2 billion, an increase of 7.8% or R$ 47.1 billion $ 608.0 billionin2018. The main factors were an increase of R$ 45.9 billion, or 81.8%, in the average loans and amounts payable. For credit institutions, an increase of R$ 18.5 billion in average loans and advances to customers and R$ 14.7 billion in the average of debt instruments, partially offset by the reduction of R$ 32.3 billion in the average availability of the Central Bank of Brazil.
| 36 |
| |
The average total onerous liabilities in 2019 were R$ 491.2 billion, an increase of 6.0% or R$ 27.8 billion of R$ 463.4 billion in 2018. The main factors for this growth were an increase of R$ 18.0 billion in customer deposits, an increase of R$ 5.3 billion in deposits from the Central Bank of Brazil and deposits from credit institutions and an increase of R$ 4.7 billion in debt securities.
Finally, the income spread (difference between the gross income of profitable assets and the cost of onerous liabilities) was 5.3% in 2019 versus 5.4% in 2018, mainly due to an increase in the cost of financing, associated with the overall reduction of the SELIC rate from 6.5% in 2018 to 4.5% in 2019.
Income from Equity Instruments
Profit on equity instruments for the year ended December 31, 2020 totaled R$34 million, an increase of R$15 million compared to R$19 million for the year ended December 31, 2019, mainly due to Santander Fundo de Investimento Amazonas Multimercado Crédito Privado Investimento no Exterior increased dividend gains resulting from gains in stock positions for hedge of derivatives.
Profit from equity instruments in 2019 totaled R$19 million, a reduction of R$14 million compared to R$33 million in the year ended December 31, 2018, mainly due to lower dividends received from Santander Investimento Fundo Guarujá Multimercado Crédito Privado Investimento Abroad.
Equity Income
Equity income for the year ended December 31, 2020 was R$112 million, a reduction of R$37 million compared to R$149 million for the year ended December 31, 2019, mainly due to a reduction of R$33 million in the results of Banco RCI Brasil S.A. operations and a reduction of R$8 million in the operating results of the Gestora de Inteligência de Crédito, both jointly controlled. These improved results were partially offset by an increase of R$10 million in the results of Tecban (Tecnologia Bancária S.A.), a jointly controlled company.
Equity income for the year ended December 31, 2019 was R$149 million, an increase of R$84 million compared to R$66 million for the year ended December 31, 2018. This increase was mainly due to the increase of R$ 59 million in the results of the operations of Banco RCI Brasil S.A., jointly controlled, to the increase of R$ 19 million in the results of the operations of Tecnologia Bancária SA, jointly controlled and an increase of R$ 12 million in the results of the operations of Webmotors SA, a joint control company. This was partially offset by a reduction of R$ 5 million in the results of the operations of The Credit Intelligence Manager, a company controlled in conjunction with and a reduction of R$ 2 million in the results of Santander Auto S.A. operations.
| 37 |
| |
Revenues from net fees and commissions
Net commission and rate revenues for the year ended December 31, 2020 reached R$16,229 million, an increase of 3.3% or R$515 million compared to R$15,713 million for the year ended December 31, 2019. This increase was mainly due to the increase in (i) trade financing, (ii) insurance and capitalization and (iii) credit and debit cards.
Net commission and rate revenues for the year ended December 31, 2019 reached R$15,713 million, an increase of 11.2% or R$1,581 million compared to R$14,132 million for the year ended December 31,2018. This increase was mainly due to the increase of R$722 million in credit and debit card revenues, R$417 million in revenues from the sale of insurance and securities premiums, R$295 million in capital market revenues and R$138 million in current account service revenues.
Net credit and debit card fees and commissions totaled R$5,151 million for the year ended December 31, 2020, an increase of 3.3% over the year ended December 31, 2019. This increase was mainly due to a recovery in transaction volumes in the second half of 2020, despite the reduction in volume during the first half of 2020.
Net credit and debit card fees and commissions totaled R$4.986 million for the year ended December 31, 2019, an increase of 16.9% over the year ended December 31, 2018. This increase was the result of a higher turnover of R$236.4 billion in the fiscal year ended December 31,2019 compared to R$201.6 billion in the fiscal year ended December 31, 2018.
Net fees and commissions on insurance and securities premiums totaled R$3,831 million for the year ended December 31, 2020, an increase of 6.8% over the year ended December 31, 2019, mainly due to life insurance associated with the good evolution of the portfolio.
Net fees and commissions on insurance and securities premiums totaled R$3,586 million in the financial year ended December 31, 2019, an increase of 13.1% over the year ended December 31, 2018, mainly due to life insurance associated with the good evolution of the portfolio.
Revenues from fees and commissions charged in connection with the capital market totaled R$858 million for the year ended December 31, 2020, a reduction of 29.1% compared to the year ended 2019.
Revenues from fees and commissions charged in connection with the capital market totaled R$1,211 million for the year ended December 31, 2019, an increase of 32.2% over the year ended 2018, mainly due to an increase of R$263 million in subscription and bond placement revenues and an increase of R$32 million in administration and custody revenues.
| 38 |
| |
Net fees and commissions for current account services totaled R$3,716 million for the year ended December 31, 2020, a reduction of 8.3% compared to the year ended 2019.
Current account service fees and commissions totaled R$4,051 million for the year ended December 31, 2019, an increase of 3.5% over the year ended 2018, driven by the expansion of our active account holders due to increased customer engagement.
The following table reflects the composition of net rate and commission revenues for the years ended December 31, 2020, 2019 and 2018:
| For the year ended December 31 | ||||||
| 2020 | 2019 | 2018 | Var % 2020/2019 | Var % 2019/2018 | ||
| (in millions of R$. except percentages) | ||||||
| Current account services | 3,716 | 4,051 | 3,913 | (8.3) | 3.5 | |
| Collection and payment services | 1,459 | 1,313 | 1,291 | 11.1 | 1.7 | |
| Insurance and capitalization | 3,831 | 3,586 | 3,169 | 6.8 | 13.2 | |
| Asset Management and pension funds | 1,114 | 1,434 | 1,289 | (22.3) | 11.2 | |
| Credit and debit cards | 5,151 | 4,986 | 4,264 | 3.3 | 16.9 | |
| Capital markets | 858 | 1,211 | 916 | (29.2) | 32.2 | |
| Trade finance | 1,740 | 1,317 | 1,228 | 32.1 | 7.2 | |
| Tax on services | (678) | (622) | (671) | 8.9 | (7.3) | |
| Others | (964) | (1,562) | (1,266) | (38.2) | 23.4 | |
| Total | 16,229 | 15,713 | 14,133 | 3.3 | 11.2 | |
"Gains/losses on financial assets and liabilities (net) and exchange variations (net)"
Gains/losses on financial assets and liabilities (net) and exchange rate differences (net) for the year ended December 31, 2020 were losses of R$11,703 million, an increase of R$11,377 million in losses of R$326 million for the year ended December 31, 2019. This variation is mainly due to gains of R$9,732 million related to financial assets measured at fair value through trading results and losses of R$21,912 million related to exchange variations (net). Excluding hedge results on the effect of investments abroad, gains/losses on financial assets and liabilities (net) and foreign exchange (net) differences were gains of R$1,880 million for the year ended December 31, 2020, an increase of R$942 million from earnings of R$938 million for the year ended December 31, 2019 mainly due to positive results in our derivatives position. Gains/losses on financial assets and liabilities (net) and exchange rate differences (net), excluding the effects of overseas hedging investment, is a non-GAAP measure. For more information, see "Item 3. Key Information — A. Selected financial data - Reconciliation of non-GAAP measures and indices with your most directly comparable IFRS financial measures. ".
Gains/losses on financial assets and liabilities (net) and exchange rate differences (net) for the year ended December 31, 2019 were losses of R$326 million, a decrease of R$5,263 million in losses of R$5,589 million for the year ended December 31, 2018. This variation is mainly due to gains of R$5,156 million related to the measurement of financial assets measured at fair value through income and gains of R$17.9 million related to exchange rate differences (net). Excluding the effect of hedge investments abroad, "Gains/losses on financial assets and liabilities (net) and exchange rate changes (net)" were gains of R$938 million for the year ended December 31, 2019, an increase of R$660 million in gains of R$278 million compared to the year ended December 31, 2018 mainly due to positive results in our derivative positions. "Gains/losses on financial assets and liabilities (net) and exchange rate changes (net)" excluding the effects of overseas hedging investment are a non-GAAP measure. For more information, see "Item 3. Key Information — A. Selected Financial Data — Reconciliation of Non-GAAP Measures and Indices With IFRS Most Directly Comparable Financial Measures."
| 39 |
| |
The following table shows our gains/losses on financial assets and liabilities (net) and exchange rate differences (net) in the periods indicated.
| For the year ended December 31 | ||||||
| 2020 | 2019 | 2018 | Var % 2020/2019 | Var % 2019/2018 | ||
| (in millions of R$, except percentages) | ||||||
| Gains/losses on financial assets and liabilities (net) and exchange differences (net) | (11,703) | (326) | (5,589) | 3,489.9 | (94.2) | |
| Effects of the hedge for investment held abroad | 13,583 | 1,264 | 5,867 | 974.6 | (78.5) | |
| Gains/losses on financial assets and liabilities (net) and exchange differences (net) excluding Hedge Impact(1) | 1,880 | 938 | 278 | 100.4 | 237.7 | |
(1) Gains/losses on financial assets and liabilities (net) and exchange rate differences (net) excluding the effects of overseas hedging investment are a non-GAAP measure. For more information, see "Item 3. Key Information — A. Selected Financial Data — Reconciliation of Non-GAAP Measures and Indices With IFRS Most Directly Comparable Financial Measures."
Other Operating Income/Expenses
Other operating income/expenses for the year ended December 31, 2020 were R$873 million, a reduction of R$236 million compared to expenses of R$1,108 million for the year ended December 31, 2019, mainly due to the lower result of our FGB pension plan and higher expenses with the FGC (Credit Guarantee Fund) due to the increase in the balance of deposits. For the year ended December 31, 2019, other operating income/expenses were expenses of R$ 1,108 million, compared to expenses of R$ 1,056 million for the year ended December 31, 2018.
Administrative Expenses
Administrative expenses for the year ended December 31, 2020 were R$17,115 million, an increase of R$173 million compared to expenses of R$16,942 million for the year ended December 31, 2019, mainly due to higher spending on technology and systems. For the year ended December 31, 2019, our administrative expenses of R$16,942 million reflected an increase of R$149 million compared to administrative expenses of R$16,792 million for the year ended December 31, 2018. The performance in both periods is mainly attributed to the increase of: (i) personnel expenses, aligned with our meritocratic culture and the performance of our business; and (ii) line of data processing expenses in order to support the increase in the volume of transactions with our customers.
| 40 |
| |
Personnel expenses reduced by R$457 million in the year ended December 31, 2020, as a result of the reduction in the line of benefits and lower salaries and salaries. In the year ended December 31, 2019, our personnel expenses increased by R$122 million compared to the same period in 2018. This performance can be attributed to the increase in the line of benefits and higher salaries.
The following table presents our personnel expenses for each of the periods indicated:
| For the year ended December31. | ||||||
| 2020 | 2011 | 2018 | Change % 2020/2019 | Change % 2019/2018 | ||
| (in millions of R$. except percentages) | ||||||
| Wages and salaries | 5,730 | 5,876 | 5,813 | (2.5) | 1.1 | |
| Social security costs | 1,222 | 1,277 | 1,405 | (4.3) | (9.1) | |
| Benefits | 1,390 | 1,492 | 1,387 | (6.8) | 7.5 | |
| Training | 49 | 66 | 63 | (25.8) | 4.8 | |
| Other personnel expenses | 480 | 617 | 538 | (22.2) | 14.7 | |
| Total | 8,871 | 9,328 | 9,206 | (4.9) | 1.3 | |
Other administrative expenses increased R$629 million to R$8,244 million in the year ended December 31, 2020, from R$7,614 million in the year ended December 31, 2019, mainly due to an increase of R$296 million in technology and systems, and an increase of R$176 million in communications.
Other administrative expenses increased R$28 million to R$7,614 million in the year ended December 31, 2019, from R$7,586 million in the year ended December 31, 2018, mainly due to an increase of R$272 million in technology and systems, an increase of R$91 million in advertising, an increase of R$83 million in specialized and technical services , both expenses arising from more intense commercial actions in our business, partially offset by a reduction of R$ 582 million with real estate, facilities and materials, as a result of the adoption of IFRS 16.
The following table presents our other administrative expenses for each of the periods indicated:
| 41 |
| |
| For the year ended December 31, | ||||||
| 2020 | 2019 | 2018 | Change % 2020/2019 | Change % 2019/2018 | ||
| (in millions of R$, except percentages) | ||||||
| Specialized and technical services | 2,171 | 2,173 | 2,090 | 4.0 | 4.0 | |
| General maintenance expenses | 744 | 748 | 1,331 | (43.8) | (43.8) | |
| Technology maintenance expenses | 2,355 | 2,059 | 1,786 | 15.3 | 15.3 | |
| Advertising | 654 | 713 | 622 | 14.6 | 14.6 | |
| Communications | 649 | 473 | 457 | 3.5 | 3.5 | |
| Per diems and travel expenses | 70 | 140 | 127 | 10.2 | 10.2 | |
| Taxes other than income tax | 280 | 112 | 89 | 25.9 | 25.9 | |
Surveillance and cash courier services | 595 | 631 | 617 | 2.3 | 2.3 | |
| Insurance premiums | 17 | 35 | 29 | 20.7 | 20.7 | |
| Other administrative expenses (1) | 709 | 531 | 437 | 21.5 | 21.5 | |
| Total | 8,244 | 7,614 | 7,586 | 0.4 | 0.4 | |
(1) As of December 31, 2020, includes data processing expenses in the balance of R$176.1 million (2019 - R$2.4 million and 2018 - R$67.7 million), Service Expenses in the balance of R$27.7 million (2019 - revenue from R$2.2 million and 2018 - R$26.8 million), Expenses with Benefit Guarantee Fund - FGB R$8.5 million (2019 - R$53.5 million and 2018 - R$35.0 million) , Interest On Equity R$0 (2019 - R$0 million and 2018 - R$38.0 million) and Recovery of Charges and Expenses of R$212.8 million (2019 - R$97.4 million and 2018 - R$92.4 million).
The efficiency ratio, calculated as total administrative expenses divided by Total Revenues, increased to 35.5% in the year ended December 31, 2020, compared to 28.8% in the year ended December 31, 2019. This increase of 6.7 p.p. in the index is mainly due to the effects of investment hedge carried out abroad. In the year ended December 31, 2018, the efficiency index was 33.9%. Our adjusted efficiency index, which excludes the effect of overseas investment hedging (see "—Hedging on Foreign Investments" and "Selected Financial Data - Selected Consolidated Indices, Including Non-GAAP Indices"), was 27.7%, 28.2% and 30.3% in 2020, 2019 and 2018, respectively
Depreciation and Amortization
Depreciation and amortization for the year ended December 31, 2020 was R$2,579 million, an increase of R$187 million compared to R$2,392 million for the year ended December 31, 2019, mainly due to higher depreciation expenses for hardware and software items, results of investments made in this period. In the year ended December 31, 2019, depreciation and amortization totaled R$2,392 million, an increase of R$652 million compared to R$1,740 million for the year ended December 31, 2018, to the change in accounting practices resulting from the adoption of IFRS 16 following the principles of IAS 17. For more information, see "Item 1 Introduction, basis for the presentation of consolidated financial statements and other information, c.1) Adoption of new standards and interpretations of our consolidated financial statements" included in "item 18. Financial Statements" of this annual report.
| 42 |
| |
Provisions (Net)
Provisions mainly include provisions for tax, civil and especially labor causes. The provisions (net) totaled R$1,657 million for the year ended December 31, 2020, a reduction of R$2,025 million compared to R$3,682 million for the year ended December 31, 2019, mainly due to an above-normal level of provisions in 2019, as explained below.
For the year ended December 31, 2019, the provisions (net) totaled R$3,682 million for the year ended December 31, 2019, an increase of R$1,682 million compared to R$2,000 million in the year ended December 31, 2018, mainly due to an increase of R$700 million related to the creation of an efficiency and productivity fund , increase in civil and labor proceedings due to the revision of the operational model and constitution of provisions related to the judicial process initiated by the Association of Retired Employees of the Bank of the State of São Paulo, or AFABESP, an association of former employees of Banespa in which the classification of the chance of loss was revised to probable in December 2019 (for more information, see observation 23 of our audited consolidated financial statements included in "Item 18. Financial Statements" of this annual report).
Impairment Losses on Financial Assets (Net)
Impairment losses on financial assets (net) for the year ended December 31, 2020 were R$17,450 million, an increase of R$4,080 million compared to R$13,370 million for the year ended December 31, 2019. This increase was mainly due to the global pandemic COVID-19 which resulted in an additional provision of R$ 3,200 million for doubtful accounts and the recurring growth of the credit portfolio.
For the year ended December 31, 2019, R$13,370 million increased by R$657 million compared to R$12,713 million for the year ended December 31, 2018. This increase was mainly due to loans to benefits for individuals, due to the recurrent growth of the credit portfolio in this segment.
Our credit risk exposure portfolio increased by R$74.5 billion to R$466.1 billion as of December 31, 2020 compared to R$391.6 billion as of December 31, 2019. In addition, our deteriorated assets decreased from R$ 0.2 billion to R$ 23.4 billion as of December 31, 2019 to R$ 23.2 billion in the year ended December 31, 2020. The default rate decreased by 10 basis points in 2020 compared to 2019.
The following table shows the proportion of our non-recoverable assets in relation to total credit risk exposure and our hedging rate as of December 31, 2020 and December 31, 2019 and 2018.
| 43 |
| |
| From December 31, | |||||
| 2020 | 2019 | 2018 | Var % 2020/2019 | Var % 2019/2018 | |
| (in millions of R$, except percentages) | |||||
| Loans and advances to customers, gross | 417,819 | 347,257 | 321,933 | 20.3 | 7.9 |
| Impaired assets | 23,176 | 23,426 | 22,426 | (1.1) | 4.5 |
| Provisions for impairment losses | 25,640 | 22,625 | 22,969 | 13.3 | (1.5) |
| Credit risk exposure Non-GAAP – customers (1) | 466,104 | 391,569 | 364,194 | 19.0 | 7.5 |
| Ratios | |||||
| Impaired assets to credit risk exposure | 5.0% | 6.0% | 6.2% | (1.0) | (0.2) |
| Coverage ratio (2) | 110.6% | 96.6% | 102.4% | 14.0 | (5.7) |
| Impairment losses | (17,451) | (13,370) | (12,713) | 30.5 | 5.2 |
| Gains (losses) due to derecognition of financial assets measured at amortized cost (3) | - | - | - | - | - |
| Impairment losses on financial assets (net) (4) | (17,451) | (13,370) | (12,713) | 30.5 | 5.2 |
| ________________________________ |
(1) Exposure to credit risk is a non-GAAP financial measure. Exposure to credit risk is the sum of amortized cost amounts of loans and advances to customers (including non-recoverable assets) in the amount of R$466.115 million and guarantees and documentary credits in the amount of R$48.282 billion. We present off-balance sheet information to better demonstrate our total managed credit risk.
(2) Provisions for losses due to reduction to recoverable value as a percentage of assets with reduction to recoverable value.
(3) It corresponds to the record of permanent losses in the realizable value of securities and values classified as "Securities available for sale", currently recorded as "Gains in financial assets (net)".
(4) As of December 31, 2020, 2019 and 2018, our total losses due to reduction to the recoverable value of financial instruments included R$1,577 million, R$2,055 million and R$2,714 million, respectively, related to debt instruments.
The following chart shows our relationship between non-recoverable assets and credit risk from 2016 to 2020:
| 44 |
| |
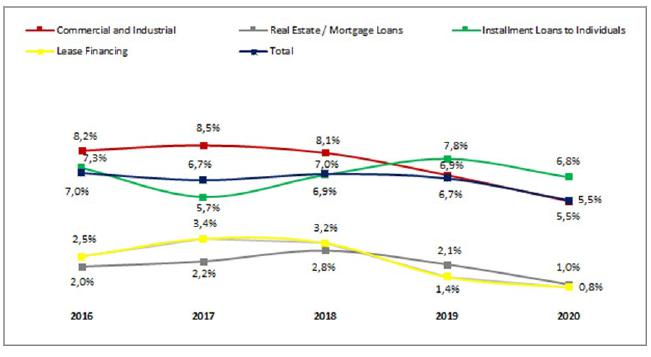
Impaired Assets by Type of Loan
The following table shows our non-recoverable assets by loan type as of December 31, 2020, 2019, and 2018.
| For the year ended December 31, | ||||||
| 2020 | 2019 | 2018 | Var % 2020/2019 | Var % 2019/2018 | ||
| (in millions of R$, except percentages) | ||||||
| Commercial and industrial | 10,558 | 10,073 | 11,832 | 4.8 | (14.9) | |
| Real estate – construction | 456 | 827 | 1,035 | (44.8) | (20.1) | |
| Installment loans to individuals | 12,144 | 12,497 | 9,499 | (2.8) | 31.6 | |
| Lease financing | 17 | 29 | 59 | (40.6) | (50.8) | |
| Total | 23,176 | 23,426 | 22,426 | (1.1) | 4.5 | |
Commercial and Industrial
Non-recoverable assets in the commercial and industrial loan portfolio totaled R$10,558 million as of December 31, 2020, an increase of R$485 million, or 4.8%, compared to R$10,073 million as of December 31, 2019. This increase was mainly due to the collective valuation of R$ 1,660 million carried out by Santander Brasil, which was based on the sensitivity of macroeconomic projections that indicate internship transfers through deterioration of the portfolio.
| 45 |
| |
Non-recoverable assets in the commercial and industrial loan portfolio totaled R$10,073 million as of December 31, 2019, a reduction of R$1,759 million, or 14.9%, compared to R$11,832 million as of December 31, 2018. The reduction of non-recoverable assets in this portfolio was the result of the measures adopted by Santander Brasil to manage them, including collection practices in relation to our borrowers, through which we offer certain clients the opportunity to negotiate a restructuring of their debts or disposal of assets.
Real estate
Non-recoverable assets in the real estate loan portfolio totaled R$456 million as of December 31, 2020, a reduction of R$371million, or 44.8%, compared to R$827 million at December 31, 2019. The reduction in assets deteriorated in this portfolio was the result of the measures that Santander Brasil implemented to manage it, including collection practices in relation to our customers.
Non-recoverable assets in the real estate loan portfolio totaled R$827 million as of December 31, 2019, a reduction of R$209 million, or 20.2%, compared to R$1,036 million as of December 31, 2018. The fall occurred mainly due to changes in monetary policy that led to a reduction in interest rates in the real estate portfolio in Brazil.
Installment Loans to Individuals
Assets with reduction in the recoverable value of term loans for individuals totaled R$12.144 million as of December 31, 2020, with a reduction of R$353 million, or 2.8%, compared to 2019. The reduction of assets in this portfolio was the result of the measures that Santander Brasil implemented to manage it, including collection practices with relation to our borrowers, through which we offer certain customers the option of negotiating a restructuring of their debts, especially during the COVID-19 Pandemic or disposal of assets.
Non-recoverable assets in the portfolio of loans to individuals totaled R$12,497 million as of December 31, 2019, with an increase of R$2,998 million, or 31.6%, compared to 2018. This increase was a consequence of the recurrent growth of the portfolio and the weak macroeconomic conditions related to the portfolio in Brazil, such as unemployment rate and degree of income impairment. For more information, see "Item 4. Company Information - B. Business Overview - Selected Statistical Information — Assets — Non-Recoverable Assets — Methodology for Loss to Recoverable Value." .
Financial Lease
Non-recoverable assets in the loan and lease financing portfolio totaled R$17 million as of December 31, 2020, a reduction of R$12million and m compared to December 31, 2019. This decrease in non-recoverable assets occurred mainly due to defaults of certain borrowers, as a result of weak macroeconomic conditions in Brazil
| 46 |
| |
Non-recoverable assets in the loan portfolio and lease financing totaled R$29 million as of December 31, 2019, a reduction of R$30 million compared to December 31, 2018.
Impairment Losses on Other Assets (Net)
Losses due to a reduction in the recoverable value of assets (net) for the year ended December 31, 2020 totaled losses of R$85 million, a reduction of R$46 million compared to the year ended December 31, 2019, mainly due to the less loss due to reduction in the reparable value of intangible assets during the year. For the year ended December 31, 2019, losses due to reduction to the recoverable value of other assets (net) totaled losses of R$131 million, a reduction of R$377 million compared to the year ended December 31, 2018, mainly due to the loss by reduction in the recoverable value of assets in the acquisition and development of software that was recorded due to the obsolescence and interruption function of these systems in 2018that did not occur in 2019.
Other Non-Financial Gains/Losses
Other non-financial gains/losses were earnings of R$308 million for the year ended December 31, 2020, a positive change of R$288 million in earnings of R$20 million for the year ended December 31, 2019, mainly due to the r$169 million gain in the sale of Superdigital in the first quarter of 2020.
During the year ended December 31, 2019, other non-financial gains/losses were earnings of R$20 million for the year ended December 31, 2019, a negative change of R$136 million in losses of R$156 million for the year ended December 31, 2018, mainly due to (i) an increase of R$104 million related to revenue stemming from the reversal of the provision for reduction in the recoverable value of real estate and R$78 million related to the sale of assets received in the recovery of credits with customers that occurred in 2018 and not occurred in 2019.
Operating Profit before Tax
Operating profit before taxes for the year ended December 31, 2020 was R$9,664 million, a reduction of R$12,609 million, or 56.6%, compared to R$22,273 million for the year ended December 31, 2019. In the year ended December 31, 2018, operating profit before taxes for the year was R$15,910 million.
Excluding the effects of investment hedge realized abroad, operating income before taxation totaled R$23,247 million for the year ended December 31, 2020, a decrease of 1.2% compared to R$23,537 million compared to the year ended December 31, 2019. For the year ended December 31, 2018, operating profit before taxes was R$21,777 million. The Operating Income of Taxation, excluding the effects of hedging on investments held abroad, is a non-GAAP measure. For more information, see "Item 3. Key Information — A. Selected Financial Data — Reconciliation of Non-GAAP Measures and Indices With IFRS Most Directly Comparable Financial Measures."
| 47 |
| |
The table below shows our operating profit before tax and our operating profit before taxes, excluding the effects of hedging for investments held abroad in the markets presented.
| For the year ended December 31, | |||||
| 2020 | 2019 | 2018 | Var % 2020/2019 | Var % 2019/2018 | ||
| (in millions of R$, except percentages) | ||||||
| Operating Profit Before Tax | 9,664 | 22,273 | 15,910 | (56.6) | 40.0 | |
| Effects of the hedge for investment held abroad | 13,583 | 1,264 | 5,867 | 974.6 | (78.5) | |
| Adjusted operating profit before tax (1) | 23,247 | 23,537 | 21,777 | (1.2) | 8.1 | |
(1) Adjusted operating income is a non-GAAP measure. For more information, see "Item 3. Key Information — A. Selected Financial Data — Reconciliation of Non-GAAP Measures and Indices With IFRS Most Directly Comparable Financial Measures."
Income Taxes
Income tax expense includes income tax, social contribution, PIS and COFINS. Income tax totaled expenses of R$3,787 million for the year ended December 31, 2020, an increase of R$9,429 million over expenses of R$5,642 million for the year ended December 31, 2019. This increase was mainly attributable to the following events:(i) foreign exchange losses of R$13,583 million as a result of the effects of exchange variations on foreign investments and losses on hedge instruments, affecting the line "Gains (losses) in financial assets and liabilities (net)"; (ii) reduction of operating profit before taxation resulting from the results of the entities' operations and (iii) recognition of certain deferred tax credits in December 2020. For more information, see note 23 of our audited consolidated financial statements included in this annual report.
In the year ended December 31, 2019, income tax totaled expenses of R$5,642 million for the year ended December 31, 2019, an increase of R$2,532 million in relation to expenses of R$3,110 million for the year ended December 31, 2018. This increase was mainly attributable to the following events: (i) foreign exchange losses of R$1,512 million as a result of the effects of exchange variations on foreign investments and losses in hedging instruments, affecting the line "Gains (losses) in financial assets and liabilities (net)"; (ii) increase in operating profit before taxation resulting from the results of the entities' operations and (iii) recognition of certain deferred tax credits in December 2019 as a result of the adjustment of CSLL tax credits derived from the increase in the tax rate to 20% for banks (constitutional amendment No. 103/2019). For more information, see note 24 of our audited consolidated financial statements included in this annual report.
The following table shows our income tax and income tax excluding the effects of hedging for investments held abroad for the periods indicated.
| 48 |
| |
| For the year ended December 31, | ||||||
| 2020 | 2019 | 2018 | Var % 2020/2019 | Var % 2019/2018 | ||
| (in millions of R$, except percentages) | ||||||
| Income taxes | 3,787 | (5,642) | (3,110) | (167.1) | 81.4 | |
| Effects of the hedge for investment held abroad | (13,583) | (1,264) | (5,867) | 974.6 | (78.5) | |
| Income taxes excluding effects of the hedge for investment held abroad | (9,796) | (6,906) | (8,977) | 41.9 | (23.1) | |
* Income tax excluding the effects of investment hedge carried out abroad, is a non-GAAP measure. For more information, see "Item 3. Key Information — A. Selected Financial Data — Reconciliation of Non-GAAP Measures and Indices With IFRS Most Directly Comparable Financial Measures."
Results of Operations by Segment of the Years Ended December31, 2020, 2019 and 2018
The following tables show our operating results for the years ended December 31, 2020, 2019 and 2018 for each of our operating segments.
Commercial Banking
| For the year ended December 31, | ||||||
| 2020 | 2019 | 2018 | Var % 2020/2019 | Var % 2019/2018 | ||
| (in millions of R$, except percentages) | ||||||
| Net interest income | 41,457 | 42,044 | 39,391 | (1.4) | 6.7 | |
| Income from equity instruments | 5 | 4 | 5 | 10 | (25.6) | |
| Income from companies accounted for by the equity method | 150 | 84 | 150 | 66 | (43.8) | |
| Net fee and commission income | 13,923 | 14,404 | 13,923 | 12,537 | 3.5 | |
Gains/losses on financial assets and liabilities (net) and exchange differences (net) | (1,541) | (13,515) | (1,541) | (6,752) | 777.0 | |
| Other operating income (expenses) | (1,069) | (767) | (1,069) | (966) | (28.3) | |
| Total income | 41,667 | 53,511 | 44,286 | (22.1) | 20.8 | |
| Personnel expenses | (8,140) | (8,554) | (8,404) | (4.8) | 1.8 | |
| Other administrative expenses | (7,635) | (7,140) | (7,186) | 6.9 | (0.6) | |
| Depreciation and amortization | (2,489) | (2,297) | (1,637) | 8.4 | 40.3 | |
| Provisions (net) | (1,639) | (3,669) | (1,948) | (55.3) | 88.3 | |
| Impairment losses on financial assets (net) | (13,423) | (17,379) | (13,423) | (12,420) | 29.5 | |
| Impairment losses on non-financial assets (net) | (73) | (28) | (73) | (450) | (61.2) | |
| Other nonfinancial gain (losses) | 20 | 309 | 20 | 156 | 1.404.1 | |
| Operating profit before tax | 4,666 | 18,375 | 12,397 | (74.6) | 48.2 | |
| 49 |
| |
| For the year ended December 31, |
2020 |
2019 |
2018 | Var % 2020/2019 | Var % 2019/2018 | ||
| (in millions of R$, except percentages) | ||||||
| Operating Profit Before Tax | 4,666 | 18,375 | 12,397 | 48.2 | 48.2 | |
| Effects of the hedge for investment held abroad | 13,583 | 1,264 | 5,867 | (78.5) | (78.5) | |
| Adjusted Operating Profit Before tax | 18,249 | 19,639 | 18,264 | 7.5 | 7.5 | |
2020 and 2019
Operating profit before taxes attributed to the Commercial Bank segment for the year ended December 31, 2020 was R$4.7 billion, a reduction of R$13.7 billion, from R$18.4 billion for the year ended December 31, 2019. This variation was mainly due to:
• an increase of R$ 3,956 million in losses due to reduction in recoverable value in financial assets mainly due to the global pandemic of COVID 19 which resulted in an additional provision of R$ 3,200 million for potential loan losses and recurring growth in the credit portfolio.
• a reduction of R$587 million in net interest income for the year ended December 31, 2020, compared to the year ended December 31, 2019, mainly attributed to the impact of spread pressure and the effect of the mix as a result of the economic effects of the COVID-19 Pandemic.
This variation was partially offset by an increase of R$481 million in net revenue from fees and commissions for the year ended December 31, 2020, compared to the year ended December 31, 2019, mainly due to (i) an increase in revenue from the sale of insurance and capitalization; and (ii) the increase in trade finance revenues; and (iii) the increase in credit and debit card revenues.
Excluding the hedging effects of investments held abroad on our revenues, our operating profit before taxes would have been $18.2 billion, 7.1% lower than in the fiscal year ended December 31, 2019.
| 50 |
| |
2019 and 2018
Operating profit before tax attributed to the Commercial Banking segment for the year ended December 31, 2019 was R$18.4 billion, a 48.2% or R$6.0 billion increase from R$12.4 billion for the year ended December 31, 2018. This variation was mainly due to:
• an increase of R$2,653 million in net interest income for the year ended December 31, 2019, compared to the year ended December 31, 2018 mainly due to an 15.0% increase in the volume of our credit.
• an increase of R$1,386 million in net fee and commission income for the year ended December 31, 2019, compared to the year ended December 31, 2018, mainly due to (i) an increase in revenues from credit and debit cards, (ii) an increase in revenues from sale of insurance and premium bonds, and (iii) an increase in revenues from current account service; and.
• a decrease of R$377 million in impairment losses on other assets (net) mainly due to impairment loss of assets in the acquisition and development of software that was recorded due to obsolescence function and disruption of these systems in 2018 that did not occur in 2019.
Global Wholesale Banking
| For the year ended December 31, | |||||
| 2020 | 2019 | 2018 | Var % 2020/2019 | Var % 2019/2018 | |
| (in millions of R$, except percentages) | |||||
| Net interest income | 41,457 | 42,044 | 39,391 | (1.4) | 6.7 |
| Income from equity instruments | 5 | 4 | 5 | 10 | (25.6) |
| Net fee and commission income | 150 | 84 | 150 | 66 | (43.8) |
| Gains/losses on financial assets and liabilities (net) and exchange differences (net) | 13,923 | 14,404 | 13,923 | 12,537 | 3.5 |
| Other operating income (expenses) | (1,541) | (13,515) | (1,541) | (6.752) | 777.0 |
| Total income | (1,069) | (767) | (1,069) | (966) | (28.3) |
| Administrative expenses | 41,667 | 53,511 | 44,286 | (22.1) | 20.8 |
| Personnel expenses | (8,140) | (8,554) | (8,404) | (4.8) | 1.8 |
| Other administrative expenses | (7,635) | (7,140) | (7,186) | 6.9 | (0.6) |
| Depreciation and amortization | (2,489) | (2,297) | (1,637) | 8.4 | 40.3 |
| Provisions (net) | (1,639) | (3,669) | (1,948) | (55.3) | 88.3 |
| Impairment losses on financial assets (net) | (13,423) | (17,379) | (13,423) | (12,420) | 29.5 |
| Impairment losses on non-financial assets (net) | (73) | (28) | (73) | (450) | (61.2) |
| Operating profit before tax | 20 | 309 | 20 | 156 | 1,404.1 |
| Net interest income | 4,666 | 18,375 | 12,397 | (74.6) | 48.2 |
2020 and 2019
Pre-tax profit attributable to the Global Wholesale Banking segment for the year ended December 31, 2020 was R$5.0 billion, an increase of 28.2% or R$1,100 million compared to R$3.9 billion for the year ended December 31, 2019.
| 51 |
| |
This variation was mainly due to:
| · | R$708 million in net interest income, representing a 31% change over 2019, mainly due to the increase in the credit portfolio due to the economic effects of the COVID-19 pandemic. |
| · | Gain from financial assets and liabilities and exchange variations of R$597 million due to positive gains from the expansion of market operations with derivatives and mainly gains in the portfolio of securities indexed to the IPCA. |
This variation was partially offset by an increase of R$125 million in losses due to reduction in recoverable value in financial assets due to an increase in coverage for potential loan losses
2019 and 2018
Profit before tax attributed to the Global Wholesale Banking segment for the year ended December 31, 2019 was R$3.9 billion, a 11.0%, or R$385 million increase compared to December 31, 2018.
This variation was mainly due to:
| · | a decrease of R$347 million in impairment losses on financial assets (net) principally owing to our preventive management. |
| · | an increase of R$195 million in net fee and commission income manly due to an increase in revenues from securities underwriting and placement and an increase in revenues from administration and custody. |
These results were partially offset by:
| · | a decrease of R$253 million in net interest income mainly lower volume in the corporate portfolio. |
10.3. Occurred and expected events with material effects on the financial statements:
a. introduction or disposal of operating segment
No introduction or disposal of any operating segment was carried out over the last three (3) fiscal years.
b. constitution, acquisition or disposal of equity interest
· Sale of equity stake in Super Pagamentos e Administração de Meios Eletrônicos S.A.
On February 28, 2020, we sold our entire equity interest in Super Pagamentos e Administração de Meios Eletrônicos S.A., or “Superdigital”, to Superdigital Holding Company, S.L., a company indirectly controlled by Santander Spain, for the amount of R$270 million as consideration. As a result of such transaction, we are no longer a shareholder of Superdigital.
| 52 |
| |
· Put option of the remaining equity interest in Banco Olé Consignado S.A. against Aymoré Crédito, Financiamento
On March 14, 2019, the minority shareholder of Banco Olé Bonsucesso Consignado S.A. ("Banco Olé") formalized his interest in exercising the put option right provided in the Investment Agreement, concluded on July 30, 2014, for the disposal of his 40% stake in the capital of Olé Consignado for us.
On December 20, 2019, the parties concluded a binding agreement for the acquisition by us of all shares issued by Bosan Participações S.A. (holding company whose sole assets are shares representing 40% of Banco Olé's share capital), for the total amount of R$1.6 billion, to be paid on the closing date of the transaction.
On January 31, 2020, the Company and the shareholders of Bosan Participações S.A. concluded the final agreement and signed the purchase and sale agreement of 100% of the shares issued by Bosan, through the transfer of Bosan shares to us and the payment to the customers in the total amount of R$ 1,608,772,783.47. As a result, we have become, directly and indirectly, holders of 100% of Banco Olé's shares.
· Merger of Banco Olé Consignado S.A. in Banco Santander (Brasil) S.A.
Following the acquisition of the remaining equity interest over Banco Olé Consignado S.A., through the holding company Bosan Participações S.A. (together referred to as “Olé Companies”), the shareholders of Santander Brasil and the Olé Companies approved the merger of Olé Companies into Santander Brasil, as provide by the general meetings held on August 31, 2020. As a result, the Olé Companies ceased to exist and were succeeded by Santander Brazil. The incorporation of the Olé Companies is under the process of ratification by the Brazilian Central Bank.
· Establishment of the Credit Intelligence Bureau
On January 20, 2016, we entered into a non-binding memorandum of understanding with Banco Bradesco S.A., Banco do Brasil S.A., Caixa Econômica Federal and Itaú Unibanco S.A., for the creation of a Credit Intelligence Bureau (Gestora de Inteligência de Crédito S.A., or “CIB”). The CIB was structured as a corporation and each of Santander Brasil, Banco Bradesco S.A., Banco do Brasil S.A., Caixa Econômica Federal and Itaú Unibanco S.A. has a 20% equity interest in the corporation.
The purpose of the CIB is to develop a database that, in compliance with the applicable law, will collect, reconcile and process the credit information of registered individuals and legal entities who expressly authorize the inclusion of their credit information on such database. On April 14, 2017, the definitive documents were executed by CIB’s shareholders. The necessary regulatory authorizations, including those issued by the Brazilian Central Bank and by CADE, have already been granted. The CIB became fully operational in 2019.
| 53 |
| |
· Incorporation of split portion of Integry Tecnologia e Serviços A.H.U Ltda.
On October 31, 2019, the partial spin-off operation of Integry Tecnologia e Serviços AHU Ltda was added. ("Integry"), a wholly owned subsidiary of Getnet Acquiring and Services for Means of Payment S.A. ("Getnet"), with a version of the portion split from its assets, relating to its assets and liabilities, to Getnet.
On December 20, 2019, Getnet and Santander Merchant Platform Solutions, S.L. ("SMPS Global"), a company based in Spain and controlled by Banco Santander, S.A. (Santander Spain), concluded a Contract for the Purchase and Sale of the shares representing Integry's entire share capital, so that SMPS Global now held 100% of Integry's share capital. On December 23, 2019, Integry changed its name to Santander Merchant Platform Tecnológicas Brasil Ltda.
· Acquisition of Return Capital Serviços e Recuperação de Crédito S.A.
On October 16, 2017, Santander Brasil, through its wholly-owned Atual Serviços de Recuperação de Créditos e Meios Digitais S.A. ("Atual"), acquired a direct ownership interest in Return Capital Serviços e Recuperação de Crédito S.A. ("Return Capital"), and an indirect shareholding interest in Return Gestão de Recursos S.A. ("Return Asset") corresponding to 70% of the share capital of Return Capital and Return Asset (both "Return Companies").
On October 16, 2019, Atual informed the other shareholders of Return Companies of its decision to exercise its call option to acquire the shares representing the remaining 30% of the return companies' capital, in the amount of approximately R$ 17 million.
On November 1, 2019, Atual and Return Capital's minority shareholders signed Share Purchase Agreement and Other Covenants of Return Capital, in which Atual acquired all the shares of the minority shareholders, corresponding to 30% of the capital of return companies, so that Atual now directly and indirectly owns 100% of the shares representing the share capital of Return Companies.
Return Companies operate in the credit recovery intelligence sector, providing services such as credit portfolio valuation and pricing, collection, management and recovery of unpaid loans.
· Acquisition of Residual equity stake in Getnet
On December 19, 2018, the minority shareholders of Getnet Adquirência e Serviços para Meios de Pagamentos S.A., or “Getnet,” exercised their right to sell all of their shares to Santander Brasil, or the “Put Option”, pursuant to the Shares’ Purchase and Sale Agreement and Other Covenants executed between the parties on April 4, 2014, or “SPA”. On the exercise date of the Put Option, we entered into a binding amendment to the SPA, to acquire all of the Getnet shares owned by minority shareholders, corresponding to 11.5% of the entity’s equity interest, in the amount of R$1.431 billion. The acquisition transaction was approved by the Brazilian Central Bank on February 18, 2019 and the transaction closed on February 25, 2019. As a result, Santander Brasil currently owns 100% of Getnet’s issued and outstanding share capital.
| 54 |
| |
· Proposal to Spin Off Getnet
On February 25, 2021, further to the Material Facts disclosed on November 16, 2020 and February 2, 2021, we announced that our Board of Directors approved a separation from our merchant payment business, which is undertaken by our subsidiary, Getnet, in order to concentrate the technology and payments businesses of Santander Group within PagoNxt, a new technology-focused global payment platform. Following the potential spin-off of our equity interest held in Getnet, or the “Spin-Off,” which will be resolved upon by our shareholders in an extraordinary shareholders’ meeting, our shareholders would become direct shareholders in Getnet on a pro rata basis. Accordingly, our shareholders immediately prior to the Spin-Off would hold a percentage of equity interest in Getnet in the same proportion as they held in Santander Brasil prior to the Spin-Off. After the approval of the Spin-off by our extraordinary shareholders’ meeting, our shares and units will be traded with the right to receive the shares and units issued by Getnet until the record date, which, once determined, will be disclosed to the market by means of a Notice to Shareholders.
· Transfer of control of Banco Olé Bonsucesso Consignado S.A. and Super Pagamentos e Administração de Meios Eletrônicos S.A.
On October 23, 2019, Aymoré Crédito, Financiamento e Investimento S.A. had its share capital reduced, without the cancellation of shares, through the transfer of the common shares representing its equity interest held in Banco Olé Bonsucesso Consignado S.A. ("Banco Olé") and Super Pagamentos e Administração de Meios Eletrônicos S.A. ("Super") to us. On December 23, 2019, the necessary conditions for completion of the operation were fulfilled, such as: (i) approval of the Central Bank of Brazil; and (ii) termination of the term of opposition of creditors, pursuant to Article 174 of Law No. 6,404/76, so that Banco Olé and Super became directly controlled by us.
· Acquisition of Summer Empreendimentos Ltda.
On May 14, 2019, we and our wholly owned subsidiary, Santander Holding Imobiliária S.A. ("SHI") signed a binding document with the members of Summer Empreendimentos Ltda. ("Summer") establishing the terms of the purchase and sale of the shares representing summer's entire share capital. The acquisition was approved by BACEN on September 16, 2019 and completed on September 20, 2019, so SHI now owns 99.999% and we 0.001% of summer's share capital shares. Due to an initial plan to sell Summer in the short term, we had initially registered the investment as Non-Current Assets Held for sale, for its cost value. In June 2020, with the non-execution of the plan established, Summer became part of the scope of Banco Santander's Consolidated Financial Statements.
| 55 |
| |
· Constitution of Esfera Fidelidade S.A.
On August 14, 2018, we constituted Esfera Fidelidade S.A., with a stake wholly owned by us. Esfera Fidelidade S.A. operates in the development and management of customer loyalty programs. The company began operations in November 2018.
· Investment in Loop Gestão de Pátios S.A.
On 26 June 2018, Webmotors S.A., a company with a 70% stake indirectly owned by us, has signed an investment agreement with Allpark Empreendimentos, Participações e Serviços S.A. and Celta LA Participações S.A., in order to acquire an equity interest corresponding to 51% of the share capital of Loop Gestão de Pátios S.A. ("Loop"), through capital increase and issuance of new Loop shares to be fully subscribed and paid by Webmotors S.A. Loop operates in the segment of commercialization and physical and virtual auction of motor vehicles. On September 25, 2018, the transaction was completed with the realization of the capital increase in the amount of R$23,900 through the issuance of shares representing 51% of the equity interest in Loop, which were fully subscribed and paid by Webmotors S.A.
· Constitution of BEN Benefícios e Serviços S.A.
On June 11, 2018, we constituted BEN Benefícios e Serviços S.A. ("Ben"), with a stake wholly owned by us to act in the supply and administration of food stamps, food stamps, transportation vouchers, cultural vouchers and the like, via printed issue or loaded on electronic or magnetic cards. Ben started operations in the second quarter of 2019.
· Joint Venture with Hyundai Capital Services, Inc.
On April 28, 2016, Aymoré Crédito, Financiamento e Investimento S.A. ("Aymoré") concluded with Hyundai Capital Services, Inc. ("Hyundai Capital") the documents necessary for the constitution of Banco Hyundai Capital Brasil S.A. and an insurance broker with the objective of offering car financing and financial services and insurance brokerage to Hyundai consumers and dealerships in Brazil.
o Banco Hyundai Capital Brasil S.A.
On April 11, 2018, the parties constituted, with a 50% stake in Aymoré and 50% of Hyundai Capital, the non-operating company BHJV Assessoria e Consultoria em Gestão Empresarial Ltda. On May 8, 2018, Aymoré and Hyundai Capital decided to transform BHJV Assessoria e Consultoria em Gestão Empresarial Ltda. non-operating corporation called Banco Hyundai Capital Brasil S.A. ("Banco Hyundai"). On December 13, 2018, the constitution of Hyundai Bank was completed.
| 56 |
| |
On February 21, 2019, the authorization granted by BACEN for the operation of Banco Hyundai was published in the Official Gazette. Hyundai Bank began operations in April 2019.
o Hyundai Corretora de Seguros Ltda.
On April 30, 2019, BACEN authorized us to have an indirect stake in a company to be incorporated under the name Hyundai Corretora de Seguros Ltda. ("Hyundai Broker"). Hyundai Corretora was incorporated on July 22, 2019. On September 10, 2019, Hyundai Corretora obtained the company's registration as an insurance broker with SUSEP. Hyundai Corretora started operations in November 2019.
· Creation of PI Distribuidora de Títulos e Valores Mobiliários S.A.
On May 3, 2018, Santander Finance Arrendamento Mercantil S.A., a subsidiary indirectly controlled by us, was converted into a securities distributor and had its registered name changed to SI Distribuidora de Títulos e Valores Mobiliários S.A. The conversion process was approved by BACEN on November 21, 2018. On December 17, 2018, SI Distribuidora de Títulos e Valores Mobiliários S.A. had its name changed to PI Distribuidora de Títulos e Valores Mobiliários S.A., and the process of changing the company name approved by BACEN on January 22, 2019. The company began operations on March 14, 2019.
· Acquisition of direct equity interest in Toque Fale Serviços de Telemarketing LTDA.
On March 24, 2020, the acquisition by the Bank of the representative shares of the entire share capital of Toque Fale Serviços de Telemarketing LTDA ("Toque Fale") was carried out for the amount of R$ 1,099,854.72, corresponding to the equity value of the shares as of February 29, 2020, previously owned by Getnet Acquiring and Services for Means of Payment S.A. and Auttar HUT Data Processing LTDA. As a result, the Bank became a direct shareholder of Toque Fale and holds 100% of its capital.
· Reduction of the Share Capital of Norchem Holding e Negócios S.A. and Norchem Participações e Consultoria S.A.
On October 8, 2020, the shareholders of Norchem Holding e Negócios S.A. and Norchem Participações e Consultoria S.A. (together, "Norchem Companies") approved the capital reduction of the two Norchem Companies, in the amounts of R$ 14,770,468.94 and R$ 19,950,000.00, respectively, so that, after the expiry of the creditors' opposition deadline, on December 8, 2020, Banco Santander withdrew from the shareholders' board of Norchem Companies.
· Purchase of Equity Interest over Toro Controle e Participações S.A.
On September 29, 2020 Santander Brasil’s subsidiary, PI DTVM, entered into an investment and other covenant agreement with the shareholders of Toro Controle e Participações S.A., or “Toro Controle” to invest in Toro Controle. Toro Controle, an investment platform, operating as a securities broker focused on the retail market was founded in Belo Horizonte in 2010. Toro Controle is the holding company of Toro Corretora de Títulos e Valores Mobiliários Ltda, or “Toro Corretora,” and Toro Investimentos S.A., or “Toro Investimentos.” We refer to Toro Controle, Toro Corretora and Toro Investimentos as “Toro,” Upon completion of the transaction, PI DTVM will hold 60% of Toro Controle’s share capital. The completion of the transaction is subject to the execution of certain customary agreements between the parties, the fulfillment of customary conditions precedent and the receipt of certain regulatory approvals, including the approval of the Brazilian Central Bank.
| 57 |
| |
· Purchase of Equity Interest in Gira – Gestão Integrada de Recebíveis do Agronegócio S.A.
On August 11, 2020, Santander Brasil executed a share purchase and sale agreement and other covenants with the shareholders of Gira (Gestão Integrada de Agronegócio S.A. or “Gira”) to acquire 80% of Gira’s share capital. Gira is a technology company that operates in the management of agribusiness receivables and whose platform has the potential to make agricultural credit transactions more secure. This increased layer of security is achieved through the use of applications, such as geolocation of productive areas, capture and analysis of agronomic data and permanent monitoring of production performance for sites involved in credit transactions. Gira’s solutions also include the review and digital registration of collateral provided under commercial contracts and continuous observation of crop development as a way of monitoring risks. The applicable regulatory approvals were received on December 18, 2020 and the closing of the transaction took place on January 8, 2021.
· Purchase of Equity Interest in Paytec Tecnologia em Pagamentos Ltda. and Paytec Logística e Armazém EIRELI
On December 8, 2020, Banco Santander concluded, together with the partners and holders of Paytec Tecnologia em Pagamentos Ltda. and Paytec Logística e Armazém Eireli (together "Paytec"), a contract for the purchase and sale of shares, transfer of ownership and other agreements, whereby, once the operation has been carried out, it will hold 100% of Paytec's share capital. Paytec acts as a logistics operator with national coverage and focused on the payments market. By complying with the conditions set out in the contract, in particular the applicable regulatory approvals, the parties formalized the definitive instruments on March 12, 2021. With the execution of the operation, Banco Santander now held 100% of Paytec's share capital.
· Sale of all stake held in CIBRASEC
On July 24, 2019, Banco Santander divested its entire stake in the share capital of CIBRASEC – Companhia Brasileira de Securitização, corresponding to 4,000 common shares and 50 preferred shares, to ISEC Securitizadora S.A. for the amount of R$ 9,845,611.54. Due to the closing of the transaction, Banco Santander ceased to be a shareholder of CIBRASEC.
| 58 |
| |
· Joint Venture with HDI Seguros
On December 20, 2017, we entered into binding agreements with HDI Seguros for the formation of a partnership through the creation of a new insurer called Santander Auto S.A., or "Santander Auto". Sancap Investimentos e Participações S.A., a company controlled by Santander Brasil, holds 50% of the share capital issued by Santander Auto, with the remaining 50% held by HDI Seguros. Santander Auto is focused on offering car insurance policies through a fully digital platform. The transaction was terminated on October 9, 2018, when the documentation for the formation of Santander Auto S.A. on January 11, 2019 was executed, Santander Auto received regulatory authorization to start operations by SUSEP and effectively began operations in October 2019.
· Dissolution and liquidation of Santander Brasil, Establecimiento Financiero de Credito, S.A.
On November 12, 2020, we approved the dissolution and liquidation of Santander Brasil, Establecimiento Financiero de Credito, S.A., a Spanish entity wholly owned by us, which we mainly use for the acquisition of funds in the banking and international capital market to provide credit lines to us that are extended to our clients for working capital and trade-related financing. The capital invested abroad was repatriated to Brazil in November 2020. The deed of dissolution and liquidation of the entity was registered in the Mercantile Registry of Madrid and effective on December 15, 2020. These activities are now carried out by our Luxembourg subsidiary.
· Acquisition of the companies Isban Brasil S.A. and Produban Serviços de Informática S.A.
On February 19 and 28, 2018, respectively, we bought all shares issued by Isban Brasil of Ingenería de Software Bancário, S.L., and all shares issued by Produban Serviços de Informática S.A. of Produban Servicios Informáticas Generales, S.L., for R$61,078,000 and R$42,731,000, respectively. Although all parts of these transactions are ultimately controlled by Santander Spain, the transactions were carried out on an equitable basis of values. On February 28, 2018, Isban Brasil was incorporated into Produban Serviços de Informática S.A. and, on the same date, Produban Serviços de Informática S.A. we changed its company reason for Santander Brasil Tecnologia S.A.
c. Unusual events or operations
Nothing to report.
| 59 |
| |
10.4. Officers’ comments on:
a. Significant changes in accounting practices
IFRS 16 - as of January 1, 2019, the Bank adopted IFRS 16, which replaces IAS 17.
I. Transition
As permitted by the specific transition provisions, Banco Santander has chosen to apply the rules in a modified retrospective manner, the effects of which were applied on January 1, 2019.
The changes in accounting practices resulting from the adoption of IFRS 16 have been applied to assets under right of use as part of tangible assets and lease liabilities as other liabilities in the balance sheet.
II. Lease Identification
In adopting IFRS 16, the Bank recognized lease liabilities involving leases that had already been classified as “commercial leases” in accordance with the principles of IAS 17 - Leases.
For the initial application of the standard, the Bank used the following practical procedures allowed:
• The exclusion of initial direct costs for measuring the right-of-use asset on the initial application date;
• It was decided not to separate the service provision component embedded in leasing contracts; and
• The Bank also decided not to apply IFRS 16 to contracts that were not identified as containing a lease under IAS 17 and IFRIC 4 - Determination of whether a Contract contains a Lease.
Additionally, the following recognition exemptions are also being used:
• Accounting for operating leases with a remaining term of less than 12 months on January 1, 2019 as short-term leases;
• Accounting for operating leases whose underlying asset is of low value;
• Until January 1, 2019, leases of fixed assets, in which the Bank, as a lessee, held substantially all the risks and benefits of ownership were classified as finance leases. The balances presented are immaterial.
The Bank leases various properties and equipment. Predominantly, the assets subject to the lease agreements are real estate deals referring to the agencies.
| 60 |
| |
Banco Santander does not have any rights of use assets that fall within the definition of investment properties.
III. Lease term
The lease agreements are formalized, analyzed and renegotiated individually and contain a wide range of different terms and conditions. The Bank assesses the term of the contract, as well as the intention to remain in the properties. Thus, the term estimates may vary according to the contractual conditions, considering extension options, and also according to legal provisions.
The Bank assumes that fines for contract termination collected before the due date do not make up a significant portion.
The lease agreements do not contain restrictive clauses, but the leased assets cannot be used as collateral for loans.
IV. Initial Measurement
In their initial registration, leases are recognized as a right-of-use asset and a corresponding liability on the date the leased asset becomes available for use by the Group.
The right to use the registered sis measured at its cost in return for the rental liabilities that represent the present value of the lease payments that are not made to date. Lease payments are discounted using the incremental interest rate on the tenant's loan. There is no onerous contract that required an adjustment to the usage rights to be registered as assets on the date of initial adoption.
Direct usage is measured at amortized cost according to the following:
| · | The value of the initial measurement of leasing liabilities; |
| · | Any lease payment made before or on the reduced start date of any incentive received; |
| · | Any directly assigned initial cost; And |
| · | Restoration costs, if IAS 37 requirements are met for the registration of Provisions, Contingent Liabilities and Contingent Assets. |
Grupo Santander uses as an incremental rate the interest rate that it would have to pay when borrowing the necessary resource to obtain the asset with a value similar to the asset under the lease, for term, guarantee and similar economic scenarios, represented in Santander Brasil, by the curve of funding cost (funding) of a free asset, applied individually to each contract according to the projected estimates for the lease term.
| 61 |
| |
Lease liabilities include the net present value of the following lease payments:
• Reduced fixed payments for any incentive;
• Variable payments that are based on a rate or index;
• Amounts expected to be paid by the lessee based on the residual value of guarantees;
• The exercise price of a call option, if the lessee is reasonably certain about the exercise of the option; and
• Penalty payments for terminating the lease if the term of the transaction reflects the exercise of the option by the lessee.
Below is the inflation projection (IGP-M) on the base date December 31, 2020:
| IGP-M Projection (annualized) | |
| Up to 3 months | 26.1% |
| From 3 to 12 months | 5.3% |
| From 1 year to 3 years | 4% |
| From 3 years to 5 years | 4% |
| More than 5 years | 4% |
V. Subsequent measurement
After the initial measurement, the values of the assets recorded as rights of use are being updated using the cost method, so any accumulated depreciation is deducted monthly, in accordance with the criteria of IAS 16/ CPC 27 - Property, Plant and Equipment in the depreciation of the right of use asset. use and corrected any remeasurement of the lease liability, when applicable.
The lease liability initially recorded is updated by monthly increasing the liability amount of the interest installment of each lease and reducing the amount of monthly lease payments and adjusted for any lease remeasurements, when applicable.
The lease liability is remeasured, in the event of changes in the lease term or the contract value, the amount resulting from the new determination of the lease liability is recorded against the corresponding asset in use right.
The rights of use are subject of impairment test.
The effects of adopting IFRS 16 have an impact exclusively on the operating segment - Banco Comercial.
• IFRIC 23 – Published in June 2017 by the IASB, IFRIC 23 - Uncertainty over Income Tax Treatments on Profit has mandatory application as of January 1, 2019 and aims to clarify procedures for the application of recognition and measurement requirements established in the IAS 12 of Taxes on Profit when there is uncertainty about the treatments to be adopted for the Taxes on Profit.
| 62 |
| |
The Bank carried out analyzes on the procedures already adopted for accounting and presentation of Income Taxes in relation to the content of IFRIC 23 and it was possible to conclude that there are no impacts on related measurements nor disclosures.
Definitions and classification of financial instruments
i. Definitions
“Financial instrument” is any contract that gives rise to a financial asset of one entity and, simultaneously, to a financial liability or financial interest of another entity.
“Equity instrument” is any agreement that evidences a residual interest in the asset of the issuing entity after deducting all of its liabilities.
“Financial derivative” is a financial instrument whose value changes in response to the change in an observable market variable (such as an interest rate, foreign exchange rate, financial instrument price, market index or credit rating), whose initial investment is zero or very small compared with other financial instruments with a similar response to changes in market factors, and which is settled at a future date.
“Hybrid financial instruments” are contracts that simultaneously include a non-derivative host contract together with a derivative, known as an embedded derivative, that is not separately transferable and has the effect to make part of the cash flow of the hybrid contract vary similar to a stand-alone derivative.
The following transactions are not treated as financial instruments for accounting purposes:
· Investments in subsidiaries, jointly controlled entities and associates (notes 3&11 of our Financial Statements).
· Rights and obligations due to employee benefit plans (note 21 c of our Financial Statements).
ii. Classification of financial assets for measurement purposes
Financial assets are initially classified into the various categories used for management and measurement purposes, unless they have to be presented as Non-current assets held for sale or they relate to Cash, cash balances at Central Banks and other deposits on demand, Changes in the fair value of hedged items in portfolio hedges of interest rate risk (asset side), Hedging derivatives and Investments, which are reported separately.
| 63 |
| |
Upon initial recognition of an equity instrument not held for trading, the Bank may irrevocably choose to present subsequent changes in fair value through Other Comprehensive Income. This option is made considering each investment individually and was not used by the Bank. In addition, upon initial recognition, the Bank may irrevocably designate at fair value through profit or loss a financial asset that would otherwise meet the measurement requirements at amortized cost or at fair value through Other Comprehensive Income, if such designation eliminate or substantially reduce an accounting mismatch that could exist. This option was not used by the Bank.
Financial assets are included for measurement purposes in one of the following categories:
• Financial Assets Measured At Fair Value Through Profit Or Loss Held For Trading: this category includes the financial assets acquired to generate short-term profit resulting from the fluctuation of its prices and financial derivatives not classified as hedging instruments, whose primary business model of the Bank is to trade them frequently.
• Financial Assets Measured At Fair Value Through Profit Or Loss: this category includes the financial assets that did not meet the pre-established criteria when evaluating the SPPI Test (Solely Payment of Principal and Interest).
• Non-Trading Financial Assets Mandatorily Measured At Fair Value Through Profit Or Loss: this category includes the financial assets that at the time of initial designation was made the fair value option.
• Financial Assets Measured At Fair Value Through Profit Or Loss: are stated at fair value. This category does not include debt instruments classified as “Held-to-maturity investments” or “Financial assets at fair value through profit or loss”, and equity instruments issued by entities other than subsidiaries, associates and jointly controlled entities, provided that such instruments have not been classified as “Financial assets held for trading” or as “Other financial assets at fair value through profit or loss”.
The results rising from changes in fair value are recognized at the Financial Assets Measured At Fair Value Through Other Comprehensive Income line in the Shareholders´ equity except for cumulative impairment losses which are recognized in statement of profit or loss. When the investment is sold or has evidences of decreases on the fair value due to impairment, the previously recognized result at the same Shareholders´ Equity line, mentioned above is reclassified to the statement of profit or loss.
| 64 |
| |
iii. Financial assets measured at amortized cost
this category includes financing granted to third parties, based on their nature, irrespective of the type of borrower and the form of financing, including finance lease transactions in which the consolidated entities act as lessors. The entities included in the consolidation have, in general, the intention of maintaining the loans and credits they grant until their final maturity, which, therefore, are presented in the consolidated balance sheet at amortized cost (which includes the necessary adjustments to reflect the estimated impairment losses).
• A financial asset is measured at amortized cost if it meets the following conditions and is not designated at fair value through profit or loss:
• The asset is maintained within a business model whose objective is to maintain assets in order to receive contractual cash flows;
• The contractual terms of the financial asset generate, on specific dates, cash flows that refer exclusively to payments of the principal and interest on the principal amount outstanding;
• A debt instrument is measured at fair value through Other Comprehensive Income if it meets the following conditions and is not designated at fair value through profit or loss;
• The asset is maintained within a business model whose objective is achieved by receiving contractual cash flows and by selling financial assets; and
• The contractual terms of the financial asset generate, on specific dates, cash flows that refer exclusively to payments of the principal and interest on the principal amount outstanding.
iv. Business model assessment
The Bank assesses the objective of a business model in which an asset is maintained at the portfolio level, as it better reflects how the business is managed and what information is provided to management. The information considered comprises:
- Policies and objectives defined for the portfolio and the application of these policies in practice. Including, if the Administration's strategy is focused on earning contractual interest income, maintaining a specific interest rate profile, aligning the duration of the assets;
- How the portfolio's performance is assessed and reported to the Bank's management;
- The risks that affect the performance of the business model (and the financial assets held within that business model) and how these risks are managed;
| 65 |
| |
- How the business managers are remunerated - for example, if the remuneration is based on the fair value of the managed assets or the contractual cash flows received;
- The frequency, volume and timing of sales in previous periods, the reasons for such sales and your expectations about future sales. However, information on sales activity is not considered in isolation, but as part of an overall assessment of the objective defined by the Bank to manage financial assets.
Financial assets held for trading or managed, whose performance is assessed based on fair value, are measured at fair value through profit or loss, as (i) they are not held to receive contractual cash flows (ii) nor are they held to receive flows contractual cash flow and sell financial assets.
v. Valuation to determine whether contractual cash flows refer exclusively to principal and interest payments
For the purposes of this assessment, “principal” is defined as the fair value of the financial asset upon initial recognition. “Interest” is defined as the consideration for the value of the currency over time and for the credit risk associated with the value of the principal outstanding during a specific period and for other basic risks and costs of loans (for example, liquidity risk and administrative costs), as well as the profit margin.
When assessing whether contractual cash flows refer exclusively to payments of principal and interest, the Bank considers the contractual terms of the instrument. This includes assessing whether the financial asset contains a contractual term that could change the term or value of the contractual cash flows in a way that would not meet this condition. When carrying out the assessment, the Bank considers:
- contingent events that would change the amount and timing of cash flows;
- leverage;
- advance payment terms and extension;
- terms that limit the Bank's right to cash flows from assets; and
- resources that modify the consideration of the currency value over time, for example, periodic adjustment of interest rates.
vi. Classification of financial liabilities for measurement purposes
Financial liabilities are classified for measurement purposes into one of the following categories:
• Financial Assets At Fair Value Through Profit Or Loss Held for Trading: this category includes financial liabilities incurred for the purpose of generating a profit in the near term from fluctuations in their prices, financial derivatives not designated as hedging instruments, and financial liabilities arising from the outright sale of financial assets acquired under reverse repurchase agreements ("reverse repos") or borrowed (short positions).
| 66 |
| |
• Financial Assets At Fair Value Through Profit Or Loss: financial liabilities are included in this category when they provide more relevant information, either because this eliminates or significantly reduces recognition or measurement inconsistencies (accounting mismatches) that would otherwise arise from measuring assets or liabilities or recognizing the gains or losses on them on different bases, or because a group of financial liabilities or financial assets and liabilities is managed and its performance is evaluated on a fair value basis, in accordance with a documented risk management or investment strategy, and information about the group is provided on that basis to the Group's key management personnel.
• Financial liabilities at amortized cost: financial liabilities, irrespective of their instrumentation and maturity, not included in any of the above-mentioned categories which arise from the ordinary borrowing activities carried on by financial institutions.
vii. Classification of financial liabilities for presentation purposes
Financial liabilities are classified by nature into the following items in the consolidated financial statements:
• Deposits from Bacen: deposits of any nature received from Bacen.
• Deposits from credit institutions: deposits of any nature, including credit received and money market operations in the name of credit institutions.
• Client deposits: includes deposits of any nature such as demand deposits, saving deposits and time deposits including money market operation received from client
• Marketable debt securities: includes the amount of bonds and other debt represented by marketable securities, other than subordinated liabilities.
• Trading derivatives: includes the fair value, with a negative balance for the Bank, of derivatives which do not form part of hedge accounting.
• Short positions: includes the amount of financial liabilities arising from the outright sale of financial assets purchased under reverse repurchase agreements or borrowed.
• Subordinated liabilities: amount of financing received which, for the purposes of payment priority, ranks behind ordinary debt. This category also includes the financial instruments issued by the Bank which, although equity for legal purposes, do not meet the requirements for classification as equity.
| 67 |
| |
• Other financial liabilities: includes the amount of payment obligations having the nature of financial liabilities not included in other items, and liabilities under financial guarantee contracts, unless they have been classified as non-performing.
• Hedging derivatives: includes the fair value of the Bank's liability in respect of derivatives, including embedded derivatives separated from hybrid financial instruments, designated as hedging instruments in hedge accounting.
• Debt Instruments Eligible to Compose Capital: financial instruments issued by other entities, such as shares, with the nature of equity instruments for the issuer, except investments in subsidiaries, jointly controlled entities or associates.
viii. Derecognition of Financial Liabilities
The Bank derecognizes a financial liability when its contractual obligations are terminated, canceled or when they expire.
ix. Compensation
Financial asset and liability balances are offset (i.e. reported in the consolidated balance sheets at their net amount) only if the Bank and their subsidiaries currently have a legally enforceable right to set off the recognized amounts and intend either to settle on a net basis, or to realize the asset and settle the liability simultaneously.
Offsetting Agreements and Obligations Settlement (CMN Resolution 3.263/2005) - The Bank has an agreement for the clearing and settlement of obligations under the National Financial System (SFN), signed with individuals and legal entities, whether or not members of the SFN, resulting in higher financial settlement guarantee, with the parties that have this modality of agreement. These agreements establish that payment obligations to Banco Santander arising from credit and derivative operations, in the event of default by the counterparty, will be offset against Banco Santander's payment obligations with the counterparty.
| i. | Measurement of financial assets |
Financial assets are measured at fair value, without deduction of estimated costs of transaction that may be incurred on their disposal, except for loans and receivables, held-to-maturity investments, equity instruments whose fair value cannot be determined in a sufficiently objective manner and financial derivatives that have as equity instruments subject and are settled by delivery of those instruments.
The fair value of a financial instrument on a given date is taken to be the price that would be received to sell an asset or paid to transfer a liability in an orderly transaction between market participants. The most objective and common reference for the fair value of a financial instrument is the price that would be paid for it on an active, transparent and deep market (quoted price or market price).
| 68 |
| |
If there is no market price for a given financial instrument, its fair value is estimated on the basis of valuation techniques commonly used by market participants, according to the specific features of the instrument to be measured and, particularly, the various types of risk associated with it.
All derivatives are recognized in the balance sheets at fair value from the trade date. If the fair value is positive, they are recognized as assets and if the fair value is negative, they are recognized as liabilities. The changes in the fair value of derivatives from the trade date are recognized in “Gains (losses) on financial assets and liabilities” in the consolidated income statement. Specifically, the fair value of standard financial derivatives included in the portfolios of financial assets or liabilities held for trading is deemed to be their daily quoted price and if, for exceptional reasons, the quoted price cannot be determined on a given date, these financial derivatives are measured using methods similar to those used to measure over the counter “OTC” derivatives.
The fair value of OTC derivatives is taken to be the sum of the future cash flows arising from the instrument, discounted to present value at the date of measurement (“present value” or “theoretical close”) using valuation techniques commonly used by market participants: “net present value” (NPV), option pricing models and other methods.
“Financial Assets Measured At Amortized Cost” and “Held-to-maturity investments” are measured at amortized cost using the effective interest method. “Amortized cost” is the acquisition cost of a financial asset or liability plus or minus, as appropriate, the principal repayments and the cumulative amortization (taken to the income statement) between the difference of the initial cost and the maturity amount. In the case of financial assets, amortized cost furthermore includes any reductions for impairment or uncollectibility. In the case of loans and receivables hedged in fair value hedges, the changes in the fair value of these assets related to the risk or risks being hedged are recognized.
The “effective interest rate” is the discount rate that exactly matches the initial amount of a financial instrument to all its estimated cash flows of all kinds over its remaining life. For fixed rate financial instruments, the effective interest rate coincides with the contractual interest rate established on the acquisition date plus, where applicable, the fees and transaction costs that, because of their nature, form part of their financial return. In the case of floating rate financial instruments, the effective interest rate coincides with the rate of return prevailing in all connections until the next benchmark interest reset date.
Equity instruments whose fair value cannot be determined in a sufficiently objective manner are measured at acquisition cost adjusted, where appropriate, by any related impairment loss.
Equity instruments whose fair value cannot be calculated in a sufficiently objective manner are measured at acquisition cost, adjusted, as the case may be, to the related impairment losses.
| 69 |
| |
The amounts at which the financial assets are recognized represent, in all material respects, the Bank’s maximum exposure to credit risk at each reporting date. Also, the Bank has received collateral and other credit enhancements to mitigate its exposure to credit risk, which consist mainly of mortgage guarantees, cash collateral, equity instruments and personal security, assets leased out under leasing and renting agreements, assets acquired under repurchase agreements and securities loans and derivatives.
ii. Provisions for losses on credits for impairment
The carrying amount of non-recoverable financial assets is adjusted through the recording of a provision for loss due to “Losses on financial assets (net) - Financial assets measured at amortized cost” in the consolidated income statement. The reversal of previously recorded losses is recognized in the consolidated income statement in the period in which the impairment decreases and can be objectively related to a recovery event.
To individually measure the impairment loss on loans assessed for impairment, the Bank considers the conditions of the counterparty, such as its economic and financial situation, level of indebtedness, ability to generate income, cash flow, management, corporate governance and quality of internal controls, payment history, industry experience, contingencies and credit limits, as well as characteristics of assets, such as their nature and purpose, type, sufficiency and guarantees of liquidity level and total credit value , and also based on the historical experience of impairment and other circumstances known at the time of the valuation.
To measure the impairment loss on loans assessed collectively for impairment, the Bank separates financial assets into groups taking into account the characteristics and similarities of credit risk, that is, according to the segment, type of assets, guarantees and other factors associated with the historical experience of impairment and other circumstances known at the time of the valuation.
iii. Impairment
The Bank recognizes adjustments for expected credit losses with respect to the following financial instruments that are not measured at fair value through profit or loss:
- financial assets that are debt instruments;
- amounts receivable from leasing;
- financial guarantee contracts issued; and
- loan commitments issued.
No impairment loss is recognized in equity instruments.
| 70 |
| |
The Bank measures the adjustments for losses at an amount equal to the expected credit losses during the expected life, except for the instruments below, for which they are recorded as expected credit losses in 12 months:
- debt instruments that present a low credit risk at the closing date; and
- other financial instruments (except lease receivables) in which the credit risk has not increased substantially since its initial recognition.
Adjustments for losses on amounts receivable from leasing are always measured at an amount equal to the expected credit losses during their useful lives.
iv. Measurement of expected credit losses
The expected credit losses are an estimate weighted by the probability of credit losses. They are measured as follows:
- financial assets not subject to impairment at the closing date: as the present value of all cash shortfalls, that is, the difference between the cash flows due to the entity under the contract and the cash flows that the Bank expects to receive;
- financial assets subject to impairment at the closing date: as the difference between the gross book value and the present value of estimated future cash flows;
- loan commitments: as the present value of the difference between the contractual cash flows due to the Bank if the commitment is used in full and the cash flows that the Bank expects to receive; and
- financial guarantee contracts: payments expected to reimburse the holder, less any amounts that the Bank expects to recover.
v. Modified assets
If the terms of a financial asset are renegotiated or modified or an existing financial asset is replaced by a new asset due to the debtor's financial difficulties, it is necessary to assess whether the financial asset should be written off and expected credit losses are measured as follows:
- If the expected restructuring does not result in a decrease in the existing asset, the expected cash flows from and the modified financial asset are included in the calculation of the cash shortfalls of the existing asset.
- If the expected restructuring results in a write-off of the existing asset, the expected fair value of the new asset is treated as the final cash flow of the existing financial asset at the time of its write-off.
This amount is included in the calculation of cash shortfalls arising from the existing financial asset discounted from the estimated write-off date until the closing date, using the original effective interest rate of the existing financial asset.
| 71 |
| |
vi. Determination of significant increases in credit risk
On each balance sheet calculation date, the Bank assesses whether financial assets recorded at amortized cost and debt financial instruments recorded at fair value through Other Comprehensive Income are subject to impairment, as well as other financial instruments subject to that assessment.
A financial asset is “subject to impairment” when one or more events that have a negative impact on the estimated future cash flows of the financial asset have occurred.
Evidence that a financial asset is subject to impairment includes the following observable data:
- significant financial difficulty for the debtor or issuer;
- delays in contractual obligations;
- breach of contract, such as default or delay;
- the restructuring of a loan or advance by the Bank under conditions that the Bank would not consider interesting to carry out;
- the likelihood that the debtor will enter bankruptcy or other financial reorganization; or
- the disappearance of an active market for a security due to financial difficulties.
A financial instrument that has been renegotiated due to deterioration in the borrower's condition is generally considered to be subject to impairment, unless there is evidence that the risk of not receiving contractual cash flows has been significantly reduced and there is no other impairment indicator.
vii. Presentation of the provision for impairment losses in the balance sheet
Provisions for impairment losses are presented in the balance sheet as follows:
- financial assets measured at amortized cost: as a deduction from the gross book value of the assets;
- loan commitments and financial guarantee contracts: as a provision; and
- debt instruments measured at fair value through Other Comprehensive Income: no provision for losses is recognized in the balance sheet, as the book value of these assets corresponds to the fair value.
viii. Individual or collective assessment
An individual measurement of impairment was based on management's best estimate of the present value of cash flows expected to be received. In estimating these cash flows, management exercised judgment as to the financial situation of a debtor and the net realizable value of any underlying guarantee. Each asset reduced to recoverable value was evaluated in relation to its merits, while the test strategy and the estimated cash flows considered recoverable, were approved by the Bank's credit risk officers.
When assessing the need for a collective provision for losses, management considered factors such as credit quality, portfolio size, concentrations and economic factors. In order to estimate the necessary provision, premises were established to define how the inherent losses were modeled and to determine the necessary data parameters, based on historical experience and current economic conditions.
| 72 |
| |
ix. Measurement of impairment
Losses on impairment of assets measured at amortized cost were calculated as the difference between the carrying amount and the present value of estimated future cash flows, discounted at the asset's original effective interest rate. Impairment losses on assets measured at fair value through Other Comprehensive Income were calculated as the difference between the book value and the fair value.
x. Reversal of impairment
For assets measured at amortized cost: If an event that occurred after impairment caused the impairment loss to decrease, the impairment loss was reversed through profit or loss.
For debt securities measured at fair value through Other Comprehensive Income: If, in a subsequent period, the fair value of a debt security reduced to recoverable value has increased and this increase could be objectively linked to an event that occurred after recognition from impairment loss, impairment loss was reversed through profit or loss; otherwise, any increase in fair value was recognized through Other Comprehensive Income.
Any subsequent recovery in the fair value of an equity instrument measured at fair value through Other Comprehensive Income and reduced to recoverable value was recognized at any time in Other Comprehensive Income.
Below is the reconciliation of shareholders' equity resulting from the initial adoption of IFRS 9:
| Reconciliation of Shareholders' Equity | |||||||||||||||||||
| Shareholders' equity before IFRS 9 adjustments - 12/31/2017 | 87,087,601 | ||||||||||||||||||
| Allowance for loan losses | (2,149,051) | ||||||||||||||||||
| Provisions for contingent commitments | (674,513) | ||||||||||||||||||
| Remeasurement of assets arising from the new categories | 17,806 | ||||||||||||||||||
| Others | 237,867 | ||||||||||||||||||
| Income taxes and deferred social contribution | 1,026,066 | ||||||||||||||||||
| Shareholders' equity after IFRS 9 adjustments - 01/01/2018 | 85,545,776 | ||||||||||||||||||
Information, assumptions and techniques used to estimate the impairment
| i. | Classification of financial instruments by stages |
The portfolio of financial instruments subject to impairment is divided into three levels, based on the stage of each instrument related to its level of credit risk:
| 73 |
| |
- Stage 1: It is understood that a financial instrument at this stage does not have a significant increase in risk since its initial recognition. The provision on this asset represents the expected loss resulting from possible default over the next 12 months;
- Stage 2: If a significant increase in risk is identified since initial recognition, without materializing deterioration, the financial instrument will be classified within this stage. In this case, the amount referring to the provision for expected loss due to default reflects the estimated loss of the residual life of the financial instrument. To assess the significant increase in credit risk, quantitative measurement indicators used in normal credit risk management will be used, as well as other qualitative variables, such as the indication of being a non-deteriorating operation if considered as refinanced or included operations in a special agreement; and
- Stage 3: A financial instrument is recorded within this stage, when it shows signs of deterioration evident as a result of one or more events that have already occurred and which materialize at a loss. In this case, the amount referring to the provision for losses reflects the expected losses due to credit risk over the expected residual life of the financial instrument.
| ii. | Impairment estimate methodology |
The measurement of impairment loss is performed using the following factors:
- Exposure to Default or EAD: is the value of the transaction exposed to credit risk, including the current balance ratio available that could be provided at the time of default. The models developed incorporate assumptions about changes in the payment schedule for operations.
- Probability of Default (PD): is defined as the probability that the counterparty will be able to fulfill its obligations to pay the principal and / or interest. For the purposes of IFRS 9, both will be considered: PD - 12 months (Stage 1), which is the probability that the financial instrument will default in the next 12 months as well as PD - lifetime (Stages 2 and 3), which considers the probability that the counterparty will default between the balance sheet date and the residual maturity date of the operation. The standard requires that future information relevant to the estimation of these parameters must be considered.
- Loss on Default (LGD): is the resulting loss in the event of default, that is, the percentage of exposure that cannot be recovered in the event of default. It mainly depends on the guarantees associated with the transaction, which are considered as risk mitigation factors associated with each financial credit asset and the expected future cash flows to be recovered. As established in the regulations, future information must be taken into account for its estimation.
- Discount rate: is the rate applied to the estimated future cash flows over the expected life of the asset, to bring them to present value.
| 74 |
| |
In order to estimate the aforementioned parameters, the Bank has applied its experience in the development of internal models for the calculation of parameters for both the regulatory environment and internal management purposes.
| iii.Default | definition |
The Bank considers that a financial asset is in default when:
- it is likely that the debtor will not fully pay its credit obligations to the Bank; or
- the debtor presents significant credit obligations to the Bank overdue for more than 90 days, as a general rule.
Overdrafts are considered overdue if the customer breaches a recommended limit or has been granted a limit lower than the current open amount.
When assessing whether a debtor is in default, the Bank considers indicators:
- qualitative - for example, violations of covenants;
- quantitative - for example, overdue status and non-payment of another obligation of the same issuer with the Bank; and
- based on data collected internally and obtained from external sources.
b. Auditor’s qualified opinion and highlights
In the years ended December 31, 2020, 2019 and 2018 the auditor in charge issued no qualified opinion and highlights.
10.5. Officers’ indication of key points and comments on.
I. Estimates used
The consolidated results and the calculation of consolidated equity are impacted by the accounting policies, assumptions, estimates and measurement methods used by the Bank's directors in the preparation of interim consolidated financial statements. The Bank makes estimates and assumptions that affect the reported amounts of assets and liabilities of future periods. All estimates and assumptions required, in accordance with IFRSs, are the management's best estimate in accordance with the applicable standard.
In the consolidated financial statements, estimates are made by management of the Bank and consolidated entities in order to quantify certain assets, liabilities, revenues and expenses and disclosures of explanatory notes.
(i) Critical estimates
The main estimates were discussed in detail with a view to the preparation of the consolidated financial statements as of December 31, 2020.
In the year ended December 31, 2020, there were no significant changes in the estimates made at the end of 2019, in addition to those indicated in these financial statements.
| 75 |
| |
Critical estimates and assumptions that have a more significant impact on the accounting balances of certain assets, liabilities, income and expenses and on the disclosures of explanatory notes are described below:
i. Income taxes (IRPJ), Social Contribution (CSLL), Social Integration Program (PIS) and Tax for Social Security Financing (COFINS)
Income tax expense is obtained by adding the Income Tax, Social Contribution, PIS and COFINS. Current Income Tax and Social Contribution result from the application of the respective rates on taxable income, and the PIS and COFINS rates applied on the respective calculation basis provided for in the specific legislation, added also with changes in deferred tax assets and liabilities recognized in the consolidated income statement. The CSLL rate, for banks of any kind, was increased from 15% to 20% effective as of March 1, 2020, pursuant to Article 32 of Constitutional Amendment 103, published on November 13, 2019.
Income tax is calculated at the rate of 15% plus a surcharge of 10% levied on the profit, after adjustments determined by tax legislation. The social contribution (CSLL) is calculated at the rate of 20% for financial institutions (15% up to August 2015) and 9% for other companies, levied on the profit, after considering the adjustments determined by tax legislation.
Deferred tax assets and liabilities include temporary differences, which are identified as the amounts expected to be payable or recoverable on differences between the carrying amounts of assets and liabilities and their related tax bases, and tax loss and tax credit carry forwards. These amounts are measured at the tax rates that are expected to apply in the period when the asset is realized or the liability is settled.
Deferred tax assets are only recognized as temporary differences to the extent that it is considered probable that the consolidated entities will have sufficient future taxable profits against which the deferred tax assets can be utilized, and the deferred tax assets do not arise from the initial recognition (except in a business combination) of other assets and liabilities in a transaction that affects neither taxable profit or accounting profit. Other deferred tax assets (tax loss and tax credit carry forwards) are only recognized if it is considered probable that the consolidated entities will have sufficient future taxable profits against which they can be utilized.
Due to the change in social contribution tax rate, the group companies made the remeasurement of tax credit assets and deferred liabilities at the rates applicable to the period in which estimates the realization of assets and settlement of liabilities.
For additional details see Note 2.aa. of our Financial Statements.
| 76 |
| |
ii. Valuation of the fair value of certain financial instruments
Financial instruments are initially recognized at fair value and those that are not measured at fair value through profit or loss are adjusted for transaction costs.
Financial assets and liabilities are subsequently measured at the end of each period using valuation techniques. This calculation is based on assumptions, which take into account the management's judgment based on information and market conditions existing at the balance sheet date.
Banco Santander classifies the measurements at fair value using the hierarchy of fair value that reflects the model used in the measurement process, segregating the financial instruments between Levels I, II or III.
Additional details are in notes 2.e and 46.c8 of the consolidated financial statements of December 31, 2020, which present the sensitivity analysis for Financial Instruments.
iii.IFRS 9 - Financial Instruments
Issued in its final format in July 2014, the International Accounting Standards Board (IASB) approved IFRS 9, which replaced IAS 39 Financial Instruments, in accordance with the guidelines defined by the G20 by finance ministers of the world's 20 largest economies) in April 2009, establishing requirements for the recognition and measurement of financial instruments. This standard was adopted from January 1, 2018.
iii.1. Provisions for losses on receivables
The book value of non-recoverable financial assets is adjusted by recording a provision for loss of debt of "Losses on financial assets (net) – Financial Assets measured at amortized cost" in the consolidated income statement. The reversal of previously recorded losses is recognized in the consolidated income statement in the period in which the reduction to recoverable value decreases and can be related objectively to a recovery event.
To individually measure the loss by reduction to the recoverable value of loans evaluated as to the reduction to recoverable value, we consider the conditions of the payoff, such as its economic and financial situation, level of indebtedness, income generation capacity, cash flow, administration, corporate governance and quality of internal controls, payment history, industry experience, contingencies and credit limits, as well as asset characteristics, such as their nature and purpose, type, sufficiency and guarantees of liquidity level and total credit value, and also based on historical experience of reduction to recoverable value and other circumstances known at the time of valuation.
To measure the loss by reduction to the recoverable value of collectively valuated loans for the reduction to recoverable value, we separate financial assets into groups taking into account the characteristics and similarities of credit risk, i.e., according to the segment, type of assets, guarantees and other factors associated with the historical experience of recoverable value reduction and other circumstances known at the time of the valuation.
| 77 |
| |
iii.2. Business model assessment
The Bank assesses the objective of a business model in which an asset is maintained at the portfolio level, as it better reflects how the business is managed and what information is provided to management. The information considered comprises:
- Policies and objectives defined for the portfolio and the application of these policies in practice. Including, if the Administration's strategy is focused on earning contractual interest income, maintaining a specific interest rate profile, aligning the duration of the assets;
- How the portfolio's performance is assessed and reported to the Bank's management;
- The risks that affect the performance of the business model (and the financial assets held within that business model) and how these risks are managed;
- How the business managers are remunerated - for example, if the remuneration is based on the fair value of the managed assets or the contractual cash flows received;
- The frequency, volume and timing of sales in previous periods, the reasons for such sales and your expectations about future sales. However, information on sales activity is not considered in isolation, but as part of an overall assessment of the objective defined by the Bank to manage financial assets.
Financial assets held for trading or managed, whose performance is assessed based on fair value, are measured at fair value through profit or loss, as (i) they are not held to receive contractual cash flows (ii) nor are they held to receive flows contractual cash flow and sell financial assets.
iii.3. Valuation to determine whether contractual cash flows refer exclusively to principal and interest payments
For the purposes of this assessment, “principal” is defined as the fair value of the financial asset upon initial recognition. “Interest” is defined as the consideration for the value of the currency over time and for the credit risk associated with the value of the principal outstanding during a specific period and for other basic risks and costs of loans (for example, liquidity risk and administrative costs), as well as the profit margin.
When assessing whether contractual cash flows refer exclusively to payments of principal and interest, the Bank considers the contractual terms of the instrument. This includes assessing whether the financial asset contains a contractual term that could change the term or value of the contractual cash flows in a way that would not meet this condition. When carrying out the assessment, the Bank considers:
| 78 |
| |
- contingent events that would change the amount and timing of cash flows;
- leverage;
- advance payment terms and extension;
- terms that limit the Bank's right to cash flows from assets; and
- resources that modify the consideration of the currency value over time, for example, periodic adjustment of interest rates.
iii.4. Financial assets write-off
We write-off a financial asset when the contractual rights to the asset's cash flows expire or when we transfer the rights to receive contractual cash flows in a transaction in which essentially all risks and benefits of ownership of the financial asset are transferred or in which we do not substantially transfer or retain all the risks and benefits of ownership of the financial asset and do not control the financial asset.
At the loss of a financial asset, the difference between the book value of the asset (or book value allocated to the portion of the asset summed) and the sum (i) of the payment received (including any new asset obtained, deducted from any new assumed liabilities) and (ii) any accumulated gains or losses recognized in "Other Comprehensive Results" is recorded in the income statement.
From the opening date of IFRS, mentioned above, any accumulated and recognized gains/losses in "Other Comprehensive Results" in relation to equity instruments designated at fair value through Other Comprehensive Results are not recorded in profit or loss by the loss of these securities.
We carry out operations in which we transfer the assets recognized in our balance sheet, but we maintain all or substantially all the risks and benefits of the transferred assets or part thereof. In these cases, transferred assets are not downloaded. Examples of these transactions include restraining of portfolios of loans with co-obligation. In operations in which we do not substantially retain or transfer all risks and property benefits of a financial asset and retain control of the asset, we continue to recognize the asset to the extent of our ongoing involvement, determined by the extent to which it is exposed to changes in the value of the transferred asset.
iii.5. Financial Liabilities write-off
We write-off a financial liability when your contractual obligations are extinguished, cancelled or when they expire.
iii.6. Compensation
Financial assets and liabilities are offset and the net amount presented in the balance sheet when, and only when, we have a legally enforceable right to offset the amounts and the intention to settle them on a net basis, or realize the asset and settle the liability simultaneously.
| 79 |
| |
Revenues and expenses are presented on a net basis only when allowed by IFRSs or for gains or losses resulting from a group of similar transactions, as in our trading activity.
iii.7. Impairment
The Bank recognizes adjustments for expected credit losses with respect to the following financial instruments that are not measured at fair value through profit or loss:
- financial assets that are debt instruments;
- amounts receivable from leasing;
- financial guarantee contracts issued; and
- loan commitments issued.
No impairment loss is recognized in equity instruments.
The Bank measures the adjustments for losses at an amount equal to the expected credit losses during the expected life, except for the instruments below, for which they are recorded as expected credit losses in 12 months:
- debt instruments that present a low credit risk at the closing date; and
- other financial instruments (except lease receivables) in which the credit risk has not increased substantially since its initial recognition.
Adjustments for losses on amounts receivable from leasing are always measured at an amount equal to the expected credit losses during their useful lives.
iii.8. Measurement of expected credit losses
The expected credit losses are an estimate weighted by the probability of credit losses. They are measured as follows:
- financial assets not subject to impairment at the closing date: as the present value of all cash shortfalls, that is, the difference between the cash flows due to the entity under the contract and the cash flows that the Bank expects to receive;
- financial assets subject to impairment at the closing date: as the difference between the gross book value and the present value of estimated future cash flows;
- loan commitments: as the present value of the difference between the contractual cash flows due to the Bank if the commitment is used in full and the cash flows that the Bank expects to receive; and
- financial guarantee contracts: payments expected to reimburse the holder, less any amounts that the Bank expects to recover.
iii.9. Modified assets
If the terms of a financial asset are renegotiated or modified or an existing financial asset is replaced by a new asset due to the debtor's financial difficulties, it is necessary to assess whether the financial asset should be written off and expected credit losses are measured as follows:
| 80 |
| |
- If the expected restructuring does not result in a decrease in the existing asset, the expected cash flows from and the modified financial asset are included in the calculation of the cash shortfalls of the existing asset.
- If the expected restructuring results in a write-off of the existing asset, the expected fair value of the new asset is treated as the final cash flow of the existing financial asset at the time of its write-off.
This amount is included in the calculation of cash shortfalls arising from the existing financial asset discounted from the estimated write-off date until the closing date, using the original effective interest rate of the existing financial asset.
iii.10. Determining significant increases in credit risk
On each balance sheet calculation date, the Bank assesses whether financial assets recorded at amortized cost and debt financial instruments recorded at fair value through Other Comprehensive Income are subject to impairment, as well as other financial instruments subject to that assessment.
A financial asset is “subject to impairment” when one or more events that have a negative impact on the estimated future cash flows of the financial asset have occurred.
Evidence that a financial asset is subject to impairment includes the following observable data:
- significant financial difficulty for the debtor or issuer;
- delays in contractual obligations;
- breach of contract, such as default or delay;
- the restructuring of a loan or advance by the Bank under conditions that the Bank would not consider interesting to carry out;
- the likelihood that the debtor will enter bankruptcy or other financial reorganization; or
- the disappearance of an active market for a security due to financial difficulties.
A financial instrument that has been renegotiated due to deterioration in the borrower's condition is generally considered to be subject to impairment, unless there is evidence that the risk of not receiving contractual cash flows has been significantly reduced and there is no other impairment indicator.
iii.11. Presentation of expected credit losses in the financial statements
Provisions for impairment losses are presented in the balance sheet as follows:
- financial assets measured at amortized cost: as a deduction from the gross book value of the assets;
- loan commitments and financial guarantee contracts: as a provision; and
| 81 |
| |
- debt instruments measured at fair value through Other Comprehensive Income: no provision for losses is recognized in the balance sheet, as the book value of these assets corresponds to the fair value.
iii.12. Individual or collective evaluation
An individual measurement of impairment was based on management's best estimate of the present value of cash flows expected to be received. In estimating these cash flows, management exercised judgment as to the financial situation of a debtor and the net realizable value of any underlying guarantee. Each asset reduced to recoverable value was evaluated in relation to its merits, while the test strategy and the estimated cash flows considered recoverable, were approved by the Bank's credit risk officers.
When assessing the need for a collective provision for losses, management considered factors such as credit quality, portfolio size, concentrations and economic factors. In order to estimate the necessary provision, premises were established to define how the inherent losses were modeled and to determine the necessary data parameters, based on historical experience and current economic conditions.
iii.13. Measurement of impairment
Losses on impairment of assets measured at amortized cost were calculated as the difference between the carrying amount and the present value of estimated future cash flows, discounted at the asset's original effective interest rate. Impairment losses on assets measured at fair value through Other Comprehensive Income were calculated as the difference between the book value and the fair value.
iii.14. Impairment reversal
For assets measured at amortized cost: If an event that occurred after impairment caused the impairment loss to decrease, the impairment loss was reversed through profit or loss.
For debt securities measured at fair value through Other Comprehensive Income: If, in a subsequent period, the fair value of a debt security reduced to recoverable value has increased and this increase could be objectively linked to an event that occurred after recognition from impairment loss, impairment loss was reversed through profit or loss; otherwise, any increase in fair value was recognized through Other Comprehensive Income.
Any subsequent recovery in the fair value of an equity instrument measured at fair value through Other Comprehensive Income and reduced to recoverable value was recognized at any time in Other Comprehensive Income.
Below is the reconciliation of shareholders' equity resulting from the initial adoption of IFRS 9:
| 82 |
| |
| Equity conciliation |
| Equity before IFRS 9 adjustments - 12/31/2017 | 87,087,601 | |||||||||||
| Allowance for loan losses | (2,149,051) | |||||||||||
| Provision for contingent commitments | (674,513) | |||||||||||
| Re-measurement of assets arising from the new categories | 17,806 | |||||||||||
| Others | 237,867 | |||||||||||
| Income taxes and deferred social contribution | 1,026,066 | |||||||||||
| Equity after IFRS 9 adjustments - 1/01/2018 | 85,545,776 | |||||||||||
iii.15. Information, assumptions and techniques used in the impairment estimate
iii.15.1 Classification of financial instruments by stages
The portfolio of financial instruments subject to impairment is divided into three levels, based on the stage of each instrument related to its level of credit risk:
- Stage 1: It is understood that a financial instrument at this stage does not have a significant increase in risk since its initial recognition. The provision on this asset represents the expected loss resulting from possible default over the next 12 months;
- Stage 2: If a significant increase in risk is identified since initial recognition, without materializing deterioration, the financial instrument will be classified within this stage. In this case, the amount referring to the provision for expected loss due to default reflects the estimated loss of the residual life of the financial instrument. To assess the significant increase in credit risk, quantitative measurement indicators used in normal credit risk management will be used, as well as other qualitative variables, such as the indication of being a non-deteriorating operation if considered as refinanced or included operations in a special agreement; and
- Stage 3: A financial instrument is recorded within this stage, when it shows signs of deterioration evident as a result of one or more events that have already occurred and which materialize at a loss. In this case, the amount referring to the provision for losses reflects the expected losses due to credit risk over the expected residual life of the financial instrument.
iii.15.2 Impairment estimate methodology
The measurement of impairment loss is performed using the following factors:
- Exposure to Default or EAD: is the value of the transaction exposed to credit risk, including the current balance ratio available that could be provided at the time of default. The models developed incorporate assumptions about changes in the payment schedule for operations.
- Probability of Default (PD): is defined as the probability that the counterparty will be able to fulfill its obligations to pay the principal and / or interest. For the purposes of IFRS 9, both will be considered: PD - 12 months (Stage 1), which is the probability that the financial instrument will default in the next 12 months as well as PD - lifetime (Stages 2 and 3), which considers the probability that the counterparty will default between the balance sheet date and the residual maturity date of the operation. The standard requires that future information relevant to the estimation of these parameters must be considered.
| 83 |
| |
- Loss on Default (LGD): is the resulting loss in the event of default, that is, the percentage of exposure that cannot be recovered in the event of default. It mainly depends on the guarantees associated with the transaction, which are considered as risk mitigation factors associated with each financial credit asset and the expected future cash flows to be recovered. As established in the regulations, future information must be taken into account for its estimation.
- Discount rate: is the rate applied to the estimated future cash flows over the expected life of the asset, to bring them to present value.
In order to estimate the aforementioned parameters, the Bank has applied its experience in the development of internal models for the calculation of parameters for both the regulatory environment and internal management purposes.
iii.15.3 Default Definition
The Bank considers that a financial asset is in default when:
- it is likely that the debtor will not fully pay its credit obligations to the Bank; or
- the debtor presents significant credit obligations to the Bank overdue for more than 90 days, as a general rule.
Overdrafts are considered overdue if the customer breaches a recommended limit or has been granted a limit lower than the current open amount.
When assessing whether a debtor is in default, the Bank considers indicators:
- qualitative - for example, violations of covenants;
- quantitative - for example, overdue status and non-payment of another obligation of the same issuer with the Bank; and
- based on data collected internally and obtained from external sources.
| iv. | Provisions for pension funds |
Defined benefit plans are recorded based on an actuarial study, carried out annually by a specialized company, at the end of each year, effective for the subsequent period and are recognized in the consolidated income statement in the Interest and similar expenses and Provisions lines (net).
The present value of the defined benefit obligation is the present value without deducting any plan assets, from the expected future payments necessary to settle the obligation resulting from the employee's service in current and past periods.
| 84 |
| |
Additional details are in note 2.x to the Consolidated Financial Statements of December 31, 2020.
| v. | Contingent provisions, assets and liabilities |
Provisions for judicial and administrative proceedings are constituted when the risk of loss of the judicial or administrative action is assessed as probable and the amounts involved are measurable with sufficient security, based on the nature, complexity and history of the actions and the opinion of the legal advisors internal and external.
Explanatory note 2.r to the Bank's consolidated financial statements for the year ended December 31, 2020, features information on provisions and contingent assets and liabilities. There were no significant changes in provisions and contingent assets and liabilities of the Bank between December 31, 2019 and December 31, 2020, the date of preparation of these consolidated financial statements.
| vi. | Goodwill |
The goodwill recorded is subject to the impairment test, at least once a year or in a shorter period, in the event of any indication of impairment of the asset.
The basis used for the recoverability test is the value in use and, for this purpose, the cash flow is estimated for a period of 5 years. Cash flow was prepared considering several factors, such as: (i) macroeconomic projections of interest rates, inflation, exchange rate and others; (ii) behavior and growth estimates of the national financial system; (iii) increased costs, returns, synergies and investment plan; (iv) customer behavior; and (v) growth rate and adjustments applied to flows in perpetuity. The adoption of these estimates involves the probability of future events occurring and the alteration of any of these factors could have a different result. The cash flow estimate is based on a valuation prepared by an independent expert annually or whenever there is evidence of a reduction in its recoverable amount, which is reviewed and approved by management.
Additional details are in note 13 of our Financial Statements.
II. Foreign currency transactions
The financial statements are presented in Brazilian Reais, the functional and reporting currency of Banco Santander and its subsidiaries.
The assets and liabilities and foreign subsidiary are converted to Real as follows:
- Assets and liabilities are translated at the exchange rate at the balance sheets date
- Revenues and expenses are translated at the monthly average exchange rates.
| 85 |
| |
- Gain and losses on translation of net investment are recorded in the statement of comprehensive income, in “exchange rate of investees located abroad”.
III. Basis for consolidation
i. Subsidiaries
“Subsidiaries” are defined as entities over which the Bank has control. Control is based on whether the Bank has: i) power over the investee; ii) exposure, or rights, to variable returns from its involvement with the investee; and iii) the ability to use its power over the investee to affect the amount of the returns, as set forth in the law, the Bylaws or agreement.
Consolidation of a subsidiary begins when the Bank obtains control over the subsidiary and ceases when the Bank loses control of the subsidiary. Specifically, income and expense of a subsidiary acquired or disposed during the year are included in the consolidated income statement and other comprehensive income from the date the Bank gains controls until the date when the Bank ceases to control the subsidiary.
Profit or loss and each component of Other Comprehensive Income are attributed to the owners of the Bank and to the non-controlling interests even if the effect is attributed to non-controlling interests. Total comprehensive income of subsidiaries is attributed to the owners of the Bank and to the non-controlling interest even if this generates a negative balance for non-controlling interests. All transactions, balances, income and expenses between the companies of the Santander Group are eliminated in the consolidated financial statements.
Changes in the Santander Group’s interest in a subsidiary that do not result in loss of control are registered as equity transactions. Any difference between the amount by which the non-controlling interests are adjusted and the fair value of the consideration paid or received is recognized directly in equity and attributed to owners of the Company.
When the Bank loses control of a subsidiary, the profit or loss on disposal is calculated as the difference between (i) the aggregate fair value of the consideration received and the fair value of any retained interest and (ii) the previous carrying amount of the assets (including goodwill), and liabilities of the subsidiary and any non-controlling interests. Amounts previously recognized in other comprehensive income in relation to the subsidiary are registered (i.e. reclassified to income statement or transferred directly to retained earnings) in the same manner as it would be required if the relevant assets or liabilities are disposed of. The fair value of any investment retained in the former subsidiary at the date when control got lost is considered as the fair value on initial recognition for subsequent accounting under IFRS 9 Financial Instruments: Recognition and Measurement or, when applicable, the costs on initial recognition of an investment in an associate or jointly controlled entity
| 86 |
| |
ii. Interests in joint ventures (jointly controlled entities) and associates
Joint ventures mean interests in entities that are not subsidiaries but which are jointly controlled by two or more unrelated entities. This is evidenced by contractual arrangements whereby two or more entities (“ventures”) acquire interests in entities (jointly controlled entities) so that strategic financial and operating decisions affecting the joint venture require the unanimous consent of the ventures.
Associates are entities over which the Bank is in a position to exercise significant influence (significant influence is the power to participate in the financial and operating decisions of the investee) but it does not control or has joint control over the investee.
In the consolidated financial statements, interest in joint ventures and investments in associates are registered using the equity method, i.e. at the Bank’s share of net assets of the investee, after taking into consideration the dividends received from capital reductions and other related transactions.
iii. Business combinations, acquisitions and disposals
A business combination means the union of two or more individual business or economic business into one single entity or group of entities and is registered in accordance with IFRS 3 - “Business Combinations”.
Business combinations are carried out so that the Bank obtains control over an entity and are recognized for accounting purposes as follow:
The Bank measures the cost of the business combination, defined as the fair value of the assets offered, the liabilities incurred and the equity instruments issued, if any.
The fair values of the assets, liabilities and contingent liabilities of the acquired entity or business, including any intangible assets which might not have been recognized by the acquiree, are estimated at the acquisition date and recognized in the consolidated financial statement.
The excess of the acquisition cost over the fair value of the identifiable net assets acquired are recognized as goodwill (note 13). The excess of fair value of the identifiable net assets over the acquisition cost is an advantageous purchase gain and it is recorded as income on the date of the acquisition.
Note 3 of our Financial Statements has the most significant transaction descriptions in 2020, 2019 and 2018.
| iv. | Investment Funds |
These include investment funds in which the Santander Group companies hold a substantial interest or the entirety of the interests and are therefore exposed to, or have rights, to variable returns and have the ability to affect those returns through power over the fund, in accordance with IFRS 10 - Consolidated Financial Statements and are therefore, consolidated in these financial statements.
| 87 |
| |
IV. Definitions and classification of financial instruments
i. Definitions
“Financial instrument” is any contract that gives rise to a financial asset of one entity and, simultaneously, to a financial liability or financial interest of another entity.
“Equity instrument” is any agreement that evidences a residual interest in the asset of the issuing entity after deducting all of its liabilities.
“Financial derivative” is a financial instrument whose value changes in response to the change in an observable market variable (such as an interest rate, foreign exchange rate, financial instrument price, market index or credit rating), whose initial investment is zero or very small compared with other financial instruments with a similar response to changes in market factors, and which is settled at a future date.
“Hybrid financial instruments” are contracts that simultaneously include a non-derivative host contract together with a derivative, known as an embedded derivative, that is not separately transferable and has the effect to make part of the cash flow of the hybrid contract vary similar to a stand-alone derivative.
The following transactions are not treated for accounting purposes as financial instruments:
- Investments in subsidiaries, jointly controlled entities and associates (notes 3&11 of our Financial Statements).
- Rights and obligations under employee benefit plans (note 21 of our Financial Statements).
ii. Classification of financial assets for measurement purposes
Financial assets are initially classified into the various categories used for management and measurement purposes, unless they have to be presented as Non-current assets held for sale or they relate to Cash, cash balances at Central Banks and other deposits on demand, Changes in the fair value of hedged items in portfolio hedges of interest rate risk (asset side), Hedging derivatives and Investments, which are reported separately.
Upon initial recognition of an equity instrument not held for trading, the Bank may irrevocably choose to present subsequent changes in fair value through Other Comprehensive Income. This option is made considering each investment individually and was not used by the Bank. In addition, upon initial recognition, the Bank may irrevocably designate at fair value through profit or loss a financial asset that would otherwise meet the measurement requirements at amortized cost or at fair value through Other Comprehensive Income, if such designation eliminate or substantially reduce an accounting mismatch that could exist. This option was not used by the Bank.
Financial assets are included for measurement purposes in one of the following categories:
| 88 |
| |
• Financial Assets Measured At Fair Value Through Profit Or Loss Held For Trading: this category includes the financial assets acquired to generate short-term profit resulting from the fluctuation of its prices and financial derivatives not classified as hedging instruments, whose primary business model of the Bank is to trade them frequently.
• Financial Assets Measured At Fair Value Through Profit Or Loss: this category includes the financial assets that did not meet the pre-established criteria when evaluating the SPPI Test (Solely Payment of Principal and Interest).
• Non-Trading Financial Assets Mandatorily Measured At Fair Value Through Profit Or Loss: this category includes the financial assets that at the time of initial designation was made the fair value option.
• Financial Assets Measured At Fair Value Through Profit Or Loss: are stated at fair value. This category does not include debt instruments classified as “Held-to-maturity investments” or “Financial assets at fair value through profit or loss”, and equity instruments issued by entities other than subsidiaries, associates and jointly controlled entities, provided that such instruments have not been classified as “Financial assets held for trading” or as “Other financial assets at fair value through profit or loss”.
The results rising from changes in fair value are recognized at the Financial Assets Measured At Fair Value Through Other Comprehensive Income line in the Shareholders´ equity except for cumulative impairment losses which are recognized in statement of profit or loss. When the investment is sold or has evidences of decreases on the fair value due to impairment, the previously recognized result at the same Shareholders´ Equity line, mentioned above is reclassified to the statement of profit or loss.
• Financial Assets Measured At Amortized Cost: this category includes financing granted to third parties, based on their nature, irrespective of the type of borrower and the form of financing, including finance lease transactions in which the consolidated entities act as lessors. The entities included in the consolidation have, in general, the intention of maintaining the loans and credits they grant until their final maturity, which, therefore, are presented in the consolidated balance sheet at amortized cost (which includes the necessary adjustments to reflect the estimated impairment losses).
• A financial asset is measured at amortized cost if it meets the following conditions and is not designated at fair value through profit or loss:
• The asset is maintained within a business model whose objective is to maintain assets in order to receive contractual cash flows;
• The contractual terms of the financial asset generate, on specific dates, cash flows that refer exclusively to payments of the principal and interest on the principal amount outstanding;
• A debt instrument is measured at fair value through Other Comprehensive Income if it meets the following conditions and is not designated at fair value through profit or loss;
| 89 |
| |
• The asset is maintained within a business model whose objective is achieved by receiving contractual cash flows and by selling financial assets; and
• The contractual terms of the financial asset generate, on specific dates, cash flows that refer exclusively to payments of the principal and interest on the principal amount outstanding.
Business model evaluation
The Bank assesses the objective of a business model in which an asset is maintained at the portfolio level, as it better reflects how the business is managed and what information is provided to management. The information considered comprises:
- Policies and objectives defined for the portfolio and the application of these policies in practice. Including, if the Administration's strategy is focused on earning contractual interest income, maintaining a specific interest rate profile, aligning the duration of the assets;
- How the portfolio's performance is assessed and reported to the Bank's management;
- The risks that affect the performance of the business model (and the financial assets held within that business model) and how these risks are managed;
- How the business managers are remunerated - for example, if the remuneration is based on the fair value of the managed assets or the contractual cash flows received;
- The frequency, volume and timing of sales in previous periods, the reasons for such sales and your expectations about future sales. However, information on sales activity is not considered in isolation, but as part of an overall assessment of the objective defined by the Bank to manage financial assets.
Financial assets held for trading or managed, whose performance is assessed based on fair value, are measured at fair value through profit or loss, as (i) they are not held to receive contractual cash flows (ii) nor are they held to receive flows contractual cash flow and sell financial assets.
iii. Classification of financial assets for presentation purposes
Financial assets are classified by nature into the following headings in the consolidated financial statements:
• Cash and balances with the Bacen: cash balances and balances receivable on demand relating to deposits with Bacen and credit institutions.
• Financial Assets Measured At Amortized Cost: includes the debit balances of all credit and loans granted by the Bank, other than those represented by securities, as well as finance lease receivables and other debit balances of a financial nature in favor of the Bank, such as checks drawn on credit institutions, balances receivable from clearing houses and settlement agencies for transactions on the stock exchange and organized markets, bonds given in cash, capital calls, fees and commissions receivable for financial guarantees and debit balances arising from transactions not originating in banking transactions and services, such as the collection of rentals and similar items.
| 90 |
| |
• Loans and other amounts with credit institutions: credit of any nature in the name of financial institutions.
• Loans and advances to clients: includes debit balances of all the remaining credit and loans granted by the Bank, including money market operations through centralized counterparties.
• Debt instruments: bonds and other securities that represent a debt for their issuer, that generate an interest return, and that are in the form of certificates or book entries.
• Equity instruments: Financial instruments issued by other entities, such as shares, which have the nature of equity instruments for the issuer, other than investments in subsidiaries, joint ventures or associates. Investment fund units are included in this item.
• Trading derivatives: includes the fair value in favor of the Bank of derivatives which do not form part of hedge accounting.
• Hedging derivatives: includes the fair value in favor of the Bank of derivatives designated as hedging instruments in hedge accounting.
• Investments in associates and jointly controlled companies: includes the investments made in the share capital of associates and jointly controlled companies.
iv. Classification of financial liabilities for measurement purposes
Financial liabilities are classified for measurement purposes into one of the following categories:
• Financial Assets At Fair Value Through Profit Or Loss Held for Trading: this category includes financial liabilities incurred for the purpose of generating a profit in the near term from fluctuations in their prices, financial derivatives not designated as hedging instruments, and financial liabilities arising from the outright sale of financial assets acquired under reverse repurchase agreements ("reverse repos") or borrowed (short positions).
• Financial Assets At Fair Value Through Profit Or Loss: financial liabilities are included in this category when they provide more relevant information, either because this eliminates or significantly reduces recognition or measurement inconsistencies (accounting mismatches) that would otherwise arise from measuring assets or liabilities or recognizing the gains or losses on them on different bases, or because a group of financial liabilities or financial assets and liabilities is managed and its performance is evaluated on a fair value basis, in accordance with a documented risk management or investment strategy, and information about the group is provided on that basis to the Group's key management personnel.
| 91 |
| |
• Financial liabilities at amortized cost: financial liabilities, irrespective of their instrumentation and maturity, not included in any of the above-mentioned categories which arise from the ordinary borrowing activities carried on by financial institutions.
v. Classification of financial liabilities for presentation purposes
Financial liabilities are classified by nature into the following items in the consolidated financial statements:
• Deposits from Bacen: deposits of any nature received from Bacen.
• Deposits from credit institutions: deposits of any nature, including credit received and money market operations in the name of credit institutions.
• Client deposits: includes deposits of any nature such as demand deposits, saving deposits and time deposits including money market operation received from client.
• Marketable debt securities: includes the amount of bonds and other debt represented by marketable securities, other than subordinated liabilities.
• Trading derivatives: includes the fair value, with a negative balance for the Bank, of derivatives which do not form part of hedge accounting.
• Short positions: includes the amount of financial liabilities arising from the outright sale of financial assets purchased under reverse repurchase agreements or borrowed.
• Subordinated liabilities: amount of financing received which, for the purposes of payment priority, ranks behind ordinary debt. This category also includes the financial instruments issued by the Bank which, although equity for legal purposes, do not meet the requirements for classification as equity.
• Other financial liabilities: includes the amount of payment obligations having the nature of financial liabilities not included in other items, and liabilities under financial guarantee contracts, unless they have been classified as non-performing.
• Hedging derivatives: includes the fair value of the Bank's liability in respect of derivatives, including embedded derivatives separated from hybrid financial instruments, designated as hedging instruments in hedge accounting.
| 92 |
| |
• Debt Instruments Eligible to Compose Capital: financial instruments issued by other entities, such as shares, with the nature of equity instruments for the issuer, except investments in subsidiaries, jointly controlled entities or associates.
V. Funding, debt notes issued and other liabilities
Funding debt rates and other liabilities Instruments are recognized initially at fair value, considered primarily as the transaction price. They are measured at amortized cost and its expenses are recognized as a financial cost.
Among the liabilities initial recognition methods, it is important to emphasize those compound financial instruments which are classified as such due to the fact that the instruments contain both, a debt instrument (liability) and an embedded equity component (derivative).
The recognition of a compound instrument consists of a combination of (i) a main instrument, which is recognized as an entity’s genuine liability (debt) and (ii) an equity component (derivative convertible into ordinary share).
The issue of "Notes" must be registered in specific heading liabilities and updated according to the agreed rates and adjusted by the effect of exchange rate variations, when denominated in foreign currency. All remuneration related to these instruments, such as interest and Exchange variation (difference between the functional currency and the currency in which the instrument was named) shall be recognized as expenses for the period, according to the accrual basis.
The relevant detail sanding of these eligible debt instruments to capital is described in note 19 of our Financial Statements.
VI. Measurement of financial assets and liabilities and recognition of fair value changes
In general, financial assets and liabilities are initially recognized at fair value which, in the absence of evidence to the contrary, is deemed to be the transaction price. Financial instruments not measured at fair value through profit or loss, are adjusted by the transaction costs. Financial assets and liabilities are subsequently measured at each period-end as follows:
i. Measurement of financial assets
Financial assets are measured at fair value, without deduction of estimated costs of transaction that may be incurred on their disposal, except for loans and receivables, held-to-maturity investments, equity instruments whose fair value cannot be determined in a sufficiently objective manner and financial derivatives that have as equity instruments subject and are settled by delivery of those instruments.
| 93 |
| |
The fair value of a financial instrument on a given date is taken to be the price that would be received to sell an asset or paid to transfer a liability in an orderly transaction between market participants. The most objective and common reference for the fair value of a financial instrument is the price that would be paid for it on an active, transparent and deep market (quoted price or market price).
If there is no market price for a given financial instrument, its fair value is estimated on the basis of valuation techniques commonly used by market participants, according to the specific features of the instrument to be measured and, particularly, the various types of risk associated with it.
All derivatives are recognized in the balance sheets at fair value from the trade date. If the fair value is positive, they are recognized as assets and if the fair value is negative, they are recognized as liabilities. The changes in the fair value of derivatives from the trade date are recognized in “Gains (losses) on financial assets and liabilities” in the consolidated income statement. Specifically, the fair value of standard financial derivatives included in the portfolios of financial assets or liabilities held for trading is deemed to be their daily quoted price and if, for exceptional reasons, the quoted price cannot be determined on a given date, these financial derivatives are measured using methods similar to those used to measure over the counter “OTC” derivatives.
The fair value of OTC derivatives is taken to be the sum of the future cash flows arising from the instrument, discounted to present value at the date of measurement (“present value” or “theoretical close”) using valuation techniques commonly used by market participants: “net present value” (NPV), option pricing models and other methods.
“Financial Assets Measured At Amortized Cost” and “Held-to-maturity investments” are measured at amortized cost using the effective interest method. “Amortized cost” is the acquisition cost of a financial asset or liability plus or minus, as appropriate, the principal repayments and the cumulative amortization (taken to the income statement) between the difference of the initial cost and the maturity amount. In the case of financial assets, amortized cost furthermore includes any reductions for impairment or uncollectibility. In the case of loans and receivables hedged in fair value hedges, the changes in the fair value of these assets related to the risk or risks being hedged are recognized.
The “effective interest rate” is the discount rate that exactly matches the initial amount of a financial instrument to all its estimated cash flows of all kinds over its remaining life. For fixed rate financial instruments, the effective interest rate coincides with the contractual interest rate established on the acquisition date plus, where applicable, the fees and transaction costs that, because of their nature, form part of their financial return. In the case of floating rate financial instruments, the effective interest rate coincides with the rate of return prevailing in all connections until the next benchmark interest reset date.
| 94 |
| |
Equity instruments whose fair value cannot be determined in a sufficiently objective manner are measured at acquisition cost adjusted, where appropriate, by any related impairment loss.
Equity instruments whose fair value cannot be calculated in a sufficiently objective manner are measured at acquisition cost, adjusted, as the case may be, to the related impairment losses.
The amounts at which the financial assets are recognized represent, in all material respects, the Bank’s maximum exposure to credit risk at each reporting date. Also, the Bank has received collateral and other credit enhancements to mitigate its exposure to credit risk, which consist mainly of mortgage guarantees, cash collateral, equity instruments and personal security, assets leased out under leasing and renting agreements, assets acquired under repurchase agreements and securities loans and derivatives.
ii.Measurement of financial liabilities
In general, financial liabilities are measured at amortized cost, as defined above, except for those included under “Financial Assets Measured At Fair Value Through Profit Or Loss” and financial liabilities designated as hedge items (or hedging instruments) in fair value hedges, which are measured at fair value.
iii.Recognition of changes in fair value
As a general rule, changes in the carrying amount of financial assets and liabilities are recognized in the consolidated income statement, distinguishing between those arising from the accrual of interest and similar items -which are recognized under “Interest and similar income” or “Interest expense and similar charges”, as appropriate - and those arising for other reasons, which are recognized at their net amount in the heading “Gains (losses) on financial assets and liabilities (net)”.
Adjustments due to changes in fair value arising from Available-for-sale financial assets are recognized temporarily in equity in the heading “Other Comprehensive Income”. Items charged or credited to this account remain in the Bank’s consolidated equity until the related assets are written-off, whereupon they are charged to the consolidated income statement.
iv. Hedging transactions
The consolidated entities use financial derivatives for the following purposes: i) to provide these instruments to clients who request them in the management of their market and credit risks; ii) to use these derivatives in the management of the risks of the Bank entities' own positions and assets and liabilities (“hedging derivatives”); and iii) to obtain gains from changes in the prices of these derivatives (“financial derivatives”).
| 95 |
| |
Financial derivatives that do not qualify for hedge accounting are treated for accounting purposes as trading derivatives.
A derivative qualifies for hedge accounting if all the following conditions are met:
1. The derivative hedges one of the following three types of exposure:
a. Changes in the fair value of assets and liabilities due to fluctuations, among other, in the interest rate and/or exchange rate to which the position or balance to be hedged is subject (“fair value hedge”);
b. Changes in the estimated cash flows arising from financial assets and liabilities, commitments and highly probable forecast transactions (“cash flow hedge”);
c. The net investment in a foreign operation (hedge of a net investment in a foreign operation).
2. It is effective in offsetting exposure inherent in the hedged item or position throughout the expected term of the hedge, which means that:
a. At the date of arrangement the hedge is expected, under normal conditions, to be highly effective (prospective effectiveness).
b. There is sufficient evidence that the hedge was actually effective during the whole life of the hedged item or position (retrospective effectiveness).
3. There must be adequate documentation evidencing the specific designation of the financial derivative to hedge certain balances or transactions and how this effective hedge was expected to be achieved and measured, provided that this is consistent with the Bank’s management of own risks.
The changes in value of financial instruments qualifying for hedge accounting are recognized as follows:
a. In fair value hedges, the gains or losses arising on both the hedging instruments and the hedged items (attributable to the type of risk being hedged) are recognized directly in the consolidated income statement.
b. In cash flow hedges, the effective portion of the change in value of the hedging instrument is recognized temporarily in equity under “Other comprehensive Income - Cash flow hedges” until the forecast transactions occur, when it is recognized in the consolidated income statement, unless, if the forecast transactions result in the recognition of non-financial assets or liabilities, it is included in the cost of the non-financial asset or liability. The ineffective portion of the change in value of hedging derivatives is recognized directly in the consolidated income statement.
| 96 |
| |
c. The ineffective portion of the gains and losses on the hedging instruments of cash flow hedges and hedges of a net investment in a foreign operation are recognized directly under “Gains (losses) on financial assets and liabilities (net)” in the consolidated income statement.
If a derivative designated as a hedge instrument no longer meets the requirements described above due to expiration, ineffectiveness or for any other reason, the derivative is classified as a derivative measured at fair value through profit or loss.
When fair value hedge accounting is discontinued (expired, sold our no longer meet hedge accounting criteria) the adjustments previously recognized on the hedged item are transferred to profit or loss at the effective interest rate re-calculated at the date of hedge discontinuation. The adjustments must be fully amortized at maturity.
When cash flow hedges are discontinued, any cumulative gain or loss on the hedging instrument recognized in equity in the heading "Other comprehensive Income” (from the period when the hedge was effective) remains recognized in equity until the forecast transaction occurs at which time it is recognized in profit or loss, unless the transaction is no longer expected to occur, in which case any cumulative gain or loss is recognized immediately in profit or loss.
For the accounting and disclosure of the hedge accounting structures as of December 31, 2019, the bank used the faculty of IFRS 9, to maintain the practices determined by IAS 39.
VII. Settlement of financial assets and liabilities
The Bank derecognizes a financial asset when the contractual rights to the cash flows of the asset expire or when it transfers the rights to the receipt of the contractual cash flows in a transaction in which essentially all the risks and benefits of ownership of the financial asset are transferred or in which the Bank does not transfer or retain substantially all the risks and rewards of ownership of the financial asset and does not control the financial asset.
The difference between the carrying amount of the asset (or book value allocated to the portion of the asset disposed) and the sum (i) of the consideration received (including any new assets obtained, less any new liabilities assumed) and (ii) any accumulated gains or losses recognized in "Other Comprehensive Income" is recorded in the income statement.
As from the date of the adoption of IFRS, mentioned above, any accumulated gains / losses recognized in "Other Comprehensive Income" in relation to equity instruments designated at fair value through Other Comprehensive Income are not recorded in the statement of income through the write-off of these securities.
| 97 |
| |
The Bank carries out transactions in which it transfers the assets recognized in its balance sheet, but maintains all or substantially all the risks and benefits of the assets transferred or part thereof. In these cases, the transferred assets are not written off. Examples of such operations include assignments of co-sponsored loan portfolios.
In operations in which the Bank does not retain or transfer substantially all the risks and rewards of ownership of a financial asset and hold control of the asset, the Bank continues to recognize the asset in the extent of its continued involvement, determined by the extent to which it is exposed to changes in the value of the transferred asset.
VII. Offsetting of financial instruments
Financial asset and liability balances are offset (i.e. reported in the consolidated balance sheets at their net amount) only if the Bank and their subsidiaries currently have a legally enforceable right to set off the recognized amounts and intend either to settle on a net basis, or to realize the asset and settle the liability simultaneously.
Offsetting Agreements and Obligations Settlement (CMN Resolution 3.263/2005) - The Bank has an agreement for the clearing and settlement of obligations under the National Financial System (SFN), signed with individuals and legal entities, whether or not members of the SFN, resulting in higher financial settlement guarantee, with the parties that have this modality of agreement. These agreements establish that payment obligations to Banco Santander arising from credit and derivative operations, in the event of default by the counterparty, will be offset against Banco Santander's payment obligations with the counterparty.
(i) Impairment of financial assets
i. Definition
A financial asset is considered impaired when there is objective evidence that events have occurred which:
• Give rise to an adverse impact on the future cash flows that were estimated at the transaction date, in the case of debt instruments (loans and debt securities);
• In the case of equity instruments, mean that their carrying amount may not be fully recovered.
• Arising from the violation of terms of loans, and
• During the Bankruptcy process.
As a general rule, the adjustment of the value of the impaired financial instruments is recognized in the consolidated income statement for the period in which the impairment becomes evident, and the reversal, if any, of previously recognized impairment loss is recognized in the consolidated income statement for the period in which the impairment is reversed or reduced.
| 98 |
| |
ii. Debt instruments carried at amortized cost
The amount of an impairment loss incurred for determination of the recoverable amount on a debt instrument measured at amortized cost is equal to the difference between its carrying amount and the present value of its estimated future cash flows (excluding future credit losses that have not been incurred) discounted the original effective interest rate of the financial asset (or the effective interest rate computed at initial recognition), and is presented as a reduction of the asset balance and recorded in income statements.
In estimating the future cash flows of debt instruments the following factors are considered:
• All the amounts that are expected to be obtained over the remaining life of the instrument, in this case, the provided guarantees. The impairment loss considers the likelihood of collecting accrued interest receivable.
• The various types of risk to which each instrument is subject; and
• The circumstances in which collections will foreseeably be made.
These cash flows are discounted using the instrument's effective interest rate.
Specifically, in regards to recoverable amount losses resulting from materialization of the insolvency risk of the obligors (credit risk), a debt instrument is impaired due to insolvency when there is evidence of a deterioration of the obligor's ability to pay, either because it is in arrears or for other reasons.
The Bank has certain policies, methods and procedures for covering its credit risk arising from insolvency allocable to counterparties.
These policies, methods and procedures are applied in the granting, in the examination and to document debt instruments, and contingent liabilities and commitments, the identification of their recoverable amount and the calculation of the amounts necessary to cover the related credit risk.
The procedures applied in the identification, measurement, control and reduction of the exposure to credit risk, are based on an individual basis or grouped by similarity.
• Clients with individual management: Wholesale clients, financial institutions and certain companies. Risk management is performed through an analysis complemented by tools to support the decision-making based in internal risk assessment.
| 99 |
| |
• Clients with standardized management: individuals and companies not classified as individual clients. Risk management models based on automated decision-making and risk assessment procedure, complemented, when the model is not comprehensive or accurate enough, by teams of analysts specialized in this type of risk. The credits related to clients standardized, are usually considered not recoverable when they have historical loss experience and delinquency greater than 90 days.
Regarding the provision for impairment losses from credit risk, the Bank evaluates all loans. Loans are either individually or collectively evaluated for impairment. Loans accounted as amortized cost, which are not individually evaluated for impairment, are collectively evaluated for impairment, grouping them considering the similarity of risk. Loans individually evaluated for impairment are not included in balances that are collectively evaluated for impairment.
To measure the impairment loss on loans individually evaluated for impairment, the Bank considers the conditions of the borrower, such as his economic and financial situation, level of indebtedness, ability to generate income, cash flow , management, corporate governance and quality of internal controls, payment history, industry expertise, contingencies and credit limits, as well as characteristics of assets, such as their nature and purpose, type, sufficiency and liquidity level guarantees and total amount of credit, as well as based on historical experience of impairment and other circumstances known at the moment of evaluation.
To measure the impairment loss on loans collectively evaluated for impairment, the Bank segregates financial assets into groups considering the characteristics and similarity of credit risk, in other words, according to segment, the type of assets, guarantees and other factors associated as the historical experience of impairment and other circumstances known at the time of assessment.
In some cases, the observable data required to estimate the amount of an impairment loss on a financial asset may be limited or no longer fully relevant to current circumstances.
In such cases, an entity uses its experienced judgment to estimate the amount of any impairment loss. Similarly, an entity uses its experienced judgment to adjust observable data for a group of financial assets to reflect current circumstances.
The impairment loss is calculated by using statistical models that consider the following factors:
Exposure at default (EAD) is the amount of risk exposure at the date of default by the counterparty. The timing of default is considered in the PD measurement.
In accordance with IFRSs, the exposure at default used for this calculation is the current exposure, as reported in the balance sheets.
| 100 |
| |
• Probability of default, or “PD”, is the probability of the borrower failing to meet its principal and/or interest payment obligations.
PD is measured using a time horizon of one year when the transaction is at stage one or for the life time of the transaction, when the it is at stages 2 or 3; that is, it quantifies the probability of the borrower default. A loan will be defaulted if either the principal or interest become past due by ninety days or more or the loan is active but there are doubts about the solvency of the counterparty (subjective doubtful assets).
• Loss is given default, or “LGD”, is the loss arising in the event of default.
LGD calculation is based on the net charge offs on defaulted loans, considering the guarantees/collateral associated with the loans, the income and expenses associated with the recovery process and the timing of default.
• In addition, prior to loans be written-off (which is only done after the Bank have completed all recovery efforts and after about 360 days late), it is registered fully provision of the loan´s remaining balance so this provision (allowance for loan losses) fully covers the losses. Thus, the Bank that its loan loss allowance methodology has been developed to meet its risk metrics and capture loans that could potentially become impaired.
iii. Debt or equity instruments classified as financial assets measured at fair value through other comprehensive income
The difference between the amortized cost and fair value of debt or equity instruments classified as available for sale are recorded in equity under "Other Comprehensive Income.”
When there is objective evidence that the aforementioned differences are due to a prolonged decline in fair value, they are no longer recognized in equity and are reclassified, at the cumulative amount at that date, to the consolidated income statement. Losses from a prolonged decline in fair value relating to an investment in equity instruments are not reversed in subsequent periods.
IX. Repurchase agreements
Purchases (sales) of financial instruments under a non-optional resale (repurchase) agreement at a fixed price (repos) are recognized in the consolidated financial statements as financing granted (received), based on the nature of the debtor (creditor), under Loans and advances with Bacen, Loans and advances to credit institutions or Loans and advances to clients (Deposits from Bacen, Deposits from credit institutions or Client deposits).
Differences between the purchase and sale prices are recognized as interest over the duration of the contract.
| 101 |
| |
X. Leasing accounting
| i. | Financial leases |
Financial leases, until December 31, 2018, are leases that transfer substantially all the risks and rewards incidental to ownership of the leased asset to the lessee. From January 1, 2019, see note 1.c.1 of our Financial Statements.
When the consolidated entities act as the lessors of an asset, the sum of the present value of the lease payments receivable from the lessee, including the exercise price of the lessee’s purchase option at the end of the lease term when such exercise price is sufficiently below fair value at the option date such that it is reasonably certain that the option will be exercised, is recognized as lending to third parties and is therefore included under Financial Assets Measured At Amortized Cost in the consolidated financial statements.
The finance income arising from these contracts is credited in the heading “Interest and similar income” in the consolidated income statement in order to achieve a constant rate of return over the deadline of the lease.
XI. Non-current assets held for sale
“Impairment losses” includes the carrying amount of individual items or disposal groups or items forming part of a business unit earmarked for disposal (“Discontinued operations”), whose sale in their present condition is highly probable and is expected to occur within one year, the property or other non-current assets received by the consolidated entities as total or partial settlement of their debtors' payment obligations to them are deemed to be non-current assets held for sale through the completion of actions which normally occurs up to one year.
Non-current assets held for sale are measured at the lower of fair value less costs to sell and their carrying amount at the date of classification in this category. These assets held for sale are not depreciated.
Impairment losses on an asset or disposal group arising from a reduction in it carrying amount to its fair value (less costs to sell) are recognized in the heading “Gains (losses) on disposal and expenses of non-current assets held for sale not classified as discontinued operations” in the consolidated income statement. The gains on a non-current asset held for sale resulting from subsequent increases in fair value (less costs to sell) increase it carrying amount and are recognized in the consolidated income statement up to an amount equal to the impairment losses previously recognized.
| 102 |
| |
XII. Residual maturity periods and average interest rates
The analysis of the maturities of the balances of certain items in the consolidated financial statements at December 31, 2020, 2019 and 2018 is provided in note 43-d of our Financial Statements.
XIII. Tangible asset
“Tangible assets” includes the amount of buildings, land, furniture, vehicles, computer hardware, right-of-use of assets and other fixtures owned by the Bank, including tangible assets received by the Bank in full or partial satisfaction of financial assets representing receivables from third parties which are intended to be held for continuing use and tangible assets acquired under finance leases are presented at acquisition cost, less the related accumulated depreciation and any impairment losses (net carrying amount higher than recoverable amount).
Depreciation is calculated, using the straight-line method, on the basis of the acquisition cost of the assets less their residual value. The land on which the buildings and other structures are located has an indefinite life and, therefore, it is not depreciated.
The tangible asset depreciation charge is recognized in the consolidated income statement and is calculated basically using the following depreciation rates (based on the average years of estimated useful life of the various assets):
| Annual Rate | |||||||||||
| Buildings for own use | 4% | ||||||||||
| Furniture | 10% | ||||||||||
| Fixtures | 10% | ||||||||||
| Office and IT equipment | 20% | ||||||||||
| Leasehold improvements | 10% or up to contractual maturity | ||||||||||
The Bank assesses at end of each reporting period, if there is indication that the items of tangible assets carrying amount may be impaired, that is if there is an asset with it carrying amount bigger than its recoverable amount, either for use or sale.
Once an impairment loss of tangible assets is identified, it is adjusted to reach its recoverable amount by recognizing an impairment loss recorded in the heading "Impairment loss on other assets (Net)". Additionally, the value of depreciation of that asset is recalculated in order to adjust the value of the life of the asset.
In case of evidence or indication of a recovery of a tangible asset value, the Bank recognizes the reversal of the impairment loss amount recorded in prior years and should adjust the future depreciation expenses according to the lifetime value of the asset. Under no circumstance, a reversal of impairment loss of an asset will increase it carrying amount higher than the amount that it would have had no impairment loss been recognized in prior years.
| 103 |
| |
Upkeep and maintenance expenses relating to property, plant and equipment for own use are recognized as an expense in the period in which they are incurred.
XIV. Intangible assets
Intangible assets are identifiable non-monetary assets (separable from other assets) without physical substance which arise as a result of a legal transaction or software development. Only assets whose cost can be estimated reliably and from which the consolidated entities consider it probable that future economic benefits will be generated are recognized.
Intangible assets are recognized initially at acquisition or production cost and are measured deducting any accumulated amortization and any accumulated impairment losses.
i. Goodwill
In the acquisition and/or merger of investment in subsidiary, any difference between the investment cost and the investor's share in net fair value of assets, liabilities and contingent liabilities of the investee (subsidiary or affiliate) is accounted for in accordance with IFRS 3 "Business Combination ".
Goodwill is only recognized when it has been acquired for consideration and represents, therefore, a payment made by the acquirer in anticipation of future economic benefits from assets of the acquired entity that are not capable of being individually identified and separately recognized.
On an annual basis or whenever there is any indication of impairment goodwill is reviewed for impairment (i.e. a reduction in its recoverable amount to below it carrying amount) and, if there is any impairment, the goodwill is written down with a charge to Impairment on non-financial assets (net) - Intangible assets in the consolidated income statement.
The net fair value adjustments of assets, liabilities and contingent liabilities of the investee in relation to their carrying amount are allocated to individual identifiable assets acquired and liabilities assumed that comprise them based on their respective fair values at the date of purchase.
In the case of a business combination made in stages, prior interest in the acquired is measured again at fair value at the acquisition date when control of the acquired is obtained.
ii. Other intangible assets
Other intangible assets are non-monetary assets without physical substance. Generally arising from software development and acquisition of rights that can generate benefits for the Bank. They can have characteristics of definite or indefinite period.
| 104 |
| |
Other intangible assets can have an indefinite useful life -when, based on an analysis of all the relevant factors, it is concluded that there is no foreseeable limit to the period over which the asset is expected to generate net cash inflows for the consolidated entities- or a finite useful life, in all other cases.
Intangible assets with indefinite useful lives are not amortized. At the end of each accounting period the entity reviews the intangible asset classification as with indefinite useful live, in case this classification is maintained these assets are subject to annual impairment test (IAS36).
Intangible assets with finite useful lives are amortized over those useful lives using methods similar to those used to depreciate tangible assets. The amortization expense is recognized under "Depreciation and amortization" in the consolidated income statement.
The Bank assesses at the end of each period, if there is any indication that the items of intangible assets may present an impairment loss, i.e. an asset that presents the carrying amount higher than the net realizable value. After identifying any reduction in impairment loss, it is adjusted to reach its fair value.
Measurement of the recoverable amount of other intangible assets - software is made based on the value in use, as well as the analysis of the discontinuity of the asset in relation to the activities of the Bank.
Expenditures for acquisition and development of software are amortized over a maximum period of 5 years.
XV. Other assets
Other Assets include the balances of all prepayments and accrued income (excluding accrued interest), acquired client list, the net amount of the difference between pension plan obligations and the fair value of the plan assets with a balance on the entity’s behalf, when this net amount shall be disclosed in the consolidated financial statements, and the amount of any other assets not included in other items.
The Bank uses the value in use of client relationship as a basis for measuring the impairment since it is not reasonably possible to determine the net value of sales, because there is no basis for making a reliable estimate of the value to be obtained by selling the asset in a transaction at cumulative basis, between knowledgeable, willing parties. The value in use of client lists acquired related to the purchase of the "payroll" will be determined individually. An analysis that aims to demonstrate the expectation of generating future economic benefit and the present value of expected cash flows is prepared by the business areas. Quarterly, these analyses are reviewed based on the actual cash flows of each business (value in use), which are compared with the carrying amount, checking whether there is a need to record a loss on non-recoverability.
| 105 |
| |
XVI. Liabilities for insurance contracts
The liabilities for insurance contracts are comprised substantially by actuarial provisions for current and future benefits (PMBaC and PMBC). Insurance contracts are contracts under which the Bank accepts a significant risk, other than a financial risk, from a policyholder by agreeing to compensate the beneficiary on the occurrence of an uncertain future event by which the policyholder will be adversely affected.
Insurance liabilities are recognized when the contract is entered into and the premiums are charged. Contracts that have been classified as insurance are not reclassified. The liability is derecognized when the contract expires or is cancelled.
All valuation methods used by the subsidiaries are based on the general principle that the carrying amount of the net liability must be sufficient to meet any reasonably foreseeable obligation resulting from the insurance contracts. Investment assumptions are either determined by the local regulator and based on management’s future expectations. In the latter case, the anticipated future investment yield is set by management, considering the available market information and economic indicators. A significant assumption related to estimated gross profits on variable annuities, is the annual long-term growth rate of the underlying assets.
At each financial statement date an assessment is made in order to verify whether the actuarial provisions are adequate.
In the years ended December 31, 2020, 2019 and 2018, as determined by IFRS 4 - Contracts classification and subsequent amendments, the adequacy of the technical provisions constituted were evaluated through Liability Adequacy Test (LAT).
At December 31, 2020, the LAT indicated the need for the additional constitution of technical provisions amounted to R$285,554 (12/31/2019 - R$357,539 and 12/31/2018 - R$215,754) for Indemnity Funds for Benefit (FGB) plans.
XVII. Provisions for legal and administrative proceedings, commitments and other provisions
Banco Santander and its subsidiaries are involved in lawsuits and administrative proceedings related to tax, labor and civil, in the normal course of their activities.
The provisions include legal obligations, lawsuits and administrative proceedings related to tax and social security obligations, whose object is to challenge their legality or constitutionality, regardless of the assessment that the probability of success, the amounts are fully recognized in the financial statements.
| 106 |
| |
Provisions are reviewed at each financial statement date and adjusted to reflect the current best estimate and may be fully or partially reversed or reduced when the outflows of resources and obligations relevant to the process are no longer probable, including decay of legal deadlines, among others.
Provisions for the lawsuits and administrative proceedings are recorded when their risk of loss is considered probable and the amounts can be reliably measured, based on the nature, complexity and history of lawsuits, the legal opinion of the internal and external advisors, based on the best available information. For those lawsuits for which the risk of loss is possible, are not recorded and the information is disclosed in the financial statements and for the lawsuits for which the risk of loss is remote, no disclosure is required.
Contingent assets are not recognized, except when there are guarantees or favorable lawsuits decisions, about which features no longer fit, characterizing the gain as practically certain. Assets with probable success, if any, are only disclosed in the financial statements.
On the favorable decisions to Santander, the counterparty has the right, in the event of specific legal requirements, to file a rescission lawsuit within a period determined by current legislation. Rescission lawsuits are considered as new events and will be evaluated for contingent liability purposes if and when they are filed.
XVIII. Other liabilities
“Other liabilities” includes the balance of all accrued expenses and deferred income, excluding accrued interest, and the amount of any other liabilities not included in other categories.
XIX. Share-based compensation
The Bank has long-term compensation plans with vesting conditions. The main vesting conditions are: (1) service conditions, since it is necessary that the participant continues to be employed by the Bank during the term of the Plan for his rights to vest; (2) performance conditions, since the number of Units that ultimately vest will be determined according to the result of certain performance parameter of the Bank, such as: total Shareholder Return (TSR) and may be reduced in case of failure to achieve the goals of reducing the Return on Risk Adjusted Capital (RORAC), comparison between actual and budget in each year, as determined by the Board of Directors and (3) market conditions, since some parameters are linked to the market price of the Bank´s shares. The Bank measures the fair value of the services rendered by reference to the fair value of the equity instruments granted at the grant date, considering the market conditions for each plan when estimating the fair value.
| 107 |
| |
Settlement in Shares
The Bank measures the fair value of the services received by reference to the fair value of the equity instruments granted at the grant date, considering the market conditions for each grant when estimating the fair value. In order to recognize the personnel expenses against equity reserves throughout the vesting period, as the services are received, the Bank considers the treatment of service conditions and recognize the amount for the services received during the vesting period based on the best available estimate of the number of equity instruments expected to vest. Semi-annually, the Bank reviews the estimate of the number of equity instruments expected to vest.
Settlement in cash
For cash-settled share-based compensation (in the form of share appreciation rights), the Bank measures the fair value of services rendered and the corresponding liability incurred, based on the fair value of the share appreciation rights at the grant date and until the liability is settled. The Banks remeasures the fair value of the liability at the end of each reporting period and at the date of settlement, with any changes in fair value recognized in profit or loss for the period. In order to recognize the personnel expenses against a provision in “other liabilities” throughout the vesting period, reflecting the period as the services are received, the Bank bases the total liability on the best estimate of the number of share appreciation rights that will vest at the end of the vesting period and recognizes the amount for the services received during the vesting period based on such best available estimate. Periodically, the Bank reviews such estimate of the number of share appreciation rights that will vest at the end of vesting period.
XX. Recognition of revenue and expenses
The most significant criteria used by the Bank to recognize its income and expenses are summarized as follows:
i. Interest income, interest expenses and similar items
Interest income, interest expenses and similar items are generally recognized on an accrual basis using the effective interest method.
ii. Commissions, fees and similar items
Fees and commission income and expenses are recognized in the income statement using criteria that vary according to their nature (note 34 of our Financial Statements). The main criteria are as follows:
• Fee and commission income and expenses relating to financial assets and financial liabilities measured at fair value through profit or loss are recognized when paid;
| 108 |
| |
• Those arising from transactions or services that are performed over a period of time are recognized over the life of these transactions or services; and
• Those relating to services provided in a single act are recognized when the single act has been performed.
iii.Non-financial income and expenses
They are recognized for accounting purposes by the competency regime.
iv.Deferred collections and payments
These are recognized for accounting purposes at the amount resulting from discounting the expected cash flows at market rates.
v. Loan arrangement fees
Loan arrangement fees, mainly loan origination and application fees, are accrued and recognized in the income statement over the term of the loan. In the case of loan origination fees, the portion relating to the associated direct costs incurred in the loan arrangement is recognized immediately in the consolidated income statement.
XXI. Guarantees
i.Financial Guarantees
“Financial guarantees” are defined as contracts whereby an entity undertakes to make specific payments for a third party if the latter does not do so, irrespective of the various legal forms they may have, such as guarantees, irrevocable documentary credits issued or confirmed by the entity, among others.
The Bank initially recognizes the commission of the financial guarantees as liability in the consolidated financial statements at fair value, which is generally the present value of the fees, commissions and similar interest receivable from these contracts over their term.
Financial guarantees, regardless of the guarantor, type of instrument or other circumstances, are reviewed periodically so as to determine the credit risk to which they are exposed and, if appropriate, to consider whether a provision is required. The credit risk is determined by application of criteria similar to those established for quantifying impairment losses on debt instruments measured at amortized cost.
The provisions made for these transactions are recognized in the heading “Provisions - Provisions for contingent liabilities, commitments and other provisions” in the consolidated financial statements (note 22 of our Financial Statements).
| 109 |
| |
If a specific provision is required for financial guarantees, the related unearned commissions are recognized in the heading “Financial liabilities at amortized cost – Other financial liabilities” in the consolidated financial statements are reclassified to the appropriate provision.
ii.Guarantees and Credit Risk Mitigation Policy
Banco Santander controls the credit risk using the collateral in its operations. Each business unit is responsible for credit risk management and formalizes the use of collateral in its lending policies.
Banco Santander uses guarantees in order to increase its ability to recover operations subject to credit risk. The guarantees can be fiduciary, real, legal structures with power mitigation and compensation agreements. Annually the bank reviews its guarantees policies to capture changes in the market, in the characteristics of the assets given as guarantees and the conditions of the assets, these are examples of technical parameters reviewed.
Credit limits are continually monitored and changed in client behavior function. Thus, the potential loss values represent a fraction of the amount available.
XXII. Assets under management and investment and pension funds managed by the Company
Assets owned by third parties and managed by the consolidated entities are not presented in the consolidated financial statements. Management fees are included in “Fee and commission income” in the consolidated income statement. Note 43-b contains information on the third-party assets managed by the Bank.
The investment funds and pension funds managed by the consolidated entities are not recorded in the consolidated financial statements since the related assets are owned by third parties. The fees and commissions earned in the year for the services rendered by the Bank entities to these funds (asset management and custody services) are recognized in the heading “Fee and commission income” in the consolidated income statement.
XXIII. Post-employment benefits
Post-employment benefit plans include the commitments of the Bank: (i) addition to the benefits of public pension plan; and (ii) healthcare in case of retirement, permanent disability or death for those employees, and their direct beneficiaries.
Defined contribution plans
Defined contribution plans are the post-employment benefit plan which the Bank, and its subsidiaries, as the sponsoring entity pays fixed contributions into a pension fund, not having a legal or constructive obligation to pay further contributions if the fund does not hold sufficient assets to pay all benefits relating to services provided in the current and in previous periods.
| 110 |
| |
The contributions made are recognized in the heading "Interest Expense and Similar Charges" in the income statement.
Defined benefit plans
Defined benefit plan is the post-employment benefit plan which is not a defined contribution plan and is shown in Note 21. For this type of plan, the sponsoring entity's obligation is to provide the benefits agreed with the former employees, assuming the potential actuarial risk that benefits will cost more than expected.
For defined benefit plan, the amendment of IAS 19 established fundamental changes in the accounting for and disclosure of employee post-employment benefits such as removing the corridor approach in the accounting for the obligation of the plans, as well as changes in the criteria for recognition of conventional interest of plan assets (valuation based on the discount rate actuarial liability).
In addition, there is full recognition in liabilities heading of actuarial losses (actuarial deficit) not recognized previously when they occur, which its counterparty is a heading in the stockholders’ equity (Other Comprehensive Income).
Main Definitions
- The present value of the defined benefit obligation is the present value without any deduction from the plan assets, of expected future payments required to settle the obligation resulting from employee service in the current and past periods.
- Deficit or surplus is: (a) the present value of the defined benefit obligation, less (b) the fair value of plan assets.
- The sponsoring entity may recognize the plan assets in the financial statements when they meet the following characteristics: (i) the fund assets are sufficient to meet all employee benefit plan or the sponsor obligations; or (ii) the assets are returned to the sponsoring entity in order to reimburse it for employee benefits already paid.
- Actuarial gains and losses correspond to changes in the present value of defined benefit obligation resulting from: (a) adjustments by experience (the effects of differences between the actuarial assumptions adopted and what has actually occurred); and (b) effects of changes in actuarial assumptions.
- Current service cost is the increase in the present value of the defined benefit obligation resulting from employee service provided in the current period.
- The past service cost is the change in present value of defined benefit obligation for employee service provided in prior periods resulting from a change in the plan or reductions in the number of employees covered.
| 111 |
| |
Post-employment benefits are recognized in income in the headings "Interest expense and similar Charges" and "Provisions (net)".
The defined benefit plans are recorded based on an actuarial study, conducted annually by an external consulting firm, at the end of each year to be effective for the subsequent period.
XXIV. Other long-term employee benefits
“Other long-term employee benefits”, defined as obligations to early retirees considered as those who have ceased to render services at the entity but who, without being legally retired, continue to have economic rights relating to the entity until they acquire the legal status of retiree, long-service bonuses, obligations for death of spouse or disability before retirement that depend on the employee's length of service at the entity and other similar items, are treated for accounting purposes, where applicable, as established above for defined benefit post-employment plans, except that all past service costs and actuarial gains and losses are recognized immediately (note 21 of our Financial Statements).
XXV. Termination benefits
Termination benefits are recognized when there is a detailed formal plan identifying the basic changes to be made, provided that implementation of the plan has begun, its main features have been publicly announced or objective facts concerning its implementation have been disclosed.
XXVI. Income taxes (IRPJ), Social Contribution (CSLL), Social Integration Program (PIS) and Tax for Social Security Financing (COFINS)
Income tax expense is obtained by adding the Income Tax, Social Contribution, PIS and COFINS. Current Income Tax and Social Contribution result from the application of the respective rates on taxable income, and the PIS and COFINS rates applied on the respective calculation basis provided for in the specific legislation, added also with changes in deferred tax assets and liabilities recognized in the consolidated income statement. The CSLL rate, for banks of any kind, was increased from 15% to 20% effective as of March 1, 2020, pursuant to Article 32 of Constitutional Amendment 103, published on November 13, 2019.
Income tax is calculated at the rate of 15% plus a surcharge of 10% levied on the profit, after adjustments determined by tax legislation. The social contribution (CSLL) is calculated at the rate of 20% for financial institutions (15% up to August 2015) and 9% for other companies, levied on the profit, after considering the adjustments determined by tax legislation. The CSLL rate, for banks of any kind, was increased from 15% to 20% effective as of March 1, 2020, pursuant to article 32 of Constitutional Amendment 103, published on November 13, 2019.
| 112 |
| |
The expense for corporate income tax is recognized in the consolidated income statement, except when it results from a transaction recognized directly in equity, in which case the tax effect is also recognized in equity.
The current income tax expense is calculated as the sum of the current tax resulting from application of the appropriate tax rate to the taxable profit for the year (net of any deductions allowable for tax purposes), and of the changes in deferred tax assets and liabilities recognized in the consolidated income statement.
Tax assets classified as "Current" are amounts of tax to be recovered within the next twelve months.
Tax liabilities includes the amount of all tax liabilities (except provisions for taxes), which are broken down into “current” amount payable in respect of the income tax on the taxable profit for the year and other taxes in the next twelve months.
Deferred tax assets and liabilities include temporary differences, which are identified as the amounts expected to be payable or recoverable on differences between the carrying amounts of assets and liabilities and their related tax bases, and tax loss and tax credit carry forwards. These amounts are measured at the tax rates that are expected to apply in the period when the asset is realized or the liability is settled.
Deferred tax assets are only recognized as temporary differences to the extent that it is considered probable that the consolidated entities will have sufficient future taxable profits against which the deferred tax assets can be utilized, and the deferred tax assets do not arise from the initial recognition (except in a business combination) of other assets and liabilities in a transaction that affects neither taxable profit or accounting profit. Other deferred tax assets (tax loss and tax credit carry forwards) are only recognized if it is considered probable that the consolidated entities will have sufficient future taxable profits against which they can be utilized.
Due to the change in social contribution tax rate, the group companies made the remeasurement of tax credit assets and deferred liabilities at the rates applicable to the period in which estimates the realization of assets and settlement of liabilities.
Income and expenses recognized directly in stockholder’s equity are accounted as temporary differences.
The deferred tax assets and liabilities recognized are reassessed at each financial statement date in order to ascertain whether they still exist, and the appropriate adjustments are made on the basis of the findings of the analyses performed.
Under the current regulation, the expected realization of tax credits is based on the Bank's projections of future results and on technical technical analysis of the realization of the temporary differences, as shown in Note 23 of our Financial Statements.
PIS (Social Integration Program) and COFINS (Tax for Social Security Financing) have been computed at a combined rate of 4.65% on certain gross revenues and expenses. Financial institutions may deduct financial expenses in determining the PIS/COFINS tax basis. PIS and COFINS are considered a profit-base component (net basis of certain revenues and expenses), therefore and accordingly to IAS 12 it is recorded as income taxes.
| 113 |
| |
• IFRIC 23 - Published in June 2017 by the IASB, IFRIC 23 - Uncertainty over Income Tax Treatments on Profit has mandatory application as of January 1, 2019 and aims to clarify procedures for the application of recognition and measurement requirements established in the IAS 12 of Taxes on Profit when there is uncertainty about the treatments to be adopted for the Taxes on Profit.
The Bank carried out analyzes on the procedures already adopted for accounting and presentation of Income Taxes in relation to the content of IFRIC 23 and it was possible to conclude that there are no impacts on related measurements nor disclosures.
XXVII. Consolidated cash flow statements
The following terms are used in the consolidated cash flow statements with the following meanings:
• Cash flows: inflows and outflows of cash and cash equivalents, which are short-term, highly liquid investments that are subject to an insignificant risk of changes in value and original maturity of three months or less.
• Operating activities: the primary revenue-generating activities of credit institutions and other activities that are not investing or financing activities.
• Investing activities: the acquisition and disposal of long-term assets and other investments not included in cash and cash equivalents.
• Financing activities: activities that result in changes in the size and composition of the equity and liabilities that are not operating activities.
In preparing the consolidated cash flows statement, the high liquidity investments with insignificant risk of changes in their values were classified as "Cash and cash equivalents". The Bank classifies as cash and cash equivalents balances recorded in the headings "Cash and balance with the Brazilian Central Bank" and "Loans and amounts due from credit institutions" in the consolidated financial statements, except restricted resources and long-term transactions.
The interest paid and received correspond to operating activities of Banco Santander.
| 114 |
| |
10.6. Officers description of relevant items not evidenciated in the financial statements of the Company:
a. the assets and liabilities held by the issuer, directly or indirectly, which are not shown in its balance sheet (off-balance sheet items), such as:
i. commercial operating leases, assets and liabilities
As of December 31, 2020, we owned leased properties, mainly used with branches, based on a standard contract, which can be cancelled at our will and includes the right of renewal option and adjustment clauses, framed in the concept of operational lease. The total future minimum payments of non-cancelable operating market leases as of December 31, 2020 is R$2,450 million, of which R$671 million in up to 1 year, R$1,608 million between 1 and 5 years and R$171 million over 5 years. Additionally, we have contracts with a term of indetermined, in the amount of R$ 880,000 corresponding to the monthly rent of contracts with this characteristic. Operating lease payments, recognized as expenses in 2020, were R$359 million.
The rental contracts will be adjusted annually, according to current legislation, and the highest percentage is according to the variation of the Índice Geral de Preços do Mercado (IGPM). The lessee is guaranteed the right to unilaterally terminate this contract at any time, in accordance with contractual clauses and legislation in force.
ii. written-off receivables portfolios in relation to which the entity is exposed to risks and responsibilities, indicating the respective liabilities
Not Not applicable, since there are no such assets off balance sheet.
iii. agreements for future purchase and sale of products or services
Not applicable, since there are no such assets off balance sheet.
iv. unfinished construction contracts
Not applicable, since there are no such assets off balance sheet.
v. agreements for future receivables from loans
Not applicable, since there are no such assets off balance sheet.
b. other items not evidenced in the financial statements
We offer a number of guarantees for our clients to improve their credit position and allow them to be able to compete. As required, the "Maximum potential value of future payments" represents the listed amounts that could be lost if there was total default of the endorsed parties, without considering possible recoveries of guarantees held or provided, or recoveries on appeal.
| 115 |
| |
There is no relationship between these values and the probable losses on these guarantees.
In fact, the "Maximum potential value of future payments" significantly exceeds the inherent losses.
The following table presents all guarantees as at 31 December 2020, 2019 and 2018.
| In R$ million | 2020 | 2019 | 2018 |
| Maximum potential value of future payments | |||
| Contingent liabilities | |||
| Guarantees and other guarantees | 43,930 | 41,870 | 39,082 |
| Financial Guarantees | 32,447 | 29,397 | 27,216 |
| Performance Guarantees | 990 | 1,009 | 908 |
| Financial letters of credit | 12,408 | 11,388 | 10,860 |
| Others | 55 | 76 | 97 |
| Other contingent exposures | 2,352 | 2,443 | 3,178 |
| Documentation credits | 2,352 | 2,443 | 3,178 |
| Total contingent liabilities | 48,282 | 44,313 | 42,260 |
The investment funds that are under our management and that are not recorded in our balance sheet are detailed in the table below:
| In R$ million | 2020 | 2019 | 2018 |
| Managed funds | 2,716 | 2,035 | 1,897 |
| Total | 2,716 | 2,035 | 1,897 |
Finally, we have in our custody third-party securities and securities in the total amount of R$35,519 million in 2020, R$27,284 million in 2019 and R$3,441million in 2018.
10.7 Comments on items not evinced in the financial statements:
a. how do such items alter or may alter the revenues, expenses, operational result, financial expenses or other items of the financial statements of the Company.
There are no additional effects to be evidenced, except for those presented in Section 10.6 of this document.
b. nature and the purpose of the operation
There are no additional effects to be evidenced, except for those presented in Section 10.6 of this document
| 116 |
| |
c. the nature and amount of obligations assumed and the rights generated in favor of the Company by virtue of the operation.
There are no additional effects to be evidenced, except for those presented in Section 10.6 of this document.
10.8 Officers’ comments and indications of main aspects of the Company’s business plan, exploiting specifically the following items
a. investments, including:
i. quantitative and qualitative description of current and expected investments
The Company's main capital expenditures are composed of investments in information technology. The Company's information technology platform focuses on its customers and supports the Company's business model. In the years 2020, 2019 and 2018, the total investments in information technology were R$1,432 million, R$1,858 million and R$1,276 million, respectively.
In 2020, 2019 and 2018, the Company made significant transformations in its operations and technological infrastructure, through the implementation of several modern solutions in the areas of Artificial Intelligence (Machine Learning, AIOPs), Micro Services, BPM, Block Chain, Cyber Insurance, Facial Recognition, MultiCloud, among others. The application of these new technologies allowed the renewal of our digital channels to continuously improve the experience of interaction between customers and bank, seeking to offer increasingly practical and intuitive services, in addition to enabling the launch of digital and innovative products in the market. areas of credit, consortium, payments, agribusiness, investments, in order to meet the demands and expectations of the modern client.
Within the scope of the physical service (Branches, PABs and PAEs), applying new features, including: biometrics for PJ customers in card transactions, purchase and payment of exchanges for digital treasure, single line administration for a more efficient organization of the service and recognition of preferred customers in the totem of agencies, seeking greater security, agility and customization of services.
ii. sources of financing of investments
The sources of financing of the investments mentioned above is mainly the cash flow of operating activities. Ongoing investments consist mainly of investments in technology.
iii. material current divestitures and expected divestitures
The main disinvestment in the last three fiscal years were the sale of CIBRASEC in 2019 and the sale of Super Payments in 2020, as described in item 10.3 b above.
| 117 |
| |
b. provided that it has already been disclosed, indicate the acquisition of plants, equipment, patents, or other assets that must materially influence the company's productive capacity.
Please refer to the information available in item 10.3 - b, above.
c. new products and services, indicating:
i. description of ongoing research already disclosed
Not applicable
ii. total amounts spent by the Company on research for development of new products or services
Not applicable
iii. ongoing projects already disclosed
Not applicable
iv. total amounts spent by the Company on development of new products or services
Not applicable, since the amounts spent on the development of new products or services are considered in item 10.8.a (i) above.
10.9. Comments of the Officers regarding other factors that highly influenced the operational performance and that were not identified or commented in the other items of this section
The balance of amounts spent on other administrative expenses for 2020 was R$8,243 million, of which R$2,1721 million is attributed to technical services and R$2,355 million is attributed to system maintenance expenses.
The composition of the balance of other administrative expenses for the years 2020, 2019 and 2018 is described in the table below:
| 118 |
| |
| In Thousands of Reais | 2020 | 2019 | 2018 |
| Property, fixtures and supplies | 743,580 | 748,196 | 1,330,549 |
| Technology and systems | 2,355,310 | 2,058,619 | 1,786,416 |
| Advertising | 654,175 | 712,855 | 621,645 |
| Communications | 648,856 | 472,873 | 457,323 |
| Per diems and travel expenses | 68,922 | 140,016 | 127,277 |
| Taxes other than income tax | 280,098 | 112,012 | 88,977 |
| Surveillance and cash courier services | 594,953 | 630,585 | 617,129 |
| Insurance premiums | 16,620 | 34,778 | 29,434 |
| Specialized and technical services | 2,171,460 | 2,172,567 | 2,089,614 |
| Technical reports | 319,814 | 360,990 | 359,468 |
| Other specialized and technical services | 1,851,646 | 1,811,577 | 1,730,146 |
| Other administrative expenses (1) | 709,504 | 531,311 | 437,767 |
| Total | 8,243,478 | 7,613,812 | 7,586,131 |
| (1) In December 31,2020, includes mainly Data Processing Expenses in the balance of R$ 176,105 (2019 – R$ 67,724 and 2018 – R$ 73,664), Services Expenses in the balance of R$ 27,752 (2019 0 income of R$ 26,852 and 2018 – R$ 87,199), Expenses with Benefit Guarantor Fund – FGB R$ 8,478 (2019 – R$ 34,996 and 2018 R$ 5,334), Interest on Equity R$0 (2019 0 R$ 38,006 and 2018 R$ 20,826) and Recovery of Charges and Expenses R$ 212,850 (2019 – R$ 92,408 and 2018 R$ 89,409) | |||
There is no other information pertaining to this topic that we deem relevant that is not described in the other items in Section 10.
| 119 |
| |
EXHIBIT III:
BOARD PROPOSAL FOR ALLOCATION OF NET PROFIT FOR THE FISCAL YEAR (Pursuant to item II of the sole paragraph of article 9, Annex 9-1-II to CVM Instruction 481)
1. Inform the net profit for the fiscal year
The net profit for the fiscal year 2020 was R$ 14,056,148 thousand in the individual financial statements, and R$ 13,469,380 thousand in the consolidated statement.
2. Inform the overall amount and the value per share of dividends, including anticipated dividends and interest on equity that has already been declared
In 2020, the Board of Directors has approved the payment of Interest on Equity to our shareholders in the amount of R$ 3,325 million, and dividends in the amount of R$ 512 million, ad referendum of the ordinary general meeting. These amounts were deliberated on April 29, 2020, July 28, 2020, October 26, 2020, December 28, 2020, and February 28, 2021, as shown in the table below in summarized form:
| 2020 fiscal year | Deliberation Date | Gross Amount (in R$ k) | Gross Amount per Share (in R$) | Net amount per Share (in R$) | Payment date | ||||
| ON | PN | Unit | ON | PN | Unit | ||||
| Interest on Equity declared | 04/27/20 | 890,000 | 0.11371295 | 0.12508424 | 0.23879719 | 0.09665601 | 0.10632161 | 0.20297761 | 06/26/20 |
| Interest on Equity declared | 07/28/20 | 770,000 | 0.09837927 | 0.10821720 | 0.20659647 | 0.08362238 | 0.09198462 | 0.17560700 | 09/25/20 |
| Interest on Equity declared | 10/26/20 | 1,000,000 | 0.12776361 | 0.14053997 | 0.26830358 | 0.10859907 | 0.11945897 | 0.22805804 | 12/23/20 |
| Interest on Equity declared | 12/28/20 | 665,000 | 0.08496259 | 0.09345885 | 0.17842145 | 0.07221820 | 0.07944003 | 0.15165823 | 02/01/21 |
| Interim Dividends | 02/02/21 | 512,085 | 0.06542570 | 0.07196827 | 0.13739397 | 0.06542570 | 0.07196827 | 0.13739397 | 03/03/21 |
| Total | 3,837,085 | 0.49024412 | 0.53926853 | 1.02951265 | 0.42652136 | 0.46917349 | 0.89569485 | ||
3. Inform the net profit percent for the distributed fiscal year
In the fiscal year 2020, 28.74% of the Company’s net profit was distributed, after allocation to the legal reserve, according to individual financial statement, drawn up in accordance with the Accounting Practices Adopted in Brazil, configured by the Corporations Law, associated to the CMN, Central Bank and CVM standards as demonstrated below.
| Description | 2020 | 2019 | 2018 |
| Net Profit | 14,056,148 | 14,089,180 | 12,166,394 |
| (-) Legal Reserve | 702,807 | 704,459 | 608,320 |
| (=) Adjusted Net Income for Dividend purposes (i) | 13,353,341 | 13,384,721 | 11,558,075 |
| Mandatory Minimum Dividend (25%) | 3,338,335 | 3,346,180 | 2,889,519 |
| Interest on Equity (JCP) | 3,325,000 | 4,010,000 | 4,080,000 |
| Anticipated Dividends | 512,085 | 6,790,000 | 2,520,000 |
| Total (JCP + Dividends) (ii) | 3,837,085 | 10,800,000 | 6,600,000 |
| Dividend Higher than Mandatory Minimum | 0 | 7,453,820 | 3,710,481 |
| % net profit for the distributed dividends (ii) / (i) | 28.74% | 80.69% | 57.10% |
| 120 |
| |
4. Inform the overall amount and the value per share of dividends distributed on the basis of profit from previous fiscal years.
In 2020, no dividends based on profit from previous fiscal years were approved.
5. Inform, minus anticipated dividends and interest on net equity that has already been declared:
a. the gross dividend value and interest on net equity, in segregated form, by the action of each kind and class
In 2020, Interest on Equity the amount of R$ 3,325 million and dividends in the amount of R$ 512million, as mentioned in item 2 above, were declared in advance. After deducting these amounts, there were no other declaration of dividends and/or interest on equity referring to net profits for the year 2020.
b. the form and the deadline for payment of dividends and interest on net equity
Not applicable
c. possible incidence of update and interest on the dividends and interest on net equity
Not applicable
d. declaration date for dividend payment and interest on net equity considered for identification of shareholders who are entitled to the receipt thereof
Not applicable
6. In case of declaration of dividends or interest on net equity on the basis of profits recorded in half-yearly balance sheets or in shorter periods
a. informs the amount of dividends or interest on net equity that has already been declared
b. informs the date of the respective payments
In 2020, the Board of Directors has approved, ad referendum of the Ordinary General Meeting to be held until April 30, 2021, the Executive Board proposal related to the declaration of the following earnings:
• Interest on Equity, pursuant to article 17, XVIII of the Company's Bylaws, in the gross amount of R$ 890,000,000.00, corresponding to R$ 0.11371294750 per common share, R$ 0.12508424225 per preferred share and R$ 0.23879718974 per Unit, which after deduction of the corresponding Withholding Income Tax, according to the applicable law, became the net amount equivalent to R$ 0.09665600537 per common share, R$ 0.10632160591 per preferred share, and R$ 0.20297761128 per Unit, except for tax exempt shareholders.
| 121 |
| |
Shareholders who were registered in the Company's books at the end of May 07, 2020 were entitled to the Interest on own Capital approved at the meeting held on April 27, 2020. As of May 8, 2020 (including the same), shares of Santander Brasil were traded "ex- Interest on Equity". The Interest on Equity were paid on July 26, 2020.
• Interest on Equity, pursuant to article 17, XVIII of the Company's Bylaws, in the gross amount of R$ 770,000,000.00, corresponding to R$ 0.0983792708 per common share, R$ 0.10821719794 per preferred share and R$ 0.20659646879 per Unit, which after deduction of the corresponding Withholding Income Tax, according to the applicable law, became the net amount equivalent to R$ 0.08362238023 per common share, R$ 0.09198461825 per preferred share, and R$ 0.17560699848 per Unit, except for tax exempt shareholders.
Shareholders who were registered in the Company's books at the end of August 06, 2020 were entitled to the Interest on Equity approved at the meeting held on July 28, 2020. As of August 7, 2020 (including the same), shares of Santander Brasil were traded "ex- Interest on Equity". The Interest on Equity were paid on September 25, 2020.
• Interest on Equity, pursuant to article 17, XVIII of the Company's Bylaws, in the gross amount of R$ 1,000,000,000.00, corresponding to R$ 0.12776360834 per common share, R$ 0.14053996918 per preferred share and R$ 0.26830357752 per Unit, which after deduction of the corresponding Withholding Income Tax, according to the applicable law, became the net amount equivalent to R$ 0.10859906709 per common share, R$ 0.11945897381 per preferred share, and R$ 0.22805804089 per Unit, except for tax exempt shareholders.
Shareholders who were registered in the Company's books at the end of November 04, 2020 were entitled to the Interest on Equity approved at the meeting held on October 26, 2020. As of November 5, 2020 (including the same), shares of Santander Brasil were traded "Interest on Equity". The Interest on Equity were paid on December 23, 2020.
• Interest on Equity, pursuant to article 17, XVIII of the Company's Bylaws, in the gross amount of R$ 665,000,000.00, corresponding to R$ 0.08496259400 per common share, R$ 0.09345885340 per preferred share and R$ 0.17842144740 per Unit, which after deduction of the corresponding Withholding Income Tax, according to the applicable law, became the net amount equivalent to R$ 0.07221820490 per common share, R$ 0.07944002539 per preferred share, and R$ 0.15165823029 per Unit, except for tax exempt shareholders.
Shareholders who were registered in the Company's books at the end of January 08, 2021 were entitled to the Interest on Equity approved at the meeting held on December 28, 2020. As of January 11, 2020 (including the same), shares of Santander Brasil were traded "ex- Interest on Equity". The Interest on Equity were paid on February 01, 2021.
| 122 |
| |
• Interim Dividends, in the amount of R$ 512,000,000.00, pursuant to Article 37, I, of the Company's Bylaws, based on profits registered in a balance sheet, on December 31, 2020, equivalent to R$ 0.06542569871 per common share, R$ 0.07196826858 per preferred share, and R$ 0.13739396730 per Unit.
Shareholders who were registered in the Company's books at the end of February 12, 2021 were entitled to the Interim Dividends approved at the meeting held on February 2, 2021. As of February 17, 2021 (including the same), shares of Santander Brasil were traded "ex- Interim Dividends ". The Interim Dividends were paid in March 03, 2021.
Below is a summary of dividends and interest on equity anticipated in 2020:
| 2020 fiscal year | Deliberation Date | Gross Amount (in R$ k) | Gross Amount per Share (in R$) | Net amount per Share (in R$) | Payment date | ||||
| ON | PN | Unit | ON | PN | Unit | ||||
| Interest on Equity declared | 04/27/20 | 890,000 | 0.11371295 | 0.12508424 | 0.23879719 | 0.09665601 | 0.10632161 | 0.20297761 | 06/26/20 |
| Interest on Equity declared | 07/28/20 | 770,000 | 0.09837927 | 0.10821720 | 0.20659647 | 0.08362238 | 0.09198462 | 0.17560700 | 09/25/20 |
| Interest on Equity declared | 10/26/20 | 1,000,000 | 0.12776361 | 0.14053997 | 0.26830358 | 0.10859907 | 0.11945897 | 0.22805804 | 12/23/20 |
| Interest on Equity declared | 12/28/20 | 665,000 | 0.08496259 | 0.09345885 | 0.17842145 | 0.07221820 | 0.07944003 | 0.15165823 | 02/01/21 |
| Interim Dividends | 02/02/21 | 512,085 | 0.06542570 | 0.07196827 | 0.13739397 | 0.06542570 | 0.07196827 | 0.13739397 | 03/03/21 |
| Total | 3,837,085 | 0.49024412 | 0.53926853 | 1.02951265 | 0.42652136 | 0.46917349 | 0.89569485 | ||
7. Provide comparative table indicating the following values per share of each type and class
a. net profit for the fiscal year and the 3 (three) previous fiscal years
| Description | 2020 | 2019 | 2018 |
| Net Profit (in R$ thousand) | 14,056,148 | 14,089,180 | 12,166,394 |
| Profit per share (in R$) | |||
| Ordinary Share | 1.87452 | 1.87893 | 1.62250 |
| Preferred Share | 1.87452 | 1.87893 | 1.62250 |
| Ordinary Share (in thousand) | 3,818,695 | 3,818,695 | 3,818,695 |
| Preferred Share (in thousand) | 3,679,836 | 3,679,836 | 3,679,836 |
b. dividend and interest on equity distributed in three (3) previous fiscal years
| 2019 fiscal year | Deliberation Date | Gross Amount (in R$ k) | Gross Amount per Share (in R$) | Net amount per Share (in R$) | Payment date | ||||
| ON | PN | Unit | ON | PN | Unit | ||||
| Interest on Equity declared | 03/29/19 | 1,000,000 | 0.12758528 | 0.14034380 | 0.26792908 | 0.10844748 | 0.11929223 | 0.22773972 | 0429/19 |
| Interest on Equity declared | 06/28/19 | 1,000,000 | 0.12763993 | 0.14040392 | 0.26804384 | 0.10849394 | 0.11934333 | 0.22783727 | 07/31/19 |
| Interest on Equity declared | 09/30/19 | 1,000,000 | 0.12766104 | 0.14042715 | 0.26808819 | 0.10851189 | 0.11936308 | 0.22787496 | 10/30/19 |
| Interest on Equity declared | 12/27/19 | 1,010,000 | 0.12896733 | 0.14186406 | 0.27083139 | 0.10962223 | 0.12058445 | 0.23020668 | 02/21/20 |
| Interim Dividends | 12/27/19 | 6,790,000 | 0.86701797 | 0.95371977 | 1.82073774 | 0.86701797 | 0.95371977 | 1.82073774 | 02/21/20 |
| Total | 3,837,085 | 0.49024412 | 0.53926853 | 1.02951265 | 0.42652136 | 0.46917349 | 0.89569485 | ||
| 123 |
| |
| 2018 fiscal year | Deliberation Date | Gross Amount (in R$ k) | Gross Amount per Share (in R$) | Net amount per Share (in R$) | Payment date | ||||
| ON | PN | Unit | ON | PN | Unit | ||||
| Interest on Equity declared | 03/27/18 | 600,000 | 0.07633038089 | 0.08396341898 | 0.16029379987 | 0.06488082376 | 0.07136890613 | 0.13624972989 | 26/04/18 |
| Interim Dividends | 06/26/18 | 600,000 | 0.07649556233 | 0.08414511856 | 0.16064068089 | 0.07649556233 | 0.08414511856 | 0.16064068089 | 27/07/18 |
| Interest on Equity declared | 09/28/18 | 600,000 | 0.07649851518 | 0.08414836669 | 0.16064688187 | 0.06502373790 | 0.07152611169 | 0.13654984959 | 26/10/18 |
| Interest on Equity declared | 12/28/18 | 2,880,000 | 0.36741489184 | 0.40415638103 | 0.77157127287 | 0.31230265806 | 0.34353292387 | 0.65583558194 | 26/02/19 |
| Interim Dividends | 12/28/18 | 1,920,000 | 0.24494326123 | 0.26943758735 | 0.51438084858 | 0.24494326123 | 0.26943758735 | 0.51438084858 | 26/02/19 |
| Total | 6,600,000 | 0.841682611 | 0.925850873 | 1.767533484 | 0.763646043 | 0.840010648 | 1.603656691 | ||
| 2017 fiscal year | Deliberation Date | Gross Amount (in R$ k) | Gross Amount per Share (in R$) | Net amount per Share (in R$) | Payment date | ||||
| ON | PN | Unit | ON | PN | Unit | ||||
| Interest on Equity declared | 04/25/17 | 500,000 | 0.06337800118 | 0.06971580130 | 0.13309380248 | 0.05387130100 | 0.05925843111 | 0.11312973211 | 05/26/17 |
| Interim Dividends | 07/25/17 | 500,000 | 0.06352799946 | 0.06988079941 | 0.13340879887 | 0.05399879954 | 0.05939867950 | 0.11339747904 | 08/25/17 |
| Interest on Equity declared | 09/29/17 | 500,000 | 0.06359174383 | 0.06995091821 | 0.13354266204 | 0.05405298226 | 0.05945828048 | 0.11351126274 | 10/26/17 |
| Interest on Equity declared | 12/28/17 | 2,300,000 | 0.29283542142 | 0.32211896356 | 0.61495438498 | 0.24891010821 | 0.27380111902 | 0.52271122723 | 02/26/18 |
| Interim Dividends | 12/28/17 | 2,500,000 | 0.31829937110 | 0.35012930822 | 0.66842867932 | 0.31829937110 | 0.35012930822 | 0.66842867932 | 02/26/18 |
| Total | 6,300,000 | 0.801632536 | 0.881795790 | 1.683428327 | 0.729132562 | 0.802045818 | 1.531178380 | ||
8. In case there is allocation of profits to legal reserve
a. identify the amount intended for the legal reserve
Of the net profit for the fiscal year 2020, which totaled the amount of R$ 14,056,148 thousand, the value of R$ 702,807 thousand, equivalent to 5% of the net profits, was allocated in the legal reserve.
b. detail the legal reserve calculation method
Pursuant to Article 193 of the Brazilian Corporate Law, there is a requirement to establish the legal reserve to which 5% of the net income of each fiscal year must be allocated, until the total value of the reserve is equal to 20% of the share capital.
9. If the company has preferred shares entitled to fixed or minimum dividends
a. describe the calculation method for the fixed or minimum dividends
Not applicable.
b. inform whether the profit for the fiscal year is sufficient for the full payment of fixed or minimum dividends
Not applicable.
c. identify whether any unpaid installment is cumulative
Not applicable.
d. identify the global value of fixed or minimum dividends to be paid to each class of preferred shares
Not applicable.
| 124 |
| |
e. identify the fixed or minimum dividends to be paid per preferred share of each class
Not applicable.
10. In relation to the mandatory dividend
a. describe the calculation method provided for in the Bylaws
The Company's Bylaws provide that an amount of not less than 25% of net income, minus the allocations for legal reserves and contingencies, shall be available for distribution in the form of dividends or Interest on Equity in any fiscal year.
b. inform whether it is being paid in full
In the fiscal year 2020 the mandatory dividend was fully paid as shown in the worksheet below:
| Description | 2020 | 2019 | 2018 |
| Net Profit | 14,056,148 | 14,089,180 | 12,166,394 |
| (-) Legal Reserve | 702,807 | 704,459 | 608,320 |
| (=) Adjusted Net Income for Dividend purposes (i) | 13,353,341 | 13,384,721 | 11,558,075 |
| Mandatory Minimum Dividend (25%) | 3,338,335 | 3,346,180 | 2,889,519 |
| Interest on Equity (JCP) | 3,325,000 | 4,010,000 | 4,080,000 |
| Anticipated Dividends | 512,085 | 6,790,000 | 2,520,000 |
| Total (JCP + Dividends) (ii) | 3,837,085 | 10,800,000 | 6,600,000 |
| Dividend Higher than Mandatory Minimum | 0 | 7,453,820 | 3,710,481 |
c. inform any amount withheld
There was no minimum mandatory dividend withholding
11. In case there is mandatory dividend withholding due to the company's financial situation
a. inform the withholding amount
Not applicable.
b. describe in detail the company's financial situation, additionally addressing aspects related to liquidity analysis, working capital and positive cash flows
Not applicable.
c. justify the withholding of dividends
Not applicable.
| 125 |
| |
12. In case there is an allocation of results for contingency reserve
a. identify the amount intended for the reserve
There was no allocation of results for constituting contingency reserve in the Company.
b. identify the loss deemed probable and the cause thereof
Not applicable.
c. explain why the loss has been deemed probable
Not applicable.
d. justify the reserve constitution
Not applicable.
13. In case there is an allocation of results for unrealized profit reserve
a. inform the amount intended for the unrealized profits reserve
There was no allocation of results for unrealized profits reserve in the Company.
b. inform the nature of unrealized profits that originated the reserve
Not applicable.
14. In case there is an allocation of results for statutory reserves
a. describe the statutory clauses that establish the reserve
The Company's Bylaws establish that, after deduction of the values intended for legal reserve and the mandatory dividends, is possible to allocate the remaining amounts from the adjusted net profit in the dividend equalization reserve, which may not exceed 50% of the Company’s share capital.
b. identify the amount intended for the reserve
In the profit allocation proposal for the year 2020, the remaining balance of this profit in the amount of R$ 9,516,256 thousand, after allocations to the legal reserve account, dividends and Interest on Equity, was allocated to the reserve account for equalization of dividends.
c. describe how the amount was calculated
It is the remaining profit balance for the fiscal year 2020, after allocations to the legal reserve account, to dividends and Interest on Equity.
15. In case profit withholding is provided for in the capital budget
a. identify the withholding amount
There was no profit retention in the Company, in accordance with the capital budget.
| 126 |
| |
b. provide copy of capital budget
Not applicable.
16. In case there is an allocation of results for tax incentives reserve
a. inform the amount intended for the reserve
There was no allocation of results for constituting tax incentives reserve in the Company.
b. explain the nature of the allocation
Not applicable.
| 127 |
| |
EXHIBIT IV:
PROPOSAL FOR ELECTION OF THE COMPANY'S BOARD OF DIRECTORS
(Information on compliance with items 12.5 to 12.10 of Appendix 24 of CVM Instruction 480, pursuant to Annex A of CVM Instruction 552)
12.5. In relation to each of the managers and members of the Fiscal Board of the Company, indicate, in table form.
12.6. In relation to each of the persons who served as members of the board of directors or of the fiscal council in the last fiscal year, inform, in a table format, the percentage of participation in meetings held by the respective organ in the same period that occurred after the office.
12.7 Provide the information mentioned in item 12.5 with respect to members of statutory committees, as well as audit, risk, financial and compensation committees, even if such committees or structures are not statutory.
12.8. In relation to each person who served as a member of the statutory committees, as well as the audit, risk, financial and compensation committees, even if such committees are not statutory, inform in a table the percentage of participation in the meetings carried out by the respective body in the same period, that occurred after the tenure in office.
| Name | Álvaro Antônio Cardoso de Souza |
| Date of Birth | 09/05/1948 |
| Profession | Economist and Business Manager |
| CPF or passport number | 249.630.118-91 |
| Position occupied | Chairman of the Board of Directors |
| Election date | 04/26/2019 |
| Investiture date | 08/05/2019 |
| Term of office | OGM of 2021 |
| Elected by the controller | Yes |
| If is an independent member and, if so, what was the criterion used by the issuer to determine the independence | Yes Pursuant paragraph 3º of Art.14 of Company’s Bylaws |
| Number of consecutive terms | 5 |
| 128 |
| |
| Information about | Mr. Álvaro de Souza is Portuguese and was born on September 5, 1948. He holds degrees in Economics and Business Administration from the Pontifícia Universidade Católica de São Paulo, and attended several specialization courses from a number of American universities, such as the University of Pittsburgh and The Wharton Business School of the University of Pennsylvania. He is the Managing Director of AdS - Management, Consulting and Investments, a firm which provides advice on investments and general management. He is Chairman of the Board of Santander Brasil and a member of Santander Global Board in Spain. He worked in several banks, including Citibank, where he worked for 32 years in Brasil and abroad. In addition to the period he worked at Citigroup, he was founder and President of Banco ABC, then a subsidiary of Globo Group, Chairman of the Deliberative Council of Fundo Brasileiro para Biodiversidade (FUNBIO), and president of the American Chamber of Commerce in São Paulo (AmCham Brasil). He was also a board member of WWF International, Mastercard International and several Brazilian companies, such as AmBev S.A., Celbrás, Ultraquímica, SPCI Computers, Lazard Brazil Bank, Triângulo Bank, CSU Cardsystems, Duratex S/A. and Gol Airlines, besides had been President of the Board of Directors of WWF Brasil. Mr. Souza is coordinator of the Nomination and Governance Committee, and a member of the Compensation Committee and Risk and Compliance Committee of Santander Brasil, as well as chairman of the Risk and Compliance Committee of Santander Group. |
| Main professional experiences during the last 5 years, indicating: | |
| Name and activity sector of the company | |
| Position occupied | |
| If the company is (i) part of the economic group of the issuer or (ii) controlled by a shareholder of the issuer that holds an interest, direct or indirect, equal or higher than 5% of the same class or type of a security of the issuer | |
| Indication of all management positions held by other companies or organizations in the third sector | |
| Other position or occupation on the company | Member of the Risk and Compliance Committee and the Remuneration Committee and Coordinator of Nomination and Governance. |
Member of the Risk and Compliance Committee (16 meetings in 2020)
| Election date: 05/03/2019 |
| Investiture date: 05/03/2019 | |
| Term of office: 1st BoD meeting after 2021 OGM | |
| Number of consecutive terms: 04 | |
| Participation ratio: 94% | |
Coordinator of Nomination and Governance (21 meetings in 2020)
| Election date: 05/03/2019 |
| Investiture date: 05/03/2019 | |
| Term of office: 1st BoD meeting after 2021 OGM | |
| Number of consecutive terms:2 | |
| Participation ratio: 95% | |
Member of the Remuneration Committee(21 meetings in 2020)
| Election date: 05/03/2019 |
| Investiture date: 05/03/2019 | |
| Term of office: 1st BoD meeting after 2021 OGM | |
| Number of consecutive terms:03 | |
| Participation ratio: 95% | |
| Description of any of the following events that have occurred during the last 5 years. | Mr. Álvaro Antonio Cardoso de Souza declares that he has not suffered any criminal conviction, conviction in an administrative proceeding of the CVM, or a final and unappealable conviction, in the judicial or administrative sphere, that has suspended or disqualified him for practicing any professional or commercial activity |
| Name | Sérgio Agapito Lires Rial |
| Date of Birth | 07/28/1960 |
| Profession | Economist |
| CPF or passport number | 595.644.157-72 |
| Position occupied | Vice-Chairman of the Board of Directors |
| Election date | 04/26/2019 |
| Investiture date | 08/05/2019 |
| Term of office | OGM of 2021 |
| Elected by the controller | Yes |
| If is an independent member and, if so, what was the criterion used by the issuer to determine the independence | No |
| Number of consecutive terms | 4 |
| 129 |
| |
| Information about | Mr. Rial is Brazilian and was born on July 28, 1960. He has a degree in Law from the Universidade Federal do Rio de Janeiro and in Economics from Universidade Gama Filho, and also holds an MBA from IBMEC in São Paulo, as well as specialization degrees from Harvard Business School, the Wharton School of Business at the University of Pennsylvania and INSEAD, in France. His professional career includes serving as Chief Executive Officer of Marfrig Global Foods S.A, Vice-President Executive Officer and World Chief Financial Officer of Cargill. He was also a member of the board of directors of Cargill for nine years. He was a Managing Director of Bear Stearns & Co., in New York, Officer of ABN AMRO Bank and a member of the board of directors of ABN AMRO Bank in the Netherlands, as well as a member of the board of directors of Mosaic Fertilizers. Currently he is Vice-Chairman of the Board of Directors and the Chief Executive Officer of Santander Brasil, Chairman of the Board of Directors of Universia Brasil S.A. and member of the Board of Directors of the Santander Group. |
| Main professional experiences during the last 5 years, indicating: | |
| Name and activity sector of the company | |
| Position occupied | |
| If the company is (i) part of the economic group of the issuer or (ii) controlled by a shareholder of the issuer that holds an interest, direct or indirect, equal or higher than 5% of the same class or type of a security of the issuer | |
| Indication of all management positions held by other companies or organizations in the third sector | |
| Other position or occupation on the company | Chief Executive Officer |
| Description of any of the following events that have occurred during the last 5 years. | Mr. Sérgio Agapito Lires Rial declares that he has not suffered any criminal conviction, conviction in an administrative proceeding of the CVM, or a final and unappealable conviction, in the judicial or administrative sphere, that has suspended or disqualified him for practicing any professional or commercial activity. |
| Name | Deborah Patricia Wright |
| Date of Birth | 09/04/1957 |
| Profession | Business Administrator |
| CPF or passport number | 031.544.298-08 |
| Position occupied | Director (independent) |
| Election date | 04/26/2019 |
| Investiture date | 08/05/2019 |
| Term of office | OGM of 2021 |
| Elected by the controller | Yes |
| If is an independent member and, if so, what was the criterion used by the issuer to determine the independence | Yes Pursuant paragraph 3º of Art.14 of Company’s Bylaws |
| Number of consecutive terms | 3 |
| 130 |
| |
| Information about | Mrs. Deborah Wright is Brazilian and was born on September 4, 1957. She holds a Business Administration degree from the São Paulo School of Business Administration (EAESP-FGV). Mrs. Wright started her career in 1980 at Kibon’s Marketing Department, where she remained until 1989. In 1989, she joined Unilever as Marketing Manager and worked in the food division. In 1991, she returned to Kibon as Marketing Director, and becoming Commercial Vice President in 1994. In 1995 she became the General Manager of Kraft Suchard Foods. In 1997, she reached the position of General Manager of Kibon. At ICI/Paints, she was the General Manager for Tintas Coral Brasil from 1997 to 1999, and subsequently the Regional Manager for ICI. She was also General Officer at Parmalat Brasil in 1999, and Chief Executive Officer of Pão de Açúcar’s Group Internet Division from 2000 to 2001. From 2002 to 2007, she was Corporate Vice President/Commercial Vice President in the area of Sales and Corporate Marketing of the Abril Group. From 2009 to 2010, she was Chief Executive Officer/Country Manager of Ipsos Brasil, a market research firm. She has been acting as a Board Member since 2001. From 2001 to 2005 she served on the Board of the São Paulo American Graded School. From 2005 to 2006 she was a Board Member of CONAR (Brazilian National self-regulatory Board of Advertising). From 2008 to 2009 she was a member of the Board of Directors of the Samaritano Hospital in São Paulo. From 2008 to 2014 she was Board Member for Lojas Renner, a Brazilian publicly traded company, specializing in Apparel retail, as well as Chairwoman of their Sustainability Committee from 2012 to 2014. From 2013 to 2016, she was member of the Advisory Board for Eurofarma, 4th largest Brazilian pharmaceutical company, still privately owned and not listed on stock exchange. Currently she is associated with the following entities: Brazilian subsidiary of WCD Group (Women Corporate Directors), of which she co-founded in 2010; Strategy Commission at IBGC (Brazilian Institute of Corporate Governance), where she leads a work and study group of DEI (Diversity , Equity and Inclusion); she is part of AmCham’s (American Chamber of Commerce) Strategic Forum of Corporate Governance; and she is an ambassador of the 30% Club and WOB (Women on Boards) and has been involved in advocacy for gender diversity for over a decade. Besides that, she is an independent member of the Board of Directors, a member of the nominations and governance committee and a chairwoman of the Compensation Committee of Banco Santander (Brasil) S.A. |
| Main professional experiences during the last 5 years, indicating: | |
| Name and activity sector of the company | |
| Position occupied | |
| If the company is (i) part of the economic group of the issuer or (ii) controlled by a shareholder of the issuer that holds an interest, direct or indirect, equal or higher than 5% of the same class or type of a security of the issuer | |
| Indication of all management positions held by other companies or organizations in the third sector | |
| Other position or occupation on the company | Coordinator of the Remuneration Committee; and Member of the Nomination and Governance Committee. |
Member of the Nomination and Governance Committee (21 meetings in 2020)
| Election date: 05/03/2019 |
| Investiture date: 05/03/2019 | |
| Term of office: 1st BoD meeting after 2021 OGM | |
| Number of consecutive terms: 02 | |
| Participation ratio: 100% | |
Coordinator of the Remuneration Committee (21 meetings in 2020)
| Election date: 05/03/2019 |
| Investiture date: 05/03/2019 | |
| Term of office: 1st BoD meeting after 2021 OGM | |
| Number of consecutive terms: 02 | |
| Participation ratio: 100% | |
| Description of any of the following events that have occurred during the last 5 years. | Mrs. Deborah Patricia Wright declares that she has not suffered any criminal conviction, conviction in an administrative proceeding of the CVM, or a final and unappealable conviction, in the judicial or administrative sphere, that has suspended or disqualified her for practicing any professional or commercial activity. |
| Name | Deborah Stern Vieitas |
| Date of Birth | 09/04/1957 |
| Profession | Public Administrator and Journalist |
| CPF or passport number | 013.968.828-55 |
| Position occupied | Director (independent) |
| 131 |
| |
| Election date | 04/26/2019 |
| Investiture date | 08/05/2019 |
| Term of office | OGM of 2021 |
| Elected by the controller | Yes |
| If is an independent member and, if so, what was the criterion used by the issuer to determine the independence | Yes Pursuant paragraph 3º of Art.14 of Company’s Bylaws |
| Number of consecutive terms | 2 |
| Information about | Mrs. Deborah Vieitas is Brazilian, has a French nationality, and was born on August 21, 1957. She holds a degree in Public Business from FGV-SP and Journalism from Escola de Comunicações e Artes USP. She holds also a master’s degree in Business from FGV-SP and in Public Business from École Nationale d’Administration. She is currently the CEO of American Chamber of Commerce Brazil (Amcham Brazil). From 2015 to 2017, she was an independent member of the board of AXA Seguros SA. From 2008 to 2014, she was CEO and Board Member of the Banco Caixa Geral – Brasil. From 2000 to 2008, she was an Executive Vice President of Banco BNP Paribas Brasil, responsible for Corporate Coverage and Loan and Financing portfolios. From 1998 to 2000, she was an Executive Vice President of Banco CCF Brasil and in charge of Large Corporate & Corporate Coverage, Capital Markets, Trade Finance and Foreign Exchange. Currently she is an independent member of board of directors and chairwoman of Audit Committee of the Banco Santander (Brasil) S.A., in addition to having already been a member of the Risks and Compliance Committee. |
| Main professional experiences during the last 5 years, indicating: | |
| Name and activity sector of the company | |
| Position occupied | |
| If the company is (i) part of the economic group of the issuer or (ii) controlled by a shareholder of the issuer that holds an interest, direct or indirect, equal or higher than 5% of the same class or type of a security of the issuer | |
| Indication of all management positions held by other companies or organizations in the third sector | |
| Other position or occupation on the company | Coordinator of Audit Committee |
| Coordinator of Audit Committee (41 meetings in 2020) | Election date: 05/21/2020 |
| Investiture date: 09/02/2020 | |
| Term of office: 1st BoD meeting after 2021 OGM | |
| Number of consecutive terms: 02 | |
| Participation ratio: 100% | |
| Description of any of the following events that have occurred during the last 5 years. | Mrs. Deborah Stern Vieitas declares that she has not suffered any criminal conviction, conviction in an administrative proceeding of the CVM, or a final and unappealable conviction, in the judicial or administrative sphere, that has suspended or disqualified her for practicing any professional or commercial activity. |
| Name | Jose Antonio Alvarez Alvarez |
| Date of Birth | 01/06/1960 |
| Profession | Executive |
| CPF or passport number | 233.771.448-97 |
| Position occupied | Director |
| Election date | 04/26/2019 |
| Investiture date | 08/05/2019 |
| Term of office | OGM of 2021 |
| Elected by the controller | Yes |
| If is an independent member and, if so, what was the criterion used by the issuer to determine the independence | No. |
| Number of consecutive terms | 7 |
| 132 |
| |
| Information about | Mr. José Antonio Álvarez is Spanish and was born on January 6, 1960. He holds a Bachelor´s Degree (Hons) in Economics and Business from Santiago de Compostela University and a Master´s Degree in Business Administration from the University of Chicago. Mr. Alvarez became Chief Executive Officer of Banco Santander group in January 1st, 2015 and Executive Vice Chairman in January 15th, 2019. Prior to this, he was the bank´s Chief Financial Officer, from 2004 to 2015 and the Head of its Finance Division from 2002 - 2004. Before joining Banco Santander, he was Head of the Finance Division of BBVA (1999 - 2002) and Argentaria (1995 - 1999). Previously, he served as Chief Financial Officer for Banco Hipotecario de España, Vice President of Finanpostal Gestión Fondos de Inversión y Pensiones, and in roles at Banco de Crédito Industrial and Instituto Nacional de Industria. He has served as a member of the boards of directors of Santander Consumer Finance S.A, Santander Consumer Bank AG and Banco de Crédito Local S.A., among others, and on the supervisory boards of several of Grupo Banco Santander´s autonomous subsidiaries in Poland, Germany and the United States. He was Chairman of the European Banking Federation and Banking Supervision Committee from 2009 – 2012 and is currently a Member of the Board of Directors of Santander Brasil. |
| Main professional experiences during the last 5 years, indicating: | |
| Name and activity sector of the company | |
| Position occupied | |
| If the company is (i) part of the economic group of the issuer or (ii) controlled by a shareholder of the issuer that holds an interest, direct or indirect, equal or higher than 5% of the same class or type of a security of the issuer | |
| Indication of all management positions held by other companies or organizations in the third sector | |
Other position or occupation on the company
| None |
| Description of any of the following events that have occurred during the last 5 years. | Mr. José Antonio Alvarez Alvarez declares that he has not suffered any criminal conviction, conviction in an administrative proceeding of the CVM, or a final and unappealable conviction, in the judicial or administrative sphere, that has suspended or disqualified him for practicing any professional or commercial activity. |
| Name | José de Paiva Ferreira |
| Date of Birth | 03/01/1959 |
| Profession | Administrator |
| CPF or passport number | 007.805.468-06 |
| Position occupied | Director |
| Election date | 04/26/2019 |
| Investiture date | 08/05/2019 |
| Term of office | OGM of 2021 |
| Elected by the controller | Yes |
| If is an independent member and, if so, what was the criterion used by the issuer to determine the independence | No |
| Number of consecutive terms | 7 |
| 133 |
| |
Information about:
| Mr. José Paiva is Portuguese and was born on March 1, 1959. He has a specialization in Business Administration from Fundação Getúlio Vargas, and an MBA from The Wharton School of Business, at the University of Pennsylvania. He has worked in financial markets for over 40 years. Mr. Paiva started his career at Banco Bradesco in 1973 and held several positions. Then, he joined Banco Geral do Comércio, Noroeste and Santander Brasil, where he was executive vice president, responsible for the Business, Human Resources, Operations, Technology, Heritage, Products, Marketing, Credit Cards, Insurance, Leasing and Branch Network. From 2000 to 2001, he held the position of e-business director for Latin America, for the America Division of Santander Central Hispano. At the end of 2001, he returned to Brazil to work at Banco Banespa, as executive vice president responsible for Human Resources, Technology, Operations and Patrimony. In 2003, he became the executive vice president responsible for the Marketing, Products and Retail sectors at Santander Brasil. In 2008, he became the CEO of Santander Brasil, a position he held until the merger with Banco Real, when he became senior executive vice president responsible for the Retail Sector. In March 2011, Mr. Paiva became a member of the Board of Directors of Santander Brasil, and joined the Mitsubishi Corp Group with headquarters in Los Angeles, California, USA as Senior Executive Vice President. From July 2013 to December 2019, he returned to Santander Brasil and served as senior executive vice president responsible for Human Resources, Organization, Equity, Processes, Operations, Technology and Costs. Additionally, he performed the following functions: Executive Director of Febraban (2014 to 2019), Chairman of the Febraban Self-Regulation Board (2016 to 2019), Chairman of the Board of Directors of CIP- Interbank Payment Chamber (2015 to 2018), President of Tecban Council - Banking Technology (2014 to 2015), Advisor of the Cancer Institute - SP (2009 to 2010) and Mentor of the Inova Unicamp Program (2011 to 2013). Currently, Mr. Paiva is a member of the Board of Directors and a member of the Risk and Compliance Committee of Banco Santander (Brasil) S.A. |
| Other position or occupation on the company | Member of the Risk and Compliance Committee |
Member of the Risk and Compliance Committee (16 meetings in 2020)
| Election date: 05/03/2019 |
| Investiture date: 05/03/2019 | |
| Term of office: 1st BoD meeting after 2021 OGM | |
| Number of consecutive terms: 04 | |
| Participation ratio: 100% | |
| Description of any of the following events that have occurred during the last 5 years. | Mr. José de Paiva Ferreira declares that he has not suffered any criminal conviction, conviction in an administrative proceeding of the CVM, or a final and unappealable conviction, in the judicial or administrative sphere, that has suspended or disqualified him for practicing any professional or commercial activity. |
| Name | José García Cantera |
| Date of Birth | 05/26/1966 |
| Profession | Executive |
| CPF or passport number | PAL741935 |
| Position occupied | Director |
| Election date | N/A |
| Investiture date | N/A |
| Term of office | N/A |
| Elected by the controller | N/A |
| If is an independent member and, if so, what was the criterion used by the issuer to determine the independence | No |
| Number of consecutive terms | 0 |
| 134 |
| |
| Information about | Mr. José García Cantera is Spanish and and was born on May 26, 1966. He holds a degree of industrial engineering and also holds an MBA from IE Business School. Mr. García Cantera is Senior Executive Vice-President of Santander Group in Spain. He became Chief Financial Officer and Head of the Financial Management Division in January 2015. Prior to his current role, Mr. García Cantera was Head of the Global Wholesale Banking, reporting directly to the Group's CEO. Mr. García Cantera became CEO of Banesto in 2006, having joined in September 2003 as Senior Executive-Vice President of Wholesale Banking, comprising Corporate Banking, Treasury, Capital Markets, Banesto Bolsa and the bank's international operations. Before working at Banesto, Mr. García Cantera held senior executive positions at Salomon Brothers-Citigroup. He was a member of the Management Committee of Citigroup EMEA and of the Board of Directors of Citigroup Capital Markets UK and Citigroup EMEA. During his time as a Latin American stock analyst, he was rated as best analyst by a number of specialised publications including Institutional Investor, Reuters, Extel and Global Investor between 1995 and 2002. |
| Main professional experiences during the last 5 years, indicating: | |
| Name and activity sector of the company | |
| Position occupied | |
| If the company is (i) part of the economic group of the issuer or (ii) controlled by a shareholder of the issuer that holds an interest, direct or indirect, equal or higher than 5% of the same class or type of a security of the issuer | |
| Indication of all management positions held by other companies or organizations in the third sector | |
| Other position or occupation on the company | None |
| Description of any of the following events that have occurred during the last 5 years. | Mr. José García Cantera declares that he has not suffered any criminal conviction, conviction in an administrative proceeding of the CVM, or a final and unappealable conviction, in the judicial or administrative sphere, that has suspended or disqualified him for practicing any professional or commercial activity. |
| Name | Marília Artimonte Rocca |
| Date of Birth | 01/31/1973 |
| Profession | Business Administrator |
| CPF or passport number | 252.935.048-51 |
| Position occupied | Director (independent) |
| Election date | 04/26/2019 |
| Investiture date | 08/05/2019 |
| Term of office | OGM of 2021 |
| Elected by the controller | Yes |
| If is an independent member and, if so, what was the criterion used by the issuer to determine the independence | Yes Pursuant paragraph 3º of Art.14 of Company’s Bylaws |
| Number of consecutive terms | 1 |
| 135 |
| |
| Information about | Mrs. Marilia Rocca is CEO of Hinode Group since november 2018, the largest Marketing Multilevel consumer goods company in Brazil, with operations also in Latin America. Previously, she was Ticket’s Managing Director in Brazil, a food voucher Edenred Group company. Formerly, she served as vice president at TOTVS, the 6th largest software company worldwide based in São Paulo. From 2008 till 2012, Marilia was a managing partner at Mãe Terra, a natural and organic foods B-Corp sold to Unilever in 2017. Prior to that she co-founded and managed Endeavor Brazil, the most successful NGO supporting innovative entrepreneurship in the country. In 2000, she also co-founded Fundação Brava, a family foundation focused on transferring management tools to the public sector and Brazilian NGOs to boost their effectiveness. From 1995-98, Marilia worked for Walmart as one of the organization's first female directors in Brazil. For 20 years Marilia has served as a board member at privately and public held companies in the Education, IT, Services and Consumer Goods industries. Marilia earned a BA in Business Administration from EAESP/Fundação Getúlio Vargas and an MBA in Management from Columbia University, attending on the Fundação Estudar Scholarship. She is a 2006 Henry Crown Fellow of The Aspen Institute and a member of the Aspen Global Leadership Network. Also, Marilia is an independent Board member and coordinator of the Sustainability Committee of Banco Santander (Brasil) S.A. |
| Main professional experiences during the last 5 years, indicating: | |
| Name and activity sector of the company | |
| Position occupied | |
| If the company is (i) part of the economic group of the issuer or (ii) controlled by a shareholder of the issuer that holds an interest, direct or indirect, equal or higher than 5% of the same class or type of a security of the issuer | |
| Indication of all management positions held by other companies or organizations in the third sector | |
| Other position or occupation on the company | Coordinator of the Sustainability Committee |
Coordinator of the Sustainability Committee (7 meetings in 2020)
| Election date: 08/08/2019 |
| Investiture date: 08/06/2019 | |
| Term of office: 1st BoD meeting after 2021 OGM | |
| Number of consecutive terms: 0 | |
| Participation ratio: 100% | |
| Description of any of the following events that have occurred during the last 5 years. | Mrs. Marília Rocca declares that she has not suffered any criminal conviction, conviction in an administrative proceeding of the CVM, or a final and unappealable conviction, in the judicial or administrative sphere, that has suspended or disqualified her for practicing any professional or commercial activity. |
| Name | Pedro Augusto de Melo |
| Date of Birth | 11/04/1961 |
| Profession | Accountant |
| CPF or passport number | 011.512.108-03 |
| Position occupied | Director (independent) |
| Election date | 06/10/2020 |
| Investiture date | 07/17/2020 |
| Term of office | OGM of 2021 |
| Elected by the controller | Yes |
| If is an independent member and, if so, what was the criterion used by the issuer to determine the independence | Yes Pursuant paragraph 3º of Art.14 of Company’s Bylaws |
| Number of consecutive terms | 1 |
| 136 |
| |
| Information about | Mr. Pedro Augusto de Melo is Brazilian and was born on November 4, 1961. He has a degree in accounting sciences and a postgraduate degree in accounting and financial administration from the São Judas Tadeu University of Accounting Sciences (São Paulo). Since March 2, 2020 he occupies the position of CEO of the Brazilian Institute of Corporate Governance (IBGC). He is also member of the Governance Committee of Amcham Brasil and executive of the Union of Accounting Companies - SESCON. He developed his career in Deloitte and KPMG audit areas. From 2008 to 2017, he was CEO of KPMG Brazil, accumulating, in 2015, the position of CEO for KPMG South America. On October 1, 2017, he assumed the roles of COO for South America and Leader of Customers and Markets for South America until he retired from the firm in early 2020. He also actively participated in other levels of Governance at KPMG International, KPMG Americas and KPMG South America. He was Chairman of the Board of Directors of IBRACON - Brazilian Institute of Independent Auditors between 2009 and 2010. Currently, he is an independent member of board of directors and the coordinator of Risk and Compliance Committee of the Banco Santander (Brasil) S.A. |
| Main professional experiences during the last 5 years, indicating: | |
| Name and activity sector of the company | |
| Position occupied | |
| If the company is (i) part of the economic group of the issuer or (ii) controlled by a shareholder of the issuer that holds an interest, direct or indirect, equal or higher than 5% of the same class or type of a security of the issuer | |
| Indication of all management positions held by other companies or organizations in the third sector | |
| Other position or occupation on the company | Coordinator of Risk and Compliance Committee |
Coordinator of Risk and Compliance Committee (16 meetings in 2020)
| Election date: 04/28/2020 |
| Investiture date: 04/28/2020 | |
| Term of office: 1st BoD meeting after 2021 OGM | |
| Number of consecutive terms: 0 | |
| Participation ratio: 100% | |
| Description of any of the following events that have occurred during the last 5 years. | Mr. Pedro Augusto de Melo declares that he has not suffered any criminal conviction, conviction in an administrative proceeding of the CVM, or a final and unappealable conviction, in the judicial or administrative sphere, that has suspended or disqualified him for practicing any professional or commercial activity. |
12.9. Report the existence of a marital relationship, stable union or kinship up to the second degree between:
a. issuer administrators
It does not apply, since there is no relationship between such persons.
b. (i) administrators of the issuer and (ii) administrators of subsidiaries, direct or indirect, of the issuer
It does not apply, since there is no relationship between such persons.
c. (i) administrators of the issuer or its subsidiaries, direct or indirect and (ii) direct or indirect controllers of the issuer
It does not apply, since there is no relationship between such persons.
d. (i) directors of the issuer and (ii) directors of the issuer's direct and indirect parent companies
It does not apply, since there is no relationship between such persons.
12.10. Inform about subordination, service or control relationships maintained in the last 3 fiscal years between directors of the issuer and:
a. company controlled, directly or indirectly, by the issuer
For information about this item, we request that item 12.9 be consulted.
| 137 |
| |
b. direct or indirect issuer controller
As for the subordination item, Santander Brasil has four (4) members of the Board of Directors who also hold positions in group Santander España, they are: Álvaro Antônio Cardoso de Souza, José Antonio Alvarez Alvarez, José García Cantera and Sergio Agapito Lires Rial.
c. if relevant, supplier, customer, debtor or creditor of the issuer, its subsidiary or controlling or controlled of any of these persons
Consult item 12.9.
| 138 |
| |
EXHIBIT V:
ITEM 13 of Annex 24 of CVM Instruction 481
(Pursuant to item II of Article 12 to CVM Instruction 481)
13. Remuneration of the Executives
13.1. Describe the Policy or Practice of Remuneration of the Board of Directors, Statutory and Non-Statutory Officers, Supervisory Board, Statutory Committees, and Audit, Risk, Finance and Remuneration Committees.
A. Board of Directors
All members of our Board of Directors are well-paid to a fixed compensation consisting of monthly fees and benefits. In exceptional and fully justified cases, the Chairman of the Board of Directors may also receive a variable annual compensation for his duties performed, upon resolution of the Compensation Committee and the Board of Directors, and always within the overall limit of the annual compensation approved at an ordinary general meeting.
It is important to emphasize that, in case a member of the Board of Directors is also a member of Company´s Auditing Committee, in terms of applicable regulation and the internal ruling of the Auditing Committee, such member shall opt for the compensation from one of the bodies. In relation to other Advisory Committees, in case one of the members or the Chairman of the Board of Directors become part of them, he/she shall be entitled to the compensation attributed to him/her as a member or Chairman of the Board.
| B. | Board of Officers |
The members of our Executive Board are up to: fixed compensation composed of monthly payments, benefits, pension and variable compensation, always within the global limit of the annual compensation approved at an ordinary general meeting.
| C. | Audit Committee |
Our Audit Committee is composed of at least three and a maximum of six members appointed by the Board of Directors, among persons, members or not of the Board of Directors, who meet the legal and regulatory conditions required for the exercise of the position.
D. Compensation, Nomination and Governance, Sustainability, and Risks and Compliance Committees - Advisory Committees.
The Board of Directors approves the fixed monthly compensation of the members of the Advisory Committees, and only those members who do not occupy the executive board will be able to pay this compensation.
| 139 |
| |
The members of the Advisory Committee are not entitled to any other type of compensation or benefit.
a. Goals of the compensation policy or practice, informing if the compensation policy has been formally approved, body responsible for its approval, date of approval and, if the issuer discloses the policy, locations in the worldwide computer network where the document can be consulted.
The Company has a Compensation Policy approved by the Board of Directors meeting held on May 21, 2020.
The Compensation Policy of the Board of Directors seeks to ensure the following premises:
| · | To ensure the interests alignments among the shareholders and the public with who the Company relates with, and |
| · | To promote the good performance of the Company and to ensure the shareholders interests by means a long-term commitment. |
The purpose of the Executive Board compensation policy/practice is to support the company´s strategy, aiming to:
| · | Promote the Company´s recurrent good performance and to assure the shareholders interest through the long-term compliance of the members of the Executive Board, create long-term value and be compatible with adequate, rigorous risk management and with long-term strategy, values and interests, as well as maintain a solid base capital through a long-term commitment by the members of the Executive Board; |
| · | To recognize the meritocracy, differentiating the individual contributions of the areas and the Company in the fulfillment of the objectives and in the execution of the strategies of the business, proposed by the Executive Board and approved by the Board of Directors, regardless of ethnicity, race, sex or any personal matter; and |
| · | To maintain the competitiveness of the compensation paid by the Company in a way that facilitates the attraction and retention of managers. |
The compensation of the Audit Committee should be adequate to attract qualified, experienced professionals and recognize for the performance of their duties established in the bylaws.
| b. | Breakdown compensation, appointing: |
| · | Description of the elements of compensation and the objectives of each of them |
The remuneration of the Board of Directors is composed as follows:
| 140 |
| |
| · | Fixed Compensation: The fixed compensation is composed of monthly fees, based on market research data prepared by specialized external consultants, whose maximum overall value is approved annually at an ordinary general meeting. The fixed compensation aims at attracting and retaining professionals with the skills and experience necessary for the function. |
| · | Annual variable compensation (Programa Próprio Gestão - PPG): If a variable compensation is granted to the Chairman of the Board, the calculation of this variable compensation shall consider the individual performance, performance of the business units and performance of the institution as a whole. It shall consider the form of payment and the different percentages of deferral, according to the variable compensation level received in the year, and observe the Malus and/or Clawback clause with the possibility of reducing and/or returning up to 100% of the variable compensation amount under the estimated hypothesis. The objective of variable compensation is to mobilize and recognize, through meritocracy, the performance in the organization. |
| · | Benefits: We grant for the Independent Directors and for the Directors without position in Company´s Executive Board or in other company of Santander Group, benefits aligned with the size of the position and market practices, including medical, dental and life insurance. For the Chairman, in addition to these benefits, vehicles and drivers are also available, among others. For the expatriated members of the Board, we can also offer expatriation benefits such as rent payment, children's schools, housing expenses, among others. The benefits aim to attract and retain professionals with the skills and experience necessary for the function. |
| · | Private Pension Plan: Up to the present moment, the members of the Board of Directors that have not been holding executive positions are not entitled to private pension plan. |
| · | Share-based compensation: Up to the present moment no share-based compensation has been defined to the members that are part of this body. |
The compensation of the Executive Board is composed of a fixed party and another variable, as detailed below:
| · | Fixed Compensation: Fixed compensation is composed of the contractual salary of each executive. The salary is linked to the profile of the position held and has the corresponding level range as a reference. The individual salary also contemplates the history of performance and seniority of the occupants and is aligned with market practices, measured periodically through salary surveys done by specialized Advisory firms. The fixed compensation aims at attracting and retaining professionals with the skills and experience necessary for the position. |
| · | Benefits: Aligned with the size of the position occupied and market practices, including Medical Assistance, Dental Care and Life Insurance. For the CEO, in addition to these benefits, a car is also available for locomotion. Since March 2018, the automobile benefit or specific money for locomotion has been terminated for other executives, in alignment with market practices. The benefits aim to attract and retain professionals with the skills and experience necessary for the position. |
| 141 |
| |
| · | Private Pension Plan: The pension plan is a tool for financial planning, aiming to ensure future supplementary income. Currently the biggest plan is SantanderPrevi, a plan that since July 2018 is closed for new additions. As of January 2018, the SBPrev Pension Plan was implemented for new employees/administrators and new members. As of March 2018, the Santander Plus Pension Plan was implemented, which, like the SantanderPrevi and SBPrev plans, provides future supplementary income. This plan is restricted to the group of executives who are part of the Collective "Santander Plus". Participation is optional and the contribution is annual, limited to 12 salaries, with 100% of the contribution made by Santander Brasil. An executive lives up to the Plan generating free benefits - PGBL, established by Santander with Zurich Santander. The pension has as objective the attraction and retention of professionals with the skills and experience necessary for the position. |
| · | Variable Compensation: Variable compensation is composed of the annual Variable Income program (Programa Próprio Gestão - PPG) and the Long-Term Incentive Plans (ILP). |
(i.1) Programa Próprio Gestão (PPG)
The objective of the PPG is to mobilize and recognize, through meritocracy, the performances in the organization. This program, to which the members of the Executive Board are eligible, takes into account the individual performance, measured through the institutional performance evaluation tool (Direção por Objetivos - DPO) and includes quantitative and qualitative indicators, the performance of the business unit, measured through the DPO of the area, and reflects the objectives of the area in the exercise and performance of the institution as a whole.
From 2017 on, variable remuneration was calculated according to the following model:

For the fiscal year of 2020 the Quantitative Metrics evaluated were as follows:
| Category | Weight | Quantitative | |
| Costumers | 20% | NPS / customer satisfaction | |
| Number of loyal customers | |||
| Shareholders | risks | 10% | Credit cost ratio (IFRS 9) |
| NPL ratio | |||
| capital | 20% | Capital contribution to the Group | |
| profitability | 50% | net profit | |
| ROTE | |||
| 142 |
| |
The Board of Directors, on the recommendation of the Compensation Committee, will carry out a qualitative assessment of each quantitative metric, considering the way in which each objective was achieved and other relevant and context aspects that are not directly reflected in each indicator. This assessment may increase or decrease the result of each metric by up to 25%.
In the specific case of the members of the Executive Board, variable remuneration may also be affected by the results of the global Santander Group.
The annual variable remuneration for statutory directors is paid as follows:

The percentage of deferral will also depend on the level of variable compensation received in the year, being as a minimum criterion the above.
In the case of the Chief Executive Officer, the deferral in this program is at least 50%, with at least 25% each of the items mentioned above.
Since 2015, for cases of variable compensation greater than a certain amount established in the policy, the payment of deferred installments from three to five annual installments and equal, maintaining the conditions of lock up.
From the 2016 financial year, the deferral plan of the Executive Committee and other executives chosen by the Executive Committee, began to have the payment of the last installment (in the case of deferral in 3 years) or the last three installments (in the case of deferral in 5 years), subject to the achievement of the three indicators (detailed in the table below) for a period of three years.
| 143 |
| |
| Index | Weight |
| Total shareholders return | 33,33% |
| Capital ratio (CET1) | 33,33% |
| Earnings per share | 33,33% |
The Plan is also subject to a Malus and/or Clawback clause, that is, our Board of Directors, on the recommendation of the Compensation Committee (CC), may approve the reduction and/or return of up to 100% of the value of each participant in hypotheses previously approved by our Remuneration Committee.
(i.2) Long-Term Incentive Plans (ILP)
The objective of the ILP is to align the interests of the organization and the interests of the participants, stimulating the retention of professionals in the long term.
Our long-term programs are divided into Local and Global plans, with specific performance indicators and condition of maintaining the employee's employment relationship up to the date of payment to be entitled to receipt.
The calculation of the payment of the plans is carried out based on the percentage of achievement of the indicators applied on the reference value (target), being the Local plans paid in Units SANB11 and the Global plans in shares and options of the Santander Group (SAN).
Each participant has a reference value defined in kind, converted into SANB11 units or Santander group (SAN) shares and options, usually by the quotation of the last 15 trading sessions of the month immediately preceding the granting of each plan. At the end of the vesting period the resulting actions are delivered with a restriction of 1 year, and this payment is still subject to the application of the Malus/Clawback clauses, which may reduce or cancel the shares to be delivered in cases of non-compliance with internal standards and exposure to excessive risks.
(i.e. 2.b) Local Plans
Currently there are no local plans open to this public.
(i.e. 2.b) Global Plans
ILP CRDIV Plan
In 2016, a stock delivery plan called the CRDIV Global Long-Term Incentive – Grant 2015 was launched. This plan was subject to the achievement of several indicators including the Total Return to the Shareholder of the Santander Group, the Return on Tangible Assets (ROTE), customer satisfaction, employee satisfaction and the linking of company customers.
| 144 |
| |
The Global Long-Term Incentives Program 2015 provided for the delivery of actions resulting from the achievement of the program in 2019, with an additional sales restriction of one year after delivery to a specific group of Identified Collective. For the extended group that is not Collective identified, there was no additional sales restriction.
The Plan was closed in December 2018 with a final achievement of 66.88%. The payment corresponding to the SAN shares was made in cash in March 2019 to the participants of the "Extended Group" (without lock-up no restriction of disposal) and for the participants of the Identified Collective was made in March 2020, after the lock-up of 1 year.
ILP Global Plan - Digital Transformation Award
In 2020, the 2019 ILP Global called The Digital Transformation Award (DTA) was launched. Eligible executives have had a target set in Reais and the payment is provided as follows:
- 50% between 2024 and 2026 depending on the public considering the global SAN share price and the euro price at the time of payment
- 50% in options to be exercised by 2030 with payment considering the global SAN share price and the euro price at the time of payment.
The remuneration of the Audit Committee is composed of:
| · | Fixed Compensation: twelve monthly installments, according to the amounts fixed annually by the Board of Directors. |
| · | Benefits: medical, dental and life insurance are granted. |
| · | Pension: Members of the Audit Committee are not eligible for private pension. |
o (ii) For the last 3 fiscal years, what is the proportion of each element in the total
The estimated proportion of each element in the total remuneration is as follows:
| Board of Directors | 2018 | 2019 | 2020 |
| Fixed compensation | 98.10% | 97.54% | 98.33% |
| Benefits | 1.90% | 2.46% | 1.67% |
| Executive Board (Officers) | 2018 | 2019 | 2020 |
| Fixed compensation | 24.15% | 24.14% | 26.23% |
| Benefits | 7.06% | 2.23% | 2.44% |
| Social Security | 11.39% | 13.80% | 14.96% |
| Variable Compensation | 30.47% | 29.91% | 28.19% |
| Share-based compensation | 26.93% | 29.91% | 28.18% |
| Audit Committee | 2018 | 2019 | 2020 |
| Fixed compensation | 99.38% | 99.79% | 99.90% |
| Benefits | 0.62% | 0.21% | 0.10% |
| 145 |
| |
| Fiscal Council | 2018 | 2019 | 2020 |
| Fixed compensation | - | 100.00% | 100.00% |
| Benefits | - | 0.00% | 0.00% |
* As provided for in the Company's Bylaws, the Fiscal Council is a non-permanent operating body. It was installed at the Company's Annual General Meeting held on April 26, 2019 and April 30, 2020.
| (iii) | Calculation methodology and adjustment of each of the compensation elements |
| · | Fixed Compensation: There is no automatic methodology for adjustment. Market research is conducted annually to assess the competitiveness of compensation of directors and members of the Audit Committee. If any relevant difference is identified in relation to the market, the Remuneration Committee assesses the need to propose adjustments to the Board of Directors. |
| · | Variable Compensation: There is no automatic methodology for adjustment. Market research is conducted annually to assess the competitiveness of the compensation of the Board of Directors/Board of Directors. If any relevant difference is identified in relation to the market, the Compensation Committee assesses the need to propose adjustments to the Board of Directors. It does not apply to members of the Audit Committee. |
| · | Benefits: There is no automatic methodology for adjustment. Market research is conducted annually to assess the competitiveness of compensation, including benefits, of the Directors, Directors and members of the Audit Committee. If any relevant difference is identified in relation to the market, the Remuneration Committee assesses the need to propose adjustments to the Board of Directors. |
| · | Social Security: Does not apply to the Directors and members of the Audit Committee. For the Officers, as defined in the plan regulations. See item 13.10 of the Reference Form. |
| · | Share-based compensation: Does not apply to The Board members and members of the Audit Committee. For the Directors, as defined in the regulations of each plan. See item 13.4 of the Reference Form. |
| (iv) | Reasons that justify the composition of the compensation |
The proposed compensation considers the experience of the members of the Board of Directors, the Executive Board and the Audit Committee, the need to retain talent in a competitive market and the promotion of the good performance of the organization and alignment with the strategy of the shareholders, and with respect to the members of the Executive Board, through a long-term commitment.
| 146 |
| |
| (v) | The existence of members with no compensation on the part of the issuer and the reason for that |
There are two unpaid members on the Board of Directors, representatives of Santander Spain. They receive remuneration from the Parent Company for their executive duties in it.
There are no unpaid members on the Executive Board.
There are no unpaid members on the Audit Committee.
c. Main performance indicators taken into consideration in the determination of each compensation element
The maximum definition of values is approved by the ordinary general meeting considering our results in the last fiscal year and the expected results for the current fiscal year, including, but not limited to, net income.
For the members of the Executive Board, the following are also considered:
| · | Fixed Compensation: no linked indicator. |
| · | Variable Compensation: is based on the Company's results indicators, results of the areas and individual performance. |
For the year 2020 the Quantitative Metrics evaluated were as follows:
| Category | Weight | Quantitative | |
| Costumers | 20% | NPS / customer satisfaction | |
| Number of loyal customers | |||
| Shareholders | risks | 10% | Credit cost ratio (IFRS 9) |
| NPL ratio | |||
| capital | 20% | Capital contribution to the Group | |
| profitability | 50% | net profit | |
| ROTE | |||
Quantitative factors are considered in the individual's assessment, which depend on their area of activity, as well as qualitative factors (behaviors aligned with our culture).
| · | Benefits: no linked indicator. |
| · | Social Security: no linked indicator. |
| · | Share-based compensation: ILP Plan, as described in item |
13.4 of the Reference Form.
| 147 |
| |
d. How the compensation is structured in order to reflect the evolution of the performance indicators
The compensation of the members of the Board of Directors is defined considering the responsibility and seniority of the members.
For the Executive Board, the Board of Directors evaluates the fulfillment of the established objectives and the budget, with the purpose of verifying whether the results justify the distribution of funds up to the proposed limits.
The compensation of the members of the Audit Committee is defined annually by the ordinary general meeting and is not directly linked to short- and medium-term performance.
e. How the compensation policy or practice aligns with the interests of issuer in the short, medium and long term
The compensation policy aligns with our interests, as it establishes premises compatible with risk management so as not to encourage behaviors that increase exposure to risk above the levels considered prudent in the short, medium and long-term strategies adopted by us, disclosing concepts, criteria and responsibilities related to the forms of fixed and variable remuneration, encouraging the high performance of these, always aligned with our interests and our shareholders.
Our compensation policy offers executive board members programs such as the Programa Próprio Gestão (PPG), ILP Plans (global and local) and deferral program in order to align the interests of the Company and executives. On the one hand, we seek the growth and sustainable profitability of our business and, on the other hand, the recognition of the contribution of executives to our development.
f. Existence of compensation borne by subsidiaries, controlled companies or direct or indirect controlling companies
The compensation of the members of the Board of Directors and the members of the Audit Committee is not supported by subsidiaries, subsidiaries or our direct or indirect controllers. However, the members of the Board of Directors who also perform executive functions of Santander Spain, our indirect controller, or in other companies controlled by Santander Spain are compensated, as a result of such functions, directly by those companies, in accordance with the activities carried out by them.
The compensation of the members of the Executive Board is not borne by subsidiaries, subsidiaries or our direct or indirect controllers. However, the results of subsidiaries and affiliates influence our consolidated results, and consequently, the variable compensation of the members of the Executive Board.
| 148 |
| |
g. Existence of any compensation or benefit bound to the occurrence of a certain shareholding event, such as the disposal of the share control of issuer
There is no compensation or benefit linked to the occurrence of corporate event.
h. Practices and procedures adopted by the board of directors to define the individual remuneration of the board of directors and board of executive officers, indicating:
i. the issuer's bodies and committees that participate in the decision-making process, identifying how they participate
It is up to the General Meeting to set the annual overall compensation for distribution among our directors. Subsequently, it will be up to the Board of Directors, with the help of our Compensation Committee, to distribute the amount, individually, to each member of the Board itself and the Executive Board, which will include the allocation of all benefits.
ii. criteria and methodology used to determine the individual remuneration, indicating whether studies are used to verify market practices and, if so, the criteria for comparison and the scope of these studies
The criteria and methodology used to set individual compensation are aligned with the practices adopted by the market, measured periodically through salary surveys conducted by specialized Advisory firms, and the performance history and seniority of the occupants.
All members of the Board of Directors are entitled to a fixed compensation composed of monthly fees and benefits. In exceptional and fully justified cases, the Chairman of the Board of Directors may also receive a variable annual compensation for his duties performed, upon resolution of the Compensation Committee and the Board of Directors, and always within the overall limit of the annual remuneration approved at the Ordinary General Meeting.
In addition, it is the function of our Compensation Committee:
| (i) | analyze the compensation policy of directors in relation to market practices, with a view to identifying significant discrepancies in relation to similar companies; And |
| (ii) | ensure that the management compensation policy is permanently compatible with the risk management policy, with the goals and our current and expected financial situation. |
iii. how often and how the board of directors assesses the adequacy of the issuer's remuneration policy
The Compensation Committee is responsible for reviewing the Compensation Policy annually, recommending to the Board of Directors its correction or improvement, when necessary.
| 149 |
| |
13.2 - Total remuneration of the board of directors, statutory board and supervisory board
| Total remuneration foreseen for the current Fiscal Year 2021 - Annual amounts | |||||
| Board of Directors | Executive Board | Audit Committee | Fiscal Council | Total | |
| Total Number of Members | 9 | 45 | 4 | 6 | 64 |
| Number of Remunerated Numbers | 6 | 44 | 4 | 3 | 57 |
| Annual Fixed Remuneration | - | ||||
| Salary or Compensation | 6,000,000.00 | 89,000,000.00 | 3,700,000.00 | 500,000.00 | 99,200,000.00 |
| Direct and Indirect Benefits | 300,000.00 | 10,000,000.00 | 300,000.00 | - | 10,600,000.00 |
| Participation in Committees | - | ||||
| Other | 74,700,000.00 | 74,700,000.00 | |||
| Outros INSS | 1,350,000.00 | 27,145,000.00 | 832,500.00 | 112,500.00 | 29,440,000.00 |
| Other INSS | - | ||||
| Variable Remuneration | - | - | - | - | - |
| Bonus | - | 110,000,000.00 | - | - | 110,000,000.00 |
| Participation in Income | - | ||||
| Attendance at Meetings | - | ||||
| Commissions | - | ||||
| Other INSS | - | ||||
| Other | - | ||||
| Post-Employment | - | ||||
| Extinction of Job | 110,000,000.00 | - | 110,000,000.00 | ||
| Total remuneration | 7,650,000.00 | 420,845,000.00 | 4,832,500.00 | 612,500.00 | 433,940,000.00 |
| Without taxes | 6,300,000.00 | 393,700,000.00 | 4,000,000.00 | 500,000.00 | 404,500,000.00 |
| Total Remuneration for the Fiscal Year ended in 12/31/2020 - Annual amounts | |||||
| Board of Directors | Executive Board | Audit Committee | Fiscal Council | Total | |
| Total Number of Members | 9 | 45 | 4 | 6 | 64 |
| Number of Remunerated Numbers | 5.25 | 39 | 3.58 | 3 | 50.83 |
| Annual Fixed Remuneration | - | ||||
| Salary or Compensation | 5,259,500.00 | 66,454,658.86 | 2,915,000.00 | 418,800.00 | 75,047,958.86 |
| Direct and Indirect Benefits | 89,360.64 | 6,169,101.15 | 2,918.40 | - | 6,261,380.19 |
| Participation in Committees | - | ||||
| Other | - | 37,907,905.95 | - | - | 37,907,905.95 |
| Outros INSS | 1,183,387.50 | 21,412,353.32 | 655,875.00 | 94,230.00 | 23,345,845.82 |
| Other INSS | - | ||||
| 150 |
| |
| Variable Remuneration | - | - | - | - | - |
| Bonus | - | 71,403,961.00 | - | - | 71,403,961.00 |
| Participation in Income | - | ||||
| Attendance at Meetings | - | ||||
| Commissions | - | ||||
| Other INSS | - | ||||
| Other | - | ||||
| Post-Employment | - | ||||
| Extinction of Job | - | 71,403,961.00 | - | - | 71,403,961.00 |
| Total remuneration | 6,532,248.14 | 274,751,941.28 | 3,573,793.40 | 513,030.00 | 285,371,012.82 |
| Without taxes | 5,348,860.64 | 253,339,587.96 | 2,917,918.40 | 418,800.00 | 262,025,167.00 |
| Total remuneration for the Fiscal Year as of 12/31/2019 - Annual amounts - | |||||
| Board of Directors | Executive Board | Audit Committee | Fiscal Council | Total | |
| Total Number of Members | 9.9 | 41.7 | 4.0 | 2.5 | 58.1 |
| Number of Remunerated Numbers | 4.8 | 40.9 | 4.0 | 1.3 | 51.0 |
| Annual Fixed Remuneration | |||||
| Salary or Compensation | 4,769,000.00 | 65,675,735.42 | 3,160,000.00 | 166,110.00 | 73,770,845.42 |
| Direct and Indirect Benefits | 120,081.88 | 6,058,872.43 | 6,507.44 | - | 6,185,461.75 |
| Participation in Committees | - | - | - | - | - |
| Other | - | 37,547,886.47 | - | - | 37,547,886.47 |
| Outros INSS | 1,073,025.00 | 20,031,099.30 | 711,000.00 | 37,374.75 | 21,852,499.05 |
| Other INSS | - | ||||
| Variable Remuneration | - | - | - | - | - |
| Bonus | - | 81,373,612.34 | - | - | 81,373,612.34 |
| Participation in Income | - | - | - | - | - |
| Attendance at Meetings | - | - | - | - | - |
| Commissions | - | - | - | - | - |
| Other INSS | - | - | - | - | - |
| Other | - | - | - | - | - |
| Post-Employment | - | - | - | - | - |
| Extinction of Job | - | 81,373,612.34 | - | - | 81,373,612.34 |
| Total remuneration | 5,962,106.88 | 292,060,818.30 | 3,877,507.44 | 203,484.75 | 302,103,917.37 |
| Without taxes | 4,889,081.88 | 272,029,718.99 | 3,166,507.44 | 166,110.00 | 280,251,418.31 |
| 151 |
| |
| Total remuneration for the Fiscal Year on 12/31/2018 - Annual amounts - | |||||
| Board of Directors | Executive Board | Audit Committee | Fiscal Council | Total | |
| Total Number of Members | 10 | 42.17 | 4 | - | 56.17 |
| Number of Remunerated Numbers | 5 | 40.83 | 4 | - | 49.83 |
| Annual Fixed Remuneration | - | ||||
| Salary or Compensation | 3,774,000.00 | 69,698,795.60 | 3,054,000.00 | - | 76,526,795.60 |
| Direct and Indirect Benefits | 89,404.10 | 20,381,150.31 | 19,046.82 | - | 20,489,601.23 |
| Participation in Committees | - | ||||
| Other | - | 32,863,627.58 | - | - | 32,863,627.58 |
| Outros INSS | 1,040,850.00 | 24,179,972.74 | 691,200.00 | - | 25,912,022.74 |
| Other INSS | - | ||||
| Variable Remuneration | - | - | |||
| Bonus | - | 84,601,886.64 | - | - | 84,601,886.64 |
| Participation in Income | - | - | 18,000.00 | - | 18,000.00 |
| Attendance at Meetings | - | ||||
| Commissions | - | ||||
| Other INSS | - | ||||
| Other | - | ||||
| Post-Employment | - | ||||
| Extinction of Job | - | 73,531,504.64 | - | - | 73,531,504.64 |
| Total remuneration | 4,904,254.10 | 305,256,937.51 | 3,782,246.82 | - | 313,943,438.43 |
| 152 |
| |
13,3. In relation to the variable remuneration in the last 3 fiscal years and expected remuneration for the current fiscal year of the Board of Directors and Statutory Board
The following tables show the variable remuneration of the members of the Company's management bodies in the fiscal years 2018, 2019 and 2020, as well as that foreseen for the fiscal year 2021.
| 2018 | Board of Directors | Board of Executive Officers | Audit Committee | Total |
A. Body: b. Total number of members | 10 | 42.17 | 4.00 | 60.17 |
| c. No. of Members compensated | 5 | 40.83 | 4.00 | 53.83 |
| d. in relation to the Bonus | ||||
| i. minimum amount provided for in the compensation plan | - | - | - | - |
| ii. maximum amount provided for in the compensation plan | - | 9,000,000.00 | - | 9,000,000.00 |
| iii. amount payable under the compensation plan, in case the the goals are met | - | 5,000,000.00 | - | 5,000,000.00 |
| iv. Amount actually acknowledged in the income of the social exercise | - | - | - | |
| e. in relation to the profit sharing | ||||
| i. minimum amount set forth in the compensation plan | - | - | - | - |
| ii . maximum amount set forth in the compensation plan | - | 160,000,000.00 | - | 160,000,000.00 |
| iii. amount payable under the compensation plan, in case the goals are met | - | 140,000,000.00 | - | 140,000,000.00 |
| iv. Amount actually acknowledged in the income of the social exercise | - | 158,133,391.28 | - | 158,133,391.28 |
Note: The number of members of each Body corresponds to the annual average calculated monthly.
| 153 |
| |
| 2019 | Board of Directors | Board of Executive Officers | Audit Committee | Total | Board of Directors |
A. Body: b. Total number of members | 9.9 | 41.7 | 4.0 | 2.5 | 58.1 |
| c. No. of Members compensated | 4.8 | 40.9 | 4.0 | 1.3 | 51.0 |
| d. in relation to the Bonus | |||||
| i. minimum amount provided for in the compensation plan | - | - | - | - | - |
| ii. maximum amount provided for in the compensation plan | - | 9,000,000.00 | - | - | 9,000,000.00 |
| iii. amount payable under the compensation plan, in case the goals are met | - | 5,000,000.00 | - | - | 5,000,000.00 |
| iv. Amount actually acknowledged in the income of the social exercise | - | - | - | - | - |
| e. in relation to the profit sharing | |||||
| i. minimum amount set forth in the compensation plan | - | - | - | - | - |
| ii. maximum amount set forth in the compensation plan | - | 220,000,000.00 | - | - | 220,000,000.00 |
| iii. amount payable under the compensation plan, in case the goals are met | - | 200,000,000.00 | - | - | 200,000,000.00 |
| iv. Amount actually acknowledged in the income of the social exercise | - | 162,747,224.67 | - | - | 162,747,224.67 |
Note: The number of members of each Body corresponds to the annual average calculated monthly.
| 2020 | Board of Directors | Board of Executive Officers | Audit Committee | Total | Board of Directors |
A. Body: b. Total number of members | 9 | 45.0 | 4.0 | 6.0 | 64 |
| c. No. of Members compensated | 5.25 | 39.0 | 3.58 | 3.0 | 50.83 |
| d. in relation to the Bonus | |||||
| i. minimum amount provided for in the compensation plan | - | - | - | - | - |
| ii. maximum amount provided for in the compensation plan | - | 9,000,000.00 | - | - | 9,000,000.00 |
| iii. amount payable under the compensation plan, in case the goals are met | - | 5,000,000.00 | - | - | 5,000,000.00 |
| 154 |
| |
| iv. Amount actually acknowledged in the income of the social exercise | - | - | - | - | - |
| e. in relation to the profit sharing | |||||
| i. minimum amount set forth in the compensation plan | - | - | - | - | - |
| ii. maximum amount set forth in the compensation plan | - | 220,000,000.00 | - | - | 220,000,000.00 |
| iii. amount payable under the compensation plan, in case the goals are met | - | 200,000,000.00 | - | - | 200,000,000.00 |
| iv. Amount actually acknowledged in the income of the social exercise | - | 142,807,922.00 | - | - | 142,807,922.00 |
Note: The number of members of each Body corresponds to the annual average calculated monthly.
| 2021 (predicted) | Board of Directors | Board of Executive Officers | Audit Committee | Total | Board of Directors |
A. Body: b. Total number of members | 9 | 45.0 | 4.0 | 6.0 | 64.0 |
| c. No. of Members compensated | 6 | 44.0 | 4.0 | 3.0 | 57.0 |
| d. in relation to the Bonus | |||||
| i. minimum amount provided for in the compensation plan | - | - | - | - | - |
| ii. maximum amount provided for in the compensation plan | - | 9,000,000.00 | - | - | 9,000,000.00 |
| iii. amount payable under the compensation plan, in case the goals are met | - | 5,000,000.00 | - | - | 5,000,000.00 |
| iv. Amount actually acknowledged in the income of the social exercise | - | - | - | - | - |
| e. in relation to the profit sharing | |||||
| i. minimum amount set forth in the compensation plan | - | - | - | - | - |
| ii. maximum amount set forth in the compensation plan | - | 220,000,000.00 | - | - | 220,000,000.00 |
| iii. amount payable under the compensation plan, in case the goals are met | - | 200,000,000.00 | - | - | 200,000,000.00 |
| iv. Amount actually acknowledged in the income of the social exercise | - | 0 | - | - | 0 |
| 155 |
| |
13.4. Compensation plan based on the actions of the Board of Directors and the Statutory Board, in force in the last fiscal year and estimated for the current fiscal year.
a. general terms and conditions
Currently we have three long-term compensation plans linked to stock market price performance: Local Long-Term Incentive Plan, Global Long-Term Incentive Plan, and Deferral Plan.
Directors and non-directors who have been appointed by our Board of Directors are eligible for these plans. The Plans last for three years, promoting the commitment of eligible people to long-term results.
| (i) | Local Long-Term Incentive Plan |
Currently there are no open to this audience.
| (ii) | Global Long-Term Incentive Plans |
| (ii.1) | Global Plans - ILP CRDIV |
Please refer to the text on the ILP CRDIV and ILP DTA Plan available in item 13.1, D, above.
| (ii.2) | Deferral Programs |
Deferral Programs are applied to Officers, executives with management positions, and other eligible employees. As part of the Deferral program, participants receive part of the variable remuneration over a period of three years or five years.
Deferral Programs are renewed and updated each year. In December/2020, we had six plans in place: one for each fiscal year 2015, 2016, 2017, 2018, 2019 and 2020.
(iii) Deferral Program
Deferral plans are divided into three programs:
· Identified Collective: Statutory and Executive Directors. Statutory and Executive Officers who assume significant risks and are responsible for control areas. Deferred compensation is paid 50% in cash, and 50% in shares (Units SANB11).
| · | Superintendents: Employees. Superintendent-level employees are eligible for this program. Deferred compensation is paid 50% in cash, and 50% in shares (Units SANB11). |
| · | Others: Employees. Employees with variable compensation above a stipulated minimum amount are eligible. Deferred compensation is paid 50% in cash, and |
| 156 |
| |
50% in shares (Units SANB11).
b. primary purposes of the plans
The main objectives of the plans are:
· Align our interests and participants with a view, on the one hand, to the growth and profitability of our business and, on the other hand, to the recognition of the contribution of participants to the development of our activities;
· Enable us to retain participants in our staff, offering them, as an additional advantage, the opportunity to become or increase their participation as our shareholders; And
· Promote our good performance and the interests of our shareholders through a long-term commitment on the part of the participants.
c. how does the plans contribute to objectives
The plans contribute to the objectives set out above ensuring quality achievement and long-term commitment since these plans are subject to Malus and/or/ Clawback clauses.
d. how the plans are inserted in the compensation policy of the issuer
The plans are a key part of our compensation strategy because they act as efficient instruments for recognizing and retaining executive board members in the short, medium and long term, in addition to aligning the interests of executives with our interests.
e. how the plans align the interests of managers and issuer in the short, medium and long terms
The plans align the interests of the Members of the Board of Executive Officers and to ours in the short, medium and long term, since the options are only exercised and the actions received if our strategic objectives are consistently achieved during the duration of the respective cycles of the Plans.
| 157 |
| |
| f. | Maximum number of shares covered |
Stock-based Compensation Plan planned for the current fiscal year (2021)
| |||||||||||||||||
| Board of Directors | Board of Executive Officers | ||||||||||||||||
| ILP Global CRDIV 2015 | DEFERRAL 5th Cycle | DEFERRAL 6th Cycle | DEFERRAL 7th Cycle | DEFERRAL 8th Cycle | DEFERRAL 9th Cycle | DEFERRAL 10th Cycle | DEFERRAL 11th Cycle | SOP 2013 | ILP Global CRDIV 2015 | DEFERRAL 5th Cycle | DEFERRAL 6th Cycle | DEFERRAL 7th Cycle | DEFERRAL 8th Cycle | DEFERRAL 9th Cycle | DEFERRAL 10th Cycle | DEFERRAL 11th Cycle | |
| Maximum number of Shares | - | - | - | - | - | - | - | - | - | - | - | - | 61,238 | 96,079 | 353,078 | 657,843 | 760,732 |
* Until February 10 of each of the three fiscal years following the base year, the Company's Board of Directors may change the maximum amount of Units per year, increasing in proportion to the Company distributing dividends and/or interest on equity to its shareholders, in the amount equivalent to dividends and interest on equity that the participant would be entitled to if the Company had the Units.
| |||||||||||||||||
| 158 |
| |
Stock-based Compensation Plan in force for the fiscal year ended December 31, 2020
| |||||||||||||||||
| �� | Board of Directors | Board of Executive Officers | |||||||||||||||
| ILP Global CRDIV 2015 | DEFERRAL 5th Cycle | DEFERRAL 6th Cycle | DEFERRAL 7th Cycle | DEFERRAL 8th Cycle | DEFERRAL 9th Cycle | DEFERRAL 10th Cycle | DEFERRAL 11th Cycle | SOP 2013 | ILP Global CRDIV 2015 | DEFERRAL 5th Cycle | DEFERRAL 6th Cycle | DEFERRAL 7th Cycle | DEFERRAL 8th Cycle | DEFERRAL 9th Cycle | DEFERRAL 10th Cycle | DEFERRAL 11th Cycle | |
| Maximum number of shares | - | - | 61,653 | - | - | - | - | - | - | - | - | 73,759 | 122,061 | 454,039 | 550,811 | 887,949 | - |
* Until February 10 of each of the three fiscal years following the base year, the Company's Board of Directors may change the maximum amount of Units per year, increasing in proportion to the Company distributing dividends and/or interest on equity to its shareholders, in the amount equivalent to dividends and interest on equity that the participant would be entitled to if the Company had the Units.
| |||||||||||||||||
| 159 |
| |
Compensation Plan based on shares in force in the fiscal year ended December 31, 20219
| |||||||||||||||||
| Board of Directors | Board of Executive Officers | ||||||||||||||||
| ILP Global CRDIV 2015 | DEFERRAL 5th Cycle | DEFERRAL 6th Cycle | DEFERRAL 7th Cycle | DEFERRAL 8th Cycle | DEFERRAL 9th Cycle | DEFERRAL 10th Cycle | DEFERRAL 11th Cycle | SOP 2013 | ILP Global CRDIV 2015 | DEFERRAL 5th Cycle | DEFERRAL 6th Cycle | DEFERRAL 7th Cycle | DEFERRAL 8th Cycle | DEFERRAL 9th Cycle | DEFERRAL 10th Cycle | DEFERRAL 11th Cycle | |
| Maximum number of shares | - | 54,809 | - | 115,730 | - | - | - | - | - | 364,858 | - | 254,185 | 310,730 | 674,296 | 720,624 | - | - |
* Until February 10 of each of the three fiscal years following the base year, the Company's Board of Directors may change the maximum amount of Units per year, increasing in proportion to the Company distributing dividends and/or interest on equity to its shareholders, in the amount equivalent to dividends and interest on equity that the participant would be entitled to if the Company had the Units.
| |||||||||||||||||
| 160 |
| |
Compensation Plan based on shares in force in the fiscal year ended December 31, 2018
| |||||||||||||||||
| Board of Directors | Board of Executive Officers | ||||||||||||||||
| ILP Global CRDIV 2015 | DEFERRAL 5th Cycle | DEFERRAL 6th Cycle | DEFERRAL 7th Cycle | DEFERRAL 8th Cycle | DEFERRAL 9th Cycle | DEFERRAL 10th Cycle | DEFERRAL 11th Cycle | SOP 2013 | ILP Global CRDIV 2015 | DEFERRAL 5th Cycle | DEFERRAL 6th Cycle | DEFERRAL 7th Cycle | DEFERRAL 8th Cycle | DEFERRAL 9th Cycle | DEFERRAL 10th Cycle | DEFERRAL 11th Cycle | |
| Maximum number of shares | - | 86,468 | - | 172,510 | - | - | - | - | 465,988 | 517,980 | - | 717,317 | 667,771 | 997,429 | - | 86,468 | - |
* Until February 10 of each of the three fiscal years following the base year, the Company's Board of Directors may change the maximum amount of Units per year, increasing in proportion to the Company distributing dividends and/or interest on equity to its shareholders, in the amount equivalent to dividends and interest on equity that the participant would be entitled to if the Company had the Units.
| |||||||||||||||||
| 161 |
| |
g) maximum number of options to be granted
Stock-based Compensation Plan planned for the current fiscal year (2021)
| |||||||||||||||||
| Board of Directors | Board of Executive Officers | ||||||||||||||||
| ILP Global CRDIV 2015 | DEFERRAL 5th Cycle | DEFERRAL 6th Cycle | DEFERRAL 7th Cycle | DEFERRAL 8th Cycle | DEFERRAL 9th Cycle | DEFERRAL 10th Cycle | DEFERRAL 11th Cycle | SOP 2013 | ILP Global CRDIV 2015 | DEFERRAL 5th Cycle | DEFERRAL 6th Cycle | DEFERRAL 7th Cycle | DEFERRAL 8th Cycle | DEFERRAL 9th Cycle | DEFERRAL 10th Cycle | DEFERRAL 11th Cycle | |
| Maximum number of shares | - | - | - | - | - | - | - | - | - | - | - | - | 61,238 | 96,079 | 353,078 | 657,843 | 760,732 |
* Until February 10 of each of the three fiscal years following the base year, the Company's Board of Directors may change the maximum amount of Units per year, increasing in proportion to the Company distributing dividends and/or interest on equity to its shareholders, in the amount equivalent to dividends and interest on equity that the participant would be entitled to if the Company had the Units.
| |||||||||||||||||
| 162 |
| |
Stock-based Compensation Plan in force for the fiscal year ended December 31, 2020
| |||||||||||||||||
| Board of Directors | Board of Executive Officers | ||||||||||||||||
| ILP Global CRDIV 2015 | DEFERRAL 5th Cycle | DEFERRAL 6th Cycle | DEFERRAL 7th Cycle | DEFERRAL 8th Cycle | DEFERRAL 9th Cycle | DEFERRAL 10th Cycle | DEFERRAL 11th Cycle | SOP 2013 | ILP Global CRDIV 2015 | DEFERRAL 5th Cycle | DEFERRAL 6th Cycle | DEFERRAL 7th Cycle | DEFERRAL 8th Cycle | DEFERRAL 9th Cycle | DEFERRAL 10th Cycle | DEFERRAL 11th Cycle | |
| Maximum number of shares | - | - | 61,653 | - | - | - | - | - | - | - | - | 73,759 | 122,061 | 454,039 | 550,811 | 887,949 | - |
* Until February 10 of each of the three fiscal years following the base year, the Company's Board of Directors may change the maximum amount of Units per year, increasing in proportion to the Company distributing dividends and/or interest on equity to its shareholders, in the amount equivalent to dividends and interest on equity that the participant would be entitled to if the Company had the Units,
| |||||||||||||||||
Compensation Plan based on shares in force in the fiscal year ended December 31, 2019
| |||||||||||||||||
| Board of Directors | Board of Executive Officers | ||||||||||||||||
| SOP 2013 | ILP Global CRDIV 2015 | DEFERRAL 5th Cycle | DEFERRAL 6th Cycle | DEFERRAL 7th Cycle | DEFERRAL 8th Cycle | DEFERRAL 9th Cycle | DEFERRAL 10th Cycle | SOP 2013 | ILP Global CRDIV 2015 | DEFERRAL 5th Cycle | DEFERRAL 6th Cycle | DEFERRAL 7th Cycle | DEFERRAL 8th Cycle | DEFERRAL 9th Cycle | DEFERRAL 10th Cycle | DEFERRAL 11th Cycle | |
| Maximum number of shares | - | 54,809 | - | 115,730 | - | - | - | - | - | 364,858 | - | 254,185 | 310,730 | 674,296 | 720,624 | - | - |
* Until February 10 of each of the three fiscal years following the base year, the Company's Board of Directors may change the maximum amount of Units per year, increasing in proportion to the Company distributing dividends and/or interest on equity to its shareholders, in the amount equivalent to dividends and interest on equity that the participant would be entitled to if the Company had the Units.
| |||||||||||||||||
| 163 |
| |
Compensation Plan based on shares in force in the fiscal year ended December 31, 2018
| |||||||||||||||||
| Board of Directors | Board of Executive Officers | ||||||||||||||||
| SOP 2013 | ILP Global CRDIV 2015 | DEFERRAL 5th Cycle | DEFERRAL 6th Cycle | DEFERRAL 7th Cycle | DEFERRAL 8th Cycle | DEFERRAL 9th Cycle | DEFERRAL 10th Cycle | SOP 2013 | ILP Global CRDIV 2015 | DEFERRAL 5th Cycle | DEFERRAL 6th Cycle | DEFERRAL 7th Cycle | DEFERRAL 8th Cycle | DEFERRAL 9th Cycle | DEFERRAL 10th Cycle | DEFERRAL 11th Cycle | |
| Maximum number of shares | - | 86,468 | - | 172,510 | - | - | - | - | 465,988 | 517,980 | - | 717,317 | 667,771 | 997,429 | - | - | - |
* Until February 10 of each of the three fiscal years following the base year, the Company's Board of Directors may change the maximum amount of Units per year, increasing in proportion to the Company distributing dividends and/or interest on equity to its shareholders, in the amount equivalent to dividends and interest on equity that the participant would be entitled to if the Company had the Units.
| |||||||||||||||||
| 164 |
| |
h. conditions for the acquisition of shares
| (i) | Global Programs |
Please refer to the text on the ILP CRDIV and ILP DTA Plans available in item 13.1, D, above.
| (ii) | Deferral Programs |
Deferral - 6th Cycle (2015) 7th Cycle (2016), 8th Cycle (2017), 9th Cycle (2018), 10th Cycle (2019) and 11th Cycle (2020): The Plan is part of the current regulatory environment applicable to us, notified in the light of CMN Resolution No. 3921, of November 25, 2010 ("Resolution No. 3921/10"), which obliges financial institutions to comply with certain requirements for deferred payment in the future of the portion of the Variable Compensation owing to their managers and other employees, taking into account sustainable long-term financial bases and adjustments of future payments according to the risks assumed and variations in the cost of capital.
i. criteria for setting the price of acquisition or exercise
| (i) | Global Programs |
The cycles last for three years, covering three social exercises, promoting a commitment of the Executive Directors to the long-term results.
(ii) Deferral Programs (6th, 7th, 8th, 9th, 10th and 11th cycles)
The total amount of Units referenced is settled in three or five installments and equally allocated for the three or five fiscal years subsequent to the base year.
j. Criteria for setting the time for exercise
| (i) | Global Programs |
In the Global Plan - ILP CRDIV there is a restriction on the transfer of shares for one year after they have been received. In other global plans there is no restriction on the transfer of shares after they have been received.
| (ii) | Deferral Programs |
6th, 7th, 8th, 9th, 10th and 11th Deferral Cycles: Administrators belonging to the Identified Collective mentioned above may not dispose of units received in this plan for a period of one year from the date of receipt of each lot of Units.
| 165 |
| |
k. Form of settlement
| (i) | Global Programs |
Payroll bonus
| (ii) | Deferral Programs |
6th, 7th, 8th, 9th, 10th and 11th Deferral Cycles: it is performed directly in Units (deferred portion in Units)
l. l. Lock-up on the transfer of shares
| (i) | Global Programs |
The Global Plan – ILP CRDIV was paid in payroll respecting the lock-up period initially defined.
| (ii) | Deferral Programs |
6th, 7th, 8th, 9th, 10th and 11th Deferral Cycles: Administrators belonging to the Identified Collective mentioned above may not dispose of units received in this plan for a period of one year from the date of receipt of each lot of Units.
m. criteria and events that, when verified, cause the suspension, change or cancellation of the plan
| (i) | Global Programs |
The plan may be amended for legal or regulatory reasons.
| (ii) | Deferral Programs |
The Plans may be extinguished, suspended or amended, at any time, by the Board of Directors, and in the case of suspension or extinction the rights of participants who already have bonus installments referenced in Units to be received, in the following provisions, must be respected:
· To preserve the objectives of the plan, the total amount of Units must be adjusted to more or less when it occurs: split, grouping or bonus of shares, merger, incorporation, division, other procedures of such nature and relevant meaning; and
· The Human Resources Board, under the supervision of the Executive Committee, will execute the aforementioned quantitative adjustments using the methodologies used by B3 to make similar adjustments in its stock markets.
| 166 |
| |
| (ii.1) | Deferral - 6°, 7°, 8th, 9th, 10th and 11th Cycles: |
The Plan is subject to the Malus and/or Clawback clauses, that is, the Company's Board of Directors, on the recommendation of the Compensation Committee, may approve the reduction and/or return of up to 100% of the value of each participant in the hypotheses previously approved by Internal Governance.
n. effects of the exit of the manager from the bodies of the issuer over his/her rights set in the share-based compensation plan
| (i) | Global Programs |
In case of retirement, due to dismissal without cause, removal, permanent disability or death, the right to surrender the shares will remain as if none of these circumstances had occurred, except for the following changes:
· In the event of death, that right shall be passed on to the successors of the beneficiary;
· The number of shares to be delivered will be the result of multiplying the maximum number of shares established by the quotient resulting from the division between the number of days elapsed between the date of launch of the plan and the date on which the death, retirement, pre-retirement, dismissal, retirement or other circumstance that determines the application of this rule, both including by the number of days of validity of the plan; And
· In case of resignation, the participant loses the right to the plan.
| (ii) | Deferral Programs |
The plan will have its validity extinguished, in advance and in full right, losing the participant the right to participate in the plan and to receive future installments, in the event of dismissal by resignation request, resignation, due to dismissal for just cause pursuant to Article 482 of the Consolidation of Labor Laws or removal of statutory office by unilateral decision of the Company.
In the event of termination of a participant for termination of the employment contract due to acts performed by us, pursuant to Article 483 of the Consolidation of Labor Laws, due to dismissal without cause, due to retirement or in the event of death, the participant will receive at the time of making payments to the other participants of the respective cycle, the amount of the bonus portion referenced in Units applicable to that participant. In the event of death, the delivery will be made to the successors of the participant. In the case of permanent disability of the participant, as evidenced by two medical reports (public and private institution), the participant will receive, at the time of making payments to the other participants of the respective cycle, the amount of the portion of the bonus referenced in Units applicable to that participant.
| 167 |
| |
In the event of suspension of the employment contract due to illness or accident at work, the participant will receive, at the time of making the payments to the other participants of the respective cycle, the amount of the portion of the bonus referenced in Units applicable to that participant.
| 168 |
| |
13.5. In relation to the share-based compensation recognized in the income statement for the last 3 fiscal years and that forecast for the current fiscal year, the Board of Directors and the Board of Officers:
The following tables shows the current expected remuneration for the base year 2021:
| Board of Directors | ||||||||||
| ILP Global CRDIV 2015 | 5TH DEFERRAL CYCLE | 6TH DEFERRAL CYCLE | 7TH DEFERRAL CYCLE | 8TH DEFERRAL CYCLE | 9TH DEFERRAL CYCLE | 10TH DEFERRAL CYCLE | 11TH DEFERRAL CYCLE | |||
| Number of members | 9 | |||||||||
| Number of compensated members | 5 | |||||||||
| Granting shares purchase options | ||||||||||
| Grant date | 2019 | 2015 | 2016 | 2017 | 2018 | 2019 | 2020 | 2021 | ||
| Quantity of options granted | 0 | 0 | 0 | 0 | 0 | 0 | 0 | 0 | ||
| Deadline for options to become exercisable | 2020 | 2016 | 2017 | 2018 | 2019 | 2020 | 2021 | 2022 | ||
| Maximum term to exercise the options | None | 2021 | 2022 | 2023 | 2024 | 2025 | 2026 | 2027 | ||
| Lock-up period for the transfer of shares | None | |||||||||
| Weighted average exercise price: | None | |||||||||
| (a) The options open at the beginning of the financial year | None | |||||||||
| (b) The options lost during the fiscal year | None | |||||||||
| 169 |
| |
| (c) the options exercised during the financial year | None | |||||||||||||||||||||||||
| (d) the options expired during the financial year | None | |||||||||||||||||||||||||
| Fair value of options on the date of grant | None **
| |||||||||||||||||||||||||
| Potential dilution in the case of the exercise of all options granted |
| |||||||||||||||||||||||||
| ** Global plans grant shares and not purchase options. In this way, there is no fair value. | ||||||||||||||||||||||||||
| Maximum dilution. | ||||||||||||||||||||||||||
| Executive Board | ||||||||||||||||||||||||||
| ILP Global CRDIV 2015 | 4TH DEFERRAL CYCLE | 5TH DEFERRAL CYCLE | 6TH DEFERRAL CYCLE | 7TH DEFERRAL CYCLE | 8TH DEFERRAL CYCLE | 9TH DEFERRAL CYCLE | 10TH DEFERRAL CYCLE | 11TH DEFERRAL CYCLE | SOP 2013 | |||||||||||||||||
| Number of members | 45 | |||||||||||||||||||||||||
| Number of compensated members | 45 | |||||||||||||||||||||||||
| Granting share purchase options | ||||||||||||||||||||||||||
| Grant date | 2019 | 2014 | 2015 | 2016 | 2017 | 2018 | 2019 | 2020 | 2021 | 2013 | ||||||||||||||||
| Number of options granted | 0 | 0 | 0 | 0 | 61,238 | 96,079 | 353,078 | 657,843 | 760,732 | 0 | ||||||||||||||||
| Deadline for options to become exercisable | 2020 | 2015 | 2016 | 2017 | 2018 | 2019 | 2020 | 2021 | 2022 | 2016 | ||||||||||||||||
| Maximum period for the exercise of options | None | 2017 | 2021 | 2022 | 2023 | 2024 | 2025 | 2026 | 2027 | 2018 | ||||||||||||||||
| 170 |
| |
| Lock-up period for the transfer of shares | None | None | |||||||||||
| Weighted average exercise price: | None | None | |||||||||||
| (a) The options open at the beginning of the financial year | None | None | |||||||||||
| (b) The options lost during the fiscal year | None | None | |||||||||||
| (c) the options exercised during the financial year | None | None | |||||||||||
| (d) the options expired during the financial year | None | None | |||||||||||
| Fair value of options on the date of grant | None ** | R$5.96 | |||||||||||
| Potential dilution in the case of the exercise of all options granted | |||||||||||||
| ** Global plans grant shares and not purchase options. In this way, there is no fair value. | |||||||||||||
| Maximum dilution. | |||||||||||||
| 171 |
| |
The following tables shows the compensation for the base year 2020:
| Board of Directors | ||||||||||
| ILP Global CRDIV 2015 | 5TH DEFERRAL CYCLE | 6TH DEFERRAL CYCLE | 7TH DEFERRAL CYCLE | 8TH DEFERRAL CYCLE | 9TH DEFERRAL CYCLE | 10TH DEFERRAL CYCLE | 11TH DEFERRAL CYCLE | |||
| Number of members | 9.00 | |||||||||
| Number of compensated members | 4.75 | |||||||||
| Granting share purchase options | ||||||||||
| Grant date | 2019 | 2015 | 2016 | 2017 | 2018 | 2019 | 2020 | 2021 | ||
| Number of options granted | 0 | 0 | 61,653 | 0 | 0 | 0 | 0 | 0 | ||
| Deadline for options to become exercisable | 2020 | 2016 | 2017 | 2018 | 2019 | 2020 | 2021 | 2022 | ||
| Maximum period for the exercise of options | None | 2021 | 2022 | 2023 | 2024 | 2025 | 2026 | 2027 | ||
| Lock-up period for the transfer of shares | None | |||||||||
| Weighted average exercise price: | None | |||||||||
| (a) The options open at the beginning of the financial year | None | |||||||||
| (b) The options lost during the fiscal year | None | |||||||||
| (c) the options exercised during the financial year | None | |||||||||
| (d) the options expired during the financial year | None | |||||||||
| Fair value of options on the date of grant | None ** | |||||||||
| 172 |
| |
| Potential dilution in the case of the exercise of all options granted | ||||||||
| ** Global plans grant shares and not purchase options. In this way, there is no fair value. | ||||||||
| Maximum dilution. | ||||||||
| Executive Board | ||||||||||||||||||||
| ILP Global CRDIV 2015 | 4TH DEFERRAL CYCLE | 5TH DEFERRAL CYCLE | 6TH DEFERRAL CYCLE | 7TH DEFERRAL CYCLE | 8TH DEFERRAL CYCLE | 9TH DEFERRAL CYCLE | 10TH DEFERRAL CYCLE | 11TH DEFERRAL CYCLE | SOP 2013 | |||||||||||
| Number of members | 45.0 | |||||||||||||||||||
| Number of compensated members | 39.0 | |||||||||||||||||||
| Granting stock purchase options | ||||||||||||||||||||
| Grant date | 2019 | 2014 | 2015 | 2016 | 2017 | 2018 | 2019 | 2020 | 2021 | 2013 | ||||||||||
| Number of options granted | 0 | 0 | 0 | 73,759 | 122,061 | 454,039 | 550,811 | 887,949 | 0 | 0 | ||||||||||
| Deadline for options to become exercisable | 2020 | 2015 | 2016 | 2017 | 2018 | 2019 | 2020 | 2021 | 2022 | 2016 | ||||||||||
| Maximum period for the exercise of options | None | 2017 | 2021 | 2022 | 2023 | 2024 | 2025 | 2026 | 2027 | 2018 | ||||||||||
| Lock-up period for the transfer of shares | None | None | ||||||||||||||||||
| Weighted average exercise price: | None | None | ||||||||||||||||||
| (a) The options open at the beginning of the financial year | None | None | ||||||||||||||||||
| 173 |
| |
| (b) The options lost during the fiscal year | None | None | ||||||||||
| (c) the options exercised during the financial year | None | None | ||||||||||
| (d) the options expired during the financial year | None | None | ||||||||||
| Fair value of options on the date of grant | None * * | R$5.96 | ||||||||||
| Potential dilution in the case of the exercise of all options granted | ||||||||||||
| ** Global plans grant shares and not purchase options. In this way, there is no fair value. | ||||||||||||
| Maximum dilution. | ||||||||||||
The following tables shows the compensation for the base year 2019:
| Board of Directors | ||||||||||
| ILP Global CRDIV 2015 | 5TH DEFERRAL CYCLE | 6TH DEFERRAL CYCLE | 7TH DEFERRAL CYCLE | 8TH DEFERRAL CYCLE | 9TH DEFERRAL CYCLE | 10TH DEFERRAL CYCLE | 11TH DEFERRAL CYCLE | |||
| Number of members | 9.9 | |||||||||
| Number of compensated members | 4.8 | |||||||||
| Granting stock purchase options | ||||||||||
| Grant date | 2019 | 2015 | 2016 | 2017 | 2018 | 2019 | 2020 | 2021 | ||
| Number of options granted | 54,809 | 0 | 115,730 | 0 | 0 | 0 | 0 | 0 | ||
| Deadline for options to become exercisable | 2020 | 2016 | 2017 | 2018 | 2019 | 2020 | 2021 | 2022 | ||
| 174 |
| |
| Maximum period for the exercise of options | None | 2021 | 2022 | 2023 | 2024 | 2025 | 2026 | 2027 | ||
| Lock-up period for the transfer of shares | None | |||||||||
| Weighted average exercise price: | None | |||||||||
| (a) The options open at the beginning of the financial year | None | |||||||||
| (b) The options lost during the fiscal year | None | |||||||||
| (c) the options exercised during the financial year | None | |||||||||
| (d) the options expired during the financial year | None | |||||||||
| Fair value of options on the date of grant | None ** | |||||||||
| Potential dilution in the case of the exercise of all options granted | ||||||||||
| ** Global plans grant shares and not purchase options. In this way, there is no fair value. | ||||||||||
| Maximum dilution. | ||||||||||
| Executive Board |
| 175 |
| |
| ILP Global CRDIV 2015 | 4TH DEFERRAL CYCLE | 5TH DEFERRAL CYCLE | 6TH DEFERRAL CYCLE | 7TH DEFERRAL CYCLE | 8TH DEFERRAL CYCLE | 9TH DEFERRAL CYCLE | 10TH DEFERRAL CYCLE | 11TH DEFERRAL CYCLE | SOP 2013 | ||||||||||||
| Number of members | 41.7 | ||||||||||||||||||||
| Number of compensated members | 40.9 | ||||||||||||||||||||
| Granting stock purchase options | |||||||||||||||||||||
| Grant date | 2019 | 2014 | 2015 | 2016 | 2017 | 2018 | 2019 | 2020 | 2021 | 2013 | |||||||||||
| Number of options granted | 364,858 | 0 | 0 | 254,185 | 310,730 | 674,296 | 720,624 | 0 | 0 | 0 | |||||||||||
| Deadline for options to become exercisable | 2020 | 2015 | 2016 | 2017 | 2018 | 2019 | 2020 | 2021 | 2022 | 2016 | |||||||||||
| Maximum period for the exercise of options | None | 2017 | 2021 | 2022 | 2023 | 2024 | 2025 | 2026 | 2027 | 2018 | |||||||||||
| Lock-up period for the transfer of shares | None | None | |||||||||||||||||||
| Weighted average exercise price: | None | None | |||||||||||||||||||
| (a) The options open at the beginning of the financial year | None | None | |||||||||||||||||||
| (b) The options lost during the fiscal year | None | None | |||||||||||||||||||
| (c) the options exercised during the financial year | None | None | |||||||||||||||||||
| (d) the options expired during the financial year | None | None | |||||||||||||||||||
| Fair value of options on the date of grant | None ** | R$5.96 | |||||||||||||||||||
| 176 |
| |
| Potential dilution in the case of the exercise of all options granted | ||||||||||
| ** Global plans grant shares and not purchase options. In this way, there is no fair value. | ||||||||||
| Maximum dilution. | ||||||||||
The following tables shows the compensation for the base year 2018:
| Board of Directors | ||||||||||
| ILP Global CRDIV 2015 | 5TH DEFERRAL CYCLE | 6TH DEFERRAL CYCLE | 7TH DEFERRAL CYCLE | 8TH DEFERRAL CYCLE | 9TH DEFERRAL CYCLE | 10TH DEFERRAL CYCLE | 11TH DEFERRAL CYCLE | |||
| Number of members | 10 | |||||||||
| Number of compensated members | 5 | |||||||||
| Granting stock purchase options | ||||||||||
| Grant date | 2019 | 2015 | 2016 | 2017 | 2018 | 2019 | 2020 | 2021 | ||
| Number of options granted | 86,468 | 0 | 172,510 | 0 | 0 | 0 | 0 | 0 | ||
| Deadline for options to become exercisable | 2020 | 2016 | 2017 | 2018 | 2019 | 2020 | 2021 | 2022 | ||
| Maximum period for the exercise of options | 2021 | 2022 | 2023 | 2024 | 2025 | 2026 | 2027 | |||
| Lock-up period for the transfer of shares | None | |||||||||
| Weighted average exercise price: | None | |||||||||
| (a) The options open at the beginning of the financial year | None | |||||||||
| (b) The options lost during the fiscal year | None | |||||||||
| 177 |
| |
| (c) the options exercised during the financial year | None | |||||||||
| (d) the options expired during the financial year | None | |||||||||
| Fair value of options on the date of grant | None ** | |||||||||
| Potential dilution in the case of the exercise of all options granted | ||||||||||
| ** Global plans grant shares and not purchase options. In this way, there is no fair value. | ||||||||||
| Maximum dilution. | ||||||||||
| Executive Board | |||||||||||||||
| ILP Global CRDIV 2015 | 4TH DEFERRAL CYCLE | 5TH DEFERRAL CYCLE | 6TH DEFERRAL CYCLE | 7TH DEFERRAL CYCLE | 8TH DEFERRAL CYCLE | 9TH DEFERRAL CYCLE | 10TH DEFERRAL CYCLE | 11TH DEFERRAL CYCLE | SOP 2013 | ||||||
| Number of members | 42.17 | ||||||||||||||
| Number of compensated members | 40.83 | ||||||||||||||
| Granting stock purchase options | |||||||||||||||
| Grant date | 2019 | 2014 | 2015 | 2016 | 2017 | 2018 | 2019 | 2020 | 2021 | 2013 | |||||
| Number of options granted | 517.980 | 0 | 0 | 717,317 | 667,771 | 997,429 | 0 | 0 | 0 | 465,988 | |||||
| Deadline for options to become exercisable | 2020 | 2015 | 2016 | 2017 | 2018 | 2019 | 2020 | 2021 | 2022 | 2016 | |||||
| Maximum period for the exercise of options | 2017 | 2021 | 2022 | 2023 | 2024 | 2025 | 2026 | 2027 | 2018 | ||||||
| 178 |
| |
| Lock up period for the transfer of shares | None | None | |||||||||||||
| Weighted average exercise price: | None | None | |||||||||||||
| (a) The options open at the beginning of the financial year | None | None | |||||||||||||
| (b) The options lost during the fiscal year | None | None | |||||||||||||
| (c) the options exercised during the financial year | None | None | |||||||||||||
| (d) the options expired during the financial year | None | None | |||||||||||||
| Fair value of options on the date of grant | None ** | $5.96 | |||||||||||||
| Potential dilution in the case of the exercise of all options granted | |||||||||||||||
| ** Global plans grant shares and not purchase options. In this way, there is no fair value. | |||||||||||||||
| Maximum dilution. | |||||||||||||||
| 179 |
| |
13.6. Regarding the outstanding options of the Board of Directors and Statutory Board at the end of last fiscal year:
As of December 31, 2020, the members of the Company's Board of Directors and Board of Executive Officers had no outstanding options.
13.7. In relation to options exercised and shares delivered regarding the stock-based remuneration for the Board of Directors and Statutory Board in the last three (3) fiscal years:
(i) Global ILP Program
The Plan was closed in December 2018 with a final achievement of 66.88%. The payment corresponding to the SAN shares was made in cash in March 2019 to the participants of the "Grupo Extended" (without lock-up – no restriction of disposal) and for the participants of the Identified Collective was made in March 2020, after the lock-up of 1 year.
Shares delivered - fiscal year ended December 31, 2020
| |||
| Board of Directors | Executive Board | ||
| Crdiv Global ILP | |||
| No. Of members | 9.00 | 45.0 | |
| No. Of paid members | 5.25 | 39.0 | |
| Options exercised | |||
| Number of shares | - | - | |
| Weighted average exercise price | - | - | |
| Difference between the exercise amount and the market value of the shares relating to the options exercised | - | - | |
| Actions delivered | |||
| Number of shares delivered | - | 360,663 | |
| Weighted average purchase price | - | 17.47 | |
| Difference between acquisition value and market value of acquired shares | - | 1.09 | |
(*) ILP Global Plan 2015 - based on shares of Santander Spain (SAN). The payment corresponding to the SAN shares resulting from the achievement of the cash plan on 30/03/2020. Plan closed. | |||
| 180 |
| |
(ii) Local Program
The right to exercise the options for the third Local cycle, SOP 2013 was exercised, according to the information described in the tables below:
This plan was closed on June 30, 2018.
| Exercised options - fiscal year ended 12/31/2018 | ||
| Board of Directors | Board of Executive Officers | |
| SOP 2013 | SOP 2013 | |
| No. of Members | 6.00 | 44.00 |
| No. of Members compensated | 4.17 | 44.50 |
| Options exercised | ||
| Number of shares | - | 465,988 |
| Weighted average price for the fiscal year | - | 12,8423 |
| Difference between the exercise amount and the market value of shares related to options exercised Shares delivered | - | 17,90 |
| shares delivered | ||
| Number of shares delivered | - | 271,306 |
| Weighted average price of acquisition | - | 12,8423 |
| Difference between the value of acquisition and the | - | 17,90 |
13.8. Brief description of information needed to comprehend the data disclosed in items 13.5 to 13.7, such as the explanation of shares and options value pricing method
| A. | Global Program |
| a. | Pricing model |
The Monte Carlo method pricing model (MMC) was used to calculate the fair value. It is a statistical method that simulates the pricing process based on the premise of risk neutrality.
| b. | Data and assumptions used in the pricing model, including the average weighted price of the shares, exercise price, expected volatility, option life term, expected dividends and risk-free interest rate |
Below are the assumptions used in the pricing model.
| 181 |
| |
The exercise price, in all cycles and if the objectives set out in the regulations are met, shall be the market price on the exercise date.
For the ILP CRDIV Plan, the parameters used in pricing were:
| Assumption | 2 years old | 3 years old | 4 years old |
| Future yields | 11.1% aa | 10.8% aa | 9.5% aa |
| Volatility | 32.7% aa | 34.7% aa | 36.9% aa |
| Risk-Free Rate | 1.7% aa | 2.1% aa | 2.5% AA |
| Price correlation compared | 55% | 55% | 55% |
c. Method used and premises assumed to incorporate the expected effects of early exercise
Not applicable, as the model does not allow early exercise.
| d. | How to determine expected volatility |
Estimated based on historical volatility for the respective term.
e. Whether any other characteristic of the option was incorporated in the measurement of the fair value
It does not apply, considering that no other characteristic of the option was incorporated into the measurement of its fair value.
| B. | Local Program |
Not applicable to Deferral Plans, since they have as object the payment, in Units, of part of the Variable Remuneration due by the Company to the participants, in accordance with its remuneration policy.
13.9. Inform the number of shares or shares directly or indirectly held, in Brazil or abroad, and other securities convertible into shares or units issued by the issuer, their direct or indirect controllers, their subsidiaries or companies under common control, by members of the Board of Directors, the Statutory Board or the Audit Committee.
| Company Name: Banco Santander (Brasil) S.A. | ||||
| Board of Directors | ||||
| Final Amount | ||||
| Securities/ Derivatives | Characteristics of the securities | Amount | % participation | |
| Same Species/ Class | Total | |||
| Shares | Ordinary | 2 | 0.00% | 0 |
| Shares | Preferred | - | 0.00% | 0 |
| Shares | Units | 647,722 | 0.00% | 0 |
| 182 |
| |
| Company Name: Banco Santander (Brasil) S.A. | ||||
| Board of Executive Officers | ||||
| Final Balance | ||||
| Securities/ Derivatives | Characteristics of the securities | Amount | % participation | |
| Same Species/ Class | Total | |||
| Shares | Ordinary | 235 | 0.00% | 0 |
| Shares | Preferred | 235 | 0.00% | 0 |
| Shares | Units | 3,065,399 | 0.00% | 0 |
Base date: 31.12.2020
(*) includes the balance for the equivalent persons.
13.10. Pension Plans in force, granted to members of the board and executive officers.
Currently the biggest plan is SantanderPrevi, a plan that since July 2018 is closed for new additions. As of January 2018, the SBPrev Pension Plan was implemented for new employees/administrators and new members.
Participation in the SBPrevi Pension Plan is optional and the monthly contribution of the participant will be equivalent to 2% of salary* (limited to 13 UPs = R$ 6,828.77) + 2% to 9% (to choose) of salary minus 13 UPs.
This amount will be added to a contribution amount made by the Company itself (called matching or counterpart) that varies from 100% to 150% over the years, as shown in the table below.
| Length of time in the plan | Matching Amount of Group ("matching") |
| Less than 3 years | 100% of participant´s contribution/prize |
| From 3 full years to 6 incomplete years | 110% of participant´s contribution/prize |
| From 6 full years to 10 incomplete years | 120% of participant´s contribution/prize |
| From 10 full years to 15 incomplete years | 130% of participant´s contribution/prize |
| As from 15 full years | 150% of participant´s contribution/prize |
As of March 2018, the SantanderPlus Pension Plan was implemented, which, like SantanderPrevi, provides future supplementary income. This plan is restricted to the group of executives who are part of the Collective "SantanderPlus". Participation is optional and the contribution is annual, limited to 12 salaries, with 100% of the contribution made by Santander Brasil.
| 183 |
| |
An executive participates in a Free Benefit Generating Plan (PGBL), established by the Company with Zurich Santander, in which the company assumes the Cost of the Basic Company Account, and the contribution amount is defined according to percentage on the portion of the Applicable Salary.
In the table below, we provide the amounts provided in the supplementary pension plans in 2020.
| TOTAL | ||
| Board of Directors | Board of Officers | |
| Number of members | 1 | 42 |
| Name of plan | Plano de Aposentadoria da Santanderprevi + SBPREV | Plano de Aposentadoria da Santanderprevi + SBPREV |
| Number of administrators who qualify for retirement | n/a | n/a |
| Conditions for early retirement | n/a | n/a |
| Accumulated amount of contributions accrued up to the end of the last fiscal year, less the portion related to contributions made directly by the administrators | 3,465,181 | 141,131,039 |
| Accumulated total amount of contributions made during the last fiscal year, less the portion related to contributions made directly by the administrators | 0 | 43,629,919 |
| Possibility of early redemption and conditions | n/a | n/a |
The accumulated amount as of December 31, 2020 comprises the balance of the amounts added even if redeemed to that date.
| 184 |
| |
13.11. Maximum, minimum and medium individual compensation of the board of directors, the executive board and the audit committee.
· Annual figures
| Board of Executive Officers | Board of Directors | Fiscal Council | |||||||
| 31/12/2020 | 31/12/2019 | 31/12/2018 | 31/12/2020 | 31/12/2019 | 31/12/2018 | 31/12/2020 | 31/12/2019 | 31/12/2018 | |
| Number of members | 45.0 | 41.7 | 42.2 | 9.0 | 9.9 | 10.0 | 6.0 | 2.5 | - |
| Number of paid members | 39.0 | 40.9 | 40.8 | 5.3 | 4.8 | 5.0 | 3.0 | 1.3 | - |
| Value of highest remuneration (Reais) | 46,953,181.92 | 45,325,345.00 | 43,068,683.26 | 1,802,918.40 | 1,752,022.72 | 1,563,056.44 | 139,600.00 | 55,370.00 | - |
| Value of the lowest remuneration (Reais) | 1,791,418.04 | 1,843,405.07 | 2,026,240.06 | 762,000.00 | 769,131.80 | 700,542.46 | 139,600.00 | - | - |
| Average remuneration value (Reais) | 6,495,753.59 | 6,647,842.60 | 6,884,079.47 | 1,018,830.60 | 1,012,232.27 | 772,680.82 | 139,600.00 | 132,888.00 | - |
Observation
| Board of Directors / Board of Executive Officers / Fiscal Council | |
| 31/12/2020 | (i) The amount of the lowest individual remuneration shall not be considered to members who have not exercised their duties within 12 months of the fiscal year in question; And (ii) The amounts do not consider social charges. |
| 31/12/2019 | (i) The amount of the lowest individual remuneration shall not be considered to members who have not exercised their duties within 12 months of the fiscal year in question; And (ii) The amounts do not consider social charges. |
| 31/12/2018 | (i) The amount of the lowest individual remuneration shall not be considered to members who have not exercised their duties within 12 months of the fiscal year in question; And (ii) The amounts do not consider social charges. |
| 185 |
| |
13.12. Describe the contractual arrangements, insurance policies or other instruments that structure remuneration or compensation mechanisms to officers in the case of removal from a position or retirement, indicating the financial consequences to the issuer
Most administrators have signed with us a garden leave agreement, which stipulates that the executives will be obliged for a period of three months after the dismissal not to engage in any professional activity in any other company or financial institution, for payment, by us, of a consideration. This obligation will apply whenever the dismissal of the executive is voluntary and, in the event of involuntary termination, it will be at our discretion to pay such consideration. The consideration corresponds to up to 180 days of the executive's monthly fixed salary, as compensation.
We have an annual renewed Directors & Officers (Directors & Officers) Liability Insurance Policy, with the purpose of ensuring that its directors and administrators pay compensation arising from claims that require compensation for damages caused to third parties or to us as a result of the performance of their duties. The total amount of insurance premiums paid 2020 was R$ 1,183,311.49 and the corresponding year 2021 is not yet fixed.
In accordance with the approval of our board of directors at the meeting held on December 23, 2009, we indemnify our directors, executive directors and members of the Audit Committee in actions related to the positions held by them, exclusively at procedural or administrative costs and to attorneys' fees, except in cases of serious or misdemeanor guilt and/or abuse of power and/or in disagreement with the Bylaws and our internal rules. This letter of indemnity was also issued to the members of the Audit Committee and the remuneration committee and reflects the terms of the D&O Liability insurance policy mentioned in the preceding paragraph.
There are no contractual arrangements, insurance policies or other instruments that structure compensation or indemnification mechanisms for administrators in case of removal from office or retirement.
13.13. In relation to the last three (3) fiscal years, indicate the total remuneration percentage of each body recognized in the income of the issuer in reference to members of the board of directors, executive board or fiscal committee who are related parties to direct or indirect controllers, as defined by the accounting standards that treat this issue.
In the years 2018, 2019 and 2020, no payment was made to members of the Board of Directors or Board of Executive Officers who were parties related to the direct or indirect controlling shareholders of the Company.
| 186 |
| |
13.14. Relation to the last three (3) fiscal years, indicate the values recognized in the income of the issuer as remuneration to the members of the board of directors, statutory board or fiscal committee, grouped by body, for any reason other than the function occupied, such as, for example, commissions and consulting or assistance services rendered
Not applicable, as there is no value recorded in the result as compensation earned by the members of the Board of Directors of the Company, Board of Executive Officers or Fiscal Council in the last three fiscal years other than as a result of the position they held.
13.15. In relation to the last 3 fiscal years, indicate the recognized values in the income of controllers, directly or indirectly, of companies under common control and controlled by issuer, such as remuneration of members of the board of directors, of the statutory board, or of the fiscal committee of the issuer, grouped by body, specifying within which meaning those values were attributed to those individuals
The members of the Board of Directors of the Company who hold executive offices at Santander Spain, the holding company of Company, as well as all other directors and officers, do not receive compensation abroad concerning the office held in Brazil.
In year 2018, three non-executive members of the Board of Directors of Company held executive offices at Santander Spain, the holding company of Company, and were paid EUR 14,697,012 as compensation for such offices.
In year 2019, three non-executive members of the Board of Directors of Company held executive offices at Santander Spain, the holding company of Company, and were paid EUR 13.021.681 as compensation for such offices.
In 2020, three members of the Non-Executive Board of Directors of the Company performed executive functions at Santander Spain, the holding company of Company, and were paid EUR 10,034,509 for these functions.
| Fiscal Year 2018 | Board of Directors | Board of Executive Officers | Fiscal Council | Total |
| Direct and indirect controlling shareholders | 14,697,012 EUR | 0 | 0 | 14,697,012 EUR |
| Controlled companies of issuer | 0 | 0 | 0 | 0 |
| Companies under common control | 0 | 0 | 0 | 0 |
| Fiscal Year 2019 | Board of Directors | Board of Executive Officers | Fiscal Council | Total |
| Direct and indirect controlling shareholders | 13,021,681 EUR | 0 | 0 | 13,021,681 EUR |
| Controlled companies of issuer | 0 | 0 | 0 | 0 |
| Companies under common control | 0 | 0 | 0 | 0 |
| 187 |
| |
| Fiscal Year 2020 | Board of Directors | Board of Executive Officers | Fiscal Council | Total |
| Direct and indirect controlling shareholders | 10,034,509 EUR | 0 | 0 | 10,034,509 EUR |
| Controlled companies of issuer | 0 | 0 | 0 | 0 |
| Companies under common control | 0 | 0 | 0 | 0 |
|
13.16. Provide other information as deemed relevant by the issuer
There is no other information pertaining to this topic that the Company deems relevant that are not described in the other items in Section 13.
|
| 188 |
Banco Santander (Brasil) S.A. | ||
| By: | /S/ Amancio Acurcio Gouveia | |
Amancio Acurcio Gouveia Officer Without Specific Designation | ||
| By: | /S/ Angel Santodomingo Martell | |
Angel Santodomingo Martell Vice - President Executive Officer | ||