UNITED STATES
SECURITIES AND EXCHANGE COMMISSION
SECURITIES AND EXCHANGE COMMISSION
Washington, D.C. 20549
FORM 6-K
REPORT OF FOREIGN PRIVATE ISSUER PURSUANT TO RULE 13a-16 OR 15d-16 UNDER THE
SECURITIES EXCHANGE ACT OF 1934
For the month of March, 2023
Commission File Number: 001-34476
BANCO SANTANDER (BRASIL) S.A.
(Exact name of registrant as specified in its charter)
Avenida Presidente Juscelino Kubitschek, 2041 and 2235
Bloco A – Vila Olimpia
São Paulo, SP 04543-011
Federative Republic of Brazil
Bloco A – Vila Olimpia
São Paulo, SP 04543-011
Federative Republic of Brazil
(Address of principal executive office)
Indicate by check mark whether the registrant files or will file annual reports under cover of Form 20-F or Form 40-F: Form 20-F ___X___ Form 40-F _______
Indicate by check mark if the registrant is submitting the Form 6-K in paper as permitted by Regulation S-T Rule 101(b)(1):
Yes _______ No ___X____
Indicate by check mark if the registrant is submitting the Form 6-K in paper as permitted by Regulation S-T Rule 101(b)(7):
Yes _______ No ___X____
Indicate by check mark whether by furnishing the information contained in this Form, the Registrant is also thereby furnishing the information to the Commission pursuant to Rule 12g3-2(b) under the Securities Exchange Act of 1934:
Yes _______ No ___X____
If “Yes” is marked, indicate below the file number assigned to the registrant in connection with Rule 12g3-2(b): N/A

 |
SUMMARY
| 1. Message from the Board of Directors | 4 |
| 2. Call Notice of Meeting | 5 |
| 3. Participation of shareholders in the OGM | 7 |
| 4. Matters to be resolved at the OGM | 12 |
| EXHIBIT I: TEMPLATE OF POWER OF ATTORNEY | 15 |
| EXHIBIT II: COMMENTS OF THE MANAGEMENT TO THE FINANCIAL CONDITION OF THE COMPANY | 17 |
| EXHIBIT III: BOARD PROPOSAL FOR ALLOCATION OF NET PROFIT FOR THE FISCAL YEAR | 74 |
| EXIBIT IV: PROPOSAL FOR ELECTION OF THE COMPANY'S BOARD OF DIRECTORS | 83 |
| Exhibit V: ITEM 8 of the Reference Form | 91 |
|
1. Message from the Board of Directors
Dear Shareholder,
It is with great pleasure that I invite you, a shareholder of Banco Santander (Brasil) S.A. (“Santander Brasil” or “Company”), to participate in our Ordinary General Meeting (“OGM”), to be held on April 28, 2023, at 3:00 P.M.
Besides this Management Proposal (“Proposal”) a Manual for Participation in the OGM (“Manual”) was prepared to assist you in understanding the matters presented, providing a conscious and reasoned decision-making process, anticipating possible clarifications and voting guidelines.
Pursuant to the Call Notice made available, we shall take resolutions on the following matters:
(i) To TAKE the management accounts, to examine, discuss and vote on the Company’s Financial Statements related to the fiscal year ended on December 31, 2022, accompanied by the Management Report, the balance sheet, other parts of the financial statements, external auditors’ opinion and the Audit Committee Report;
(ii) To DECIDE on the allocation of net income for the year 2022 and the distribution of dividends;
(iii) To FIX the number of members that will compose the Board of Directors in the mandate from 2023 to 2025;
(iv) To ELECT the members of the Company's Board of Directors for a term of office from 2023 to 2025; and
(v) To FIX the annual global compensation of the Company´s management and members of Audit Committee.
As established by the Brazilian Securities and Exchange Commission (CVM), in order to facilitate its analysis and evaluation of the matters to be resolved on our OGM, this Proposal includes exhibits containing the information made available in addition to the Call Notice.
We are at your disposal to clarify any questions through the emails acionistas@santander.com.br oriented at non-financial individual and corporate investors and ri@santander.com.br for institutional investors.
We hope that this Proposal and the Manual fulfills its purpose in assisting your decision making. Your participation is essential for the Company.
Sincerely,
Deborah Stern Vieitas
Vice Chairwoman of the Board of Directors
|
2. Call Notice of Meeting
[to be published in the newspaper “Valor Econômico” in editions of March 28, 29 and 30, 2023]
BANCO SANTANDER (BRASIL) S.A.
Publicly-Held Company of Authorized Capital
CNPJ/MF 90.400.888/0001-42 - NIRE 35.300.332.067
NOTICE OF MEETING – ORDINARY GENERAL MEETING - Shareholders are hereby invited to attend the Ordinary General Meeting (“OGM”) to be held on April 28, 2023, at 3:00 PM, at the principal place of business of Banco Santander (Brasil) S.A. (“Santander Brasil” or “Company”), located at Avenida Presidente Juscelino Kubitschek No. 2235 and 2014 – 2nd mezzanine, Vila Olímpia, São Paulo/SP, to resolve upon the following Agenda:
(i) To TAKE the management accounts, to examine, discuss and vote on the Company’s Financial Statements related to the fiscal year ended on December 31, 2022, accompanied by the Management Report, the balance sheet, other parts of the financial statements, external auditors’ opinion and the Audit Committee Report;
(ii) To DECIDE on the allocation of net income for the year 2022 and the distribution of dividends;
(iii) To FIX the number of members that will compose the Board of Directors in the mandate from 2023 to 2025;
(iv) To ELECT the members of the Company's Board of Directors for a term of office from 2023 to 2025; and
(v) To FIX the annual global compensation of the Company´s management and members of Audit Committee.
Observation for participation and Vote during the Meeting
Participation in the Meeting: Shareholders, their legal representatives or attorneys-in-fact may participate in the Meeting in any of the following ways:
In person - The shareholders or their legal representatives shall appear at the OGM with the appropriate identity documents. In the event of representation of a shareholder by an attorney-in-fact, shareholders shall leave at the Company's principal place of business, at least seventy-two (72) hours before the OGM is held, a power of attorney granted according to the applicable law;
Remote Voting Ballot: the Company implemented the remote voting system pursuant to CVM Resolution 81/22, enabling our Shareholders to send remote voting ballots directly to the Company, to the bookkeeper or through their respective custodian agents, in accordance with the procedures described in the General Meeting Participation Manual.
|
Our recommendation to the shareholders is to make use of remote voting instruments, either by the electronic means available or by sending written votes to the Company, or granting standardized powers of attorney with voting guidance, according to the instructions provided in the Management Proposal for the OGM to be held in April 28, 2023.
General Instructions
1. As provided in CVM Resolution No. 70/22, the minimum percentage of participation in the voting capital required for the application of the multiple voting process for the election of the members of the Board of Directors is 5%;
2. As provided in § 2 of article 161 of Law No. 6,404/76 and art. 4 of CVM Resolution No. 70/22, the installation of the Fiscal Council by the General Meeting shall occur at the request of shareholders representing at least 2% (two percent) of the shares with voting rights, or 1% (one per cent) of non-voting shares; and
3. The documents related to the matters to be examined and resolved at the OGM are available to shareholders (i) at the Company's principal place of business, at Avenida Presidente Juscelino Kubitschek, nº 2041 Wtorre JK, 9th floor - Corporate Legal Department, where they can be consulted, on working days, from 10:00 a.m. until 4:00 p.m., and on its website (www.ri.santander.com.br – at Corporate Governance >> Minutes of the Meeting); (ii) on the website of the Brazilian Securities and Exchange Commission (www.cvm.gov.br) and (iii) on the website of B3 S.A. - Brasil, Bolsa, Balcão (http://www.b3.com.br).
São Paulo, March 27, 2023 – Deborah Stern Vieitas – Vice Chairwoman of the Board of Directors.
___________________________________________________
|
3. Participation of shareholders in the OGM
Santander Brasil shareholders may participate in the OGM in person, by a duly appointed proxy, as specified in item 3.2 below, or by Remote Voting.
Shareholders will be required to provide the following documents to participate in the OGM:
| Individual: | · identity document with photo[1] (original or copy) · proof of ownership of the shares issued by the Company, issued by the depository and/or custodian financial institution (original or copy) |
| Legal entity: | · corporate documents that prove the legal representation of the shareholder (original or copy)[2] · legal representative's identity document with photo (original or copy) |
| Investment fund | · identity document of the legal representative of the Investment Fund’s manager (or of the manager, as the case may be) with photo (original or copy) · simple copy of the last consolidated bylaws of the fund and of the Articles of Association or Organization of its manager, in addition to the corporate documentation granting powers of representation (minutes of election of the officers and/or power of attorney) |
3.1. In-person Participation
Santander Brasil shareholders may participate in the OGM by attending the place where it will be held and declaring their vote, according to the types of shares they own (common and/or preferred), and the matters to be voted on. In accordance with the provisions of Article 126 of Law No. 6,404/76, shareholders shall attend the Shareholders' Meeting presenting, in addition to the identity document, proof of ownership of the shares issued by the Company, issued by the depository and/or custodian financial institution. The Company recommends that said proof be issued within two (2) business days before the date scheduled for the Meeting.
[1] The following documents may be presented: (i) General Registration Identity Card (RG); (ii) Foreigner Registration Identity Card (RNE); (iii) Valid passport; (iv) Class Organization Card valid as a civil identity for legal purposes (e.g.: OAB, CRM, CRC, CREA); or (v) National Driver's License (CNH) with photo.
[2] Articles of Incorporation/Organization e Minutes/Instruments of election of legal representatives registered with the competent body.
|
Corporate shareholders, such as companies and investment funds, shall be represented in accordance with their Articles of Association, Articles of Organization or Bylaws, delivering documents proving the regularity of the representation, accompanied by the Minutes of the election of the Managers, if applicable, at the place and term indicated in the item below. Prior to the OGM, the shareholders shall sign the Attendance Book. Shareholders without voting rights may attend the OGM and discuss all matters submitted for resolution.
3.2. Participation by Proxy
The shareholder may be represented at the OGM by an attorney-in-fact, duly appointed under a public or private instrument, and pursuant to article 126, § 1 of the Corporations Act, the attorneys-in-fact shall have been appointed less than one (1) year ago, and they shall be (i) shareholders of the Company, (ii) managers of the Company, (iii) lawyers, or (iv) financial institutions, with the investment fund’s manager being responsible for representing the quotaholders.
The originals or copies of the documents mentioned above may be delivered at the Company's principal place of business by the time the OGM is held.
However, in order to facilitate shareholders' access to the OGM, we recommend that the delivery of such documents be made at least seventy-two (72) hours before the OGM is held.
In the case of submittal of documents via email, we request that the shareholder contact the Company, so that the originals or copies can be delivered by the day the OGM is held.
In case the Shareholder is unable to attend the OGM or cannot yet be represented by an attorney-in-fact of his/her/their choice, the Company will make available an attorney-in-fact to vote for the shareholder, in accordance with his/her/their voting instructions, according to the power of attorney template in Exhibit I to this Proposal.
Furthermore, it should be noted that in addition to the power of attorney, the shareholder shall forward the documents required by the Company to participate in the OGM, as provided for in item 3 above.
The documents shall be delivered at the Company’s principal place of business, at Avenida Presidente Juscelino Kubitschek, No. 2041 and 2235 – Bloco A - Vila Olímpia - São Paulo – SP, 9th floor – Corporate - Legal Department, email: rafael.faria@santander.com.br.
3.3. Remote Voting Participation
Pursuant to articles 21-A et seq. of CVM Ruling No. 481/2009, the Company's shareholders may also vote at shareholders’ meetings by means of remote voting, to be formalized through the “remote voting ballot” (“Ballot”), the template of which is available in the Corporate Governance area of the Company’s Investor Relations website (www.ri.santander.com.br), or on the website of the Brazilian Securities and Exchange Commission – CVM (http://sistemas.cvm.gov.br/?CiaDoc).
|
The shareholder that chooses to exercise his/her/their voting rights remotely shall do so by one of the options described below:
(I) Submittal of the Ballot to Custody agents
The Shareholder that chooses to cast remote voting through his/her/its respective custodian agent (“Custodian") shall convey his/her/their voting instructions in accordance to the rules determined by the Custodian, which shall forward said voting ballots to the Central Depository of B3 S.A. - Brasil, Bolsa, Balcão. Shareholders shall contact his/her/their respective Custodians to check the procedures established by them for issuance of ballot voting instructions, as well as the documents and information required to do so.
The Shareholder shall convey the instructions for completion of the Ballot to his/her/their Custody agents by 04/20/2023 (including), unless defined otherwise by them.
(II) Submittal of the Ballot by the Shareholder to the Bookkeeper
The Shareholder who chooses to cast the remote vote through the Company's Bookkeeper shall observe the following instructions, so that the Ballot can be deemed valid and the votes are counted:
(i) all fields shall be duly completed;
(ii) all pages shall be initialed;
(iii) the last page shall be signed by the Shareholder or his/her/their legal representative(s), as applicable, and in accordance with the applicable legislation.
The following documents shall be forwarded to the Bookkeeper:
(i) original copy of the Ballot, duly completed, initialed and signed; and
(ii) copy of the following documents:
- Individual (Shareholder or legal representative): Identity document with photo (RG and CPF; CNH or Professional Card duly attested by the competent authorities, containing CPF number).
- Legal entity: (i) Articles of Organization or Bylaws duly updated, with the documents proving the powers of representation (minutes of election); (ii) Identity document with photo of the representatives (RG and CPF; CNH or Professional Card duly attested by the competent authorities, containing CPF number).
- Investment fund: (i) Latest consolidated Regulations for the fund, as well as the Bylaws or Articles of Organization of its manager, in addition to the corporate documentation that grants proxy powers (minutes of officers’ election and/or power of attorney); (ii) Identity Card with a photograph of the representatives (RG and CPF; CNH (driver’s license) or official Professional Card containing the CPF enrollment number).
The documents shall be sent to the Bookkeeper within 7 days before the date of the OGM, in other words, by 04/20/2023 (including) (i) at the following address: Banco Santander (Brasil) S.A. – Shareholders – Bookkeeping of Shares – Rua Amador Bueno, 474 – 2nd floor – Setor vermelho - Santo Amaro – São Paulo/SP – CEP 04752- 005; or (ii) via email, to the electronic address custodiaacionistavotodistancia@santander.com.br.
|
After receiving the documents, the Bookkeeper, within three (3) days, will inform the Shareholder regarding the receipt of the documents and their acceptance. If the submitted documentation is not considered suitable, the Ballot shall be considered invalid, and the Shareholder may regularize it by 04/20/2023.
Ballots received by the Bookkeeper after 04/20/2023 shall be disregarded.
(III) Submittal of the Ballot directly to the Company
The Shareholder who chooses to cast the remote vote through the Company shall observe the following instructions, so that the Ballot can be deemed valid and the votes are counted:
(i) all fields shall be duly completed;
(ii) all pages shall be initialed;
(iii) the last page shall be signed by the Shareholder or his/her/its legal representative(s), as applicable, and in accordance with the applicable legislation.
The following documents shall be forwarded to the Company:
(i) original copy of the Ballot, duly completed, initialed and signed; and
(ii) copy of the following documents:
- Individual (Shareholder or legal representative): Identity document with photo (RG and CPF; CNH or Professional Card duly attested by the competent authorities, containing CPF number).
- Legal entity: (i) Articles of Organization or Bylaws duly updated, with the documents proving the powers of representation (minutes of election); (ii) Identity document with photo of the representatives (RG and CPF; CNH or Professional Card duly attested by the competent authorities, containing CPF number).
- Investment fund: (i) Last consolidated bylaws of the fund and of the Articles of Association or Organization of its manager, in addition to the corporate documentation granting powers of representation (minutes of election of the officers and/or power of attorney) (ii) Identity document with photo of the representatives (RG and CPF; CNH or Professional Card duly attested by the competent authorities, containing CPF number).
The documents shall be sent to the Company within 7 days before the date of the OGM, in other words, by 04/20/2023 (including) (i) at the following address: Banco Santander (Brasil) S.A. - Investor Relations - Avenida Presidente Juscelino Kubitscheck, 2235 - 26th floor - Vila Olímpia - São Paulo/SP - CEP 04543-011; or (ii) via email, to the electronic address ri@santander.com.br.
After receiving the documents, the Company, within three (3) days, will inform the Shareholder regarding the receipt of the documents and their acceptance. If the submitted documentation is not considered suitable, the Ballot shall be considered invalid, and the Shareholder may regularize it by 04/20/2023.
Ballots received by the Company after 04/20/2023 shall be disregarded.
|
General Information:
Ø in accordance with Article 44 of CVM Resolution nº 81/22, the Central Depository of B3 S.A. - Brasil, Bolsa, Balcão, upon receiving the voting instructions from the shareholders through their respective custody agents shall disregard any diverging instructions in relation to the same resolution that has been issued by the same CPF or CNPJ registration number; and
Ø upon termination of the deadline for remote voting, in other words, by 04/20/2023 (including), the shareholder will not be able to change the voting instructions already sent, except if attending the Shareholders' Meeting or represented by power of attorney, upon express request for disregard of the voting instructions sent through the Ballot, before the respective matter(s) is subject to voting.
3.4. ADS holders
Holders of American Depositary Shares (ADSs) shall be given the right to vote on the matters listed on the Agenda, subject to the same criteria applied in relation to national investors, according to the type of shares (common or preferred) on which their ADSs are backed. ADS holders will be duly instructed by The Bank of New York Mellon, depository institution for ADSs backed by Santander Brasil shares.
|
4. Matters to be resolved at the OGM
Below you shall find clarifications made by the Company’s management regarding each of the items to be resolved in the OGM. According to the Call Notice made available to the shareholders, our OGM shall take resolutions regarding the following matters of the Agenda:
4.1 To TAKE the management accounts, to examine, discuss and vote on the Company’s Financial Statements related to the fiscal year ended on December 31, 2022, accompanied by the Management Report, the balance sheet, other parts of the financial statements, external auditors’ opinion and the Audit Committee Report.
The documents presented by the management are:
i. Management Report showing the operating statistics and the analysis and discussion of the Administrative Officers of the principal accounts of the Statement of Income for the Fiscal Year;
ii. Comments of the administrative officers on the financial condition of the Company (Exhibit II - Item 2 of the Reference Form);
iii. Copy of the Financial Statements and Explanatory Notes;
iv. Opinion of the Independent Auditors;
v. Summary of the report of the Audit Committee; and
vi. Standardized financial statements form – DFP.
The management documents identified above, except for item ii above, were made available to the CVM, via the IPE system, at the time of disclosure of the individual and consolidated financial statements of the Company prepared in accordance with Accounting Practices Adopted in Brazil applicable to institutions authorized to operate by the Brazilian Central Bank, on February 2nd, 2023, and for the consolidated financial statements of the Company in accordance with the IFRS as issued by the IASB made available on February 28th, 2023. These documents can be found on the electronic address of CVM (www.cvm.gov.br), or of the Company (www.ri.santander.com.brand www.santander.com.br/acionistas), according to information shown in Exhibit II to this Management Proposal.
The Company's management proposes that the shareholders examine in detail the management accounts and the Company's Financial Statements so that they can deliberate about their approval.
|
4.2. To DECIDE on the allocation of net income for the year ended on December 31, 2022 and the distribution of dividends
(a) Net Profit Allocation
The Executive Board presents a proposal for the fiscal year 2022 net profit allocation in compliance with the provisions of Article 10, first paragraph, item II and the respective Annex A to CVM Resolution 81/22. Said proposal is contained in the Exhibit III to this Management Proposal. We recommend the careful reading of said exhibit.
The net profit of the Company in the fiscal year 2022 was R$ 12,358,521,447.76.
Management proposes the following allocation for net income for the year 2022:
1. The amount of R$ 617,926,072.39, to the Company’s legal reserve account;
2. The amount of R$6,800,000,000.00, as dividends and Interest on Equity to shareholders, which have been the object of decision in the meetings of the Board of Directors held on February 01, 2022; April 14, 2022; August 05, 2022; and Ocotober 13, 2022, of which R$5,280,000,000.00 as and Interest on Equity allocated within the mandatory minimum dividends and R$ 1,520,000,000.00 as interim dividends; and
3. The balance of the remaining net profit after the distributions above, to the value of R$ 4,940,595,375.37, for the Dividend Equalization Reserve account, pursuant to Article 36, item III-a of the Company's Bylaws.
The board understands that the proposal for allocation of net profits above was formulated in accordance with the legal and statutory obligations applicable to the Company, and is in line with the goals and strategies of the Company, which is why the board recommends its approval without restrictions.
(b) Distribution of Dividends
As better detailed in the Exhibit III to this Management Proposal, the Company management has approved the distribution to its shareholders the global amount of R$6,800,000,000.00, as dividends and Interest on Equity to the shareholders, which have been the object of decision in the meetings of the Board of Directors held on February 01, 2022; April 14, 2022; August 05, 2022; and Ocotober 13, 2022, of which R$5,280,000,000.00 as and Interest on Equity allocated within the mandatory minimum dividends and R$ 1,520,000,000.00 as interim dividends and were paid to shareholders based on their respective shares in the share capital of the Company.
|
4.3. To FIX the number of members that will compose the Board of Directors in the mandate from 2023 to 2025
The Company’s management proposes that the Board of Directors comprises of 10 members for a term of office to be effective between the OGM of 2023 and the Ordinary General Meeting of 2025.
4.4. To ELECT the members of the Company's Board of Directors for a term of office from 2023 to 2025
After complying with the applicable governance approvals, the Company proposes to the OGM the election for a new term of two (2) years, of the following candidates recommended by the controlling shareholders to compose the Board of Directors of the Company:
| Name | Position |
| Deborah Stern Vieitas | Chairwoman and Independent Director |
| Jose Antonio Alvarez Alvarez | Vice-Chairman |
| Angel Santodomingo Martell | Director |
| Deborah Patricia Wright | Independent Director |
| Ede Ilson Viani | Director |
| José de Paiva Ferreira | Independent Director |
| José Garcia Cantera | Director |
| Marília Artimonte Rocca | Independent Director |
| Mario Roberto Opice Leão | Director |
| Pedro Augusto de Melo | Independent Director |
The information related to the election of the members of the Board of Directors of the Company, pursuant to article 11 of CVM Resolution 81/22, can be found in the Exhibit IV to this Management Proposal.
4.5. To FIX the annual global compensation of the Company´s management and members of Audit Committee
The management presents a proposal for remuneration of the Company’s management, complying with the provisions of Article 13, items I and II of CVM Resolution 81/22 and item 8 of the Reference Form of the Company, on the terms of Exhibit IV to this Manegment Proposal
For the period from January to December, 2023, the amount proposed by the management as the annual global compensation for the Company’s management (Board of Directors and Executive Board) is of up to R$ 500,000,000.00 (five hundred million Brazilian Reais), covering fixed remuneration, variable remuneration and the stock base remuneration.
The amount proposed by the Board of Directors as annual global compensation of the members of the Audit Committee for the twelve (12) months period counting from January 1st, 2023 is of up to R$ 4,000,000.00 (four million Brazilian Reais).
|
EXHIBIT I:
TEMPLATE OF POWER OF ATTORNEY
[SHAREHOLDER], [QUALIFICATION] (“Grantor”), appoints as his/her/its attorneys-in-fact Messrs. CAROLINA SILVIA ALVES NOGUEIRA TRINDADE, Brazilian, married, registered with OAB/RJ under no. 182.414 and under the CPF/ME under no. 124.143.167.13; and RAFAEL TRIDICO FARIA, Brazilian, married, registered with OAB/SP 358.447 and under the CPF/ME under no. 409.544.508-41, both of them lawyers, with commercial address in the Capital City of the State of São Paulo, at Avenida Presidente Juscelino Kubitschek Nos. 2041 and 2235 - Bloco A - Vila Olímpia (“Grantees”) to represent, collectively or individually, regardless of the order of appointment, the Grantor, as shareholder of Banco Santander (Brasil) S.A. ("Company"), at the Company's Ordinary General Meeting to be held, on first call, on April 28, 2023, at 3:00 PM, at the Company's principal place of business, at Avenida Presidente Juscelino Kubitschek No. 2235 and 2041 - 2nd mezzanine, Vila Olímpia, São Paulo/SP, and if necessary on second call, on a date to be informed in due course, to whom powers are granted to attend the meeting and vote, on behalf of the Grantor, in accordance with the voting guidelines set forth below for each of the items on the Agenda:
(i) To TAKE the management accounts, to examine, discuss and vote on the Company’s Financial Statements related to the fiscal year ended on December 31, 2022, accompanied by the Management Report, the balance sheet, other parts of the financial statements, external auditors’ opinion and the Audit Committee Report.
( ) For ( ) Against ( ) Abstention
(ii) To DECIDE on the allocation of net income for the year 2022 and the distribution of dividends.
( ) For ( ) Against ( ) Abstention
(iii) To FIX the number of members that will compose the Board of Directors in the mandate from 2023 to 2025.
( ) For ( ) Against ( ) Abstention
(iv) To ELECT the members of the Company's Board of Directors for a term of office from 2023 to 2025
( ) For ( ) Against ( ) Abstention
(v) To FIX the annual global compensation of the Company´s management and members of Audit Committee;
( ) For ( ) Against ( ) Abstention
The Grantees are hereby authorized to abstain from any resolution or act for which they have not received, at their discretion, sufficiently specific voting guidelines. The Grantor shall hold the Grantees above harmless and free from any and all claims, disputes, demands, losses, or damages, of any nature, arising from the fulfillment of this instrument, except in cases of acts performed in an abusive and excessive manner, pursuant to the legislation in effect.
|
This power of attorney shall only be valid for the Company's Ordinary General Meeting mentioned above.
[Local], [month] [day], 2023.
_____________________________________________
[Signature of Grantor]
|
EXHIBIT II
COMMENTS OF THE MANAGEMENT TO THE FINANCIAL CONDITION OF THE COMPANY
(Pursuant to Item III of the article 10 of CVM Resolution 81/22)
2.1. Officers should comment on:
a. general financial and equity conditions
At the end of the fourth quarter of 2022, Banco Santander observed the median of the projections of economic agents regarding the performance of the Brazilian economy indicate growth of the Brazilian GDP of 3.0% in 2022 compared to the expansion of 5.0% in the previous year. The projection for 2022 is higher than that observed at the end of the third quarter and, in the Bank's assessment, was influenced by the recent publication that the effective result observed in that period was in line with the median of market expectations, despite the bullish revision in the previous results of the historical series, indicating greater robustness of the Brazilian economy in 2022. It seems to us that robustness is directly linked to the maintenance of the fiscal and tax incentives previously approved and that were implemented throughout the second half of the year. The economic activity data released fell short of our estimate of GDP growth in the previous quarter – we estimated a rise of 4.2% – but we believe that the frustration was directly linked to the revision mentioned in the historical series and not to the change in recent growth dynamics. Along with the stimuli mentioned earlier, this picture has led us to alter our expectation about what the expansion will be in 2022. Instead of the previous 2.6% estimate, we currently project growth of 3.0% in 2022.
In the last quarter of 2022, the Bank witnessed the year-on-year variation of the IPCA decline to 5.8% from the level of 7.2% observed at the end of the third quarter. Despite the retreat, the level reached was still above the 3.5% target set for 2022. The Bank understands that this inflationary environment and the balance of risks were the motivators for the Central Bank of Brazil to have justified the maintenance of the basic rate at 13.75% p.a. between the end of the third quarter of 2022 and the previous quarter. Santander believes that this approach to the Selic rate increases the chance that inflation will converge to the targets set within the time horizon relevant to monetary policy, especially after the signaling of the elected government that it will increase the amount of public spending from next year, which could make the disinflation process slower. In this sense, the Bank projects that the Selic rate will reach 12.00% p.a. by the end of 2023 and 9.0% p.a. at the end of 2024.
Regarding the behavior of the exchange rate, Banco Santander saw the price of the Brazilian currency against the U.S. dollar fluctuate between R$5.02/US$ and R$5.53/US$ in the fourth quarter and end the period quoted at R$5.22/US$. That is, below the price of R $ 5.41 / US $ verified at the end of the third quarter. The volatility demonstrated by the real's trajectory is in line with our prediction that the exchange rate will have limited room to register significant appreciation in the coming years. In fact, we project that the exchange rate will reach $5.40/$ by the end of 2023 and $5.50/$$ by the end of 2025.
|
The aforementioned performances took place in the midst of an international environment that the Bank judged unfavorable and that had as highlights the following themes: 1) maintenance of inflationary pressures around the globe; 2) signaling of more extensive adjustment in U.S. monetary policy; 3) intensification in the pace of normalization of monetary policy in the Eurozone and; 4) new outbreaks of COVID-19 contamination in China, raising fears of an intense slowdown in that country's economy that would trigger a global recession of great magnitude. In the domestic environment, Santander understands that the main themes were the following: 1) closing of the presidential election without damage to the Brazilian institutional framework; 2) approval of a constitutional amendment authorizing the elected government to increase the amount of public expenditures not subject to the public spending ceiling rule from 2023 and ; 3) deterioration in the expectations of economic agents regarding the beginning of the process of reducing the SELIC rate in 2023 (previously, they pointed to the possibility of cuts at the beginning of the year and, currently, they indicate a chance for the second half of 2023).
| (i) | 2022 |
For the year ended December 31, 2022, we reported consolidated net income of R$14.4 billion, a decrease of 7.8% compared to 2021. Total assets for the year ended December 31, 2022 reached R$985,451 million, an increase of 5.8% over 2021. Shareholders' equity reached R$110,183 million and adjusted ROAE (excluding the effect of goodwill) was 14.2% in 2022.
Our Basel capital adequacy ratio, in accordance with Central Bank regulations, was 13.9% as of December 31, 2022.
As of December 31, 2022, our portfolio of loans and advances to gross customers grew by 6.3% to R$524,655 million, compared to R$493,355 million as of December 31, 2021.
The following table presents a managerial breakdown of our portfolio of loans and advances to customers (gross) by customer category on the dates indicated.
For the year ended December 31 | Variations between December 31, 2022 vs. December 31, 2021 | ||||
2022 | 2021 | 2020 | R$ million | % | |
| (in millions of R$, except percentages) | |||||
| Individual | 243.399 | 203.678 | 174.042 | 39.721 | 17,0% |
| Consumer finance | 58.824 | 55.441 | 51.637 | 3.383 | 7,4% |
| Small and Medium Enterprises | 62.916 | 59.602 | 54.525 | 3.314 | 9,3% |
| Large Companies (1) | 159.516 | 174.634 | 137.618 | (15.118) | 26,9% |
| Total | 524.655 | 493.355 | 417.822 | 31.300 | 18,1% |
| (1) | Companies with annual gross revenues in excess of R$200 million, including our global corporate clients. |
Our total funding as of December 31, 2022 was R$732,691 million, an increase of 6.4% compared to R$688,645 million at December 31, 2021.
| (ii) | 2021 |
For the year ended December 31, 2021, we reported consolidated net income of R$15.6 billion, an increase of 15.7% compared to 2020. Total assets for the year ended December 31, 2021 reached R$931,208 million, a decrease of 0.3% compared to 2020. Shareholders' equity reached R$105,974 million and adjusted ROAE (excluding the effect of goodwill) was 20.2% in 2021.
Our Basel capital adequacy ratio, in accordance with Central Bank regulations, was 14.9% as of December 31, 2021.
|
As of December 31, 2021, our portfolio of loans and advances to gross customers grew by 18.1% to R$493,355 million, compared to R$417,822 million as of December 31, 2020.
The following table presents a managerial breakdown of our portfolio of loans and advances to customers (gross) by customer category on the dates indicated.
For the year ended December 31 | Variations between December 31, 2021 vs. December 31, 2020 | ||||
2021 | 2020 | 2019 | R$ million | % | |
| (in millions of R$, except percentages) | |||||
| Individual | 203.678 | 174.042 | 156.177 | 29.636 | 17,0% |
| Consumer finance | 55.441 | 51.637 | 48.421 | 3.804 | 7,4% |
| Small and Medium Enterprises | 59.602 | 54.525 | 53.119 | 5.077 | 9,3% |
| Large Companies (1) | 174.634 | 137.618 | 89.539 | 37.016 | 26,9% |
| Total | 493.355 | 417.822 | 347.257 | 75.533 | 18,1% |
| (1) | Companies with annual gross revenues in excess of R$200 million, including our global corporate clients. |
Our total funding as of December 31, 2021 was R$688,645 million, an increase of 6.4% compared to R$647,465 million at December 31, 2020.
| (ii) | 2020 |
For the year ended December 31, 2020, we reported consolidated net income of R$13.4 billion, a decrease of 19.1% compared to 2019. Total assets for the year ended December 31, 2020 reached R$936,201 million, an increase of 22.8% over 2019. Shareholders' equity reached R$106,090 million and adjusted ROAE (excluding the effect of goodwill) was 18.4% in 2020.
Our Basel capital adequacy ratio, in accordance with Central Bank regulations, was 15.3% as of December 31, 2020.
As of December 31, 2020, our portfolio of loans and advances to gross customers grew by 20.3% to R$417,822 million, compared to R$347,257 million as of December 31, 2019.
The following table presents a managerial breakdown of our portfolio of loans and advances to customers (gross) by customer category on the dates indicated.
For the year ended December 31 | Variations between December 31, 2020 vs. December 31, 2019 | ||||
2020 | 2019 | 2018 | R$ million | % | |
| (in millions of R$, except percentages) | |||||
| Individual | 174.042 | 156.177 | 133.603 | 17.865 | 11,4% |
| Consumer finance | 51.637 | 48.421 | 40.964 | 3.216 | 6,6% |
| Small and Medium Enterprises | 54.525 | 53.119 | 49.624 | 1.406 | 2,6% |
| Large Companies (1) | 137.618 | 89.539 | 97.112 | 48.079 | 53,7% |
| Total | 417.822 | 347.257 | 321.303 | 70.565 | 20,3% |
| (1) | Companies with annual gross revenues in excess of R$200 million, including our global corporate clients. |
Our total funding as of December 31, 2020 was R$647,465 million, an increase of 24.5% compared to R$519,664 million at December 31, 2019.
|
b. capital structure:
| Liability Structure | ||||||
| LIABILITIES In millions of Reais | Dec/22 | % of total liabilities | Dec/21 | % of total liabilities | Dec/20 | % of total liabilities |
| Own Capital – Shareholders Equity (1) |
110.680 | 11% | 105.974 | 11% | 106.089 | 11% |
| Third Party Capital – Short Term (2) |
602.245 | 61% | 427.965 | 46% | 591.257 | 64% |
| Third Party Capital – Long Term (2) |
272.526 | 28% | 366.988 | 43% | 236.232 | 25% |
| Total Liabilities | 985.451 | 100% | 931.208 | 100% | 933.578 | 100% |
(1) Includes Non-Controlling Participation
(2) Current liabilities
(3) Total liabilities, except Shareholders' Equity and Current Liabilities
Debt ratio, according to the formula: third-party capital / total assets x 100, is 89.
In addition, the following table shows the direct shareholding (common and preferred shares) as of December 31, 2022:
Major Shareholders | Common stock | Percentage of Outstanding Common Shares | Preferred Shares | Percentage of Outstanding Preferred Shares | Total Shares (thousands) | Percentage of Total Capital Stock |
| Sterrebeeck BV (1) | 1.809.583.330 | 47,387 | 1.733.643.596 | 47,112 | 3.543.226.926 | 47,252 |
| Grupo Empresarial Santander SL (1) | 1.627.891.019 | 42,630 | 1.539.863.493 | 41,846 | 3.167.754.512 | 42,245 |
| Santander Bank, S.A. | 2.696.163 | 0,071 | - | - | 2.696.163 | 0,036 |
| Directors / Executives (2) | 3.860.825 | 0,101 | 3.860.824 | 0,105 | 7.721.649 | 0,103 |
| Treasury Shares | 31.138.524 | 0,825 | 31.138.524 | 0,846 | 62.277.048 | 0,831 |
| Other minority shareholders | 343.525.170 | 8,996 | 371.329.583 | 10,091 | 714.854.753 | 9,533 |
| Total | 3.818.695.031 | 100,000 | 3.679.836.020 | 100,000 | 7.498.531.051 | 100,000 |
| (1) | It includes members of the Company's senior management. |
| (2) | An affiliate of Grupo Santander |
| (i) | Equity and Non-Controlling Shareholder Participation |
As of December 31, 2022, the Company's capital stock was R$55,000,000,000.00, fully paid up and divided into 7,498,531,051 shares, all nominative, book-entry and without par value.
In accordance with our current bylaws, our capital stock may be increased to the limit of the authorized capital, regardless of statutory changes, by resolution of our Board of Directors and through the issuance of up to 9,090,909,090 new shares, being established that the total number of preferred shares may not exceed 50.0% of the total number of shares. in circulation. Any capital increase exceeding this limit requires shareholder approval.
|
| (ii) | Equity and Third Parties |
Revenue from equity instruments for the year ended December 31, 2022 totaled R$38 million, a decrease of R$52 million from R$90 million for the year ended December 31, 2021, mainly due to higher dividend gains from an investment fund, Santander Fundo de Investimento Amazonas Multimercado Crédito Privado de Investimento no Exterior, in 2021 compared to 2022.
Profit from equity instruments for the year ended December 31, 2021 totaled R$90 million, an increase of R$56 million over the R$19 million year ended December 31, 2020, mainly due to higher dividend gains received from an investment fund, Santander Investment Fund Amazonas Multimarket Private Investment Credit Abroad as a result of gains in equity positions in the direction of hedges. of derivatives, R$84.8 million.
| (iii) | Benchmark Equity – Basel Index |
Our capital management is based on conservative principles with continuous monitoring of items that affect our level of solvency. We are obliged to comply with Brazilian capital adequacy regulations in accordance with the rules of the Central Bank of Brazil. In October 2013, the new capital implementation regulations and regulatory capital requirements of the Basel Committee on Banking Supervision (Basel III) came into force in Brazil. The minimum regulatory capital requirement is currently 11%. The Tier I requirement is 6.0%, divided into basic capital of at least 4.5%, consisting primarily of share capital and profit reserves, including shares, units of ownership, reserves and income earned, and additional capital consisting primarily of certain reserves, earned income, and securities and hybrid instruments as capital authorized by the Central Bank of Brazil.
According to the new rules on regulatory capital in Brazil, the value of the goodwill for the calculation of the capital base was deducted in accordance with the "phase-in" for implementation of Basel III in Brazil, which was completed on January 1, 2019. The following table presents the percentage of goodwill deduction required for each year up to 2022:
Basel III Phase in | |||||
2017 | 2018 | 2019 | 2020 | 2021 | 2022 |
| 80% | 100% | 100% | 100% | 100% | 100% |
Source: Central Bank of Brazil; Resolution No. 4,192 of the Central Bank of Brazil of March 2013.
For the base year 2022, the Reference Equity requirement was 10.625%, including 8.00% Minimum Reference Equity, plus 1.625% Additional Capital Conservation and 1.00% Systemic Additional. The Level I Reference Equity reaches 8.625% and the Minimum Principal Capital 7.125%.
In the month of October 2021 the Additional Capital Conservation increased to 2.00%. Thus, in December the requirement of PR is 11.00%. It is considered 8.00% of Minimum Reference Equity added to 2.00% of Additional Capital Conservation and 1.00% of Systemic Addition, with the requirement of PR Level I of 9.00% and Minimum Principal Capital of 7.50%. From April 2022 the PR requirement will reach 11.50%, considering 8.00% of Minimum Reference Equity added to 2.50% of Additional Capital Conservation and 1.00% of Systemic Addition, with requirement of PR Level I and Minimum Main Capital of 9.50% of 8.00%, respectively.
|
On December 31, | ||||||
2022(1) | 2021(1) | 2020(1) | ||||
| (In millions of R$, except percentages) | ||||||
| Level I Reference Assets | 75.943,7 | 76.969,9 | 77.571,5 | |||
| Main Capital | 69.229,0 | 69.919,9 | 71.006,3 | |||
| Complementary Capital | 6.714,7 | 7.050,1 | 6.565,2 | |||
| Level II Reference Assets | 13.109,8 | 12.591,3 | 6.554,4 | |||
| Reference Heritage (Level I and II) | 89.053,5 | 89.561,3 | 84.125,9 | |||
| Required Reference Assets | 638.635,9 | 600.741,3 | 551.569,1 | |||
| Credit Risk Portion (2) | 559.230,6 | 527.119,3 | 478.303,5 | |||
| Market Risk Portion (3) | 19.332,1 | 15.122,2 | 15.846,2 | |||
| Operational Risk Portion | 60.073,2 | 58.499,8 | 57.419,4 | |||
| Basel Index Level I | 11,89% | 12,81% | 14,06% | |||
| Basel Capital Main Index | 10,84% | 11,64% | 12,87% | |||
| Basel Index | 13,94% | 14,91% | 15,25% | |||
| (1) | Values calculated based on the consolidated information of the Prudential Consolidated. |
| (2) | To calculate the allocation of capital for credit risk, modifications and inclusions of BACEN circular 3,714 of August 20, 2014, BACEN circular 3,770 of October 29, 2015, which amends circular 3,644 of March 4, 2013, were considered. |
| (3) | Includes the portions for market risk exposures subject to changes in foreign currency coupon rates (PJUR2), price indices (PJUR3) and interest rate (PJUR1/PJUR4), commodity prices (PCOM), the price of shares classified in the trading book (PACS) and portions for exposure of gold, foreign currency and operations subject to exchange variation (PCAM). |
c. ability to pay in relation to financial commitments entered into
Our Executive Board understands that we present sufficiently adequate financial and patrimonial conditions for the payments of our commitments.
The management of our payment capacity is done dynamically through the implementation of limits and control models, approved and monitored by the Assets and Liabilities Committee (ALCO), which acts in accordance with the guidelines and procedures established by the Santander Group and the Central Bank. The control and management of the ability to pay are carried out through the analysis of cash flow positions, structural liquidity and simulations of potential losses of resources under stress scenarios. A funding plan is also elaborated that takes into account the best structuring of the sources of funding to achieve the necessary diversification in terms of maturities, instruments and markets in addition to the establishment of contingency plans. These controls, together with the maintenance of a minimum liquidity margin, guarantee sufficient resources to honor customer deposits and other obligations, grant loans and financing to clients, meet their own working capital needs for investment and address any risks related to liquidity crises.
We actively manage the risks intrinsic to commercial banking activity, such as the structural risks of interest rates, liquidity and exchange rates. Our goal of financial management is to make net interest income from business activities more stable and recurring while maintaining adequate levels of liquidity and solvency. Financial management also analyzes the structural interest rate risk derived from divergences between the maturity dates and revision of assets and liabilities in each of the currencies we operate.
The following tables show the intervals between pricing dates of financial assets and liabilities with different maturity dates, at December 31, 2022, 2021 and 2020, respectively (liquidity position):
|
| 2022 | In millions of Reais | ||||||
| In sight | Up to 3 months | 3 to 12 months | 1 to 3 years | 3 to 5 years | After 5 years | Total | |
| Assets: | |||||||
| Availability | 21.589 | 415 | - | - | - | - | 22.003 |
| Debt instruments (2) | 16.743 | 6.128 | 24.067 | 51.980 | 33.417 | 70.577 | 202.913 |
| Equity instruments | 2.474 | 43 | 116 | 2 | - | 3 | 2.639 |
| Loans and other amounts with credit institutions | 54 | 542 | 10.740 | 8.724 | 641 | 13 | 20.713 |
| Loans and advances to customers | 11.271 | 123.503 | 117.101 | 152.555 | 38.944 | 47.255 | 490.630 |
| Derivatives | 6 | 4.365 | 2.828 | 4.661 | 3.034 | 7.081 | 21.976 |
| Reserves at the Central Bank of Brazil | 96.850 | 30.787 | - | - | - | - | 127.637 |
| Total | 148.987 | 165.784 | 154.853 | 217.923 | 76.035 | 124.930 | 888.511 |
| Liabilities: | |||||||
| Financial liabilities at amortized cost: | |||||||
| Deposits of credit institutions (1) | 356 | 95.792 | 237 | 14.469 | 2.902 | 2.323 | 116.079 |
| Customer Deposits (1) | 77.835 | 185.159 | 98.821 | 85.233 | 42.787 | 119 | 489.953 |
| Securities obligations (1) | 2.206 | 12.356 | 32.545 | 44.723 | 10.150 | 5.140 | 107.121 |
| Equity Eligible Debt Instruments | - | 6.787 | 876 | 1.359 | 1.527 | 8.990 | 19.538 |
| Other financial liabilities | 186 | 35.254 | 3.660 | 23.346 | 88 | 59 | 62.593 |
| Short positions | - | 144 | 3.084 | 4.575 | 5.396 | 8.848 | 22.047 |
| Derivatives | - | 5.077 | 3.131 | 5.367 | 2.976 | 2.149 | 18.699 |
| Total | 80.583 | 340.569 | 142.354 | 179.073 | 65.825 | 27.628 | 836.031 |
| 2021 | In millions of Reais | ||||||
| In sight | Up to 3 months | 3 to 12 months | 1 to 3 years | 3 to 5 years | After 5 years | Total | |
| Assets: | |||||||
| Availability | 15.431 | 1.227 | - | - | - | - | 16.657 |
| Debt instruments (2) | 1.612 | 119.780 | 20.353 | 5.835 | 38.904 | 38.728 | 225.212 |
| Equity instruments | - | - | - | - | - | 2.528 | 2.528 |
| Loans and other amounts with credit institutions | 11.177 | 2.717 | 1.749 | 10.828 | 15 | - | 26.485 |
| Loans and advances to customers | 70.399 | 82.203 | 84.986 | 152.609 | 31.902 | 42.744 | 464.844 |
| Derivatives | - | 8.668 | 2.836 | 1.646 | 5.990 | 2.001 | 21.140 |
| Reserves at the Central Bank of Brazil | 69.179 | 15.737 | - | - | - | - | 84.916 |
| Total | 167.798 | 230.332 | 109.923 | 170.916 | 76.811 | 86.000 | 841.783 |
| Liabilities: | |||||||
| Financial liabilities at amortized cost: | |||||||
| Deposits of credit institutions (1) | 10.052 | 60.636 | 39.748 | 6.681 | 1.657 | 2.230 | 121.006 |
| Customer Deposits (1) | 86.052 | 79.688 | 56.178 | 163.642 | 83.327 | 75 | 468.961 |
| Securities obligations (1) | - | 28.052 | 5.039 | 35.844 | 9.342 | 760 | 79.037 |
| Equity Eligible Debt Instruments | - | 5.553 | - | 14.089 | - | - | 19.641 |
| Other financial liabilities | 3.935 | 771 | 9.962 | 11.673 | 35.108 | - | 61.449 |
| Short positions | - | 12.781 | - | - | - | - | 12.781 |
| Derivatives | 642 | 7.240 | 2.504 | 9.117 | 3.773 | 1.343 | 24.619 |
| Total | 100.681 | 194.720 | 113.431 | 241.046 | 133.206 | 4.409 | 787.493 |
|
| 2020 | In millions of Reais | ||||||
| In sight | Up to 3 months | 3 to 12 months | 1 to 3 years | 3 to 5 years | After 5 years | Total | |
| Assets: | |||||||
| Availability | 7.374 | 12.775 | - | - | - | - | 20.149 |
| Debt instruments (2) | 433 | 13.196 | 33.904 | 64.226 | 70.18 | 48.162 | 230.103 |
| Equity instruments | - | - | - | - | - | 2.329 | 2.329 |
| Loans and other amounts with credit institutions | - | 2.778 | 35.728 | 15.155 | 363 | 48 | 54.073 |
| Loans and advances to customers | 29.386 | 80.282 | 93.750 | 98.550 | 47.161 | 44.640 | 393.768 |
| Derivatives | - | 14.558 | 1.994 | 4.104 | 1.870 | 3.721 | 26.248 |
| Reserves at the Central Bank of Brazil | 58.777 | 57.355 | - | - | - | - | 116.132 |
| Total | 95.969 | 180.943 | 165.377 | 182.035 | 119.576 | 98.901 | 842.801 |
| Liabilities: | |||||||
| Financial liabilities at amortized cost: | |||||||
| Deposits of credit institutions (1) | - | 83.923 | 43.315 | 3.764 | - | 655 | 131.657 |
| Customer Deposits (1) | 85.433 | 139.191 | 121.805 | 62.769 | 36.578 | 38 | 445.814 |
| Securities obligations (1) | - | 8.815 | 18.736 | 28.158 | 747 | 418 | 56.876 |
| Equity Eligible Debt Instruments | - | 220 | - | 12.899 | - | - | 13.120 |
| Other financial liabilities | 23 | 21.859 | 20.730 | 17.203 | 5 | 2 | 59.823 |
| Short positions | - | 45.808 | - | - | - | - | 45.808 |
| Derivatives | - | 2.047 | 1.974 |
5.388 | 7.744 | 12.204 | 29.357 |
| Total | 85.457 | 301.863 | 206.560 | 130.181 | 45.075 | 13.317 | 782.454 |
| (1) | They include obligations that may have anticipated chargeability, being: demand and term deposits, committed operations with customers, LCI and LCA. |
The following table shows financial assets and liabilities by domestic and foreign currency as of December 31, 2022, 2021 and 2020 (currency position):
|
On December 31, | ||||||
2022 | 2021 | 2020 | ||||
National Currency | Foreign currency | National Currency | Foreign currency | National Currency | Foreign currency | |
| (in millions of R$) | ||||||
| Assets | ||||||
| Cash and reserves at the Central Bank | 11.346 | 10.657 | 5.806 | 10.851 | 4.532 | 15.617 |
| Debt instruments | 185.814 | 17.098 | 208.132 | 17.080 | 226.787 | 3.315 |
| Equity instruments | 19.784 | 929 | 22.689 | 3.797 | 50.553 | 3.520 |
| Loans and other amounts with credit institutions, gross | 416.127 | 74.503 | 398.335 | 66.509 | 372.946 | 3.520 |
| Loans and advances to customers, gross | 2.582 | 57 | 2.483 | 45 | 2.329 | 20.822 |
| Total | 635.653 | 103.244 | 637.445 | 98.282 | 657.147 | 43.274 |
| Liabilities | ||||||
| Financial liabilities at amortized cost | ||||||
| Deposits of the Central Bank and credit institutions | 59.366 | 56.713 | 62.332 | 58.674 | 86.564 | 45.093 |
| Customer deposits | 457.188 | 32.765 | 468.961 | — | 445.814 | — |
| Securities obligations | 92.638 | 14.483 | 66.028 | 13.009 | 45.477 | 9.399 |
| Capital Eligible Debt Instruments | 19.538 | — | — | 19.641 | — | 13.120 |
| Other financial liabilities | 71.371 | 143 | 68.496 | 413 | 66.708 | 153 |
| Total | 700.101 | 104.104 | 665.817 | 84.877 | 646.563 | 67.765 |
|
d. sources of financing for working capital and for investments in used non-current assets
The following table presents the composition of the fundraisers on the dates indicated:
On December 31, | |||
2022 | 2021 | 2020 | |
| (in millions of R$) | |||
| Customer deposits | 489.953 | 468.961 | 445.814 |
| Current accounts | 26.607 | 41.742 | 35.550 |
| Savings accounts | 60.171 | 65.249 | 62.210 |
| Time deposits | 339.943 | 280.955 | 269.929 |
| Repurchase agreements | 63.232 | 81.014 | 78.124 |
| Transactions backed by Private Securities (1) | 17.309 | 20.103 | 14.944 |
| Operations guaranteed by Public Securities | 45.923 | 60.911 | 63.180 |
| Deposits of the Central Bank of Brazil and credit institutions | 116.079 | 121.006 | 131.657 |
| Demand deposits | 3.521 | 126 | 296 |
| Time deposits (2) | 87.824 | 75.755 | 76.489 |
| Repurchase agreements | 24.734 | 45.125 | 54.872 |
| Transactions backed by Private Securities (1) | 70 | 13.478 | 13.844 |
| Operations guaranteed by Public Securities | 24.664 | 31.647 | 41.028 |
| Total deposits | 606.033 | 589.967 | 577.470 |
| Negotiable debt securities | 107.121 | 79.037 | 56.876 |
| Agribusiness Letters of Credit | 24.045 | 16.989 | 14.747 |
| Financial Letters | 33.713 | 25.074 | 12.750 |
| Real Estate Credit Notes | 34.854 | 24.021 | 19.979 |
| Securities and other securities | 14.508 | 12.952 | 9.399 |
| Debt Instruments Eligible to Compose Tier 1 and Tier 2 Capital | 19.538 | 19.641 | 13.120 |
| Total Funding | 732.691 | 688.645 | 647.466 |
| __________________ |
| (1) | It mainly refers to committed operations backed by debentures. |
| (2) | It includes operations with credit institutions linked to export and import financing lines, transfers from BNDES and FINAME and abroad in other lines of credit abroad. |
| (i) | Deposits |
| · | Customer Deposits: Our customer deposit balance was R$489.9 billion as of December 31, 2022, R$468.9 billion as of December 31, 2021 and R$445.8 billion as of December 31, 2020, representing 66.9%, 68.1% and 68.9% of our total financing, respectively. |
| · | Current Accounts: Our current account balance was R$ 26.6 billion at December 31, 2022, R$ 41.7 billion at December 31, 2021 and R$ 35.6 billion at December 31, 2020, representing 4.4%, 7.1% and 6.2% of total deposits, respectively. |
| · | Savings Accounts: Our savings account balance was R$ 60.2 billion at December 31, 2022, R$ 65.2 billion at December 31, 2021 and R$ 62.2 billion at December 31, 2020, representing 9.9%, 11.1% and 10.8% of total deposits, respectively. |
| · | Customer Time Deposits: Our balance of customer term deposits was R$339.9 billion as of December 31, 2022, R$281.0 billion as of December 31, 2021 and R$269.9 billion as of December 31, 2020, representing 56.1%, 47.6% and 46.7% of total deposits, respectively. |
| · | Repurchase Agreements: We maintain a portfolio of Brazilian public and private sector debt instruments used to obtain overnight funds from other financial institutions or investment funds through the sale of such securities and simultaneously agreeing to repurchase them. Due to the short-term nature (overnight) of this source of financing, such transactions are volatile and generally composed of Brazilian public securities and repurchase agreements linked to debentures. Securities sold in committed operations decreased to R$63.2 billion at December 31, 2022, from R$81.0 billion at December 31, 2021 and R$78.1 billion at December 31, 2020, representing 10.4%, 13.7% and 13.5% of total deposits, respectively. |
|
| (ii) | Central Bank Deposits and Credit Institutions |
Our balance of deposits from the Central Bank of Brazil and credit institutions was R$ 116.1 billion at December 31, 2022, R$ 121.0 billion at December 31, 2021 and R$ 131.7 billion at December 31, 2020, representing 19.2%, 20.5% and 22.8% of total deposits, respectively.
Our deposit balance mainly includes national loans and Transfers Obligations:
| · | Loan obligations. We have relationships with banks around the world, providing lines of credit linked to foreign currencies (either to the dollar or to a basket of foreign currencies). We apply the proceeds of these transactions primarily to loan operations linked to the U.S. dollar and, in particular, to trade finance operations. |
| · | National Transfers. Loans from public institutions, mainly BNDES and FINAME, for which we act as a financial agent. Financing these sources in Brazil represents a method of providing long-term loans with attractive average interest rates for certain sectors of the economy. The loans of these funds are allocated by the BNDES, through banks, to specific sectors focused on economic development. This type of loan is known as a "pass-through." Because the funds passed on are usually paired and/or financed by loans from a federal government agency, we do not assume risk of term or interest rate incompatibility, nor do we charge interest at a fixed margin on the cost of the funds. However, we retain the borrower's commercial credit risk and therefore have discretion in the decision of the loan and in the application of the credit criteria. This type of financing is not affected by the requirement of compulsory deposit. The transfer is usually guaranteed, although it is not required by the terms of the transfer. |
| (iii) | Other Means of Funding |
| (iii.1) | Debt Securities |
Our balance of negotiable debt securities was R$107.1 billion as of December 31, 2022, R$79.0 billion as of December 31, 2021, and R$56.9 billion as of December 31, 2020, representing 14.6%, 11.5% and 8.8% of our total financing, respectively.
The Agribusiness Letter of Credit, which are freely negotiable credit notes and represent an unconditional promise of payment in cash, are issued exclusively by financial institutions and related to credit rights originated from transactions carried out between rural producers and their cooperatives and agents of the agribusiness production chain and foreign exchange acceptances, reached R$ 24.0 billion on December 31, 2022, R$ 17.0 billion at December 31, 2021 and R$ 14.7 billion at December 31, 2020.
|
Financial Letters are an alternative financing available to banks that can be characterized as senior or eligible to compose the reference equity, under the terms of CMN Resolution No. 5,007, of March 24, 2022, its minimum term must be 24 months and must be issued for a minimum amount of R $ 300,000 for subordinated transactions and R $ 50,000 for senior transactions. Our treasury bills balance totaled $33.7 billion as of December 31, 2022, an increase of 34.5% from December 31, 2021.
Real Estate Letters of Credit increased by 45.1%, from R$ 24.0 billion on December 31, 2021 to R$ 34.9 billion on December 31, 2022.
We issue securities, including under our Global Medium-Term Billing Program. Our balance of securities and other securities was $14.5 billion as of December 31, 2022 and $13.0 billion as of December 31, 2021. This change was mainly due to the fact that in 2022 we issued a higher aggregate value of securities than those that matured that year.
| (iv) | Eligible Instruments to compose Level I and Level II |
On November 5, 2018, our board of directors approved the issuance, through our agency in the Cayman Islands, of debt instruments to form part of our benchmark Tier 1 and Tier 2 equity in the total amount of $2.5 billion, pursuant to an offer made to non-U.S. persons pursuant to Regulation S of the U.S. Securities Act of 1993, as amended, or the "Offer of Notes". Our Note Offering was structured as follows: (i) $1.25 billion indexed at 7.25% per annum without maturity (perpetual) and interest paid semi-annually; and (ii) US$ 1.25 billion indexed at 6.125% per year due in November 2028 and interest paid semi-annually. These issues were made through our Cayman Islands branch and, as a result, do not generate liability for income tax at source. In addition, our board of directors also approved the redemption of debt instruments issued to be part of our Tier 1 and Level 2 regulatory capital as set forth in the board's resolution of January 14, 2014. The proceeds of the Note Offering were used to finance this redemption. On December 18, 2018, the Central Bank of Brazil authorized the operations contemplated in the Offer of Notes and the redemption, which were concluded on January 29, 2019.
In November and December 2021, Santander Brasil issued Financial Bills with subordination clause, to be used to compose our Level 2 reference equity, in the total amount of R$ 5.5 billion. The Financial Letters have a term of ten years and redemption and repurchase options in accordance with the applicable regulations. Financial Bills had an estimated 92 basis point impact on our Tier 2 benchmark equity.
As of December 31, 2022, the balance of Level 1 and Level 2 debt instruments was R$19.5 billion compared to R$19.6 billion as of December 31, 2021. This reduction of 0.5% was due to the non-replacement of certain debt instruments that reached maturity. The value remained virtually stable when compared to 2021, as no notes were issued or matured in 2022.
| (v) | Subordinated Debt |
As of December 31, 2022, we had no subordinated debts.
|
e. Sources of financing for working capital and for investments in non-current assets that you intend to use to cover liquidity deficiencies
Due to our stable and diversified sources of fundraising, which include a large deposit base of their clients as detailed in paragraph 2.1.d above, we have historically had no liquidity issues.
As part of our liquidity risk management, we have a formal plan with measures to be taken in scenarios of systemic liquidity crisis and/or arising from any risk to our corporate image. This liquidity contingency plan contains parameters of attention, as well as preventive measures and actions to be triggered in times of liquidity deficiency, if the reserves fall below certain parameters.
As sources of financing for working capital and for investments in non-current assets used to cover liquidity shortfalls, the following resources may be used: (i) deposit raising; (ii) securities issuances; (iii) transactions committed to public/private securities; (iv) transfer pricing review; (v) establishment of more restrictive credit policies; and (vi) release of guarantee margin at B3 S.A. – Brasil Bolsa, Balcão.
f. levels of indebtedness and the characteristics of such debts, further describing:
| (i) | relevant loan and financing agreements |
There are no loan agreements or other debt instruments that our management deems to be relevant to us, with the exception of the securities representing debt of our issuance described in Section 12 of the Reference Form.
| (ii) | other long-term relationships with financial institutions |
Our main sources of funds are local deposits in the form of cash and term accounts, in line with other Brazilian banks, as well as borrowings in the open market, namely, bonds of own issue and bonds of the Federal Government with commitment to repurchase ("committed operations").
We also have deposits in credit institutions related to export and import financing lines raised from banks abroad and intended for application in foreign exchange commercial operations related to export and import financing. We are also part of long-term obligations via transfers, all in accordance with the operational policies of the BNDES system.
| (ii.1) | Eurobonds and Securitization Notes - MT100 |
External issues of securities denominated in foreign currency include securities and other securities (Eurobonds and Structured Notes). The following table shows the detailed composition of Eurobonds:
| Emission | Maturity | Interest Rate (a.a.) | 2022 | 2021 | 2020 |
| 2018 | 2025 | 4,4% | - | 306.253 | 4.213.777 |
| 2019 | 2027 | Up to 6.4% + CDI | 32.204 | 1.189.699 | 1.279.506 |
| 2020 | 2027 | Up to 6.4% + CDI | 90.069 | 3.363.551 | 3.905.993 |
| 2021 | 2031 | Up to 9% + CDI | 6.306.335 | 8.092.563 | - |
| 2022 | 2035 | Up to 9% + CDI | 8.079.519 | - | - |
| Total | 14.508.127 | 12.952.066 | 9.399.276 |
|
| (ii.2) | Subordinated debts |
We use subordinated debt instruments in its funding structure, represented by securities issued in accordance with the rules of the Central Bank, which are used as Reference Equity - Level 2, to calculate the operational limits, including Subordinated CDBs, certificates of deposit issued by us in the local market, in various issues, at interest rates updated by the CDI or the IPCA.
| (iii) | degree of subordination between debts |
In case of our judicial or extrajudicial liquidation there is a preference order regarding the payment of the various creditors of the mass provided for by law, which must be respected under the Brazilian legislation in force at the time. Specifically, with regard to the financial debts that make up our indebtedness, the following payment order must be observed: debts guaranteed by collateral, unsecured debts and subordinated debts. It is worth mentioning that, in relation to debts with real guarantee, creditors prefer to others up to the limit of the asset given as collateral and, as far as it remains, will have their credits included in the payment order of the creditors. Among the creditors there is no degree of subordination, just as there is no degree of subordination between the various subordinated creditors.
(iv) any restrictions imposed on the Company, in particular, in relation to debt limits and contracting of new debts, the distribution of dividends, the disposal of assets, the issuance of new securities and the sale of corporate control, as well as whether the Company has been complying with these restrictions
Regarding securities issued abroad, whose descriptions of operations and programs are described in Item 12.7 of the Reference Form ("Securitization Program" and "Medium Term Notes – MTN"), the main restrictions imposed on the issuer, existing in financing agreements, are also described in the same item.
g. limits on contracted financing and percentages already used
The information requested in this item is not applicable to financial institutions. We are subject, however, to the parameters determined by the monetary authorities, in line with the Basel principles.
h. material changes in items in the income and cash flow statements
| (i) | Assets and Liabilities (in millions of reais): |
| Assets | 2022 | 2021 | Var. 2022x2021 | 2020 | Var. 2021x2020 |
| Availability and Reserves at the Central Bank of Brazil | 22.003 | 16.657 | 32,1% | 20.149 | -17,3% |
| Financial Assets Measured at Fair Value in Earnings | 58.547 | 18.859 | 210,4% | 60.900 | -69,0% |
| Financial Assets Measured at Fair Value in Earnings Held for Trading | 84.834 | 70.571 | 20,2% | 95.843 | -26,4% |
| Financial Assets Not Intended for Trading Mandatorily Measured at Fair Value in Earnings | 2.134 | 870 | 145,3% | 500 | 74,0% |
| Financial Assets Measured at Fair Value in Other Comprehensive Results | 55.426 | 101.242 | -45,3% | 109.740 | -7,7% |
| Financial Assets Measured at Amortized Cost | 663.824 | 633.241 | 4,8% | 554.925 | 14,1% |
| Derivatives Used as Hedge | 1.741 | 342 | 409,1% | 743 | -54,0% |
| Non-Current Assets Held for Sales | 699 | 816 | -14,3% | 1.093 | -25,3% |
| Participations in Affiliates and Joint Ventures | 1.728 | 1.232 | 40,3% | 1.095 | 12,5% |
| Tax Credits | 46.446 | 41.757 | 11,2% | 41.064 | 1,7% |
| Other Assets | 8.275 | 6.049 | 36,8% | 7.222 | -16,2% |
| Tangible Asset | 8.191 | 8.783 | -6,7% | 9.537 | -7,9% |
| Intangible Asset | 31.603 | 30.787 | 2,7% | 30.766 | 0,1% |
| Total Assets | 985.451 | 931.208 | 5,8% | 933.578 | -0,3% |
|
The following are the main changes in balance sheet accounts for the financial years 2022, 2021 and 2020.
| Liabilities and Equity | 2022 | 2021 | Var. 2022x2021 | 2020 | Var. 2021x2020 |
| Financial Liabilities for Trading | 40.747 | 36.953 | 10,3% | 75.020 | -50,7% |
| Financial Liabilities Measured at Fair Value in Earnings | 8.922 | 7.460 | 19,6% | 7.038 | 6,0% |
| Financial Liabilities at Amortized Cost | 795.284 | 750.094 | 6,0% | 707.289 | 6,1% |
| Derivatives Used as Hedge | - | 447 | -100,0% | 145 | 208,3% |
| Provisions | 9.115 | 11.604 | -21,4% | 13.815 | -16,0% |
| Tax Liabilities | 7.811 | 8.175 | -4,5% | 10.130 | -19,3% |
| Other Obligations | 12.892 | 10.501 | 22,8% | 14.051 | -25,3% |
| Total Liabilities | 874.771 | 825.234 | 6,0% | 827.489 | -0,3% |
| Equity | 114.669 | 109.046 | 5,2% | 106.205 | 2,7% |
| Other Comprehensive Results | -4.486 | -3406 | 31,7% | -428 | 695,8% |
| Shareholders' Equity Attributable to the Controller | 110.183 | 105.640 | 4,3% | 105.777 | -0,1% |
| Total Equity | 110.680 | 105.974 | 4,4% | 106.090 | -0,1% |
| Total Liabilities and Shareholders' Equity | 985.450 | 931.208 | 5,8% | 933.578 | -0,3% |
Our total assets reached, as of December 31, 2022, R$985,451 million, a growth of 5.83% compared to 2021, whose total assets reached R$931,208 million, 0.25% lower than the year ended December 31, 2020, in the amount of R$933,578 million.
The portfolio of loans and advances to gross customers, without guarantees and guarantees, totaled R$524,655 at December 31, 2022, a growth of 6.3% compared to R$493,355 million at December 31, 2021, a growth of 6.3% compared to R$417,822 million at December 31, 2020. The Large Companies presented a reduction of 8.7% compared to 2021, being an increase of 19.5% in the Individual segment.
Consolidated shareholders' equity totaled R$110,183 million at December 31, 2022, R$105,640 million at December 31, 2021 and R$105,777 million at December 31, 2020, an increase of 4.4% at December 31, 2022 compared to 2021 and a decrease of 0.1% at December 31, 2021 compared to 2020. The change in shareholders' equity in the year is mainly due to the growth in revenues, Net Income for the period in the amount of R$14,339 million and reduced by the payment of Dividends and Interest on Own Capital in the amount of R$8,100 million.
|
2.2. The directors must comment:
a. results of operations of the Company:
Results of Operations for the Years Ended December 31, 2022, 2021 and 2020
The following table provides an overview of the key core aspects of our results of operations for the years ended December 31, 2022, 2021 and 2020:
Total Revenue totaled R$66,475 million in 2022, an increase of 4.0%, or R$2,548 million compared to the year ended December 31, 2021, driven by an increase in earnings in financial assets and liabilities (net) and exchange rate differences (net), offset by a decrease in net interest income due to the impact of interest rate increases on the cost of financing.
Consolidated Net Income totaled R$14,339 million in the year ended December 31, 2022, a decrease of 7.8% compared to the year ended December 31, 2021, primarily due to: (i) a 4.0% increase in total revenue as described above, (ii) the increase in losses due to a reduction in the recoverable amount of financial assets of 45.1% in 2022 driven by the individual loan portfolio and a specific case of large client in our wholesale segment that entered into judicial reorganization process (judicial reorganization), (iii) a 5.3% increase in administrative expenses in 2022 due to the increase in inflation in the period (with inflation reaching 5.8% in 2022), and (iv) reduction in tax rates from 37.1% to 26.7%. For more information, please see note "c.1) Legal and Administrative Proceedings – Related to Tax and Social Security" in our audited consolidated financial statements included elsewhere in this annual report. | The Customer Loan Portfolio totaled R$524 billion as of December 31, 2022, an increase of 6.3% compared to December 31, 2021, mainly due to increases in the portfolio of loans to individuals, especially payroll mortgages, credit cards and personal credit.
Credit Quality remains at reasonable levels and supports our growth. The ratio of depreciated assets to credit risk was 6.9% in the year ended December 31, 2022, an increase of 1.9 p.p. compared to the previous year. The coverage ratio was 89.8% in the year ended December 31, 2022, a decrease of 20.6 p.p. from 110.4% in the year ended December 31, 2021. Our Basel Capital Adequacy Ratio was 13.9% for the year ended December 31, 2022, a decrease of 1.0 p.p. compared to the year ended December 31, 2021.
The deposits of the Central Bank of Brazil and the deposits of credit institutions plus customer deposits increased by 2.7%, reaching R$ 606 billion in 2022. |
Results of Operations
The following table presents our consolidated operating results for the years ended December 31, 2022, 2021 and 2020:
|
For the financial year ended December 31, | |||||
2022 | 2021 | 2020 | Amendment % 2022/2021 | Amendment % 2021/2020 | |
| (in millions of R$, except percentages) | |||||
| Net interest income | 47.503 | 51.318 | 44.443 | (7,4) | 15,5 |
| Profits from equity instruments | 38 | 90 | 34 | (57,7) | 166,8 |
| Corporate profits accounted for by the equity method | 199 | 144 | 112 | 38,1 | 28,6 |
| Net fee and commission income (expense) | 14.876 | 15.274 | 16.228 | (2,6) | (5,9) |
| Gains (losses) on financial assets and liabilities (net) and exchange differences (net) | 4.699 | (1.781) | (11.703) | (363,9) | (84,8) |
| Other operating income (expenses) (net) | (841) | (1.120) | (873) | (24,9) | 28,3 |
| Total profit | 66.475 | 63.926 | 48.242 | 4,0 | 32,5 |
| Administrative expenditure | (18.240) | (17.316) | (17.115) | 5,3 | 1,2 |
| Depreciation and amortization | (2.586) | (2.434) | (2.579) | 6,2 | (5,6) |
| Provisions (net) | (1.215) | (2.179) | (1.657) | (44,2) | 31,6 |
| Impairment losses on financial assets (net) | (24.829) | (17.113) | (17.450) | 45,1 | (1,9) |
| Impairment losses on other (net) assets | (161) | (166) | (85) | (2,6) | 95,3 |
| Other non-financial gains (losses) | 131 | 33 | 308 | 304,4 | (89,5) |
| Operating profit before tax | 19.575 | 24.750 | 9.664 | (20,9) | 156,1 |
| Income tax | (5.235) | (9.191) | 3.787 | (43,0) | (342,7) |
| Consolidated net income for the year | 14.339 | 15.559 | 13.451 | (7,8) | 15,7 |
Consolidated profit for the year
Our consolidated net income for the year ended December 31, 2022 was R$14,339 million, a decrease of R$1,220 million, or 7.8%, compared to our consolidated net income of R$15,559 million for the year ended December 31, 2021, primarily due to an increase in losses due to a reduction in the recoverable amount of financial assets of R$7,716 million, or 45.1%, to R$ 24,829 million in the year ended December 31, 2022, from R$ 17,113 million in the fiscal year December 31, 2021, due to the deterioration of the loan portfolio that was impacted by a specific case of a large client in our wholesale segment that filed for judicial reorganization, and a reduction in net interest income from R$3,815 million, or 7.4%, to R$47,503 million in the year ended December 31, 2022 from R$51,318 million in December 31, 2021, primarily due to an increase in interest rates in force in Brazil as a result of the Central Bank of Brazil's increases in the SELIC rate to suppress inflation and a decrease in revenue and d fees received from customers as a result of more selective credit policies and services and an increase in the cost of our obligations as a result of higher interest rates.
Our consolidated net income for the year ended December 31, 2021 was R$15,559 million, an increase of R$2,109 million, or 15.7%, compared to our consolidated net income of R$13,451 million for the year ended December 31, 2020, as a result of an increase in net interest income of R$6,876 million, or 15.5%, to R$51,318 million in the year ended December 31, 2021, from R$44,443 million in the year ended December 31, 2020 to be driven by our loan portfolio.
Net interest income
Net interest income for the year ended December 31, 2022 was R$47,503 million, a decrease of 7.4% or R$3,815 million from R$51,318 million for the year ended December 31, 2021. This reduction was primarily due to the increase in interest rates, which increased pressure on our margins, partially offset by an increase in gains/losses on financial assets and liabilities (net) and exchange rate differences (net).
The average total of assets earned in 2022 was R$ 903.4 billion, an increase of 7.13% or R$ 60.1 billion compared to R$ 843.3 billion in 2021. The main drivers of this increase were an increase of R$ 42.4 billion, or 9.2%, in the average of loans and advances to customers and a reduction of R$ 11.2 billion in the average of debt instruments.
|
Net income (net interest income divided by average profitable assets) in 2022 was 5.3% and 6.1% in 2021. Net income (net interest income divided by average profitable assets) was 6.1% in 2021 compared to 6.0% in 2020.
The average total of interest-bearing liabilities in 2022 was R$ 673.0 billion, an increase of 3.9% or R$ 25.3 billion compared to R$ 647.8 billion in 2021. The main driver of this growth was an R$18.6 billion increase in customer deposits as a result of a change in consumer preferences regarding interest-bearing assets.
Finally, the yield spread (the difference between gross income from earned assets and the average cost of interest-bearing liabilities) was 2.7% in 2022, mainly due to rising interest rates in Brazil in 2022, which pressured our margins.
Net interest income for the year ended December 31, 2021 was R$51,318 million, an increase of 15.5% or R$6,876 million from R$44,443 million in the year ended December 31, 2020. This increase was mainly due to the 15.7% increase in our loan portfolio driven by our Commercial Bank unit.
Total average profitable assets in 2021 were R$843.2 billion, an increase of 12.4% or R$93.2 billion, from R$750.1 billion in 2020. The main factors were the increase of R$76.8 billion, or 20.0%, in the average of loans and advances to customers and R$21.3 billion in the average of debt instruments. Net income (net interest income divided by average profitable assets) was 5.86% in 2021, compared to 5.93% in 2020, a decrease of 0.07 p.p.
The average total of onerous liabilities in 2021 was R$647.7 billion, an increase of 13.0% or R$74.3 billion, compared to R$573.4 billion in 2020. The main driver of this growth was the increase of R$ 40.1 billion in customer deposits and R$ 37.4 billion in deposits from the Central Bank of Brazil and deposits from credit institutions, as a result of a change in investor preferences for more stable instruments.
Finally, the yield spread (the difference between gross income on assets earned and the average cost of interest-bearing liabilities) was 4.8% in 2021, mainly due to the increase in the SELIC rate during the year ended December 31, 2021, from 2.0% on December 31, 2020 to 9.25% on December 31, 2021.
Income from equity instruments
Income from equity instruments for the year ended December 31, 2022 totaled R$38 million, a decrease of R$52 million from R$90 million in the year ended December 31, 2021, mainly due to higher dividend gains from an investment fund, Santander Fundo de Investimento Amazonas Multimercado Credito Privado de Investimento no Exterior, in 2021 compared to 2022.
Profit from equity instruments for the year ended December 31, 2021 totaled R$90 million, an increase of R$56 million over the R$19 million year ended December 31, 2020, mainly due to higher dividend gains received from an investment fund, Santander Investment Fund Amazonas Multimarket Private Investment Credit Abroad as a result of gains in equity positions in the direction of hedges. of derivatives, R$84.8 million.
|
Equity Result
The result of companies accounted for by the equity method for the year ended December 31, 2022 was R$ 199 million, an increase of R$ 55 million compared to R$ 144 million for the year ended December 31, 2021, mainly due to an increase of R$ 50.6 million in Mobills' results of operations, that we acquired in 2021.
The result of companies accounted for by the equity method for the year ended December 31, 2021 was R$ 144 million, an increase of R$ 32 million compared to R$ 112 million in the year ended December 31, 2020, mainly due to an increase of R$ 23.5 million in the result of operations of Tecban (Tecnologia Bancário S.A.), and an increase of R$ 7.0 million in the results of the operations of Webmotors S.A., both jointly controlled.
Net fee and commission revenues
Net fee and commission revenues for the year ended December 31, 2022 were R$14,876 million, a decrease of 2.6% or R$397 million compared to R$15,273 million for the year ended December 31, 2021. This was primarily attributed to (i) a decrease in credit and debit card issuances as a result of a more selective credit approval policy, (ii) Getnet's spin-off (in the first quarter of 2021), (iii) a decrease in current and accountable service fees (as a result of annual fee waiver campaigns and customers' increasing use of PIX as an alternative to traditional banking). This was partially offset by an increase in collection and payment services and in the management of assets and pension funds.
Net revenue from fees and commissions for the year ended December 31, 2021 reached R$15,273 million, a decrease of 5.9% or R$955 million compared to R$16,228 million for the year ended December 31, 2020, primarily impacted due to the decrease in credit and debit cards, due to higher card issuance costs as a result of business growth and the impact of Getnet's spin-off. This was partially offset by growth in insurance, capitalization, asset management and pension funds.
Net trade finance fees and commissions totaled R$1,825 million in the year ended December 31, 2022, an increase of 3.8% over the year ended December 31, 2021.
Net trade finance fees and commissions totaled R$1,758 million in the year ended December 31, 2021, an increase of 1.0% over the year ended December 31, 2020.
Net insurance and capitalization fees and commissions totaled R$4,357 million in the year ended December 31, 2022, an increase of 1.1% over the year ended December 31, 2021. This increase was primarily a result of an increase in our life insurance portfolio.
Net insurance and capitalization fees and commissions totaled R$4,311 million in the year ended December 31, 2021, an increase of 12.5% over the year ended December 31, 2020. This increase was primarily a result of the increase in our lender insurance portfolio.
Net credit and debit card fees and commissions totaled R$3,151 million in the year ended December 31, 2022, a decrease of 14.1% compared to the year ended December 31, 2021. This reduction was primarily a result of (i) a decrease in credit and debit card issuances as a result of a more selective credit approval policy (ii) the Getnet Spin-off (in the first quarter of 2021).
|
Net credit and debit card fees and commissions totaled R$3,666 million in the year ended December 31, 2021, a decrease of 28.8% compared to the year ended December 31, 2020. This reduction was mainly a result of the spin-off of Getnet.
The following table reflects the composition of net fee and commission revenues for the years ended December 31, 2022, 2021 and 2020:
For the Year Ended December 31 | |||||
2022 | 2021 | 2020 | Amendment % 2022/2021 | Amendment % 2021/2020 | |
| (in millions of R$, except percentages) | |||||
| Current account services | 3.267 | 3.549 | 3.716 | (8,0) | (4,5) |
| Billing and payment services | 1.790 | 1.626 | 1.459 | 10,1 | 11,4 |
| Insurance and capitalization | 4.357 | 4.311 | 3.831 | 1,1 | 12,5 |
| Asset Management and Pension Funds | 1.600 | 1.418 | 1.114 | 12,8 | 27,3 |
| Credit and debit cards | 3.151 | 3.666 | 5.151 | (14,1) | (28,8) |
| Capital markets | 1.112 | 1.053 | 858 | 5,5 | 22,8 |
| Trade finance | 1.825 | 1.758 | 1.740 | 3,8 | 1,0 |
| Service tax | (687) | (712) | (678) | (3,6) | 5,1 |
| Other | (1.538) | (1.396) | (964) | 10,2 | 44,8 |
| Total | 14.876 | 15.273 | 16.229 | (2,6) | (5,9) |
"Gains/losses on financial assets and liabilities (net) and exchange rate changes (net)"
Gains on financial assets and liabilities (net) and exchange differences (net) in the year ended December 31, 2022 totaled R$4,699 million, an increase of R$6,480 million compared to losses of R$1,781 million in the year ended December 31, 2021. This variation is primarily due to (i) gains of R$ 3,985 million related to net hedge accounting gains or losses and (ii) gains of R$ 426 million related to financial instruments not measured at fair value through income. For more information, please refer to notes 36 and 37 of our audited consolidated financial statements – included in this annual report.
Gains/losses on financial assets and liabilities (net) and exchange differences (net) for the year ended December 31, 2021, totaled losses of R$1,781 million, a gain of R$9,922 million over losses of R$11,703 million for the year ended December 31, 2020. This variation is mainly due to greater exposure to operations in Cayman and Luxembourg and unfavorable exchange rate variation in 2020. In 2021, there was a combination of lower exchange rate variation and the end of over hedge operations due to the change in taxation. Excluding hedge results on investments abroad, gains/losses on financial assets and liabilities (net) and exchange differences (net) totaled gains of R$731 million in the year ended December 31, 2021, an increase of R$1,149 million, relative to gains of R$1,880 million compared to the year ended December 31, 2020, mainly due to the positive results in our derivative position. Gains/losses on financial assets and liabilities (net) and exchange rate differences (net), excluding the effects of overseas hedging investment, is a non-GAAP measure. For more information, see "Item 3. Key Information — A. Selected financial data - Reconciliation of non-GAAP measures and indices with their more directly comparable IFRS financial measures."
The following table presents our gains/losses on financial assets and liabilities (net) and exchange differences (net) in the periods indicated.
|
For the Year Ended December 31 | |||||
2022 | 2021 | 2020 | Amendment % 2022/2021 | Amendment % 2021/2020 | |
| (in millions of R$, except percentages) | |||||
| Gains (losses) on financial assets and liabilities (net) and exchange differences (net) | 4.699 | (1.781) | (11.703) | n.m. | (84,8) |
| Hedge effects of investments made abroad | (129) | 2.512 | 13.583 | n.m. | (81,5) |
| Gains (losses) on financial assets and liabilities (net) and exchange differences (net) excluding hedge effects for investments held abroad (1) | 4.570 | 731 | 1.880 | 524,8 | (61,1) |
(1) Gains/losses on financial assets and liabilities (net) and exchange rate differences (net) excluding the effects of overseas hedging are a non-GAAP measure. For more information, see "Item 3. Key Information — A. Financial Data Selected — Reconciliation of Non-GAAP Measures and Indices with the Most Directly Comparable IFRS Financial Measures."
Other Operating Profits/Expenses
Other operating expenses for the year ended December 31, 2022 totaled R$841 million, a decrease of R$279 million compared to expenses of R$1,120 million for the year ended December 31, 2021, primarily due to lower expenses with the Benefit Guarantee Fund (FGB) pension plan and higher expenses with FGC pension plans, given the increase in the balance of deposits from R$ 436 million to R$ 478 million, which was mainly due to the increase in the consumption of products covered by the FGC. For the year ended December 31, 2021, other operating income/expenses were expenses of R$1,120 million, compared to expenses of R$873 million for the year ended December 31, 2020.
|
Administrative Expenses
Administrative expenses for the year ended December 31, 2022 were R$18,240 million, an increase of R$924 million compared to expenses of R$17,316 million for the year ended December 31, 2021, primarily due to the increase in expenses for salaries and salaries, technology/systems and technical services, resulting from the increase in inflation in the period.
For the year ended December 31, 2021, our administrative expenses of R$17,316 million reflected an increase of R$202 million compared to expenses of R$17,115 million for the year ended December 31, 2020, primarily personal expenses due and technology/systems expenses, due to business growth.
Personnel expenses increased by R$871 million in the year ended December 31, 2022, primarily due to higher employee wages and salaries arising from our collective bargaining with employees in 2021, which impacted the first eight months of 2022, and our 2022 collective bargaining agreement, which impacted the last four months of the year.
In the year ended December 31, 2021, our personnel expenses increased by R$154 million, primarily as a result of higher employee salaries and salaries, as a result of the collective bargaining agreement applied to the Company's salary base as of September 2021.
The following table presents our personnel expenses for each of the periods indicated:
For the financial year ended December 31, | |||||
2022 | 2021 | 2020 | Amendment % 2022/2021 | Amendment % 2021/2020 | |
| (in millions of R$, except percentages) | |||||
| Salaries and remuneration | 6.311 | 5.905 | 5.730 | 6,9 | 3,1 |
| Social insurance costs | 1.431 | 1.153 | 1.222 | 24,1 | (5,6) |
| Benefits | 1.603 | 1.435 | 1.390 | 11,7 | 3,2 |
| Training | 60 | 55 | 49 | 9,4 | 12,0 |
| Other staff expenditure | 492 | 478 | 480 | 2,9 | (0,4) |
| Total | 9.896 | 9.026 | 8.871 | 9,6 | 1,7 |
Other administrative expenses increased R$52 million to R$8,343 million in the year ended December 31, 2022, from R$8,291 million in the year ended December 31, 2021, primarily as a result of higher expenses on real estate, utensils and supplies, and technology and systems, resulting from inflationary pressures, which were partially offset by decreased advertising expenses.
Other administrative expenses increased R$47 million to R$8,291 million in the year ended December 31, 2021, from R$8,243 million in the year ended December 31, 2020, primarily as a result of higher expenses on real estate, utensils and supplies, and technology and systems, as a result of the expansion of our business, which was partially offset by reduced communications expenses.
The following table presents our other administrative expenses for each of the periods indicated:
|
For the financial year ended December 31, | |||||
2022 | 2021 | 2020 | Change % 2022/2021 | Change % 2021/2020 | |
| (in millions of R$, except percentages) | |||||
| Technical and specialized services | 2.229 | 2.184 | 2.171 | 2,1 | 0,6 |
| Real estate, improvements and supplies | 896 | 889 | 744 | 0,8 | 19,5 |
| Technology and systems | 2.577 | 2.474 | 2.355 | 4,1 | 5,1 |
| Advertising | 541 | 621 | 654 | (12,9) | (5,0) |
| Communications | 422 | 353 | 649 | 19,5 | (45,6) |
| Daily rates and travel expenses | 73 | 72 | 69 | 1,6 | 2,6 |
| Taxes other than income tax | 149 | 202 | 280 | (26,4) | (27,7) |
| Surveillance and courier services | 549 | 598 | 595 | (8,2) | 0,5 |
| Insurance premiums | 22 | 22 | 17 | (1,7) | 31,6 |
| Other administrative expenditure | 887 | 874 | 710 | 1,3 | 23,3 |
| Total | 8.343 | 8.291 | 8.243 | 0,7 | 0,6 |
The efficiency ratio, calculated as total administrative expenses divided by total profit, increased to 27.4% in the year ended December 31, 2022, compared to 27.1% in the year ended December 31, 2021. This increase of 0.35 p.p. in the index is mainly due to the increase in administrative expenses, resulting from the increase in inflation in the period, and to the effect of a more selective credit approval policy, which pressured our revenue.
The efficiency ratio, calculated as total administrative expenses divided by total profit, decreased to 27.1% in the year ended December 31, 2021, compared to 35.5% in the year ended December 31, 2020. This reduction of 8.4 p.p. in the index is mainly due to the effects of the investment hedge abroad and the growth of the financial margin due to the increase in the volume of the loan portfolio.
Depreciation and Amortization
Depreciation and amortization for the year ended December 31, 2022 was R$2,586 million, an increase of 6.2% or R$152 million from R$2,434 million for the year ended December 31, 2021, primarily due to higher expenses for the amortization of hardware and software items resulting from investments made in this period.
For the year ended December 31, 2021, depreciation and amortization was R$2,434 million, a decrease of 5.6%, or R$145 million, from R$2,579 million for the year ended December 31, 2020, primarily due to the decrease in hardware and software amortization expenses, which was primarily due to the volume of assets not deployed or under development and the effect of write-offs.
Provisions (Net)
The provisions mainly include provisions for tax, civil and especially labor causes. Provisions (net) totaled R$1,215 million in the year ended December 31, 2022, a decrease of 44.2%, or R$964 million, compared to R$2,179 million in the year ended December 31, 2021. This was mainly due to the reduction of civil and labor lawsuits due to the revision of our operating model and the creation of provisions related to lawsuits filed by the Association of Retired Employees of the Bank of the State of São Paulo, or AFABESP, in which the classification of the risk of loss was maintained as probable in December 2022.
In the year ended December 31, 2021, provisions (net) totaled R$2,179 million for the year ended December 31, 2021, an increase of 31.6%, or R$522 million, compared to R$1,657 million for the year ended December 31, 2020, driven by the fact that the amounts provisioned are indexed to SELIC rate (for tax proceedings), the National Consumer Price Index (for civil suits) and the National Broad Consumer Price Index – Special) and the SELIC rate for labor lawsuits, each of which increased significantly in the year ended December 31, 2021 (for more information, see note 23 of our audited consolidated financial statements included in "Item 18. Financial Statements" of this annual report).
|
Impairment Losses on Financial Assets (Net)
Losses due to impairment of financial assets (net) in the year ended December 31, 2022 were R$24,829 million, an increase of R$7,716 million compared to R$17,113 million in the year ended the year ended. December 31, 2021, driven by deteriorating macroeconomic conditions in Brazil and a specific case of a large client in our wholesale segment that has entered judicial reorganization proceedings.
Impairment losses of (net) financial assets in the year ended December 31, 2021 were R$17,113 million, a decrease of R$337 million compared to R$17,450 million in the year ended December 31, 2020, primarily due to the resumption of economic activity in Brazil following the easing of the COVID-19 pandemic in the second half of 2021 and the use of the overlap provision constituted in the year ended December 31, 2020, in response to the potential effects of the COVID-19 pandemic.
Our credit risk exposure portfolio increased by R$27.5 billion to R$568.3 billion at December 31, 2022, compared to R$540.8 billion at December 31, 2021. In addition, our depreciated assets increased by R$12.3 billion from R$26.9 billion at December 31, 2021 to R$39.2 billion in the year ended December 31, 2022.
Our credit risk exposure portfolio increased by R$74.8 billion to R$540.9 billion as of December 31, 2021 compared to R$466.1 billion on December 31, 2020, In addition, our assets reduced to recoverable value increased by R$3.7 billion from R$23.2 billion as of December 31, 2020 to R$26.9 billion in the year ended December 31, 2021.
The following table shows the ratio of our non-recoverable assets to total credit risk exposure and our coverage ratio as of December 31, 2022, 2021 and 2020.
On December 31, | |||
2022 | 2021 | 2020 | |
| (in millions of R$, except percentages) | |||
| Loans and advances to customers, gross | 524.655 | 493.355 | 417.822 |
| Depreciated assets | 39.224 | 26.923 | 23.176 |
| Provisions for impairment losses | 35.212 | 29.723 | 25.640 |
| Non-GAAP Credit Risk Exposure – Customers (1) | 568.338 | 540.873 | 466.104 |
| Indexes | |||
| Assets that are recoverable from exposure to credit risk | 6,9% | 5,0% | 5,0% |
| Coverage ratio (2) | 89,8% | 110,4% | 110,6% |
| Impairment losses | (24.829) | (17.113) | (17.450) |
| Losses on other financial instruments not measured at fair value (3) |
— |
— |
— |
| Impairment losses on financial assets (net) (4) | (24.829) | (17.113) | (17.450) |
| ________________________________ |
| (1) | Exposure to credit risk is a non-GAAP financial measure. Credit risk exposure is the sum of the amortized cost amounts of loans and advances to customers (including depreciated assets) in the amount of R$568,338 million as of December 31, 2022 and guarantees and documentary credits in the amount of R$43,682 million as of December 31, 2022. We have included off-balance sheet information to this extent to better demonstrate our managed credit risk. For more information, see "Item 3. Key Information — A. Financial Data Selected — Reconciliation of Non-GAAP Measures and Indices with the Most Directly Comparable IFRS Financial Measures." |
|
| (2) | Provisions for impairment losses as a percentage of assets with a reduction to recoverable value. |
| (3) | It corresponds to the registration of permanent losses in the realizable value of securities and securities classified as "Securities available for sale", currently accounted for as "Gains on financial assets (net)". |
| (4) | As of December 31, 2022, 2021 and 2020, our total impairment losses on financial instruments included R$1,173 million, R$1,191 million and R$1,577 million, respectively, related to debt instruments. |
The following chart shows our relationship between non-recoverable assets and credit risk from 2020 to 2022:
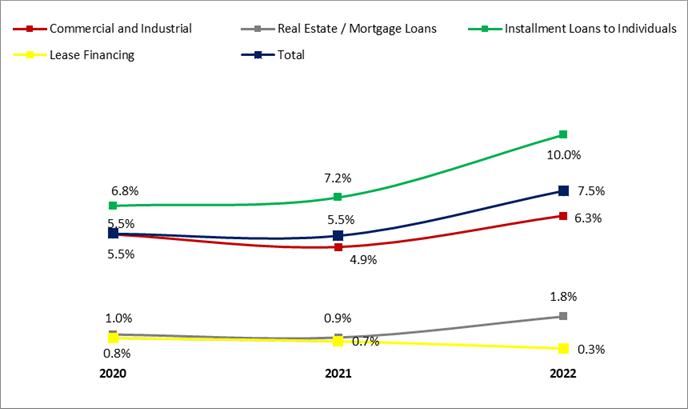 Non-recoverable assets by Loan Type
The following table shows our non-recoverable assets by loan type as of December 31, 2022, 2021 and 2020.
For the financial year ended December 31, | |||||
2022 | 2021 | 2020 | change % 2022/2021 | change % 2021/2020 | |
| (in millions of R$, except percentages) | |||||
| Commercial and industrial | 14.156 | 11.440 | 10.558 | 23,7 | 8,3 |
| Real estate | 1.058 | 470 | 456 | 124,9 | 3,1 |
| Installment loans to individuals | 23.999 | 14.996 | 12.144 | 60,0 | 23,5 |
| Lease financing | 10 | 17 | 17 | (41,2) | (0,6) |
| Total | 39.224 | 26.923 | 23.176 | 45,7 | 16,2 |
Commercial and Industrial
Depreciated assets in the commercial and industrial loan portfolio totaled R$14,156 million as of December 31, 2022, an increase of R$2,716 million, or 23.7%, compared to R$11,440 million at December 31, 2021. This increase was due to a specific case of a large client in our wholesale segment that entered into judicial reorganization proceedings. Depreciated assets in commercial and industrial loans totaled R$11,440 million as of December 31, 2021, an increase of R$881 million or 8.3% compared to R$10,558 million as of December 31, 2020. The increase in impairment assets in this portfolio was a result of the growth of the loan portfolio and the adverse macroeconomic situation caused by the COVID-19 pandemic.
|
Real estate
Depreciated assets in the real estate loan portfolio totaled R$1,058 million as of December 31, 2022, an increase of R$588 million, or 125% compared to R$470 million as of December 31, 2021. The increase in depreciated assets in this portfolio was mainly due to the impact on our clients of deteriorating macroeconomic conditions in Brazil.
Impairment assets in the real estate loan portfolio totaled R$470 million as of December 31, 2021, an increase of R$14 million, or 3.1%, compared to R$456 million as of December 31, 2020. The increase in impairment assets in this portfolio was a result of the recurring growth of the loan portfolio. The increase in depreciated assets in this portfolio was due to the effect of deteriorating macroeconomic conditions on our clients.
Installment Loans to Individuals
Depreciated assets in the portfolio of installment loans to individuals totaled R$23,999 million as of December 31, 2022, an increase of R$9,003 million, or 60.0% compared to R$14,996 million as of December 31, 2021. The increase in depreciated assets in this portfolio was due to the impact on our clients of deteriorating macroeconomic conditions in Brazil.
Assets with a reduction in the recoverable value of term loans to individuals totaled R$14,996 million as of December 31, 2021, an increase of R$2,852 million, or 23.5%, compared to 2020. The increase is mainly due to the growth of the loan portfolio and the deterioration of the macroeconomic situation in Brazil.
Financial Lease
Depreciated assets in the lease loan portfolio totaled R$10 million as of December 31, 2022, a decrease of R$7 million compared to R$17 million at December 31, 2021 primarily due to a decrease in delinquent loans.
Depreciated assets in the lease loan portfolio totaled R$17 million as of December 31, 2021, remaining similar to December 31, 2020 primarily due to a stable amount of delinquent loans.
Impairment Losses on Other Assets (Net)
Impairment losses of other (net) assets in the year ended December 31, 2022 totaled losses of R$161 million, a decrease of R$4 million compared to R$166 million in the year ended December 31, 2021, primarily due to impairment losses on intangible assets.
Impairment losses of other (net) assets for the year ended December 31, 2021 totaled losses of R$166 million, an increase of R$81 million compared to R$85 million in the year ended December 31, 2020, primarily due to further impairment losses for intangible assets, which was mainly due to the obsolescence of some of our information technology equipment.
|
Other Non-Financial Gains/Losses
Other non-financial gains totaled R$131 million during the year ended December 31, 2022, an increase of R$99 million compared to gains of R$33 million during the year ended December 31, 2021, primarily due to non-recurring gains from real estate gains in the year ended December 31, 2022.
During the year ended December 31, 2021, other non-financial gains totaled R$33 million, a decrease of R$275 million compared to R$308 million during the year ended December 31, 2020, primarily due to positive extraordinary effects in 2020, in particular a gain of R$169 million on the sale of Superdigital in the first quarter of 2020.
Operating Income before Taxation
Operating profit before tax for the year ended December 31, 2022 was R$19,575 million, a decrease of R$5,175 million, or 20.9%, compared to R$24,750 million for the year ended December 31, 2021. For the year ended December 31, 2020, our operating profit before tax was R$9,664 million.
Excluding the effects of hedging for investments held abroad, operating profit before tax totaled R$19,446 million in the year ended December 31, 2022, a decrease of 28.7% compared to R$27,262 million in the year ended December 31, 2021. In the year ended December 31, 2020, operating profit before tax was R$23,247 million. Operating profit before tax, excluding hedging effects for investments held abroad, is a non-GAAP measure.
The table below presents our operating profit before tax and our operating profit before taxes, excluding the effects of hedging for investments held abroad in the periods presented.
For the financial year ended December 31, | |||||
2022 | 2021 | 2020 | change % 2022/2021 | change % 2021/2020 | |
| (in millions of R$, except percentages) | |||||
| Operating profit before tax | 19.575 | 24.750 | 9.664 | (20,9) | 156,1 |
| Hedge effects of investments made abroad | (129) | 2.512 | 13.583 | (105,1) | (81,5) |
| Adjusted operating profit before tax (1) | 19.446 | 27.262 | 23.247 | (28,7) | 17,3 |
(1) Adjusted operating income is a non-GAAP measure. For more information, see "Item 3. Key Information — A. Financial Data Selected — Reconciliation of Non-GAAP Measures and Indices with the Most Directly Comparable IFRS Financial Measures."
Income Taxes
Income tax expenses include income tax, social contribution, PIS and COFINS (which are social contributions due on certain revenues net of some expenses). Total income tax was R$5,235 million in the year ended December 31, 2022, a reduction of 43%, or R$3,956 million, relative to the income tax balance of R$9,191 million in the year ended December 31, 2021. This reduction in expenses was primarily attributable to the following: (i) foreign exchange losses of R$129 million as a result of the effects of exchange rate variations on foreign investment in our subsidiary and for hedging instruments, affecting "our gains (losses) on (net) financial assets and liabilities"; and (ii) a 20.9% or R$5,176 million reduction in operating profit before tax arising from the entities' operating results to R$19,575 million in the year ended December 31, 2022, from R$24,750 million in the year ended December 31, 2021, which was primarily due to a decrease in net interest income of R$3,815 million; or 7.4%, to R$47,503 million in the year ended December 31, 2022, of R$51,318 million in the year ended December 31, 2021 driven by our loan portfolio.
|
In the period from August 1, 2022 to December 31, 2022, as a result of Law No. 14,446/2022, there was an increase in the CSLL rate for banks and other financial institutions, with no effect on our audited consolidated financial statements, due to the strategies we adopted to cover this increase. For more information, please refer to 23 of our audited consolidated financial statements included in this annual report.
Total income tax was R$9,191 million in the year ended December 31, 2021, an increase of 342.7%, or R$12,978 million, over the income tax balance of R$3,787 million in the year ended December 31, 2020. This increase in expense was primarily attributable to the following events: (i) foreign exchange losses of R$2,512 million as a result of the effects of exchange rate variations on foreign investment in our subsidiary and for hedging instruments, affecting our gains (losses) on financial assets and liabilities (net); (ii) an increase of 156.1% or R$15,086 million in operating profit before tax from the entities' operating results to R$24,750 million in the year ended December 31, 2021, from R$9,664 million in the year ended December 31, 2020, which was primarily due to an increase in net interest income of R$6,875 million; or 15.5%, to R$51,318 million in the year ended December 31, 2021, of R$44,443 million in the fiscal year December 31, 2020 driven by our loan portfolio, and (iii) an increase of R$1,237 million in the CSLL rate for banks and other financial institutions for the period from July 1, 2021 to December 31, 2021, as a result of Law No. 14,183/2021. For more information, please refer to 24 of our audited consolidated financial statements included in this annual report.
The following table shows our income tax and income tax excluding the effects of hedging for investments held abroad in the periods indicated.
For the financial year ended December 31, | |||||
2022 | 2021 | 2020 | change % 2022/2021 | change % 2021/2020 | |
| (in millions of R$, except percentages) | |||||
| Income taxes | (5.235) | (9.191) | 3.787 | (43,0) | (342,7) |
| Hedge effects of investments made abroad | 129 | (2.512) | (13.583) | (105,1) | (81,5) |
| Income tax excluding hedging effects for investments held abroad (*) | (5.106) | (11.703) | (9.796) | (56,4) | 19,5 |
* Income tax, excluding the effects of hedging investment made abroad, is a non-GAAP measure. For more information, see "Item 3. Key Information — A. Financial Data Selected — Reconciliation of Non-GAAP Measures and Indices with the Most Directly Comparable IFRS Financial Measures."
|
Results of Operations by Segment for the Years Ended December 31, 2022, 2021 and 2020
The following tables show our operating results for the years ended December 31, 2022, 2021 and 2020 for each of our operating segments.
Commercial bank
| For the financial year ended December 31, | ||||||
| 2022 | 2021 | 2020 | change % 2022/2021 | change % 2021/2020 | ||
| (in millions of R$, except percentages) | ||||||
| Net interest income | 45.618 | 46.236 | 41.457 | (1,3) | 11,5 | |
| Profits from equity instruments | 11 | 10 | 4 | 10,0 | 182,4 | |
| Corporate profits accounted for by the equity method | 148 | 105 | 84 | 40,1 | 25,4 | |
| Net fee and commission profits | 12.539 | 13.285 | 14.405 | (5,6) | (7,8) | |
| Gains/losses on financial assets and liabilities (net) and exchange differences (net) | (360) | (1.433) | (13.515) | (74,9) | (89,4) | |
| Other operating profits (expenses) | (718) | (974) | (767) | (26,3) | 27,0 | |
| Total profit | 57.237 | 57.229 | 41.668 | — | 37,3 | |
| Staff costs | (8.986) | (8.221) | (8.140) | 9,3 | 1,0 | |
| Other administrative expenditure | (7.571) | (7.697) | (7.635) | (1,6) | 0,8 | |
| Administrative expenditure | (16.557) | (15.918) | (15.775) | 4,0 | 0,9 | |
| Depreciation and amortization | (2.480) | (2.343) | (2.489) | 5,8 | (5,9) | |
| Provisions (net) | (1.208) | (2.177) | (1.639) | (44,5) | 32,8 | |
| Impairment losses on financial assets (net) | (23.683) | (17.170) | (17.380) | 37,9 | (1,2) | |
| Impairment losses on other (net) assets | (160) | (164) | (28) | (2,1) | 485,7 | |
| Other non-financial gains (losses) | 131 | 33 | 308 | 304,4 | (89,5) | |
| Operating profit before tax | 13.281 | 19.491 | 4.666 | (31,9) | 317,7 | |
|
| For the financial year ended December 31, | |||||
| 2022 | 2021 | 2020 | Amendment % 2022/2021 | Amendment % 2021/2020 | |
| (in millions of R$, except percentages) | |||||
| Operating Profit Before Tax | 13.281 | 19.491 | 4.666 | (31,9) | 317,7 |
| Effects of hedge of investment made abroad | (129) | 2.512 | 13.583 | (105,1) | (81,5) |
| Adjusted operating profit before tax (1) | 13.151 | 22.003 | 18.249 | (40,2) | 20,6 |
2022 and 2021
Operating profit before tax attributable to the Commercial Banking segment for the year ended December 31, 2022 was R$13.3 billion, a decrease of R$6.2 billion from R$19.5 billion in the year ended December 31, 2021.
This variation is mainly due to:
• an increase of R$ 6.5 billion in impairment losses on financial assets (net), representing an increase of 37.9% compared to the year ended December 31, 2021, mainly due to (i) an increase in the loan portfolio driven by the portfolio of individual clients, despite a more selective credit approval policy, and (ii) the deterioration of the loan portfolio driven in particular by the increase in the cost of credit as a result of higher interest rates in 2022 than in 2021.
• a $746 million reduction in net fee and commission revenue due to (i) a more selective credit approval policy and (ii) reduced current and accountable service fees (as a result of annual fee waiver campaigns and as a result of customers' increasing use of PIX as an alternative to traditional banking).
Excluding the effects of hedging for investments held abroad on our revenues, our operating profit before tax would have been R$13.2 billion, 40.2% lower than in the fiscal year ended December 31, 2021. Operating income, excluding hedging effects for overseas investments, is a non-GAAP measure.
2021 and 2020
Operating profit before tax attributable to the Commercial Bank segment for the year ended December 31, 2021 was R$19.5 billion, an increase of R$14.8 billion from R$4.7 billion in the year ended December 31, 2020.
This variation was mainly due to:
• increase of R$ 4.8 billion in the financial margin, representing a variation of 11.5% in relation to the year ended December 31, 2020, mainly due to the increase in the loan portfolio resulting from the resumption of economic activity in the year ended December 31, 2021 in relation to the year ended December 31, 2020, as a result of the relative easing of restrictions related to the COVID-19 pandemic.
• losses on financial assets and liabilities and exchange differences of R$ 1.4 billion in the year ended December 31, 2021, compared to losses of R$ 13.5 billion in the year ended December 31, 2020 (reduction of 89.4%, or R$ 12.0 billion) was due to the positive gains from the increase in market operations in derivatives and, mainly, the gains in the portfolio of securities indexed to the IPCA. We believe that the variation between the years ended December 31, 2021 and 2020 is not recurring.
|
This change was partially offset by a decrease of R$1.1 billion in net revenue from fees and commissions for the year ended December 31, 2021, compared to the year ended December 31, 2020, primarily due to the spin-off of Getnet.
Excluding the effects of hedging investments held abroad on our revenues, our operating profit before tax would be R$22.0 billion, 20.6% higher than the fiscal year ended December 31, 2020.
Global Wholesale Bank
| For the financial year ended December 31, | |||||
| 2022 | 2021 | 2020 | Amendment % 2022/2021 | Amendment % 2021/2020 | |
| (in millions of R$, except percentages) | |||||
| Net interest income | 1.885 | 5.082 | 2.985 | (62,9) | 70,2 |
| Profits from equity instruments | 27 | 80 | 30 | (66,4) | 164,9 |
| Corporate profits accounted for by the equity method | 52 | 39 | 28 | 33,3 | 37,5 |
| Net fee and commission profits | 2.337 | 1.988 | 1.823 | 17,5 | 9,1 |
| Gains/losses on financial assets and liabilities (net) and exchange differences (net) | 5.060 | (347) | 1.812 | n.s. | (119,1) |
| Other operating profits (expenses) | (123) | (145) | (105) | (15,5) | 37,5 |
| Total profit | 9.238 | 6.697 | 6.574 | 37,9 | 1,9 |
| Administrative expenditure | (1.683) | (1.399) | (1.340) | 20,3 | 4,3 |
| Staff costs | (911) | (805) | (732) | 13,2 | 10,0 |
| Other administrative expenditure | (772) | (593) | (609) | 30,1 | (2,5) |
| Depreciation and amortization | (106) | (91) | (91) | 16,5 | 0,7 |
| Provisions (net) | (8) | (3) | (18) | 166,7 | (85,1) |
| Impairment losses on financial assets (net) | (1.146) | 57 | (71) | n.m. | (180,6) |
| Impairment losses on other (net) assets | (1) | (2) | (57) | (50,0) | (96,7) |
| Operating profit before tax | 6.294 | 5.260 | 4.998 | 19,7 | 5,2 |
n.s. = not significant.
|
2022 and 2021
Operating profit before tax attributable to the Global Wholesale Bank segment for the year ended December 31, 2022 was $6.3 billion, an increase of 19.7% or $1,035 million over the year ended December 31, 2021, which was primarily due to an increase in (i) net commission revenue primarily due to capital markets and trade finance and (ii) gain on assets and financial liabilities and exchange rate difference driven by gains on financial assets measured at fair value through the result maintained for trading. These results partially offset the increase in impairment losses in financial assets, primarily driven by a specific case of a large client in our wholesale segment that has entered judicial reorganization proceedings.
2021 and 2020
Operating profit before tax attributable to the Global Wholesale Bank segment for the year ended December 31, 2021 was R$5.3 billion, an increase of 5.2% or R$262 million from R$5.0 billion for the year ended December 31, 2020, primarily due to an increase in Total Revenue driven primarily by an increase of R$165 million in net revenues from fees and commissions, and a decrease in expenses and losses primarily due to R$128 million in impairment losses in financial assets related to an increase in coverage of potential loan losses.
|
2.3. The directors must comment:
a. Significant changes in accounting practices that have resulted in significant effects on the information provided for in fields 2.1 and 2.2.
As of January 1, 2019, we have adopted IFRS 16, which replaces IAS 17.
I. Lease Identification
In adopting IFRS 16, the Bank recognizes lease liabilities, following the principles of IFRS 16 - Leases.
The following exemptions from recognition are also being used:
The accounting of leases with a remaining term of less than 12 months as short-term leases;
The accounting for leases whose underlying asset is of low value.
The Bank leases several properties and equipment. Predominantly, the assets subject to leases are real estate deals relating to agencies.
Banco Santander does not have right-of-use assets that fall under the definition of investment properties.
II. Term of the lease
Leases are formalized, reviewed and renegotiated individually and contain a wide range of distinct terms and conditions. The Bank evaluates the term of the contract, as well as the intention to remain in the properties. Thus, term estimates may vary according to contractual conditions, considering extension options and legal provisions.
The Bank assumes that the contractual termination fines levied before the maturity date do not make up a significant portion.
Leases do not contain restrictive clauses, but leased assets cannot be used as collateral for loans.
III. Initial Measurement
In their initial registration, leases are recognized as a right-of-use asset and a corresponding liability on the date the leased asset becomes available for use by the Group.
The right of use to be recorded is measured at its cost in exchange for the lease liability that represents the present value of lease payments that are not made to date. Lease payments are deducted using the incremental interest rate on the tenant's loan. There is no onerous contract that required an adjustment to the usage rights to be registered as assets on the date of initial adoption.
Use rights are measured at amortized cost according to the following:
· the value of the initial measurement of the lease liability;
· Any lease payment made before or on the reduced start date of any incentive received;
· Any initial cost directly assigned; and
|
· Restoration costs, if the requirements of IAS 37 are met for the registration of Provisions, Contingent Liabilities and Contingent Assets.
The Santander Group uses as an incremental rate the interest rate that it would have to pay when borrowing the necessary resource to obtain the asset with a value similar to the asset object of the lease, by term, guarantee and similar economic scenarios, represented in Santander Brasil, by the financing cost curve of a free asset, applied individually to each contract according to the estimates projected as lease term.
Lease liabilities include the net present value of the following leasing payments:
· reduced fixed payments of any incentive;
· Variable payments that are based on a rate or indexer;
· Amounts expected to be paid by the lessee based on the residual value of guarantees;
· the exercise price of a call option, if the lessee is reasonably sure about the exercise of the option; and
· Payment of penalties for the termination of the lease if the term of the operation reflects the exercise of the option by the lessee.
Lease liabilities are primarily adjusted for inflation (IGP-M), whose estimated projections at the base date of December 31, 2022 are presented below:
| IGP-M projection (annualized) | |
| Up to 3 months | 0,94% |
| From 3 to 12 months | 4,0% |
| From 1 year to 3 years | 3,0% |
| From 3 years to 5 years | 3,0% |
| More than 5 years | 3,0% |
IV. Subsequent measurement
After the initial measurement, the values of the assets registered as right of use are being updated using the cost method, so any accumulated depreciation is deducted monthly, according to the criteria of IAS 16 / CPC 27 – Fixed Assets in the depreciation of the right-of-use asset and corrected any remeasurement of the lease liability, when applicable.
The lease liability initially recorded, is updated by increasing monthly the amount of the liability of the interest portion of each lease agreement and reducing the amount of the monthly lease payments and corrected any lease remeasurement, where applicable.
The lease liability is remeasured, in case of changes in the lease term or in the contract value, the value resulting from the new calculation of the lease liability is recorded in return for the corresponding asset of right of use.
Use rights are subject to impairment testing.
Definitions and classification of financial instruments
i. Definitions
"Financial instrument" means any contract that gives rise to a financial asset in one entity and simultaneously to a financial liability or financial participation in another entity. "Equity instruments" means any contract that represents a residual interest in the issuer's assets after deducting the entirety of its liabilities.
|
"Financial derivative" means the financial instrument whose value changes in response to changes in an observable market variable (such as interest rate, exchange rate, price of financial instruments, market index or credit rating), in which the initial investment is very low, compared to other financial instruments with similar response to changes in market factors, and is usually settled at a future date.
"Hybrid financial instruments" are contracts that include both a non-derivative core contract and a derivative, known as an embedded derivative, which cannot be transferred separately and has the effect of causing part of the cash flows of the hybrid contract to vary similarly to that of an isolated derivative.
The following transactions are not treated as financial instruments for accounting purposes:
· Investments in subsidiaries, jointly controlled entities and affiliates (notes 3&11 of our Financial Statements).
· Rights and obligations under employee benefit plans (note 21 c of our Financial Statements).
ii. Classification of financial assets for measurement purposes
Financial assets are initially classified in the various categories used for management and measurement purposes, except when it is mandatory to present them as "Non-current assets held for sale or if they refer to "Cash and reserves at the Central Bank of Brazil", "Derivatives used as hedging" and "Investments in affiliates", which are accounted for separately.
In the initial recognition of a capital instrument not held for trading, we may irrevocably choose to make subsequent changes in fair value through Other Comprehensive Results. This option is made considering each investment individually and has not been used by us. In addition, at initial recognition, we may irrevocably designate at fair value through profit or loss a financial asset that otherwise meets the requirements for measurement at amortized cost or fair value through Other Comprehensive Results, should such designation eliminate or substantially reduce an accounting mismatch that could exist. This option was not used by us.
Financial assets are included, for measurement purposes, in one of the following categories:
• Financial assets measured at fair value in profit or loss held for trading: This category includes financial assets acquired to generate short-term profit resulting from the fluctuation of their prices and financial derivatives not classified as hedging instruments, whose primary business model of the Bank is to trade them frequently.
• Financial assets not intended for trading mandatorily measured at fair value in the result: this category includes financial assets that did not meet the criteria established in the SPPI Test (principal and interest payment only).
• Financial assets measured at fair value in income: This category includes the financial assets for which the Fair Value Option was made at the time of initial designation.
|
• Financial assets measured at fair value in Other Comprehensive Results: are demonstrated at fair value. This category does not include debt instruments classified as "Investments held to maturity", joint control, provided that such instruments have not been classified as "Financial assets measured at fair value on income" or as "Other financial assets at fair value on income".
Results resulting from changes in fair value are recognized in the item adjustment to market value in equity, with the exception of cumulative losses due to non-recovery, which are recognized in the result. When the investment is disposed of or has indications of a decline in fair value due to non-recovery, the result previously accumulated in the fair value adjustments in equity account is reclassified to the result.
• Financial assets measured at amortized cost: This category includes financing granted to third parties based on their nature, regardless of the type of borrower and the form of financing, including financial leasing transactions in which the entities included in the consolidation act as lessors. The entities included in the consolidation generally have the business model of maintaining the loans and credits they grant until their final maturity, which are therefore presented on the consolidated balance sheet at amortized cost (which includes the necessary adjustments to reflect the estimated non-recovery losses).
•
iii. Classification of financial assets for presentation purposes
Financial assets are classified by nature under the following items in the consolidated balance sheet:
• "Cash flows" and "Reserves at the Central Bank of Brazil": cash balances and credit balances related to deposits in BACEN.
• "Financial assets measured at amortized cost" includes loans granted by the Bank, as well as financial leasing credits and other outstanding balances of a financial nature in favor of the Bank, such as cheques drawn against financial institutions, credit balances in relation to clearing houses and settlement agencies for transactions on stock exchanges and organized markets, cash bonuses, capital calls, fee credits and commissions for financial collateral and outstanding balances resulting from transactions not originating in banking operations and services, such as rent collection and similar items.
• "loans and other amounts with credit institutions" means claims of any kind on behalf of financial institutions.
• "Loans and advances to customers" includes outstanding balances of all other credits and loans provided by the Bank, including operations on the open market through centralized counterparties.
• "Debt instruments": bonds and other securities that represent debt to the issuer, yield interest and are issued in physical or book-entry form.
• "Equity instruments" means financial instruments issued by other entities, such as shares, in the nature of equity instruments for the issuer, except investments in subsidiaries, jointly controlled entities or affiliates. The shares of unconsolidated investment funds are included under this heading.
• "Derivatives": includes the fair value in favor of the Bank of derivatives that are not part of the hedging instruments.
• "Derivatives used as hedging" includes the fair value in favor of the Bank of derivatives designated as hedging instruments.
• "Holdings in jointly controlled and jointly controlled entities" means investments in jointly controlled or affiliated entities.
|
iv. Classification of financial liabilities for measurement purposes
Financial liabilities are classified, for measurement purposes, into one of the following categories:
• Financial liabilities measured at fair value in income: This category includes financial liabilities issued to generate short-term profit resulting from the fluctuation of their prices, financial derivatives not considered hedge accounting, and financial liabilities resulting from the direct sale of financial assets purchased through resale or borrowing commitments ("Long Positions").
• Other financial liabilities at fair value in income: Financial liabilities are included in this category when there is more material information obtained, either by eliminating or significantly reducing the recognition or measurement inconsistencies ("accounting divergences") derived from the measurement of assets or liabilities or from the recognition of gains or losses from them on a diverse basis, or because there is a group of financial liabilities or financial assets and liabilities that is managed, and whose performance is assessed on the basis of fair value, in accordance with a documented risk management or investment strategy, and information about the Bank is provided to key professionals in the Bank's management on the same basis.
• Financial liability at amortized cost: financial liabilities, regardless of their form and maturity, not included in any of the above categories and resulting from borrowing activities carried out by financial institutions.
v. Classification of financial liabilities for presentation purposes
Financial liabilities are classified by nature under the following items of the consolidated balance sheet:
• "Deposits of the Central Bank of Brazil": deposits of any nature received from BACEN.
• "deposits of credit institutions" means deposits of any kind, including loan obligations and transfers and borrowings on the open market, received from credit institutions.
• "Customer deposits": includes deposits of any nature such as cash, savings and time, including open market operations received from customers.
• "Securities Obligations" includes the value of bonds and other debts represented by negotiable securities, other than subordinated liabilities.
• "Derivatives": includes the Bank's negative balance fair value of derivatives that are not part of hedge accounting.
• "Short positions": includes the value of financial liabilities resulting from the direct sale of financial assets purchased through resale or loan commitments.
• "Subordinated debts" means the value of the financing received which, for the purposes of priority of payment, is below the common debts. That category also includes financial instruments issued by the Bank which, although they constitute shares for legal purposes, do not meet the requirements for classification as shares.
• "Other financial liabilities" includes the value of payment obligations in the nature of financial liabilities not included in the other items and liabilities subject to financial collateral contracts, unless classified as doubtful.
• "Derivatives used as hedging: includes the fair value of the Bank's liabilities relating to derivatives designated as hedging instruments.
• "Equity instruments" means financial instruments issued by other entities, such as shares, in the nature of equity instruments for the issuer, except investments in subsidiaries, jointly controlled entities or affiliates.
viii. Write-off of Financial Liabilities
We write off a financial liability when your contractual obligations are extinguished, cancelled or when they mature.
|
ix. Compensation
Financial assets and liabilities are offset, i.e. recorded on the balance sheet at their net value, only if the Bank and its subsidiaries currently have a legally enforceable right to offset the amounts recognized and intend to settle on a net basis, or realize the asset and settle the liability simultaneously.
Bond Clearing and Settlement Agreements – IFRS 07 – Derivative Instruments (Disclosure) – Banco Santander has a clearing and settlement agreement for obligations within the scope of the National Financial System (SFN), signed with individuals and legal entities that are members or not of the SFN, resulting in a greater guarantee of financial settlement, with the parties that have this type of agreement. These agreements establish that payment obligations to Banco Santander arising from credit and derivatives operations, in the event of default of the counterparty, will be offset against Banco Santander's payment obligations together with the counterparty.
i. Fair value measurement
Financial assets are measured at fair value, without deduction of estimated transaction costs that would eventually be incurred at the time of their disposal, except financial assets measured at amortized cost, investments held to maturity, equity instruments, whose fair value cannot be sufficiently objectively ascertained, and financial derivatives that have as their object equity instruments of this kind and that are settled upon delivery of these Instruments.
The "fair value" of a financial instrument on a given date is the price that would be received for the sale of an asset or that would be paid for the transfer of a liability in an unforced transaction between market participants on the measurement date. The most objective and common reference to the fair value of a financial instrument is the price that would be paid for it in an active, transparent and significant market ("quoted price" or "market price").
If there is no market price for a particular financial instrument, its fair value is estimated on the basis of the valuation techniques normally adopted by the international financial community, taking into account the specific characteristics of the instrument to be measured and especially the various types of risks associated with it.
All derivatives are recognized on the balance sheet at fair value from the date of the deal. When fair value is positive, they are recognized as assets; when negative, such as liabilities. Changes in the fair value of derivatives since the date of the deal are recognized under the heading "Gains (losses) on financial assets and liabilities" of the consolidated income statement. Specifically, the fair value of standard financial derivatives included in portfolios of financial assets or liabilities measured at fair value in profit or loss is considered equivalent to their daily quoted price; if, for exceptional reasons, it is not possible to determine the quoted price on a specific date, these derivatives are measured using methods similar to those used to measure over-the-counter derivatives.
The fair value of over-the-counter derivatives is considered equivalent to the sum of future cash flows resulting from the instrument, discounted at present value on the date of measurement ("present value" or "theoretical closing"), adopting valuation techniques commonly adopted by financial markets: Net Present Value - NPV, options pricing models and other methods.
|
The "Financial assets measured at amortized cost" and "Investments maintained until maturity" are measured at amortized cost, adopting the effective interest method. "Amortized cost" is the cost of acquiring a financial asset or liability, added to or subtracted, as the case may be, principal payments and accumulated amortization (included in the income statement) from the difference between the initial cost and the amount at maturity. In the case of financial assets, the amortized cost also includes any reductions due to non-recovery or inability to recover. In the case of financial assets measured at amortized cost hedged in fair value hedges, changes in the fair value of these assets related to the risk(s) subject to hedges are recognized.
The "Effective Interest Rate" is the discount rate that corresponds exactly to the initial value of the financial instrument in relation to the totality of its estimated cash flows, of all kinds, over its remaining useful life. In the case of fixed income financial instruments, the effective interest rate coincides with the contractual interest rate defined on the date of contracting, plus, as the case may be, commissions and transaction costs that, by their nature, are part of their financial return. In the case of variable income financial instruments, the effective interest rate coincides with the prevailing rate of return on all commitments up to the next reference date of interest renewal.
Equity instruments whose fair value cannot be sufficiently objectively ascertained are measured at the acquisition cost, adjusted, as the case may be, to related impairment losses.
The amounts by which financial assets are recognized represent, in all material respects, our maximum exposure to credit risk on the date of each of the financial statements. In addition, we have received collateral and other credit increments to mitigate our exposure to credit risk, which primarily include mortgages, cash collateral, equity instruments, sureties, assets leased through leasing and lease agreements, assets acquired through repurchase commitments, bond loans and derivatives.
ii. Provisions for losses on claims for impairment
The book value of non-recoverable financial assets is adjusted by recording a provision for debit loss of "Losses on (net) financial assets – Financial Assets measured at amortized cost" in the consolidated income statement. The reversal of previously recorded losses is recognized in the consolidated income statement in the period in which the reduction to recoverable value decreases and can be objectively related to a recovery event.
To individually measure the impairment loss of loans valued at the impairment of loans, we consider the counterparty's conditions, such as its economic and financial situation, level of indebtedness, income generation capacity, cash flow, management, corporate governance and quality of internal controls, payment history, industry experience, contingencies and credit limits, as well as characteristics of assets such as their nature and purpose, type, sufficiency and guarantees of liquidity level and total credit value, and also based on historical experience of reduction to recoverable value and other circumstances known at the time of valuation.
To measure the impairment loss of loans collectively valued for impairment, we separate financial assets into groups taking into account credit risk characteristics and similarities, i.e., by segment, type of assets, collateral, and other factors associated with historical experience of impairment and other known circumstances at the time of valuation.
|
iii. Impairment
We recognize adjustments for expected credit losses with respect to the following financial instruments that are not measured at fair value through income:
- financial assets that are debt instruments;
- amounts receivable from commercial lease;
- financial guarantee contracts issued; and
- loan commitments issued.
No impairment loss is recognized in equity instruments.
We measure adjustments for losses to an amount equal to expected credit losses over the useful life, except for the following instruments, for which they are recorded as expected 12-month credit losses:
- debt instruments that present a low credit risk on the closing date; and
- other financial instruments (other than lease receivables) in which credit risk has not increased substantially since its initial recognition.
Adjustments for losses in receivables from leases are always measured at an amount equal to the expected credit losses over the useful life.
iv. Measurement of expected credit losses
Expected credit losses are a probability-weighted estimate of credit losses. They are measured as follows:
- financial assets not subject to impairment on the closing date: such as the present value of all cash shortfalls, i.e. the difference between the cash flows due to the entity under the contract and the cash flows we expect to receive;
- financial assets subject to impairment on the closing date: such as the difference between the gross book value and the present value of estimated future cash flows;
- loan commitments to be released: such as the present value of the difference between the contractual cash flows due to us if the commitment is used in full and the cash flows we expect to receive; and
- financial guarantee contracts: payments expected to reimburse the holder, less any amounts we expect to recover.
v. Modified Assets
If the terms of a financial asset are renegotiated or modified or an existing financial asset is replaced by a new asset due to the debtor's financial difficulties, it is necessary to assess whether the financial asset should be written off and the expected credit losses are measured as follows:
- If the expected restructuring does not result in a write-off of the existing asset, the expected cash flows and from the modified financial asset are included in the calculation of the cash shortfalls of the existing asset.
|
- If the expected restructuring results in a write-off of the existing asset, the expected fair value of the new asset is treated as the final cash flow of the existing financial asset at the time of its write-off.
This amount is included in the calculation of cash shortfalls arising from the existing financial asset discounted from the estimated write-off date to the closing date, using the original effective interest rate of the existing financial asset.
vi. Determination of significant increases in credit risk
On each balance sheet calculation date, we assess whether financial assets recorded at amortized cost and financial debt instruments recorded at fair value through Other Comprehensive Results are subject to impairment, as well as other financial instruments subject to such valuation.
A financial asset is "subject to impairment" when one or more events that have a negative impact on the estimated future cash flows of the financial asset have occurred.
Evidence that a financial asset is subject to impairment includes the following observable data:
- significant financial difficulty of the debtor or issuer;
- delays in contractual obligations;
- breach of contract, such as default or delay;
- the restructuring of a loan or advance by us on terms that we would not consider to be interesting to carry out;
- the likelihood that the debtor will go bankrupt or other financial reorganization; or
- the disappearance of an active market for a security due to financial difficulties.
A financial instrument that has been renegotiated due to deterioration in the borrower's condition is generally considered to be subject to impairment unless there is evidence that the risk of not receiving contractual cash flows has been significantly reduced and there is no other indicator of impairment.
vii. Presentation of the provision for expected credit losses on the balance sheet
Provisions for impairment losses are presented on the balance sheet as follows:
- financial assets measured at amortized cost: as a deduction from the gross book value of assets;
- loan commitments and financial guarantee agreements: as a provision; and
- debt instruments measured at fair value through Other Comprehensive Results: No provision for losses is recognized on the balance sheet because the book value of these assets corresponds to fair value.
viii. Individual or collective evaluation
An individual impairment measurement was based on our Management's best estimate of the present value of the cash flows we were expected to receive. In estimating these cash flows, our Management exercised judgment as to the financial condition of a debtor and the net realizable value of any underlying security. Each asset reduced to recoverable value has been assessed on its merits, while the testing strategy and the estimation of cash flows deemed recoverable have been approved by our credit risk officers.
In assessing the need for collective provision for losses, our Management considered factors such as credit quality, portfolio size, concentrations and economic factors. To estimate the required provision, assumptions were established to define how inherent losses were modeled and to determine the necessary data parameters, based on historical experience and current economic conditions.
|
ix. Measurement of impairment
Impairment losses on assets measured at amortized cost were calculated as the difference between the book value and the present value of estimated future cash flows, discounted by the asset's original effective interest rate. Impairment losses on assets measured at fair value through Other Comprehensive Results were calculated as the difference between book value and fair value.
x. Reversal of impairment
For assets measured at amortized cost: If an event occurring after the reduction to recoverable value caused the reduction in the value of the loss by reduction of the recoverable value, the reduction in the loss by reduction of the recoverable value was reversed through the result.
For debt securities measured at fair value through Other Comprehensive Results: If, in a subsequent period, the fair value of a debt security reduced to recoverable value has increased and that increase could be objectively linked to an event occurring after the recognition of the impairment loss, the impairment loss was reversed through the result; otherwise, any increase in fair value has been recognized through Other Comprehensive Results.
Any subsequent recovery in the fair value of an equity security measured at fair value through Other Comprehensive Results and reduced to recoverable value was recognized at any time in Other Comprehensive Results.
Information, assumptions and techniques used to estimate impairment
i. Classification of financial instruments by stages
The portfolio of financial instruments subject to impairment is divided into three levels, based on the stage of each instrument related to its level of credit risk:
- Stage 1: It is understood that a financial instrument at this stage does not have a significant increase in risk since its initial recognition. The provision on this Asset represents the expected loss resulting from possible non-compliances over the next 12 months;
- Stage 2: If a significant increase in risk is identified from the initial recognition, without having materialized deterioration, the financial instrument will be framed within this stage. In this case, the amount of the provision for expected loss for default reflects the estimated loss of the residual life of the financial instrument. For the assessment of the significant increase in credit risk, the quantitative measurement indicators used in the normal management of credit risk shall be used, as well as other qualitative variables, such as the indication that it is a non-deteriorated operation if considered as refinanced or operations included in a special agreement; and
|
- Stage 3: A financial instrument is registered within this stage, when it shows signs of deterioration evident as a result of one or more events that have already occurred and that materialize into a loss. In this case, the amount for the provision for losses reflects the expected losses due to credit risk over the expected residual life of the financial instrument.
ii. Impairment estimation methodology
The measurement of the loss by reduction to the recoverable value is carried out through the following factors:
- Exposure to Default or EAD: is the amount of the transaction exposed to credit risk, including the ratio of current available balance that could be provided at the time of default. The developed models incorporate assumptions about changes in the payment schedule of operations.
- Probability of Default (PD): is defined as the probability that the counterparty can meet its obligations to pay principal and/or interest. For the purposes of IFRS 9, both will be considered: PD - 12 months (Stage 1), which is the probability that the financial instrument will default during the next 12 months as well as the DP - lifetime (Stages 2 and 3), which considers the probability that the operation will default between the balance sheet date and the residual maturity date of the operation. The standard requires that future information relevant to the estimation of these parameters should be considered.
- Loss on Default (LGD): is the resulting loss in the event of default, that is, the percentage of exposure that cannot be recovered in case of default. It depends mainly on the guarantees associated with the operation, which are considered as risk mitigation factors associated with each credit financial asset and the future cash flows expected to be recovered. As established in the regulations, future information should be taken into account for your estimation.
- Discount rate: is the rate applied to future cash flows estimated during the expected life of the asset, to bring them to present value.
For the estimation of the aforementioned parameters, the Bank has applied its experience in the development of internal models for the calculation of the parameters both for purposes of the regulatory environment and for internal management.
iii. Definition of default
We consider that a financial asset is in default when:
- it is likely that the debtor will not pay us in full his credit obligations; or
- the debtor has significant credit obligations to us that have been due for more than 90 days, as a general rule.
Overdrafts are considered overdue if the customer violates a recommended limit or has been granted a lower limit than the current outstanding amount.
When assessing whether a debtor is in default, we consider the following indicators:
- qualitative – e.g. breaches of restrictive clauses (covenants)
- quantitative – for example, status of accrued and non-payment of another obligation of the same issuer to us; and
- based on data collected internally and obtained from external sources.
|
b. Modified opinions and emphases in the auditor's report
In the years ended December 31, 2022, 2021 and 2020, there were no caveats and emphases present in the opinion of the auditor in charge.
|
2.4. The officers shall comment on the material effects that the following events have caused or are expected to cause in the Company's financial statements and results:
a. introduction or disposal of operating segment
No introduction or divestiture of an operating segment was carried out in the last 3 fiscal years.
b. incorporation, acquisition or disposal of equity interest
| · | Investment of Lexisnexis Serviços de Análise de Risco Ltda. in Gestora de Inteligência de Crédito S.A. |
On December 20, 2022, Banco Santander (Brasil) S.A. ("Santander"), together with the other shareholders, closed the investment transaction, through the subscription of new shares, by Lexisnexis Serviços de Análise de Risco Ltda. ("Lexisnexis") in Gestora de Inteligência de Crédito S.A. ("GIC"). Upon completion of the subscription, Lexisnexis becomes a shareholder holding shares equivalent to 20% (twenty percent) of GIC's share capital.
With the implementation of the closure and the entry of Lexisnexis into GIC, Santander becomes the holder of 15.559% of the shares issued by GIC.
· Sale of the entire Equity Stake held by Aymoré Crédito, Financiamento e Investimento S.A. in Banque PSA Finance, S.A. and Santander Corretora de Seguros, Investimentos e Serviços S.A. in PSA Corretora de Seguros e Serviços Ltda.
On November 29, 2022, Aymoré Crédito, Financiamento e Investimento S.A. ("Aymoré") and Santander Corretora de Seguros, Investimentos e Serviços S.A. ("Santander Corretora de Seguros") formalized, together with Banque PSA Finance, S.A. ("Banque PSA") and Stellantis Services Ltd. ("Stellantis Services"), a certain agreement for the purchase and sale of equity interests and other agreements regarding the sale of equity interests held (a) by Aymoré, representing 50% (fifty percent) of the share capital of Banco PSA Finance Brasil S.A., for Banque PSA, and (b) by Santander Corretora de Seguros, representing 50% (fifty percent) of the share capital of PSA Corretora de Seguros e Serviços Ltda., for Stellantis Services ("Operation").
The execution of the Transaction will be subject to the implementation of certain conditions customary in this type of transaction, including applicable regulatory approvals.
· Investment of Santander Corretora de Seguros, Investimentos e Serviços S.A. in Biomas – Serviços Ambiental, Restauração e Carbono S.A.
On November 9, 2022, Santander Corretora de Seguros, Investimentos e Serviços S.A. ("Santander Corretora") entered into an investment agreement to become a shareholder ("Operation") of Biomas – Serviços Ambiental, Restauração e Carbono S.A. ("Biomas").
Biomas is a company established with the purpose of providing services aimed at the development and execution of activities aimed at the restoration and conservation of biodiversity and natural ecosystems, aligning, therefore, with the ESG (Environmental, Social and Governance) purposes of the Santander Group. After the fulfillment of the condition’s precedent established in the Agreement, the closing of the Transaction took place on March 20, 2023, so that Santander Corretora now holds 16.66% of the shareholding of Biomas.
|
· Total spin-off of Atual Serviços de Recuperação de Crédito e Meios Digitais S.A. to Return Capital S.A. e Liderança Serviços Especializados em Cobrança Ltda.
On October 31, 2022, Atual Serviços de Recuperação de Crédito e Meios Digitais S.A. ("Atual") was fully divided and its assets were absorbed by both of its direct subsidiaries, Return Capital S.A. ("Return") and Liderança Serviços Especializados em Cobrança Ltda. ("Leadership") in accordance with the proportions established in the Protocol and Justification of the operation. With the implementation of the total spin-off, Return had its capital increased by R$ 3,990,617,559.32 and the Leadership by R$ 267,027,054.61, both of which were directly owned by Banco Santander (Brasil) S.A. as the sole shareholder of Return and the only partner of Leadership.
· Acquisition of an Equity Stake in SX Tools Soluções e Serviços Compartilhados Ltda.
On September 26, 2022, Banco Santander (Brasil) S.A. ("Banco Santander") underwrote the capital increase in SX Tools Soluções e Serviços Compartilhados Ltda ("SX Tools") becoming the sole partner of the company. SX Tools will act primarily in the provision of services to Banco Santander and Group companies and will concentrate the hiring of technology providers focused on the provision of such services.
· Acquisition of an Equity Stake in CSD Central de Serviços de Registro e Depósito aos Mercados Financeiro e de Capitais S.A.
On January 21, 2022, Santander Corretora de Seguros, Investimentos e Serviços S.A. ("Santander Corretora"), together with other investors, together with CSD Central de Serviços de Registro e Depósito aos Mercados Financeiro e de Capitais S.A. ("CSD BR") and its respective shareholders, a certain investment agreement and other agreements ("Agreement") with a view to subscribing to a minority interest in CSD BR ("Transaction"). CSD BR operates as a registrar of financial assets, derivatives, securities and insurance policies, authorized by the Central Bank of Brazil, the Securities and Exchange Commission and the Superintendence of Private Insurance. After compliance with the conditions precedent set forth in the Agreement, the closing of the Transaction took place on May 26, 2022, so that Santander Corretora now holds 20% (twenty percent) of CSD BR's shareholding.
· Sale of the entire Equity Stake held in Paytec Tecnologia em Pagamentos Ltda. and Paytec Logística e Armazém Ltda.
On May 26, 2022, Banco Santander entered into a contract with Getnet Adquirência e Serviços para Meios de Pagamento S.A. – Instituição de Pagamento ("Getnet IP"), the contract for the purchase and sale of shares, transfer of title and other covenants, of 100% of the shares of Paytec Tecnologia em Pagamentos Ltda. ("Transaction"). With the implementation of the Operation, Getnet IP directly held 100% of the shares of Paytec Tecnologia em Pagamentos Ltda and indirectly controlled Paytec Logística e Armazém Ltda.
|
· Acquisition of an Equity Stake in Monetus Investimentos Ltda. and Monetus Corretora de Seguros Ltda.
On June 15, 2021, Santander Distribuidora de Títulos e Valores Mobiliários S.A. ("Santander DTVM", new corporate name of PI Distribuidora de Títulos e Valores Mobiliários S.A.), Toro Corretora de Títulos e Valores Mobiliários S.A. ("Toro CTVM"), and Toro Investimentos S.A. ("Toro Investimentos" and, together with Toro CTVM, "Toro") entered into an agreement with the partners of Monetus Investimentos Ltda., and Monetus Corretora de Seguros Ltda. (collectively "Monetus"), an investment agreement and other agreements, by which, once the operation is carried out, Toro Investimentos would hold 100% of Monetus' share capital ("Transaction"). Monetus, originally from Belo Horizonte, carries out its activities through an automated investment application based on objectives. Upon compliance with the applicable conditions precedent, the closing of the Transaction was formalized on January 4, 2022.
· Acquisition of an Equity Stake in Mobills Labs Soluções em Tecnologia Ltda. and Mob Soluções em Tecnologia Ltda.
On June 15, 2021, Santander Distribuidora de Títulos e Valores Mobiliários S.A. ("Santander DTVM", new corporate name of PI Distribuidora de Títulos e Valores Mobiliários S.A.), Toro Corretora de Títulos e Valores Mobiliários S.A. ("Toro CTVM"), and Toro Investimentos S.A. ("Toro Investimentos" and, together with Toro CTVM, "Toro") entered into an agreement with the partners of Mobills Labs Soluções em Tecnologia Ltda., and Mob Soluções em Tecnologia Ltda (collectively "Mobills"), an investment agreement and other agreements, by which, once the operation was carried out, Toro Investimentos would hold 100% of Mobills' share capital ("Operation"). Headquartered in Ceará, Mobills has a variety of financial applications that have a large user base, especially related to financial planning. Upon compliance with the applicable conditions precedent, the closing of the Transaction was formalized on January 4, 2022.
· Acquisition of an Equity Stake in Apê11 Tecnologia e Negócios Imobiliários Ltda.
On September 2, 2021, Santander Holding Imobiliária S.A. ("SHI") – a wholly-owned subsidiary of the Company – entered into certain Share Purchase and Sale Agreement and Investment Agreement with the partners of Apê11 Tecnologia e Negócios Imobiliários Ltda. ("Apê11"), pursuant to which, once the transaction was carried out, it would hold 90% of Apê11's share capital ("Operation"). Apê11 acts as a collaborative marketplace, a pioneer in the digitalization of the journey of buying houses and apartments. Following compliance with the condition’s precedent set forth in the Share Purchase and Sale Investment Agreement, the closing of the Transaction was formalized on December 16, 2021.
· Acquisition of an Equity Stake in Solution 4Fleet Consultoria Empresarial Ltda.
On July 13, 2021, Aymoré Crédito, Financiamento e Investimento S.A. ("Aymoré"), entered into certain Investment and Share Purchase and Sale Agreement with the partners of Solution 4Fleet Consultoria Empresarial Ltda. ("Solution4Fleet"), pursuant to which, once the transaction was completed, Aymoré would hold 80% of Solution 4Fleet's share capital ("Operation"). Solution 4Fleet specializes in structuring vehicle rental and subscription businesses – a long-term rental modality for individuals. Upon compliance with the condition’s precedent set forth in the Share Purchase and Sale Investment Agreement, the closing of the Transaction was formalized on October 8, 2021.
|
· Acquisition of an Equity Stake in Liderança Serviços Especializados em Cobranças Ltda. ("Liderança") and Fozcobra Agência de Cobranças Ltda. ("Fozcobra") and subsequent incorporation of Fozcobra by Liderança.
On August 4, 2021, Atual Serviços de Recuperação de Créditos e Meios Digitais S.A. ("Atual") – a wholly-owned subsidiary of the Company – entered into a certain Quota and Other Covenants Agreement with the partners of Liderança Serviços Especializados em Cobranças Ltda. ("Leadership"), a Contract for the Assignment of Quotas and Other Covenants, by which, once the transaction was carried out, it would hold 100% of the capital stock of Leadership ("Operation"). The Leadership operates in the area of recovery of arrears, providing extrajudicial collection services to financial institutions of different sizes, retail chains, telecommunications operators and automakers, among others, and has a subsidiary, Fozcobra Agência de Cobranças Ltda. After compliance with the condition’s precedent established in the Quota Assignment Agreement and Other Covenants, the closing of the Operation was formalized on October 1, 2021. Continuous act, Fozcobra was incorporated by the Leadership on October 4, 2021.
· Acquisition of an Equity Stake in Car10 Tecnologia e Informação S.A. and Pag10 Fomento Mercantil Eireli.
On July 13, 2021, Webmotors S.A. ("Webmotors"), entered into an agreement with the partners of Car10 Tecnologia e Informação S.A. ("Car10 Tecnologia") and Pag10 Fomento Mercantil Eireli. ("Pag10" and, together with Car10 Tecnologia, "Car10"), certain Investment and Share Purchase and Sale Agreements, by which, once the transaction is completed, Webmotors would hold approximately 66.7% of the share capital of Car10 Tecnologia, which, in turn, is the sole owner of Pag10 ("Transaction"). Car10 acts as a marketplace that brings together more than 7,000 service providers such as workshops and autocenters; bodywork and painting; and cleaning and sanitization, as well as emergency assistance and towing. Following compliance with the conditions precedent set forth in the Share Purchase and Sale Investment Agreement, the closing of the Transaction was formalized on September 20, 2021.
· Corporate reorganization Santander Leasing S.A. Arrendamento Mercantil and Banco Bandepe S.A.
On May 11, 2021, Banco Santander (Brasil) S.A. ("Banco Santander") and Banco Bandepe S.A. ("Bandepe") entered into a Share Purchase and Sale Agreement whereby Banco Santander acquired the entire equity interest held by Bandepe in Santander Leasing S.A. Arrendamento Mercantil ("Santander Leasing"), which corresponds to 21.42%. In this operation, Banco Santander became the sole shareholder of Santander Leasing. On May 27, 2021, it was decided to incorporate all of Bandepe's shares by Santander Leasing in order to convert Bandepe into a wholly-owned subsidiary of Santander Leasing ("Share Merger").
· Execution of an Agreement for the Acquisition of a Shareholding in Toro Controle
On September 29, 2020, Santander Distribuidora de Títulos e Valores Mobiliários S.A. ("Santander DTVM", new corporate name of PI Distribuidora de Títulos e Valores Mobiliários S.A.) which is indirectly controlled by Banco Santander, entered into an investment agreement and other agreements with the shareholders of Toro Controle e Participações S.A. ("Toro Controle"). Toro Controle was a holding company that ultimately controlled Toro Corretora de Títulos e Valores Mobiliários S.A. ("Toro CTVM") and Toro Investimentos S.A. ("Toro Investimentos" and, collectively, "Toro"). Toro is an investment platform founded in Belo Horizonte in 2010. In 2018, it received the necessary authorizations and began its operation as a securities broker aimed at the retail public. After the fulfillment of all applicable suspensive conditions, including the approval by the Central Bank of Brazil, the operation was effective on April 30, 2021, with the acquisition of shares representing 60% of the capital stock of Toro Controle and its immediate incorporation by Toro CTVM, so that Santander DTVM became the direct holder of the equivalent of 60% of the capital stock of Toro CTVM that, in turn, it holds 100% of the share capital of Toro Investimentos.
|
· Spin-off Getnet Adquirência e Serviços para Meios de Pagamento S.A.
Following the approval of the studies and favorable proposal of the Board of Directors of Santander Brasil, on March 31, 2021, the shareholders of Santander Brasil approved the spin-off of Santander Brasil, for the segregation of the shares of its property issued by Getnet Adquirência e Serviços para Meios de Pagamentos S.A. ("Getnet"), with version of the portion divided for Getnet itself. After the completion of the spin-off, Santander Brasil's shareholders became direct shareholders of Getnet in proportion to their stake in Santander Brasil's share capital.
As a result of the Spin-off, Santander Brasil's share capital was reduced by a total amount of R$ 2,000,000 (two billion reais), without the cancellation of shares, increasing Santander Brasil's share capital from R$ 57,000,000 (fifty-seven billion reais) to R$ 55,000,000 (fifty-five billion reais).
c. Unusual events or operations
Nothing to report.
|
2.5. Inform the value of non-accounting measurements
(in millions of R$, unless otherwise indicated)
In the fiscal year ended December 31, | |||||
2022 | 2021 | 2020 | 2019 | 2018 | |
| Efficiency Index disregarding the effects of hedging investments abroad | 27,4% | 28,2% | 27,8% | 28,2% | 30,3% |
b. make reconciliations between the amounts disclosed and the values of the audited financial statements
(in millions of R$, unless otherwise indicated)
| From and for the financial year ended December 31, | |||||||
| 2022 | 2021 | 2020 | 2019 | 2018 | |||
| (in millions of R$, unless otherwise indicated) | |||||||
| Efficiency index | |||||||
| Administrative expenditure | 18.240 | 17.316 | 17.115 | 16.942 | 16.792 | ||
| Total profit | 66.475 | 63.926 | 48.242 | 58.769 | 49.507 | ||
| of which: | |||||||
| Gains (losses) on financial assets and liabilities (net) and exchange differences (net) | 4.699 | (1.781) | (11.703) | (326) | (5.589) | ||
| Efficiency index | 27,4% | 27,1% | 35,5% | 28,8% | 33,9% | ||
| Total Profit | 66.475 | 63.926 | 48.242 | 58.769 | 49.507 | ||
| Hedge effects of investments made abroad | (129) | 2.512 | 13.583 | 1.264 | 5.867 | ||
| Total revenue excluding the effects of hedging investments held abroad | 66.604 | 66.438 | 61.825 | 60.033 | 55.374 | ||
| Administrative expenditure | 18.240 | 17.316 | 17.115 | 16.942 | 16.792 | ||
| Efficiency ratio adjusted for the effects of hedging investments held abroad | 27,4% | 28,2% | 27,8% | 28,2% | 30,3% | ||
c. explain why you believe that such measurement is more appropriate for the correct understanding of your financial condition and the outcome of your operations
The Efficiency Index disregarding the effects of hedging investments abroad aims to adequately convey the company's performance.
|
2.6. Subsequent events to DFs:
There were no events following the release of our financial statements for the fiscal year ended December 31, 2022 that materially change them.
2.7. Allocation of results
As established in the Company's Bylaws, the net income calculated, after deductions and legal provisions, will have the following destination:
I - 5% (five percent) for the constitution of the legal reserve, until it reaches 20% (twenty percent) of the share capital;
II - 25% (twenty-five percent) of net income, adjusted in accordance with Article 202 of Law No. 6,404/76, shall be mandatorily distributed as a mandatory dividend to all shareholders;
III - the balance, if any, may, upon proposal of the Executive Board and approved by the Board of Directors: (a) be destined to the formation of a Reserve for Equalization of Dividends, which shall be limited to 50% (fifty percent) of the value of the capital stock and shall have the purpose of guaranteeing resources for the payment of dividends, including in the form of interest on equity, or its anticipations, in order to maintain the flow of remuneration to shareholders, and once this limit is reached, it will be up to the General Meeting to resolve on the balance, proceeding to its distribution to shareholders or to increase the share capital; and/or (b) be retained, in order to meet the capital investment needs stipulated in the Company's General Budget, submitted by management to the approval of the General Meeting and reviewed annually by the General Meeting, when it lasts more than one fiscal year.
Profits not intended under the above terms shall be distributed as dividends.
a. Rules on profit retention
Pursuant to corporate law, including Law 6,404 of December 15, 1976, as amended ("Brazilian Corporation Law"), and the Company's Bylaws, net income for the year may be retained in order to meet the capital investment needs stipulated in the Company's general budget, as submitted by management for approval at a general meeting and reviewed annually, if applicable.
There was no withholding of profits in the last three fiscal years, and the Company paid dividends in excess of the mandatory dividend.
| b. | Rules on dividend distribution |
The Company's Bylaws provide that an amount of not less than 25% of net income, less allocations to legal and contingency reserves, shall be available for distribution in the form of dividends or interest on equity in any fiscal year. This amount represents the mandatory dividends. The calculation of net income and allocations to reserves, as well as the amounts available for distribution, are made based on the Company's individual financial statements prepared in accordance with accounting practices adopted in Brazil and standards issued by the National Monetary Council ("CMN") and the Central Bank of Brazil ("Central Bank" or “BACEN”), applicable to financial institutions authorized to operate by the Central Bank (" BRGAAP").
|
The Company's Board of Directors may declare interim dividends or interest on equity based on the profits recorded in the Company's consolidated half-yearly financial statements. In addition, the Board of Directors may declare dividends or interest on equity based on consolidated financial statements for shorter periods, provided that the total dividends paid in each semester do not exceed the value of the capital reserves provided for under the corporate legislation. The Board of Directors may also declare interim dividends or interest on equity from the accumulated profit or profit reserves existing in the Company's last annual or half-yearly balance sheet.
Any payment of interim dividends or interest on own capital by the Company may be offset against the amount of mandatory dividends related to the net income calculated in the fiscal year in which they are paid.
The amount distributed to shareholders as interest on equity, net of any withholding tax, may be included as part of the mandatory minimum dividends. In accordance with the applicable legislation, the Company is obliged to pay shareholders an amount sufficient to ensure that the net amount received as interest on equity, less the payment of the applicable withholding income tax, plus the value of the dividends declared, is equivalent to at least the amount of the mandatory dividend.
The corporate legislation allows, however, that the Company's shareholders suspend the distribution of dividends if the Company's Board of Directors informs the general meeting of shareholders that the distribution is incompatible considering the Company's financial situation. The Company's fiscal council, if in operation, shall review any suspension of payment of the mandatory dividend. In addition, management must submit a report to the Brazilian Securities and Exchange Commission ("CVM") justifying the reasons for the suspension. Net income not distributed as a result of the suspension shall be allocated to a separate reserve and, if not absorbed by subsequent losses, shall be distributed as dividends as soon as the Company's financial condition permits such payment.
| c. | Periodicity of dividend distributions |
The distribution of dividends and/or interest on own capital is annual (at the annual general meeting), based on the results of the fiscal year, and the Board of Directors may also declare dividends to the profit account calculated in the half-yearly, quarterly, bi-monthly or monthly balance sheet or even declare interim dividends to the account of accumulated profits or profit reserves existing in the last annual or half-yearly balance sheet of the Company.
In 2020, the Company approved the payment of interest on equity and/or dividends in April, July, October and December of that year and additionally in February 2021, as described below:
| · | Interest on equity in the amount of R$ 890 million, declared on April 27, 2020; |
| · | Interest on equity in the amount of R$ 770 million, declared on July 28, 2020; |
| · | Interest on equity in the amount of R$ 1,000 million, declared on October 26, 2020; |
| · | Interest on equity in the amount of R$ 665 million, declared on December 28, 2020; |
| · | Interim dividends based on the profit calculated in the December 2020 balance sheet in the amount of R$ 512 million, declared on February 2, 2021; |
|
In 2021, the Company approved the payment of interest on equity and/or dividends in April, July, October and December of that year and in February 2022 based on the 2021 result, as described below:
| · | Interim Dividends in the amount of R$ 2,800 million, declared on April 27, 2021; |
| · | Interest on equity in the amount of R$ 3,400 million, declared on July 27, 2021; |
| · | Interim Dividends in the amount of R$ 3,000 million, declared on October 26, 2021; |
| · | Interest on equity in the amount of R$ 249 million, declared on December 28, 2021; |
| · | Interim Dividends in the amount of R$ 1,300 million, declared on February 1, 2022; |
In 2022, the Company approved the payment of interest on equity and/or dividends in February, April, August and October of that year:
| · | Interest on equity in the amount of R$ 1,700 million, declared on February 1, 2022; |
| · | Interim Dividends in the amount of R$ 700 million, declared on April 14, 2022; |
| · | Interest on equity in the amount of R$ 1,000 million, declared on April 14, 2022; |
| · | Interest on equity in the amount of R$ 1,700 million, declared on August 5, 2022; |
| · | Interim Dividends in the amount of R$ 820 million, declared on October 13, 2022; |
| · | Interest on equity in the amount of R$ 880 million, declared on October 13, 2022; |
d. Any restrictions on the distribution of dividends imposed by special legislation or regulations applicable to the issuer, as well as contracts, judicial, administrative or arbitral decisions
The Company observed the limitation of the distribution of results determined by CMN Resolution No. 4,885, of December 23, 2020, which establishes, for a fixed term, prohibitions on the remuneration of own capital, the increase in the remuneration of managers, the repurchase of shares and the reduction of capital stock, to be observed by financial institutions and other institutions authorized to operate by the Central Bank of Brazil, considering the potential effects of the coronavirus (Covid-19) pandemic on the National Financial System.
e. If the issuer has a formally approved result allocation policy, inform the body responsible for the approval, date of approval and, if the issuer discloses the policy, locations on the World Wide Web where the document can be consulted
The Company has a dividend distribution policy, approved by the Board of Directors on September 18, 2009, which recommends to its shareholders the distribution of 50.0% of the annual adjusted net income as dividends and/or interest on equity. The future dividend policy and the amount of future dividends and/or interest on equity that the Company decides to recommend to shareholders for approval will depend on a number of factors, including, without limitation, the Company's cash flow, financial condition (including capital position), investment plans, prospects, legal requirements, economic environment and other factors that we consider relevant at the time.
|
2.8. The directors shall describe the relevant items not evidenced in the issuer's financial statements, indicating:
a. assets and liabilities held by the issuer, directly or indirectly, which do not appear on its balance sheet, such as:
i. write-off receivables portfolios over which the entity has not substantially retained or transferred the risks and benefits of ownership of the transferred asset, indicating their liabilities
Not applicable, as there are no such assets off the balance sheet.
ii. contracts for the future purchase and sale of products or services
Not applicable, as there are no such assets off the balance sheet.
| iii. | unfinished construction contracts |
Not applicable, as there are no such assets off the balance sheet.
| iv. | contracts for future receipt of financing |
Not applicable, as there are no such assets off the balance sheet.
b. other items not evidenced in the financial statements
We offer a number of guarantees for our clients to improve their credit position and allow them to be able to compete. As required, the "Maximum potential value of future payments" represents the notional amounts that could be lost if there were total default of the guarantor parties, without considering possible recoveries of secured or provided guarantees, or recoveries on appeal.
There is no relationship between these amounts and the likely losses on these guarantees.
In fact, the "Maximum potential value of future payments" significantly exceeds the inherent losses.
The following table presents all guarantees as at 31 December 2022, 2021 and 2020.
| In millions of Reais | 2022 | 2021 | 2020 |
| Maximum potential value of future payments | |||
| Contingent liabilities | |||
| Guarantees and other sureties | 54.497 | 49.392 | 45.930 |
| Financial guarantees | 41.456 | 33.193 | 32.447 |
| Performance guarantees | 2.167 | 1.168 | 990 |
| Financial letters of credit | 10.841 | 14.991 | 12.408 |
| Other | 33 | 41 | 55 |
| Other contingent exhibitions | 2.882 | 4.029 | 2.352 |
| Documentation credits | 2.882 | 4.029 | 2.352 |
| Total contingent liabilities | 57.379 | 53.420 | 48.282 |
|
The investment funds that are under our management and that are not recorded in our balance sheet are detailed in the table below:
| In thousands of Reais | 2022 | 2021 | 2021 |
| Funds under management | 18.934 | 2.770 | 2.716 |
| Total | 18.934 | 2.770 | 2.716 |
Finally, we hold in our custody debt securities and third-party securities totaling R$48,918 million in 2021, R$37,998 million in 2021 and R$35,519 million in 2020.
|
2.9. In relation to each of the items not evidenced in the financial statements indicated in item 2.8., the officers shall comment:
a. how such items alter or may change the Company's revenues, expenses, operating income, financial expenses or other items in the Company's financial statements
There are no additional effects to be evidenced other than those presented in Section 2.8 of this document.
b. nature and purpose of the operation
There are no additional effects to be evidenced other than those presented in Section 2.8 of this document.
c. nature and amount of the obligations assumed and the rights generated in favor of the Company as a result of the operation
There are no additional effects to be evidenced other than those presented in Section 2.8 of this document.
|
2.10. The directors must indicate and comment on the main elements of the Company's business plan, specifically exploring the following topics:
a. investments, including:
i. quantitative and qualitative description of investments in progress and planned investments
Our main capital expenditures are comprised of investments in information technology. Our information technology platform focuses on your customers and supports our business model. In the years 2022, 2021 and 2020, total investments in information technology were R$1,885 million, R$1,905 million and R$1,432 million, respectively.
In 2022, 2021 and 2020, we carried out significant transformations in our operations and technological infrastructure, through the implementation of new solutions in the areas of Artificial Intelligence (AIOPs), Micro Services, Blockchain Technology, Cyber Insurance, Facial Recognition, MultiCloud (cloud-based technologies), among others. The application of these new technologies has improved our interaction with our customers, allowing us to offer solutions in credit, consortium, payroll loans, insurance, private banking, cards, means of payment, agribusiness and investments to better meet the needs of customers. We also continue to invest in our physical distribution network (branches, PABs and PAEs), including: biometric identification for corporate customers, digital purchasing and payment in return, among other initiatives.
In the scope of the physical service (Branches, PABs and PAEs), applying new functionalities, including: biometrics for PJ customers in card transactions, purchase and payment of exchanges by digital treasury, single line administration for a more efficient organization of the service and recognition of preferred customers on the totem of the branches, seeking greater security, agility and personalization of services.
ii. sources of financing for investments
The sources of financing for the investments mentioned above are mainly cash flow from operating activities. The ongoing investments consist mainly of investments in technology.
iii. relevant divestments in progress and planned divestments
The main disinvestments in the last three fiscal years were the spin-off and sale of Super Payments in 2020.
|
b. provided that it is already disclosed, indicate the acquisition of plants, equipment, patents, or other assets that should materially influence the Company's productive capacity.
Please refer to the information available in item 2.4 - b, above.
c. new products and services, indicating:
i. description of ongoing research already released
Not applicable.
ii. total amounts spent by the Company on research for the development of new products or services
Not applicable.
iii. projects in development already disclosed
Not applicable.
iv. total amounts spent by the Company on the development of new products or services
Not applicable, as the amounts spent on the development of new products or services are considered in item 2.10.a (i) above.
d. opportunities included in the Company's business plan related to ESG issues
Our purpose is to contribute to the progress of people and business, while supporting the development of a fairer world and a sustainable Brazil. We have sought to develop a clear strategy for our environmental aspirations (to be a reference company in sustainable business), social (working to ensure that everyone has opportunities) and governance (to have the best practices of ESG management).
Our extensive commercial activity allows us to support our customers and their projects. In the year ended December 31, 2022, we assisted approximately 430,000 people through financial inclusion products and financial education guidance, through access to banking services, non-financial products and initiatives. We have specific products to support microentrepreneurs and SMEs, such as the Prospera Microfinanças, " Avançar" and " Parceiros em Ação" programs. In addition, we increasingly seek to include financial management as a theme in the relationship with customers, through tools such as Santander On.
|
2.11. Comment on other factors that have materially influenced operating performance and that have not been identified or commented on in the other items of this section
The balance of amounts spent on other administrative expenses for 2022 was R$8,343 million, of which R$2,229 million is attributed to technical services and R$2,577 million is attributed to expenses with system maintenance.
The composition of the balance of other administrative expenses for the years 2022, 2021 and 2020 is described in the table below:
| In Thousand of Reais | 2022 | 2021 | 2020 |
| Diverse Maintenance expenses | 895,734 | 889,077 | 743,580 |
| Systems Maintenance expenses | 2,577,479 | 2,474,348 | 2,355,310 |
| Advertising | 540,593 | 621,425 | 654,175 |
| Communications | 421,522 | 353,271 | 648,856 |
| Per diems and travel expenses | 72,647 | 71,840 | 68,922 |
| Taxes other than income tax | 148,950 | 202,440 | 280,098 |
| Surveillance and cash courier services | 548,759 | 597,946 | 594,953 |
| Insurance premiums | 21,977 | 22,375 | 16,620 |
| Specialized and technical services | 2,228,715 | 2,184,139 | 2,171,460 |
| Tecnhical Reports | 425,767 | 755,343 | 319,814 |
| Other Specialized and technical services | 1,802,948 | 1,828,795 | 1,851,646 |
| Other administrative expenses (1) | 886,742 | 873,857 | 709,504 |
| Total | 8,343,118 | 8,290,717 | 8,243,478 |
(1) on December 31, 2022 is mainly composed of Data Processing Expenses in the balance of R$ 155,326 (2021 – R$ 160,716 and 2022 – R$ 176,105), Services Expenses in the balance of R$ 52,165 (2021 – revenue of BRL 51,689 and 2020 BRL 27,751), Expenses with the Benefit Guarantee Fund - FGB BRL 3,979 2021 - BRL 3,864 and 2020 BRL 8,478), and Recovery of Charges and Expenses BRL 435,717 (2021 - BRL 378,604 and 2020 - BRL 212,850)
There is no other information pertinent to this topic that we deem relevant that is not described in the other items of this Section 2.
|
EXHIBIT III
BOARD PROPOSAL FOR ALLOCATION OF NET PROFIT FOR THE FISCAL YEAR (Pursuant to item II of the sole paragraph of article 10, Annex A of CVM Resolution 81/22)
1. Inform the net profit for the fiscal year
Net income for the 2022 fiscal year was R$ 12,358,521 thousand in the individual financial statements.
2. Inform the overall amount and the value per share of dividends, including anticipated dividends and interest on equity that has already been declared
For the 2022 fiscal year, the Board of Directors approved the payment of interest on equity to our shareholders, in the amount of R$ 5,280 million, and dividends, in the amount of R$ 1,520 million, ad referendum of the ordinary general meeting. These values were deliberated on February 1, 2022, April 14, 2022, August 5, 2022, October 13, 2022, as shown in the table below in summary form:
| Financial Year 2022 | Deliberation Date | Gross Amount (in R$ thousand) | Gross Value per share (in R$) | Net Value per share (in R$) | Payment Date | ||||
| ON | PN | Unit | ON | PN | Unit | ||||
| Interest on Equity Already Declared | 02/01/22 | 1,700,000 | 0.21701568653 | 0.23871725519 | 0.45573294172 | 0.18446333355 | 0.20290966691 | 0.38737300046 | 04/03/22 |
| Interim Dividends | 04/14/22 | 700,000 | 0.08945232373 | 0.09839755610 | 0.18784987983 | 0.08945232373 | 0.09839755610 | 0.18784987983 | 16/05/22 |
| Interest on Equity Already Declared | 04/14/22 | 1,000,000 | 0.12778903390 | 0.14056793729 | 0.26835697119 | 0.10862067882 | 0.11948274669 | 0.22810342551 | 16/05/22 |
| Interest on Equity Already Declared | 08/05/22 | 1,700,000 | 0.21774739699 | 0.23952213669 | 0.45726953368 | 0.18508528744 | 0.20359381618 | 0.38867910362 | 06/09/22 |
| Interim Dividends | 10/13/22 | 820,000 | 0.10502481038 | 0.11552729142 | 0.22055210180 | 0.10502481038 | 0.11552729142 | 0.22055210180 | 22/11/22 |
| Interest on Equity Already Declared | 10/13/22 | 880,000 | 0.11270955260 | 0.12398050786 | 0.23669006047 | 0.09580311971 | 0.10538343168 | 0.20118655140 | 22/11/22 |
| Total | 6,800,000 | 0.869738804 | 0.956712685 | 1.826451489 | 0.768449554 | 0.845294509 | 1.613744063 | ||
3. Inform the net profit percent for the distributed fiscal year
In the 2022 fiscal year, 57.92% of the Company's net income was distributed, after allocation to the legal reserve, according to the individual financial statement, prepared in accordance with the Accounting Practices Adopted in Brazil, configured by the Brazilian Corporation Law, associated with the rules of the CMN, the Central Bank and the CVM, as shown below.
|
| Description | 2022 | 2021 | 2020 |
| Net Income | 12,358,521 | 14,995,509 | 14,056,148 |
| (-) Legal Reserve | 617,926 | 749,775 | 702,807 |
| (=) Adjusted Net Income for Dividend purposes (i) | 11,740,595 | 14,245,734 | 13,353,341 |
| Minimum Mandatory Dividend (25%) | 2,935,149 | 3,561,433 | 3,338,335 |
| Interest on Equity (JCP) | 5,280,000 | 3,649,000 | 3,325,000 |
| Early Dividends | 1,520,000 | 7,100,000 | 512,085 |
| Total (JCP + Dividends) (ii) | 6,800,000 | 10,749,000 | 3,837,085 |
| Dividend Higher than Mandatory Minimum | 3,864,851 | 7,187,567 | 0 |
| % of Distributed Profit (ii) / (i) | 57.92% | 75.45% | 28.74% |
4. Inform the overall amount and the value per share of dividends distributed on the basis of profit from previous fiscal years.
In 2022, no dividends were resolved based on profit from previous years.
5. Inform, minus anticipated dividends and interest on net equity that has already been declared:
a. the gross dividend value and interest on net equity, in segregated form, by the action of each kind and class
In 2022, interest on equity in the amount of R$ 5,280 million and dividends in the amount of R$ 1,520 million were highlighted in advance, as mentioned in item 2 above. Deducting these amounts, there was no highlight of other dividends and/or interest on equity related to net income for the 2022 fiscal year.
b. the form and the deadline for payment of dividends and interest on net equity
Not applicable
c. possible incidence of update and interest on the dividends and interest on net equity
Not applicable
d. declaration date for dividend payment and interest on net equity considered for identification of shareholders who are entitled to the receipt thereof
Not applicable
|
6. In case of declaration of dividends or interest on net equity on the basis of profits recorded in half-yearly balance sheets or in shorter periods
a. informs the amount of dividends or interest on net equity that has already been declared
b. informs the date of the respective payments
Regarding the 2022 fiscal year, the Company, through its Board of Directors, approved ad referendum of the ordinary general meeting of shareholders to be held until April 30, 2023, the proposal of the Executive Board, regarding the declaration of the following earnings:
· Interest on Equity, pursuant to articles 17, item XVIII and 37, paragraph 2 of the Company's Bylaws, in the gross amount of R$ 1,700,000,000.00 (one billion and seven hundred million reais), equivalent to R$ 0.21701568653 per common share, R$ 0.23871725519 per preferred share and R$ 0.45573294172 per Unit, which after deducting the amount related to the Withholding Income Tax ("IRRF"), under the legislation in force, they import the net amount of R$ 1,445,000,000.00 (one billion four hundred and forty-five million reais), equivalent to R$ 0.18446333355 per common share, R$ 0.20290966691 per preferred share and R$ 0.38737300046 per Unit, with the exception of immune and/or exempt shareholders.
The shareholders who were registered in the Company's records at the end of February 11, 2022 were entitled to the aforementioned Interest on Equity approved at the meeting of February 1, 2022. Thus, as of February 12, 2022 (inclusive), Santander Brasil's shares began to be traded "ex-Interest on Equity". The Interest on Equity were paid on March 4, 2022.
· Interim Dividends, pursuant to Article 37, item II, of the Company's Bylaws, in the amount of R$ 700,000,000.00 (seven hundred million reais) calculated based on the balance sheet of March 31, 2022, equivalent to R$ 0.35744877 per common share, R$ 0.08945232373 per common share, R$ 0.09839755610 per preferred share and R$ 0.18784987983 per Unit.
The shareholders who were registered in the Company's records at the end of April 20, 2022 were entitled to the said Interim Dividends approved at the meeting of April 14, 2022. Thus, as of April 22, 2022 (inclusive), Santander Brasil's shares began to be traded "ex-dividends". The dividends were paid on May 16, 2022.
· Interest on Equity, pursuant to articles 17, item XVIII and 37, paragraph 2 of the Company's Bylaws, in the gross amount of R$ 1,000,000,000.00 (one billion reais), equivalent to R$ 0.12778903390 per common share, R$ 0.14056793729 per preferred share and R$ 0.26835697119 per Unit, which after deducting the amount related to Withholding Income Tax ("IRRF"), under the legislation in force, they import the net amount of R$ 850,000,000.00 (eight hundred and fifty million reais), equivalent to R$ 0.10862067882 per common share, R$ 0.11948274669 per preferred share and R$ 0.22810342551 per Unit, with the exception of immune and/or exempt shareholders.
|
The shareholders who were registered in the Company's records at the end of April 20, 2022 were entitled to the aforementioned Interest on Equity approved at the meeting of April 14, 2022. Thus, as of April 22, 2022 (inclusive), Santander Brasil's shares began to be traded "ex-Interest on Equity". The Interest on Equity were paid on May 16, 2022.
· Interest on Equity, pursuant to articles 17, item XVIII and 37, paragraph 2 of the Company's Bylaws, in the gross amount of R$ 1,700,000,000.00 (one billion and seven hundred million reais), equivalent to R$ 0.21774739699 per common share, R$ 0.23952213669 per preferred share and R$ 0.45726953368 per Unit, which after deducting the amount related to the Withholding Income Tax ("IRRF"), under the legislation in force, they import the net amount of R$ 1,445,000,000.00 (one billion, four hundred and forty-five million reais), equivalent to R$ 0.18508528744 per common share, R$ 0.20359381618 per preferred share and R$ 0.38867910362 per Unit, with the exception of immune and/or exempt shareholders.
The shareholders who were registered in the Company's records at the end of August 12, 2022 were entitled to the aforementioned Interest on Equity approved at the meeting of August 5, 2022. Thus, as of August 15, 2022 (inclusive), Santander Brasil's shares began to be traded "ex-Interest on Equity". The Interest on Equity were paid on September 6, 2022.
· Interim Dividends, pursuant to Article 37, item II, of the Company's Bylaws, in the amount of R$ 820,000,000.00 (eight hundred and twenty million reais), calculated based on the profit for the year calculated up to the balance sheet of September 30, 2022, equivalent to R$ 0.10502481038 per common share, R$ 0.11552729142 per preferred share and R$ 0.22055210180 per Unit.
The shareholders who were registered in the Company's records at the end of October 21, 2022 were entitled to the aforementioned Interim Dividends approved at the meeting of October 13, 2022. Thus, as of October 24, 2022 (inclusive), Santander Brasil's shares began to be traded "ex-dividends". The dividends were paid on November 22, 2022.
· Interest on Equity, pursuant to articles 17, item XVIII and 37, paragraph 2 of the Company's Bylaws, in the gross amount of R$ 880,000,000.00 (eight hundred and eighty million reais), equivalent to R$ 0.11270955260 per common share, R$ 0.12398050786 per preferred share and R$ 0.23669006047 per Unit, which after deducting the amount related to the Withholding Income Tax ("IRRF"), under the legislation in force, they import the net amount of R$ 748,000,000.00 (seven hundred and forty-eight million reais), equivalent to R$ 0.09580311971 per common share, R$ 0.10538343168 per preferred share and R$ 0.20118655140 per Unit, with the exception of immune and/or exempt shareholders.
|
The shareholders who were registered in the Company's records at the end of October 21, 2022 were entitled to the aforementioned Interest on Equity approved at the meeting of October 13, 2022. Thus, as of October 24, 2022 (inclusive), Santander Brasil's shares began to be traded "ex-Interest on Equity". The Interest on Equity were paid on November 22, 2022.
The table in item 2 of this Annex summarizes the above information.
7. Provide comparative table indicating the following values per share of each type and class:
a. net profit for the fiscal year and the 3 (three) previous fiscal years
| Description | 2022 | 2021 | 2020 |
| Net Income (in R$ thousand) | 12,358,521 | 14,995,509 | 14,056,148 |
| Earnings per share (in R$) | |||
| Common Stock | 0,86973 | 1,99979 | 1,87452 |
| Preferred Stock | 0,95671 | 1,99979 | 1,87452 |
| Common Shares (in thousands) | 3,818,695 | 3,818,695 | 3,818,695 |
| Preferred Shares (in thousands) | 3,679,836 | 3,679,836 | 3,679,836 |
b. dividend and interest on equity distributed in three (3) previous fiscal years
| Financial Year 2021 | Deliberation Date | Gross Amount (in R$ thousand) | Gross Value per share (in R$) | Net Value per share (in R$) | Payment Date | ||||
| ON | PN | Unit | ON | PN | Unit | ||||
| Interim Dividends | 27/04/21 | 2,800,000 | 0.35744877 | 0.39319365 | 0.75064242 | 0.35744877 | 0.39319365 | 0.75064242 | 02/06/21 |
| Interim Dividends | 26/10/21 | 3,000,000 | 0.38298083 | 0.42127891 | 0.80425974 | 0.38298083 | 0.42127891 | 0.80425974 | 03/12/21 |
| Interim Dividends | 01/02/22 | 1,300,000 | 0.16595317 | 0.18254849 | 0.34850166 | 0.16595317 | 0.18254849 | 0.34850166 | 04/03/22 |
| Interest on Equity Already Declared | 27/07/21 | 3,400,000 | 0.43404494 | 0.47744943 | 0.91149437 | 0.36893820 | 0.40583202 | 0.77477021 | 03/09/21 |
| Interest on Equity Already Declared | 28/12/21 | 249,000 | 0.03178685 | 0.03496553 | 0.06675238 | 0.02701882 | 0.02972070 | 0.05673952 | 03/02/22 |
| Total | 10,749,000 | 1.372215 | 1.509436 | 2.881651 | 1.30234 | 1.432574 | 2.734914 | ||
| Financial year 2020 | Deliberation Date | Gross Amount (in R$ thousand) | Gross Value per share (in R$) | Net Value per share (in R$) | Payment Date | ||||
| ON | PN | Unit | ON | PN | Unit | ||||
| Interest on Equity Already Declared | 27/04/20 | 890,000 | 0.11371295 | 0.12508424 | 0.23879719 | 0.09665601 | 0.10632161 | 0.20297761 | 26/06/20 |
| Interest on Equity Already Declared | 28/07/20 | 770,000 | 0.09837927 | 0.10821720 | 0.20659647 | 0.08362238 | 0.09198462 | 0.17560700 | 25/09/20 |
| Interest on Equity Already Declared | 26/10/20 | 1,000,000 | 0.12776361 | 0.14053997 | 0.26830358 | 0.10859907 | 0.11945897 | 0.22805804 | 23/12/20 |
| Interest on Equity Already Declared | 28/12/20 | 665,000 | 0.08496259 | 0.09345885 | 0.17842145 | 0.07221820 | 0.07944003 | 0.15165823 | 01/02/21 |
| Interim Dividends | 02/02/21 | 512,085 | 0.06542570 | 0.07196827 | 0.13739397 | 0.06542570 | 0.07196827 | 0.13739397 | 03/03/21 |
| Total | 3,837,085 | 0.49024412 | 0.53926853 | 1.02951265 | 0.42652136 | 0.46917349 | 0.89569485 | ||
|
| Financial year 2019 | Deliberation Date | Gross Amount (in R$ thousand) | Gross Value per share (in R$) | Net Value per share (in R$) | Payment Date | ||||
| ON | PN | Unit | ON | PN | Unit | ||||
| Interest on Equity Already Declared | 29/03/19 | 1,000,000 | 0.12758528 | 0.14034380 | 0.26792908 | 0.10844748 | 0.11929223 | 0.22773972 | 29/04/19 |
| Interest on Equity Already Declared | 28/06/19 | 1,000,000 | 0.12763993 | 0.14040392 | 0.26804384 | 0.10849394 | 0.11934333 | 0.22783727 | 31/07/19 |
| Interest on Equity Already Declared | 30/09/19 | 1,000,000 | 0.12766104 | 0.14042715 | 0.26808819 | 0.10851189 | 0.11936308 | 0.22787496 | 30/10/19 |
| Interest on Equity Already Declared | 27/12/19 | 1,010,000 | 0.12896733 | 0.14186406 | 0.27083139 | 0.10962223 | 0.12058445 | 0.23020668 | 21/02/20 |
| Interim Dividends | 27/12/19 | 6,790,000 | 0.86701797 | 0.95371977 | 1.82073774 | 0.86701797 | 0.95371977 | 1.82073774 | 21/02/20 |
| Total | 3,837,085 | 0.49024412 | 0.53926853 | 1.02951265 | 0.42652136 | 0.46917349 | 0.89569485 | ||
8. In case there is allocation of profits to legal reserve
a. identify the amount allocated for the legal reserve
Of the net income for the 2022 fiscal year, in the amount of R$ 12,358,521 thousand, the 5% portion was allocated to the constitution of the legal reserve in the amount of R$ 617,926 thousand.
b. detail the legal reserve calculation method
According to Article 193 of the Brazilian Corporation Law, there is an obligation to constitute the legal reserve to which 5% of the net income of each fiscal year must be allocated, until the total value of the reserve is equal to 20% of the share capital.
9. If the company has preferred shares entitled to fixed or minimum dividends
a. describe the calculation method for the fixed or minimum dividends
Not applicable.
b. inform whether the profit for the fiscal year is sufficient for the full payment of fixed or minimum dividends
Not applicable.
c. identify whether any unpaid installment is cumulative
Not applicable.
|
d. identify the global value of fixed or minimum dividends to be paid to each class of preferred shares
Not applicable.
e. identify the fixed or minimum dividends to be paid per preferred share of each class
Not applicable.
10. In relation to the mandatory dividend
a. describe the calculation method provided for in the Bylaws
The Company's Bylaws provide that an amount of not less than 25% of net income, minus the allocations for legal reserves and contingencies, shall be available for distribution in the form of dividends or Interest on Equity in any fiscal year.
b. inform whether it is being paid in full
In fiscal year 2022 the mandatory dividend was fully paid, as shown in the spreadsheet below:
| Description | 2022 | 2021 | 2020 |
| Net Income | 12,358,521 | 14,995,509 | 14,056,148 |
| (-) Legal Reserve | 617,926 | 749,775 | 702,807 |
| (=) Adjusted Net Income for Dividend purposes (i) | 11,740,595 | 14,245,734 | 13,353,341 |
| Minimum Mandatory Dividend (25%) | 2,935,149 | 3,561,433 | 3,338,335 |
| Interest on Equity (JCP) | 5,280,000 | 3,649,000 | 3,325,000 |
| Early Dividends | 1,520,000 | 7,100,000 | 512,085 |
| Total (JCP + Dividends) (ii) | 6,800,000 | 10,749,000 | 3,837,085 |
| Dividend Higher than Mandatory Minimum | 3,864,851 | 7,187,567 | 0 |
c. inform any amount withheld
There was no mandatory minimum dividend retention
11. In case there is mandatory dividend withholding due to the company's financial situation
a. inform the withholding amount
Not applicable.
b. describe in detail the company's financial situation, additionally addressing aspects related to liquidity analysis, working capital and positive cash flows
Not applicable.
|
c. justify the withholding of dividends
Not applicable.
12. In case there is an allocation of results for contingency reserve
a. identify the amount allocated for the reserve
There was no allocation of results for the constitution of contingency reserves in the Company.
b. identify the loss deemed probable and the cause thereof
Not applicable.
c. explain why the loss has been deemed probable
Not applicable.
d. justify the reserve constitution
Not applicable.
13. In case there is an allocation of results for unrealized profit reserve
a. inform the amount allocated for the unrealized profits reserve
There was no allocation of results for unrealized profits reserve in the Company.
b. inform the nature of unrealized profits that originated the reserve
Not applicable.
14. In case there is an allocation of results for statutory reserves
a. describe the statutory clauses that establish the reserve
The Company's Bylaws establish that, after deduction of the values intended for legal reserve and the mandatory dividends, is possible to allocate the remaining amounts from the adjusted net profit in the dividend equalization reserve, which may not exceed 50% of the Company’s share capital.
|
b. identify the amount allocated for the reserve
In the profit allocation proposal for the year 2022 the remaining balance of this profit in the amount of R$ 4,940,595 thousand, after allocations to the legal reserve account, dividends and Interest on Equity, was allocated to the reserve account for equalization of dividends.
c. describe how the amount was calculated
It is the remaining profit balance for the fiscal year 2022 , after allocations to the legal reserve account, to dividends and Interest on Equity..
15. In case profit withholding is provided for in the capital budget
a. identify the withholding amount
There was no withholding of profits in the Company, according to the capital budget.
b. provide a copy of the capital budget
Not applicable.
16. In case there is an allocation of results for tax incentives reserve
a. inform the amount allocated to the reserve
There was no allocation of results for the constitution of a reserve of tax incentives in the Company.
b. explain the nature of the allocation
Not applicable.
|
EXHIBIT IV
PROPOSAL FOR ELECTION OF THE COMPANY'S BOARD OF DIRECTORS (Itens 7.3 to 7.6 of Reference Form)
| Name | Deborah Stern Vieitas |
| Date of birth | 08/21/1957 |
| Profession | Public Administrator and Journalist |
| CPF or passport number | 013.968.828-55 |
| Elective office held | Vice-Chairman of the Board (independent) |
| Election date | 04/30/2021 |
| Date of Inauguration | 07/22/2021 |
| Term of office | 2023 OGM |
| Whether he was elected by the controller or not | Yes |
| First Term Start Date | 08/23/2017 |
| Professional Experience / Independence Criteria: | Mrs. Deborah Vieitas is Brazilian, has French nationality, and was born on August 21, 1957. She graduated in Public Administration from FGV-SP and in Journalism from the School of Communications and Arts of USP. She also holds a master’s degree in Business Administration from FGV-SP and a postgraduate degree in Public Administration from the École Nationale d’Administration. She was CEO of the American Chamber of Commerce for Brazil (Amcham Brasil), from 2015 to 2022. From 2015 to 2017, she was an independent board member of AXA Seguros SA. From 2008 to 2014, she was CEO and member of the Board of Directors of Banco Caixa Geral-Brasil. From 2000 to 2008, she was vice-president of Banco BNP Paribas Brasil, responsible for Large Corporate and Financial Institutions Coverage and for the financing portfolios. From 1998 to 2000, she was vice-president of Banco CCF Brasil in charge of Large Corporate & Corporate Coverage, Capital Markets, Trade Finance and Foreign Exchange. She is currently an independent Vice-Chairman of the Board of Directors and coordinator of the Audit Committee of Banco Santander (Brasil) S.A, in addition to being a member of the Risk and Compliance Committee. Since 2022, she holds the position of independent member of BRF's Board of Directors and is a member of the Audit and People Committees. Ms. Vieitas meets the independence criteria pursuant to paragraph 3 of Article 14 of the Company's Bylaws. |
| Description of other positions or functions | Audit Committee Coordinator |
| Audit Committee Coordinator | Election Date: 05/03/2021 |
| Inauguration Date: 06/08/2021 | |
| Term of office: 1st RCA after OGM 2023 | |
| Convictions | N/A |
|
| Name | Jose Antonio Alvarez Alvarez |
| Date of birth | 01/06/1960 |
| Profession | Executive |
| CPF or passport number | 233.771.448-97 |
| Elective office held | Director |
| Election date | 04/30/2021 |
| Date of Inauguration | 07/22/2021 |
| Term of office | 2023 OGM |
| Whether he was elected by the controller or not | Yes |
| First Term Start Date | 11/26/2009 |
| Professional Experience / Independence Criteria: | Mr. José Antonio Álvarez is Spanish and was born on January 6, 1960. He holds a Bachelor´s Degree (Hons) in Economics and Business from Santiago de Compostela University and a Master´s Degree in Business Administration from the University of Chicago. Mr. Alvarez became Chief Executive Officer of Banco Santander group in January 1st, 2015 and Executive Vice Chairman in January 15th, 2019. Prior to this, he was the bank´s Chief Financial Officer, from 2004 to 2015 and the Head of its Finance Division from 2002 - 2004. Before joining Banco Santander, he was Head of the Finance Division of BBVA (1999 - 2002) and Argentaria (1995 - 1999). Previously, he served as Chief Financial Officer for Banco Hipotecario de España, Vice President of Finanpostal Gestión Fondos de Inversión y Pensiones, and in roles at Banco de Crédito Industrial and Instituto Nacional de Industria. He has served as a member of the boards of directors of Santander Consumer Finance S.A, Santander Consumer Bank AG and Banco de Crédito Local S.A., among others, and on the supervisory boards of several of Grupo Banco Santander´s autonomous subsidiaries in Poland, Germany and the United States. He was Chairman of the European Banking Federation and Banking Supervision Committee from 2009 – 2012 and is currently a Member of the Board of Directors of Santander Brasil. |
| Description of other positions or functions | N/A |
| Convictions | N/A |
| Name | Angel Santodomingo Martell |
| Date of birth | 11/16/1965 |
| Profession | Economist |
| CPF or passport number | 237.035.738-05 |
| Elective office held | Director |
| Election date | 12/17/2021 |
| Date of Inauguration | 02/02/2022 |
| Term of office | 2023 OGM |
| Whether he was elected by the controller or not | Yes |
| First Term Start Date | 02/02/2022 |
| Professional Experience / Independence Criteria: | Mr. Santodomingo is Spanish and was born on November 16, 1965. He holds a degree in Economics and Business with specialization in Finance from ICADE University in Madrid and a CFA (Chartered Financial Analyst) from the CFA Society of the United States. As one of our Vice President Executive Officers, he holds the position of Chief Financial Officer and Investor Relations Officer since 2014. He started at the Santander Group in 2005 as Head of International Development in the Asset Management unit after which he became Global Responsible for the Group Investor Relations area. Prior to this he was the head of Grupo Fortis in Spain and an officer and board member at Banesto Bolsa. He also worked at Usera y Morenés S.V.B. - Sociedade de Valores y Bolsa and Arthur Andersen (Deloitte). From 1996 to 2008, he acted as founding member of the nonprofit organization CFA Society in Spain occupying as well different positions including President; and from 2009 to 2014 he was Vice President of AERI’s (Asociación Española de Relaciones con Inversores) Board of Directors. He was also Chairman of the Board of Directors of Webmotors S.A. from 2018 to 2021 and CEO of Santander Leasing S.A. Arrendamento Mercantil e Santander Corretora de Seguros, Investimentos e Serviços S.A. from 2018 to 2022. He was the CFO and Investor Relation Officer of Banco Santander (Brasil) S.A. since 2014. Currently he has been appointed as Head of Strategy at Santander Group and Chief of Staff of the Executive Chair of Santander Group. |
| Description of other positions or functions | N/A |
| Convictions | N/A |
|
| Name | Deborah Patricia Wright |
| Date of birth | 09/04/1957 |
| Profession | Business Administrator |
| CPF or passport number | 031.544.298-08 |
| Elective office held | Director (independent) |
| Election date | 04/30/2021 |
| Date of Inauguration | 07/22/2021 |
| Term of office | 2023 OGM |
| Whether he was elected by the controller or not | Yes |
| First Term Start Date | 02/20/2017 |
| Professional Experience / Independence Criteria: | Mrs. Deborah Wright is Brazilian and was born on September 4, 1957. She holds a Business Administration degree from the São Paulo School of Business Administration (EAESP-FGV). Mrs. Wright started her career in 1980 at Kibon’s Marketing Department, where she remained until 1989. In 1989, she joined Unilever as Marketing Manager and worked in the food division. In 1991, she returned to Kibon as Marketing Director, and becoming Commercial Vice President in 1994. In 1995 she became the General Manager of Kraft Suchard Foods. In 1997, she reached the position of General Manager of Kibon. At ICI/Paints, she was the General Manager for Tintas Coral Brasil from 1997 to 1999, and subsequently the Regional Manager for ICI. She was also General Officer at Parmalat Brasil in 1999, and Chief Executive Officer of Pão de Açúcar’s Group Internet Division from 2000 to 2001. From 2002 to 2007, she was Corporate Vice President/Commercial Vice President in the area of Sales and Corporate Marketing of the Abril Group. From 2009 to 2010, she was Chief Executive Officer/Country Manager of Ipsos Brasil, a market research firm. She has been acting as a Board Member since 2001. From 2001 to 2005 she served on the Board of the São Paulo American Graded School. From 2005 to 2006 she was a Board Member of CONAR (Brazilian National self-regulatory Board of Advertising). From 2008 to 2009 she was a member of the Board of Directors of the Samaritano Hospital in São Paulo. From 2008 to 2014 she was Board Member for Lojas Renner, a Brazilian publically traded company, specializing in Apparel retail, as well as Chairwoman of their Sustainability Committee from 2012 to 2014. From 2013 to 2016, she was member of the Advisory Board for Eurofarma, 4th largest Brazilian pharmaceutical company, still privately owned and not listed on stock exchange. Currently she is associated with the following entities: Brazilian subsidiary of WCD Group (Women Corporate Directors), of which she co-founded in 2010; Strategy Commission at IBGC (Brazilian Institute of Corporate Governance), where she leads a work and study group of DEI (Diversity , Equity and Inclusion); she is part of AmCham’s (American Chamber of Commerce) Strategic Forum of Corporate Governance; and she is an ambassador of the 30% Club and WOB (Women on Boards) and has been involved in advocacy for gender diversity for over a decade. Besides that, she is an independent member of the Board of Directors, a member of the nominations and governance committee and a chairwoman of the Compensation Committee of Banco Santander (Brasil) S.A.. Ms. Wright meets the independence criteria pursuant to paragraph 3 of Article 14 of the Company's Bylaws. |
| Description of other positions or functions | Member of the nomination and governance committee and Coordinator of the compensation committee |
| Member of the nomination and governance committee | Election Date: 05/03/2021 |
| Inauguration date: 05/03/2021 | |
| Term of office: 1st RCA after OGM 2023 | |
| Coordinator of the compensation committee | Election Date: 05/03/2021 |
| Inauguration date: 05/03/2021 | |
| Term of office: 1st RCA after OGM 2023 | |
| Convictions | N/A |
|
| Name | Ede Ilson Viani |
| Date of birth | 09/05/1967 |
| Profession | Accountant |
| CPF or passport number | 064.923.468-58 |
| Elective office held | N/A |
| Election date | N/A |
| Date of Inauguration | N/A |
| Term of office | N/A |
| First Term Start Date | N/A |
| Professional Experience / Independence Criteria: | Mr. Viani is Brazilian and was born on September 5, 1967. He holds a degree in accounting sciences and an MBA in Finance from the Instituto de Ensino e Pesquisa – Insper. He was an auditor at Banco Itaú S.A. from 1986 to 1990. he worked at BankBoston S.A. for 16 years as Senior Auditor, Superintendent of Credit Risks, Executive Superintendent of Lending Products and Executive Superintendent of Small and Medium Enterprises. He started at Santander Brasil in 2007 as Director responsible for Small and Medium Enterprises and from July 2010 to 2014 he was Retail Risk Director. From 2014 he was Director responsible for Companies, Governments & Institutions and Agribusiness and subsequently Director responsible for the branch network until December 2019 when he assumed the position of Executive Vice President, responsible for Technology & Operations. |
| Description of other positions or functions | Executive Vice President |
| Executive Vice President | Election Date: 05/03/2021 |
| Inauguration Date: 06/08/2021 | |
| Term of office: 1st RCA after OGM 2023 | |
| Convictions | N/A |
|
| Name | Jose de Paiva Ferreira |
| Date of birth | 01/03/1959 |
| Profession | Administrator |
| CPF or passport number | 007.805.468-06 |
| Elective office held | Director |
| Election date | 30/04/2021 |
| Date of Inauguration | 22/07/2021 |
| Term of office | 2023 OGM |
| Whether he was elected by the controller or not | Yes |
| First Term Start Date | 27/03/2008 |
| Professional Experience / Independence Criteria: | Mr. José Paiva is Portuguese and was born on March 1, 1959. He has a specialization in Business Administration from Fundação Getúlio Vargas, and an MBA from The Wharton School of Business, at the University of Pennsylvania. He has worked in financial markets for over 40 years. Mr. Paiva started his career at Banco Bradesco in 1973 and held several positions. Then, he joined Banco Geral do Comércio, Noroeste and Santander Brasil, where he was executive vice president, responsible for the Business, Human Resources, Operations, Technology, Heritage, Products, Marketing, Credit Cards, Insurance, Leasing and Branch Network. From 2000 to 2001, he held the position of e-business director for Latin America, for the America Division of Santander Central Hispano. At the end of 2001, he returned to Brazil to work at Banco Banespa, as executive vice president responsible for Human Resources, Technology, Operations and Patrimony. In 2003, he became the executive vice president responsible for the Marketing, Products and Retail sectors at Santander Brasil. In 2008, he became the CEO of Santander Brasil, a position he held until the merger with Banco Real, when he became senior executive vice president responsible for the Retail Sector. In March 2011, Mr. Paiva became a member of the Board of Directors of Santander Brasil, and joined the MMitsubishi Corp Group with headquarters in Los Angeles, California, USA as Senior Executive Vice President. From July 2013 to December 2019, he returned to Santander Brasil and served as senior executive vice president responsible for Human Resources, Organization, Equity, Processes, Operations, Technology and Costs. Additionally, he performed the following functions: Executive Director of Febraban (2014 to 2019), Chairman of the Febraban Self-Regulation Board (2016 to 2019), Chairman of the Board of Directors of CIP- Interbank Payment Chamber (2015 to 2018), President of Tecban Council - Banking Technology (2014 to 2015), Advisor of the Cancer Institute - SP (2009 to 2010) and Mentor of the Inova Unicamp Program (2011 to 2013). Currently, Mr. Paiva is a member of the Board of Directors and a member of the Risk and Compliance Committee of Banco Santander (Brasil) S.A. |
| Description of other positions or functions | Member of the Risk and Compliance Committees |
Member of the Risk and Compliance Committee
| Election Date: 03/05/2021 |
| Inauguration date: 03/05/2021 | |
| Term of office: 1st RCA after OGM 2023 | |
| Convictions | N/A |
|
| Name | Jose García Cantera |
| Date of birth | 05/26/1966 |
| Profession | Executive |
| CPF or passport number | PAL741935 |
| Elective office held | Director |
| Election date | 04/30/2021 |
| Date of Inauguration | 07/22/2021 |
| Term of office | 2023 OGM |
| Whether he was elected by the controller or not | Yes |
| First Term Start Date | 07/22/2021 |
| Professional Experience / Independence Criteria: | Mr. Cantera is Spanish and was born on May 26, 1966. He holds a degree in industrial engineering and an MBA from the IE Business School. Mr. Cantera is Senior Executive Vice President of Grupo Santander in Spain. He became Chief Financial Officer and Head of the Financial Management Division in January 2015. Prior to his current role, Mr. Cantera was Head of the Global Wholesale Banking Division, reporting directly to the Group's CEO. In 2006 Mr. Cantera became CEO of Banesto, having joined in September 2003 as Senior Executive Vice President of Wholesale Banking, comprising Corporate Banking, Treasury, Capital Markets, Banesto Bolsa and the bank's international operations. Prior to joining Banesto, Mr. Cantera was a senior executive at Salomon Brothers-Citigroup. He was a member of the Executive Committee of Citigroup EMEA and of the Board of Directors of Citigroup Capital Markets UK and Citigroup EMEA. During his time as an investment analyst in Latin America he was considered the best analyst by several publications including Institutional Investor, Reuters, Extel and Global Investor between 1995 and 2002. |
| Description of other positions or functions | N/A |
| Convictions | N/A |
| Name | Marília Artimonte Rocca |
| Date of birth | 01/31/1973 |
| Profession | Business Administrator |
| CPF or passport number | 252.935.048-51 |
| Elective office held | Director (independent) |
| Election date | 04/30/2021 |
| Date of Inauguration | 07/22/2021 |
| Term of office | 2023 OGM |
| Whether he was elected by the controller or not | Yes |
| First Term Start Date | 12/21/2012 |
| Professional Experience / Independence Criteria: | Mrs. Marilia Rocca earned a BA in Business Administration from EAESP/Fundação Getúlio Vargas and an MBA in Management from Columbia University, attending on the Fundação Estudar Scholarship. She is a 2006 Henry Crown Fellow of The Aspen Institute and a member of the Aspen Global Leadership Network. She was CEO of Hinode Group from November 2018 to October 2022, the largest Marketing Multilevel consumer goods company in Brazil, with operations also in Latin America. Previously, she was Ticket’s Managing Director in Brazil, a food voucher Edenred Group company. Formerly, she served as vice president at TOTVS, the 6th largest software company worldwide based in São Paulo. From 2008 till 2012, Marilia was a managing partner at Mãe Terra, a natural and organic foods B-Corp sold to Unilever in 2017. Prior to that she co-founded and managed Endeavor Brazil, the most successful NGO supporting innovative entrepreneurship in the country. In 2000, she also co-founded Fundação Brava, a family foundation focused on transferring management tools to the public sector and Brazilian NGOs to boost their effectiveness. From 1995-98, Marilia worked for Walmart as one of the organization's first female directors in Brazil. For 20 years Marilia has served as a board member at privately and public held companies in the Education, IT, Services and Consumer Goods industries. Also, Marilia is an independent Board member and coordinator of the Sustainability Committee of Banco Santander (Brasil) S.A Ms. Rocca meets the independence criteria according to paragraph 3 of Article 14 of the Company's Bylaws. |
| Description of other positions or functions | Coordinator of the Sustainability Committee |
Coordinator of the Nomination and Governance Committee
| Election Date: 05/03/2021 |
| Inauguration date: 05/03//2021 | |
| Term of office: 1st RCA after OGM 2023 | |
| Convictions | N/A |
|
| Name | Mario Roberto Opice Leão |
| Date of birth | 07/21/1975 |
| Profession | Engineer |
| CPF or passport number | 248.745.618-37 |
| Elective office held | Director |
| Election date | 12/17/2021 |
| Date of Inauguration | 02/02/2022 |
| Term of office | 2023 OGM |
| Whether he was elected by the controller or not | Yes |
| First Term Start Date | 02/02/2022 |
| Professional Experience / Independence Criteria: | Mr. Mario Leão is Brazilian and was born on July 21, 1975. He holds a degree in Production Engineering from the Escola Politecnica of the Universidade de São Paulo. He joined Santander Brasil in October 2015 as an Executive Director in Corporate and Investment Banking. In July 2017 he became Executive Vice-President of Corporate and SMEs and a member of the executive committee. Since January 2022 he has been the Chief Executive Officer of Santander Brasil. Before joining Santander Brasil, he was a Managing Director in Capital Markets at Morgan Stanley in Brazil from 2008 to 2015, worked for Goldman Sachs from 2006 to 2008 and for Citibank Brasil from 1996 to 2006. |
| Description of other positions or functions | Chief Executive Officer |
Chief Executive Officer
| Election Date: 12/17/2021 |
| Inauguration date: 01/01/2022 | |
| Term of office: 1st RCA after OGM 2023 | |
| Convictions | N/A |
|
| Name | Pedro Augusto de Melo |
| Date of birth | 11/04/1961 |
| Profession | Accountant |
| CPF or passport number | 011.512.108-03 |
| Elective office held | Director (independent) |
| Election date | 04/30/2021 |
| Date of Inauguration | 07/22/2021 |
| Term of office | 2023 OGM |
| Whether he was elected by the controller or not | Yes |
| First Term Start Date | 07/17/2020 |
| Professional Experience / Independence Criteria: | Mr. Pedro Augusto de Melo is Brazilian and was born on November 4, 1961. He has a degree in accounting sciences and a postgraduate degree in accounting and financial administration from the São Judas Tadeu University of Accounting Sciences (São Paulo). Since March 2, 2020 he occupies the position of CEO of the Brazilian Institute of Corporate Governance (IBGC). He is also member of the Governance Committee of Amcham Brasil and executive of the Union of Accounting Companies - SESCON. He developed his career in Deloitte and KPMG audit areas. From 2008 to 2017, he was CEO of KPMG Brazil, accumulating, in 2015, the position of CEO for KPMG South America. On October 1, 2017, he assumed the roles of COO for South America and Leader of Customers and Markets for South America until he retired from the firm in early 2020. He also actively participated in other levels of Governance at KPMG International, KPMG Americas and KPMG South America. He was Chairman of the Board of Directors of IBRACON - Brazilian Institute of Independent Auditors between 2009 and 2010. Currently, he is is an independent member of board of directors and the coordinator of Risk and Compliance Committee of the Banco Santander (Brasil) S.A. Mr. de Melo meets the independence criteria according to paragraph 3 of Article 14 of the Company's Bylaws. |
| Description of other positions or functions | Coordinator of the Risk and Compliance Committee |
| Coordinator of the Risk and Compliance Committee | Election Date: 05/03/2021 |
| Inauguration date: 05/03/2021 | |
| Term of office: 1st RCA after OGM 2023 | |
| Convictions | N/A |
7.5 Family relations
There is no marital relationship, stable union or kinship up to the second degree between administrators of the issuer; between the issuer's administrators and the issuer's direct or indirect subsidiaries; between managers of the issuer or its direct or indirect subsidiaries and direct or indirect controllers of the issuer; and managers of the issuer and managers of the issuer's direct or indirect controlled companies.
|
7.6 Relations of subordination, provision of service or control:
As for the subordination item, Santander Brasil has 3 (three) members of the Board of Directors who also hold positions in the Santander Spain Group, they are: Angel Santodomingo Martell, José Antonio Alvarez Alvarez and José García Cantera.
|
Exhibit V
ITEM 8 of the Reference Form
(Pursuant to item II of the article 13 of the CVM Resolution 81/22)
8.1. Describe the remuneration policy or practice of the Board of Directors, the Statutory and Non-Statutory Executive Board, the Fiscal Council, the Statutory Committees and the Audit, Risk, Financial and Remuneration Committees.
| A. | Board of Directors |
All members of our Board of Directors are entitled to a fixed compensation consisting of monthly fees and benefits. In exceptional and fully justified cases, the Chairman of the Board of Directors may also receive an annual variable remuneration for his/her duties performed, upon deliberation of the Remuneration Committee and the Board of Directors, and always within the global limit of the annual remuneration approved at the general meeting ordinary.
It is important to point out that, in the event that a member of the Board of Directors is also a member of our Audit Committee, pursuant to the applicable regulations and the Internal Regulations of the Audit Committee, such member must opt for the remuneration of one of the bodies. With regard to the other Advisory Committees, if one of the members or the Chairman of the Board of Directors becomes part of them, he will be entitled to the remuneration attributed as a member or Chairman of the Board.
| B. | Board of Officers |
The members of our Executive Board are entitled to: fixed compensation consisting of monthly payments, benefits, social security and variable compensation, always within the global limit of the annual compensation approved at the annual general meeting.
The variable remuneration will be paid considering the different deferral percentages, depending on the level of the variable remuneration received in the year (including the value of the Long-Term Incentive - ILP in the grant year, valued at the grant price), and observing the recovery clauses/ Malus and/or Clawback refund with the possibility of reduction and/or return of up to 100% of the value of the variable remuneration in the premises.
| C. | Audit Committee |
Our Audit Committee is composed of at least three and a maximum of six members appointed by the Board of Directors, among persons, members or not of the Board of Directors, who meet the legal and regulatory conditions required for the exercise of the position.
|
D. Compensation, Nomination and Governance, Sustainability, and Risks and Compliance Committees - Advisory Committees.
The Board of Directors approves the fixed monthly compensation of the members of the Advisory Committees, and only those members who do not occupy the executive board will be able to pay this compensation.
The members of the Advisory Committee are not entitled to any other type of compensation or benefit.
a. Goals of the compensation policy or practice, informing if the compensation policy has been formally approved, body responsible for its approval, date of approval and, if the issuer discloses the policy, locations in the worldwide computer network where the document can be consulted.
The Company has a Compensation Policy approved by the Board of Directors meeting held on May 26, 2022.
The Compensation Policy of the Board of Directors seeks to ensure the following premises:
| · | Ensure the alignment of the interests of the shareholders and the public with which the Company relates, and |
| · | Promote the good performance of the Company and ensure the interests of shareholders through a long-term commitment. |
The objective of the Executive Board's compensation policy/practice is to support the organization's strategy, aiming to:
| · | Promote our good recurring performance, ensure the interests of our shareholders, create long-term value and be compatible with adequate, rigorous risk management and long-term strategy, values and interests, as well as maintain a solid capital base; |
| · | Recognize meritocracy, differentiating the individual contributions of the areas and the Company in the fulfillment of the objectives and in the execution of the business strategies, proposed by the Executive Board and approved by the Board of Directors, regardless of ethnicity, race, sex or any matter of a personal nature; and |
| · | Maintain the competitiveness of the remuneration paid by us in a way that facilitates the attraction and retention of managers. |
|
The remuneration of the Audit Committee must be adequate to attract qualified, experienced professionals and recognize for the performance of their duties established in the bylaws.
b. Practices and procedures adopted by the board of directors to define the individual remuneration of the board of directors and the executive board, indicating:
i. the organs and committees of the issuer that participate in the decision-making process, identifying how they participate
It is up to the General Meeting to determine the annual global remuneration for distribution among our managers. Subsequently, it will be up to the Board of Directors, with the assistance of our Compensation Committee, to distribute the money, individually, to each member of the Board itself and of the Executive Board, which will include the attribution of all benefits.
ii. criteria and methodology used for the setting of individual remuneration, indicating whether studies are used to verify market practices, and, if so, the comparison criteria and the scope of these studies
The criteria and methodology used to fix the individual remuneration are aligned with the practices adopted by the market, measured periodically through salary surveys made by specialized consultancies, the performance history and seniority of the occupants.
In addition, it is the function of our Compensation Committee:
| (i) | analyze the remuneration policy of managers in relation to market practices, with a view to identifying significant discrepancies in relation to similar companies; and |
| (ii) | ensure that the management remuneration policy is permanently compatible with the risk management policy, the company's strategy and the maintenance of a solid capital base. |
iii. how often and how the board of directors assesses the appropriateness of the issuer's remuneration policy
Our Compensation Committee is responsible for annually reviewing the Compensation Policy, recommending to the Board of Directors its correction or improvement, when necessary.
|
| c. | Composition of remuneration, indicating: |
| · | Description of the elements of remuneration and the objectives of each of them |
| · | Fixed Remuneration: The fixed remuneration is composed of monthly fees, based on market research data prepared by a specialized external consultancy, whose maximum overall value is approved annually at the ordinary general meeting. The fixed remuneration aims to attract and retain professionals with the necessary skills and experience for the function. |
| · | Benefits: The benefits offered are aligned with the size of the position held and market practices, comprising Medical Assistance, Dental Care and Life Insurance. For the Chairman of the Board, in addition to these benefits, vehicles and drivers are also available, among others. For the Chief Executive Officer, in addition to these benefits, a car is also available for locomotion. Since March 2018, the car benefit or specific budget for locomotion has been terminated for the other executives, in alignment with market practices. For expatriate Board members, we can offer expatriation benefits such as rent payment, children's schools, housing expenses, among others. The benefits are aimed at attracting and retaining professionals with the necessary skills and experience for the position. |
| · | Private Pension: To date, members of the Board of Directors who do not exercise executive functions in the Company are not eligible for private pension. The same applies to members of the Audit Committee (they are not eligible for this benefit). For the members of the Executive Board, the pension plan is made available in order to attract and retain professionals with the necessary skills and experience for the position. Currently the biggest plan is SantanderPrevi, a plan that since July 2018 has been closed to new members. As of January 2018, the SBPrev Pension Plan was implemented for new employees/administrators and new memberships. As of March 2018, the SantanderPlus Pension Plan was implemented, which, like the SantanderPrevi and SBPrev plans, provides future complementary income. This plan is restricted to the group of executives who are part of the "SantanderPlus" Collective. Participation is optional and the contribution is annual, limited to 12 salaries, with a counterpart of 100% to 125% made by Santander Brasil, according to the time in the plan. |
| · | Annual Variable Remuneration: The annual variable remuneration is composed of the Own Management Program (PPG) and the Long-Term Incentive Plans (ILP). Currently, only members of the Executive Board are eligible for the Own Management Program (PPG) and the Long-Term Incentive Plans (ILP). When granted, the calculation of the Own Management Program (PPG) should consider the individual performance, performance of the business units and performance of the institution as a whole, as well as the form of payment and the different percentages of deferral, according to the level of variable compensation received in the year, and observe the Malus and/or Clawback clause with the possibility of reduction and/or return of up to 100% of the value of the variable remuneration in the foreseen hypotheses. |
|
(i.1) Own Management Program (PPG)
The objective of the Annual Variable Compensation (PPG) program is to mobilize and recognize, through meritocracy, the performances in the organization. This program, to which the members of the Executive Board are eligible, takes into account individual performance, measured through the institutional performance evaluation tool (Direction by Objectives – DPO) and includes quantitative and qualitative indicators, the performance of the business unit, measured through the DPO of the area, and reflects the objectives of the area in the exercise and in the performance of the institution as a whole.
As of 2016, variable remuneration has been calculated according to the following model:

For the 2022 fiscal year, the Qualitative Metrics evaluated were as follows:
| Category | Description |
| Clients (30%) | Risk conduct performance |
| Focus on Customer Service and Digital Experience | |
| Revenue / Profitability (ESG) (70%) | Capital Generation |
| Risk Appetite and Risk Strategy | |
| Financial results | |
| Net operating revenue and Net revenue | |
| Diversity, Financial Inclusion, Sustainable Finance, Governance |
 The Board of Directors, on the recommendation of the Compensation Committee, will carry out a qualitative assessment of each quantitative metric, considering the way in which each objective was achieved and other relevant and context aspects that are not directly reflected in each indicator. This assessment can increase or decrease the result of each metric by up to 25%.
|
In the specific case of the members of the Executive Committee, the variable remuneration may also be affected by the result of the Santander Mundial Group.
The annual variable remuneration for statutory directors is paid as follows:
| Immediately | 30% | In Cash |
| 30% | In SANB11 with 1 year lock up period | |
| Differed | 20% | In Cash in 3 yearly equal installments |
| 20% | In SANB11 in 3 yearly equal installments |
The percentage of deferral will also depend on the level of variable compensation received in the year, with the minimum criterion being the one presented above. In the case of the Chief Executive Officer, the deferral in this program is at least 50%, being at least 25% each of the items mentioned above.
Since 2015, for cases of variable compensation higher than a certain amount established in the policy, the payment of deferred installments has increased from three to five annual and equal installments, maintaining the lockup conditions.
Between the years 2016 and 2021, the deferral plan of the Executive Committee and other executives chosen by the Executive Committee, had the payment of the last installment (in the case of deferral in 3 years) or the last three installments (in the case of deferral in 5 years), subject to the achievement of result indicators of the Santander Mundial Group, with a weight of 30%.
As of the 2022 fiscal year, only the deferral of the Chief Executive Officer maintains the impact in the last three installments (deferral in 5 years), subject to the achievement of the Santander Mundial Group's result indicators, with a weight of 30%.
The Plan is also subject to a Malus and/or Clawback clause, that is, our Board of Directors, on the recommendation of the Compensation Committee (CR), may approve the reduction and/or the return of up to 100% of the value of each participant in cases previously approved by our Compensation Committee.
(i.2) Long-Term Incentive Plans (ILP)
The goal of the ILP is to align the interests of the organization and the interests of the participants, stimulating the retention of professionals in the long term.
|
Our long-term programs are divided into Local and Global plans, with specific performance indicators and condition of maintenance of the participant's employment relationship until the date of payment to be entitled to receipt.
The calculation of the payment of the plans is carried out based on the percentage of achievement of the indicators applied on the reference value (target), being the Local plans paid in SANB11 units and the Global plans in actions and options of the Santander Group (SAN).
Each participant has a reference value defined in cash, converted into SANB11 units or into shares and options of Grupo Santander (SAN), usually by the price of the last 15 trading sessions of the month immediately preceding the granting of each plan. At the end of the vesting period, the resulting shares are delivered with a restriction of 1 year, and this payment is still subject to the application of the Malus/Clawback clauses, which may reduce or cancel the shares to be delivered in cases of non-compliance with internal rules and exposure to excessive risks.
(i.2.b) Local Plans
Retention Plans
In specific and punctual situations, both managers and employees may have a retention plan linked to the area or individual with the objective of retaining it and ensuring the sustainability of the business and the Bank. Each plan has a specific contract and provides payment according to the performance and permanence of the individual, observing local and global normative resolutions.
(i.2.b) Global Plans
CRDIV ILP Plan
In 2016, an action delivery plan called the CRDIV Global Long-Term Incentive – 2015 Grant was launched. This plan was subject to the achievement of Santander Grupo Mundial's indicators including Santander Group's Total Return to Shareholder, Return on Tangible Assets (ROTE), Customer Satisfaction, Employee Satisfaction and Linking of Companies Clients.
The Global Long-Term Incentive Program 2015 provided for the delivery of the actions resulting from the achievement of the program in 2019, with an additional restriction of sale of one year after delivery to the group of participants called " Identified Collective" and without restriction to the other participants of the so-called "Extended Group".
|
The Plan was terminated in December 2018 with a final achievement of 66.88% and the payment corresponding to the SAN shares was made in cash in March 2019 to the participants of the "Extended Group" (without lockup) and in March 2020 to the participants of the "Identified Collective" (after a 1-year lockup).
ILP Global Plan – Digital Transformation Award 2019, 2020 and 2021
We currently have 3 global plans in place launched in 2019, 2020 and 2021. Eligible executives had an incentive target based on target quantity of shares and stock options of Grupo Santander (SAN). The payment according to compliance with the performance indicators will be calculated on the target amounts of shares and options after a three-year deferral period, the equivalent settlement being made in cash.
1. In relation to the last 3 fiscal years, what is the proportion of each element in the total remuneration
The estimated proportion of each element in the total remuneration is as follows:
| Board of Directors | 2020 | 2021 | 2022 |
| Fixed Remuneration | 98,33% | 93,01% | 99,32% |
| Benefits | 1,67% | 6,99% | 0,68% |
| Executive Board | 2020 | 2021 | 2022 |
| Fixed Remuneration | 26,23% | 22,35% | 24,79% |
| Benefits | 2,44% | 2,08% | 1,56% |
| Security | 14,96% | 16,58% | 15,74% |
| Variable Remuneration | 28,19% | 29,50% | 27,85% |
| Stock-based compensation | 28,18% | 29,50% | 30,05% |
| Audit Committee | 2020 | 2021 | 2022 |
| Fixed Remuneration | 99,90% | 99,95% | 100,00% |
| Benefits | 0,10% | 0,05% | 0,00% |
| Fiscal Council | 2020 | 2021 | 2022 |
| Fixed Remuneration | 100,00% | 100,00% | 100,00% |
| Benefits | 0,00% | 0,00% | 0,00% |
* As provided for in the Company's Bylaws, the Fiscal Council is a non-permanent operating body. Its installation took place at the Company's Annual General Meeting held on April 26, 2019, April 30, 2020 and April 30, 2021.
|
b. Methodology for calculating and adjusting each of the elements of remuneration
| · | Fixed Remuneration: There is no automatic methodology for readjustment. Market surveys are conducted annually to assess the competitiveness of the compensation of Directors/Officers and members of the Audit Committee. If any material difference is identified in relation to the market, the Compensation Committee evaluates the need to propose adjustments to the Board of Directors. |
| · | Variable Remuneration: There is no automatic methodology for readjustment. Market surveys are conducted annually to evaluate the competitiveness of the compensation of the Board of Directors/Executive Officers. If any material difference is identified in relation to the market, the Compensation Committee evaluates the need to propose adjustments to the Board of Directors. It does not apply to the members of the Audit Committee. |
| · | Benefits: There is no automatic methodology for readjustment. Market research is conducted annually to assess the competitiveness of compensation, including benefits, of Directors, Officers and members of the Audit Committee. If any material difference is identified in relation to the market, the Compensation Committee evaluates the need to propose adjustments to the Board of Directors. |
| · | Social Security: Does not apply to Directors and members of the Audit Committee. For Directors, as defined in the plan regulations. See item 8.14 of the Reference Form. |
| · | Stock-based compensation: Does not apply to Directors and members of the Audit Committee. For the Directors, as defined in the regulations of each plan. See item 8.4 of the Reference Form. |
(ii). Reasons justifying the composition of remuneration
The proposed remuneration considers the experience of the members of the Board of Directors, the Executive Board and the Audit Committee, the need to retain talent in a competitive market and the promotion of the good performance of the organization and the alignment with the strategy of the shareholders, and with respect to the members of the Executive Board, through a long-term commitment.
|
(iii.) The existence of members not paid by the issuer and the reason for this fact
There are two unpaid members on the Board of Directors, representatives of Santander Spain. They receive remuneration at the Parent Company for their executive functions there.
There are no unpaid members on the Executive Board.
There are no unpaid members on the Audit Committee.
d. Existence of remuneration borne by subsidiaries, subsidiaries or direct or indirect controllers
The Compensation of the members of the Board of Directors and the members of the Audit Committee is not supported by subsidiaries, subsidiaries or our direct or indirect controllers. However, the members of the Board of Directors who also exercise executive functions of Santander Spain, our indirect controller, or in other companies controlled by Santander Spain are remunerated, as a result of such functions, directly by said companies, in accordance with the activities carried out by them.
The remuneration of the members of the Executive Board is not supported by subsidiaries, subsidiaries or our direct or indirect controllers. However, the results of subsidiaries and affiliates influence our consolidated results, and consequently, the variable remuneration of the members of the Executive Board.
e. Existence of any remuneration or benefit linked to the occurrence of a certain corporate event, such as the sale of the issuer's corporate control
There is no remuneration or benefit linked to the occurrence of a corporate event.
|
8.2 - Total remuneration of the board of directors, statutory executive board and fiscal council
| Total remuneration expected for the current fiscal year 2023 - Annual values | |||||
| Board of Directors | Executive Board | Audit Committee | Fiscal Council | Total | |
| Total number of members | 9 | 55 | 4 | 5 | 73 |
| Number of Remunerated Members | 6 | 55 | 4 | 2 | 67 |
| Annual fixed remuneration | |||||
| Salary or pro-labor | 17,000,000.00 | 115,000,000.00 | 3,700,000.00 | 550,000.00 | 136,250,000.00 |
| Direct and indirect benefits | 600,000.00 | 7,400,000.00 | 300,000.00 | - | 8,300,000.00 |
| Participation in committees | |||||
| Other | 62,000,000.00 | 62,000,000.00 | |||
| Other INSS | 3,825,000.00 | 35,075,000.00 | 832,500.00 | 123,750.00 | 39,856,250.00 |
| Variable remuneration | |||||
| Bonus | |||||
| Participation of results | 149,000,000.00 | 149,000,000.00 | |||
| Meeting attendance | |||||
| Commissions | |||||
| Other INSS | |||||
| Other | |||||
| Post-employment | |||||
| Termination of office | |||||
| Stock-based | - | 149,000,000.00 | 149,000,000.00 | ||
| Total remuneration | 21,425,000.00 | 517,475,000.00 | 4,832,500.00 | 673,750.00 | 544,406,250.00 |
| Total remuneration for the Fiscal Year at 12/31/2022 - Annual values | |||||
| Board of Directors | Executive Board | Audit Committee | Fiscal Council | Total | |
| Total number of members | 10.0 | 50.0 | 4.0 | 6.0 | 70.0 |
| Number of Paid Members | 5.0 | 50.3 | 4.0 | 3.0 | 62.3 |
| Annual fixed remuneration | - | ||||
| Salary or pro-labor | 14,220,986.19 | 75,736,959.17 | 3,260,000.00 | 431,460.00 | 93,649,405.36 |
| Direct and indirect benefits | 242,937.34 | 4,781,405.75 | 5,024,343.09 | ||
| Participation in committees | - | ||||
| Other | 48,089,033.90 | 48,089,033.90 | |||
| Other INSS | 3,448,537.64 | 25,839,071.90 | 733,500.00 | 97,078.50 | 30,118,188.04 |
| Variable remuneration | - | ||||
| Bonus | |||||
| Participation of results | - | 85,106,050.00 | 85,106,050.00 | ||
| Meeting attendance | |||||
| Commissions | |||||
| Other INSS | |||||
| Other | |||||
| Post-employment | |||||
| Termination of office | |||||
| Stock-based | 1,399,166.67 | 91,821,350.00 | 93,220,516.67 | ||
| Total remuneration | 19,311,627.83 | 331,373,870.72 | 3,993,500.00 | 528,538.50 | 355,207,537.06 |
|
| Total remuneration for the Fiscal Year as of 12/31/2021 - Annual values | |||||
| Board of Directors | Executive Board | Audit Committee | Fiscal Council | Total | |
| Total number of members | 12.0 | 50.0 | 5.0 | 6.0 | 73.0 |
| Number of Paid Members | 5.6 | 45.2 | 3.6 | 3.0 | 57.3 |
| Annual fixed remuneration | |||||
| Salary or pro-labor | 5,526,500.00 | 76,828,861.70 | 3,192,333.33 | 449,703.00 | 85,997,398.03 |
| Direct and indirect benefits | 415,072.93 | 7,142,244.16 | 1,459.20 | 7,558,776.29 | |
| Participation in committees | |||||
| Other | 57,007,756.70 | 57,007,756.70 | |||
| Other INSS | 1,243,462.50 | 25,707,773.31 | 718,275.00 | 101,183.18 | 27,770,693.98 |
| Variable remuneration | |||||
| Bonus | |||||
| Participation of results | 101,401,104.23 | 101,401,104.23 | |||
| Meeting attendance | |||||
| Commissions | |||||
| Other INSS | |||||
| Other | |||||
| Post-employment | |||||
| Termination of office | |||||
| Stock-based | 101,401,104.23 | - | 101,401,104.23 | ||
| Total remuneration | 7,185,035.43 | 369,488,844.32 | 3,912,067.53 | 550,886.18 | 381,136,833.46 |
| Total remuneration for the Fiscal Year at 12/31/2020 - Annual values | |||||
| Board of Directors | Executive Board | Audit Committee | Fiscal Council | Total | |
| Total number of members | 9 | 45 | 4 | 6 | 64 |
| Number of Paid Members | 5.25 | 39 | 3.58 | 3 | 50.83 |
| Annual fixed remuneration | - | ||||
| Salary or pro-labor | 5,259,500.00 | 66,454,658.86 | 2,915,000.00 | 418,800.00 | 75,047,958.86 |
| Direct and indirect benefits | 89,360.64 | 6,169,101.15 | 2,918.40 | - | 6,261,380.19 |
| Participation in committees | - | ||||
| Other | 37,907,905.95 | 37,907,905.95 | |||
| Other INSS | 1,183,387.50 | 21,412,353.32 | 655,875.00 | 94,230.00 | 23,345,845.82 |
| Variable remuneration | - | ||||
| Bonus | |||||
| Participation of results | �� 71,403,961.00 | 71,403,961.00 | |||
| Meeting attendance | - | ||||
| Commissions | - | ||||
| Other INSS | - | ||||
| Other | - | ||||
| Post-employment | - | ||||
| Termination of office | - | ||||
| Stock-based | 71,403,961.00 | 71,403,961.00 | |||
| Total remuneration | 6,532,248.14 | 274,751,941.28 | 3,573,793.40 | 513,030.00 | 285,371,012.82 |
| No charges | 5,348,860.64 | 253,339,587.96 | 2,917,918.40 | 418,800.00 | 262,025,167.00 |
| |||||
|
8.3. In relation to the variable remuneration of the last 03 fiscal years and the one planned for the current fiscal year of the Board of Directors and the Statutory Executive Board
The following tables present the variable remuneration of the members of the Company's management bodies in the fiscal years 2020, 2021 and 2022, as well as that expected for the 2023 fiscal year.
| 2020 | Board of Directors | Board of Executive Officers | Audit Committee | Fiscal Council | Total |
a. Body: b. Total number of members | 9 | 45.0 | 4.0 | 6.0 | 64 |
| c. Number of paid members | 5.25 | 39.0 | 3.58 | 3.0 | 50.83 |
| d. in relation to the Bonus | |||||
| i . minimum amount provided for in the compensation plan | - | - | - | - | - |
| i i .maximum amount provided for in the remuneration plan | - | 9,000,000.00 | - | - | 9,000,000.00 |
| i i i .amount provided for in the compensation plan, if the goals are achieved | - | 5,000,000.00 | - | - | 5,000,000.00 |
| iv. Value actually recognized in the result of the fiscal year | - | - | - | - | - |
| e. in relation to participation in the result | |||||
| i . minimum amount provided for in the compensation plan | - | - | - | - | - |
| i i . maximum amount provided for in the remuneration plan | - | 220,000,000.00 | - | - | 220,000,000.00 |
| i i i .amount provided for in the compensation plan, if the goals are achieved | - | 200,000,000.00 | - | - | 200,000,000.00 |
| iv. Value actually recognized in the result of the fiscal year | - | 142,807,922.00 | - | - | 142,807,922.00 |
Note: The number of members of each Body corresponds to the annual average calculated monthly.
|
| 2021 | Board of Directors | Board of Executive Officers | Audit Committee | Fiscal Council | Total |
a. Body: b. Total number of members | 12.0 | 50.0 | 5.0 | 6.0 | 73.0 |
| c. Number of paid members | 5.6 | 45.2 | 3.6 | 3.0 | 57.3 |
| d. in relation to the Bonus | |||||
| i . minimum amount provided for in the compensation plan | - | - | - | - | - |
| i i .maximum amount provided for in the remuneration plan | - | 9,000,000.00 | - | - | 9,000,000.00 |
| i i i .amount provided for in the compensation plan, if the goals are achieved | - | 5,000,000.00 | - | - | 5,000,000.00 |
| iv. Value actually recognized in the result of the fiscal year | - | - | - | - | - |
| e. in relation to participation in the result | |||||
| i . minimum amount provided for in the compensation plan | - | - | - | - | - |
| i i . maximum amount provided for in the remuneration plan | - | 220,000,000.00 | - | - | 220,000,000.00 |
| i i i .amount provided for in the compensation plan, if the goals are achieved | - | 200,000,000.00 | - | - | 200,000,000.00 |
iv. Value actually recognized in the result of the fiscal year
| - | 202,802,208.46 | - | - | 202,802,208.46 |
Note: The number of members of each Body corresponds to the annual average calculated monthly.
|
| 2022 | Board of Directors | Board of Executive Officers | Audit Committee | Fiscal Council l | Total |
a. Body: b. Total number of members | 10.0 | 50.0 | 4.0 | 6.0 | 70.0 |
| c. Number of paid members | 5.0 | 50.3 | 4.0 | 3.0 | 62.3 |
| d. in relation to the Bonus | |||||
| i . minimum amount provided for in the compensation plan | - | - | - | - | - |
| i i .maximum amount provided for in the remuneration plan | - | 9,000,000.00 | - | - | 9,000,000.00 |
| i i i .amount provided for in the compensation plan, if the goals are achieved | - | 5,000,000.00 | - | - | 5,000,000.00 |
| iv. Value actually recognized in the result of the fiscal year | - | - | - | - | - |
| e. in relation to participation in the result | |||||
| i . minimum amount provided for in the compensation plan | - | - | - | - | - |
| i i . maximum amount provided for in the remuneration plan | - | 298,000,000.00 | - | - | 298,000,000.00 |
| i i i .amount provided for in the compensation plan, if the goals are achieved | - | 220,000,000.00 | - | - | 220,000,000.00 |
iv. Value actually recognized in the result of the fiscal year
| - | 176,927,400.00 | - | - | 176,927,400.00 |
Note: The number of members of each Body corresponds to the annual average calculated monthly.
|
| 2023 (foreseen) | Board of Directors | Board of Executive Officers | Audit Committee | Fiscal Council l | Total |
a. Body: b. Total number of members | 10.0 | 55.0 | 4.0 | 5.0 | 73.0 |
| c. Number of paid members | 6.0 | 55.0 | 4.0 | 2.0 | 67.0 |
| d. in relation to the Bonus | |||||
| i . minimum amount provided for in the compensation plan | - | - | - | - | - |
| i i .maximum amount provided for in the remuneration plan | - | 9,000,000.00 | - | - | 9,000,000.00 |
| i i i .amount provided for in the compensation plan, if the goals are achieved | - | 5,000,000.00 | - | - | 5,000,000.00 |
| iv. Value actually recognized in the result of the fiscal year | - | - | - | - | - |
| e. in relation to participation in the result | |||||
| i . minimum amount provided for in the compensation plan | - | - | - | - | - |
| i i . maximum amount provided for in the remuneration plan | - | 298,000,000.00 | - | - | 298,000,000.00 |
| i i i .amount provided for in the compensation plan, if the goals are achieved | - | 220,000,000.00 | - | - | 220,000,000.00 |
iv. Value actually recognized in the result of the fiscal year
| - | 0 | - | - | 0 |
|
8.4. Compensation plan based on shares of the Board of Directors and the Statutory Executive Board, in force in the last fiscal year and foreseen for the current fiscal year.
a. general terms and conditions
We currently have three long-term compensation plans tied to stock market price performance: the Local Long-Term Incentive Plan, the Global Long-Term Incentive Plan, and the Deferment Plan.
Eligible for these plans are directors and non-management employees who have been appointed by our Board of Directors. The Plans have a duration of three years, promoting the commitment of those eligible to long-term results.
| (i) | Local Long-Term Incentive Plan |
Retention Plans
In specific and punctual situations, both managers and employees may have a retention plan linked to the area or individual in order to retain it, ensuring the sustainability of the business and the Bank. Each plan has a specific contract and provides payment according to the performance and permanence of the individual, observing local and global normative resolutions.
| (ii) | Global Long-Term Incentive Plans |
| (ii.1) | Global Plans – ILP CRDIV and Digital Transformation Award (DTA) 2019, 2020 and 2021 |
Please refer to the text on the ILP CRDIV and ILP DTA Plan available in item 8.1, D, above.
| (ii.2) | Deferment Programs |
The Deferral Programs are applied to Statutory Directors, executives with Management positions and other eligible employees. As part of the Deferral program, participants receive part of the variable remuneration over a period of three years or five years.
The Deferral Programs are renewed and updated each year. As of December/2022, we had six plans in place: one for each fiscal year 2017, 2018, 2019, 2020, 2021 and 2022.
|
| (iii) | Deferment Program |
The deferral plans are divided into two programs:
| · | Identified Collective: Statutory and Executive Directors. Statutory Directors and Executives who assume significant risks to us and are responsible for the areas of control. Deferred compensation is paid 50% in cash, and 50% in shares (SANB11 Units). |
| · | Other Employees: Employees of Superintendence level and other employees with variable remuneration above a stipulated minimum amount are eligible. Deferred compensation is paid 50% in cash, and 50% in shares (SANB11 Units). |
b.date of approval and responsible body
The Long-Term General Incentive Plan, which includes the deferral plans in force, was approved at the Extraordinary General Meeting on 12/21/2016, according to the proposal approved by the Board of Directors, at a meeting held on 10.25.2016.
|
| c. | maximum number of shares covered |
| Stock-based Compensation Plan planned for the current fiscal year (2023) | ||||||||||||||||||||||||
| Board of Directors | Executive Board | |||||||||||||||||||||||
| ILP Global CRDIV 2015 | DEFERRAL 6th Cycle | DEFERRAL 7th Cycle | DEFERRAL 8th Cycle | DEFERRAL 9th Cycle | DEFERRAL 10th Cycle | DEFERRAL 11th Cycle | DEFERRAL 12th Cycle | DEFERRAL 13th Cycle | ILP Global CRDIV 2015 | ILP DTA 2019 | ILP DTA 2020 | ILP DTA 2021 | DEFERRAL 6th Cycle | DEFERRAL 7th Cycle | DEFERRAL 8th Cycle | DEFERRAL 9th Cycle | DEFERRAL 10th Cycle | DEFERRAL 11th Cycle | DEFERRAL 12th Cycle | DEFERRAL 13th Cycle | ||||
| Maximum number of shares covered | - | - | - | - | - | - | - | - | - | - | 51,483 | 22,896 | 29,933 | - | - | - | 27,422 | 63,693 | 403,211 | 1,076,026 | 1,317,392 | |||
| * Until February 10 of each of the three fiscal years following the base year, the Company's Board of Directors may change the maximum number of Units per year, increasing the proportion in which the Company distributes dividends and/or interest on own capital to its shareholders, in the amount equivalent to the dividends and or/ interest on own capital that the participant would be entitled to if he had the Company's Units. | ||||||||||||||||||||||||
| Stock-based Compensation Plan for the fiscal year ended 12/31/2022 | |||||||||||||||||||||||
| Board of Directors | Executive Board | ||||||||||||||||||||||
| ILP Global CRDIV 2015 | DEFERRAL 6th Cycle | DEFERRAL 7th Cycle | DEFERRAL 8th Cycle | DEFERRAL 9th Cycle | DEFERRAL 10th Cycle | DEFERRAL 11th Cycle | DEFERRAL 12th Cycle | DEFERRAL 13th Cycle | ILP Global CRDIV 2015 | ILP DTA 2019 | ILP DTA 2020 | ILP DTA 2021 | DEFERRAL 6th Cycle | DEFERRAL 7th Cycle | DEFERRAL 8th Cycle | DEFERRAL 9th Cycle | DEFERRAL 10th Cycle | DEFERRAL 11th Cycle | DEFERRAL 12th Cycle | DEFERRAL 13th Cycle | |||
| Maximum number of shares covered | - | - | - | - | - | - | - | - | - | - | 51,483 | 22,896 | 29,933 | - | - | 38,540 | 54,108 | 233,039 | 672,734 | 1,512,546 | 1,317,392 | ||
| * Until February 10 of each of the three fiscal years following the base year, the Company's Board of Directors may change the maximum number of Units per year, increasing the proportion in which the Company distributes dividends and/or interest on own capital to its shareholders, in the amount equivalent to the dividends and or/ interest on own capital that the participant would be entitled to if he had the Company's Units. | |||||||||||||||||||||||
|
| Stock-based Compensation Plan for the fiscal year ended 12/31/2021 | |||||||||||||||||||||||
| Board of Directors | Executive Board | ||||||||||||||||||||||
| ILP Global CRDIV 2015 | DEFERRAL 6th Cycle | DEFERRAL 7th Cycle | DEFERRAL 8th Cycle | DEFERRAL 9th Cycle | DEFERRAL 10th Cycle | DEFERRAL 11th Cycle | DEFERRAL 12th Cycle | DEFERRAL 13th Cycle | ILP Global CRDIV 2015 | ILP DTA 2019 | ILP DTA 2020 | ILP DTA 2021 | DEFERRAL 6th Cycle | DEFERRAL 7th Cycle | DEFERRAL 8th Cycle | DEFERRAL 9th Cycle | DEFERRAL 10th Cycle | DEFERRAL 11th Cycle | DEFERRAL 12th Cycle | DEFERRAL 13th Cycle | |||
| Maximum number of shares covered | - | - | - | - | - | - | - | - | - | - | 69,287 | 11,448 | - | - | 68,091 | 106,830 | 406,973 | 743,652 | 903,914 | 1,503,510 | - | ||
| * Until February 10 of each of the three fiscal years following the base year, the Company's Board of Directors may change the maximum number of Units per year, increasing the proportion in which the Company distributes dividends and/or interest on own capital to its shareholders, in the amount equivalent to the dividends and or/ interest on own capital that the participant would be entitled to if he had the Company's Units. | |||||||||||||||||||||||
| Stock-based Compensation Plan in effect for the fiscal year ended 12/31/2020 | ||||||||||||||||||||||||||
| Board of Directors | Executive Board | |||||||||||||||||||||||||
| ILP Global CRDIV 2015 | DEFERRAL 6th Cycle | DEFERRAL 7th Cycle | DEFERRAL 8th Cycle | DEFERRAL 9th Cycle | DEFERRAL 10th Cycle | DEFERRAL 11th Cycle | DEFERRAL 12th Cycle | DEFERRAL 13th Cycle | ILP Global CRDIV 2015 | ILP DTA 2019 | ILP DTA 2020 | ILP DTA 2021 | DEFERRAL 6th Cycle | DEFERRAL 7th Cycle | DEFERRAL 8th Cycle | DEFERRAL 9th Cycle | DEFERRAL 10th Cycle | DEFERRAL 11th Cycle | DEFERRAL 12th Cycle | DEFERRAL 13th Cycle | ||||||
| Maximum number of shares covered | 32,046 | 61,653 | - | - | - | - | - | - | - | 360,586 | 69,287 | - | - | 73,759 | 122,060 | 454,039 | 550,811 | 887,949 | - | - | - | |||||
| * Until February 10 of each of the three fiscal years following the base year, the Company's Board of Directors may change the maximum number of Units per year, increasing the proportion in which the Company distributes dividends and/or interest on own capital to its shareholders, in the amount equivalent to the dividends and or/ interest on own capital that the participant would be entitled to if he had the Company's Units. | ||||||||||||||||||||||||||
|
d. maximum number of options to be granted
| Stock-based Compensation Plan planned for the current fiscal year (2023) | ||||||
| Board of Directors | Executive Board | |||||
| ILP DTA | ILP DTA | ILP DTA | ILP DTA | ILP DTA | ILP DTA | |
| 2019 | 2020 | 2021 | 2019 | 2020 | 2021 | |
| Maximum number of shares covered | - | - | - | 269,148 | 68,306 | 114,946 |
| * Until February 10 of each of the three fiscal years following the base year, the Company's Board of Directors may change the maximum number of Units per year, increasing the proportion in which the Company distributes dividends and/or interest on own capital to its shareholders, in the amount equivalent to the dividends and or/ interest on own capital that the participant would be entitled to if he had the Company's Units. | ||||||
| Stock-based Compensation Plan for the fiscal year ended 12/31/2022 | ||||||
| Board of Directors | Executive Board | |||||
| ILP DTA 2019 | ILP DTA 2020 | ILP DTA 2021 | ILP DTA 2019 | ILP DTA 2020 | ILP DTA 2021 | |
| Maximum number of shares covered | - | - | - | 269,148 | 68,306 | 114,946 |
| * Until February 10 of each of the three fiscal years following the base year, the Company's Board of Directors may change the maximum number of Units per year, increasing the proportion in which the Company distributes dividends and/or interest on own capital to its shareholders, in the amount equivalent to the dividends and or/ interest on own capital that the participant would be entitled to if he had the Company's Units. | ||||||
|
| Stock-based Compensation Plan for the fiscal year ended 12/31/2021 | ||||||
| Board of Directors | Executive Board | |||||
| ILP DTA 2019 | ILP DTA 2020 | ILP DTA 2021 | ILP DTA 2019 | ILP DTA 2020 | ILP DTA 2021 | |
| Maximum number of shares covered | - | - | - | 362,225 | 34,153 | - |
| * Until February 10 of each of the three fiscal years following the base year, the Company's Board of Directors may change the maximum number of Units per year, increasing the proportion in which the Company distributes dividends and/or interest on own capital to its shareholders, in the amount equivalent to the dividends and or/ interest on own capital that the participant would be entitled to if he had the Company's Units. | ||||||
| Stock-based Compensation Plan in effect for the fiscal year ended 12/31/2020 | ||||||
| Board of Directors | Executive Board | |||||
| ILP DTA 2019 | ILP DTA 2020 | ILP DTA 2021 | ILP DTA 2019 | ILP DTA 2020 | ILP DTA 2021 | |
| Maximum number of shares covered | - | - | - | 362,225 | - | - |
| * Until February 10 of each of the three fiscal years following the base year, the Company's Board of Directors may change the maximum number of Units per year, increasing the proportion in which the Company distributes dividends and/or interest on own capital to its shareholders, in the amount equivalent to the dividends and or/ interest on own capital that the participant would be entitled to if he had the Company's Units. | ||||||
|
e. conditions for the acquisition of shares
| (i) | Global Programs |
Please refer to the text on the ILP CRDIV and ILP DTA Plans available in item 8.1, D, above.
| (ii) | Deferment Programs |
Deferment -, 8th Cycle (2017), 9th Cycle (2018), 10th Cycle (2019), 11th Cycle (2020), 12th Cycle (2021) and 13th Cycle (2022): The Plan is part of the current regulatory environment applicable to us, notably in light of CMN Resolution No. 3921, of November 25, 2010 ("Resolution No. 3921/10"), which obliges financial institutions to observe certain requirements for deferred payment in the future of part of the Variable Remuneration due to their managers and other employees, taking into account long-term sustainable financial bases and adjustments in future payments according to the risks assumed and fluctuations in the cost of capital.
f. criteria for fixing the purchase or exercise price
| (i) | Global Programs |
The cycles have a duration of three years, covering three social years, promoting a commitment of the Executive Directors with the long-term results.
| (ii) | Deferment Programs (8th, 9th, 10th, 11th, 12th and 13th cycles) |
The total number of referenced Units is settled in three or five installments and allocated equally for the three or five fiscal years following the base year.
g. Criteria for setting the time limit for acquisition or exercise
| (i) | Global Programs |
ILP DTA global plans are restricted to the transfer of shares for one year (lockup) after they are received.
| (ii) | Deferment Programs |
8th, 9th, 10th, 11th, 12th and 13th Deferral Cycles: the Units received in these plans may not be sold within one year from the date of receipt of each batch of Units (lockup).
h. Form of settlement
| (i) | Global Programs |
Payroll gratification
|
| (ii) | Deferment Programs |
8th, 9th, 10th, 11th, 12th and 13th Cycles of Deferment: it is carried out directly in Units (deferred portion in Units)
i. Restrictions on the transfer of shares
| (i) | Global Programs |
The Global Plan – ILP CRDIV was paid on payroll respecting the restriction period initially defined.
| (ii) | Deferment Programs |
8th, 9th, 10th, 11th, 12th and 13th Deferment Cycles: the Units received in this plan may not be sold within one year from the date of receipt of each batch of Units (lockup).
j. Criteria and events that, when verified, will cause the suspension, alteration or extinction of the plan
| (i) | Global Programs |
Changes to the plan may happen for legal or regulatory reasons.
| (ii) | Deferment Programs |
The Plans may be extinguished, suspended or amended, at any time, by the Board of Directors, and in the event of suspension or extinction the rights of participants who already have installments of bonuses referenced in Units receivable, in the following provisions, shall be respected:
| · | To preserve the objectives of the plan, the total number of Units shall be adjusted more or less when it occurs: splitting, grouping or bonus shares, merger, incorporation, spin-off, other procedures of a similar nature and relevant significance; and |
| · | The Human Resources Department, under the supervision of the Executive Committee, will execute the aforementioned quantitative adjustments using the methodologies used by B3 to make similar adjustments in its stock markets. |
| (ii.1) | Deferment –8th, 9th, 10th, 11th, 12th and 13th Cycles: |
The Plan is subject to the Malus and/or Clawback clauses, that is, the Company's Board of Directors, on the recommendation of the Compensation Committee, may approve the reduction and/or return of up to 100% of the value of each participant in the cases previously approved by Internal Governance.
|
Between the years 2016 and 2021, the deferral plan of the Executive Committee and other executives chosen by the Executive Committee, had the payment of the last installment (in the case of deferral in 3 years) or the last three installments (in the case of deferral in 5 years), also impacted by the result of the Santander Mundial Group, with a weight of 30%.
As of the 2022 fiscal year, only the deferral of the Chief Executive Officer maintains the impact in the last three installments (deferral in 5 years), subject to the achievement of the Santander Mundial Group's result indicators, with a weight of 30%.
K. Effects of the director's departure from the issuer's organs on his rights under the share-based compensation plan
| (i) | Global Programs |
In case of retirement, due to dismissal without just cause, removal, permanent disability or death, the right to the delivery of the shares will remain as if none of the said circumstances had occurred, except for the following changes:
| · | In the event of death, such right shall pass to the beneficiary's successors in title; |
| · | The number of shares to be delivered shall be the result of multiplying the maximum number of shares established by the quotient resulting from the division between the number of days elapsed between the date of release of the plan and the date on which the death, retirement, pre-retirement, dismissal, discharge or other circumstance that determines the application of this rule occurs, both inclusive, by the number of days of validity of the plan; and |
| · | In case of resignation the participant loses the right to the plan. |
| (ii) | Deferment Programs |
The plan will have its validity extinguished, in advance and in its own right, losing the participant the right to participate in the plan and to receive future installments, in the event of dismissal by request for resignation, resignation, due to dismissal for just cause under the terms of article 482 of the Consolidation of Labor Laws or removal from statutory position by unilateral decision of the Company.
|
In the event of dismissal of a participant for termination of the employment contract due to acts performed by us, pursuant to article 483 of the Consolidation of Labor Laws, due to dismissal without just cause, due to retirement or in the event of death, the participant will receive at the time of making payments to the others participants of the respective cycle, the amount of the bonus portion referenced in Units applicable to that participant. In the event of death, the delivery will be made to the successors of the participant. In the case of permanent disability of the participant, as evidenced by two medical reports (public and private institution), the participant will receive, at the time of making the payments to the other participants of the respective cycle, the value of the portion of the bonus referenced in Units applicable to this participant.
In the event of suspension of the employment contract due to illness or accident at work, the participant will receive, at the time of making the payments to the other participants of the respective cycle, the value of the portion of the bonus referenced in Units applicable to that participant.
|
8.5. In relation to the share-based remuneration in the form of stock options recognized in the results of the last 3 fiscal years and that foreseen for the current fiscal year, of the board of directors and the statutory executive board, prepare a table with the following content:
| a. | Organ |
| b. | total number of members |
| c. | number of paid members |
| d. | weighted average strike price for each of the following option groups: |
| i. | open at the beginning of the fiscal year |
| ii. | lost and expired during the fiscal year |
| iii. | exercised during the fiscal year |
| iv. | potential dilution in case of exercise of all open options |
The following tables present the expected remuneration for the current financial year 2023:
| Board of Directors | |||||||
| ILP DTA 2019 | ILP DTA 2020 | ILP DTA 2021 | |||||
| Number of members | 10 | ||||||
| Number of paid members | 5 | ||||||
| Grant of stock purchase options | |||||||
| Date of grant | 2020 | 2021 | 2022 | ||||
| Number of options granted | - | - | - | ||||
| Deadline for options to become exercisable | 2023 | 2024 | 2025 | ||||
| Maximum period for exercise of options | 2030 | 2029 | 2030 | ||||
| Period of restriction on the transfer of shares | there is no | there is no | there is no | ||||
| Weighted average strike price: | there is no | there is no | there is no | ||||
| (a) Options open at the beginning of the fiscal year | - | - | - | ||||
| (b) Options lost during the fiscal year | - | - | - | ||||
| (c) the options exercised during the fiscal year | - | - | - | ||||
| (d) Options expired during the fiscal year | - | - | - | ||||
| Fair value of options on the date of grant | EUR 3.67 | EUR 2.685 | EUR 3,104 | ||||
| Potential dilution in the case of the exercise of all options granted | |||||||
| Maximum dilution. | |||||||
|
| Executive Board | |||||
| ILP DTA 2019 | ILP DTA 2020 | ILP DTA 2021 | |||
| Number of members | 50 | ||||
| Number of paid members | 50.3 | ||||
| Grant of stock purchase options | |||||
| Date of grant | 2020 | 2021 | 2022 | ||
| Number of options granted | 269.148 | 68.306 | 114.946 | ||
| Deadline for options to become exercisable | 2023 | 2024 | 2025 | ||
| Maximum period for exercise of options | 2030 | 2029 | 2030 | ||
| Period of restriction on the transfer of shares | there is no | there is no | there is no | ||
| Weighted average strike price: | there is no | there is no | there is no | ||
| (a) Options open at the beginning of the fiscal year | 269.148 | 68.306 | 114.946 | ||
| (b) Options lost during the fiscal year | - | - | - | ||
| (c) the options exercised during the fiscal year | - | - | - | ||
| (d) Options expired during the fiscal year | - | - | - | ||
| Fair value of options on the date of grant | EUR 3.67 | EUR 2.685 | EUR 3,104 | ||
| Potential dilution in the case of the exercise of all options granted | |||||
| Maximum dilution. | |||||
|
The following tables present the compensation for base year 2022:
| Board of Directors | |||||
| ILP DTA 2019 | ILP DTA 2020 | ILP DTA 2021 | |||
| Number of members | 10 | ||||
| Number of paid members | 5 | ||||
| Grant of stock purchase options | |||||
| Date of grant | 2020 | 2021 | 2022 | ||
| Number of options granted | - | - | - | ||
| Deadline for options to become exercisable | 2023 | 2024 | 2025 | ||
| Maximum period for exercise of options | 2030 | 2029 | 2030 | ||
| Period of restriction on the transfer of shares | there is no | there is no | there is no | ||
| Weighted average strike price: | there is no | there is no | there is no | ||
| (a) Options open at the beginning of the fiscal year | - | - | - | ||
| (b) Options lost during the fiscal year | - | - | - | ||
| (c) the options exercised during the fiscal year | - | - | - | ||
| (d) Options expired during the fiscal year | - | - | - | ||
| Fair value of options on the date of grant | EUR 3.67 | EUR 2.685 | EUR 3,104 | ||
| Potential dilution in the case of the exercise of all options granted | |||||
| Maximum dilution. | |||||
|
| Executive Board | |||||
| ILP DTA 2019 | ILP DTA 2020 | ILP DTA 2021 | |||
| Number of members | 50 | ||||
| Number of paid members | 50.3 | ||||
| Grant of stock purchase options | |||||
| Date of grant | 2020 | 2021 | 2022 | ||
| Number of options granted | 269,148 | 68,306 | 114,946 | ||
| Deadline for options to become exercisable | 2023 | 2024 | 2025 | ||
| Maximum period for exercise of options | 2030 | 2029 | 2030 | ||
| Period of restriction on the transfer of shares | there is no | there is no | there is no | ||
| Weighted average strike price: | there is no | there is no | there is no | ||
| (a) Options open at the beginning of the fiscal year | 269,148 | 68,306 | 114,946 | ||
| (b) Options lost during the fiscal year | 93,077 | - | - | ||
| (c) the options exercised during the fiscal year | - | - | - | ||
| (d) Options expired during the fiscal year | - | - | - | ||
| Fair value of options on the date of grant | EUR 3.67 | EUR 2.685 | EUR 3,104 | ||
| Potential dilution in the case of the exercise of all options granted | |||||
| Maximum dilution. | |||||
|
The following tables present the compensation for base year 2021:
| Board of Directors | |||||
| ILP DTA 2019 | ILP DTA 2020 | ILP DTA 2021 | |||
| Number of members | 12 | ||||
| Number of paid members | 5.6 | ||||
| Grant of stock purchase options | |||||
| Date of grant | 2020 | 2021 | 2022 | ||
| Number of options granted | - | - | - | ||
| Deadline for options to become exercisable | 2023 | 2024 | - | ||
| Maximum period for exercise of options | 2030 | 2029 | - | ||
| Period of restriction on the transfer of shares | there is no | there is no | - | ||
| Weighted average strike price: | there is no | there is no | - | ||
| (a) Options open at the beginning of the fiscal year | - | - | - | ||
| (b) Options lost during the fiscal year | - | - | - | ||
| (c) the options exercised during the fiscal year | - | - | - | ||
| (d) Options expired during the fiscal year | - | - | - | ||
| Fair value of options on the date of grant | EUR 3.67 | EUR 2.685 | - | ||
| Potential dilution in the case of the exercise of all options granted | |||||
| Maximum dilution. | |||||
|
| Executive Board | |||||
| ILP DTA 2019 | ILP DTA 2020 | ILP DTA 2021 | |||
| Number of members | 50 | ||||
| Number of paid members | 45.2 | ||||
| Grant of stock purchase options | |||||
| Date of grant | 2020 | 2021 | 2022 | ||
| Number of options granted | 362,225 | 34,153 | - | ||
| Deadline for options to become exercisable | 2023 | 2024 | - | ||
| Maximum period for exercise of options | 2030 | 2029 | - | ||
| Period of restriction on the transfer of shares | there is no | there is no | - | ||
| Weighted average strike price: | there is no | there is no | - | ||
| (a) Options open at the beginning of the fiscal year | 362,225 | 34,153 | - | ||
| (b) Options lost during the fiscal year | - | - | - | ||
| (c) the options exercised during the fiscal year | - | - | - | ||
| (d) Options expired during the fiscal year | - | - | - | ||
| Fair value of options on the date of grant | EUR 3.67 | EUR 2.685 | - | ||
| Potential dilution in the case of the exercise of all options granted | |||||
| Maximum dilution. | |||||
|
The following tables present the compensation for base year 2020:
| Board of Directors | |||||
| ILP DTA 2019 | ILP DTA 2020 | ILP DTA 2021 | |||
| Number of members | 9 | ||||
| Number of paid members | 4.8 | ||||
| Grant of stock purchase options | |||||
| Date of grant | 2020 | 2021 | 2022 | ||
| Number of options granted | - | - | - | ||
| Deadline for options to become exercisable | 2023 | - | - | ||
| Maximum period for exercise of options | 2030 | - | - | ||
| Period of restriction on the transfer of shares | there is no | - | - | ||
| Weighted average strike price: | there is no | - | - | ||
| (a) Options open at the beginning of the fiscal year | 362,225 | - | - | ||
| (b) Options lost during the fiscal year | - | - | - | ||
| (c) the options exercised during the fiscal year | - | - | - | ||
| (d) Options expired during the fiscal year | - | - | - | ||
| Fair value of options on the date of grant | EUR 3.67 | - | - | ||
| Potential dilution in the case of the exercise of all options granted | |||||
| Maximum dilution. | |||||
|
| Executive Board | |||||
| ILP DTA 2019 | ILP DTA 2020 | ILP DTA 2021 | |||
| Number of members | 45 | ||||
| Number of paid members | 39 | ||||
| Grant of stock purchase options | |||||
| Date of grant | 2020 | 2021 | 2022 | ||
| Number of options granted | 362,225 | - | - | ||
| Deadline for options to become exercisable | 2023 | - | - | ||
| Maximum period for exercise of options | 2030 | - | - | ||
| Period of restriction on the transfer of shares | there is no | - | - | ||
| Weighted average strike price: | there is no | - | - | ||
| (a) Options open at the beginning of the fiscal year | 362,225 | - | - | ||
| (b) Options lost during the fiscal year | - | - | - | ||
| (c) the options exercised during the fiscal year | - | - | - | ||
| (d) Options expired during the fiscal year | - | - | - | ||
| Fair value of options on the date of grant | EUR 3.67 | - | - | ||
| Potential dilution in the case of the exercise of all options granted | |||||
| Maximum dilution. | |||||
|
8.6. In relation to each grant of stock purchase options made in the last 3 fiscal years and planned for the current fiscal year, the board of directors and the statutory executive board, prepare a table with the following content:
a. organ
b. total number of members
c. number of paid members
d. date of grant
e. number of options granted
f. deadline for options to become exercisable
g. maximum period for exercise of options
h. period of restriction on the transfer of shares received as a result of the exercise of options
i. fair value of options on the date of grant
j. multiplication of the number of shares granted by the fair value of the options on the date granted
The following tables present the expected remuneration for the current financial year 2023:
| Board of Directors | |||||
| ILP DTA 2019 | ILP DTA 2020 | ILP DTA 2021 | |||
| Number of members | 10 | ||||
| Number of paid members | 5 | ||||
| Grant of stock purchase options | |||||
| Date of grant | 2020 | 2021 | 2022 | ||
| Number of options granted | - | - | - | ||
| Deadline for options to become exercisable | 2023 | 2024 | 2025 | ||
| Maximum period for exercise of options | 2030 | 2029 | 2030 | ||
| Period of restriction on the transfer of shares | there is no | there is no | there is no | ||
| Weighted average strike price: | there is no | there is no | there is no | ||
| (a) Options open at the beginning of the fiscal year | - | - | - | ||
| (b) Options lost during the fiscal year | - | - | - | ||
| (c) the options exercised during the fiscal year | - | - | - | ||
| (d) Options expired during the fiscal year | - | - | - | ||
| Fair value of options on the date of grant | EUR 3.67 | EUR 2.685 | EUR 3,104 | ||
| Multiplication of the number of shares granted by the fair value of the options on the date granted | - | - | - | ||
|
| Executive Board | |||||
| ILP DTA 2019 | ILP DTA 2020 | ILP DTA 2021 | |||
| Number of members | 50 | ||||
| Number of paid members | 50,3 | ||||
| Grant of stock purchase options | |||||
| Date of grant | 2020 | 2021 | 2022 | ||
| Number of options granted | 269.148 | 68.306 | 114.946 | ||
| Deadline for options to become exercisable | 2023 | 2024 | 2025 | ||
| Maximum period for exercise of options | 2030 | 2029 | 2030 | ||
| Period of restriction on the transfer of shares | there is no | there is no | there is no | ||
| Weighted average strike price: | there is no | there is no | there is no | ||
| (a) Options open at the beginning of the fiscal year | 269.148 | 68.306 | 114.946 | ||
| (b) Options lost during the fiscal year | - | - | - | ||
| (c) the options exercised during the fiscal year | - | - | - | ||
| (d) Options expired during the fiscal year | - | - | - | ||
| Fair value of options on the date of grant | EUR 3.67 | EUR 2.685 | EUR 3,104 | ||
| Multiplication of the number of shares granted by the fair value of the options on the date granted | |||||
|
The following tables present the compensation for base year 2022:
| Board of Directors | |||||
| ILP DTA 2019 | ILP DTA 2020 | ILP DTA 2021 | |||
| Number of members | 10 | ||||
| Number of paid members | 5 | ||||
| Grant of stock purchase options | |||||
| Date of grant | 2020 | 2021 | 2022 | ||
| Number of options granted | - | - | - | ||
| Deadline for options to become exercisable | 2023 | 2024 | 2025 | ||
| Maximum period for exercise of options | 2030 | 2029 | 2030 | ||
| Period of restriction on the transfer of shares | there is no | there is no | there is no | ||
| Weighted average strike price: | there is no | there is no | there is no | ||
| (a) Options open at the beginning of the fiscal year | - | - | - | ||
| (b) Options lost during the fiscal year | - | - | - | ||
| (c) the options exercised during the fiscal year | - | - | - | ||
| (d) Options expired during the fiscal year | - | - | - | ||
| Fair value of options on the date of grant | EUR 3.67 | EUR 2.685 | EUR 3,104 | ||
| Multiplication of the number of shares granted by the fair value of the options on the date granted | - | - | - | ||
|
| Executive Board | |||||
| ILP DTA 2019 | ILP DTA 2020 | ILP DTA 2021 | |||
| Number of members | 50 | ||||
| Number of paid members | 50.3 | ||||
| Grant of stock purchase options | |||||
| Date of grant | 2020 | 2021 | 2022 | ||
| Number of options granted | 269,148 | 68,306 | 114,946 | ||
| Deadline for options to become exercisable | 2023 | 2024 | 2025 | ||
| Maximum period for exercise of options | 2030 | 2029 | 2030 | ||
| Period of restriction on the transfer of shares | there is no | there is no | there is no | ||
| Weighted average strike price: | there is no | there is no | there is no | ||
| (a) Options open at the beginning of the fiscal year | 269,148 | 68,306 | 114,946 | ||
| (b) Options lost during the fiscal year | 93,077 | - | - | ||
| (c) the options exercised during the fiscal year | - | - | - | ||
| (d) Options expired during the fiscal year | - | - | - | ||
| Fair value of options on the date of grant | EUR 3.67 | EUR 2.685 | EUR 3,104 | ||
| Multiplication of the number of shares granted by the fair value of the options on the date granted | EUR 987,773 | EUR 183,402 | EUR 356,792 | ||
|
The following tables present the compensation for base year 2021:
| Board of Directors | |||||
| ILP DTA 2019 | ILP DTA 2020 | ILP DTA 2021 | |||
| Number of members | 12 | ||||
| Number of paid members | 5.6 | ||||
| Grant of stock purchase options | |||||
| Date of grant | 2020 | 2021 | 2022 | ||
| Number of options granted | - | - | - | ||
| Deadline for options to become exercisable | 2023 | 2024 | - | ||
| Maximum period for exercise of options | 2030 | 2029 | - | ||
| Period of restriction on the transfer of shares | there is no | there is no | - | ||
| Weighted average strike price: | there is no | there is no | - | ||
| (a) Options open at the beginning of the fiscal year | - | - | - | ||
| (b) Options lost during the fiscal year | - | - | - | ||
| (c) the options exercised during the fiscal year | - | - | - | ||
| (d) Options expired during the fiscal year | - | - | - | ||
| Fair value of options on the date of grant | EUR 3.67 | EUR 2.685 | - | ||
| Multiplication of the number of shares granted by the fair value of the options on the date granted | - | - | - | ||
|
| Executive Board | |||||
| ILP DTA 2019 | ILP DTA 2020 | ILP DTA 2021 | |||
| Number of members | 50 | ||||
| Number of paid members | 45.2 | ||||
| Grant of stock purchase options | |||||
| Date of grant | 2020 | 2021 | 2022 | ||
| Number of options granted | 362,225 | 34,153 | - | ||
| Deadline for options to become exercisable | 2023 | 2024 | - | ||
| Maximum period for exercise of options | 2030 | 2029 | - | ||
| Period of restriction on the transfer of shares | there is no | there is no | - | ||
| Weighted average strike price: | there is no | there is no | - | ||
| (a) Options open at the beginning of the fiscal year | 362,225 | 34,153 | - | ||
| (b) Options lost during the fiscal year | - | - | - | ||
| (c) the options exercised during the fiscal year | - | - | - | ||
| (d) Options expired during the fiscal year | - | - | - | ||
| Fair value of options on the date of grant | EUR 3.67 | EUR 2.685 | - | ||
| Multiplication of the number of shares granted by the fair value of the options on the date granted | EUR 1,329,366 | EUR 91,701 | - | ||
|
The following tables present the compensation for base year 2020:
| Board of Directors | |||||
| ILP DTA 2019 | ILP DTA 2020 | ILP DTA 2021 | |||
| Number of members | 9 | ||||
| Number of paid members | 4.8 | ||||
| Grant of stock purchase options | |||||
| Date of grant | 2020 | 2021 | 2022 | ||
| Number of options granted | - | - | - | ||
| Deadline for options to become exercisable | 2023 | - | - | ||
| Maximum period for exercise of options | 2030 | - | - | ||
| Period of restriction on the transfer of shares | there is no | - | - | ||
| Weighted average strike price: | there is no | - | - | ||
| (a) Options open at the beginning of the fiscal year | - | - | - | ||
| (b) Options lost during the fiscal year | - | - | - | ||
| (c) the options exercised during the fiscal year | - | - | - | ||
| (d) Options expired during the fiscal year | - | - | - | ||
| Fair value of options on the date of grant | EUR 3.67 | - | - | ||
| Multiplication of the number of shares granted by the fair value of the options on the date granted | - | - | - | ||
|
| Executive Board | |||||
| ILP DTA 2019 | ILP DTA 2020 | ILP DTA 2021 | |||
| Number of members | 45 | ||||
| Number of paid members | 39 | ||||
| Grant of stock purchase options | |||||
| Date of grant | 2020 | 2021 | 2022 | ||
| Number of options granted | 362,225 | - | - | ||
| Deadline for options to become exercisable | 2023 | - | - | ||
| Maximum period for exercise of options | 2030 | - | - | ||
| Period of restriction on the transfer of shares | there is no | - | - | ||
| Weighted average strike price: | there is no | - | - | ||
| (a) Options open at the beginning of the fiscal year | 362,225 | - | - | ||
| (b) Options lost during the fiscal year | - | - | - | ||
| (c) the options exercised during the fiscal year | - | - | - | ||
| (d) Options expired during the fiscal year | - | - | - | ||
| Fair value of options on the date of grant | EUR 3.67 | - | - | ||
| Multiplication of the number of shares granted by the fair value of the options on the date granted | EUR 1,329,366 | - | - | ||
|
8.7. In relation to the open options of the Board of Directors and the Statutory Executive Board at the end of the last fiscal year:
As of December 31, 2022, the members of the Company's Executive Board and Board of Directors had 452,400 open options regarding the global ILP DTA plans.
|
8.8. In relation to the options exercised and shares delivered related to the share-based remuneration of the Board of Directors and the statutory Executive Board, in the last 3 fiscal years, prepare a table with the following content:
| a. | Organ |
| b. | total number of members |
| c. | number of paid members |
| d. | number of actions |
| e. | weighted average strike price |
f. weighted average market price of shares for options exercised
g. multiplication of the total options exercised by the difference between the weighted average strike price and the weighted average market price of the shares for the options exercised
Not applicable. There were no options for the open plans that became exercisable as of Dec. 31, 2022.
|
8.9 Share-based remuneration to be delivered to beneficiaries
In relation to share-based remuneration, in the form of shares to be delivered directly to the beneficiaries, recognized in the results of the last 3 fiscal years and that foreseen for the current fiscal year, of the board of directors and the statutory executive board, prepare a table with the following content:
a. organ
b. total number of members
c. number of paid members
d. potential dilution in case of granting of all actions to beneficiaries
According to tables in items 8.5 and 8.6 above.
|
8.10 Grant of shares
In relation to each grant of shares made in the last 3 fiscal years and planned for the current fiscal year, the board of directors and the statutory board of directors, prepare a table with the following content:
a. organ
b. total number of members
c. number of paid members
d. date of grant
e. number of shares granted
f. maximum deadline for delivery of shares
g. period of restriction on the transfer of shares
h. fair value of the shares on the date of grant
i. multiplication of the number of shares granted by the fair value of the shares on the date granted
The following tables present the expected remuneration for the current financial year 2023:
| Board of Directors | ||||||||||||
| ILP Global CRDIV 2015 | ILP DTA 2019 | DEFERRAL 6th Cycle | DEFERRAL 7th Cycle | DEFERRAL 8th Cycle | DEFERRAL 9th Cycle | DEFERRAL 10th Cycle | DEFERRAL 11th Cycle | DEFERRAL 12th Cycle | DEFERRAL 13th Cycle | |||
| Number of members | 10 | |||||||||||
| Number of paid members | 5 | |||||||||||
| Grant of shares | ||||||||||||
| Date of grant | Mar /20 | Mar /20 | Feb/23 | |||||||||
| Number of shares granted | - | 51,483 | - | - | - | - | - | - | - | - | ||
| Maximum deadline for delivery of shares | Mar /20 | Mar /23 | Mar /23 | |||||||||
| Period of restriction on the transfer of shares | 1 year | |||||||||||
| Fair value of shares on the date of grant | R$ 18.56 | €3.67 | R$ 28.92 | |||||||||
| Multiplication of the number of shares granted by the fair value of the shares on the date granted | - | € 188.943 | - | - | - | - | - | - | - | - | ||
|
| Executive Board | |||||||||||||||||||
| ILP Global CRDIV 2015 | ILP DTA 2019 | DEFERRAL 6th Cycle | DEFERRAL 7th Cycle | DEFERRAL 8th Cycle | DEFERRAL 9th Cycle | DEFERRAL 10th Cycle | DEFERRAL 11th Cycle | DEFERRAL 12th Cycle | DEFERRAL 13th Cycle | ||||||||||
| Number of members | 55 | ||||||||||||||||||
| Number of paid members | 55 | ||||||||||||||||||
| Grant of shares | |||||||||||||||||||
| Date of grant | Mar/20 | Mar/20 | Feb/23 | ||||||||||||||||
| Number of shares granted | - | 51,483 | - | - | 39,065 | 27,422 | 172,520 | 278,686 | 457,121 | 1,856,898 | |||||||||
| Maximum deadline for delivery of shares | Mar/20 | Mar/23 | Mar /23 | ||||||||||||||||
| Period of restriction on the transfer of shares | 1 year | ||||||||||||||||||
| Fair value of shares on the date of grant | R$ 18.56 | €3.67 | R$ 28.92 | ||||||||||||||||
| Multiplication of the number of shares granted by the fair value of the shares on the date granted | - | € 188,943 | - | - | R$ 1,250,073 | R$ 877,520 | R$ 5,520,644 | R$ 8,917,951 | R$ 14,627,873 | R$ 59,420,747 | |||||||||
The following tables present the compensation for base year 2022:
|
| Board of Directors | ||||||||||||
| ILP Global CRDIV 2015 | ILP DTA 2019 | DEFERRAL 6th Cycle | DEFERRAL 7th Cycle | DEFERRAL 8th Cycle | DEFERRAL 9th Cycle | DEFERRAL 10th Cycle | DEFERRAL 11th Cycle | DEFERRAL 12th Cycle | DEFERRAL 13th Cycle | |||
| Number of members | 9 | |||||||||||
| Number of paid members | 6 | |||||||||||
| Grant of shares | ||||||||||||
| Date of grant | Mar /20 | Mar /20 | Feb/22 | |||||||||
| Number of shares granted | - | 51.483 | - | - | - | - | - | - | - | - | ||
| Maximum deadline for delivery of shares | Mar /20 | Mar /23 | Mar /22 | |||||||||
| Period of restriction on the transfer of shares | 1 year | |||||||||||
| Fair value of shares on the date of grant | R$ 18.56 | €3.67 | R$ 32.00 | |||||||||
| Multiplication of the number of shares granted by the fair value of the shares on the date granted | - | € 188,943 | - | - | - | - | - | - | - | - | ||
|
| Executive Board | ||||||||||||||||||
| ILP Global CRDIV 2015 | ILP DTA 2019 | DEFERRAL 6th Cycle | DEFERRAL 7th Cycle | DEFERRAL 8th Cycle | DEFERRAL 9th Cycle | DEFERRAL 10th Cycle | DEFERRAL 11th Cycle | DEFERRAL 12th Cycle | DEFERRAL 13th Cycle | |||||||||
| Number of members | 50 | |||||||||||||||||
| Number of paid members | 50.3 | |||||||||||||||||
| Grant of shares | ||||||||||||||||||
| Date of grant | Mar /20 | Mar /20 | Feb/22 | |||||||||||||||
| Number of shares granted | - | 51,483 | - | 43,403 | 37,072 | 148,539 | 274,914 | 275,112 | 1,938,289 | - | ||||||||
| Maximum deadline for delivery of shares | Mar /20 | Mar /23 | Mar /22 | |||||||||||||||
| Period of restriction on the transfer of shares | 1 year | |||||||||||||||||
| Fair value of shares on the date of grant | R$ 18.56 | €3.67 | R$ 32.00 | |||||||||||||||
| Multiplication of the number of shares granted by the fair value of the shares on the date granted | - | € 188,943 | - | R$ 1,388,889 | R$ 1,186,298 | R$ 4,753,259 | R$ 8,797,250 | R$ 8,803,591 | R$ 62,025,250 | - | ||||||||
|
The following tables present the compensation for base year 2021:
| Board of Directors | |||||||||||||||||||
| ILP Global CRDIV 2015 | ILP DTA 2019 | DEFERRAL 6th Cycle | DEFERRAL 7th Cycle | DEFERRAL 8th Cycle | DEFERRAL 9th Cycle | DEFERRAL 10th Cycle | DEFERRAL 11th Cycle | DEFERRAL 12th Cycle | DEFERRAL 13th Cycle | ||||||||||
| Number of members | 12 | ||||||||||||||||||
| Number of paid members | 5.6 | ||||||||||||||||||
| Grant of shares | |||||||||||||||||||
| Date of grant | Mar /20 | Mar /20 | Feb/21 | ||||||||||||||||
| Number of shares granted | - | - | - | - | - | - | - | - | - | - | |||||||||
| Maximum deadline for delivery of shares | Mar /20 | Mar /23 | Mar /21 | ||||||||||||||||
| Period of restriction on the transfer of shares | 1 year | ||||||||||||||||||
| Fair value of shares on the date of grant | R$ 18.56 | €3.67 | R$ 42.56 | ||||||||||||||||
| Multiplication of the number of shares granted by the fair value of the shares on the date granted | - | - | - | - | - | - | - | - | - | - | |||||||||
|
| Executive Board | ||||||||||||
| ILP Global CRDIV 2015 | ILP DTA 2019 | DEFERRAL 6th Cycle | DEFERRAL 7th Cycle | DEFERRAL 8th Cycle | DEFERRAL 9th Cycle | DEFERRAL 10th Cycle | DEFERRAL 11th Cycle | DEFERRAL 12th Cycle | DEFERRAL 13th Cycle | |||
| Number of members | 50 | |||||||||||
| Number of paid members | 45.2 | |||||||||||
| Grant of shares | ||||||||||||
| Date of grant | Mar /20 | Mar /20 | Feb/21 | |||||||||
| Number of shares granted | - | 69,287 | 135,873 | 61,238 | 155,833 | 200,161 | 238,606 | 995,305 | - | - | ||
| Maximum deadline for delivery of shares | Mar /20 | Mar /23 | Mar /21 | |||||||||
| Period of restriction on the transfer of shares | 1 year | |||||||||||
| Fair value of shares on the date of grant | R$ 18.56 | €3.67 | R$ 42.56 | |||||||||
| Multiplication of the number of shares granted by the fair value of the shares on the date granted | - | € 254,283 | R$ 5,782,743 | R$ 2,606,278 | R$ 6,632,235 | R$ 8,518,838 | R$ 10,155,055 | R$ 42,360,169 | - | - | ||
|
The following tables present the compensation for base year 2020:
| Board of Directors | ||||||||||||
| ILP Global CRDIV 2015 | ILP DTA 2019 | DEFERRAL 6th Cycle | DEFERRAL 7th Cycle | DEFERRAL 8th Cycle | DEFERRAL 9th Cycle | DEFERRAL 10th Cycle | DEFERRAL 11th Cycle | DEFERRAL 12th Cycle | DEFERRAL 13th Cycle | |||
| Number of members | 9 | |||||||||||
| Number of paid members | 4.8 | |||||||||||
| Grant of shares | ||||||||||||
| Date of grant | Mar /20 | - | Feb/20 | |||||||||
| Number of shares granted | 32,046 | - | 23,165 | 8,759 | 11,443 | 8,499 | 51,842 | - | - | - | ||
| Maximum deadline for delivery of shares | Mar /20 | - | Mar /20 | |||||||||
| Period of restriction on the transfer of shares | 1 year | |||||||||||
| Fair value of shares on the date of grant | R$ 18.56 | €3.67 | R$ 44.42 | |||||||||
| Multiplication of the number of shares granted by the fair value of the shares on the date granted | R$ 594,741 | - | R$ 1,028,999 | R$ 389,070 | R$ 508,314 | R$ 377,512 | R$ 2,302,800 | - | - | - | ||
|
| Executive Board | ||||||||||||||||||
| ILP Global CRDIV 2015 | ILP DTA 2019 | DEFERRAL 6th Cycle | DEFERRAL 7th Cycle | DEFERRAL 8th Cycle | DEFERRAL 9th Cycle | DEFERRAL 10th Cycle | DEFERRAL 11th Cycle | DEFERRAL 12th Cycle | DEFERRAL 13th Cycle | |||||||||
| Number of members | 45 | |||||||||||||||||
| Number of paid members | 39 | |||||||||||||||||
| Grant of shares | ||||||||||||||||||
| Date of grant | Mar /20 | Mar /20 | Feb/20 | |||||||||||||||
| Number of shares granted | 360,586 | 69,287 | 109,390 | 185,720 | 221,408 | 180,192 | 911,380 | - | - | - | ||||||||
| Maximum deadline for delivery of shares | Mar /20 | Mar /23 | Mar/20 | |||||||||||||||
| Period of restriction on the transfer of shares | 1 year | |||||||||||||||||
| Fair value of shares on the date of grant | R$ 18.56 | €3.67 | R$ 44.42 | |||||||||||||||
| Multiplication of the number of shares granted by the fair value of the shares on the date granted | R$ 6,692,102 | € 254,283 | R$ 4,859,091 | R$ 8,249,672 | R$ 9,834,928 | R$ 8,004,147 | R$ 40,483,517 | - | - | - | ||||||||
|
8.11 Shares delivered
In relation to the shares delivered related to the share-based remuneration of the board of directors and the statutory executive board, in the last 3 fiscal years, prepare a table with the following content:
a. organ
b. total number of members
c. number of paid members
d. number of shares
e. weighted average purchase price
f. weighted average market price of acquired shares
g. multiplication of the total shares acquired by the difference between the weighted average purchase price and the weighted average market price of the acquired shares
Not applicable
|
8.12 Summary description of the information necessary for understanding the data disclosed in paragraphs 8.5 to 8.11, such as the explanation of the method of pricing the value of shares and options:
| A. | Global Program |
| a. | Pricing model |
The pricing model is based on the Local Volatility model or Dupire model, which allows simultaneous calibration of all quoted European options. In addition to this model there is an extension to deal with uncertainty in dividends, where part of the dividend value is considered confirmed, and the rest is linked to the performance of the underlying. This extended model is integrated into a PDE engine, which numerically solves the corresponding stochastic differential equation to calculate the expected value of the product.
b. Data and assumptions used in the pricing model, including weighted average share price, exercise price, expected volatility, option lifetime, expected dividends, and risk-free interest rate
| · | The weighted average share price (and strike price) is €3,104 based on the 15-day weighted average between 01/07/2022 and 01/27/2022 |
| · | The expected volatility used was 33.80 |
| · | Options expire on 01/02/2030 |
| · | Expected dividends range from approximately 6.6 cents in the short term (2022) to approximately 5.75 cents per share per year in the long term (2030). |
| · | The discount curve used gives a discount of 0.96 for 2030 |
The strike price, in all cycles and if the objectives set out in the regulations are achieved, will be the market price on the date of the exercise.
c. Method used and the assumptions assumed to incorporate the expected effects of anticipated exercise
Not applicable, since the model does not allow early exercise.
| d. | How to determine expected volatility |
Estimated based on historical volatility for the respective term.
|
e. Whether any other features of the option have been incorporated into the measurement of its fair value
It does not apply, since no other features of the option have been incorporated into the measurement of its fair value.
| B. | Local Program |
Not applicable to the Local Long-Term Incentive Plans and Deferment, since they have as their object the payment, in Units, of part of the Variable Remuneration owed by the Company to the participants, under the terms of its remuneration policy.
|
8.13. Inform the number of shares, quotas and other securities convertible into shares or quotas, issued, in Brazil or abroad, by the issuer, its direct or indirect controllers, controlled companies or under common control, which are held by members of the board of directors, the statutory board or the fiscal council, grouped by body.
| Company Name: Banco Santander (Brasil) S.A. | ||||
| Board of Directors | ||||
| Final Balance | ||||
| Securities/ Derivatives | Characteristics of the Titles | Quantity | % share | |
| Same Species/Class | Total | |||
| Shares | Ordinary | 2 | 0,00% | 0 |
| Shares | Preferred | - | 0,00% | 0 |
| Shares | Units | 1.703.653 | 0,00% | 0 |
| Company Name: Banco Santander (Brasil) S.A. | ||||
| Board of directors | ||||
| Final Balance | ||||
| Securities/ Derivatives | Characteristics of the Titles | Quantity | % share | |
| Same Species/Class | Total | |||
| Shares | Ordinary | 514 | 0,00% | 0 |
| Shares | Preferred | 515 | 0,00% | 0 |
| Shares | Units | 4.167.004 | 0,00% | 0 |
Base date: 31.12.2022
(*) includes balance of persons assimilated
|
8.14 Pension plans in force granted to the members of the Board of Directors and to the statutory officers.
Currently the biggest plan is SantanderPrevi, a plan that since July 2018 has been closed to new members. As of January 2018, the SBPrev Pension Plan was implemented for new employees/administrators and new memberships.
Participation in the SBPrev Pension Plan is optional and the participant's monthly contribution will be equivalent to 2% of the Salary* (limited to 13 UPs = R$ 8,184.02) + 2% to 9% (to be chosen) of the salary minus 13 UPs.
To this amount will be added a contribution amount made by the Company itself (called matching or counterpart) that varies from 100% to 150% according to the time of participation in the plan.
As of March 2018, the SantanderPlus Pension Plan was implemented, which, like SantanderPrevi, provides future complementary income. This plan is restricted to the group of executives who are part of the "SantanderPlus" Collective. Participation is optional and the contribution is annual, limited to 12 salaries, with a counterpart of 100% to 125% made by Santander Brasil, according to the time in the plan.
An executive participated, until the end of 2021, in a Free Benefit Generating Plan – PGBL, instituted by the Company with Zurich Santander, in which the company assumes the Cost of the Company's Basic Account, with the contribution amount defined according to a percentage of the portion of the Applicable Salary.
In the table below we provide the amounts contributed to the supplementary pension plans in 2022.
| TOTAL | ||
| Board of Directors | Statutory Board of Directors | |
| Total number of members | 10 | 50 |
| Number of members | 0 | 42 |
| Plan name | Santanderprevi Retirement Plan + SBPREV | Santanderprevi Retirement Plan + SBPREV |
| Number of directors who are able to retire | does not apply | does not apply |
| Conditions for early retirement | does not apply | does not apply |
| Updated cumulative value of the contributions accumulated until the end of the last fiscal year, minus the portion related to the contributions made directly by the managers | 0 | 231,376,842 |
| Total accumulated value of contributions made during the last fiscal year, minus the portion related to contributions made directly by the managers | 0 | 47,788,050 |
| Possibility of early redemption and conditions | does not apply | does not apply |
The amount accumulated on December 31, 2022 comprises the balance of the amounts contributed even if redeemed until the said date.
|
8.15 Maximum, minimum and average individual remuneration of the Board of Directors, the Statutory Executive Board and the Fiscal Council.
| Executive Board | Board of Directors |
Fiscal Council
| ||||||||||||
| 31/12/2022 | 31/12/2021 | 31/12/2020 | 31/12/2022 | 31/12/2021 | 31/12/2020 | 31/12/2022 | 31/12/2021 | 31/12/2020 | ||||||
| Number of members | 50.0 | 50.0 | 45.0 | 10.0 | 12.0 | 9.0 | 6.0 | 6.0 | 6.0 | |||||
| Number of paid members | 50.3 | 45.2 | 39.0 | 5.0 | 5.6 | 4.8 | 3.0 | 3.0 | 3.0 | |||||
| Value of the highest remuneration (Reais) | 21,122,291.48 | 59,029,586.25 | 46,953,181.92 | 11,559,693.20 | 2,129,585.07 | 1,802,918.40 | 176,179.50 | 142,710.00 | 139,600.00 | |||||
| Amount of the lowest remuneration (Reais) | 2,407,487.32 | 2,098,466.40 | 1,791,418.04 | 805,000.00 | 762,000.00 | 762,000.00 | 176,179.50 | 142,710.00 | 139,600.00 | |||||
| Average value of remuneration (Reais) | 6,080,294.50 | 7,674,778.20 | 6,495,886.87 | 3,014,657.47 | 1,064,162.32 | 1,037,445.25 | 176,179.50 | 149,901.00 | 139,600.00 | |||||
| Charges of the highest remuneration (Reais) | 1,593,625.01 | 3,856,725.00 | 3,856,725.00 | 2,680,162.64 | 478,500.00 | 405,000.00 | 32,359.50 | 32,109.75 | 31,410.00 | |||||
| Charges of the lowest remuneration (Reais) | 248,880.00 | 231,900.49 | 231,900.49 | 181,125.00 | 171,450.00 | 171,450.00 | 32,359.50 | 32,109.75 | 31,410.00 | |||||
| Board of Directors / Statutory Executive Board / Fiscal Council | |
| 31/12/2022 | (i) The value of the lowest individual remuneration disregards members who have not performed their duties in the 12-month period of the fiscal year in question; and (ii) The figures do not take into account social charges. |
| 31/12/2021 | (i) The value of the lowest individual remuneration disregards members who have not performed their duties in the 12-month period of the fiscal year in question; and (ii) The figures do not take into account social charges. |
| 31/12/2020 | (i) The value of the lowest individual remuneration disregards members who have not performed their duties in the 12-month period of the fiscal year in question; and (ii) The figures do not take into account social charges. |
|
8.16. Describe contractual arrangements, insurance policies or other instruments that structure compensation or indemnification mechanisms for managers in the event of removal from office or retirement, indicating the financial consequences for the issuer
Most of the directors have entered into a garden leave agreement with us, which stipulates that executives will be obliged for a period of three months after the dismissal not to exercise any professional activity in any other company or financial institution, upon payment, by us, of a consideration. This obligation will apply whenever the termination of the executive is voluntary and, in the case of involuntary dismissal, it will be at our discretion to pay such compensation. The consideration corresponds to up to 180 days of the executive's fixed monthly salary, as compensation.
We have a D&O Civil Liability insurance policy (Directors & Officers), renewed annually, in order to guarantee its directors and managers the payment of indemnities arising from claims that require the reparation of damages caused to third parties or to us by virtue of the exercise of their functions. The total amount of insurance premiums paid in 2022 was R$ 3,059,793.52 and the corresponding amount for the year 2023 is not yet fixed.
Pursuant to the approval of our board of directors at the meeting held on December 23, 2009, we indemnify our directors, executive officers and members of the Audit Committee in actions related to the positions held by them, exclusively for procedural or administrative costs and attorneys' fees, except in cases of serious fault or intent and/or abuse of power and/or in disagreement with the Bylaws and our internal rules. This indemnification letter has also been issued to the members of the Audit Committee and the compensation committee and reflects the terms of the D&O Civil Liability insurance policy mentioned in the preceding paragraph.
There are no contractual arrangements, insurance policies or other instruments that structure compensation or indemnification mechanisms for managers in the event of removal from office or retirement.
|
8.17. In relation to the last 3 fiscal years and the forecast for the current fiscal year, indicate the percentage of the total remuneration of each body recognized in the result of the issuer referring to members of the board of directors, the statutory board or the fiscal council that are parties related to the controllers, direct or indirect, as defined by the accounting rules that deal with this matter.
Not applicable
|
8.18. In relation to the last 3 fiscal years and the forecast for the current fiscal year, indicate the amounts recognized in the result of the issuer as remuneration of members of the board of directors, the statutory board or the fiscal council, grouped by body, for any reason other than the function they occupy, such as commissions and consulting or advisory services provided
It does not apply, given that there is no value recognized in the result as remuneration received by our members of the Board of Directors, the Statutory Executive Board or the Fiscal Council, in the last three fiscal years, other than due to the position they occupy.
|
8.19 In relation to the last 3 fiscal years and the forecast for the current fiscal year, indicate the amounts recognized in the results of controllers, direct or indirect, companies under common control and subsidiaries of the issuer, such as remuneration of members of the board of directors, the statutory board or the fiscal council of the issuer, grouped by body, specifying under what title such values were assigned to such individuals
| Social Fiscal Year 2022 | Board of Directors | Statutory Board of Directors | Fiscal Council | Total |
| Direct and indirect controllers | 19,981,775 EUR | 0 | 0 | 10,034,509 EUR |
| Issuer Subsidiaries | 0 | 0 | 0 | 0 |
| Societies under common control | 0 | 0 | 0 | 0 |
| Social Fiscal Year 2021 | Board of Directors | Statutory Board of Directors | Fiscal Council | Total |
| Direct and indirect controllers | 19,981,775 EUR | 0 | 0 | 10,034,509 EUR |
| Issuer Subsidiaries | 0 | 0 | 0 | 0 |
| Societies under common control | 0 | 0 | 0 | 0 |
| Social Fiscal Year 2020 | Board of Directors | Statutory Board of Directors | Fiscal Council | Total |
| Direct and indirect controllers | 10,034,509 EUR | 0 | 0 | 10,034,509 EUR |
| Issuer Subsidiaries | 0 | 0 | 0 | 0 |
| Societies under common control | 0 | 0 | 0 | 0 |
|
8.20. Provide other information that the issuer deems relevant:
There is no other information that we consider relevant.
SIGNATURE
Pursuant to the requirements of the Securities Exchange Act of 1934, the Registrant has duly caused this report to be signed on its behalf by the undersigned, thereto duly authorized.
Date: March 27, 2023
Banco Santander (Brasil) S.A. | ||
| By: | /S/ Andrea Marques de Almeida | |
Andrea Marques de Almeida Executive Vice-President | ||
| By: | /S/ Gustavo Alejo Viviane | |
Gustavo Alejo Viviane Vice - President Executive Officer | ||