Use these links to rapidly review the document
TABLE OF CONTENTS
INDEX TO CONSOLIDATED FINANCIAL STATEMENTS
Table of Contents
UNITED STATES
SECURITIES AND EXCHANGE COMMISSION
Washington, D.C. 20549
Form 10-K
| | |
| (Mark One) | | |
ý |
|
ANNUAL REPORT PURSUANT TO SECTION 13 OR 15(d) OF THE SECURITIES EXCHANGE ACT OF 1934 |
For the fiscal year ended December 31, 2009 |
OR |
o |
|
TRANSITION REPORT PURSUANT TO SECTION 13 OR 15(d) OF THE SECURITIES EXCHANGE ACT OF 1934 |
For the transition period from to
|
Commission File Number 001-34579
Cobalt International Energy, Inc.
(Exact name of registrant as specified in its charter)
| | |
Delaware
(State or other jurisdiction of
incorporation or organization) | | 27-0821169
(I.R.S. Employer
Identification No.) |
Two Post Oak Central
1980 Post Oak Boulevard, Suite 1200
Houston, TX 77056
(Address of principal executive offices, including zip code)
(713) 579-9100
(Registrant's telephone number, including area code)
Securities registered pursuant to Section 12(b) of the Securities Act:
| | |
| Title of Each Class | | Name of Each Exchange on Which Registered |
|---|
| Common stock, $0.01 par value | | The New York Stock Exchange |
Securities registered pursuant to Section 12(g) of the Securities Act:None
Indicate by check mark if the registrant is a well-known seasoned issuer, as defined in Rule 405 of the Securities Act. Yes o No ý
Indicate by check mark if the registrant is not required to file reports pursuant to Section 13 or Section 15(d) of the Securities Act. Yes o No ý
Indicate by check mark whether the registrant (1) has filed all reports required to be filed by Section 13 or 15(d) of the Securities Exchange Act of 1934 during the preceding 12 months (or for such shorter period that the registrant was required to file such reports), and (2) has been subject to such filing requirements for the past 90 days. Yes ý No o
Indicate by check mark whether the registrant has submitted electronically and posted on its corporate Web site, if any, every Interactive Data File required to be submitted and posted pursuant to Rule 405 of Regulation S-T (§ 232.405 of this chapter) during the preceding 12 months (or for such shorter period that the registrant was required to submit and post such files). Yes o No ý
Indicate by check mark if disclosure of delinquent filers pursuant to Item 405 of Regulation S-K is not contained herein, and will not be contained, to the best of registrant's knowledge, in definitive proxy or information statements incorporated by reference in Part III of this Form 10-K or any amendment to this Form 10-K. ý
Indicate by check mark whether the registrant is a large accelerated filer, an accelerated filer, a non-accelerated filer, or a smaller reporting company. See the definitions of "large accelerated filer," "accelerated filer," and "smaller reporting company" in Rule 12b-2 of the Exchange Act. (Check one):
| | | | | | |
| Large accelerated filer o | | Accelerated filer o | | Non-accelerated filer ý
(Do not check if a
smaller reporting company) | | Smaller reporting company o |
Indicate by check mark whether the registrant is a shell company (as defined in Rule 12b-2 of the Securities Act). Yes o No ý
As of June 30, 2009, the last business day of the registrant's most recently completed second fiscal quarter, the registrant's common stock was not listed on any domestic exchange or over-the-counter market. The registrant's common stock began trading on the New York Stock Exchange on December 16, 2009. As of December 31, 2009, the aggregate market value of the registrant's common stock held by non-affiliates was approximately $1,392 million based on the closing price of the registrant's common stock on the New York Stock Exchange on December 31, 2009.
As of March 29, 2010, the registrant had 356,594,544 shares of common stock outstanding.
DOCUMENTS INCORPORATED BY REFERENCE
Portions of the registrant's proxy statement relating to the 2010 Annual Meeting of Shareholders, to be filed within 120 days of the end of the fiscal year covered by this report, are incorporated by reference into Part III of this Annual Report on Form 10-K.
Table of Contents
Cobalt International Energy, Inc.
| | | | | | |
Item
No. | |
| | Page
No. | |
|---|
PART I
|
|
1 | | Business | | | 2 | |
1A | | Risk Factors | | | 40 | |
1B | | Unresolved Staff Comments | | | 53 | |
2 | | Properties | | | 53 | |
3 | | Legal Proceedings | | | 53 | |
4 | | (Removed and Reserved) | | | 53 | |
PART II
|
|
5 | | Market for the Registrant's Common Equity, Related Stockholder Matters and Issuer Purchases of Equity Securities | | | 54 | |
6 | | Selected Financial Data | | | 55 | |
7 | | Management's Discussion and Analysis of Financial Condition and Results of Operations | | | 57 | |
7A | | Quantitative and Qualitative Disclosures About Market Risk | | | 70 | |
8 | | Financial Statements and Supplementary Data | | | 71 | |
9 | | Changes in and Disagreements with Accountants on Accounting and Financial Disclosure | | | 71 | |
9A | | Controls and Procedures | | | 71 | |
9B | | Other Information | | | 71 | |
PART III
|
|
10 | | Directors, Executive Officers and Corporate Governance | | | 71 | |
11 | | Executive Compensation | | | 71 | |
12 | | Security Ownership of Certain Beneficial Owners and Management Related Stockholder Matters | | | 72 | |
13 | | Certain Relationships and Related Transactions, and Director Independence | | | 72 | |
14 | | Principal Accountant Fees and Services | | | 72 | |
| | Glossary of Selected Oil and Gas Terms | | |
73 | |
PART IV
|
|
15 | | Exhibits and Financial Statement Schedules | | | 78 | |
| | Signatures | | | 81 | |
Table of Contents
PART I
Cautionary Note Regarding Forward-Looking Statements
This Annual Report on Form 10-K contains estimates and forward-looking statements, principally in "Business," "Risk Factors," and "Management's Discussion and Analysis of Financial Condition and Results of Operations." Our estimates and forward-looking statements are mainly based on our current expectations and estimates of future events and trends, which affect or may affect our businesses and operations. Although we believe that these estimates and forward-looking statements are based upon reasonable assumptions, they are subject to several risks and uncertainties and are made in light of information currently available to us. Many important factors, in addition to the factors described in this Annual Report on Form 10-K, may adversely affect our results as indicated in forward-looking statements. You should read this Annual Report on Form 10-K and the documents that we have filed as exhibits hereto completely and with the understanding that our actual future results may be materially different from what we expect.
Our estimates and forward-looking statements may be influenced by the following factors, among others:
- •
- uncertainties inherent in making estimates of our oil and natural gas data;
- •
- the volatility of oil prices;
- •
- discovery and development of oil reserves;
- •
- projected and targeted capital expenditures and other costs, commitments and revenues;
- •
- current and future government regulation of the oil and gas industry;
- •
- changes in environmental laws or the implementation of those laws;
- •
- termination of or intervention in concessions, rights or authorizations granted by the United States, Angolan and Gabonese governments to us;
- •
- competition;
- •
- our ability to find, acquire or gain access to other prospects and to successfully develop our current prospects;
- •
- the successful implementation of our and our partners' prospect development and drilling plans;
- •
- the availability and cost of drilling rigs, production equipment, supplies, personnel and oilfield services;
- •
- the availability and cost of developing appropriate infrastructure around and transportation to our prospects;
- •
- military operations, terrorist acts, wars or embargoes;
- •
- the ability to obtain financing;
- •
- our dependence on our key management personnel and our ability to attract and retain qualified personnel;
- •
- our vulnerability to severe weather events, especially tropical storms and hurricanes in the U.S. Gulf of Mexico;
- •
- the cost and availability of adequate insurance coverage; and
- •
- other risk factors discussed in the "Risk Factors" section of this Annual Report on Form 10-K.
The words "believe," "may," "will," "aim," "estimate," "continue," "anticipate," "intend," "expect," "plan" and similar words are intended to identify estimates and forward-looking statements. Estimates and forward-looking statements speak only as of the date they were made, and, except to the extent required by law, we undertake no obligation to update or to review any estimate and/or forward-looking statement because of new information, future events or other factors. Estimates and forward-looking statements involve risks and uncertainties and are not guarantees of future performance. As a result of the risks and uncertainties described above, the estimates and forward-looking statements discussed in this Annual Report on Form 10-K might not occur and our future
Table of Contents
results and our performance may differ materially from those expressed in these forward-looking statements due to, including, but not limited to, the factors mentioned above. Because of these uncertainties, you should not place undue reliance on these forward-looking statements.
Item 1. Business
Overview
We are an independent, oil-focused exploration and production company with a world-class below salt prospect inventory in the deepwater of the U.S. Gulf of Mexico and offshore Angola and Gabon in West Africa. We were formed in late 2005 by experienced industry executives and private equity investors who believed that a team of veteran explorationists, equipped with industry-leading data, newly available seismic technologies, industry contacts and adequate funding, could acquire a deepwater prospect inventory that would rival the supermajor oil companies. After considering numerous global oil-producing regions in which to focus our exploration and development efforts, we selected the deepwater U.S. Gulf of Mexico and offshore Angola and Gabon due to the largely unrealized hydrocarbon potential offered by below salt horizons within these regions. We believe that we have been successful in assembling such an inventory and that our asset portfolio would be very difficult to replicate. In December 2009, we completed our initial public offering, which together with a concurrent private offering and the exercise by the underwriters of their overallotment option yielded gross proceeds of $1 billion, and we became a listed company on the New York Stock Exchange. We believe that we are well-positioned, through our prospect maturation efforts, active drilling program, long-term strategic alliances with key industry participants and with the proceeds from our initial public offering, to unlock the potential of and de-risk our prospects on an accelerated basis.
Primarily through our highly targeted leasing strategy, which was the result of an in-depth, multi-year study of potential regional hydrocarbon accumulations within the deepwater U.S. Gulf of Mexico and select regions offshore West Africa, we have established a current portfolio of 134 identified, well-defined prospects, comprised of 48 prospects located in the deepwater U.S. Gulf of Mexico and 86 prospects located in Blocks 9 and 21 offshore Angola and the Diaba Block offshore Gabon. All of our prospects are oil-focused.
Our prospect inventory as of December 31, 2009 is summarized in the table below:
| | | | | | | | | | |
| | Identified
Prospects(1) | | Identified Prospects
on which an Initial
Exploratory Well is
Expected to be Spud
by End of 2012(1) | |
|---|
U.S. Gulf of Mexico | | | | | | | |
| | Miocene | | | | | | | |
| | | Tahiti Basin | | | 3 | | | 3 | |
| | | Adjacent Miocene | | | 18 | | | 4 | |
| | Inboard Lower Tertiary(2) | | | 21 | | | 6 | |
| | Dual Miocene and inboard Lower Tertiary | | | 6 | | | 2 | |
| | | | | | |
| | | | U.S. Gulf of Mexico subtotal | | | 48 | | | 15 | |
West Africa | | | | | | | |
| | Angola(3) | | | 42 | | | 5 | |
| | Gabon | | | 44 | | | 2 | |
| | | | | | |
| | | | West Africa subtotal | | | 86 | | | 7 | |
| | | | | | |
Total Portfolio | | | 134 | | | 22 | |
| | | | | | |
- (1)
- See "Risk Factors—We have no proved reserves and areas that we decide to drill may not yield oil in commercial quantities or quality, or at all," "Risk Factors—Our identified drilling locations are scheduled out over several years, making them susceptible to uncertainties that could materially alter the occurrence or timing of their drilling," and "—How We Identify and Analyze Prospects."
2
Table of Contents
- (2)
- What we refer to as the inboard Lower Tertiary is an emerging trend located to the northwest of existing outboard Lower Tertiary fields such as St. Malo, Jack and Cascade. Based on the drilling results of Shenandoah #1, we believe that discoveries in the inboard Lower Tertiary will exhibit meaningfully better reservoir characteristics than had previously been encountered by the industry in the outboard Lower Tertiary.
- (3)
- On February 24, 2010, we executed Risk Services Agreements for Blocks 9 and 21 offshore Angola which converted the contractual rights we acquired in such blocks in 2007 into licenses to explore for, develop and produce oil from these blocks. We also have retained contractual rights with respect to one additional block offshore Angola. This table excludes the additional block.
Strategic Relationships
On April 6, 2009, we announced a long-term alliance with TOTAL E&P USA, INC. ("TOTAL") in which, through a series of transactions, we combined our respective U.S. Gulf of Mexico exploratory lease inventory (which excludes the Heidelberg portion of our Ligurian/Heidelberg prospect, our Shenandoah prospect, and all developed or producing properties held by TOTAL in the U.S. Gulf of Mexico) through the exchange of a 40% interest in our leases for a 60% interest in TOTAL's leases, resulting in a current combined alliance portfolio covering 215 blocks. We will act as operator on behalf of the alliance through the exploration and appraisal phases of development. As part of the alliance, TOTAL committed, among other things, to (i) provide a 5th generation deepwater rig to drill a mandatory five-well program on existing Cobalt-operated blocks, (ii) pay up to $300 million to carry a substantial share of Cobalt's costs with respect to this five-well program (above the amounts TOTAL has agreed to pay as owner of a 40% interest), (iii) pay an initial amount of approximately $280 million primarily as reimbursement of our share of historical costs in our contributed properties and consideration under purchase and sale agreements, (iv) pay 40% of the general and administrative costs relating to our operations in the U.S. Gulf of Mexico during the 10-year alliance term, and (v) award us up to $180 million based on the success of the alliance's initial five-well program, in all cases subject to certain conditions and limitations. Additionally, as part of the alliance, we formed a U.S. Gulf of Mexico-wide area of mutual interest with TOTAL, whereby each party has the right to participate in any oil and natural gas lease interest acquired by the other party within this area.
On April 22, 2009, we announced a partnership in the U.S. Gulf of Mexico with the national oil company of Angola, Sociedade Nacional de Combustíveis de Angola—Empresa Pública ("Sonangol"), pursuant to an agreement we had entered into with Sonangol immediately following the 2008 MMS Central Gulf of Mexico Lease Sale, whereby they acquired a 25% non-operated interest of our pre-TOTAL alliance interests in 11 of our U.S. Gulf of Mexico leases. The price Sonangol paid us for this interest was calculated using the price we paid for these leases plus $10 million to cover our historical seismic and exploration costs. Additionally, as part of the partnership, we formed an area of mutual interest with Sonangol covering a subset of the U.S. Gulf of Mexico, whereby each party has the right to participate in any oil and natural gas lease interest acquired by the other party within this area until mid-May 2010. This transaction is notable as it represents Sonangol's initial entry into the North American exploration and production sector.
Drilling Results
As of March 29, 2010, we have drilled as operator two exploratory wells (Ligurian #1 and Criollo #1) and participated as non-operator in three exploratory wells (Heidelberg #1, Shenandoah #1 and Firefox #1) and one appraisal well (Heidelberg #2), of which Firefox #1 and Heidelberg #2 are currently being drilled.
3
Table of Contents
Heidelberg #1, Ligurian #1 and Heidelberg #2. On February 2, 2009, we announced that the Heidelberg #1 well had encountered more than 200 feet of net pay thickness in the Miocene horizons. Located in approximately 5,200 feet of water in Green Canyon 859 within the Tahiti Basin Miocene trend, this well was drilled to approximately 30,000 feet. Anadarko Petroleum Corporation ("Anadarko") operates the block and we hold a 9.375% working interest. We purchased our interest in Green Canyon 859 and 903 (the "Heidelberg blocks") from an existing owner in May 2008 after we successfully acquired 100% of the working interest in the adjacent blocks of Green Canyon 813, 814 and 858 (the "Ligurian blocks") in the 2008 MMS Central Gulf of Mexico Lease Sale.
On July 16, 2009, we spud Ligurian #1 on Green Canyon 858 to target the upper- and middle-Miocene horizons. On October 28, 2009, we and our partners decided to temporarily cease drilling operations on Ligurian #1 having encountered operational difficulties when drilling below salt through an unforeseen geologic formation before reaching total depth or testing the targeted horizons. We did encounter oil in the wellbore above the targeted horizons, but believe further drilling operations will be required to adequately test the prospect. Since ceasing drilling operations, we have been evaluating the significant amount of new information that we have gathered from Ligurian #1, including results from the reprocessing of seismic data. We expect to resume exploratory activity on the Ligurian blocks during the third quarter of 2010.
On February 17, 2010, the Heidelberg #2 appraisal well was spud by Anadarko in approximately 5,300 feet of water in Green Canyon 903. This well is currently drilling towards a targeted depth of approximately 31,500 feet.
Shenandoah #1. On February 4, 2009, we announced that the Shenandoah #1 well had been drilled into Lower Tertiary horizons. Anadarko, as operator, has stated that this well encountered approximately 300 feet of net pay thickness. This well, located in approximately 5,750 feet of water in Walker Ridge 52, was drilled to approximately 30,000 feet. Anadarko operates the block and we hold a 20% working interest. We strategically purchased our interest in Shenandoah #1 to test our hypothesis that targeting the previously undrilled inboard Lower Tertiary, which we regard as an emerging trend located to the northwest of existing outboard Lower Tertiary fields such as St. Malo, Jack and Cascade, would lead to discoveries that exhibit meaningfully better reservoir characteristics than had previously been encountered by the industry in the outboard Lower Tertiary. We believe the successful results of the Shenandoah #1 well support our hypothesis.
Criollo #1. On January 29, 2010, we announced that we had reached a planned total depth of approximately 31,000 feet in the Criollo exploration sidetrack well located in approximately 4,200 feet of water in Green Canyon 685 within the Tahiti Basin Miocene trend. The original well encountered 55 feet of net pay thickness in Miocene horizons and the sidetrack encountered 73 feet of net pay thickness in correlative reservoirs. Both the original well and the sidetrack encountered structural complexities associated with salt, which prevented the testing of the entire prospective interval. We have suspended operations on the well and we are conducting a detailed review of the well data and reprocessing the existing 3-D pre-stack depth seismic data so that we and our partner can determine the next appropriate steps. We refer to the sidetrack well and the original well as the Criollo #1 exploratory well. We hold a 60% working interest in this prospect.
Firefox #1. On February 10, 2010, the Firefox #1 exploratory well was spud by BHP Billiton Petroleum (GOM) Inc. ("BHP") in approximately 4,400 feet of water in Green Canyon 817 within the Tahiti Basin Miocene trend and approximately six miles northeast of the Heidelberg discovery. This well is currently drilling towards a targeted measured depth of approximately 34,000 feet. We hold a 30% working interest in this prospect.
4
Table of Contents
Drilling Rigs
We have entered into a two-year drilling contract with a subsidiary of ENSCO International Incorporated ("ENSCO"), which may be extended to up to four years at our option, for the use of the ENSCO 8503 deepwater 5th generation semi-submersible drilling rig in our exploration and development efforts in the U.S. Gulf of Mexico. We expect to take delivery of the ENSCO 8503 drilling rig, which is currently under construction, in the fourth quarter of 2010. We expect to be able to drill at least two wells with the ENSCO 8503 during the initial two year term of this agreement and at least two additional wells should we extend the contract. The lease for the ENSCO 8503 drilling rig has an aggregate rate for the first two years of the contract of approximately $372 million, representing a base operating rate of $510,000 per day, subject to adjustment.
On March 8, 2010, we entered into a Rig Assignment Agreement with Anadarko providing for the assignment to Cobalt of the Ocean Monarch drilling rig. We plan to use the Ocean Monarch to drill our North Platte #1 exploratory well. We expect Anadarko to make the Ocean Monarch available to us on or about May 1, 2010, depending upon when the current assignee of the Ocean Monarch concludes its designated drilling operations. We committed to use the Ocean Monarch for a minimum of 75 days at a day rate of approximately $440,000, and have the option to use the Ocean Monarch to drill a second well.
We continually evaluate opportunities to contract for the use of additional rigs to increase our capacity to drill additional wells.
Recent Events
On June 11, 2009, the Council of Ministers of Angola published Decree Law No. 15/09 and Decree Law No. 14/09 which granted the mining rights for the prospecting, exploration, development and production of hydrocarbons on Blocks 9 and 21 offshore Angola, respectively, to Sonangol, as the national concessionaire, and appointed Cobalt as the operator of Blocks 9 and 21. Pursuant to these Decrees Laws, in October 2009, we completed negotiations with Sonangol and initialed the finalized Risk Services Agreements for Blocks 9 and 21 offshore Angola. On December 16, 2009, the Council of Ministers of Angola approved the terms of the finalized Risk Services Agreements. On February 24, 2010, we executed Risk Services Agreements for Blocks 9 and 21 offshore Angola with Sonangol, as well as Sonangol Pesquisa e Produção, S.A., Nazaki Oil and Gáz, S.A. and Alper Oil, Limitada. The Risk Services Agreements govern our 40% interest in and operatorship of Blocks 9 and 21 offshore Angola and form the basis of our exploration, development and production operations on these blocks. Their execution is a key milestone that allows for the commencement of our offshore Angola drilling program, currently planned to begin within the next twelve months.
How We Identify and Analyze Prospects
Our prospect identification and analysis approach is based on a thorough, basin-wide understanding of the geologic trends within our focus areas. From our inception, we have been focused on acquiring and reprocessing the highest quality seismic data available, including the application of advanced imaging technology, such as wide-azimuth seismic. This approach differs considerably from often-followed industry practice of acquiring more narrowly focused, prospect-specific data on a block-by-block basis. In the Gulf of Mexico, we have licenses covering approximately 17.8 million acres (72,000 square kilometers) of processed 3-D depth-migrated seismic data and approximately 17.7 million acres (71,800 square kilometers) of wide-azimuth 3-D depth data. In addition, we have performed proprietary reprocessing on approximately 2.9 million acres (11,800 square kilometers) of 3-D seismic data to enhance image quality and velocity model confidence. Our proprietary seismic reprocessing was performed by third-party geophysical providers using leading-edge technologies, including reverse time migration algorithms for pre-stack depth migration and 3-D surface related
5
Table of Contents
multiple elimination (SRME) for multiple attenuation. We also have licensed approximately 78,000 line miles (125,000 kilometers) of 2-D pre-stack depth-migrated seismic data in the U.S. Gulf of Mexico. In West Africa, we have acquired approximately 125,000 line miles (200,000 line kilometers) of 2-D seismic data and approximately 3,200 square miles (8,300 square kilometers) of 3-D seismic data. Our approach to data acquisition entails analyzing regional data, including industry well results, to understand a given trend's specific geology and defining those areas that offer the highest potential for large hydrocarbon deposits. After these areas are identified, we seek to acquire and reprocess the highest resolution subsurface data available in the potential prospect's direct vicinity. This includes advanced imaging information, such as wide-azimuth studies, to further our understanding of a particular reservoir's characteristics, including both trapping mechanics and fluid migration patterns. Reprocessing is accomplished through a series of model building steps that incorporate the geometry of the salt and below salt geology to optimize the final image. In addition, we gather publicly available information, such as logs, press releases and industry intelligence, which we use to evaluate industry results and activities in order to understand the relationships between industry drilled prospects and our portfolio of undrilled prospects.
As part of our prospect identification and analysis approach, we estimate three primary characteristics:
- •
- mean prospect area—being the mean aerial extent of a hydrocarbon-bearing rock section of a prospect (expressed in acres);
- •
- mean "net pay" thickness—being the mean vertical extent of the effective hydrocarbon-bearing rock (expressed in feet); and
- •
- hydrocarbon yield—being the hydrocarbons that can ultimately be recovered from a volume of rock (expressed in barrels of oil-equivalent per acre-foot).
We use industry recognized probabilistic methods to estimate the ranges of potential outcomes for each characteristic. The ranges are checked for reasonableness by comparison to probabilistic distributions of analogous discoveries and fields (including dry holes), which we refer to as analogs. For instance, in evaluating our three primary characteristics in the Tahiti Basin Miocene trend, we extensively studied successful discoveries, including the Tahiti field, a subsalt Miocene field. Analogs also provide critical information regarding the age, thickness, quality of reservoir rock and components of hydrocarbon yield. As analog discoveries are appraised and become producing fields, they also provide performance data, including production and decline rates. By analyzing analogs in a basin, we refine and improve the accuracy of the estimates we calculate for prospects. We also work with DeGolyer and MacNaughton, an independent petroleum consulting firm, in assessing our prospects.
The accuracy of our estimates is subject to a number of risks and uncertainties as described under the heading "Risk Factors—We face substantial uncertainty in estimating the characteristics of our prospects, so you should not place undue reliance on any of our estimates."
The following describes how we determine the estimates of our three primary characteristics.
6
Table of Contents
Prospect Area

The aerial extent of a hydrocarbon-bearing section of a prospect is referred to as "prospect area." To determine our prospect area, we use our seismic data and all available geologic data to map the aerial extent of the closures or trapping geometries that can hold hydrocarbons. Because it is not possible to directly detect the presence of hydrocarbons, we use statistical methods to define the amount of the closure that can be filled with hydrocarbons. We use a lognormal distribution to define the probabilities of the size of the prospect area. The prospect area may extend across multiple lease blocks or license areas, including on lease blocks and license areas in which we do not own an interest.
Net Pay Thickness

The vertical extent of the effective hydrocarbon-bearing rock is referred to as "net pay" thickness. We estimate the amount of net pay thickness for a prospect by using wireline log information from wells in applicable analog fields. Our estimates for the net pay thickness of a prospect are validated with our studies of historical field thicknesses. As with our area estimations, we use a lognormal distribution to establish the probabilities of the net pay thickness of a prospect.
The expected net pay thickness of the exploration well may differ from the mean net pay thickness of the prospect due to several factors, including the relative location of the exploration well on the structure, potential thickness variations that may occur across the prospect and the extent to which potential reservoir horizons are penetrated.
7
Table of Contents
Hydrocarbon yield is a measure of the quantity of oil and natural gas ultimately recoverable from a given volume of reservoir rock. Estimating hydrocarbon yield involves an analysis of a combination of several factors including reservoir characteristics, hydrocarbon and fluid properties and recovery efficiency. Reservoir characteristics include porosity (the ratio of the volume of voids or pore space to the total volume, in other words, the storage capacity of a reservoir rock), permeability (the measure of the ease with which fluids will flow through the pore spaces of a reservoir rock) and hydrocarbon saturation (the percentage of oil and natural gas relative to water in the pore spaces of the reservoir rock). We estimate probabilistically the ranges for these reservoir characteristics by performing a petrophysical analysis of analogous wells and reservoirs in order to determine the range of these reservoir characteristics.
Hydrocarbon and fluid properties, including the gas-oil ratio and recoverable oil per acre-foot, are estimated using published or commercially available information from offset fields to determine likely ranges expected in the prospect trend.
Recovery efficiency is estimated from modeling multiple development scenarios that consider (i) the expected initial reservoir pressure, (ii) the number of wells used for production, (iii) the type of reservoir drive mechanism, (iv) the type of secondary recovery methods (if used), and (v) the expected reservoir abandonment pressure.
How We Acquire Prospects
Once a prospect is identified and analyzed, we may seek to acquire leasehold title to the lease blocks (in the U.S. Gulf of Mexico) or license area (offshore Angola and Gabon) that include the prospect. The leasehold acquisition typically occurs from one of two sources: from governments through lease sales, licensing rounds or direct negotiations, or from other oil and gas companies through direct purchases, trades or farm-in arrangements. The leasehold acquisition provides us with title to specific blocks or license areas that we believe includes the entire prospect or a portion thereof. For each block or license area, our ownership percentage is referred to as our working interest. For those prospects which extend beyond our leasehold acreage, we include only the portion of prospect acreage for which we hold leasehold title. We refer to this as the net mean area of the prospect. Depending on the terms of our lease or license agreement, we may be required to pay royalties on our oil and gas production.
Deepwater U.S. Gulf of Mexico
Our oil-focused exploration efforts primarily target subsalt Miocene and Lower Tertiary horizons in the deepwater U.S. Gulf of Mexico. The deepwater subsalt petroleum provinces are the least explored of the accessible regions of the U.S. Gulf of Mexico. Advances in technology over the past 10 years have led to significant discoveries and increased the hydrocarbon assessment in the deepwater U.S. Gulf of Mexico. These horizons are characterized by well-defined hydrocarbon systems, comprised primarily of high-quality source rock and crude oil, and contain several of the most significant hydrocarbon discoveries in the deepwater U.S. Gulf of Mexico, including Tahiti (Green Canyon 640), Knotty Head (Green Canyon 512) and Kaskida (Keathley Canyon 292).
The Miocene play is generally characterized by reservoirs exhibiting high permeability and containing high-quality oil and natural gas. One of the most prolific regions within the Miocene play is the Tahiti Basin, which includes discoveries such as Tahiti, Caesar, Tonga, Friesian, Knotty Head, Pony and Heidelberg.
8
Table of Contents
The following table presents the most recent data published by the MMS regarding selected industry discoveries in the Miocene trend(1):
| | | | | | | | | | | | | | | | | | | |
Field (Block) | | Reservoir
Depth (feet) | | Sand | | Total
Area
(acres)(2) | | Net Pay
Thickness
(feet) | | Gas-Oil
Ratio
(scf/bbl)(3) | | Recoverable
Oil per
Acre-foot
(bbl/acre-foot)(4) | |
|---|
Tahiti (Green Canyon 640) | | | 24,200 | | M15A | | | 3,500 | | | 150 | | | 467 | | | 404 | |
| | | 25,800 | | M18A | | | 1,500 | | | 35 | | | 680 | | | 344 | |
| | | 26,000 | | M21A | | | 3,600 | | | 70 | | | 505 | | | 378 | |
| | | 26,200 | | M21B | | | 3,300 | | | 100 | | | 510 | | | 323 | |
| | | | | | | | | | | | | | | | |
| | Tahiti Total | | | 335 | | | 508 | (5) | | 370 | (5) |
Knotty Head (Green Canyon 512) | | |
27,800 | | 27850 | | |
209 | | |
15 | | |
390 | | |
335 | |
| | | 28,000 | | MM50 | | | 882 | | | 92 | | | 395 | | | 303 | |
| | | 28,800 | | 30_31 | | | 315 | | | 36 | | | 395 | | | 300 | |
| | | 29,200 | | MM65up | | | 643 | | | 62 | | | 375 | | | 340 | |
| | | 29,800 | | MM65low | | | 1,106 | | | 27 | | | 380 | | | 251 | |
| | | 30,400 | | MM70up | | | 700 | | | 9 | | | 380 | | | 181 | |
| | | 30,600 | | MM70mid | | | 924 | | | 57 | | | 380 | | | 260 | |
| | | 30,800 | | MM70low | | | 892 | | | 47 | | | 380 | | | 260 | |
| | | 31,500 | | MM90 | | | 3,763 | | | 29 | | | 379 | | | 253 | |
| | | 31,700 | | 31900 | | | 1,942 | | | 12 | | | 410 | | | 223 | |
| | | | | | | | | | | | | | | | |
| | Knotty Head Total | | | 386 | | | 385 | (5) | | 285 | (5) |
Atlantis (Green Canyon 743) | | |
16,610 | | Upper_M7 | | |
945 | | |
55 | | |
647 | | |
669 | |
| | | 17,096 | | Mid_M7 | | | 3,128 | | | 130 | | | 647 | | | 670 | |
| | | 17,419 | | Lower_M7 | | | 2,550 | | | 99 | | | 647 | | | 651 | |
| | | 17,522 | | M8 | | | 1,077 | | | 39 | | | 647 | | | 529 | |
| | | 17,698 | | M9 | | | 1,456 | | | 97 | | | 647 | | | 458 | |
| | | | | | | | | | | | | | | | |
| | Atlantis Total | | | 420 | | | 647 | (5) | | 604 | (5) |
Mad Dog (Green Canyon 826) | | |
18,400 | | M60_SERIES | | |
922 | | |
157 | | |
830 | | |
246 | |
| | | 20,707 | | M20_SERIES | | | 3,296 | | | 170 | | | 267 | | | 290 | |
| | | | | | | | | | | | | | | | |
| | Mad Dog Total | | | 327 | | | 537 | (5) | | 269 | (5) |
Shenzi (Green Canyon 654) | | |
24,200 | | M8 | | |
970 | | |
122 | | |
500 | | |
334 | |
| | | 24,500 | | M7_STRAY | | | 1,058 | | | 29 | | | 500 | | | 384 | |
| | | 25,500 | | M9 | | | 6,090 | | | 205 | | | 495 | | | 361 | |
| | | | | | | | | | | | | | | | |
| | Shenzi Total | | | 356 | | | 497 | (5) | | 354 | (5) |
Puma (Green Canyon 823) | | |
16,750 | | MMM1 | | |
53 | | |
79 | | |
800 | | |
426 | |
| | | 17,260 | | MMM3 | | | 258 | | | 120 | | | 800 | | | 426 | |
| | | 17,965 | | MMM7 | | | 145 | | | 50 | | | 800 | | | 426 | |
| | | | | | | | | | | | | | | | |
| | Puma Total | | | 249 | | | 800 | (5) | | 426 | (5) |
K2 (Green Canyon 562) | | |
24,150 | | M14 | | |
3,645 | | |
20 | | |
890 | | |
279 | |
| | | 24,250 | | M20_Upper | | | 300 | | | 30 | | | 550 | | | 359 | |
| | | 26,262 | | M20_Lower | | | 4,549 | | | 53 | | | 670 | | | 185 | |
| | | 26,504 | | M20_Middle | | | 4,710 | | | 37 | | | 654 | | | 178 | |
| | | | | | | | | | | | | | | | |
| | K2 total | | | 140 | | | 671 | (5) | | 234 | (5) |
- (1)
- See the MMS' website:http://www.gomr.mms.gov/homepg/pubinfo/freeasci/Atlas/freeatlas.html. The information of this website is not incorporated into this Annual Report. Although the data published on the MMS website contains information on hundreds of fields in the U.S. Gulf of Mexico, we have included in this table only the deepwater subsalt Miocene fields that are most analogous to our Tahiti Basin Miocene trend and Adjacent Miocene trend prospects, based on the close proximity of these fields to our prospects and the similar reservoir depths, petrophysical properties and net pay thickness
9
Table of Contents
expected for our prospects. Based on these same metrics, of the seven fields presented in the table, we believe the two most analogous fields to our Tahiti Basin Miocene trend and Adjacent Miocene trend prospects are Tahiti and Knotty Head. The MMS keeps log and well data confidential for two years after receipt from companies drilling in the U.S. Gulf of Mexico. As a result, the most recent 2010 data available from the MMS does not include wells drilled after 2006, including Caesar, Tonga, Fresian, Pony and Heidelberg. We do not own interests in any of the fields listed in this table.
- (2)
- Represents the "gross area" of each field, which includes acreage of the field on all associated blocks. The "gross area" is different than the "net area", which would include only the acreage on which a particular owner holds leasehold title.
- (3)
- Represents the ratio of the volume of gas that comes out of solution from the volume of oil at standard conditions (expressed in standard cubic feet per barrel of oil).
- (4)
- Represents the amount of oil that can ultimately be recovered from a volume of rock (expressed in barrels of oil per acre-foot).
- (5)
- Represents the net pay thickness-weighted average of "gas-oil ratio" and "recoverable oil per acre-foot," as applicable.
The Lower Tertiary horizon is an older formation than the Miocene, and, as such, is generally deeper, with higher pressures and greater geologic complexity, than the Miocene play. These reservoirs are generally located in water depths of 5,000 feet to 8,000 feet, and have shown net pay thickness zones of up to 800 feet. In 2006, the discovery at Kaskida (Keathley Canyon 292) encountered 800 feet of net pay thickness. A more recent discovery in the Lower Tertiary, Shenandoah, has encountered approximately 300 feet of net pay thickness. Although to date there has been no commercial production from the Lower Tertiary horizon, the industry has been successful in terms of locating and drilling large hydrocarbon-bearing structures in this horizon. The reservoir quality of the Lower Tertiary has proven to be highly variable. Some regions, including those areas in which many of the historical Lower Tertiary discoveries have been made, exhibit lower permeability and generally lower natural gas content compared to the Miocene horizon. Another sub-region in the Lower Tertiary that has exhibited reservoir characteristics very similar to that of existing Miocene discoveries is the inboard Lower Tertiary trend, which includes the Shenandoah discovery. To date, however, the inboard Lower Tertiary trend remains largely undrilled.
10
Table of Contents
The following table presents the most recent data published by the MMS regarding selected industry discoveries in the outboard Lower Tertiary trend(1):
| | | | | | | | | | | | | | | | | | | |
Field(2) | | Reservoir
Depth (ft) | | Sand | | Total
Area
(acres)(2) | | Net Pay
Thickness
(feet) | | Gas-Oil
Ratio
(scf/bbl)(3) | | Recoverable
Oil per
Acre-foot
(bbl/acre-foot)(4) | |
|---|
St Malo (Walker Ridge 678) | | | 27,154 | | Wilcox1 | | | 6,438 | | | 185 | | | 160 | | | 128 | |
| | | 27,741 | | Wilcox2 | | | 6,170 | | | 121 | | | 160 | | | 124 | |
| | | | | | | | | | | | | | | | |
| | St Malo Total | | | 306 | | | 160 | (5) | | 126 | (5) |
Cascade (Walker Ridge 206) | | |
25,358 | | Sand1 | | |
973 | | |
107 | | |
160 | | |
173 | |
| | | 25,669 | | Sand2 | | | 490 | | | 36 | | | 160 | | | 192 | |
| | | 26,209 | | Sand3 | | | 630 | | | 56 | | | 160 | | | 104 | |
| | | | | | | | | | | | | | | | |
| | Cascade Total | | | 199 | | | 160 | (5) | | 157 | (5) |
Jack (Walker Ridge 759) | | |
27,000 | | Wilcox1 | | |
7,502 | | |
140 | | |
160 | | |
141 | |
| | | 27,669 | | Wilcox2 | | | 4,859 | | | 84 | | | 160 | | | 155 | |
| | | | | | | | | | | | | | | | |
| | Jack Total | | | 224 | | | 160 | (5) | | 146 | (5) |
Stones (Walker Ridge 508) | | |
26,826 | | Wilcox1 | | |
4,970 | | |
210 | | |
136 | | |
114 | |
Chinook (Walker Ridge 469) | | |
25,600 | | Sand1 | | |
1,270 | | |
201 | | |
160 | | |
245 | |
- (1)
- See the MMS' website:http://www.gomr.mms.gov/homepg/pubinfo/freeasci/Atlas/freeatlas.html. The information of this website is not incorporated into this Annual Report. Although the data published on the MMS website contains information on hundreds of fields in the U.S. Gulf of Mexico, we have included in this table only the deepwater subsalt outboard Lower Tertiary fields. What we refer to in this prospectus as the inboard Lower Tertiary is an emerging trend located to the northwest of existing outboard Lower Tertiary fields such as St. Malo, Jack and Cascade. We believe that discoveries in the inboard Lower Tertiary will exhibit meaningfully better reservoir characteristics than had previously been encountered by the industry in the outboard Lower Tertiary. We believe the results of the Shenandoah #1 well support this hypothesis. The MMS keeps log and well data confidential for two years after receipt from companies drilling in the U.S. Gulf of Mexico. As a result, the most recent 2010 data available from the MMS does not include wells drilled after 2006, including Kaskida and Shenandoah. We do not own interests in any of the fields listed in this table.
- (2)
- Represents the "gross area" of each field, which includes acreage of the field on all associated blocks. The "gross area" is different than the "net area", which would include only the acreage on which a particular owner holds leasehold title.
- (3)
- Represents the ratio of the volume of gas that comes out of solution from the volume of oil at standard conditions (expressed in standard cubic feet per barrel of oil).
- (4)
- Represents the amount of oil that can ultimately be recovered from a volume of rock (expressed in barrels of oil per acre-foot).
- (5)
- Represents the net pay thickness-weighted average of "gas-oil ratio" and "recoverable oil per acre-foot," as applicable.
As of December 31, 2009, we owned working interests in 225 blocks within the deepwater U.S. Gulf of Mexico covering approximately 1.3 million gross acres (0.6 million net acres). Our blocks are located primarily in the Green Canyon, Garden Banks, Walker Ridge and Keathley Canyon protraction areas. As of December 31, 2009, we have identified 48 prospects on our blocks: 3 Tahiti Basin Miocene trend prospects, 18 Adjacent Miocene trend prospects, 21 inboard Lower Tertiary trend prospects and 6 dual Miocene and Lower Tertiary trend prospects.
11
Table of Contents
Tahiti Basin. Our Tahiti Basin Miocene trend prospects are located in one of the most successful hydrocarbon bearing basins within the deepwater U.S. Gulf of Mexico. Discoveries in this region include Tahiti, Caesar (Green Canyon 683), Tonga (Green Canyon 726), Friesian (Green Canyon 599), Knotty Head, Pony (Green Canyon 468) and Heidelberg #1.
Adjacent Miocene. We believe our prospects within the Adjacent Miocene trend offer substantial, commercially viable resource potential due to similarities in the geologic profile to that of the Tahiti Basin Miocene trend. However, any analogies drawn by us from other wells, prospects or producing fields may not prove to be accurate indicators of the success of developing reserves from our prospects. Our prospect inventory in this trend benefits from significant seismic delineation via proprietary 3-D reprocessing that indicates large, well-defined subsalt closures.
Inboard Lower Tertiary. We were an early mover in the inboard Lower Tertiary trend, targeting specific lease blocks as early as 2006. Our technical team's hypothesis regarding the region's potentially higher-quality reservoir properties was supported by the successful result of the Shenandoah #1 well in which we participated. This discovery had reservoir characteristics more similar to Miocene reservoirs. Inboard Lower Tertiary trend prospects are characterized by large, well-defined subsalt closures of a similar size to historic outboard Lower Tertiary discoveries, but are differentiated by what we believe to be potentially superior reservoir quality.
We are the operator of approximately 75% of our U.S. Gulf of Mexico blocks. Most of our U.S. Gulf of Mexico blocks have a 10-year primary term, expiring between 2016 and 2019. Assuming we are able to commence exploration and production activities or successfully exploit our properties during the primary lease term, our leases would extend beyond the primary term, generally for the life of production. In the U.S. Gulf of Mexico, the royalties on our lease blocks range from 12.5% to 18.75% with an average of 15%.
Deepwater U.S. Gulf of Mexico exploration plays rely on hydrocarbons generated from several rich oil-prone source rocks. Rivers draining the North American continent provided vast quantities of sand, silt and mud to the Gulf of Mexico through major deltas similar to the present-day Mississippi and Rio Grande deltas. Sandstone reservoirs in two main geological formations, the Miocene and Lower Tertiary horizons, were ultimately transported and deposited by gravity flows in slope minibasins and on the paleo-basin floor. Hydrocarbon seals are provided by salts and the muds integral to the depositional system.
One of the most important aspects of the deepwater U.S. Gulf of Mexico is the presence of multiple layers of salt. Deposited early in the basin's history, the salt is key to both the region's complexity and its longevity as an exploration province. The upward movement of salt, through the surrounding rock, formed most of the structures in the present-day deepwater U.S. Gulf of Mexico. The interaction of sediment load and salt movement partitioned the hydrocarbons into numerous moderate-size accumulations rather than just a few super-giant fields.
Much of the deepwater province is covered by a salt canopy, which has historically prevented the oil and gas industry from effectively exploring the region's potential. This region has recently garnered interest from the industry with recent advances in seismic technology, which has provided clearer imaging beneath the salt canopy. Regional geologic reconstructions postulated the presence of mature source rock, reservoir, and trapping configurations in the subsalt region, but only since the advent of 3-D depth-migrated seismic data have geoscientists been able to develop exploration prospects to test the potential beneath the extensive salt canopy.
12
Table of Contents
Our prospects in the U.S. Gulf of Mexico as of December 31, 2009 are summarized in the following table. In interpreting this information, specific reference should be made to the subsections of this Annual Report on Form 10-K titled "Risk Factors—We face substantial uncertainties in estimating the characteristics of our prospects, so you should not place undue reliance on any of our estimates" and "Business—How We Identify and Analyze Prospects."
| | | | | | | | |
Prospect | | Cobalt Working
Interest(1) | | Block
Operator(s) | | Projected
Spud Year |
|---|
Miocene | | | | | | |
| | Tahiti Basin | | | | | | |
| | | Ligurian/Heidelberg | | (2) | | Cobalt/Anadarko | | (2) |
| | | Criollo | | 60% | | Cobalt | | Criollo #1 drilled(3) |
| | | Firefox | | 30% | | BHP | | Firefox #1 spud(4) |
| | Adjacent Miocene | | | | | | |
| | | Rum Ramsey | | 24% | | BHP | | late 2010 or early 2011 |
| | | Lyell | | 15% | | Anadarko | | 2011 |
| | | Rocky Mountain | | 45% | | Cobalt | | 2012 |
| | | Saddelbred | | 60% | | Cobalt | | 2012 |
| | | Sulu | | 45% | | Cobalt | | post 2012 |
| | | 13 additional prospects (average) | | 40% | | (various) | | post 2012 |
Inboard Lower Tertiary | | | | | | |
| | | Shenandoah | | 20% | | Anadarko | | Shenandoah #1 drilled(5) |
| | | North Platte | | 60% | | Cobalt | | 2010 |
| | | Aegean | | 60% | | Cobalt | | late 2010 or early 2011 |
| | | Catalan | | (6) | | Eni/Cobalt | | late 2010 |
| | | Latvian | | 60% | | Cobalt | | 2012 |
| | | Williams Fork | | (7) | | Cobalt/Nexen | | 2012 |
| | | Caspian | | (8) | | Cobalt | | post 2012 |
| | | El Ciervo | | (9) | | Eni/Samson | | post 2012 |
| | | South Platte | | 60% | | Cobalt | | post 2012 |
| | | Baffin Bay | | 60% | | Cobalt | | post 2012 |
| | | 11 additional prospects (average) | | 41% | | (various) | | post 2012 |
Dual Miocene and Inboard Lower Tertiary | | | | | | |
| | | Ardennes | | 42% | | Cobalt | | 2011 |
| | | Racer | | 24% | | BHP | | 2011 |
| | | Percheron | | 60% | | Cobalt | | post 2012 |
| | | 3 additional prospects (average) | | 40% | | (various) | | post 2012 |
- (1)
- Our working interests do not reflect our net economic interests, which take into account royalties. See "Business—Deepwater U.S. Gulf of Mexico."
- (2)
- Our Ligurian/Heidelberg prospect is comprised of two areas: Heidelberg (Green Canyon 859 and 903) and Ligurian (Green Canyon 813, 814 and 858). On February 2, 2009, we announced that the Heidelberg #1 well had been drilled, encountering more than 200 feet of net pay thickness in the Miocene horizons. On July 16, 2009, we spud the Ligurian #1 well to also target the upper- and
13
Table of Contents
middle-Miocene horizons. On October 28, 2009, we and our partners decided to temporarily cease drilling operations on Ligurian #1 having encountered operational difficulties when drilling below salt through an unforeseen geologic formation before reaching total depth or testing the targeted horizons. We did encounter oil in the wellbore above the targeted horizons, but believe further drilling operations will be required to adequately test the prospect. Since ceasing drilling operations, we have been evaluating the significant amount of new information that we have gathered from Ligurian #1, including results from the reprocessing of seismic data. We expect to resume exploratory activity on the Ligurian blocks during the third quarter of 2010. On February 17, 2010, the Heidelberg #2 appraisal well was spud by Anadarko in approximately 5,300 feet of water in Green Canyon 903. This well is currently drilling towards a targeted depth of approximately 31,500 feet.
Further details regarding these prospects are as follows:
| | | | | | | |
Area | | Cobalt Working
Interest | | Operator | | Projected Spud Year |
|---|
| Heidelberg | | | 9.375 | % | Anadarko | | Heidelberg #1 drilled; Heidelberg #2 spud |
| Ligurian | | | 45 | % | Cobalt | | Ligurian #1 drilled and suspended; exploratory activity expected to resume on Ligurian during the third quarter of 2010 |
- (3)
- On January 29, 2010, we announced that we had reached a planned total depth of approximately 31,000 feet in the Criollo exploration sidetrack well located in approximately 4,200 feet of water in Green Canyon 685 within the Tahiti Basin Miocene trend. The original well encountered 55 feet of net pay thickness in Miocene horizons and the sidetrack encountered 73 feet of net pay thickness in correlative reservoirs. Both the original well and the sidetrack encountered structural complexities associated with salt, which prevented the testing of the entire prospective interval. We have suspended operations on the well and we are conducting a detailed review of the well data and reprocessing the existing 3D pre-stack depth seismic data so that we and our partner can determine the next appropriate steps. While the Criollo prospect remains prospective, the potential size of the prospect has likely been reduced and the commerciality of the prospect has yet to be determined. We refer to the sidetrack well and the original well as the Criollo #1 exploratory well.
- (4)
- On February 10, 2010, the Firefox #1 exploratory well was spud by BHP in approximately 4,400 feet of water in Green Canyon 817 within the Tahiti Basin Miocene trend and approximately six miles northeast of the Heidelberg discovery. This well is currently drilling towards a targeted measured depth of approximately 34,000 feet.
- (5)
- On February 4, 2009, we announced that the Shenandoah #1 well had been drilled into Lower Tertiary horizons. Anadarko, as operator, has stated that this well encountered approximately 300 feet of net pay thickness.
- (6)
- Our Catalan prospect is comprised of four blocks as follows:
| | | | | |
Block | | Cobalt Working
Interest | | Operator |
|---|
Keathley Canyon 129 | | | 40 | % | Cobalt |
Walker Ridge 133 and 90 | | | 33.33 | % | Eni |
Walker Ridge 89 | | | 16.67 | % | Eni |
14
Table of Contents
- (7)
- Our Williams Fork prospect is comprised of five blocks as follows:
| | | | | |
Block | | Cobalt Working
Interest | | Operator |
|---|
Garden Banks 821 | | | 60 | % | Cobalt |
Garden Banks 823, 865, 866 and 867 | | | 30 | % | Nexen |
- (8)
- Our Caspian prospect is comprised of six blocks as follows:
| | | | | |
Block | | Cobalt Working
Interest | | Operator |
|---|
Garden Banks 495, 496 and 539 | | | 60 | % | Cobalt |
Garden Banks 497, 540 and 541 | | | 50 | % | Cobalt |
- (9)
- Our El Ciervo prospect is comprised of five blocks as follows:
| | | | | |
Block | | Cobalt Working
Interest | | Operator |
|---|
Walker Ridge 354, 399 and 443 | | | 20 | % | Eni |
Walker Ridge 355 and 487 | | | 50 | % | Samson |
The subsalt Miocene trend is an established play in the deepwater U.S. Gulf of Mexico. Major discoveries in this trend include Thunder Horse, Atlantis, Tahiti, Mad Dog, Knotty Head and Heidelberg. This trend is characterized by high quality reservoirs and fluid properties, resulting in high production well rates and recovery factors. We believe the primary geologic risk in this trend is the seal capacity required to trap hydrocarbons. To address this risk, we have conducted extensive regional studies, including proprietary seismic processing, proprietary pore pressure modeling, as well as other geological and geophysical predictive techniques, to better define the seal capacity for each prospect in the trend. Based on these studies, we have identified two trends located primarily in the Green Canyon protraction area, which we refer to as the Tahiti Basin Miocene trend and the Adjacent Miocene trend. A detailed description of each trend and certain of our associated prospects within each trend is included below.
The Tahiti Basin Miocene trend is in one of the most successful hydrocarbon bearing basins within the deepwater U.S. Gulf of Mexico. Major discoveries in this area include Tahiti, Friesian, Caesar, Tonga, Knotty Head, Pony and the discovery at Heidelberg #1. Because many fields have been discovered in this area, a network of facility and pipeline infrastructure may be available for commercializing potential discoveries.
Ligurian/Heidelberg
Ligurian/Heidelberg is a 3-way prospect targeting Miocene horizons. We believe Green Canyon blocks 813, 814 and 858 (which we refer to as the "Ligurian blocks") and Green Canyon blocks 859 and 903 (which we refer to as the "Heidelberg blocks") cover a common structure accumulation, and we therefore refer to them as a joint prospect. We are the named operator and own a 45% working interest in the Ligurian blocks, and we have a 9.375% working interest in the Anadarko-operated Heidelberg blocks. We purchased our interest in the Heidelberg blocks from an existing owner in May 2008 after we successfully acquired 100% of the working interest in the adjacent Ligurian blocks in the 2008 MMS Central Gulf of Mexico Lease Sale. This prospect was mapped using proprietarily processed, pre-stack, depth-migrated, wide-azimuth 3-D seismic data. On February 2, 2009, we
15
Table of Contents
announced that the Heidelberg #1 well had been drilled, encountering more than 200 feet of net pay thickness in the Miocene horizon. On July 16, 2009, we spud the Ligurian #1 well to also target the upper- and middle-Miocene horizons. On October 28, 2009, we and our partners decided to temporarily cease drilling operations on Ligurian #1 having encountered operational difficulties when drilling below salt through an unforeseen geologic formation before reaching total depth or testing the targeted horizons. We did encounter oil in the wellbore above the targeted horizons, but believe further drilling operations will be required to adequately test the prospect. Since ceasing drilling operations, we have been evaluating the significant amount of new information that we have gathered from Ligurian #1, including from our reprocessing of seismic data based on this new information, and we expect to resume exploratory activity on the Ligurian blocks during the third quarter of 2010. On February 17, 2010, the Heidelberg #2 appraisal well was spud by Anadarko in approximately 5,300 feet of water in Green Canyon 903. This well is currently drilling towards a targeted depth of approximately 31,500 feet. The untested Miocene horizons of this prospect have an estimated mean net area of 5,300 acres and an estimated mean net pay thickness of 200 feet.
Criollo
Criollo is a 3-way prospect targeting Miocene horizons located in Green Canyon blocks 685 and 729, where we are the named operator and own a 60% working interest. This prospect was acquired in the 2007 MMS Central Gulf of Mexico Lease Sale. This prospect is syncline separated from the Tahiti and the Friesian discoveries. Criollo was mapped using proprietarily processed, pre-stack, depth-migrated, wide-azimuth 3-D seismic data. On January 29, 2010, we announced that we had reached a total depth of approximately 31,000 feet in the Criollo exploration well located in approximately 4,200 feet of water in Green Canyon 685 within the Tahiti Basin Miocene trend. The original well encountered 55 feet of net pay thickness in Miocene horizons and the sidetrack encountered 73 feet of net pay thickness in correlative reservoirs. Both the original well and the sidetrack encountered structural complexities associated with salt, which prevented the testing of the entire prospective interval. We have suspended operations on the well and we are conducting a detailed review of the well data and reprocessing the existing 3D pre-stack depth seismic data so that we and our partner can determine the next appropriate steps. We refer to the sidetrack well and the original well as the Criollo #1 exploratory well. After taking into account the results of the Criollo #1 exploratory well, this prospect has an estimated mean net area of 900 acres and an estimated mean net pay thickness of 230 feet.
Firefox
Firefox is a 3-way prospect targeting Miocene horizons located in Green Canyon blocks 773, 817 and 818, where BHP is the named operator and we own a 30% working interest. This prospect was acquired in the 2007 MMS Central Gulf of Mexico Lease Sale. This prospect is syncline separated from the Heidelberg discovery. Firefox was mapped using proprietarily processed, pre-stack, depth-migrated, wide-azimuth 3-D seismic data. This prospect has an estimated mean net area of 4,000 acres and an estimated mean net pay thickness of 230 feet. On February 10, 2010, the Firefox #1 exploratory well was spud by BHP in approximately 4,400 feet of water in Green Canyon 817 within the Tahiti Basin Miocene trend and approximately six miles northeast of the Heidelberg discovery. This well is currently drilling towards a targeted measured depth of approximately 34,000 feet.
The Adjacent Miocene trend is located adjacent to the Tahiti Basin Miocene trend. We believe our prospects within the Adjacent Miocene trend offer substantial, commercially viable resource potential due to similarities in the geologic profile to that of the Tahiti Basin Miocene trend. Our prospect inventory in this trend benefits from significant seismic delineation via proprietary 3-D reprocessing
16
Table of Contents
that indicates large, well-defined subsalt closures. In much of the trend there is limited facility and pipeline infrastructure. As such, we anticipate that free-standing, independent facilities may be required to develop discoveries in this area.
Rum Ramsey
Rum Ramsey is a 3-way prospect targeting Miocene horizons located in Green Canyon blocks 632, 633 and 676, where BHP is the named operator and we own a 24% working interest. This prospect was acquired in the 2008 MMS Central Gulf of Mexico Lease Sale and through a 2008 trade. Rum Ramsey was mapped using our proprietarily processed, pre-stack, depth-migrated, narrow-azimuth 3-D seismic data and non-proprietary, pre-stack, depth-migrated, wide-azimuth 3-D seismic data. This prospect has an estimated mean net area of 4,500 acres and an estimated mean net pay thickness of 150 feet. We expect the initial exploration well on this prospect to be drilled in late 2010 or early 2011.
Lyell
Lyell is a 4-way prospect targeting Miocene horizons located in Green Canyon blocks 550 and 551, where Anadarko is the named operator and we own a 15% working interest. This prospect was acquired through a 2006 farm-in agreement and 2009 direct purchase. Lyell was mapped using non-proprietary, pre-stack, depth-migrated, wide-azimuth 3-D seismic data. This prospect has an estimated mean net area of 3,500 acres and an estimated mean net pay thickness of 230 feet. We expect the initial exploration well on this prospect to be drilled in 2011.
Rocky Mountain
Rocky Mountain is a 3-way prospect targeting Miocene horizons located in Mississippi Canyon blocks 649, 693 and 737, where we are the named operator and own a 45% working interest. This prospect was acquired in the 2008 MMS Central Gulf of Mexico Lease Sale and is syncline separated from the Blind Faith field. Rocky Mountain was mapped using our proprietarily processed, pre-stack, depth-migrated, narrow-azimuth 3-D seismic data. This prospect has an estimated mean net area of 2,400 acres and an estimated mean net pay thickness of 210 feet. We expect the initial exploration well on this prospect to be drilled in 2012.
Saddelbred
Saddelbred is a 3-way prospect targeting Miocene horizons located in Green Canyon blocks 457 and 458, where we are the named operator and own a 60% working interest. This prospect was acquired in the 2007 MMS Central Gulf of Mexico Lease Sale. Saddelbred was mapped using our proprietarily processed, wave-equation, pre-stack, depth-migrated, narrow-azimuth 3-D seismic data. This prospect has an estimated mean net area of 3,200 acres and an estimated mean net pay thickness of 140 feet. We expect the initial exploration well on this prospect to be drilled in 2012.
Sulu
Sulu is a 3-way prospect targeting Miocene horizons located in Green Canyon blocks 258, 259 and 302, where we are the named operator and own a 45% working interest. This prospect was acquired in the 2007 and 2008 MMS Central Gulf of Mexico Lease Sales and offsets the Anadarko-operated Samurai discovery. Sulu was mapped using non-proprietarily processed pre-stack, depth-migrated, narrow-azimuth 3-D seismic data. This prospect has an estimated mean net area of 4,000 acres and an estimated mean net pay thickness of 150 feet. We expect the initial exploration well on this prospect to be drilled post 2012.
17
Table of Contents
Additional Adjacent Miocene Prospects
We have 13 additional prospects targeting Miocene horizons, in which we have a combined average working interest of 43%. All of these prospects are operated by either Cobalt or various other companies. Each of these additional prospects was acquired in various MMS Gulf of Mexico Lease Sales or through direct purchases or trades. We mapped these prospects using a variety of 3-D seismic data. These prospects have a combined average estimated mean net area of 990 acres and a combined average estimated mean net pay thickness of 190 feet. We expect the initial exploration well on each of these additional prospects to be drilled post 2012.
The inboard Lower Tertiary is an emerging trend located to the northwest of existing outboard Lower Tertiary fields such as St. Malo, Jack and Cascade. We were an early mover in the inboard Lower Tertiary trend, targeting specific lease blocks as early as 2006. Our technical team's hypothesis regarding the region's potentially higher-quality reservoir properties was supported by the result of the Shenandoah #1 well in which we participated. This discovery had reservoir characteristics more similar to Miocene reservoirs. We believe our inboard Lower Tertiary blocks are characterized by large, well-defined structures of a similar size to historic outboard Lower Tertiary discoveries, but are differentiated by what we believe to be potentially superior reservoir quality. Because the inboard Lower Tertiary is an emerging trend, there is limited facility and pipeline infrastructure in the area. As such, we anticipate that free-standing, independent facilities may be required to develop discoveries in this area.
Shenandoah
Shenandoah is a 3-way prospect targeting Lower Tertiary horizons located in Walker Ridge blocks 51 and 52, where Anadarko is the named operator and we own a 20% working interest. This prospect was acquired through a 2008 purchase. Shenandoah was mapped using non-proprietarily processed pre-stack, depth-migrated, wide-azimuth 3-D seismic data. Proprietary reprocessing of wide-azimuth seismic data is in progress. On February 4, 2009, we announced that the Shenandoah #1 well had been drilled into Lower Tertiary horizons. Anadarko, as operator, has stated that this well encountered approximately 300 feet of net pay thickness. We expect an appraisal well on this prospect will be drilled in late 2011. The untested Lower Tertiary horizons of this prospect have an estimated mean net area of 4,600 acres and an estimated mean net pay thickness of 400 feet.
North Platte
North Platte is a 4-way prospect targeting Lower Tertiary horizons located in Garden Banks blocks 915, 958, 959, 1002 and 1003, where we are the named operator and own a 60% working interest. This prospect was acquired in the 2006 MMS Western Gulf of Mexico Lease Sale and the 2007 and 2008 MMS Central Gulf of Mexico Lease Sales. North Platte was mapped using our proprietarily processed, pre-stack, depth-migrated, wide-azimuth 3-D seismic data. This prospect has an estimated mean net area of 7,500 acres and an estimated mean net pay thickness of 360 feet. We expect the initial exploration well on this prospect to be drilled in 2010.
Aegean
Aegean is a 3-way prospect targeting Lower Tertiary horizons located in Keathley Canyon blocks 163 and 207, where we are the named operator and own a 60% working interest. This prospect was acquired in the 2008 MMS Central Gulf of Mexico Lease Sale. Aegean was mapped using non-proprietarily processed, pre-stack, depth-migrated, wide-azimuth 3-D seismic data. Proprietary reprocessing of the wide-azimuth seismic data is in progress. This prospect has an estimated mean net
18
Table of Contents
area of 3,400 acres and an estimated mean net pay thickness of 370 feet. We expect the initial exploration well on this prospect to be drilled in late 2010 or early 2011.
Catalan
Catalan is a 3-way prospect targeting Lower Tertiary horizons located in Keathley Canyon block 129 and Walker Ridge blocks 89, 90 and 133, where we are the named operator on the Keathley Canyon block with Eni being the named operator on the three Walker Ridge blocks. We have a 40%, 16.67%, 33.33% and 33.33% working interest in Keathley Canyon block 129 and Walker Ridge blocks 89, 90 and 133, respectively. This prospect was primarily acquired in the 2008 and 2009 MMS Central Gulf of Mexico Lease Sales and in a 2009 trade. Catalan was mapped using our proprietarily processed, pre-stack, depth-migrated, wide-azimuth 3-D seismic data. This prospect has an estimated mean net area of 5,400 acres and an estimated mean net pay thickness of 360 feet. We expect the initial exploration well on this prospect to be drilled in late 2010.
Latvian
Latvian is a 3-way prospect targeting Lower Tertiary horizons located in Garden Banks blocks 874, 917, 918 and 919, where we are the named operator and own a 60% working interest. This prospect was acquired in the 2006 MMS Western Gulf of Mexico Lease Sale and the 2007 and 2008 MMS Central Gulf of Mexico Lease Sales. Latvian was mapped using our proprietarily processed, pre-stack, depth-migrated, wide-azimuth 3-D seismic data. This prospect has an estimated mean net area of 5,200 acres and an estimated mean net pay thickness of 300 feet. We expect the initial exploration well on this prospect to be drilled in 2012.
Williams Fork
Williams Fork is a 3-way prospect targeting Lower Tertiary horizons located in Garden Banks blocks 821, 823, 865, 866 and 867, where Nexen is the named operator except for Garden Banks 821 for which we are the operator. We have a 60% working interest in Garden Banks block 821 and a 30% working interest in the remaining blocks. This prospect was acquired in the 2006 MMS Western Gulf of Mexico Lease Sale and the 2007 and 2008 MMS Central Gulf of Mexico Lease Sales. Williams Fork was mapped using non-proprietarily processed, pre-stack, depth-migrated wide-azimuth 3-D seismic data. This prospect has an estimated mean net area of 5,200 acres and an estimated mean net pay thickness of 300 feet. We expect the initial exploration well on this prospect to be drilled in 2012.
Caspian
Caspian is a 4-way prospect targeting Lower Tertiary horizons located in Garden Banks blocks 495, 496, 497, 539, 540 and 541, where we are the named operator and own a 50% working interest in Garden Banks blocks 497, 540 and 541 and a 60% working interest in the remaining blocks. This prospect was acquired in the 2008 MMS Western Gulf of Mexico Lease Sale, the 2009 MMS Central Gulf of Mexico Lease Sale and a 2009 trade. Caspian was mapped using our non-proprietarily processed, pre-stack, depth-migrated, narrow-azimuth 3-D seismic data. This prospect has an estimated mean net area of 8,200 acres and an estimated mean net pay thickness of 300 feet. We expect the initial exploration well on this prospect to be drilled post 2012.
El Ciervo
El Ciervo is a 3-way prospect targeting Lower Tertiary horizons located in Walker Ridge blocks 354, 355, 399, 443 and 487, where Eni and Samson are the named operators. We have a 20%, 50%, 20%, 20% and 50% working interest in Walker Ridge blocks 354, 355, 399, 443 and 487, respectively. This prospect was acquired in the 2008 and 2009 MMS Central Gulf of Mexico Lease Sales. El Ciervo
19
Table of Contents
was mapped using our non-proprietarily processed, pre-stack, depth-migrated, narrow-azimuth 3-D seismic data. This prospect has an estimated mean net area of 6,600 acres and an estimated mean net pay thickness of 300 feet. We expect the initial exploration well on this prospect to be drilled post 2012.
South Platte
South Platte is a 3-way prospect targeting Lower Tertiary horizons located in Garden Banks blocks 1003 and 1004 and Keathley Canyon blocks 35 and 36, where we are the named operator and own a 60% working interest. This prospect was acquired in the 2006 MMS Western Gulf of Mexico Lease Sale, the 2008 MMS Central Gulf of Mexico Lease Sale and through a 2009 trade. South Platte was mapped using our proprietarily processed, pre-stack, depth-migrated, wide-azimuth 3-D seismic data. This prospect has an estimated mean net area of 4,000 acres and an estimated mean net pay thickness of 300 feet. We expect the initial exploration well on this prospect to be drilled post 2012.
Baffin Bay
Baffin Bay is a 3-way prospect targeting Lower Tertiary horizons located in Garden Banks blocks 956 and 957, where we are the named operator and own a 60% working interest. This prospect was acquired in the 2008 MMS Central Gulf of Mexico Lease Sale. Baffin Bay was mapped using our proprietarily processed, pre-stack, depth-migrated, wide-azimuth 3-D seismic data. This prospect has an estimated mean net area of 2,300 acres and an estimated mean net pay thickness of 300 feet. We expect the initial exploration well on this prospect to be drilled post 2012.
Additional Inboard Lower Tertiary Prospects
We have 11 additional prospects targeting inboard Lower Tertiary horizons, in which we have a combined average working interest of 45%. All of these prospects are operated by either Cobalt or various other companies. Each of these additional prospects was acquired in various MMS Gulf of Mexico Lease Sales or through trades. We mapped these prospects using a variety of 3-D seismic data. These prospects have a combined average estimated mean net area of 1,700 acres and a combined average estimated mean net pay thickness of 300 feet. We expect the initial exploration well on each of these additional prospects to be drilled post 2012.
The following prospects target both Miocene and Lower Tertiary horizons.
Ardennes
Ardennes is a 4-way prospect targeting Miocene and Lower Tertiary horizons located in Green Canyon blocks 895, 896 and 939, where we are the named operator and own a 42% working interest. This prospect was acquired through a 2007 direct purchase, a trade in 2008, and in the 2007 and 2008 MMS Central Gulf of Mexico Lease Sales. Ardennes was mapped using our processed, pre-stack, depth-migrated, narrow-azimuth 3-D seismic data and non-proprietary, pre-stack, depth-migrated, wide-azimuth 3-D seismic data. Proprietary reprocessing of the wide-azimuth seismic data is in progress. The Miocene horizons of this prospect have an estimated mean net area of 7,500 acres and an estimated mean net pay thickness of 190 feet. In addition to the Miocene horizons, the Lower Tertiary horizons of this prospect have an estimated mean net area of 6,000 acres and an estimated mean net pay thickness of 300 feet. We expect the initial exploration well on this prospect to be drilled in 2011.
20
Table of Contents
Racer
Racer is a 3-way prospect targeting Miocene and Lower Tertiary horizons located in Green Canyon blocks 762 and 806, where BHP is the named operator and we own a 24% working interest. This prospect was acquired in the 2007 MMS Central Gulf of Mexico Lease Sale and through a trade in 2008. Racer was mapped using our proprietarily processed, pre-stack, depth-migrated, narrow-azimuth 3-D seismic data and non-proprietary wide-azimuth 3-D depth data. The Miocene horizons of this prospect have an estimated mean net area of 4,800 acres and an estimated mean net pay thickness of 150 feet. In addition to the Miocene horizons, the Lower Tertiary horizons of this prospect have an estimated mean net area of 5,200 acres and an estimated mean net pay thickness of 300 feet. We expect the initial exploration well on this prospect to be drilled in 2011.
Percheron
Percheron is a 3-way prospect targeting Miocene and Lower Tertiary horizons located in Green Canyon block 957, where we are the named operator and own a 60% working interest. This prospect was acquired in the 2007 MMS Central Gulf of Mexico Lease Sale and is syncline separated from the Mad Dog field. Percheron was mapped using non-proprietary, pre-stack, depth-migrated, narrow-azimuth 3-D seismic data. The Miocene horizons of this prospect have an estimated mean net area of 640 acres and an estimated mean net pay thickness of 230 feet. In addition to the Miocene horizons, the Lower Tertiary horizons of this prospect has an estimated mean net area of 450 acres and an estimated mean net pay thickness of 300 feet. We expect the initial exploration well on this prospect to be drilled post 2012.
Additional Dual Miocene and Lower Tertiary Prospects
We have 3 additional prospects targeting Miocene and inboard Lower Tertiary horizons, in which we have a combined average working interest of 28%. All of these prospects are operated by various other companies. Each of these additional prospects was acquired in various MMS Gulf of Mexico Lease Sales or through trades. We mapped these prospects using a variety of 3-D seismic data. The Miocene horizons of these prospects have a combined average estimated mean net area of 710 acres and a combined average estimated mean net pay thickness of 140 feet. The Lower Tertiary horizons of these prospects have a combined average estimated mean net area of 690 acres and a combined average estimated mean net pay thickness of 300 feet. We expect the initial exploration well on each of these additional prospects to be drilled post 2012.
The initial well drilled to test a prospect is referred to as an exploratory well. If a discovery is made by the initial exploratory well, the operator may choose to drill one or more appraisal wells to delineate the size and other characteristics of the discovered field. This information is used to create a plan of development, which may include the construction of offshore facilities and drilling of development wells designed to efficiently produce hydrocarbons from the field. Any oil resources, if developed, would use either newly constructed processing facilities owned by the working-interest partnership or processing facilities leased from third-party providers. In general, we expect our development wells will be produced through subsea templates tied back to the processing facilities.
The timing of our initial exploratory, appraisal and development wells included herein represent our anticipated priority in which prospects will be drilled by the operator of each prospect. Actual timing decisions may differ significantly from our current plans due to availability of critical equipment, material and personnel, drilling results from offset or nearby prospects, and financing priorities. We estimate that the average gross cost to drill and evaluate an exploration well is approximately $100 to $130 million for Miocene prospects and approximately $140 to $170 million for inboard Lower Tertiary
21
Table of Contents
prospects, the average gross cost to drill and evaluate an appraisal well is approximately $110 to $140 million for Miocene prospects and approximately $150 to $180 million for inboard Lower Tertiary prospects, while the average gross cost to drill and evaluate a development well is approximately $140 to $170 million for Miocene fields and approximately $180 to $210 million for inboard Lower Tertiary fields.
West Africa Deepwater
We have rights to license areas with pre-salt and above salt exploration potential offshore Angola and Gabon. We obtained our licenses offshore Angola and Gabon after a multi-year assessment of global deepwater hydrocarbon trends and resource potential. Our assessment was driven by our interpretation of seismic data, the international operating experience of our management and technical teams and an in-depth evaluation of regional political risk and economic conditions. The emerging offshore West African pre-salt exploration trend has geologic characteristics similar to the pre-salt basins offshore Brazil, which includes the Tupi, Jupiter and other recently announced significant discoveries. Pre-salt discoveries in West Africa have been made, both onshore and in shallow water offshore Angola and Gabon. Geologically similar fields have produced in northern Angola, Congo and southern Gabon.
Within our license areas offshore Angola and Gabon, we have identified 86 prospects, with 46 having pre-salt objectives, 40 having above salt objectives. While we do not expect any discoveries offshore Angola and Gabon to include significant quantities of natural gas, if discoveries in Angola do include natural gas, we do not have contractual rights to natural gas on our blocks. We do, however, have contractual rights to natural gas on our Gabon license area.
Offshore Angola, we have executed Risk Services Agreements for Blocks 9 and 21 with Sonangol, as well as Sonangol Pesquisa e Produção, S.A., Nazaki Oil and Gáz, S.A. and Alper Oil, Limitada. The Risk Services Agreements govern our 40% interest in and operatorship of Blocks 9 and 21 offshore Angola and form the basis of our exploration, development and production operations on these blocks. We also have contractual rights with respect to one additional block offshore Angola. Block 9 is approximately 1 million acres (4,000 square kilometers) in size and is located immediately offshore in the southeastern-most portion of the Kwanza basin. Water depth ranges from zero to more than 3,200 feet (1,000 meters). Block 21 is approximately 1.2 million acres (4,900 square kilometers) in size. The block is 30 to 90 miles (50 to 140 kilometers) offshore in water depths of 3,300 to 5,200 feet (1,000 to 1,600 meters) in the central portion of the Kwanza basin.
Offshore Gabon, we entered into an assignment agreement in February 2008 with Total Gabon and acquired a 21.25% working interest in the Diaba Block. Through the assignment we became a party to the Production Sharing Agreement between the operator Total Gabon and the Republic of Gabon. This agreement gives Cobalt the right to recover costs incurred and receive a share of the remaining profit from any commercial discoveries made on the block. The Diaba Block is approximately 2.2 million acres (9,000 square kilometers) in size. The block is 40 to 120 miles (60 to 200 kilometers) offshore in water depths of 300 to 10,500 feet (100 to 3,200 meters) in the central portion of the offshore South Gabon Coastal basin.
Offshore Angola and Gabon are characterized by the presence of salt formations and oil-bearing sediments located in pre-salt and above salt (Albian) horizons. Given the rifting that occurred when plate tectonics separated the South American and African continents, we believe the geology offshore Angola (Kwanza Basin) and Gabon (South Gabon Coastal Basin) is a direct analog to the geology offshore Brazil (Santos Basin) where recent pre-salt discoveries, such as Tupi and Jupiter, are located. The basis for this hypothesis is that 150 million years ago, current day South America and Africa were
22
Table of Contents
part of a larger continent that broke apart. As these land masses slowly drifted away from each other, rift basins formed. These basins were filled with organic rich material and sediments, which in time became hydrocarbon source rocks and reservoirs. A thick salt layer was subsequently deposited, forming a seal over the reservoirs. Finally the continents continued to drift apart, forming two symmetric geologic areas separated by the Atlantic Ocean. This symmetry in geology is particularly notable in the deepwater areas offshore Gabon, Angola and the Santos and Campos Basins offshore Brazil. From an exploration perspective, we believe this similarity is very meaningful, particularly in the context of recent pre-salt Brazilian discoveries, including the Petrobras-operated Tupi (BM-S-11) find, which, according to Petrobras, has an aerial extent of approximately 93,000 acres (380 square kilometers), according to Wood Mackenzie, has net pay thickness of approximately 333 feet (100 metres) and, according to industry analysis, has an estimated hydrocarbon yield of approximately 180 barrels of oil per acre-foot and is believed to hold significant oil and natural gas resource accumulations. According to industry sources, Santos Basin pre-salt activity has had a 93% drilling success rate. See "Item 1A. Risk Factors—We have no proved reserves and areas that we decide to drill may not yield oil in commercial quantities or quality, or at all."
Illustrative Atlantic Rift Play Symmetry(1)
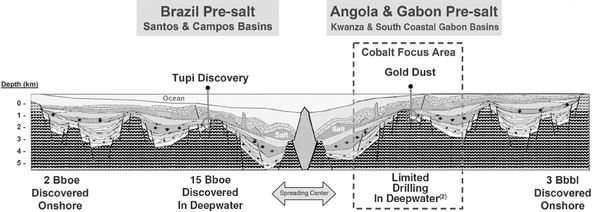
Recent pre-salt and shallow water discoveries offshore Brazil, coupled with the pre-salt onshore discoveries in West Africa and our ongoing analysis of seismic data, including our proprietary reprocessing of 3-D pre-stack, depth-migrated seismic data on Block 21 offshore Angola, furthers our belief that large-scale resource potential exists on our acreage. No exploratory wells have targeted the pre-salt horizon in the deepwater offshore Angola and Gabon. One well, drilled in 1996, which targeted shallower horizons in the deepwater offshore Angola, penetrated a pre-salt horizon and encountered oil. The pre-salt reservoirs are expected to be sandstones and carbonates, with extensive evaporite seals and rich interbedded source rocks. The above salt (Albian) reservoirs are expected to be limestones and dolomites.
Given the evidence of large structural closures and widespread sealing salt and rich source rocks, the primary geologic risk of the deepwater West Africa plays is the presence of quality reservoirs. A discovery by Cobalt or another company of a quality pre-salt reservoir in the deepwater offshore West Africa will significantly de-risk the geologic uncertainty and increase the likelihood of geologic success of our adjacent undrilled prospects.
23
Table of Contents
Our Prospects Offshore West Africa
Our prospects offshore West Africa as of December 31, 2009 are summarized in the following table. In interpreting this information, you should refer to the subsections of this Annual Report on Form 10-K titled "Risk Factors—We face substantial uncertainties in estimating the characteristics of our prospects, so you should not place undue reliance on any of our estimates" and "Business—How We Identify and Analyze Prospects."
| | | | | | | | |
Prospect | | Cobalt
Working
Interest(1) | | Operator | | Projected
Spud Year |
|---|
Angola | | | | | | | |
| | Gold Dust | | | 40 | % | Cobalt | | late 2010 or
early 2011 |
| | Oasis | | | 40 | % | Cobalt | | 2011 |
| | Aquarius | | | 40 | % | Cobalt | | 2011 |
| | Silver Dollar | | | 40 | % | Cobalt | | 2012 |
| | Riviera | | | 40 | % | Cobalt | | 2012 |
| | Monte Carlo | | | 40 | % | Cobalt | | post 2012 |
| | Churchill | | | 40 | % | Cobalt | | post 2012 |
| | Starlite | | | 40 | % | Cobalt | | post 2012 |
| | Silverado | | | 40 | % | Cobalt | | post 2012 |
| | Treasure Island | | | 40 | % | Cobalt | | post 2012 |
| | High Desert | | | 40 | % | Cobalt | | post 2012 |
| | 31 additional prospects (average) | | | 40 | % | Cobalt | | post 2012 |
Gabon | | | | | | | |
| | Longhorn | | | 21.25 | % | Total Gabon | | late 2011 |
| | Pioneer | | | 21.25 | % | Total Gabon | | late 2011 |
| | Rainbow | | | 21.25 | % | Total Gabon | | post 2012 |
| | Alamo | | | 21.25 | % | Total Gabon | | post 2012 |
| | Fiesta | | | 21.25 | % | Total Gabon | | post 2012 |
| | 39 additional prospects (average) | | | 21.25 | % | Total Gabon | | post 2012 |
- (1)
- Our working interests do not reflect our net economic interests, which take into account the economic terms of the agreements governing our blocks offshore Angola and Gabon. See "Business—West Africa Deepwater" and "Business—Material Agreements—Angolan Risk Services Agreements."
24
Table of Contents
Gold Dust
Gold Dust is a prospect targeting pre-salt horizons, where we are the named operator and have a 40% working interest. Gold Dust was mapped using our pre-stack, depth-migrated 3-D seismic data. This prospect has an estimated mean net area of 19,700 acres and an estimated mean net pay thickness of 810 feet. We expect the initial exploration well on this prospect to be drilled in late 2010 or early 2011.
Oasis
Oasis is a prospect targeting pre-salt horizons, where we are the named operator and have a 40% working interest. Oasis was mapped using our pre-stack, depth-migrated 3-D seismic data. This prospect has an estimated mean net area of 11,700 acres and an estimated mean net pay thickness of 820 feet. We expect the initial exploration well on this prospect to be drilled in 2011.
Aquarius
Aquarius is a prospect targeting Albian horizons, where we are the named operator and have a 40% working interest. Aquarius was mapped using our 2-D seismic data. This prospect has an estimated mean net area of 5,100 acres and an estimated mean net pay thickness of 390 feet. We expect the initial exploration well on this prospect to be drilled in 2011.
Silver Dollar
Silver Dollar is a prospect targeting pre-salt horizons, where we are the named operator and have a 40% working interest. Silver Dollar was mapped using our 2-D seismic data. This prospect has an estimated mean net area of 11,500 acres and an estimated mean net pay thickness of 360 feet. We expect the initial exploration well on this prospect to be drilled in 2012.
Riviera
Riviera is a prospect targeting pre-salt horizons, where we are the named operator and have a 40% working interest. Riviera was mapped using our 2-D seismic data. This prospect has an estimated mean net area of 4,000 acres and an estimated mean net pay thickness of 360 feet. We expect the initial exploration well on this prospect to be drilled in 2012.
Monte Carlo
Monte Carlo is a prospect targeting pre-salt horizons, where we are the named operator and have a 40% working interest. Monte Carlo was mapped using our 2-D seismic data. This prospect has an estimated mean net area of 30,400 acres and an estimated mean net pay thickness of 360 feet. We expect the initial exploration well on this prospect to be drilled post 2012.
Churchill
Churchill is a prospect targeting Albian horizons, where we are the named operator and have a 40% working interest. Churchill was mapped using our 2-D seismic data. This prospect has an estimated mean net area of 3,100 acres and an estimated mean net pay thickness of 390 feet. We expect the initial exploration well on this prospect to be drilled post 2012.
25
Table of Contents
Starlite
Starlite is a prospect targeting Albian horizons, where we are the named operator and have a 40% working interest. Starlite was mapped using our 2-D seismic data. This prospect has an estimated mean net area of 3,400 acres and an estimated mean net pay thickness of 390 feet. We expect the initial exploration well on this prospect to be drilled post 2012.
Silverado
Silverado is a prospect targeting pre-salt horizons, where we are the named operator and have a 40% working interest. Silverado was mapped using our pre-stack, depth-migrated 2-D seismic data. This prospect has an estimated mean net area of 4,900 acres and an estimated mean net pay thickness of 360 feet. We expect the initial exploration well on this prospect to be drilled post 2012.
Treasure Island
Treasure Island is a prospect targeting pre-salt horizons, where we are the named operator and have a 40% working interest. Treasure Island was mapped using our 2-D seismic data. This prospect has an estimated mean net area of 6,500 acres and an estimated mean net pay thickness of 360 feet. We expect the initial exploration well on this prospect to be drilled post 2012.
High Desert
High Desert is a prospect targeting Albian horizons, where we are the named operator and have a 40% working interest. High Desert was mapped using our 2-D seismic data. This prospect has an estimated mean net area of 6,700 acres and an estimated mean net pay thickness of 390 feet. We expect the initial exploration well on this prospect to be drilled post 2012.
Additional Angola Prospects
We have 11 additional prospects targeting pre-salt horizons and 20 additional prospects targeting Albian horizons offshore Angola, in which we have a 40% working interest. We are the named operator for all of these prospects. We mapped all these prospects using 2-D seismic data. These prospects have a combined average estimated mean net area of 2,000 acres and an estimated mean net pay thickness of 390 feet. We expect the initial exploration well on each of these additional prospects to be drilled post 2012.
Longhorn
Longhorn is a prospect targeting pre-salt horizons, where Total Gabon is the named operator and we have a 21.25% working interest. Longhorn was mapped using our 2-D seismic data. This prospect has an estimated mean net area of 43,600 acres and an estimated mean net pay thickness of 360 feet. We expect the initial exploration well on this prospect to be drilled in late 2011.
Pioneer
Pioneer is a prospect targeting pre-salt horizons, where Total Gabon is the named operator and we have a 21.25% working interest. Pioneer was mapped using our 2-D seismic data. This prospect has an estimated mean net area of 42,800 acres and an estimated mean net pay thickness of 360 feet. We expect the initial exploration well on this prospect to be drilled in late 2011.
26
Table of Contents
Rainbow
Rainbow is a prospect targeting pre-salt horizons, where Total Gabon is the named operator and we have a 21.25% working interest. Rainbow was mapped using our 2-D seismic data. This prospect has an estimated mean net area of 66,900 acres and an estimated mean net pay thickness of 360 feet. We expect the initial exploration well on this prospect to be drilled post 2012.
Alamo
Alamo is a prospect targeting Albian horizons, where Total Gabon is the named operator and we have a 21.25% working interest. Alamo was mapped using our 2-D seismic data. This prospect has an estimated mean net area of 8,800 acres and an estimated mean net pay thickness of 390 feet. We expect the initial exploration well on this prospect to be drilled post 2012.
Fiesta
Fiesta is a prospect targeting Albian horizons, where Total Gabon is the named operator and we have a 21.25% working interest. Fiesta was mapped using our 2-D seismic data. This prospect has an estimated mean net area of 10,700 acres and an estimated mean net pay thickness of 390 feet. We expect the initial exploration well on this prospect to be drilled post 2012.
Additional Gabon Prospects
We have 25 additional prospects targeting pre-salt horizons and 14 additional prospects targeting Albian horizons offshore Gabon, in which we have a 21.25% working interest. Total Gabon is the named operator for all of these prospects. We mapped all of these prospects using 2-D seismic data. These prospects have a combined average estimated mean net area of 6,500 acres and an estimated mean net pay thickness of 270 feet. We expect the initial exploration well on each of these additional prospects to be drilled post 2012.
In Angola, we will work in a contractor relationship to the national oil company, Sonangol, with terms and conditions established by the Risk Services Agreements. In Gabon, we will work in a contractor relationship to the Republic of Gabon with terms and conditions established by a Production Sharing Agreement. The Production Sharing Agreement or Risk Services Agreements define contractual terms, including fiscal terms, minimum contractor work, investment obligations, the carry of local partner's capital investments, and required progress milestones.
The drilling of exploration wells in both Angola and Gabon is well within known technological boundaries. The marine and subsurface conditions are anticipated to be normally pressured thus enabling standardization and simplification of well design. Offshore Angola and Gabon, we estimate that the gross cost to drill and evaluate an exploration, appraisal or development well is approximately $45 to $65 million for pre-salt prospects and $30 to $50 million for above salt prospects. The timing of our initial exploration wells included herein represent our current expectations as to the priority in which prospects will be drilled. Actual timing decisions may differ significantly due to availability of critical equipment, material and staff, drilling results from offset or nearby prospects, government approvals, and funding priorities.
As an operator in Angola, our primary development concept for any discovery will be standardized staged developments. For each discovery, we expect that an early production system incorporating a FPSO system will be implemented, to then be followed by a further standardized FPSO system depending on the size of the discovery and associated development. All FPSOs in Angola are expected to be leased.
27
Table of Contents
Material Agreements
On April 6, 2009, we announced that we had entered into a long-term alliance with TOTAL. This alliance transaction principally consisted of:
- •
- A simultaneous exchange agreement, between TOTAL and ourselves, dated April 6, 2009 (the "Exchange Agreement"), whereby both TOTAL and ourselves agreed to combine each company's respective U.S. Gulf of Mexico exploratory lease inventories except as to certain leases which were purchased by TOTAL under separate purchase and sale agreements. This was achieved through the transfer of a 40% interest in our leases to TOTAL in return for a 60% interest in TOTAL's leases, and resulted in a current combined alliance portfolio covering 215 U.S. Gulf of Mexico blocks. As the Exchange Agreement contemplates the combination of TOTAL and our U.S. Gulf of Mexico exploratory lease inventories, it excludes the Heidelberg portion of our Ligurian/Heidelberg prospect, our Shenandoah prospect, and all developed or producing properties held by TOTAL in the U.S. Gulf of Mexico. The terms of the exchange agreement mandate the alliance, with Cobalt as operator, to drill an initial five-well program on existing Cobalt-operated blocks. This well program is expected to be drilled on the prospects of Ligurian, Criollo, North Platte, Aegean and Ardennes. In order to drill this initial program, TOTAL committed to provide Cobalt with the use of the Transocean DD-I drilling rig, which was delivered on July 7, 2009 and used to drill the Ligurian and Criollo prospects. On March 8, 2010, we entered into a Rig Assignment Agreement with Anadarko providing for the assignment to Cobalt of the Ocean Monarch drilling rig. We plan to use the Ocean Monarch to drill the North Platte prospect. TOTAL is committed to provide a replacement drilling rig to drill the Aegean and Ardennes prospects. Furthermore, pursuant to the terms of the Exchange Agreement, TOTAL has also committed, among other things, to (i) pay up to $300 million to carry a substantial share of costs first allocable to us based on our 60% ownership interest in the combined alliance properties with respect to this five-well program and certain other exploration and development activities (above the amounts TOTAL has agreed to pay as owner of a 40% interests in such properties), (ii) pay an initial amount of approximately $280 million primarily as reimbursement of our share of historical costs in our contributed properties and consideration under purchase and sale agreements covering leases not included in the Exchange Agreement, and (iii) based on the success of the alliance's five-well program (primarily defined as discoveries of petroleum accumulations of at least 100 feet of net pay thickness for Miocene objectives and 250 feet of net pay thickness for Lower Tertiary objectives), pay up to $180 million to carry a substantial share of costs first allocable to Cobalt based on its 60% ownership interest in combined alliance properties with respect to additional wells and certain other exploration and development activities outside of the five-well program, in all cases subject to certain conditions and limitations. Any additional carry owed to us based on the success of the alliance's five-well program will increase the commitment by TOTAL to pay a disproportionate share of the costs of additional wells drilled and certain other exploration and development activities incurred outside of the five-well program.
- •
- A management and area of mutual interest agreement, between TOTAL and ourselves, dated April 6, 2009 (the "TOTAL AMI Agreement"), whereby both TOTAL and ourselves agreed to participate in an area of mutual interest covering the whole U.S. Gulf of Mexico. The TOTAL AMI Agreement is for a term of ten years, and grants each party the right and option, but not the obligation, to acquire a share of any oil and natural gas leasehold interest acquired by the other party within the designated area. The TOTAL AMI Agreement excludes the Heidelberg portion of our Ligurian/Heidelberg prospect, our Shenandoah prospect, and all developed or producing properties held by TOTAL in the U.S. Gulf of Mexico. For the duration of the term of the TOTAL AMI Agreement, TOTAL will pay 40% of the general and administrative costs
28
Table of Contents
relating to our operations in the U.S. Gulf of Mexico. Furthermore, this agreement designates us as the operator for all exploratory and appraisal operations. Upon completion of appraisal operations, operatorship will be determined by TOTAL and ourselves, with the greatest importance being placed on majority (or largest) working interest ownership and the respective experience of each party in developments which have required the design, construction and ownership of a permanently anchored host facility to collect and transport oil or natural gas from such development.
On May 15, 2008, we entered into a participation agreement with Sonangol, which established the terms of our U.S. Gulf of Mexico partnership with Sonangol. This partnership consists of:
- •
- An area of mutual interest, covering a sub-set of the U.S. Gulf of Mexico (the "Sonangol AMI"). The Sonangol AMI is for a term of two years which expires in May 2010, and grants each party the right and option, but not the obligation, to acquire a share of any oil and natural gas leasehold interest acquired by the other party within the designated area.
- •
- An agreement for Sonangol to participate in the development of certain prospects on 11 of our U.S. Gulf of Mexico leases. In this regard, Sonangol purchased a 25% non-operated interest in the blocks containing our Sulu, Ligurian and Rocky Mountain prospects, among others. The percentage assigned to Sonangol as part of this partnership was calculated on the basis of the interests we held in such blocks prior to our TOTAL alliance. Furthermore, in connection with the partnership, Sonangol agreed to purchase their interests in our leases for the price we paid for such leases in the 2007 and 2008 MMS Central Gulf of Mexico Lease Sales, reimburse us $10 million for our share of historical seismic and exploration costs in the subject properties and allow Cobalt to act as the operator on all of the subject properties.
ENSCO Rig
We expect to operate the ENSCO 8503, an deepwater 5th generation semisubmersible drilling rig in the U.S. Gulf of Mexico. The ENSCO 8503 is leased from ENSCO for a two year term commencing in the fourth quarter of 2010, which may be extended to a three or four year term at our option. The aggregate rate for the first two years of the ENSCO contract is approximately $372 million, representing a base operating rate of $510,000 per day, subject to adjustment for any variances in operating costs from historical January 2008 levels. Under the terms of the contract, we will pay for the transportation of this rig to the U.S. Gulf of Mexico.
On June 11, 2009, the Council of Ministers of Angola published Decree Law No. 15/09 and Decree Law No. 14/09 which granted the mining rights for the prospecting, exploration, development and production of hydrocarbons on Blocks 9 and 21 offshore Angola, respectively, to Sonangol, as the national concessionaire, and appointed Cobalt as the operator of Blocks 9 and 21, respectively. Pursuant to these Decrees Laws, in October 2009, we completed negotiations with Sonangol and initialed the finalized Risk Services Agreements for Blocks 9 and 21 offshore Angola. On December 16, 2009, the Council of Ministers of Angola approved the terms of the finalized Risk Services Agreements. On February 24, 2010, we executed Risk Services Agreements for Blocks 9 and 21 offshore Angola with Sonangol, as well as Sonangol Pesquisa e Produção, S.A. ("Sonangol P&P"), Nazaki Oil and Gáz, S.A. ("Nazaki") and Alper Oil, Limitada ("Alper" and together with Sonangol P&P and Nazaki, the "Contractor Group"). The Risk Services Agreements govern our 40% interest in and operatorship of Blocks 9 and 21 offshore Angola and form the basis of our exploration, development and production operations on these blocks. Their execution is a key milestone that allows
29
Table of Contents
for the commencement of our offshore Angola drilling program, currently planned to begin within the next twelve months.
- •
- Under the Risk Services Agreement for Block 9, in order to preserve our rights in the block, we will be required to drill three wells, as well as acquire approximately 10,764 million square feet (1,000 square kilometers) of seismic data, and find at least one commercial discovery, within four years of its signing, subject to certain extensions. Thereafter, we will be required to commence production within four years of the date of the commercial discovery, subject to certain extensions. In order to guarantee these exploration work obligations under the Risk Services Agreement for Block 9, we and Nazaki are required to post a financial guarantee in the amount of approximately $87.5 million. Our share of this financial guarantee is approximately $54.7 million. In March 2010, we delivered a letter of credit to Sonangol for such amount. As we complete our work obligations under the Risk Services Agreement, the amount of this letter of credit will be reduced accordingly. We have the right to a 20 year production period. As is customary in Angola, we are required to make contributions for Angolan social projects and academic scholarships for Angolan citizens. We made such an initial contribution in March 2010 after the signing of the Risk Services Agreement and will make additional contributions upon each commercial discovery, upon project development sanction and each year after the commencement of production. We have a 40% working interest in Block 9, with Nazaki, Alper and Sonangol P&P holding lesser working interests in the block and sharing in the exploration, development and production costs associated with such block. Proportionate with our working interest in Block 9, we will receive 40% of a variable revenue stream that the Contractor Group will be allocated from Sonangol based on the Contractor Group's rate of return, calculated on a quarterly basis, and then reduced by applicable Angolan taxes and royalties. The Contractor Group's rate of return for each quarter will be determined by the Contractor Group's variable revenue stream from oil production less expenditures and Angolan taxes and royalties from the block. The variable revenue stream paid by Sonangol to the Contractor Group ranges from 72 to 95%, and is inversely related to the size of the applicable rate of return. The Angolan taxes and royalties applicable to the variable revenue stream include the petroleum production tax (at a current tax rate of 20% applied to the Contractor Group's variable revenue stream), the petroleum transaction tax (at a current tax rate of 70% applied to the Contractor Group's variable revenue stream less expenditures less the Contractor Group's specified production allowance, which ranges from 55% to 95% of the Contractor Group's variable revenue stream depending inversely on the Contractor Group's rate of return) and the petroleum income tax (at a current tax rate of 65.75% applied to the Contractor Group's variable revenue stream less expenditures and less petroleum production and petroleum transaction taxes paid).
- •
- Under the Risk Services Agreement for Block 21, in order to preserve our rights in the block, we will be required to drill four wells and find at least one commercial discovery, within five years of its signing, subject to certain extensions. Thereafter, we will be required to commence production within four years of the date of the commercial discovery. In order to guarantee these exploration work obligations under the Risk Services Agreement for Block 21, we and Nazaki are required to post a financial guarantee in the amount approximately $147.5 million. Our share of this financial guarantee is approximately $92.2 million. In March 2010, we delivered a letter of credit to Sonangol for such amount. As we complete our work obligations under the Risk Services Agreement, the amount of this letter of credit will be reduced accordingly. We have the right to a 25 year production period. As is customary in Angola, we are required to make contributions for Angolan social projects and academic scholarships for Angolan citizens. We made such an initial contribution in March 2010 after the signing of the Risk Services Agreement and will make additional contributions upon each commercial discovery, upon project development sanction and each year after the commencement of production. We have a 40% working interest in Block 21, with Nazaki, Alper and Sonangol P&P
30
Table of Contents
holding lesser working interests in the block and sharing in the exploration, development and production costs associated with such block. Proportionate with our working interest in Block 21, we will receive 40% of a variable revenue stream that the Contractor Group will be allocated from Sonangol based on the Contractor Group's rate of return, calculated on a quarterly basis, and then reduced by applicable Angolan taxes and royalties. The Contractor Group's rate of return for each quarter will be determined by the Contractor Group's variable revenue stream from oil production less expenditures and Angolan taxes and royalties from the block. The variable revenue stream paid by Sonangol to the Contractor Group ranges from 60 to 96%, and is inversely related to the size of the applicable rate of return. The Angolan taxes and royalties applicable to the variable revenue stream include the petroleum production tax (at a current tax rate of 20% applied to the Contractor Group's variable revenue stream), the petroleum transaction tax (at a current tax rate of 70% applied to the Contractor Group's variable revenue stream less expenditures less the Contractor Group's specified production allowance, which ranges from 35% to 90% of the Contractor Group's variable revenue stream depending inversely on the Contractor Group's rate of return) and the petroleum income tax (at a current tax rate of 65.75% applied to the Contractor Group's variable revenue stream less expenditures and less petroleum production and petroleum transaction taxes paid).
Competition
The oil and gas industry is highly competitive. We encounter strong competition from other independent and major oil and gas companies in acquiring properties and securing trained personnel. Many of these competitors have financial and technical resources and staffs substantially larger than ours. As a result, our competitors may be able to pay more for desirable oil and gas properties, or to evaluate, bid for and purchase a greater number of properties than our financial or personnel resources will permit. Furthermore, these companies may also be better able to withstand the financial pressures of unsuccessful drill attempts, sustained periods of volatility in financial markets and generally adverse global and industry-wide economic conditions, and may be better able to absorb the burdens resulting from changes in relevant laws and regulations, which would adversely affect our competitive position.
We are also affected by competition for drilling rigs and the availability of related equipment. To the extent that in the future we acquire and develop undeveloped properties, higher commodity prices generally increase the demand for drilling rigs, supplies, services, equipment and crews, and can lead to shortages of, and increasing costs for, drilling equipment, services and personnel. Over the past three years, oil and gas companies have experienced higher drilling and operating costs. Shortages of, or increasing costs for, experienced drilling crews and equipment and services could restrict our ability to drill wells and conduct our operations.
Competition is also strong for attractive oil and gas producing properties, undeveloped leases and drilling rights, and we cannot assure you that we will be able to compete satisfactorily when attempting to make further acquisitions.
Title to Property
We believe that we have satisfactory title to our prospect interests in accordance with standards generally accepted in the oil and gas industry. In West Africa, we currently have a license on the Diaba Block offshore Gabon, and licenses for Blocks 9 and 21 offshore Angola. We also have contractual rights with respect to one additional block offshore Angola. Our prospect interests are subject to customary royalty and other interests, liens under operating agreements, liens for current taxes, and other burdens, easements, restrictions and encumbrances customary in the oil and gas industry that we believe do not materially interfere with the use of or affect our carrying value of the prospect interests.
31
Table of Contents
Environmental Matters and Regulation
We are, and our future operations will be, subject to various stringent and complex international, foreign, federal, state and local environmental, health and safety laws and regulations governing matters including the emission and discharge of pollutants into the ground, air or water; the generation, storage, handling, use and transportation of regulated materials; and the health and safety of our employees. These laws and regulations may, among other things:
- •
- require the acquisition of various permits before drilling commences;
- •
- enjoin some or all of the operations of facilities deemed not in compliance with permits;
- •
- restrict the types, quantities and concentration of various substances that can be released into the environment in connection with oil and natural gas drilling, production and transportation activities;
- •
- limit or prohibit drilling activities in certain locations lying within protected or otherwise sensitive areas; and
- •
- require remedial measures to mitigate pollution from our operations.
These laws and regulations may also restrict the rate of oil and natural gas production below the rate that would otherwise be possible. Compliance with these laws can be costly; the regulatory burden on the oil and gas industry increases the cost of doing business in the industry and consequently affects profitability.
Moreover, public interest in the protection of the environment has increased in recent years. Offshore drilling in some areas has been opposed by environmental groups and, in other areas, has been restricted. Our operations could be adversely affected to the extent laws are enacted or other governmental action is taken that prohibits or restricts offshore drilling or imposes environmental requirements that result in increased costs to the oil and gas industry in general, such as more stringent or costly waste handling, disposal or cleanup requirements.
The following is a summary of some of the existing laws or regulatory issues to which we and our business operations are or may be subject to in the future.
The U.S. Oil Pollution Act of 1990 ("OPA") and regulations thereunder impose liability on responsible parties for damages resulting from oil spills into or upon navigable waters or in the exclusive economic zone of the U.S. Liability under the OPA is strict, joint and several and potentially unlimited. A "responsible party" under the OPA includes the lessee or permittee of the area in which an offshore facility is located. The OPA also requires the lessee or permittee of the offshore area in which a covered offshore facility is located to establish and maintain evidence of financial responsibility to cover potential liabilities related to an oil spill for which such person would be statutorily responsible in an amount that depends on the risk represented by the quantity or quality of oil handled by such facility. The MMS of the U.S. Department of the Interior ("DOI") has promulgated regulations that implement the financial responsibility requirements of the OPA. A failure to comply with the OPA's requirements or inadequate cooperation during a spill response action may subject a responsible party to civil, administrative and/or criminal enforcement actions.
The U.S. Federal Water Pollution Control Act of 1972, as amended ("CWA"), imposes restrictions and controls on the discharge of pollutants, produced waters and other oil and natural gas wastes into
32
Table of Contents
waters of the U.S. These controls have become more stringent over the years, and it is possible that additional restrictions will be imposed in the future. Under the CWA, permits must be obtained to discharge pollutants into regulated waters. In addition, certain state regulations and the general permits issued under the federal National Pollutant Discharge Elimination System program prohibit discharge of produced waters and sand, drilling fluids, drill cuttings and certain other substances related to the oil and gas industry into certain coastal and offshore waters. The CWA provides for civil, criminal and administrative penalties for unauthorized discharges of oil and other hazardous substances and imposes liability on parties responsible for those discharges for the costs of cleaning up related damage and for natural resource damages resulting from the release. Comparable state statutes impose liabilities and authorize penalties in the case of an unauthorized discharge of petroleum or its derivatives, or other hazardous substances, into state waters.
Executive Order 13158, issued in 2000, directs federal agencies to safeguard existing Marine Protected Areas ("MPAs") in the U.S. and establish new MPAs. The order requires federal agencies to avoid harm to MPAs to the extent permitted by law and to the maximum extent practicable. It also directs the U.S. Environmental Protection Agency ("EPA") to propose regulations under the CWA to ensure appropriate levels of protection for the marine environment. This order and related CWA regulations have the potential to adversely affect our operations by restricting areas in which we may carry out future development and exploration projects and/or causing us to incur increased operating expenses.
Our operations frequently require licenses, permits and other governmental approvals. Several federal statutes, including the Outer Continental Shelf Lands Act ("OCSLA"), the National Environmental Policy Act ("NEPA"), and the Coastal Zone Management Act ("CZMA") require federal agencies to evaluate environmental issues in connection with granting such approvals or taking other major agency actions. OCSLA, for instance, requires the DOI to evaluate whether certain proposed activities would cause serious harm or damage to the marine, coastal or human environment, and gives the DOI authority to refuse to issue, suspend or revoke permits and licenses allowing such activities in certain circumstances, including when there is a threat of serious harm or damage to the marine, coastal or human environment. Similarly, NEPA requires DOI and other federal agencies to evaluate major agency actions having the potential to significantly impact the environment. In the course of such evaluations, an agency must prepare an environmental assessment and, potentially, an environmental impact statement. CZMA, on the other hand, aids states in developing a coastal management program to protect the coastal environment from growing demands associated with various uses, including offshore oil and natural gas development. In obtaining various approvals from the DOI, we will have to certify that we will conduct our activities in a manner consistent with any applicable CZMA program. Violation of these requirements may result in civil, administrative or criminal penalties.
Wastes containing naturally occurring radioactive materials ("NORM"), may also be generated in connection with our operations. Certain oil and natural gas exploration and production activities may enhance the radioactivity of NORM. In the U.S., NORM is subject primarily to regulation under individual state radiation control regulations. In addition, NORM handling and management activities are governed by regulations promulgated by the Occupational Safety and Health Administration. These regulations impose certain requirements concerning worker protection; the treatment, storage and
33
Table of Contents
disposal of NORM waste; the management of waste piles, containers and tanks containing NORM; and restrictions on the uses of land with NORM contamination.
The U.S. Resource Conservation and Recovery Act, ("RCRA"), and comparable state statutes regulate the generation, transportation, treatment, storage, disposal and cleanup of hazardous and non-hazardous wastes. Under the auspices of the EPA, individual states administer some or all of the provisions of RCRA, sometimes in conjunction with their own more stringent requirements. Drilling fluids, produced waters, and most of the other wastes associated with the exploration, development and production of crude oil or natural gas are currently exempt from RCRA's requirements pertaining to hazardous waste and are regulated under RCRA's non-hazardous waste and other regulatory provisions. A similar exemption is contained in many of the state counterparts to RCRA. At various times in the past, proposals have been made to amend RCRA to rescind the exemption that excludes oil and natural gas exploration and production wastes from regulation as hazardous waste. Accordingly, it is possible that certain oil and natural gas exploration and production wastes now classified as non-hazardous could be classified as hazardous wastes in the future. Any such change could result in an increase in our costs to manage and dispose of wastes, which could have a material adverse effect on our results of operations and financial position. Also, in the course of our operations, we expect to generate some amounts of ordinary industrial wastes, such as waste solvents and waste oils, that may be regulated as hazardous wastes.
The U.S. Clean Air Act ("CAA") and state air pollution laws adopted to fulfill its mandates provide a framework for national, state and local efforts to protect air quality. Our operations will utilize equipment that emits air pollutants subject to federal and state air pollution control laws. These laws require utilization of air emissions abatement equipment to achieve prescribed emissions limitations and ambient air quality standards, as well as operating permits for existing equipment and construction permits for new and modified equipment. Federal and state regulatory agencies can impose administrative, civil and criminal penalties for non-compliance with air permits or other requirements of the CAA and associated state laws and regulations, including the suspension or termination of permits and monetary fines.
The U.S. Comprehensive Environmental Response, Compensation and Liability Act of 1980, as amended ("CERCLA"), also known as "Superfund," imposes joint and several liability for response costs at certain contaminated properties and damages to natural resources, without regard to fault or the legality of the original act, on some classes of persons who are considered to be responsible for the release of a hazardous substance into the environment. These persons include the current or past owner or operator of the site where the release occurred and anyone who disposed or arranged for the disposal of a hazardous substance at the site. CERCLA also authorizes the EPA and, in some instances, third parties to act in response to threats to the public health or the environment and to seek to recover from the responsible classes of persons the costs they incur.
The federal Endangered Species Act, the federal Marine Mammal Protection Act, and similar federal and state wildlife protection laws prohibit or restrict activities that could adversely impact protected plant and animal species or habitats. Oil and natural gas exploration and production activities could be prohibited or delayed in areas where such protected species or habitats may be located, or expensive mitigation may be required to accommodate such activities.
34
Table of Contents
Climate change regulation has gained momentum in recent years internationally and domestically at the federal, regional, state and local levels. Various U.S. regions and states have already adopted binding climate change legislation. In addition, federal climate change regulation appears imminent. For example, in June 2009, the U.S. House of Representatives approved the American Clean Energy and Security Act of 2009 which, if adopted into law, would require significant reductions in emissions of greenhouse gases via a federal cap-and-trade system to which a variety of emitters, including certain electricity generators and certain producers and importers of specified fuels, would be subject. The U.S. Senate is currently working on companion bills, which could result in federal binding legislation. The EPA, in a parallel track, has proposed greenhouse gas regulation. In April 2009, the EPA proposed its so-called "endangerment finding", i.e., a determination under the CAA that greenhouse gases contribute to air pollution which may endanger public health or welfare. In September 2009, the EPA proposed two rules—one which would regulate greenhouse gas emissions from vehicles and a second which provides that once the endangerment finding and the vehicle rule are finalized, greenhouse gas emissions from various facilities and other stationary sources would be regulated under the CAA. These EPA rules are expected to be finalized on or before April 2010, and take effect in 2011.
On the international level, various nations, including Angola and Gabon, have committed to reducing their greenhouse gas emissions pursuant to the Kyoto Protocol. Passage of a successor international agreement, US federal climate change regulation or laws or climate change regulation in other regions in which we conduct business could have an adverse effect on our results of operations, financial condition and demand for oil and natural gas.
Our operations are and will be subject to the requirements of the federal Occupational Safety and Health Act ("OSH Act") and comparable state statutes. These laws and their implementing regulations strictly govern the protection of the health and safety of employees. The OSH Act hazard communication standard, EPA community right-to-know regulations under Title III of the Superfund Amendments and Reauthorization Act of 1986 and similar state statutes require that we organize and/or disclose information about hazardous materials used or produced in our operations. Such laws and regulations also require us to ensure our workplaces meet minimum safety standards and provide for compensation to employees injured as a result of our failure to meet these standards as well as civil and/or criminal penalties in certain circumstances.
Accidental spills or releases may occur in the course of our future operations, and we cannot assure you that we will not incur substantial costs and liabilities as a result, including costs relating to claims for damage to property and persons. Moreover, environmental laws and regulations are complex, change frequently and have tended to become more stringent over time. Accordingly, we cannot assure you that we have been or will be at all times in compliance with such laws, or that environmental laws and regulations will not change or become more stringent in the future in a manner that could have a material adverse effect on our financial condition, results of operations or ability to make distributions to you.
The oil and gas industry is regulated by numerous federal, state and local authorities. Legislation affecting the oil and gas industry is under constant review for amendment or expansion, frequently increasing the regulatory burden. Also, numerous departments and agencies, both federal and state, are authorized by statute to issue rules and regulations binding on the oil and gas industry and its individual members, some of which carry substantial penalties for failure to comply. Although the regulatory burden on the oil and gas industry may increase our cost of doing business by increasing the
35
Table of Contents
future cost of transporting our production to market, these burdens generally do not affect us any differently or to any greater or lesser extent than they affect other companies in the industry with similar types, quantities and locations of production.
The Department of Homeland Security Appropriations Act of 2007 requires the Department of Homeland Security ("DHS") to issue regulations establishing risk-based performance standards for the security of chemical and industrial facilities, including oil and natural gas facilities that are deemed to present "high levels of security risk." The DHS is currently in the process of adopting regulations that will determine whether our operations may in the future be subject to DHS-mandated security requirements. Presently, it is not possible to accurately estimate the costs we could incur, directly or indirectly, to comply with any such facility security laws or regulations, but such expenditures could be substantial.
Development and production operations are subject to various types of regulation at federal, state and local levels. These types of regulation include requiring permits for the drilling of wells, the posting of bonds in connection with various types of activities and filing reports concerning operations. U.S. laws under which we operate may also regulate one or more of the following:
- •
- the location of wells;
- •
- the method of drilling and casing wells;
- •
- the surface use and restoration of properties upon which wells are drilled;
- •
- the plugging and abandoning of wells; and
- •
- notice to surface owners and other third parties.
The availability, terms and cost of transportation significantly affect sales of natural gas. Federal and state regulations govern the price and terms for access to natural gas pipeline transportation. The interstate transportation and sale for resale of natural gas is subject to federal regulation, including regulation of the terms, conditions and rates for interstate transportation, storage and various other matters, primarily by the Federal Energy Regulatory Commission, or FERC. The FERC's regulations for interstate natural gas transmission in some circumstances may also affect the intrastate transportation of natural gas. Upon us reaching the production stage of our business model, such regulations will be applicable to us.
Although gas prices are currently unregulated, Congress historically has been active in the area of gas regulation. We cannot predict whether new legislation to regulate natural gas might be proposed, what proposals, if any, might actually be enacted by Congress or the various state legislatures, and what effect, if any, the proposals might have on the operations of the underlying properties. Sales of condensate and natural gas liquids are not currently regulated and are made at market prices.
The transportation of drilling rigs to the sites of our prospects in the U.S. Gulf of Mexico and our operation of such drilling rigs is subject to the rules and regulations of the U.S. Coast Guard and the U.S. Customs Service. Such regulation sets safety standards, authorizes investigations into vessel operations and accidents and governs the passage of vessels into U.S. territory. We are required by these agencies to obtain various permits, licenses and certificates with respect to our operations.
36
Table of Contents
Our exploration and production activities offshore Angola and Gabon are subject to Angolan and Gabonese regulation, respectively. These regulations may govern licensing for drilling operations, mandatory involvement of local partners in our operations, taxation of our revenues, safety and environmental matters and our ability to operate in such jurisdictions as a foreign participant.
Failure to comply with these laws and regulations also may result in the suspension or termination of our operations and subject us to administrative, civil and criminal penalties. Moreover, these laws and regulations could change in ways that could substantially increase our costs.
Employees
As of December 31, 2009, we had 56 employees. All employees are currently located in the U.S. None of these employees are represented by labor unions or covered by any collective bargaining agreement. We believe that relations with our employees are satisfactory. In addition, as of December 31, 2009, we had approximately 16 consultants and secondees working in our office.
Offices
We currently lease approximately 22,000 square feet of office space at Two Post Oak Central, 1980 Post Oak Boulevard, Suite 1200, Houston, TX 77056, where our principal offices are located. The lease for this office space expires on August 31, 2011. In March 2010, we entered into a sublease for an additional 9,233 square feet in the same building. This sublease expires on March 31, 2011.
Corporate Information
We were incorporated pursuant to the laws of the State of Delaware as Cobalt International Energy, Inc. in August 2009 to become a holding company for Cobalt International Energy, L.P. Cobalt International Energy, L.P. was formed as a limited partnership on November 10, 2005 pursuant to the laws of the State of Delaware. Pursuant to the terms of a corporate reorganization that we completed in connection with our initial public offering, all of the interests in Cobalt International Energy, L.P. were exchanged for common stock of Cobalt International Energy, Inc. and as a result Cobalt International Energy, L.P. is wholly-owned by Cobalt International Energy, Inc. Our web site iswww.cobaltintl.com. The information on our web site does not constitute part of this Annual Report on Form 10-K.
Executive Officers
The following table sets forth certain information concerning our executive officers:
| | | | |
Name | | Age | | Position |
|---|
Joseph H. Bryant | | 54 | | Chairman of the Board of Directors and Chief Executive Officer |
Samuel H. Gillespie | | 67 | | General Counsel and Executive Vice President |
Rodney L. Gray | | 57 | | Chief Financial Officer and Executive Vice President |
James H. Painter | | 52 | | Executive Vice President, Gulf of Mexico |
Van P. Whitfield | | 58 | | Executive Vice President, Operations and Development |
James W. Farnsworth | | 54 | | Chief Exploration Officer |
Lynne L. Hackedorn | | 51 | | Vice President, Land |
Richard A. Smith | | 50 | | Vice President |
John P. Wilkirson | | 52 | | Vice President, Strategic Planning and Investor Relations |
37
Table of Contents
Biographical information
Joseph H. Bryant has been our Chief Executive Officer and Chairman of our Board of Directors since our inception in November 2005. Mr. Bryant has 32 years of experience in the oil and gas industry. Prior to joining Cobalt, from September 2004 to September 2005, he was President and Chief Operating Officer of Unocal Corporation, an oil and gas exploration and production company. From May 2000 to August 2004, Mr. Bryant was President of BP Exploration (Angola) Limited, from January 1997 to May 2000, Mr. Bryant was President of BP Canada Energy Company (including serving as President of Amoco Canada Petroleum Co. between January 1997 and May 2000, prior to its merger with BP Canada), and from 1993 to 1996, Mr. Bryant served as President of a joint venture between Amoco Orient Petroleum Company and the China National Offshore Oil Corporation focused on developing the offshore Liuhua fields. Prior to 1993, Mr. Bryant held executive leadership positions in Amoco Production Company's business units in The Netherlands and the Gulf of Mexico, serving in many executive capacities and in numerous engineering, financial and operational roles throughout the continental United States. Mr. Bryant currently also serves on the board of directors of the Berry Petroleum Company, an independent energy company. Mr. Bryant holds a Bachelor of Science in Mechanical Engineering from the University of Nebraska.
Samuel H. Gillespie has been our General Counsel and Executive Vice President since our inception in November 2005. He served as Vice Chairman of our Board of Directors from our inception until October 2009. Mr. Gillespie has 29 years of experience in the oil and gas industry. Prior to joining Cobalt, from 2003 to 2005, Mr. Gillespie was Senior Vice President and General Counsel of Unocal Corporation. From 2001 to 2003, Mr. Gillespie was Special Counsel at Skadden, Arps, Meagher & Flom, LLP & Affiliates. From 1994 to 2001, Mr. Gillespie was Senior Vice President and General Counsel of Mobil Corporation. While at these companies Mr. Gillespie led key negotiations, including Mobil Corporation's global merger with Exxon Corporation and Unocal Corporation's merger with Chevron Corporation. He was also instrumental in the expansion of Mobil Corporation's and Unocal Corporation's exploration and production opportunities in Kazakhstan, Turkmenistan, Qatar, Indonesia, Thailand, Bangladesh, Russia, Azerbaijan, Nigeria, Cameroon, Vietnam, Venezuela and Peru. Mr. Gillespie holds a Bachelor of Arts from Middlebury College and a J.D. from Vanderbilt University.
Rodney L. Gray has been our Chief Financial Officer and Executive Vice President since June 2009. Mr. Gray has more than 30 years of experience in the energy industry, including a number of executive and financial leadership roles. Prior to joining Cobalt, from 2003 to 2009, he served as Chief Financial Officer of Colonial Pipeline Co., an interstate carrier of petroleum products. From October 1992 until his departure from Enron Corporation, an energy company, in July 1998, he served in the positions of Senior VP of Finance and Treasurer, Chairman and CEO of Enron International, Managing Director of Enron Development Corp., Chairman, CEO and President of Enron Global Power and Pipelines, and Executive VP, Finance of Enron International. In various periods from July 1998 to November 1998, Mr. Gray served as a Director and Vice Chairman, Finance, Risk Management and Investments and Chief Financial Officer and Executive Director, Finance, Risk Management and Investments of Azurix Corp., the water services division of Enron Corporation. Mr. Gray has served on the Board of Directors of Regency GP LLC, a midstream natural gas services provider, since February 2008. Mr. Gray holds a Bachelor of Science in Accounting from the University of Wyoming and a Bachelor of Science in Mathematics and Economics from Rocky Mountain College in Billings, Montana.
James H. Painter joined Cobalt in November 2005 and currently serves as our Executive Vice President, Gulf of Mexico. Mr. Painter has more than 25 years of experience in the oil and gas industry. Prior to joining Cobalt, from February 2004 to September 2005, Mr. Painter was the Senior Vice President of Exploration and Technology at Unocal Corporation. Prior to his position at Unocal Corporation (following the merger between Ocean Energy Inc. and Devon Energy Corporation), from
38
Table of Contents
April 2003 to October 2003, Mr. Painter served as the Vice President of Exploration at Devon Energy Corporation, an oil and gas exploration and production company. From January 1995 to April 2003, Mr. Painter served in various manager and executive positions at Ocean Energy Inc. (and its predecessor Flores and Rucks, Inc.) with his final position as Senior Vice President of Gulf of Mexico and International Exploration. Additional industry experience includes positions at Forest Oil Corporation, an independent oil and gas exploration and production company, Mobil Oil Corporation and Superior Oil Company, Inc. Mr. Painter holds a Bachelor of Science in Geology from Louisiana State University.
Van P. Whitfield joined Cobalt in May 2006 and currently serves as our Executive Vice President, Operations and Development. Mr. Whitfield has over 35 years of experience leading oil and gas production operations and marketing activities in North America, the United Kingdom and Europe, the Middle East and Asia. Prior to joining Cobalt, from May 2003 to May 2005, Mr. Whitfield served as Senior Vice President, Western Operations of CDX Gas LLC, an independent oil and gas company. From October 2002 to April 2003 he served as Production Unit Leader for the Angola Liquid Natural Gas Project, BP Exploration (Angola) Limited and from June 2001 to October 2002, he held the position of Vice President, Power and Water of ExxonMobil Saudi Arabia (Southern Ghawar) Ltd, an exploration and production company. Mr. Whitfield has also held the positions of Senior Vice President of BP Global Power, President and General Manager of Amoco Netherlands BV and Production Manager of Amoco (U.K.) Exploration Company, both exploration and production companies. In addition, he has held numerous operational and technical leadership positions in various Amoco Production Company locations, including: the position of Production Manager, West Texas and Engineering Manager, Worldwide. Mr. Whitfield has a Bachelor of Science Degree—Petroleum Engineering from Louisiana State University and is a graduate of the Executive Program at Stanford University.
James W. Farnsworth has been our Chief Exploration Officer since our inception in November 2005. Mr. Farnsworth has had more than 25 years of experience in the oil and gas industry. From 2003 to 2005, Mr. Farnsworth held the position of Vice President of World-Wide Exploration and Technology, at BP p.l.c., a global energy company, responsible for BP p.l.c.'s global exploration business inclusive of North America, West Africa, North Africa, South America, Russia and the Far East. His prior positions at BP p.l.c., from 1983 to 2003, include: Vice President of North America Exploration; Vice President of Gulf of Mexico Exploration; Exploration Manager for Alaska; Deepwater Gulf of Mexico Production Manager for Non-operated Fields. Mr. Farnsworth has a Bachelor of Science Degree in Geology from Indiana University and a Masters of Science Degree in Geophysics from Western Michigan University.
Lynne L. Hackedorn joined Cobalt in April 2006 and currently serves as Vice President, Land. Ms. Hackedorn has 25 years of experience in the oil and gas industry. Prior to joining Cobalt, from 2001 to 2006, Ms. Hackedorn served as Senior Landman at Hydro Gulf of Mexico, L.L.C., formerly Spinnaker Exploration Company, L.L.C., an oil and gas exploration and production company, handling a variety of land functions within both the shelf and deepwater areas of the Gulf of Mexico. From 1998 to 2001, Ms. Hackedorn held both technical and management positions within the offshore Gulf of Mexico regions of the merged companies of Sonat Exploration GOM, Inc. and El Paso Production GOM, Inc., both oil and gas exploration and production companies, and was instrumental in negotiating and closing several key land deals. From 1994 to 1998, Ms. Hackedorn was a Landman with Zilkha Energy Company, also an oil and gas exploration and production company, where she performed all areas of land functions relating to the Gulf of Mexico, with emphasis on negotiating and drafting agreements, as well as participation in Federal and Louisiana State lease sales. Ms. Hackedorn began her career as a Landman in 1984 at ARCO Oil and Gas Company, where she worked in the onshore South Texas region from 1984 until 1990, and then in the offshore Gulf of Mexico region from 1990 until 1994. Ms. Hackedorn earned her Bachelor of Science in Petroleum Land Management from the University of Houston, graduating Magna Cum Laude.
39
Table of Contents
Richard A. Smith joined Cobalt in October 2007 and currently serves as a Vice President. Mr. Smith has over 27 years of oil and gas industry experience in North American and international markets. Prior to joining Cobalt, from September 2005 to September 2007, Mr. Smith was Vice President, Joint Venture Development Corporate Affairs for the BP Russia Offshore Strategic Performance Unit, an oil and gas exploration and production unit of BP. From February 2002 to August 2005, he held the position of Vice President and then Executive Director for BP Exploration (Angola) Limited, an oil and gas exploration and production company operating in Angola. Mr. Smith's additional industry experience includes leadership positions at various companies in the oil and gas industry operating in Azerbaijan, Georgia, Turkey, the United Kingdom, the United States and Canada, as such positions pertain to new business strategy and development, commercial negotiation management, asset disposition rationalization, joint venture management, performance management and inter-company reorganizations. Further industry experience includes involvement in negotiations with various national governments, state oil companies and regulatory institutions relating to oil and natural gas operations. Mr. Smith holds a Bachelor of Commerce from the University of Calgary.
John P. Wilkirson joined Cobalt in 2007 and currently serves as Vice President, Strategic Planning and Investor Relations. Mr. Wilkirson has over 25 years of experience in the energy industry. Prior to joining Cobalt, from 1998 to 2005, Mr. Wilkirson was Vice President, Strategic Planning and Economics of Unocal Corporation, where his primary responsibilities included identifying and addressing major strategic issues, managing the global asset and investment portfolio, leading the economic analysis and evaluations function and overseeing performance management. He played an instrumental role as the integration executive for Unocal Corporation's merger into Chevron Corporation. Prior to Unocal Corporation, from 1992 to 1997, Mr. Wilkirson was an Engagement Manager at McKinsey & Company, Inc., a management consulting firm, serving energy clients on strategy and performance improvement engagements. Additional industry experience includes positions at Exxon Company USA from 1980 to 1984 and Sohio Petroleum Company and British Petroleum from 1984 to 1991, in petroleum engineering and commercial assignments. Mr. Wilkirson has a Bachelor of Science with Highest Honors in Petroleum Engineering and a Master of Business Administration from the University of Texas at Austin.
Item 1A. Risk Factors
You should consider and read carefully all of the risks and uncertainties described below, together with all of the other information contained in this Annual Report on Form 10-K, including the consolidated financial statements and the related notes appearing at the end of this Annual Report on Form 10-K. If any of the following risks actually occurs, our business, business prospects, financial condition, results of operations or cash flows could be materially adversely affected. The risks below are not the only ones facing our company. Additional risks not currently known to us or that we currently deem immaterial may also adversely affect us. this Annual Report on Form 10-K also contains forward-looking statements, estimates and projections that involve risks and uncertainties. Our actual results could differ materially from those anticipated in the forward-looking statements as a result of specific factors, including the risks described below.
Risks Relating to Our Business
We have no proved reserves and areas that we decide to drill may not yield oil in commercial quantities or quality, or at all.
We have no proved reserves. We have identified prospects based on available seismic and geological information that indicates the potential presence of oil. However, the areas we decide to drill may not yield oil in commercial quantities or quality, or at all. Most of our current prospects are in various stages of evaluation that will require substantial additional seismic data reprocessing and interpretation. Even when properly used and interpreted, 2-D and 3-D seismic data and visualization
40
Table of Contents
techniques are only tools used to assist geoscientists in identifying subsurface structures and hydrocarbon indicators and do not enable the interpreter to know whether hydrocarbons are, in fact, present in those structures. Exploratory wells have been drilled on only three of our prospects. Accordingly, we do not know if any of our prospects will contain oil in sufficient quantities or quality to recover drilling and completion costs or to be economically viable. Even if oil is found on our prospects in commercial quantities, construction costs of oil pipelines or floating production systems, as applicable, and transportation costs may prevent such prospects from being economically viable.
Additionally, the analogies drawn by us from available data from other wells, more fully explored prospects or producing fields may not prove valid in respect of our drilling prospects. We may terminate our drilling program for a prospect if data, information, studies and previous reports indicate that the possible development of our prospect is not commercially viable and, therefore, does not merit further investment. If a significant number of our prospects do not prove to be successful, our business, financial condition and results of operations will be materially adversely affected.
Furthermore, recent pre-salt hydrocarbon discoveries in Brazil and onshore West Africa, and the successful results of drilling achieved there, may prove not to be analogies for our properties offshore West Africa. To date, no exploratory wells have been drilled which have targeted the pre-salt horizon in the deepwater offshore Angola and Gabon.
The inboard Lower Tertiary trend in the deepwater U.S. Gulf of Mexico, an area in which we intend to focus a substantial amount of our exploration efforts, has only recently been considered as a potentially economically viable production area due to the costs and difficulties involved in drilling for oil at such depths. To date there has not been commercially successful production in the Lower Tertiary trend. We may not be successful in developing commercially viable production in this trend.
We face substantial uncertainties in estimating the characteristics of our prospects, so you should not place undue reliance on any of our estimates.
In this Annual Report on Form 10-K we provide estimates of the characteristics of our prospects, such as the mean area (acres) and mean net pay thickness (feet), for the basins in which our prospects are located. These estimates may be incorrect, as the accuracy of these estimates is a function of the available data, geological interpretation and judgment. To date, only three of our prospects have been drilled. Any analogies drawn by us from other wells, prospects or producing fields may not prove to be accurate indicators of the success of developing reserves from our prospects. Furthermore, we have no way of evaluating the accuracy of the data from analog wells or prospects produced by other parties which we may use.
It is possible that none of the drilled wells will find underground accumulations of oil. Any significant variance between actual results and our assumptions could materially affect the quantities of oil attributable to any particular group of properties. In this Annual Report on Form 10-K, we refer to the "mean" of the estimated data. This measurement is statistically calculated based on a range of possible values of such estimates, with such ranges being particularly large in scope. Therefore, there may be large discrepancies between the mean estimate provided in this Annual Report on Form 10-K and our actual results.
Drilling wells is speculative, often involving significant costs that may be more than our estimates, and may not result in any discoveries or additions to our future production or reserves. Any material inaccuracies in drilling costs, estimates or underlying assumptions will materially affect our business.
Exploring for and developing oil reserves involves a high degree of operational and financial risk, which precludes definitive statements as to the time required and costs involved in reaching certain objectives. The budgeted costs of drilling, completing and operating wells are often exceeded and can increase significantly when drilling costs rise due to a tightening in the supply of various types of
41
Table of Contents
oilfield equipment and related services. Drilling may be unsuccessful for many reasons, including geological conditions, weather, cost overruns, equipment shortages and mechanical difficulties. Exploratory wells bear a much greater risk of loss than development wells. Moreover, the successful drilling of an oil well does not necessarily result in a profit on investment. With the exception of Heidelberg #2, all of the wells we plan to operate or participate in that are scheduled to be spud through mid-2010 are exploratory wells. A variety of factors, both geological and market-related, can cause a well to become uneconomic or only marginally economic. Our initial drilling sites, and any potential additional sites that may be developed, require significant additional exploration and development, regulatory approval and commitments of resources prior to commercial development. If our actual drilling and development costs are significantly more than our estimated costs, we may not be able to continue our business operations as proposed and would be forced to modify our plan of operation.
Our identified drilling locations are scheduled out over several years, making them susceptible to uncertainties that could materially alter the occurrence or timing of their drilling.
Our management team has identified and scheduled drilling locations on our acreage over a multi-year period. Our ability to drill and develop these locations depends on a number of factors, including the availability of equipment and capital, seasonal conditions, regulatory approvals, oil prices, costs and drilling results. The final determination on whether to drill any of these drilling locations will be dependent upon the factors described elsewhere in this Annual Report on Form 10-K as well as, to some degree, the results of our drilling activities with respect to our established drilling locations. Because of these uncertainties, we do not know if the drilling locations we have identified will be drilled within our expected timeframe or at all or if we will be able to economically produce oil from these or any other potential drilling locations. As such, our actual drilling activities may be materially different from our current expectations, which could adversely affect our results of operations and financial condition.
We will not be the operator on all of our prospects, and, therefore, we will not be able to control the timing of exploration or development efforts, associated costs, or the rate of production of any non-operated assets.
Currently, we expect that we will not be the operator on approximately 25% of our U.S. Gulf of Mexico blocks, and we will not be the operator on the Diaba Block offshore Gabon. As we carry out our exploration and development programs, we may enter into arrangements with respect to existing or future prospects that result in a greater proportion of our prospects being operated by others. As a result, we may have limited ability to exercise influence over the operations of the prospects operated by our partners. Dependence on the operator could prevent us from realizing our target returns for those prospects. Further, it may be difficult for us to pursue one of our key business strategies of minimizing the cycle time between discovery and initial production with respect to prospects for which we do not operate. The success and timing of exploration and development activities operated by our partners will depend on a number of factors that will be largely outside of our control, including:
- •
- the timing and amount of capital expenditures;
- •
- the operator's expertise and financial resources;
- •
- approval of other participants in drilling wells;
- •
- selection of technology; and
- •
- the rate of production of reserves, if any.
This limited ability to exercise control over the operations of some of our prospects may cause a material adverse effect on our results of operations and financial condition.
42
Table of Contents
We have no operating history and our future performance is uncertain.
We are a development stage enterprise and will continue to be so until commencement of substantial production from our oil properties, which will depend upon successful drilling results, additional and timely capital funding, and access to suitable infrastructure. We do not expect to commence production until 2013 to 2015 in the U.S. Gulf of Mexico or until 2014 to 2016 offshore Angola and Gabon, and therefore we do not expect to generate any revenue from production until 2013 at the earliest. Companies in their initial stages of development face substantial business risks and may suffer significant losses. We have generated substantial net losses and negative cash flows from operating activities since our inception and expect to continue to incur substantial net losses as we continue our drilling program. We face challenges and uncertainties in financial planning as a result of the unavailability of historical data and uncertainties regarding the nature, scope and results of our future activities. New companies must develop successful business relationships, establish operating procedures, hire staff, install management information and other systems, establish facilities and obtain licenses, as well as take other measures necessary to conduct their intended business activities. We may not be successful in implementing our business strategies or in completing the development of the infrastructure necessary to conduct our business as planned. In the event that one or more of our drilling programs is not completed, is delayed or terminated, our operating results will be adversely affected and our operations will differ materially from the activities described in this Annual Report on Form 10-K. As a result of industry factors or factors relating specifically to us, we may have to change our methods of conducting business, which may cause a material adverse effect on our results of operations and financial condition.
We are dependent on certain members of our management and technical team.
Investors in our common stock must rely upon the ability, expertise, judgment and discretion of our management and the success of our technical team in identifying, discovering and developing oil reserves. Our performance and success are dependent, in part, upon key members of our management and technical team, and their loss or departure could be detrimental to our future success. In making a decision to invest in our common stock, you must be willing to rely to a significant extent on our management's discretion and judgment. The loss of any of our management and technical team members could have a material adverse effect on our results of operations and financial condition, as well as on the market price of our common stock. See "Management."
Our business plan requires substantial additional capital, which we may be unable to raise on acceptable terms in the future, which may in turn limit our ability to develop our exploration and production plans.
We expect our capital outlays and operating expenditures to increase substantially over at least the next several years as we expand our operations. Exploration and production plans and obtaining seismic data are very expensive, and we expect that we will need to raise substantial additional capital, through future private or public equity offerings, strategic alliances or debt financing, before we achieve commercialization of any of our properties.
Our future capital requirements will depend on many factors, including:
- •
- the scope, rate of progress and cost of our exploration and production activities;
- •
- oil and natural gas prices;
- •
- our ability to locate and acquire hydrocarbon reserves;
- •
- our ability to produce oil or natural gas from those reserves;
- •
- the terms and timing of any drilling and other production-related arrangements that we may enter into;
43
Table of Contents
- •
- the cost and timing of governmental approvals and/or concessions; and
- •
- the effects of competition by larger companies operating in the oil and gas industry.
While we believe our operations will be adequately funded through 2011, we do not currently have any commitments for future external funding and we do not expect to generate any revenue from production before 2013. Additional financing may not be available on favorable terms, or at all. Even if we succeed in selling additional securities to raise funds, at such time the ownership percentage of our existing stockholders would be diluted, and new investors may demand rights, preferences or privileges senior to those of existing stockholders. If we raise additional capital through debt financing, the financing may involve covenants that restrict our business activities. If we choose to farm-out interests in our prospects, we may lose operating control over such prospects.
Assuming we are able to commence exploration and production activities or successfully exploit our properties during the primary lease term, our leases would extend beyond the primary term, generally for the life of production. If we are unable to drill an initial exploratory well or conduct such activity on such properties during this time, we may be subject to significant non-operating penalties and potential forfeiture of such properties. If we are not successful in raising additional capital, we may be unable to continue our exploration and production activities or successfully exploit our properties, and we may lose the rights to develop these properties upon the expiration of our leases.
A substantial or extended decline in oil prices may adversely affect our business, financial condition and results of operations.
The price that we will receive for our oil production will significantly affect our revenue, profitability, access to capital and future growth rate. Historically, the oil markets have been volatile and will likely continue to be volatile in the future. The prices that we will receive for our production and the levels of our production depend on numerous factors. These factors include, but are not limited to, the following:
- •
- changes in supply and demand for oil and natural gas;
- •
- the actions of the Organization of the Petroleum Exporting Countries ("OPEC");
- •
- the price and quantity of imports of foreign oil and natural gas;
- •
- speculation as to the future price of oil and the speculative trading of oil futures contracts;
- •
- global economic conditions;
- •
- political and economic conditions, including embargoes, in oil-producing countries or affecting other oil-producing activities, particularly in the Middle East, Africa, Russia and South America;
- •
- the continued threat of terrorism and the impact of military and other action, including U.S. military operations in the Middle East;
- •
- the level of global oil exploration and production activity;
- •
- the level of global oil inventories and oil refining capacities;
- •
- weather conditions and other natural disasters;
- •
- technological advances affecting energy consumption;
- •
- domestic and foreign governmental regulations;
- •
- proximity and capacity of oil pipelines and other transportation facilities;
- •
- the price and availability of competitors' supplies of oil; and
44
Table of Contents
- •
- the price and availability of alternative fuels.
Oil prices have fluctuated dramatically in recent times and will likely continue to be volatile in the future. Lower oil prices may not only decrease our revenues on a per unit basis but also may reduce the amount of oil that we can produce economically. A substantial or extended decline in oil prices may materially and adversely affect our future business, financial condition, results of operations, liquidity or ability to finance planned capital expenditures.
Our inability to access appropriate equipment and infrastructure in a timely manner may hinder our access to oil markets or delay our production.
Our ability to market our oil production will depend substantially on the availability and capacity of gathering systems, pipelines and processing facilities owned and operated by third parties. Our failure to obtain such services on acceptable terms could materially harm our business. We also rely on continuing access to drilling rigs suitable for the environment in which we operate. The delivery of the ENSCO 8503 and Ocean Monarch drilling rigs may be delayed or cancelled, and we may not be able to gain continued access to suitable rigs in the future. In addition, we will need to secure a rig in connection with our offshore Angola operations, which will require substantial involvement with Sonangol, who may consider factors other than our drill schedule. We may be required to shut in oil wells because of the absence of a market or because access to pipelines, gathering systems or processing facilities may be limited or unavailable. If that were to occur, then we would be unable to realize revenue from those wells until arrangements were made to deliver the production to market, which could cause a material adverse effect on our results of operations and financial condition.
We are subject to numerous risks inherent to the exploration and production of oil.
Oil exploration and production activities involve many risks that a combination of experience, knowledge and careful evaluation may not be able to overcome. Our future success will depend on the success of our exploration and production activities and on the future existence of the infrastructure that will allow us to take advantage of our findings. Additionally, our oil properties are located in deepwater, which generally increases the capital and operating costs, technical challenges and risks associated with oil exploration and production activities. As a result, our oil exploration and production activities are subject to numerous risks, including the risk that drilling will not result in commercially viable oil production. Our decisions to purchase, explore, develop or otherwise exploit prospects or properties will depend in part on the evaluation of seismic data through geophysical and geological analyses, production data and engineering studies, the results of which are often inconclusive or subject to varying interpretations.
Furthermore, the marketability of expected oil production from our prospects will also be affected by numerous factors. These factors include, but are not limited to, market fluctuations of prices, proximity, capacity and availability of pipelines, the availability of processing facilities, equipment availability and government regulations (including, without limitation, regulations relating to prices, taxes, royalties, allowable production, importing and exporting of oil, environmental protection and climate change). The effect of these factors, individually or jointly, may result in us not receiving an adequate return on invested capital.
In the event that our drilling programs are developed and become operational, they may not produce oil in commercial quantities or at the costs anticipated, and our projects may cease production, in part or entirely, in certain circumstances. Drilling programs may become uneconomic as a result of an increase in operating costs to produce oil. Our actual operating costs may differ materially from our current estimates. Moreover, it is possible that other developments, such as increasingly strict environmental, health and safety laws and regulations and enforcement policies thereunder and claims for damages to property or persons resulting from our operations, could result in substantial costs and liabilities, delays, an inability to complete our drilling programs or the abandonment of such drilling programs, which could cause a material adverse effect on our results of operations and financial condition.
45
Table of Contents
We are subject to drilling and other operational hazards.
The oil business involves a variety of operating risks, including, but not limited to:
- •
- blowouts, cratering and explosions;
- •
- mechanical and equipment problems;
- •
- uncontrolled flows of oil or well fluids;
- •
- fires;
- •
- marine hazards with respect to offshore operations;
- •
- formations with abnormal pressures;
- •
- pollution and other environmental risks; and
- •
- natural disasters.
These risks are particularly acute in deepwater drilling and exploration. Any of these events could result in loss of human life, significant damage to property, environmental damage, impairment of our operations and substantial losses. In accordance with customary industry practice, we expect to maintain insurance against some, but not all, of these risks and losses. The occurrence of any of these events whether or not covered by insurance, could have a material adverse effect on our financial position and results of operations.
The development schedule of oil projects, including the availability and cost of drilling rigs, equipment, supplies, personnel and oilfield services, is subject to delays and cost overruns.
Historically, some oil projects have experienced delays and capital cost increases and overruns due to, among other factors, the unavailability or high cost of drilling rigs and other essential equipment, supplies, personnel and oilfield services. The cost to develop our projects has not been fixed and remains dependent upon a number of factors, including the completion of detailed cost estimates and final engineering, contracting and procurement costs. Our construction and operation schedules may not proceed as planned and may experience delays or cost overruns. Any delays may increase the costs of the projects, requiring additional capital, and such capital may not be available in a timely and cost-effective fashion.
Our operations will involve special risks that could adversely affect operations.
Offshore operations are subject to a variety of operating risks specific to the marine environment, such as capsizing, collisions and damage or loss from hurricanes or other adverse weather conditions. These conditions can cause substantial damage to facilities and interrupt our operations. As a result, we could incur substantial expenses that could reduce or eliminate the funds available for exploration, development or leasehold acquisitions, or result in loss of equipment and properties. In particular, we are not intending to put in place business interruption insurance due to the fact that this is not economically viable, and therefore we may not be able to rely on insurance coverage in the event of such natural phenomena.
Deepwater exploration generally involves greater operational and financial risks than exploration on the shelf. Deepwater drilling generally requires more time and more advanced drilling technologies, involving a higher risk of technological failure and usually higher drilling costs. Such risks are particularly applicable to our deepwater exploration efforts in the Lower Tertiary trend and pre-salt offshore Angola and Gabon, as there has been limited drilling activity in these areas. In addition, there may be production risks of which we are currently unaware. Whether we use existing pipeline infrastructure, participate in the development of new subsea infrastructure or use floating production
46
Table of Contents
systems to transport oil from producing wells, if any, these operations may require substantial time for installation, or encounter mechanical difficulties and equipment failures that could result in significant cost overruns and delays. Furthermore, deepwater operations generally, and operations in the Lower Tertiary and offshore West Africa trends in particular, lack the physical and oilfield service infrastructure present on the shelf. As a result, a significant amount of time may elapse between a deepwater discovery and the marketing of the associated oil, increasing both the financial and operational risk involved with these operations. Because of the lack and high cost of this infrastructure, reserve discoveries we make in the deepwater, if any, may never be economically producible.
Our operations in the U.S. Gulf of Mexico may be adversely impacted by tropical storms and hurricanes.
Tropical storms, hurricanes and the threat of tropical storms and hurricanes often result in the shutdown of operations in the U.S. Gulf of Mexico as well as operations within the path and the projected path of the tropical storms or hurricanes. In the future, during a shutdown period, we may be unable to access wellsites and our services may be shut down. Additionally, tropical storms or hurricanes may cause evacuation of personnel and damage to offshore drilling rigs and other equipment, which may result in suspension of our operations. The shutdowns, related evacuations and damage can create unpredictability in activity and utilization rates, as well as delays and cost overruns, which may have a material adverse impact on our financial condition and results of operations.
The geographic concentration of our properties in the U.S. Gulf of Mexico and offshore Angola and Gabon subjects us to an increased risk of loss of revenue or curtailment of production from factors specifically affecting the U.S. Gulf of Mexico and offshore Angola and Gabon.
Our properties are concentrated in two regions: the U.S. Gulf of Mexico and offshore Angola and Gabon. Some or all of these properties could be affected should such regions experience:
- •
- severe weather;
- •
- delays or decreases in production, the availability of equipment, facilities, personnel or services;
- •
- delays or decreases in the availability of capacity to transport, gather or process production; and/or
- •
- changes in the regulatory and fiscal environment.
For example, oil properties located in the U.S. Gulf of Mexico were significantly damaged by Hurricanes Katrina and Rita, which required our competitors to spend a significant amount of time and capital on inspections, repairs, debris removal, and the drilling of replacement wells. Furthermore, oil properties offshore Angola and Gabon are subject to higher country risks than those properties under the sovereignty of the United States. We plan to maintain insurance coverage for only a portion of these risks. There also may be certain risks covered by insurance where the policy does not reimburse us for all of the costs related to a loss.
Due to the concentrated nature of our portfolio of properties, a number of our properties could experience any of the same conditions at the same time, resulting in a relatively greater impact on our results of operations than they might have on other companies that have a more diversified portfolio of properties.
Our non-U.S. operations may be adversely affected by political and economic circumstances in the countries in which we operate.
Our non-U.S. oil exploration, development and production activities are subject to political and economic uncertainties (including but not limited to changes, sometimes frequent or marked, in energy policies or the personnel administering them), expropriation of property, cancellation or modification of contract rights, foreign exchange restrictions, currency fluctuations, royalty and tax increases and other
47
Table of Contents
risks arising out of foreign governmental sovereignty over the areas in which our operations are conducted, as well as risks of loss due to civil strife, acts of war, guerrilla activities and insurrection. These risks may be higher in the developing countries in which we conduct our activities, namely, Angola and Gabon.
On June 8, 2009, Omar Bongo Ondimba, who had served as president of Gabon since 1967, passed away. While to date there has been little evidence of instability resulting from the succession of political and military power in Gabon, there can be no assurance that instability in the region will not result from Omar Bongo Ondimba's passing.
Our operations in these areas increase our exposure to risks of war, local economic conditions, political disruption, civil disturbance and governmental policies that may:
- •
- disrupt our operations;
- •
- restrict the movement of funds or limit repatriation of profits;
- •
- lead to U.S. government or international sanctions; and
- •
- limit access to markets for periods of time.
Countries in West Africa have experienced political instability in the past. Disruptions may occur in the future, and losses caused by these disruptions may occur that will not be covered by insurance. Consequently, our non-U.S. exploration, development and production activities may be substantially affected by factors which could have a material adverse effect on our financial condition and results of operations. Furthermore, in the event of a dispute arising from non-U.S. operations, we may be subject to the exclusive jurisdiction of courts outside the U.S. or may not be successful in subjecting non-U.S. persons to the jurisdiction of courts in the U.S., which could adversely affect the outcome of such dispute.
The oil and gas industry, including the acquisition of exploratory acreage in the U.S. Gulf of Mexico and offshore West Africa, is intensely competitive.
The international oil and gas industry, including in the U.S. Gulf of Mexico and West Africa, is highly competitive in all aspects, including the exploration for, and the development of, new sources of supply. We operate in a highly competitive environment for acquiring exploratory acreage and hiring and retaining trained personnel. Many of our competitors possess and employ financial, technical and personnel resources substantially greater than us, which can be particularly important in the areas in which we operate. These companies may be able to pay more for productive oil properties and prospects and to evaluate, bid for and purchase a greater number of properties and prospects than our financial or personnel resources permit. Furthermore, these companies may also be better able to withstand the financial pressures of unsuccessful drill attempts, sustained periods of volatility in financial markets and generally adverse global and industry-wide economic conditions, and may be better able to absorb the burdens resulting from changes in relevant laws and regulations, which would adversely affect our competitive position. Our ability to acquire additional prospects and to find and develop reserves in the future will depend on our ability to evaluate and select suitable properties and to consummate transactions in a highly competitive environment. Also, there is substantial competition for available capital for investment in the oil and gas industry. As a result of these and other factors, we may not be able to compete successfully in an intensely competitive industry, which could cause a material adverse effect on our results of operations and financial condition.
48
Table of Contents
Participants in the oil and gas industry are subject to complex laws that can affect the cost, manner or feasibility of doing business.
Exploration and production activities in the oil and gas industry are subject to extensive local, state, federal and international regulations. We may be required to make large expenditures to comply with governmental regulations, particularly in respect of the following matters:
- •
- licenses for drilling operations;
- •
- royalty increases, including retroactive claims;
- •
- drilling and development bonds;
- •
- reports concerning operations;
- •
- the spacing of wells;
- •
- unitization of oil accumulations;
- •
- remediation or investigation activities for environmental purposes; and
- •
- taxation.
Under these and other laws and regulations, we could be liable for personal injuries, property damage and other types of damages. Failure to comply with these laws and regulations also may result in the suspension or termination of our operations and subject us to administrative, civil and criminal penalties. Moreover, these laws and regulations could change in ways that could substantially increase our costs. Any such liabilities, penalties, suspensions, terminations or regulatory changes could have a material adverse effect on our financial condition and results of operations.
We and our future operations are subject to numerous environmental, health and safety regulations which may result in material liabilities and costs.
We are, and our future operations will be, subject to various international, foreign, federal, state and local environmental, health and safety laws and regulations governing, among other things, the emission and discharge of pollutants into the ground, air or water, the generation, storage, handling, use and transportation of regulated materials and the health and safety of our employees. We are required to obtain environmental permits from governmental authorities for certain of our operations, including drilling permits for our wells. There is a risk that we have not been or will not be at all times in complete compliance with these permits and the environmental laws and regulations to which we are subject. If we violate or fail to comply with these laws, regulations or permits, we could be fined or otherwise sanctioned by regulators, including through the revocation of our permits or the suspension or termination of our operations. If we fail to obtain permits in a timely manner or at all (due to opposition from community or environmental interest groups, governmental delays, or any other reasons), such failure could impede our operations, which could have a material adverse effect on our results of operations and our financial condition.
We, as the named lessee or as the designated operator under our current and future oil leases, could be held liable for all environmental, health and safety costs and liabilities arising out of our actions and omissions as well as those of our third-party contractors. To the extent we do not address these costs and liabilities or if we are otherwise in breach of our lease requirements, our leases could be suspended or terminated. We have contracted with and intend to continue to hire third parties to perform the majority of the drilling and other services related to our operations. There is a risk that we may contract with third parties with unsatisfactory environmental, health and safety records or that our contractors may be unwilling or unable to cover any losses associated with their acts and omissions. Accordingly, we could be held liable for all costs and liabilities arising out of the acts or omissions of
49
Table of Contents
our contractors, which could have a material adverse effect on our results of operations and financial condition.
As the designated operator of our leases, we are required to maintain bonding or insurance coverage for certain risks relating to our operations, including environmental risks. We maintain insurance at levels that we believe are consistent with industry practices, but we are not fully insured against all risks. Our insurance may not cover any or all environmental claims that might arise from our operations or those of our third-party contractors. If a significant accident or other event occurs and is not fully covered by our insurance, or our third-party contractors have not agreed to bear responsibility, such accident or event could have a material adverse effect on our results of operations and our financial condition. In addition, we may not be able to obtain required bonding or insurance coverage at all or in time to meet our anticipated startup schedule for each well, and if we fail to obtain this bonding or coverage, such failure could have a material adverse effect on our results of operations and financial condition.
Releases to deepwater of regulated substances are possible, and under certain environmental laws, we could be held responsible for all of the costs relating to any contamination caused by us or our contractors, at our facilities and at any third party waste disposal sites used by us or on our behalf. In addition, offshore oil exploration and production involves various hazards, including human exposure to regulated substances, including naturally occurring radioactive materials. As such, we could be held liable for any and all consequences arising out of human exposure to such substances or other damage resulting from the release of hazardous substances to the environment, endangered species, property or to natural resources.
In addition, we expect continued attention to climate change issues. Various countries and U.S. states and regions have agreed to regulate emissions of greenhouse gases, including methane (a primary component of natural gas) and carbon dioxide, a byproduct of oil and natural gas combustion. The U.S. Environmental Protection Agency announced its intention to regulate greenhouse gas emissions beginning in 2011. The U.S. federal government is actively considering national greenhouse gas regulation, having proposed bills which would require greenhouse gas emissions reductions. A final law could be adopted this or next year. The regulation of greenhouse gases and the physical impacts of climate change in the areas in which we, our customers and the end-users of our products operate could adversely impact our operations and the demand for our products.
Environmental, health and safety laws are complex, change frequently and have tended to become increasingly stringent over time. Our costs of complying with current and future environmental, health and safety laws, and our liabilities arising from releases of, or exposure to, regulated substances may adversely affect our results of operations and our financial condition. See "Business—Environmental Matters and Regulation."
Non-U.S. holders of our common stock, in certain situations, could be subject to U.S. federal income tax upon the sale, exchange or other disposition of our common stock.
We believe that we are, and will remain for the foreseeable future, a U.S. real property holding corporation for U.S. federal income tax purposes. As a result, under the Foreign Investment in Real Property Tax Act ("FIRPTA"), certain non-U.S. investors may be subject to U.S. federal income tax on gain from the disposition of shares of our common stock, in which case they would also be required to file U.S. tax returns with respect to such gain. Whether these FIRPTA provisions apply depends on the amount of our common stock that such non-U.S. investors hold and whether, at the time they dispose of their shares, our common stock is regularly traded on an established securities market (such as the NYSE) within the meaning of the applicable Treasury Regulations. So long as our common stock is listed on the NYSE, only a non-U.S. investor who has held, actually or constructively, more than 5% of
50
Table of Contents
our common stock may be subject to U.S. federal income tax on the disposition of our common stock under FIRPTA.
We may be exposed to liabilities under the Foreign Corrupt Practices Act, and any determination that we violated the Foreign Corrupt Practices Act could have a material adverse effect on our business.
We are subject to the Foreign Corrupt Practices Act ("FCPA") and other laws that prohibit improper payments or offers of payments to foreign governments and their officials and political parties for the purpose of obtaining or retaining business. We do business and may do additional business in the future in countries and regions in which we may face, directly or indirectly, corrupt demands by officials, tribal or insurgent organizations, or private entities. Thus, we face the risk of unauthorized payments or offers of payments by one of our employees or consultants, given that these parties may not always be subject to our control. Our existing safeguards and any future improvements may prove to be less than effective, and our employees and consultants may engage in conduct for which we might be held responsible. In connection with entering into our Risk Services Agreements for Blocks 9 and 21 offshore Angola, two Angolan-based E&P companies were assigned to us as part of the contractor group by the Angolan government. We have not worked with either of these companies in the past, and, therefore, our familiarity with these companies is limited. Violations of the FCPA may result in severe criminal or civil sanctions, and we may be subject to other liabilities, which could negatively affect our business, operating results and financial condition. In addition, the government may seek to hold us liable for successor liability FCPA violations committed by companies in which we invest or that we acquire.
We may incur substantial losses and become subject to liability claims as a result of future oil and natural gas operations, for which we may not have adequate insurance coverage.
We intend to maintain insurance against risks in the operation of the business we plan to develop and in amounts in which we believe to be reasonable. Such insurance, however, may contain exclusions and limitations on coverage. We may elect not to obtain insurance if we believe that the cost of available insurance is excessive relative to the risks presented. Losses and liabilities arising from uninsured and underinsured events could materially and adversely affect our business, financial condition or results of operations.
Risks Relating to our Common Stock
Our stock price may be volatile, and investors in our common stock could incur substantial losses.
Our stock price may be volatile. The stock market in general has experienced extreme volatility that has often been unrelated to the operating performance of particular companies. The market price for our common stock may be influenced by many factors, including, but not limited to:
- •
- the price of oil and natural gas;
- •
- the success of our exploration and development operations, and the marketing of any oil we produce;
- •
- regulatory developments in the United States and foreign countries where we operate;
- •
- the recruitment or departure of key personnel;
- •
- quarterly or annual variations in our financial results or those of companies that are perceived to be similar to us;
- •
- market conditions in the industries in which we compete and issuance of new or changed securities;
51
Table of Contents
- •
- analysts' reports or recommendations;
- •
- the failure of securities analysts to cover our common stock or changes in financial estimates by analysts;
- •
- the inability to meet the financial estimates of analysts who follow our common stock;
- •
- the issuance of any additional securities of ours;
- •
- investor perception of our company and of the industry in which we compete; and
- •
- general economic, political and market conditions.
A substantial portion of our total outstanding shares may be sold into the market at any time. This could cause the market price of our common stock to drop significantly, even if our business is doing well.
All of the shares sold in our initial public offering are freely tradable without restrictions or further registration under the federal securities laws, unless purchased by our "affiliates" as that term is defined in Rule 144 under the Securities Act of 1933, as amended (the "Securities Act"). Substantially all the remaining shares of common stock are restricted securities as defined in Rule 144 under the Securities Act. Restricted securities may be sold in the U.S. public market only if registered or if they qualify for an exemption from registration, including by reason of Rules 144 or 701 under the Securities Act. All of our restricted shares will be eligible for sale in the public market in late 2010, subject in certain circumstances to the volume, manner of sale and other limitations under Rule 144. Additionally, we have registered all shares of our common stock that we may issue under our employee and director benefit plans. These shares can be freely sold in the public market upon issuance, unless pursuant to their terms these stock awards have transfer restrictions attached to them. Sales of a substantial number of shares of our common stock, or the perception in the market that the holders of a large number of shares intend to sell shares, could reduce the market price of our common stock.
The concentration of our capital stock ownership among our largest stockholders, and their affiliates.
Our four largest stockholders collectively own approximately 76% of our outstanding common stock. Consequently, these stockholders have significant influence over all matters that require approval by our stockholders, including the election of directors and approval of significant corporate transactions. This concentration of ownership will limit your ability to influence corporate matters, and as a result, actions may be taken that you may not view as beneficial.
Provisions of our certificate of incorporation and by-laws could discourage potential acquisition proposals and could deter or prevent a change in control.
Some provisions in our certificate of incorporation and by-laws, as well as Delaware statutes, may have the effect of delaying, deferring or preventing a change in control. These provisions, including those providing for the possible issuance of shares of our preferred stock and the right of the board of directors to amend the by-laws, may make it more difficult for other persons, without the approval of our board of directors, to make a tender offer or otherwise acquire a substantial number of shares of our common stock or to launch other takeover attempts that a stockholder might consider to be in his or her best interest. These provisions could limit the price that some investors might be willing to pay in the future for shares of our common stock.
We are a "controlled company" within the meaning of the NYSE rules and, as a result, we qualify for and rely on exemptions from certain corporate governance requirements.
Funds affiliated with First Reserve Corporation, Goldman, Sachs & Co., Riverstone Holdings LLC and The Carlyle Group, and KERN Partners Ltd. and certain limited partners in such funds affiliated with KERN Partners Ltd., respectively, control a majority of the voting power of our outstanding
52
Table of Contents
common stock. Consequently we are a "controlled company" within the meaning of the NYSE corporate governance standards. Under the NYSE rules, a company of which more than 50% of the voting power is held by another person or group of persons acting together is a "controlled company" and may elect not to comply with certain NYSE corporate governance requirements, including the requirements that:
- •
- a majority of the board of directors consist of independent directors;
- •
- the nominating and corporate governance committee be composed entirely of independent directors with a written charter addressing the committee's purpose and responsibilities;
- •
- the compensation committee be composed entirely of independent directors with a written charter addressing the committee's purpose and responsibilities; and
- •
- there be an annual performance evaluation of the nominating and corporate governance and compensation committees.
We are currently treated as a controlled company and utilize these exemptions, including the exemption for a board of directors composed of a majority of independent directors. In addition, although we have adopted charters for our audit, nominating and corporate governance and compensation committees and intend to conduct annual performance evaluations for these committees, none of these committees are presently composed entirely of independent directors. Accordingly, you may not have the same protections afforded to stockholders of companies that are subject to all of the NYSE corporate governance requirements.
Item 1B. Unresolved Staff Comments
Not applicable.
Item 2. Properties
Please refer to the information under the captions "Business—Deepwater U.S. Gulf of Mexico" and "Business—West Africa Deepwater" elsewhere in this Annual Report on Form 10-K.
Item 3. Legal Proceedings
We are not currently party to any legal proceedings. However, from time to time we may be subject to various lawsuits, claims and proceedings that arise in the normal course of business, including employment, commercial, environmental, safety and health matters. It is not presently possible to determine whether any such matters will have a material adverse effect on our consolidated financial position, results of operations, or liquidity.
Item 4. (Removed and Reserved)
53
Table of Contents
PART II
Item 5. Market for Registrant's Common Equity, Related Stockholder Matters and Issuer Purchases of Equity Securities
Market Information
Shares of our common stock are traded on the New York Stock Exchange under the symbol "CIE". Our shares have been traded on the New York Stock Exchange since December 16, 2009, and therefore, we have not set forth quarterly information with respect to the high and low prices for our common stock.
Holders
As of March 28, 2010, there were approximately 68 holders of record of our common stock. The number of record holders does not include holders of shares in "street names" or persons, partnerships, associations, corporations or other entities identified in security position listings maintained by depositories.
Dividend Policy
At the present time, we intend to retain all of our future earnings, if any, generated by our operations for the development and growth of our business. The decision to pay dividends is at the discretion of our board of directors and depends on our financial condition, results of operations, capital requirements and other factors that our board of directors deems relevant.
Sales of Unregistered Securities
During the past year, Cobalt International Energy, Inc.'s predecessor, Cobalt International Energy, L.P., issued unregistered securities to funds affiliated with Riverstone Holdings LLC and The Carlyle Group ("Riverstone/Carlyle"), First Reserve Corporation ("First Reserve"), Goldman, Sachs & Co. ("GS") and KERN Partners Ltd. and certain limited partners in such funds affiliated with KERN Partners Ltd. ("KERN Group"); and certain members of management and our employees, as described below. None of these transactions involved any underwriters or any public offerings, and we believe that each of these transactions was exempt from the registration requirements pursuant to Section 3(a)(9) or Section 4(2) of the Securities Act of 1933, as amended. The recipients of the securities in these transactions represented their intention to acquire the securities for investment only and not with a view to or for sale in connection with any distribution thereof. Furthermore, pursuant to the terms of a corporate reorganization that we completed in connection with our initial public offering, all of these interests in Cobalt International Energy, L.P. were exchanged for common stock of Cobalt International Energy, Inc.
During the fiscal year ended December 31, 2009, Cobalt International Energy, L.P. issued the following unregistered securities for the consideration listed:
| | | | | | |
Recipient | | Securities Issued | | Consideration Received by
Cobalt International
Energy, L.P. | |
|---|
Riverstone/Carlyle | | 65,885,942 Class A Interests | | $ | 65,885,942 | |
First Reserve | | 65,885,942 Class A Interests | | | 65,885,942 | |
GS | | 65,885,942 Class A Interests | | | 65,885,942 | |
KERN Group | | 28,170,300 Class A Interests | | | 28,170,300 | |
Members of management, in the aggregate | | 1,149,687 Class A Interests | | | 1,149,687 | |
54
Table of Contents
Lastly, on December 21, 2009 we issued 3,125,000 shares of common stock at $13.50 per share to an investor in a private placement exempt from the registration requirements of the Securities Act, pursuant to Regulation S of the Securities Act.
Use of Proceeds from the Sales of Registered Securities
In December 2009, we completed our initial public offering of common stock pursuant to a Registration Statement on Form S-1, as amended (Reg. No. 333-161734) that was declared effective on December 15, 2009. Under the registration statement, we registered the offering and sale of an aggregate of 70,978,000 shares of our common stock, (which included 7,978,000 shares sold by us pursuant to the partial exercise of the underwriters' over-allotment option). All of the shares of common stock registered under the registration statement were sold at a price to the public of $13.50 per share. Credit Suisse Securities (USA) LLC, Goldman, Sachs & Co. and J.P. Morgan Securities Inc. acted as joint book running managers of the offering and as representatives of the underwriters. The offering commenced on December 15, 2009 and closed on December 21, 2009. The closing of the over-allotment portion of the offering occurred on January 7, 2010. As a result of the initial public offering, we raised a total of $1,000,390,500 in gross proceeds, and approximately $957,374,000 in net proceeds after deducting underwriting discounts and commissions of $43,017,000 and offering expenses of $6,669,000.
None of the net proceeds from our initial public offering were paid directly or indirectly to any of our directors or officers (or their associates) or persons owning ten percent or more of any class of our equity securities or to any other affiliate, other than in the form of wages or salaries and bonuses paid out in the ordinary course of business. The net proceeds from our initial public offering and a concurrent private offering of 3,125,000 shares pursuant to Regulation S will be used to fund our capital expenditures, and in particular our drilling and exploration program through 2011, our related operating expenses, and for general corporate purposes. As a result, management retains broad discretion over the allocation of those net proceeds. Pending use of those net proceeds, we have invested the net proceeds in interest bearing, investment-grade securities.
Purchases of Equity Securities by the Issuer and Affiliated Purchasers
We did not repurchase any of our outstanding equity securities during the most recent fiscal year covered by this report.
Item 6. Selected Financial Data
The selected historical financial information set forth below should be read in conjunction with "Management's Discussion and Analysis of Financial Condition and Results of Operations" and with our financial statements and the notes to those financial statements included elsewhere in this Annual Report on Form 10-K. The consolidated statements of operations and cash flows information for the years ended December 31, 2009, 2008 and 2007 and for the period from November 10, 2005 (Inception) through December 31, 2009 was derived from Cobalt International Energy, Inc.'s audited financial statements.
55
Table of Contents
Consolidated Statement of Operations Information:
| | | | | | | | | | | | | | |
| | Year Ended December 31, | | For the Period
November 10, 2005
(Inception) through
December 31, 2009 | |
|---|
| | 2009 | | 2008 | | 2007 | |
|---|
| | ($ in thousands, except share and per share data)
| |
|---|
Oil and gas revenue | | $ | — | | $ | — | | $ | — | | $ | — | |
Operating costs and expenses | | | | | | | | | | | | | |
| | Seismic and exploration | | | 30,666 | | | 41,274 | | | 86,813 | | | 251,571 | |
| | Dry hole expense and impairment | | | 14,486 | | | — | | | — | | | 14,486 | |
| | General and administrative | | | 35,996 | | | 31,271 | | | 23,090 | | | 110,787 | |
| | Depreciation and amortization | | | 622 | | | 683 | | | 435 | | | 2,033 | |
| | | | | | | | | | |
Total operating costs and expenses | | | 81,770 | | | 73,228 | | | 110,338 | | | 378,877 | |
| | | | | | | | | | |
Operating income (loss) | | | (81,770 | ) | | (73,228 | ) | | (110,338 | ) | | (378,877 | ) |
Other income | | | | | | | | | | | | | |
| | Interest income | | | 513 | | | 1,632 | | | 1,384 | | | 4,154 | |
| | | | | | | | | | |
Total other income | | | 513 | | | 1,632 | | | 1,384 | | | 4,154 | |
| | | | | | | | | | |
Net income (loss) before income taxes | | | (81,257 | ) | | (71,596 | ) | | (108,954 | ) | | (374,723 | ) |
Income tax expense (benefit)(1)(2) | | | — | | | — | | | — | | | — | |
| | | | | | | | | | |
Net income (loss) | | $ | (81,257 | ) | $ | (71,596 | ) | $ | (108,954 | ) | $ | (374,723 | ) |
| | | | | | | | | | |
Pro forma net income (loss) (unaudited)(1) | | | | | | | | | | | | | |
Net income (loss) as reported | | $ | (81,257 | ) | | | | | | | | | |
Pro forma income tax expense(2) | | | — | | | | | | | | | | |
Pro forma management fees(3) | | | 2,872 | | | | | | | | | | |
| | | | | | | | | | | | | |
Pro forma net income (loss) allocable to common shareholders | | $ | (78,385 | ) | | | | | | | | | |
| | | | | | | | | | | | | |
Pro forma basic and diluted income (loss) per share(4) | |
$ |
(0.33 |
) | | | | | | | | | |
| | | | | | | | | | | | | |
Pro forma weighted average common shares outstanding used in pro forma basic and diluted net income (loss) per common share(5) | | |
236,751,219 | | | | | | | | | | |
| | | | | | | | | | | | | |
- (1)
- Upon completion of our IPO, Cobalt International Energy, L.P. became wholly-owned by Cobalt International Energy, Inc. Upon the completion of our corporate reorganization, all of Cobalt International Energy L.P.'s outstanding limited partnership interests were exchanged for shares of Cobalt International Energy, Inc.'s common stock based on these interests' relative rights as set forth in Cobalt International Energy, L.P.'s limited partnership agreement. Additionally, we became subject to federal and state income taxes.
- (2)
- No income tax benefit has been reflected since a full valuation allowance has been established against the deferred tax asset that would have been generated as a result of the operating results.
- (3)
- Upon completion of the corporate reorganization the right of our former private equity owners to receive a management fee terminated.
56
Table of Contents
- (4)
- Nonvested restricted stock awards of 8,015,041 as of December 31, 2009 were excluded from the pro forma calculation of diluted income (loss) per common share because they were anti-dilutive for the applicable period.
- (5)
- The pro forma weighted average common shares outstanding have been calculated as if the conversion of all partnership units into shares of common stock occurred as of the beginning of the year.
Consolidated Balance Sheet Information:
| | | | | | | | | | |
| | As of December 31, | |
|---|
| | 2009 | | 2008 | | 2007 | |
|---|
| | ($ in thousands)
| |
|---|
Cash and cash equivalents(1) | | $ | 1,093,100 | | $ | 5,103 | | $ | 95,946 | |
Total current assets | | | 1,154,487 | | | 23,876 | | | 99,371 | |
Total property, plant and equipment(2) | | | 471,612 | | | 760,728 | | | 122,097 | |
Long-term restricted cash | | | 186,006 | | | — | | | — | |
Total assets | | | 1,812,105 | | | 784,604 | | | 254,658 | |
Total current liabilities(3) | | | 70,523 | | | 44,133 | | | 10,785 | |
Total long-term liabilities | | | — | | | — | | | — | |
Total partners' capital/stockholders' equity | | | 1,741,582 | | | 740,471 | | | 243,873 | |
Total liabilities and partners' capital/stockholders' equity | | | 1,812,105 | | | 784,604 | | | 254,658 | |
- (1)
- The cash balance at December 31, 2009 includes the proceeds from the initial public offering. The cash balance at December 31, 2007 represents cash on hand for anticipated lease awards by the MMS for the 2007 Central Gulf of Mexico Lease Sale.
- (2)
- The decrease as of December 31, 2009 reflects the farm-out of the U.S. Gulf of Mexico lease interests to TOTAL and Sonangol. The year-to-year variances from 2007 to 2008 represent additions to our lease inventory in the U.S. Gulf of Mexico and offshore Angola and Gabon.
- (3)
- The increase in the current liabilities at December 31, 2008 consists of the year-end accruals for capital expenditures.
Consolidated Statement of Cash Flows Information:
| | | | | | | | | | | | | |
| |
| |
| |
| | Period
November 10,
2005
(Inception)
through
December 31,
2009 | |
|---|
| | Year Ended December 31, | |
|---|
| | 2009 | | 2008 | | 2007 | |
|---|
| | ($ in thousands)
| |
|---|
Net cash provided by (used in): | | | | | | | | | | | | | |
Operating activities | | $ | (71,667 | ) | $ | (82,164 | ) | $ | (116,050 | ) | $ | (333,796 | ) |
Investing activities | | | 83,943 | | | (575,771 | ) | | (103,770 | ) | | (678,731 | ) |
Financing activities | | | 1,075,721 | | | 567,092 | | | 305,135 | | | 2,105,627 | |
Item 7. Management's Discussion and Analysis of Financial Condition and Results of Operations
The following discussion contains forward-looking statements that involve risks and uncertainties. Our actual results may differ materially from those discussed in the forward-looking statements as a result of various factors, including, without limitation, those set forth in "Risk Factors," "Cautionary Note Regarding Forward-Looking Statements," "Business—How We Identify and Analyze Prospects" and the other matters
57
Table of Contents
set forth in this Annual Report on Form 10-K . The following discussion of our financial condition and results of operations should be read in conjunction with our financial statements and the notes thereto included elsewhere in this Annual Report on Form 10-K, as well the information presented under "Selected Financial Data." Due to the fact that we have not generated any revenues, we believe that the financial information contained in this Annual Report on Form 10-K is not indicative of, or comparable to, the financial profile that we expect to have once we begin to generate revenues. Except to the extent required by law, we undertake no obligation to update publicly any forward-looking statements for any reason, even if new information becomes available or other events occur in the future
Overview
We are an independent, oil-focused exploration and production company with a world-class below salt prospect inventory in the deepwater U.S. Gulf of Mexico and offshore Angola and Gabon in West Africa. We have established a current portfolio of 134 identified, well-defined prospects, comprised of 48 prospects located in the deepwater U.S. Gulf of Mexico and 86 prospects located in offshore West Africa.
Pursuant to the terms of a corporate reorganization that was contingent upon the completion of our initial public offering, all of the interests in Cobalt International Energy, L.P. were exchanged for common stock of Cobalt International Energy, Inc., and as a result Cobalt International Energy, L.P. is wholly-owned by Cobalt International Energy, Inc.
Since we began our operations in late 2005, we have devoted substantially all of our resources to identifying and acquiring a deepwater prospect inventory in the U.S. Gulf of Mexico and offshore Angola and Gabon in West Africa. In order to identify acreage that we believe has the potential for large hydrocarbon accumulations, we acquire, analyze and develop extensive geophysical data, including 2-D and 3-D seismic data. From our inception on November 10, 2005 through December 31, 2009, we have incurred costs of approximately $242.7 million on the acquisition, processing and analysis of extensive geophysical data. Using this data we developed a targeted leasing strategy and were successful in acquiring leasehold interests in 113 blocks covering 517,400 net acres in the 2006, 2007 and 2008 MMS Lease Sales in the U.S. Gulf of Mexico for an aggregate of $633 million. In addition, we have acquired additional leasehold interests as a result of our alliance with TOTAL. We are the operator on approximately 75% of our blocks and have varying working interests. Most of our U.S. Gulf of Mexico leases have a 10-year primary term, expiring between 2016 and 2019. In the U.S. Gulf of Mexico, the royalties on our lease blocks range from 12.5% to 18.75% with a lease block weighted average of 15%. Assuming we are able to commence exploration and production activities or successfully exploit our properties during the primary lease term, our leases would extend beyond the primary term, generally for the life of production.
In 2007 we acquired contractual rights to Blocks 9, 21 and one additional block, comprising 1.26 million net acres offshore Angola for which we paid net signature bonuses of $2.5 million, $6.3 million and $10.0 million, respectively. On February 24, 2010, we entered into Risk Service Agreements ("RSAs") for Blocks 9 and 21 offshore Angola with Sonangol and the other members of the Contractor Group. The RSAs govern our 40% interest in and operatorship of Blocks 9 and 21 offshore Angola and form the basis of our exploration, development and production operations on these blocks. Their execution is a key milestone that allows for the commencement of our offshore Angola drilling program, currently planned to begin within the next twelve months.
On November 29, 2007, we entered into an assignment agreement with Total Gabon and paid approximately $2.0 million for a 21.25% working interest in the Diaba Block offshore Gabon. Through the assignment we became a party to the PSA between the operator, Total Gabon, and the Republic of Gabon. This agreement gives Cobalt and Total Gabon the right to recover costs incurred and receive a share of the remaining profit from any commercial discoveries made on the block.
58
Table of Contents
In early 2008, we acquired a 9.375% working interest in Green Canyon 816, 859, 860 and 903 from an existing owner for $14.5 million.
On May 7, 2008, we acquired a 20% working interest in Walker Ridge 8, 51 and 52 from an existing owner for $25.3 million.
On May 15, 2008, we signed a participation agreement with Sonangol (which we subsequently announced on April 22, 2009) whereby they were assigned a 25% non-operated interest of our pre-TOTAL alliance interest in 11 of our U.S. Gulf of Mexico oil and natural gas exploration leases for $50.1 million and reimbursement of $10.0 million for our exploration and seismic costs related to those leases. The price Sonangol paid us for this interest was based on the price we paid for such leases in the 2007 and 2008 MMS Gulf of Mexico Lease Sales. This transaction resulted in no gain or loss to Cobalt.
On April 6, 2009, we announced a long-term alliance with TOTAL in which, through a series of transactions, we combined our respective U.S. Gulf of Mexico exploratory lease inventory through the exchange of a 40% interest in our leases for a 60% interest in TOTAL's leases, resulting in a current combined alliance portfolio of 215 leases. We will act as operator on behalf of the alliance through the exploration and appraisal phases of development. As part of the alliance, TOTAL committed, among other things to (i) provide a 5th generation deepwater rig to drill a mandatory five-well program on existing Cobalt-operated blocks, (ii) pay up to $300 million to carry a substantial share of Cobalt's costs with respect to the five-well program (above the amounts TOTAL has agreed to pay as owner of a 40% interest), (iii) pay an initial amount of approximately $280 million primarily as reimbursement of our share of historical costs in our contributed properties and consideration under purchase and sale agreements, (iv) pay 40% of the general and administrative costs relating to our operations in the U.S. Gulf of Mexico during the 10-year alliance term, and (v) award us up to $180 million based on the success of the alliance's initial five-well program, in all cases subject to certain conditions and limitations. Additionally as part of the alliance, we formed a U.S. Gulf of Mexico-wide area of mutual interest with TOTAL, whereby each party has the right to participate in any oil and natural gas lease interest acquired by the other party within this area. No gain or loss was recognized as a result of these agreements.
In the U.S. Gulf of Mexico, our exploration program is focused on Miocene and inboard Lower Tertiary prospects. We estimate that the average gross cost to drill and evaluate an exploration well is approximately $100 to $130 million for Miocene prospects and approximately $140 to $170 million for inboard Lower Tertiary prospects, the average gross cost to drill and evaluate an appraisal well is approximately $110 to $140 million for Miocene prospects and approximately $150 to $180 million for inboard Lower Tertiary prospects, while the average gross cost to drill and evaluate a development well is approximately $140 to $170 million for Miocene fields and approximately $180 to $210 million for inboard Lower Tertiary fields.
We currently have agreements to operate two deepwater drilling rigs in the U.S. Gulf of Mexico: the ENSCO 8503, a 5th generation semi-submersible drilling rig, which we leased from ENSCO for a two year term commencing in the fourth quarter of 2010 and which may be extended to a three or four year term at our option, and the Ocean Monarch drilling rig, which is being assigned to us from Anadarko. The lease for the ENSCO 8503 drilling rig has an aggregate rate for the first two years of the contract of approximately $372 million, representing a base operating rate of $510,000 per day, subject to adjustment. Under the terms of the contract, we will pay for the transportation of the ENSCO 8503 drilling rig to the U.S. Gulf of Mexico, which we anticipate will be approximately $24 million. The assignment of the Ocean Monarch drilling rig is expected to occur on or about May 1, 2010, depending upon when the current assignee of the rig concludes its designated drilling operations. We intend to use the rig to drill our North Platte prospect and we have an option to use the rig on a second well. We are committed to use the rig for a minimum of 75 days at a day rate of approximately $440,000 per day. Previously, we had leased Transocean DD-I drilling rig for a period of 270 days for an aggregate amount of approximately $138 million, representing a base operating rate of $500,000 per day, subject to adjustment. The Transocean DD-I drilling rig was released on February 7, 2010 after drilling of the Criollo #1 exploratory well. We continually evaluate opportunities to contract for the use of additional rigs, and in order to increase our capacity to drill wells in addition to those included in our current contracted-for drilling schedule using the ENSCO 8503 and Ocean Monarch drilling rigs, we will need to gain access to additional suitable rigs in the future.
59
Table of Contents
If we are successful in discovering economic quantities of oil in the U.S. Gulf of Mexico, development would require access to existing third-party infrastructure and newly constructed processing facilities owned by the working interest partnership or leased from third-party providers. If our initial exploratory wells are successful, we anticipate beginning commercial production and therefore generating revenue, from our U.S. Gulf of Mexico properties between 2013 and 2015.
In Angola, we will work in a contractor relationship to the national oil company, Sonangol, with terms and conditions established by the RSAs. In Gabon, we will work in a contractor relationship to the Republic of Gabon with terms and conditions established by PSAs. We are the operator for Blocks 9 and 21 offshore Angola and expect to commence drilling operations offshore Angola in late 2010 or early 2011. We will need to secure a rig in connection with our offshore Angola operations, which will require substantial involvement from Sonangol, who may consider factors other than our drill schedule. Offshore Angola and Gabon, we estimate that the gross cost to drill and evaluate an exploration, appraisal or development well is approximately $45 to $65 million for pre-salt prospects and $30 to $50 million for above salt prospects.
If we are successful in discovering economic quantities of oil offshore Angola and Gabon, we intend to lease FPSOs from third-parties. If our initial exploratory wells are successful, we anticipate beginning commercial production and therefore generating revenue, from our properties offshore Angola and Gabon between 2014 and 2016.
Based on our current operating plans, we believe the proceeds from our completed initial public offering and concurrent private placement, together with our existing cash, will be sufficient to meet our anticipated operating needs until the end of 2011, after which time we will require substantial additional capital. We do not expect to begin commercial production, and therefore generate revenue from production before 2013, which will depend upon successful drilling results, additional and timely capital funding, and access to suitable infrastructure. In addition, in budgeting for our activities, we have relied on a number of assumptions, including with regard to our discovery success rate, the number of wells we plan to drill, our working interests in our prospects, the costs involved in developing or participating in the development of a prospect, the timing of third party projects and the availability of both suitable equipment and qualified personnel. These assumptions are inherently subject to significant business, economic, regulatory, environmental and competitive uncertainties, contingencies and risks, all of which are difficult to predict and many of which are beyond our control. We may need to raise additional funds more quickly if one or more of our assumptions prove to be incorrect or if we choose to expand our hydrocarbon asset acquisition, exploration or development efforts more rapidly than we presently anticipate, and we may decide to raise additional funds even before we need them if the conditions for raising capital are favorable. We may seek to sell additional equity or debt securities or obtain a bank credit facility. The sale of additional equity securities could result in dilution to our stockholders. The incurrence of indebtedness would result in increased fixed obligations and could also result in covenants that would restrict our operations.
Factors Affecting Comparability of Future Results
You should read this management's discussion and analysis of our financial condition and results of operations in conjunction with our historical financial statements included elsewhere in this Annual Report on Form 10-K. Below are the period-to-period comparisons of our historical results and the analysis of our financial condition. In addition to the impact of the matters discussed in "Risk Factors," our future results could differ materially from our historical results due to a variety of factors, including the following:
Success in the Discovery and Development of Oil Reserves. Because we have no operating history in the production of oil, our future results of operations and financial condition will be directly affected by our ability to discover and develop reserves through our drilling activities. Currently, our estimated
60
Table of Contents
oil asset base does not qualify as proved reserves. The calculation of our geological and petrophysical estimates is complex and imprecise, and it is possible that our future exploration will not result in additional discoveries, and, even if we are able to successfully make such discoveries, there is no certainty that the discoveries will be commercially viable to produce. Our results of operations will be adversely affected in the event that our estimated oil asset base does not result in reserves that may eventually be commercially developed.
Oil and Gas Revenue. We have not yet commenced oil production. If and when we do commence production, we expect to generate revenue from such production. No oil and gas revenue is reflected in our historical financial statements.
Production Costs. We have not yet commenced oil production. If and when we do commence production, we will incur production costs. Production costs are the costs incurred in the operation of producing and processing our production and are primarily comprised of lease operating expense, workover costs and production and ad valorem taxes. No production costs are reflected in our historical financial statements.
General and Administrative Expenses. We expect to incur approximately $5.0 million per year in incremental general and administrative expenses as a result of recently becoming a publicly traded company. These costs include expenses associated with our annual and quarterly reporting, investor relations, registrar and transfer agent fees, incremental insurance costs, and accounting and legal services. As a result of the consummation of our corporate reorganization, in connection with our initial public offering, we no longer are required to pay monitoring fees to certain limited partnership interestholders pursuant to the terms of Cobalt International Energy, L.P.'s limited partnership agreement. These differences in general and administrative expenses are not reflected in our historical financial statements other than for a small part of fiscal year 2009.
Depreciation, Depletion and Amortization. We have not yet commenced oil or natural gas production. If and when we do commence production, we will amortize the costs of successful exploration, appraisal, drilling and field development using the unit-of-production method based on total estimated proved developed oil and gas reserves. Costs of acquiring proved and unproved leasehold properties and associated asset retirement costs will be amortized using the unit-of-production method based on total estimated proved developed and undeveloped reserves. No depletion of oil and gas properties is reflected in our historical financial statements.
Demand and Price. The demand for oil is susceptible to volatility related to, among other factors, the level of global economic activity and may also fluctuate depending on the performance of specific industries. We expect that a decrease in economic activity, in the United States and elsewhere, would adversely affect demand for oil we expect to produce. Since we have not generated revenues, these key factors will only affect us when we produce and sell hydrocarbons.
We expect to earn income from:
- •
- domestic sales, which consist of sales of oil and natural gas;
- •
- sales to international markets (exports); and
- •
- other sources, including services, investment income and foreign exchange gains.
We expect that our expenses will include:
- •
- costs of sales (which are composed of production costs, insurance, and costs associated with the operation of our wells);
- •
- maintenance and repair of property and equipment;
- •
- costs of acquiring seismic data;
61
Table of Contents
- •
- depreciation and amortization of fixed assets;
- •
- depletion of oilfields;
- •
- exploration costs, including appraisal and development drilling and completion costs;
- •
- selling expenses (which include expenses relating to the transportation and distribution of our products) and general and administrative expenses; and
- •
- interest expense and foreign exchange losses.
We expect that fluctuations in our financial condition and results of operations will be driven by a combination of factors, including:
- •
- the volume of oil we produce and sell;
- •
- changes in the domestic and international prices of oil, which are denominated in U.S. dollars;
- •
- fluctuations in the royalty rates on the leases that we hold;
- •
- our success in future bidding rounds for concessions;
- •
- political and economic conditions in the United States, Angola and Gabon; and
- •
- the amount of taxes and duties that we are required to pay with respect to our future operations, by virtue of our status as a U.S. company and our involvement in the oil and gas industry.
Results of Operations
The discussion of the results of operations and the period-to-period comparisons presented below analyzes our historical results. The following discussion may not be indicative of future results.
Fiscal Years Ended December 31, 2009 vs. 2008
| | | | | | | | | | | | | | |
| | Year Ended
December 31, | |
| |
| |
|---|
| | Increase
(Decrease) | | Percentage
Change | |
|---|
| | 2009 | | 2008 | |
|---|
| | ($ in thousands)
| |
|---|
Oil and gas revenue | | $ | — | | $ | — | | $ | — | | | 0 | % |
Operating costs and expenses | | | | | | | | | | | | | |
| | Seismic and exploration | | | 30,666 | | | 41,274 | | | (10,608 | ) | | (25.70 | )% |
| | Dry hole expense and impairment | | | 14,486 | | | — | | | 14,486 | | | — | |
| | General and administrative | | | 35,996 | | | 31,271 | | | 4,725 | | | 15.11 | % |
| | Depreciation and amortization | | | 622 | | | 683 | | | (61 | ) | | (8.93 | )% |
| | | | | | | | | | |
Total operating costs and expenses | | | 81,770 | | | 73,228 | | | 8,542 | | | 11.66 | % |
| | | | | | | | | | |
Operating income (loss) | | | (81,770 | ) | | (73,228 | ) | | 8,542 | | | 11.66 | % |
Other income | | | | | | | | | | | | | |
| | Interest income | | | 513 | | | 1,632 | | | (1,119 | ) | | (68.6 | )% |
| | | | | | | | | | |
Total other income | | | 513 | | | 1,632 | | | (1,119 | ) | | (68.6 | )% |
| | | | | | | | | | |
Net income (loss) before income taxes | | | (81,257 | ) | | (71,596 | ) | | 9,661 | | | 13.49 | % |
Income tax expense (benefit) | | | — | | | — | | | — | | | — | |
| | | | | | | | | | |
Net income (loss) | | $ | (81,257 | ) | $ | (71,596 | ) | $ | 9,661 | | | 13.49 | % |
| | | | | | | | | | |
Oil and gas revenue. We have not yet commenced oil production. Therefore, we did not realize any oil and gas revenue during the years ended December 31, 2009 and 2008, respectively.
62
Table of Contents
Operating costs and expenses. Our operating costs and expenses consisted of the following during the years ended December 31, 2009 and 2008: expenditures for seismic data acquisition and processing, leasehold delay rentals, costs to maintain our information technology infrastructure, salaries and related taxes and benefits of personnel employed by us, office space and office-related costs, professional fees for consultants, auditors, tax advisors and legal services, travel costs, fees paid to financial investors and other office related expenses.
Seismic and exploration. Seismic and exploration costs decreased by $10.6 million during the year ended December 31, 2009, as compared to the year ended December 31, 2008. The decrease in seismic and exploration costs during this period was primarily due to a decrease of $4.5 million in purchases of U.S. Gulf of Mexico seismic data, an increase of $4.1 million in the purchase of West African seismic data and a $10.2 million reimbursement from Sonangol for past seismic costs incurred by us in the U.S. Gulf of Mexico.
Dry hole expense and impairment. For the year ended December 31, 2009, we temporarily suspended operations on the Ligurian #1 exploratory well and on February 7, 2010, we suspended operations on the Criollo #1 exploratory well. Although both wells encountered oil bearing sands further technical evaluation is required to determine the commerciality of these prospects and portions of both wells were determined to have no future value. As a result, we have recorded an impairment charge to dry hole expense for the year ended December 31, 2009 of $10.5 million for the impaired portion of the Ligurian #1 exploratory well and $4.0 million for the impaired portion of the Criollo #1 exploratory well representing cost incurred during 2009.
General and administrative. General and administrative costs increased by $4.7 million during the year ended December 31, 2009, as compared to the year ended December 31, 2008. The increase in general and administrative costs during this period was primarily due to a $7.9 million increase in costs related to staff, an increase of $2.1 million for legal, accounting and consulting fees, an increase of $1.5 million in monitoring fees paid to our investors, an increase of $0.3 million in office related support expenses and a decrease of $7.1 million from reimbursement of our general and administrative costs paid by TOTAL pursuant to our alliance with them.
Depreciation and amortization. Depreciation and amortization did not change significantly during the year ended December 31, 2009 as compared to the year ended December 31, 2008.
Other income. Our other income consisted primarily of interest income earned from cash held on deposit in our bank account. Interest income increased by $1.1 million during the year ended December 31, 2009, as compared to the year ended December 31, 2008 due to higher average cash balances in our bank account during the 2009 period when compared to the 2008 period.
Income Taxes. Prior to our corporate reorganization in connection with our IPO, we were not subject to federal or state income taxes. Upon completion of our corporate reorganization, we became subject to federal and state income taxes. At the time of the corporate reorganization, we recorded a net deferred tax asset of $28.9 million with a corresponding full valuation of $28.9 million.
63
Table of Contents
Fiscal Years Ended December 31, 2008 vs. 2007
| | | | | | | | | | | | | | |
| | Year Ended
December 31, | |
| |
| |
|---|
| | Increase
(Decrease) | | Percentage
Change | |
|---|
| | 2008 | | 2007 | |
|---|
| | ($ in thousands)
| |
|---|
Oil and gas revenue | | $ | — | | $ | — | | $ | — | | | 0 | % |
Operating costs and expenses | | | | | | | | | | | | | |
| | Seismic and exploration | | | 41,274 | | | 86,813 | | | (45,539 | ) | | (52.5 | )% |
| | General and administrative | | | 31,271 | | | 23,090 | | | 8,181 | | | 35.4 | % |
| | Depreciation and amortization | | | 683 | | | 435 | | | 248 | | | 57.0 | % |
| | | | | | | | | | |
Total operating costs and expenses | | | 73,228 | | | 110,338 | | | (37,110 | ) | | (33.6 | )% |
| | | | | | | | | | |
Operating income (loss) | | | (73,228 | ) | | (110,338 | ) | | (37,110 | ) | | (33.6 | )% |
Other income | | | | | | | | | | | | | |
| | Interest income | | | 1,632 | | | 1,384 | | | 248 | | | 17.9 | % |
| | | | | | | | | | |
Total other income | | | 1,632 | | | 1,384 | | | 248 | | | 17.9 | % |
| | | | | | | | | | |
Net income (loss)(1) | | $ | (71,596 | ) | $ | (108,954 | ) | $ | (37,358 | ) | | (34.3 | )% |
| | | | | | | | | | |
- (1)
- We were a Partnership during these two periods and thus not subject to federal and state income taxes.
Oil and gas revenue. We have not yet commenced oil production. Therefore, we did not realize any oil and gas revenue during the years ended December 31, 2008 and 2007, respectively.
Operating costs and expenses. Our operating costs and expenses consisted of the following during the years ended December 31, 2008 and 2007: expenditures for seismic data acquisition and processing, leasehold delay rentals, costs to maintain our information technology infrastructure, salaries and related taxes and benefits of personnel employed by us, office space and office-related costs, professional fees for consultants, auditors, tax advisors and legal services, travel costs, fees paid to financial investors and other office related expenses.
Seismic and exploration. Seismic and exploration costs decreased by $45.5 million during the year ended December 31, 2008, due to a decrease of $38.0 million in purchases of U.S. Gulf of Mexico seismic data, a decrease of $10.2 million in the purchase of West African seismic data offset by an increase of $2.7 million for delay rentals in the U.S. Gulf of Mexico due to acquisition of additional lease interests.
General and administrative. General and administrative costs increased by $8.2 million during the year ended December 31, 2008, as compared to the year ended December 31, 2007, due to an increase of $3.6 million in costs related to staff additions, an increase of $1.7 million in spending for information technology and office support, and an increase of $2.9 million for legal, accounting and consulting fees and services.
Depreciation and amortization. Depreciation and amortization, which relates primarily to non-oil and gas properties and equipment, increased by $0.2 million during the year ended December 31, 2008, as compared to the year ended December 31, 2007 due to an increase in depreciable office equipment.
Other income. Our other income consisted primarily of interest income earned from cash held on deposit in our bank account. Interest income increased by $0.2 million during the year ended December 31, 2008, as compared to the year ended December 31, 2007 due to higher average cash balances carried in our bank account during 2008 when compared to 2007.
64
Table of Contents
Liquidity and Capital Resources
We are a development stage enterprise and will continue to be so until commencement of substantial production from our oil properties. We do not expect production until 2013 to 2015 in the U.S. Gulf of Mexico or until 2014 to 2016 offshore Angola and Gabon and therefore we do not expect to generate any revenue from production until 2013 at the earliest, which will depend upon successful drilling results, additional capital funding and access to suitable infrastructure. Until then, our primary sources of liquidity are expected to be cash on hand, amounts paid pursuant to the terms of our TOTAL alliance and the Sonangol partnership and funds from future equity and debt financings, asset sales and farm-out arrangements.
We expect to incur substantial expenses and generate significant operating losses as we continue to:
- •
- complete our current exploration and appraisal drilling program through 2011 in the U.S. Gulf of Mexico and our current exploration drilling program through 2011 offshore Angola and Gabon;
- •
- purchase and analyze seismic data in order to identify future prospects;
- •
- opportunistically invest in additional oil leases and concessional licenses adjacent to our current positions;
- •
- develop our discoveries which we determine to be commercially viable; and
- •
- incur expenses related to operating as a public company and compliance with regulatory requirements.
Our future financial condition and liquidity will be impacted by, among other factors, the success of our exploration and appraisal drilling program, the number of commercially viable oil discoveries made and the quantities of oil discovered, the speed with which we can bring such discoveries to production, and the actual cost of exploration, appraisal and development of our prospects.
We estimate that we will need to spend approximately $430 million of capital for the year ending December 31, 2010 in order to achieve our 2010 plans. We expect that our existing cash on hand will be sufficient to fund our planned exploration and appraisal drilling program at least through the end of 2011. However, we may require significant additional funds earlier than we currently expect in order to execute our strategy as planned. We may seek additional funding through asset sales, farm-out arrangements and equity and debt financings. Additional funding may not be available to us on acceptable terms or at all. In addition, the terms of any financing may adversely affect the holdings or the rights of our stockholders. For example, if we raise additional funds by issuing additional equity securities, further dilution to our existing stockholders will result. If we are unable to obtain funding on a timely basis, we may be required to significantly curtail one or more of our exploration and appraisal drilling programs. We also could be required to seek funds through arrangements with collaborators or others that may require us to relinquish rights to some of our prospects which we would otherwise develop on our own, or with a majority working interest.
Cash Flows
| | | | | | | | | | | |
| | Year Ended December 31. | |
|---|
| | 2009 | | 2008 | | 2007 | |
|---|
| | Audited | | Audited | | Audited | |
|---|
| | ($ in thousands)
| |
|---|
Net cash provided by (used in): | | | | | | | | | | |
| | Operating Activities | | $ | (71,667 | ) | $ | (82,164 | ) | $ | (116,050 | ) |
| | Investing Activities | | | 83,943 | | | (575,771 | ) | | (103,770 | ) |
| | Financing Activities | | | 1,075,721 | | | 567,092 | | | 305,135 | |
65
Table of Contents
Operating activities. The decrease in net cash used in 2009 was primarily due to the increase in cash payments for drilling of Shenandoah #1, Heidelberg #1, Ligurian #1 and Criollo #1 exploratory wells offset by receipt of $10.2 million from Sonangol for reimbursement of past seismic data expenditures. Net cash used in operating activities in 2009 was $71.7 million compared with net cash used in operating activities of $82.2 million and $116.1 million in 2008 and 2007, respectively. The decrease in cash used in 2008 is attributed primarily to decreased expenditures for seismic data when compared to 2007.
Investing activities. Net cash provided by investing activities in 2009 was $83.9 million compared with net cash used in investing activities of $575.8 million and $103.8 million in 2008 and 2007, respectively. The decrease in net cash used in 2009 was primarily attributed to proceeds received in 2009 totaling $333.3 million for sale of leasehold interests in the U.S. Gulf of Mexico. The increase in cash used in 2008 is attributed to increased expenditure for leases awarded to us in the U.S. Gulf of Mexico. In addition, cash used in investing activities in 2008 was primarily for acquisition of leasehold interests in the U.S. Gulf of Mexico.
Financing activities. The increase in net cash provided by financing activities in 2009 was attributed to cash received from Cobalt International Energy, L.P.'s Class A limited partnership interest holders during this year and the net proceeds of approximately $900 million from the initial public offering and sale of 3,125,000 shares from a concurrent private offering pursuant to Regulation S, which closed on December 21, 2009. The net cash provided in 2008 and 2007 represents the cash received from Cobalt International Energy, L.P.'s Class A limited partnership interest holders during these respective years.
Contractual Obligations
As of December 31, 2009, our contractual obligations were limited to payments to be made in connection with the leases related to our ENSCO 8503 and Transocean DD-I drilling rigs, office lease payments and lease rental payments for exploration rights from the MMS for further exploration in the western and central U.S. Gulf of Mexico. The following table summarizes by period the payments due for our estimated contractual obligations as of December 31, 2009:
| | | | | | | | | | | | | | | | | | | |
| | Payments Due By Year | |
|---|
| | 2010 | | 2011 | | 2012 | | 2013 | | Thereafter | | Total | |
|---|
| | ($ in thousands)
| |
|---|
Drilling Rig Contracts | | $ | 63,000 | | $ | 186,000 | | $ | 186,000 | | $ | — | | $ | — | | $ | 435,000 | |
Operating Leases | | | 458 | | | 237 | | | — | | | — | | | — | | | 695 | |
Lease Rentals | | | 5,847 | | | 5,784 | | | 5,685 | | | 4,897 | | | 15,142 | | | 37,355 | |
| | | | | | | | | | | | | | |
Total | | $ | 69,305 | | $ | 192,021 | | $ | 191,685 | | $ | 4,897 | | $ | 15,142 | | $ | 473,050 | |
| | | | | | | | | | | | | | |
In the future, we may be party to the following contractual arrangements, which will subject us to further contractual obligations:
- •
- credit facilities;
- •
- contracts for the lease of drilling rigs;
- •
- contracts for the provision of production facilities;
- •
- infrastructure construction contracts; and
- •
- long term oil and gas property lease arrangements.
Off-Balance Sheet Arrangements
As of December 31, 2009, we did not have any off-balance sheet arrangements.
66
Table of Contents
Critical Accounting Policies
This discussion of financial condition and results of operations is based upon the information reported in our consolidated financial statements, which have been prepared in accordance with generally accepted accounting principles in the United States. The preparation of our financial statements requires us to make assumptions and estimates that affect the reported amounts of assets, liabilities, revenues and expenses, as well as the disclosure of contingent assets and liabilities at the date of our financial statements. We base our assumptions and estimates on historical experience and other sources that we believe to be reasonable at the time. Actual results may vary from our estimates. Our significant accounting policies are detailed in Note 2 to our consolidated financial statements. We have outlined below certain accounting policies that are of particular importance to the presentation of our financial position and results of operations and require the application of significant judgment or estimates by our management.
Revenue Recognition. We plan to follow the "sales" (or cash) method of accounting for oil and gas revenues. Under this method, we will recognize revenues on the volumes sold. The volumes sold may be more or less than the volumes to which we are entitled based on our ownership interest in the property. These differences result in a condition known in the industry as a production imbalance. As of December 31, 2009, no revenues have been recognized in our financial statements.
We recognize interest income on bank balances and deposits on a time basis, by reference to the principal outstanding and at the effective interest rate applicable.
Cash and Cash Equivalents. Cash and cash equivalents consist of all demand deposits and funds invested in highly liquid instruments with original maturities of three months or less and typically exceed federally insured limits. We periodically assess the financial condition of the institutions where these funds are held and believe that the credit risk is minimal.
Property, Plant and Equipment. We use the "successful efforts" method of accounting for our oil properties. Under the successful efforts method of accounting, proved leasehold costs are capitalized and amortized over the proved developed and undeveloped reserves on a units-of-production basis. Successful drilling costs, costs of development and developmental dry holes are capitalized and amortized over the proved developed reserves on a units-of-production basis. Unproved leasehold costs are capitalized and are not amortized, pending an evaluation of their exploration potential. Unproved leasehold costs are assessed on an individual basis periodically to determine if an impairment of the cost of individual properties has occurred. Factors taken into account for impairment analysis include results of the technical studies conducted, lease terms and management's future exploration plans. The cost of impairment is charged to expense in the period in which it occurs. Costs incurred for exploratory dry holes, geological, and geophysical work (including the cost of seismic data) and delay rentals are charged to expense as incurred. Costs of other property and equipment are depreciated on a straight-line based on their respective useful lives.
Inventory. Inventories consist of various tubular products that will be used in our anticipated drilling program. The inventory is stated at the lower of cost or market. Cost is determined on weighted average method and comprises of purchase price and other directly attributable costs.
Income and Other Taxes. Prior to December 15, 2009, no provision for U.S. federal income taxes related to our operations was included in the accompanying financial statements. As a partnership, we were not subject to federal or state income tax, and the tax effect of our activities accrued to the partners. The Partnership had obligations associated with providing certain tax-related information to the partners and registrations and filings with applicable governmental taxing authorities.
Effective December 15, 2009, we apply the liability method of accounting for income taxes in accordance with FASB ASC No. 740,Income Taxes (SFAS No. 109) as clarified by FASB Interpretation
67
Table of Contents
No. 48,Accounting for Uncertainty in Income Taxes—an Interpretation of FASB Statement No. 109, Accounting for Income Taxes. Under this method, deferred tax assets and liabilities are determined by applying tax rates in effect at the end of a reporting period to the cumulative temporary differences between the tax bases of assets and liabilities and their reported amounts in the financial statements. Since we are in development stage and there can be no assurance that we will generate any earnings or any specific level of earnings in future years, we have established a valuation allowance for deferred tax assets (net of liabilities).
Use of Estimates. The preparation of our consolidated financial statements in conformity with United States generally accepted accounting principles requires us to make estimates and assumptions that impact our reported assets and liabilities, disclosure of contingent assets and liabilities at the date of our consolidated financial statements and the reported amounts of revenues and expenses during the reporting period. Significant estimates include: (i) accruals related to expenses, (ii) assumptions used in estimating fair value of equity-based awards, and (iii) assumptions used in impairment testing. Although we believe these estimates are reasonable, actual results could differ from these estimates.
Estimates of Proved Oil & Natural Gas Reserves. Reserve quantities and the related estimates of future net cash flows affect our periodic calculations of depletion and impairment of our oil and natural gas properties. Proved oil and natural gas reserves are the estimated quantities of crude oil, natural gas and natural gas liquids which geological and engineering data demonstrate with reasonable certainty to be recoverable in future periods from known reservoirs under existing economic and operating conditions. As of December 31, 2009, we do not have any proved reserves. Should proved reserves be found in the future, estimated reserve quantities and future cash flows will be estimated by an independent petroleum consultants and prepared in accordance with guidelines established by the SEC and the Financial Accounting Standards Board. The accuracy of these reserve estimates is a function of:
- •
- the quality and quantity of available data and the engineering and geological interpretation of that data;
- •
- estimates regarding the amount and timing of future operating cost, severance taxes, development cost and workover cost, all of which may in fact vary considerably from actual results;
- •
- the accuracy of various mandated economic assumptions (such as the future prices of oil and natural gas); and
- •
- the judgments of the persons preparing the estimates.
Asset Retirement Obligations
We currently do not have any oil and natural gas production. Should such production occur in the future, we expect to have significant obligations under our lease agreements and federal regulation to remove our equipment and restore land or seabed at the end of oil and natural gas production operations. These asset retirement obligations ("ARO") are primarily associated with plugging and abandoning wells and removing and disposing of offshore oil and natural gas platforms. Estimating the future restoration and removal cost is difficult and requires us to make estimates and judgments because most of the removal obligations are many years in the future and contracts and regulation often have vague descriptions of what constitutes removal. Asset removal technologies and cost are constantly changing, as are regulatory, political, environmental, safety and public relations considerations. Pursuant to the FASB ASC No. 410-20, "Assets Retirement Obligations" (SFAS No. 143), we are required to record a separate liability for the discounted present value of our asset retirement obligations, with an offsetting increase to the related oil and natural gas properties representing asset retirement costs on our balance sheet. The cost of the related oil and natural gas asset, including the
68
Table of Contents
asset retirement cost, is depreciated over the useful life of the asset. The asset retirement obligation is recorded at its estimated fair value, measured by reference to the expected future cash outflows required to satisfy the retirement obligation discounted at our credit-adjusted risk-free interest rate. Accretion expense is recognized over time as the discounted liability is accreted to its expected settlement value.
Inherent to the present value calculation are numerous estimates, assumptions and judgments, including the ultimate settlement amounts, inflation factors, credit adjusted risk-free rates, timing of settlement and changes in the legal, regulatory, environmental and political environments. To the extent future revisions to these assumptions impact the present value of the abandonment liability, we will make corresponding adjustments to both the asset retirement obligation and the related our oil and natural gas property asset balance. Increases in the discounted abandonment liability and related oil and natural gas assets resulting from the passage of time will be reflected as additional accretion and depreciation expense in the consolidated statement of operations.
Equity-based Compensation
In accordance with theCompensation—Stock Compensation Topic of the Codification, we recognized compensation cost for stock-based payments to employees over the period during which the recipient is required to provide service in exchange for the award, based on the fair value of the equity instrument on the date of the grant.
New Accounting Pronouncements
In June 2009, the FASB issued SFAS No. 168,"The FASB Accounting Standards Codification and the Hierarchy of Generally Accepted Accounting Principles—a replacement of FASB Statement No. 162," ("SFAS 168"). The FASB Accounting Standards Codification (the "Codification") became the source of authoritative GAAP applicable to all public and non-public entities on July 1, 2009 and supersedes authoritative guidance issued by the FASB, the American Institute of Certified Public Accountants (AICPA) and the Emerging Issues Task Force ("EITF"). The Codification, which changes the referencing of financial standards, is in effect for interim or annual financial periods ending after September 15, 2009. The Codification is not intended to change or alter existing GAAP. We adopted the codification in our financial information for the year ended December 31, 2009, which had no impact on our financial position, results of operations or cash flows.
In May 2009, the FASB issued FASB ASC No. 855,"Subsequent Events" (SFAS No. 165) to establish general standards of accounting for and disclosure of events that occur after the balance sheet date but before the financial statements are issued ("subsequent events"). SFAS No. 165 defines two types of subsequent events as "recognized" and "nonrecognized." Recognized subsequent events are events that provide additional evidence about conditions that existed at the balance sheet date (including estimates inherent in the process of preparing the financial statements) and therefore should be recorded in the financial statements. Nonrecognized subsequent events are events that do not provide evidence about conditions that existed at the balance sheet date but are considered to be material and therefore should be disclosed. The new standard requires disclosure of the date through which management has evaluated subsequent events and the basis for such date, which for public entities is generally the date the financial statements are issued. SFAS No. 165 is effective for interim or annual reporting periods ending after June 15, 2009, and shall be applied prospectively. SFAS No. 165 is not applicable to specific subsequent events that fall within the scope of other GAAP pronouncements. The adoption of SFAS No. 165 did not have an impact on our financial position, cash flows or results of operations.
In April 2009, the FASB issued FASB ASC No. 825,"Financial Instruments", (FSP No. 107-1 and APB 28-1) ("FSP 107-1")). FSP 107-1 requires public companies to include disclosures about the fair
69
Table of Contents
value of their financial instruments in interim reporting periods, as well as the methods, significant assumptions and any changes in such methods and assumptions used to estimate the fair value of financial instruments. FSP 107-1 is effective for interim reporting periods ending after June 15, 2009. The adoption of FSP 107-1 did not have a material impact on our financial statements.
In January 2010, the FASB issued certain amendments to theExtractive Activities—Oil and Gas Topic of the Accounting Standards Codification (the "Codification") that updated and aligned the FASB's reserve estimation and disclosure requirements for oil and natural gas companies with the reserve estimation and disclosure requirements that were adopted by the Securities and Exchange Commission ("SEC") in December 2008. The FASB's amendments and the SEC's new requirements became effective for annual reporting periods ending on or after December 31, 2009. Collectively, the new rules permit the use of new technologies in the determination of proved reserves if those technologies have been demonstrated empirically to lead to reliable conclusions about reserve volumes. Other definitions and terms were revised, including the definition ofproved reserves which was changed to indicate, among other things, that commencing with year-end 2009 entities must use unweighted average of first-day-of-the-month commodity prices over the preceding 12-month period, rather than end-of-period commodity prices, when estimating quantities of proved reserves. Similarly, the prices used to calculate the aggregate amount of (and changes in) future cash inflows related to the standardized measure of discounted future cash flows have been changed from end-of-period commodity prices to the 12-month average commodity prices used in calculating proved reserves. Beginning in the fourth quarter of 2009, the estimated future net revenues used to calculate the ceiling test are based on the 12-month average commodity price for each product. Additionally, entities must separately disclose information about reserve quantities and certain financial statement amounts for geographic areas that represent 15 percent or more of proved reserves, and equity-method investments should be included in determining whether an entity has significant oil and gas producing activities. Another significant provision of the new rules is a general requirement that, subject to limited exceptions, proved undeveloped reserves may only be classified as such if a development plan has been adopted indicating that they are scheduled to be drilled within five years. As of December 31, 2009, Cobalt did not have any proved reserves and has complied with the revised disclosure requirements in our financial statement for the years ending December 31, 2009 as applicable.
Item 7A. Quantitative and Qualitative Disclosures About Market Risk
The primary objective of the following information is to provide forward-looking quantitative and qualitative information about our potential exposure to market risks. The term "market risks" refers to the risk of loss arising from changes in commodity prices and interest rates. The disclosures are not meant to be precise indicators of expected future losses, but rather indicators of reasonably possible losses. This forward-looking information provides indicators of how we view and manage our ongoing market risk exposures. All of our market risk sensitive instruments will be entered into for purposes of risk management and not for speculation.
Due to the historical volatility of commodity prices, if and when we commence production, we may enter into various derivative instruments to manage our exposure to volatility of commodity market prices. We may use options (including floors and collars) and fixed price swaps to mitigate the impact of downward swings in commodity prices to our cash flow. All contracts will be settled with cash and would not require the delivery of physical volumes to satisfy settlement. While in times of higher commodity prices this strategy may result in our having lower net cash inflows than we would otherwise have if we had not utilized these instruments, management believes the risk reduction benefits of such a strategy would outweigh the potential costs.
We may borrow under fixed rate and variable rate debt instruments that give rise to interest rate risk. Our objective in borrowing under fixed or variable rate debt is to satisfy capital requirements while minimizing our costs of capital.
70
Table of Contents
Item 8. Financial Statements and Supplementary Data
The information required is included in this report as set forth in the "Index to Consolidated Financial Statements" on page F-1.
Item 9. Changes in and Disagreements with Accountants on Accounting and Financial Disclosure
None
Item 9A. Controls and Procedures
Conclusion Regarding the Effectiveness of Disclosure Controls and Procedures
Under the supervision and with the participation of our management, including our Chief Executive Officer and Chief Financial Officer (our Principal Executive Officer and Principal Financial Officer, respectively), we have evaluated our disclosure controls and procedures (as defined in Securities Exchange Act Rule 13a-15(e)) as of December 31, 2009. Based upon that evaluation, the Principal Executive Officer and Principal Financial Officer have concluded that our disclosure controls and procedures are effective.
Management's Annual Report on Internal Control Over Financial Reporting
This Annual Report on Form 10-K does not include an attestation report of our registered public accounting firm regarding internal control over financial reporting. Management's report was not subject to attestation by our registered public accounting firm pursuant to rules of the Securities and Exchange Commission that permit a transition period for newly public companies to include such attestation.
Changes in Internal Control Over Financial Reporting
There has been no change in our internal control over financial reporting during the fourth quarter ended December 31, 2009, that has materially affected, or is reasonably likely to materially affect, our internal control over financial reporting.
Item 9B. Other Information
None.
PART III
Item 10. Directors, Executive Officers and Corporate Governance
The information required by this item is set forth under the captions "Election of Directors," "Corporate Governance" and "Section 16(a) Beneficial Ownership Reporting Compliance" in our definitive Proxy Statement (the "2010 Proxy Statement") for our annual meeting of stockholders to be held on May 4, 2010, which sections are incorporated herein by reference.
Pursuant to Item 401(b) of Regulation S-K, the information required by this item with respect to our executive officers is set forth in Part I of this Annual Report on Form 10-K.
Item 11. Executive Compensation
The information required by this item is set forth in the sections entitled "Election of Directors—Director Compensation," "Executive Compensation" and "Corporate Governance" in the 2010 Proxy Statement, which sections are incorporated herein by reference.
71
Table of Contents
Item 12. Security Ownership of Certain Beneficial Owners and Management and Related Stockholder Matters
The information required by this item is set forth in the sections entitled "Security Ownership of Certain Beneficial Owners and Management" and "Executive Compensation—Equity Compensation Plan Information" in the 2010 Proxy Statement, which sections are incorporated herein by reference.
Item 13. Certain Relationships and Related Transactions, and Director Independence
The information required by this item is set forth in the section entitled "Corporate Governance" and "Certain Relationships and Related Transactions" in the 2010 Proxy Statement, which sections are incorporated herein by reference.
Item 14. Principal Accounting Fees and Services
The information required by this item is set forth in the section entitled "Ratification of Appointment of Independent Auditors" in the 2010 Proxy Statement, which section is incorporated herein by reference.
72
Table of Contents
GLOSSARY OF SELECTED OIL AND GAS TERMS
| | |
| "2-D seismic data" | | Two-dimensional seismic data, being an interpretive data that allows a view of a vertical cross-section beneath a prospective area. |
"3-D seismic data" |
|
Three-dimensional seismic data, being geophysical data that depicts the subsurface strata in three dimensions. 3-D seismic data typically provides a more detailed and accurate interpretation of the subsurface strata than 2-D seismic data. |
"Appraisal well" |
|
A well drilled after an exploratory well to gain more information on the drilled reservoirs. |
"Barrel" |
|
A standard measure of volume for petroleum corresponding to approximately 42 gallons at 60 degrees fahrenheit. |
"Below salt" |
|
A term encompassing both subsalt, as used in connection with the U.S. Gulf of Mexico, and pre-salt, as used in connection with offshore West Africa. |
"Blowouts" |
|
Blowout is the uncontrolled release of a formation fluid, usually gas, from a well being drilled, typically for petroleum production. A blowout is caused when a combination of well control systems fail primarily drilling mud hydrostatics, and formation pore pressure is greater than the wellbore pressure at depth. |
"Closure" |
|
A trapping configuration. |
"Completion" |
|
The procedure used in finishing and equipping an oil or natural gas well for production. |
"Delay rental" |
|
Payment made to the lessor under a non-producing oil and natural gas lease at the beginning or end of each year to continue the lease in force for another year during its primary term. |
"Development" |
|
The phase in which an oil field is brought into production by drilling development wells and installing appropriate production systems. |
"Development well" |
|
A well drilled to a known formation in a discovered field, usually offsetting a producing well on the same or an adjacent oil and natural gas lease. |
73
Table of Contents
| | |
| "Drilling and completion costs" | | All costs, excluding operating costs, of drilling, completing, testing, equipping and bringing a well into production or plugging and abandoning it, including all labor and other construction and installation costs incident thereto, location and surface damages, cementing, drilling mud and chemicals, drillstem tests and core analysis, engineering and well site geological expenses, electric logs, costs of plugging back, deepening, rework operations, repairing or performing remedial work of any type, costs of plugging and abandoning any well participated in by us, and reimbursements and compensation to well operators. |
"Dry hole" |
|
A well found to be incapable of producing hydrocarbons in sufficient quantities such that proceeds from the sale of such production exceed the related oil and natural gas operating expenses and taxes. |
"E&P" |
|
Exploration and production. |
"Exploratory well" |
|
A well drilled either (a) in search of a new and as yet undiscovered pool of oil or natural gas or (b) with the hope of significantly extending the limits of a pool already developed. |
"Farm-in" |
|
An agreement whereby an oil company acquires a portion of the leasehold or working interest in a block from the owner of such interest in certain acreage, usually in return for cash and for taking on a portion of the drilling of one or more specific wells or other performance by the assignee as a condition of the assignment. Under a farm-in, the owner of the leasehold or working interest may retain some interest such as an overriding royalty interest, an oil and natural gas payment, offset acreage or other type of interest. |
"Farm-out" |
|
An agreement whereby the owner of the leasehold or working interest agrees to assign a portion of his interest in certain acreage subject to the drilling of one or more specific wells or other performance by the assignee as a condition of the assignment. Under a farm-out, the owner of the leasehold or working interest may retain some interest such as an overriding royalty interest, an oil and natural gas payment, offset acreage or other type of interest. |
"Field" |
|
A geographical area under which an oil or natural gas reservoir lies in commercial quantities. |
"FERC" |
|
Federal Energy Regulatory Commission |
"Finding and development costs" |
|
Capital costs incurred in the acquisition, exploration, appraisal, development and revisions of proved oil and natural gas reserves divided by proved reserve additions. |
"FPSO" |
|
Floating Production, Storage and Offloading system. |
74
Table of Contents
| | |
| "Gas-oil ratio" | | The ratio of the volume of gas that comes out of solution from the volume of oil at standard conditions (expressed in standard cubic feet per barrel of oil); a component of hydrocarbon yield. |
"Gathering system" |
|
Pipelines and other facilities that transport oil from wells and bring it by separate and individual lines to a central delivery point for delivery into a transmission line or mainline. |
"Gross acre" |
|
An acre in which a working interest is owned. The number of gross acres is the total number of acres in which an interest is owned (see "Net Acre" below). |
"Horizon" |
|
A zone of a particular formation; that part of a formation of sufficient porosity and permeability to form a petroleum reservoir. |
"Hydrocarbon yield" |
|
The oil and natural gas that can ultimately be recovered from a volume of rock (expressed in boe per acre-foot); the primary components of which are recoverable oil and gas-oil ratio. |
"Leases" |
|
Full or partial interests in oil or natural gas properties authorizing the owner of the lease to drill for, produce and sell oil and natural gas upon payment of rental, bonus, royalty or any other payments. |
"Mean net pay thickness" |
|
The mean vertical extent of the effective hydrocarbon-bearing rock (expressed in feet). |
"Mean prospect area" |
|
The mean aerial extent of a hydrocarbon-bearing rock (expressed in feet). |
"Mud" |
|
Mud is a term that is generally synonymous with drilling fluid and that encompasses most fluids used in hydrocarbon drilling operations, especially fluids that contain significant amounts of suspended solids, emulsified water or oil. |
"Natural gas" |
|
Natural gas is a combination of light hydrocarbons that, in average pressure and temperature conditions, is found in a gaseous state. In nature, it is found in underground accumulations, and may potentially be dissolved in oil or may also be found in its gaseous state. |
"Narrow-azimuth 3-D seismic data" |
|
Seismic data acquired with receivers located in long lines that are located in line with source position. This acquisition is repeated in closely positioned parallel lines to yield 3-D seismic data coverage. |
"NORM" |
|
Naturally occurring radioactive materials. |
"Oil and natural gas lease" |
|
A legal instrument executed by a mineral owner granting the right to another to explore, drill, and produce subsurface oil and natural gas. An oil and natural gas lease embodies the legal rights, privileges and duties pertaining to the lessor and lessee. |
"OPEC" |
|
Organization of the Petroleum Exporting Countries. |
75
Table of Contents
| | |
| "Operator" | | A party that has been designated as manager for exploration, drilling, and/or production on a lease. The operator is the party that is responsible for (a) initiating and supervising the drilling and completion of a well and/or (b) maintaining the producing well. |
"Play" |
|
A project associated with a prospective trend of potential prospects, but which requires more data acquisition and/or evaluation in order to define specific leads or prospects. |
"Porosity" |
|
Porosity is the percentage of pore volume or void space, or that volume within rock that can contain fluids. Porosity can be a relic of deposition (primary porosity, such as space between grains that were not compacted together completely) or can develop through alteration of the rock (secondary porosity, such as when feldspar grains or fossils are preferentially dissolved from sandstones). |
"Pre-stack, depth-migrated seismic data processing" |
|
A type of seismic data processing used to position recorded seismic reflections into their correct subsurface location and depth. |
"Probable reserves" |
|
Oil and gas whose existence is not proven by geological information but is probably present due to proximity to proved reserves and can be produced if located. Probable reserves are less accurate that proved reserves. |
"Producing well" |
|
A well that is found to be capable of producing hydrocarbons in sufficient quantities such that proceeds from the sale of such production exceed production expenses and taxes. |
"Prospect(s)" |
|
Potential trap which may contain hydrocarbons and is supported by the necessary amount and quality of geologic and geophysical data to indicate a probability of oil and/or natural gas accumulation ready to be drilled. The five required elements (generation, migration, reservoir, seal and trap) must be present for a prospect to work and if any of them fail neither oil nor natural gas will be present, at least not in commercial volumes. |
"Protraction area" |
|
An offshore area in the U.S. Gulf of Mexico defined by a series of blocks. |
"Proved reserves" |
|
Estimated quantities of crude oil, natural gas, NGL's which geological and engineering data demonstrate with reasonable certainty to be economically recoverable in future years from known reservoirs under existing economic and operating conditions, as well as additional reserves expected to be obtained through confirmed improved recovery techniques, as defined in SEC Regulation S-X 4-10(a)(2). |
"Recoverable oil" |
|
The amount of oil that can ultimately be recovered from a volume of rock (expressed in barrels of oil per acre-foot); a component of hydrocarbon yield. |
76
Table of Contents
| | |
| "Reservoir" | | A subsurface body of rock having sufficient porosity and permeability to store and to allow for the mobility of fluids/hydrocarbons included in its pores. |
"Royalty" |
|
A fractional undivided interest in the production of oil and natural gas wells, or the proceeds therefrom to be received free and clear of all costs of development, operations or maintenance. |
"Secondary recovery" |
|
An artificial method or process used to restore or increase production from a reservoir after the primary production by the natural producing mechanism and reservoir pressure has experienced partial depletion. Gas injection and waterflooding are examples of this technique. |
"Signature bonus" |
|
Usually one time payment made to a mineral owner as consideration for the execution of an oil and natural gas lease. |
"Shut in" |
|
To close the valves on a well so that it stops producing. |
"Spud" |
|
The very beginning of drilling operations of a new well, occurring when the drilling bit penetrates the surface utilizing a drilling rig capable of drilling the well to the authorized total depth. |
"Wave equation, pre-stack, depth-migrated seismic data processing" |
|
A type of seismic data processing. |
"Wide-azimuth seismic data" |
|
Seismic data acquired with receivers located in long lines that have sources positioned in line with additional sources positioned at large lateral offsets. This acquisition is repeated in closely positioned parallel lines to yield 3-D seismic data coverage with increased azimuths of energy penetration. |
"Working interest" |
|
An interest in an oil and natural gas lease entitling the holder at its expense to conduct drilling and production operations on the leased property and to receive the net revenues attributable to such interest, after deducting the landowner's royalty, any overriding royalties, production costs, taxes and other costs. |
"Workover" |
|
Operations on a producing well to restore or increase production. |
77
Table of Contents
PART IV
Item 15. Exhibits and Financial Statement Schedules
- (a)
- The following documents are filed as part of this Annual Report on Form 10-K:
- (1)
- Financial Statements
Cobalt International Energy, Inc. (pka Cobalt International Energy, L.P.)
| | |
Report of Independent Registered Public Accounting Firm | | F-2 |
Consolidated Balance Sheet of Cobalt International Energy, Inc. as of December 31, 2009 and 2008 | | F-3 |
Consolidated Statements of Operations of Cobalt International Energy, Inc. for the years ended December 31 2009, 2008 and 2007, and for the period November 10, 2005 (Inception) through December 31, 2009 | | F-4 |
Consolidated Statements of Changes in Partners' Capital/Stockholders' Equity of Cobalt International Energy, Inc. for the years ended December 31, 2009, 2008 and 2007, and for the period November 10, 2005 (Inception) through December 31, 2009 | | F-5 |
Consolidated Statements of Cash Flows of Cobalt International Energy, Inc. for the years ended December 31, 2009, 2008 and 2007, and for the period November 10, 2005 (Inception) through December 31, 2009 | | F-6 |
Notes to Consolidated Financial Statements | | F-7 |
- (2)
- Financial Statement Schedule
Not applicable.
The following exhibits are filed with this Annual Report on Form 10-K or incorporated by reference:
| | | |
| Exhibit Number | | Description of Document |
|---|
| | 3.1* | | Certificate of Incorporation of the Company |
| | 3.2 | | By-laws of the Company (incorporated by reference to Exhibit 3 to the Company's Registration Statement on Form 8-A filed December 11, 2009 (File No. 001-34579)) |
| | 4.1 | | Specimen stock certificate (incorporated by reference to Exhibit 4.1 to the Company's Registration Statement on Form S-1/A filed November 27, 2009 (File No. 333-161734)) |
| | 4.2* | | Reorganization Agreement, dated December 8, 2009, among the Company, the Partnership, Cobalt Mergersub, Inc. and the other parties signatory thereto |
| | 10.1† | | Employment Agreement, dated November 12, 2009, among the Company, the Partnership and Joseph H. Bryant (incorporated by reference to Exhibit 10.1 to the Company's Registration Statement on Form S-1/A filed November 27, 2009 (File No. 333-161734)) |
| | 10.2† | | Severance Agreement, dated October 23, 2009, among the Company, the Partnership and Samuel H. Gillespie (incorporated by reference to Exhibit 10.2 to the Company's Registration Statement on Form S-1/A filed November 27, 2009 (File No. 333-161734)) |
| | 10.3† | | Employment Agreement, dated October 23, 2009, among the Company, the Partnership and Rodney L. Gray (incorporated by reference to Exhibit 10.3 to the Company's Registration Statement on Form S-1/A filed November 27, 2009 (File No. 333-161734)) |
78
Table of Contents
| | | |
| Exhibit Number | | Description of Document |
|---|
| | 10.4† | | Employment Agreement, dated October 23, 2009, among the Company, the Partnership and James H. Painter (incorporated by reference to Exhibit 10.4 to the Company's Registration Statement on Form S-1/A filed November 27, 2009 (File No. 333-161734)) |
| | 10.5† | | Employment Agreement, dated October 23, 2009, among the Company, the Partnership and James W. Farnsworth (incorporated by reference to Exhibit 10.5 to the Company's Registration Statement on Form S-1/A filed November 27, 2009 (File No. 333-161734)) |
| | 10.6† | | Severance Agreement, dated October 23, 2009, among the Company, the Partnership and John P. Wilkirson (incorporated by reference to Exhibit 10.6 to the Company's Registration Statement on Form S-1/A filed November 27, 2009 (File No. 333-161734)) |
| | 10.7* | | Risk Services Agreement relating to Block 9, between CIE Angola Block 9 Ltd., Sonangol, Sonangol Pesquisa e Produção, S.A., Nazaki Oil and Gás and Alper Oil, Lda |
| | 10.8* | | Risk Services Agreement relating to Block 21, between CIE Angola Block 21 Ltd., Sonangol, Sonangol Pesquisa e Produção, S.A., Nazaki Oil and Gás and Alper Oil, Lda |
| | 10.9 | | Exploration and Production Sharing Contract, dated December 13, 2006, between the Republic of Gabon and Total Gabon, S.A. (incorporated by reference to Exhibit 10.5 to the Company's Registration Statement on Form S-1/A filed October 29, 2009 (File No. 333-161734)) |
| | 10.10 | | Assignment Agreement, dated November 29, 2007, between CIE Gabon Diaba Ltd. and Total Gabon, S.A. (incorporated by reference to Exhibit 10.6 to the Company's Registration Statement on Form S-1/A filed October 29, 2009 (File No. 333-161734)) |
| | 10.11 | | Simultaneous Exchange Agreement, dated April 6, 2009, between the Partnership and TOTAL E&P USA, INC. (incorporated by reference to Exhibit 10.7 to the Company's Registration Statement on Form S-1/A filed October 9, 2009 (File No. 333-161734)) |
| | 10.12 | | Gulf of Mexico Program Management and AMI Agreement, dated April 6, 2009, between the Partnership and TOTAL E&P USA, INC. (incorporated by reference to Exhibit 10.8 to the Company's Registration Statement on Form S-1/A filed October 9, 2009 (File No. 333-161734)) |
| | 10.13 | | Offshore Daywork Drilling Contract, dated May 3, 2008, between the Partnership and ENSCO Offshore Company ("ENSCO") (incorporated by reference to Exhibit 10.9 to the Company's Registration Statement on Form S-1/A filed October 29, 2009 (File No. 333-161734)) |
| | 10.14† | | Form of Restricted Stock Award Agreements relating to the Class B interests (incorporated by reference to Exhibit 10.10 to the Company's Registration Statement on Form S-1/A filed October 29, 2009 (File No. 333-161734)) |
| | 10.15† | | Form of Restricted Stock Award Agreements relating to the Class C interests (incorporated by reference to Exhibit 10.11 to the Company's Registration Statement on Form S-1/A filed October 29, 2009 (File No. 333-161734)) |
| | 10.16† | | Form of Restricted Stock Award Agreements relating to the Class D interests (incorporated by reference to Exhibit 10.12 to the Company's Registration Statement on Form S-1/A filed October 29, 2009 (File No. 333-161734)) |
| | 10.17† | | Long Term Incentive Plan of the Company (incorporated by reference to Exhibit 99.1 to the Company's Registration Statement on Form S-8 filed December 21, 2009 (File No. 333-163883)) |
| | 10.18† | | Deferred Compensation Plan of the Partnership (incorporated by reference to Exhibit 99.2 to the Company's Registration Statement on Form S-8 filed December 21, 2009 (File No. 333-163883)) |
79
Table of Contents
| | | |
| Exhibit Number | | Description of Document |
|---|
| | 10.19*† | | Annual Incentive Plan of the Company |
| | 10.20† | | Non-Employee Directors Compensation Plan (incorporated by reference to Exhibit 99.2 to the Company's Current Report on Form 8-K filed January 29, 2010 (File No. 001-34579)) |
| | 10.21† | | Non-Employee Directors Deferral Plan (incorporated by reference to Exhibit 99.3 to the Company's Current Report on Form 8-K filed January 29, 2010 (File No. 001-34579)) |
| | 10.22† | | Form of Restricted Stock Unit Award Notification under the Non-Employee Directors Compensation Plan (incorporated by reference to Exhibit 99.4 to the Company's Current Report on Form 8-K filed January 29, 2010 (Filed No. 001-34579)) |
| | 10.23 | | Form of Director Indemnification Agreements (incorporated by reference to Exhibit 10.19 to the Company's Registration Statement on Form S-1/A filed November 27, 2009 (File No. 333-161734)) |
| | 10.24 | | Irrevocable Contract Guarantee, dated May 5, 2008, between the Partnership, ENSCO and the Guarantors named therein (incorporated by reference to Exhibit 10.20 to the Company's Registration Statement on Form S-1/A filed November 27, 2009 (File No. 333-161734)) |
| | 10.25* | | Termination and Release of Irrevocable Contract Guarantee, dated December 9, 2009, between ENSCO and the Guarantors named therein |
| | 21.1* | | List of Subsidiaries |
| | 23.1* | | Consent of Ernst & Young LLP |
| | 31.1* | | Certification of the Chief Executive Officer pursuant to Rule 13a-14(a)/15d-14(a) of the Securities Exchange Act of 1934 |
| | 31.2* | | Certification of the Chief Financial Officer pursuant to Rule 13a-14(a)/15d-14(a) of the Securities Exchange Act of 1934 |
| | 32.1* | | Certification of the Chief Executive Officer pursuant to 18 U.S.C. Section 1350, as adopted pursuant to Section 906 of the Sarbanes-Oxley Act of 2002 |
| | 32.2* | | Certification of the Chief Financial Officer pursuant to 18 U.S.C. Section 1350, as adopted pursuant to Section 906 of the Sarbanes-Oxley Act of 2002 |
- *
- Filed herewith.
- †
- Management contract or compensatory plan or arrangement required to be filed as an exhibit to this Form 10-K pursuant to Item 15(b).
80
Table of Contents
SIGNATURES
Pursuant to the requirements of Section 13 or 15(d) of the Securities Exchange Act of 1934, the Registrant has duly caused this report to be signed on its behalf by the undersigned, thereunto duly authorized.
| | | | |
| | | Cobalt International Energy, Inc. |
|
|
By: |
|
/s/ JOSEPH H. BRYANT
|
| | | Name: | | Joseph H. Bryant |
| | | Title: | | Chairman of the Board of Directors and Chief
Executive Officer |
Dated: March 30, 2010
Pursuant to the requirements of the Securities Exchange Act of 1934, this report has been signed below by the following persons on behalf of the Registrant and in the capacities and on the dates indicated.
| | | | |
Signature | | Title | | Date |
|---|
|
|
|
|
|
/s/ JOSEPH H. BRYANT
Joseph H. Bryant | | Chairman of the Board of Directors
and Chief Executive Officer (Principal
Executive Officer) | | March 30, 2010 |
/s/ RODNEY L. GRAY
Rodney L. Gray |
|
Chief Financial Officer and Executive
Vice President (Principal Financial
Officer and Principal Accounting
Officer) |
|
March 30, 2010 |
/s/ GREGORY A. BEARD
Gregory A. Beard |
|
Director |
|
March 30, 2010 |
/s/ PETER R. CONEWAY
Peter R. Coneway |
|
Director |
|
March 30, 2010 |
/s/ HENRY CORNELL
Henry Cornell |
|
Director |
|
March 30, 2010 |
/s/ JACK E. GOLDEN
Jack E. Golden |
|
Director |
|
March 30, 2010 |
81
Table of Contents
| | | | |
Signature | | Title | | Date |
|---|
|
|
|
|
|
/s/ KENNETH W. MOORE
Kenneth W. Moore | | Director | | March 30, 2010 |
/s/ J. HARDY MURCHISON
J. Hardy Murchison |
|
Director |
|
March 30, 2010 |
/s/ KENNETH A. PONTARELLI
Kenneth A. Pontarelli |
|
Director |
|
March 30, 2010 |
/s/ MYLES W. SCOGGINS
Myles W. Scoggins |
|
Director |
|
March 30, 2010 |
/s/ D. JEFF VAN STEENBERGEN
D. Jeff van Steenbergen |
|
Director |
|
March 30, 2010 |
/s/ MARTIN H. YOUNG, JR.
Martin H. Young, Jr. |
|
Director |
|
March 30, 2010 |
82
Table of Contents
INDEX TO CONSOLIDATED FINANCIAL STATEMENTS
COBALT INTERNATIONAL ENERGY, INC.
(pka COBALT INTERNATIONAL ENERGY, L.P.)
| | | | |
Report of Independent Registered Public Accounting Firm | | | F-2 | |
Consolidated Balance Sheet of Cobalt International Energy, Inc. as of December 31, 2009 and 2008 | | |
F-3 | |
Consolidated Statements of Operations of Cobalt International Energy, Inc. for the years ended December 31, 2009, 2008 and 2007, and for the period November 10, 2005 (Inception) through December 31, 2009 | | |
F-4 | |
Consolidated Statements of Changes in Partners' Capital/Stockholders' Equity of Cobalt International Energy, Inc. for the years ended December 31, 2009, 2008 and 2007, and for the period November 10, 2005 (Inception) through December 31, 2009 | | |
F-5 | |
Consolidated Statements of Cash Flows of Cobalt International Energy, Inc. for the years ended December 31, 2009, 2008 and 2007, and for the period November 10, 2005 (Inception) through December 31, 2009 | | |
F-6 | |
Notes to Consolidated Financial Statements | | |
F-7 | |
F-1
Table of Contents
Report of Independent Registered Public Accounting Firm
The Board of Directors and Stockholders
Cobalt International Energy, Inc.
We have audited the accompanying consolidated balance sheets of Cobalt International Energy, Inc. (previously known as Cobalt International Energy, L.P.) (a development stage enterprise) (the Company), as of December 31, 2009 and 2008, and the related consolidated statements of operations, changes in partners' capital and stockholders' equity, and cash flows for each of the three years in the period ended December 31, 2009, and for the period November 10, 2005 (inception) through December 31, 2009. These financial statements are the responsibility of the Company's management. Our responsibility is to express an opinion on these financial statements based on our audits.
We conducted our audits in accordance with standards of the Public Company Accounting Oversight Board (United States). Those standards require that we plan and perform the audit to obtain reasonable assurance about whether the financial statements are free of material misstatement. We were not engaged to perform an audit of the Company's internal control over financial reporting. Our audit included consideration of internal control over financial reporting as a basis for designing audit procedures that are appropriate in the circumstances, but not for the purpose of expressing an opinion on the effectiveness of the Company's internal control over financial reporting. Accordingly, we express no such opinion. An audit also includes examining, on a test basis, evidence supporting the amounts and disclosures in the financial statements, assessing the accounting principles used and significant estimates made by management, and evaluating the overall financial statement presentation. We believe that our audits provide a reasonable basis for our opinion.
In our opinion, the financial statements referred to above present fairly, in all material respects, the consolidated financial position of Cobalt International Energy, Inc. at December 31, 2009 and 2008 and the consolidated results of its operations and its cash flows for each of the three years in the period ended December 31, 2009 and for the period November 10, 2005 (inception) through December 31, 2009, in conformity with accounting principles generally accepted in the United States.
Houston, Texas
March 30, 2010
F-2
Table of Contents
Cobalt International Energy, Inc.
(pka Cobalt International Energy, L.P.)
(a Development Stage Enterprise)
Consolidated Balance Sheets
| | | | | | | | |
| | December 31, | |
|---|
| | 2009 | | 2008 | |
|---|
| | ($ in thousands, except share
and per share data)
| |
|---|
Assets | | | | | | | |
Current assets: | | | | | | | |
| | Cash and cash equivalents | | $ | 1,093,100 | | $ | 5,103 | |
| | Restricted certificate of deposit | | | 541 | | | 535 | |
| | Joint interest and other receivables | | | 44,753 | | | 536 | |
| | Prepaid expenses and other current assets | | | 6,222 | | | 6,029 | |
| | Inventory | | | 6,691 | | | 11,673 | |
| | Short-term deposit | | | 3,180 | | | — | |
| | | | | | |
Total current assets | | | 1,154,487 | | | 23,876 | |
Property, plant, and equipment: | | | | | | | |
| | Oil and gas properties, successful efforts method of accounting, net of accumulated depletion of $-0- | | | 470,741 | | | 759,773 | |
| | Other property and equipment, net of accumulated depreciation and amortization of $2,033 and $1,411, respectively | | | 871 | | | 955 | |
| | | | | | |
Total property, plant, and equipment, net | | | 471,612 | | | 760,728 | |
| | | | | | |
Long-term restricted cash | | |
186,006 | | |
— | |
| | | | | | |
Total assets | | $ | 1,812,105 | | $ | 784,604 | |
| | | | | | |
Liabilities and Partners' Capital/Stockholders' Equity | | | | | | | |
Current liabilities: | | | | | | | |
| | Trade and other accounts payable | | $ | 34,966 | | $ | 14,024 | |
| | Accrued liabilities | | | 35,557 | | | 29,470 | |
| | Insurance premium note | | | — | | | 639 | |
| | | | | | |
Total current liabilities | | | 70,523 | | | 44,133 | |
Partners' Capital: | | | | | | | |
| | Class A limited partners | | | — | | | 1,029,572 | |
| | Class B limited partners | | | — | | | 4,365 | |
Stockholders' Equity: | | | | | | | |
Common stock, $0.01 par value per share; 2,000,000,000 shares authorized, 340,517,583 issued and outstanding as of December 31, 2009 | | | 3,405 | | | — | |
Additional paid-in capital | | | 2,112,900 | | | — | |
Deficit accumulated during the development stage | | | (374,723 | ) | | (293,466 | ) |
| | | | | | |
Total partners' capital/stockholders' equity | | | 1,741,582 | | | 740,471 | |
| | | | | | |
Total liabilities and partners' capital/stockholders' equity | | $ | 1,812,105 | | $ | 784,604 | |
| | | | | | |
See accompanying notes.
F-3
Table of Contents
Cobalt International Energy, Inc.
(pka Cobalt International Energy, L.P.)
(a Development Stage Enterprise)
Consolidated Statements of Operations
| | | | | | | | | | | | | | |
| |
| |
| |
| | For the Period
November 10,
2005
(Inception)
Through
December 31,
2009 | |
|---|
| | Year Ended December 31 | |
|---|
| | 2009 | | 2008 | | 2007 | |
|---|
| | ($ in thousands except per share data)
| |
|---|
Oil and gas revenue | | $ | — | | $ | — | | $ | — | | $ | — | |
Operating costs and expenses: | | | | | | | | | | | | | |
| | Seismic and exploration | | | 30,666 | | | 41,274 | | | 86,813 | | | 251,571 | |
| | Dry hole expense and impairment | | | 14,486 | | | — | | | — | | | 14,486 | |
| | General and administrative | | | 35,996 | | | 31,271 | | | 23,090 | | | 110,787 | |
| | Depreciation and amortization | | | 622 | | | 683 | | | 435 | | | 2,033 | |
| | | | | | | | | | |
Total operating costs and expenses | | | 81,770 | | | 73,228 | | | 110,338 | | | 378,877 | |
| | | | | | | | | | |
| | Operating income (loss) | | |
(81,770 |
) | |
(73,228 |
) | |
(110,338 |
) | |
(378,877 |
) |
Other income: | | | | | | | | | | | | | |
| | Interest income | | | 513 | | | 1,632 | | | 1,384 | | | 4,154 | |
| | | | | | | | | | |
Total other income | | | 513 | | | 1,632 | | | 1,384 | | | 4,154 | |
| | | | | | | | | | |
Net income (loss) before income tax | | | | | | | | | | | | | |
Income tax expense | | | — | | | — | | | — | | | — | |
| | | | | | | | | | |
Net income (loss) | | $ | (81,257 | ) | $ | (71,596 | ) | $ | (108,954 | ) | $ | (374,723 | ) |
| | | | | | | | | | |
Pro forma basic and diluted income (loss) per share (unaudited) | |
$ |
(0.33 |
) | | | | | | | | | |
| | | | | | | | | | | | | |
See accompanying notes.
F-4
Table of Contents
Cobalt International Energy, Inc.
(pka Cobalt International Energy, L.P.)
(a Development Stage Enterprise)
Consolidated Statements of Changes in Partners' Capital and Stockholders' Equity
| | | | | | | | | | | | | | | | | | | | | | | | | | |
| | General
Partner | | Class A
Limited
Partners | | Class B
Limited
Partners | | Class C
Limited
Partners | | Common
Stock | | Additional
Paid-in
Capital | | Accumulated
Deficit During
Development
Stage | | Total | |
|---|
| | ($ in thousands)
| |
|---|
Balance, November 10, 2005 (inception) | | $ | — | | $ | — | | $ | — | | $ | — | | $ | — | | $ | — | | $ | — | | $ | — | |
| | Class A limited partners' contributions | | | — | | | 3,000 | | | — | | | — | | | — | | | — | | | — | | | 3,000 | |
| | Class B limited partners' equity compensation | | | — | | | — | | | 142 | | | — | | | — | | | — | | | — | | | 142 | |
| | Net income (loss) | | | — | | | — | | | — | | | — | | | — | | | — | | | (1,389 | ) | | (1,389 | ) |
| | | | | | | | | | | | | | | | | | |
Balance, December 31, 2005 | | | — | | | 3,000 | | | 142 | | | — | | | — | | | — | | | (1,389 | ) | | 1,753 | |
| | Class A limited partners' contributions | | | — | | | 154,984 | | | — | | | — | | | — | | | — | | | — | | | 154,984 | |
| | Class B limited partners' equity compensation | | | — | | | — | | | 1,350 | | | — | | | — | | | — | | | — | | | 1,350 | |
| | Net income (loss) | | | — | | | — | | | — | | | — | | | — | | | — | | | (111,527 | ) | | (111,527 | ) |
| | | | | | | | | | | | | | | | | | |
Balance, December 31, 2006 | | | — | | | 157,984 | | | 1,492 | | | — | | | — | | | — | | | (112,916 | ) | | 46,560 | |
| | Class A limited partners' contributions | | | — | | | 305,135 | | | — | | | — | | | — | | | — | | | — | | | 305,135 | |
| | Class B limited partners' equity compensation | | | — | | | — | | | 1,132 | | | — | | | — | | | — | | | — | | | 1,132 | |
| | Net income (loss) | | | — | | | — | | | — | | | — | | | — | | | — | | | (108,954 | ) | | (108,954 | ) |
| | | | | | | | | | | | | | | | | | |
Balance, December 31, 2007 | | | — | | | 463,119 | | | 2,624 | | | — | | | — | | | — | | | (221,870 | ) | | 243,873 | |
| | Class A limited partners' contributions | | | — | | | 566,453 | | | — | | | — | | | — | | | — | | | — | | | 566,453 | |
| | Class B limited partners' equity compensation | | | — | | | — | | | 1,741 | | | — | | | — | | | — | | | — | | | 1,741 | |
| | Net income (loss) | | | — | | | — | | | — | | | — | | | — | | | — | | | (71,596 | ) | | (71,596 | ) |
| | | | | | | | | | | | | | | | | | |
Balance, December 31, 2008 | | | — | | | 1,029,572 | | | 4,365 | | | — | | | — | | | — | | | (293,466 | ) | | 740,471 | |
| | Class A limited partners' contributions | | | — | | | 227,166 | | | — | | | — | | | — | | | — | | | — | | | 227,166 | |
| | Class B and C limited partners' equity compensation | | | — | | | — | | | 2,619 | | | 734 | | | — | | | — | | | — | | | 3,353 | |
| | Common stock issued upon corporate reorganization | | | — | | | (1,256,738 | ) | | (6,984 | ) | | (734 | ) | | 2,743 | | | 1,261,713 | | | — | | | — | |
| | Equity based compensation | | | — | | | — | | | — | | | — | | | — | | | 2,402 | | | — | | | 2,402 | |
| | Common stock issued at initial public offering, net of offering costs | | | — | | | — | | | — | | | — | | | 630 | | | 806,629 | | | — | | | 807,259 | |
| | Common stock issued at private placement | | | — | | | — | | | — | | | — | | | 32 | | | 42,156 | | | — | | | 42,188 | |
| | Net income (loss) | | | — | | | — | | | — | | | — | | | — | | | — | | | (81,257 | ) | | (81,257 | ) |
| | | | | | | | | | | | | | | | | | |
Balance, December 31, 2009 | | $ | — | | $ | — | | $ | — | | $ | — | | $ | 3,405 | | $ | 2,112,900 | | $ | (374,723 | ) | $ | 1,741,582 | |
| | | | | | | | | | | | | | | | | | |
See accompanying notes.
F-5
Table of Contents
Cobalt International Energy, Inc.
(pka Cobalt International Energy, L.P.)
(a Development Stage Enterprise)
Consolidated Statements of Cash Flows
| | | | | | | | | | | | | | | |
| |
| |
| |
| | For the Period
November 10,
2005
(Inception)
Through
December 31,
2009 | |
|---|
| | Year Ended December 31 | |
|---|
| | 2009 | | 2008 | | 2007 | |
|---|
| | ($ In thousands)
| |
|---|
Cash flows provided from operating activities | | | | | | | | | | | | | |
Net income (loss) | | $ | (81,257 | ) | $ | (71,596 | ) | $ | (108,954 | ) | | (374,723 | ) |
Adjustments to reconcile net loss to net cash used in operating activities: | | | | | | | | | | | | | |
| | Depreciation and amortization | | | 622 | | | 683 | | | 435 | | | 2,033 | |
| | Dry hole expense and impairment of unproved properties | | | 14,486 | | | — | | | — | | | 14,486 | |
| | Expiration of lease bonus | | | 250 | | | — | | | — | | | 250 | |
| | Equity based compensation | | | 5,755 | | | 1,741 | | | 1,132 | | | 10,120 | |
| | Other | | | 253 | | | — | | | — | | | 558 | |
| | Changes in operating assets and liabilities: | | | | | | | | | | | | | |
| | | Joint interest and other receivables | | | (38,967 | ) | | 591 | | | (1,115 | ) | | (39,503 | ) |
| | | Inventory | | | 4,981 | | | (11,673 | ) | | — | | | (6,691 | ) |
| | | Prepaid expense and other assets | | | (193 | ) | | (4,165 | ) | | (901 | ) | | (6,222 | ) |
| | | Trade and other accounts payable | | | 16,314 | | | 5,190 | | | (4,663 | ) | | 30,338 | |
| | | Accrued liabilities | | | 6,089 | | | (2,935 | ) | | (1,984 | ) | | 35,558 | |
| | | | | | | | | | |
Net cash used in operating activities | | | (71,667 | ) | | (82,164 | ) | | (116,050 | ) | | (333,796 | ) |
| | | | | | | | | | |
Cash flows from investing activities | | | | | | | | | | | | | |
Capital expenditures for oil and gas properties | | | (14,250 | ) | | (568,860 | ) | | (69,834 | ) | | (702,360 | ) |
Capital expenditures for other property and equipment | | | (537 | ) | | (788 | ) | | (518 | ) | | (2,904 | ) |
Exploratory wells drilling in process | | | (45,424 | ) | | (41,207 | ) | | — | | | (117,086 | ) |
Proceeds from sale of oil and gas properties | | | 333,346 | | | 1,995 | | | — | | | 333,346 | |
Increase in restricted cash | | | (186,012 | ) | | (16 | ) | | (313 | ) | | (186,547 | ) |
Short term deposit | | | (3,180 | ) | | 33,105 | | | (33,105 | ) | | (3,180 | ) |
| | | | | | | | | | |
Net cash provided by (used in) investing activities | | | 83,943 | | | (575,771 | ) | | (103,770 | ) | | (678,731 | ) |
| | | | | | | | | | |
Cash flows from financing activities | | | | | | | | | | | | | |
Capital contributions prior to IPO—Class A limited partners | | | 226,913 | | | 566,453 | | | 305,135 | | | 1,256,180 | |
Insurance premium note | | | (639 | ) | | 639 | | | — | | | — | |
Proceeds from initial public offering, net of costs | | | 807,259 | | | — | | | — | | | 807,259 | |
Proceeds from private placement, net of costs | | | 42,188 | | | — | | | — | | | 42,188 | |
| | | | | | | | | | |
Net cash provided by financing activities | | | 1,075,721 | | | 567,092 | | | 305,135 | | | 2,105,627 | |
| | | | | | | | | | |
Net increase (decrease) in cash and cash equivalents | | |
1,087,997 | | |
(90,843 |
) | |
85,315 | | |
1,093,100 | |
Cash and cash equivalents, beginning of period | | | 5,103 | | | 95,946 | | | 10,631 | | | — | |
| | | | | | | | | | |
Cash and cash equivalents, end of period | | $ | 1,093,100 | | $ | 5,103 | | $ | 95,946 | | $ | 1,093,100 | |
| | | | | | | | | | |
See accompanying notes.
F-6
Table of Contents
Cobalt International Energy, Inc.
(pka Cobalt International Energy, L.P.)
(a Development Stage Enterprise)
Notes to Consolidated Financial Statements
December 31, 2009 and 2008
1. Organization and Operations
Organization
Cobalt International Energy, Inc. (the "Company") was incorporated pursuant to the laws of the State of Delaware in August, 2009 to become a holding company for Cobalt International Energy, L.P. (the "Partnership"). The Partnership is a Delaware limited partnership formed on November 10, 2005, by funds affiliated with Goldman, Sachs & Co., Riverstone Holdings LLC and The Carlyle Group as well as members of the Partnership's management team, collectively constituting Class A limited partners. In 2006, funds affiliated with KERN Partners Ltd. and certain limited partners in such funds affiliated with KERN Partners Ltd, were admitted as a Class A limited partner. In 2007, First Reserve and Four Winds Consulting were admitted as Class A limited partners.
A corporate reorganization occurred concurrently with the completion of the initial public offering ("IPO") on December 15, 2009. All the outstanding interests of the Partnership, whether vested or nonvested, were exchanged for 283,200,000 shares of the Company's common stock and as a result the Partnership became wholly-owned by the Company. The shares of CIP GP Corp., the general partner of the Partnership were contributed by certain of the Class A limited partners holding such shares to the Company for no consideration. Prior to reorganization, the Company was not subject to federal or state income taxes. Upon completion of the corporate reorganization, the Company became subject to federal and state income taxes.
On December 21, 2009 the Company closed its IPO with the issuance of 63,000,000 shares of common stock from the public offering and 3,125,000 of shares issued in a private placement at a price of $13.50 per share. The proceeds received of approximately $900 million will be used to fund the offering expenses and the Company's drilling and exploration program through 2011.
Operations
The Company is an independent, oil-focused exploration and production company with a current focus in the deepwater U.S. Gulf of Mexico and offshore Angola and Gabon in West Africa. The terms "Company," "Cobalt," "we," "us," "our," "ours," and similar terms refer to Cobalt International Energy, Inc. unless the context indicates otherwise.
As of December 31, 2009, the Company had no proved oil and gas reserves.
2. Summary of Significant Accounting Policies
Basis of Presentation
The accompanying consolidated financial statements include the financial statements of Cobalt International Energy, Inc. and all of its wholly owned subsidiaries. All significant intercompany transactions and amounts have been eliminated for all years presented. Because we are a development stage enterprise, we have presented our financial statements in accordance with FASB Accounting Standards Codification (ASC) No. 915"Development Stage Entities" (SFAS No. 7).
At December 31, 2009, the accompanying consolidated financial statements include the accounts of Cobalt and its wholly-owned subsidiary, Cobalt International Energy, L.P. ("Partnership"). Prior to the effective date of the corporate reorganization, both entities were under common control arising from common direct or indirect ownership of each. The transfer of the Partnership interests to Cobalt
F-7
Table of Contents
Cobalt International Energy, Inc.
(pka Cobalt International Energy, L.P.)
(a Development Stage Enterprise)
Notes to Consolidated Financial Statements (Continued)
December 31, 2009 and 2008
2. Summary of Significant Accounting Policies (Continued)
represented a reorganization of entities under common control and was accounted for at historical cost.See Note 1. Prior to the reorganization, the Partnership were not subject to federal and state corporate income taxes
Reclassifications
Certain reclassifications have been made to prior periods' financial statements to conform to the current presentation.
Use of Estimates
The preparation of financial statements in conformity with United States generally accepted accounting principles ("GAAP") requires us to make estimates and assumptions that affect the reported amounts of assets and liabilities and disclosure of contingent assets and liabilities at the date of the financial statements and the reported amounts of revenues and expenses during the reporting period. Significant estimates we make include (a) accruals related to expenses, (b) assumptions used in estimating fair value of equity based awards and (c) assumptions used in impairment testing. Although we believe these estimates are reasonable, actual results could differ from these estimates.
Revenue Recognition
The Company will follow the "sales" (or cash) method of accounting for oil and gas revenues. Under this method, the Company will recognize revenues on the volumes sold. The volumes sold may be more or less than the volumes to which the Company is entitled based on its ownership interest in the property. These differences result in a condition known in the industry as a production imbalance. For the years ended December 31, 2009 and 2008, no revenues have been recognized in these consolidated financial statements.
Cash and Cash Equivalents
Cash and cash equivalents consist of all demand deposits and funds invested in highly liquid instruments with original maturities of three months or less and typically exceed federally insured limits. We periodically assess the financial condition of the institutions where these funds are held and believe that the credit risk is minimal. The Company maintains a restricted certificate of deposit amounts as of the balance sheet date related to payment guarantees of corporate employee credit cards with American Express Financial Services. As of December 31, 2009 and 2008, the balances in the certificate of deposit were $0.5 million.
Joint Interest and Other Receivables
Joint interest and other receivables result primarily from billing shared costs under the respective operating agreements to our partners in the leases. As of December 31, 2009, the balance due from our joint interest partners in the U.S. Gulf of Mexico and West Africa was $44.8 million and represents amounts due for operated exploration wells and seismic expenditures. These are usually settled within 30 days of the invoice date.
F-8
Table of Contents
Cobalt International Energy, Inc.
(pka Cobalt International Energy, L.P.)
(a Development Stage Enterprise)
Notes to Consolidated Financial Statements (Continued)
December 31, 2009 and 2008
2. Summary of Significant Accounting Policies (Continued)
Property, Plant, and Equipment
The Company uses the "successful efforts" method of accounting for its oil and gas properties. Under the successful efforts method of accounting, proved leasehold costs are capitalized and amortized over the proved developed and undeveloped reserves on a units-of-production basis. Successful drilling costs and developmental dry holes are capitalized and amortized over the proved developed reserves on a units-of-production basis. Unproved leasehold costs are capitalized and are not amortized, pending an evaluation of their exploration potential. Unproved leasehold costs are assessed periodically to determine if an impairment of the cost of individual properties has occurred. Factors taken into account for impairment analysis include results of the technical studies conducted, lease terms and management's future exploration plans. The cost of impairment is charged to expense in the period in which it occurs. Costs incurred for exploratory dry holes, geological and geophysical work (including the cost of seismic data), and delay rentals are charged to expense as incurred. Costs of other property and equipment are depreciated on a straight-line based on their respective useful lives.
Asset Retirement Obligations
We currently do not have any oil and natural gas production. Should such production occur in the future, we expect to have significant obligations under our lease agreements and federal regulation to remove our equipment and restore land or seabed at the end of oil and natural gas production operations. These asset retirement obligations ("ARO") are primarily associated with plugging and abandoning wells and removing and disposing of offshore oil and natural gas platforms. Estimating the future restoration and removal cost is difficult and requires us to make estimates and judgments because most of the removal obligations are many years in the future and contracts and regulation often have vague descriptions of what constitutes, removal. Asset removal technologies and cost are constantly changing, as are regulatory, political, environmental, safety and public relations considerations. Pursuant to the FASB ASC No. 410-20, "Assets Retirement Obligations" (SFAS No. 143), we are required to record a separate liability for the estimated fair value of our asset retirement obligations, with an offsetting increase to the related oil and natural gas properties representing asset retirement costs on our balance sheet. The cost of the related oil and natural gas asset, including the asset retirement cost, is depreciated over the useful life of the asset. The estimated fair value of asset retirement obligation is measured by reference to the expected future cash outflows required to satisfy the retirement obligation discounted at the Company's credit-adjusted risk-free interest rate. Accretion expense is recognized over time as the discounted liability is accreted to its expected settlement value.
Inherent to the present value calculation are numerous estimates, assumptions and judgments, including the ultimate settlement amounts, inflation factors, credit adjusted risk-free rates, timing of settlement and changes in the legal, regulatory, environmental and political environments. To the extent future revisions to these assumptions impact the present value of the abandonment liability, we will make corresponding adjustments to both the asset retirement obligation and the related our oil and natural gas property asset balance. Increases in the discounted abandonment liability and related oil and natural gas assets resulting from the passage of time will be reflected as additional accretion and depreciation expense in the consolidated statements of operations.
F-9
Table of Contents
Cobalt International Energy, Inc.
(pka Cobalt International Energy, L.P.)
(a Development Stage Enterprise)
Notes to Consolidated Financial Statements (Continued)
December 31, 2009 and 2008
2. Summary of Significant Accounting Policies (Continued)
Inventory
Inventories consist of various tubular products that are used in the Company's drilling programs. The products are stated at the lower of cost or market. Cost is determined on weighted average method and comprises of purchase price and other directly attributable costs.
Income and Other Taxes
Prior to December 15, 2009, no provision for U.S. federal income taxes related to our operations was included in the accompanying financial statements. As a partnership, we were not subject to federal or state income tax, and the tax effect of our activities accrued to the partners. The Partnership had obligations associated with providing certain tax-related information to the partners and registrations and filings with applicable governmental taxing authorities.
Effective December 15, 2009, the Company applied the liability method of accounting for income taxes in accordance with FASB ASC No. 740,Income Taxes (SFAS No. 109) as clarified by FASB Interpretation No. 48,Accounting for Uncertainty in Income Taxes-an Interpretation of FASB Statement No. 109, Accounting for Income Taxes. Under this method, deferred tax assets and liabilities are determined by applying tax rates in effect at the end of a reporting period to the cumulative temporary differences between the tax bases of assets and liabilities and their reported amounts in the financial statements. Since the Company is in development stage and there can be no assurance that the Company will generate any earnings or any specific level of earnings in future years, the Company has established a valuation allowance equal to its net deferred tax assets.
Equity-Based Compensation
We award share-based compensation to management and employees in the form of restricted common shares. Compensation expense on these restricted common shares is measured by the fair value of the award at the date of grant. Compensation expense is recognized in general and administrative expense over the requisite service period of each award.See Note 13.
Pro Forma Income (Loss) Per Share
Pro forma basic income (loss) per share was calculated by dividing pro forma net income or loss applicable to common shares by the pro-forma weighted average number of common shares outstanding during the year ended December 31, 2009.See Note 16. Pro forma net income or loss applicable to common shares reflects net income (loss) as reported and gives effect to (1) an adjustment for income taxes as if the Company was subject to taxation for the entire year and (2) an adjustment to remove management fees paid to our former private equity owners that terminated at the time of the IPO. The calculation of pro forma diluted income (loss) per share should include the potential dilutive impact of nonvested restricted shares outstanding during the year, unless their effect is anti-dilutive. Pro forma nonvested restricted stock awards of 8,015,041 for the year ended December 31, 2009 were excluded from the pro forma diluted earnings (loss) per share because they were anti-dilutive.
F-10
Table of Contents
Cobalt International Energy, Inc.
(pka Cobalt International Energy, L.P.)
(a Development Stage Enterprise)
Notes to Consolidated Financial Statements (Continued)
December 31, 2009 and 2008
2. Summary of Significant Accounting Policies (Continued)
Pro Forma Weighted Average Shares Outstanding
The pro forma weighted average shares outstanding used in the computation of pro forma basic and diluted income (loss) per share has been computed taking into account (1) the conversion ratio at the time of the IPO of all partnerships units into shares of common stock as if the conversion occurred as of the beginning of the year and (2) the 66,125,000 shares issued by the Company in the IPO, which included 3,125,000 shares sold by the Company in a concurrent private offering pursuant to Regulation S.
Operating Costs and Expenses
Expenses consist primarily of the costs of acquiring and processing of geological and geophysical data, consultants, telecommunications, payroll and benefit costs, information system and legal costs, office rent, contract costs, and bookkeeping and audit fees.
3. Recently Issued Accounting Guidance
In January 2010, the FASB issued certain amendments to theExtractive Activities—Oil and Gas Topic of the Accounting Standards Codification (the "Codification") that updated and aligned the FASB's reserve estimation and disclosure requirements for oil and natural gas companies with the reserve estimation and disclosure requirements that were adopted by the Securities and Exchange Commission ("SEC") in December 2008. The FASB's amendments and the SEC's new requirements became effective for annual reporting periods ending on or after December 31, 2009. Collectively, the new rules permit the use of new technologies in the determination of proved reserves if those technologies have been demonstrated empirically to lead to reliable conclusions about reserve volumes. Other definitions and terms were revised, including the definition ofproved reserves which was changed to indicate, among other things, that commencing with year-end 2009 entities must use unweighted average of first-day-of-the-month commodity prices over the preceding 12-month period, rather than end-of-period commodity prices, when estimating quantities of proved reserves. Similarly, the prices used to calculate the aggregate amount of (and changes in) future cash inflows related to the standardized measure of discounted future cash flows have been changed from end-of-period commodity prices to the 12-month average commodity prices used in calculating proved reserves. Beginning in the fourth quarter of 2009, the estimated future net revenues used to calculate the ceiling test are based on the 12-month average commodity price for each product. Additionally, entities must separately disclose information about reserve quantities and certain financial statement amounts for geographic areas that represent 15 percent or more of proved reserves, and equity-method investments should be included in determining whether an entity has significant oil and gas producing activities. Another significant provision of the new rules is a general requirement that, subject to limited exceptions, proved undeveloped reserves may only be classified as such if a development plan has been adopted indicating that they are scheduled to be drilled within five years. As of December 31, 2009, Cobalt did not have any proved reserves and has complied with the revised disclosure requirements in our financial statement for the years ending December 31, 2009 as applicable.See Note 21.
F-11
Table of Contents
Cobalt International Energy, Inc.
(pka Cobalt International Energy, L.P.)
(a Development Stage Enterprise)
Notes to Consolidated Financial Statements (Continued)
December 31, 2009 and 2008
4. Fair Value of Financial Instruments
The Company's financial instruments consist of cash and cash equivalents, employee and other receivables, trade and other payables. The carrying amounts of these items approximate fair value due to their short-term nature and the terms of these instruments.
5. Prepaid Expenses
Prepaid expenses includes the prepaid and unamortized portion of payments made for software licenses, related maintenance fees, and insurance of $2.1 million, $3.0 million and $1.8 million for the years ended December 31, 2009, 2008 and 2007, respectively. The expenses are being amortized over their service life.
6. Short-Term Deposit
As of December 31, 2009, short term deposit of $3.2 million represents the Company's portion of a security deposit made in conjunction with a sub-assignment of a drilling contract in relation to the Transocean DD-I drilling rig.
7. Long-Term Restricted Cash
On December 15, 2009, an escrow account was set up as a guarantee of performance to ENSCO for the ENSCO 8503 rig contract and the balance for this account as of December 31, 2009 was $186.0 million.
8. Related Parties
The Limited Partnership Agreement (the "LPA") governing Cobalt International Energy, L.P. was entered into on November 10, 2005 and amended and restated as of December 23, 2005, September 30, 2006, October 10, 2006, August 30, 2007, December 10, 2007, December 12, 2008 and February 6, 2009. The LPA provided for funds affiliated with First Reserve Corporation, Goldman, Sachs & Co., Riverstone Holdings LLC, The Carlyle Group and KERN Partners Ltd, and certain limited partners in such funds affiliated with KERN Partners Ltd. (or their respective affiliates) an annual monitoring fee. The monitoring fee was allocated pro rata in accordance with each fund's Class A commitment amount and the number of days each applicable fund was a Class A limited partner. The Partnership recorded $2.6 million, $1.1 million, $1.1 million and $6.0 million of monitoring fees for the years ended December 31, 2009, 2008 and 2007, and for the period November 10, 2005 (Inception) through December 31, 2009, respectively. These amounts are included in general and administrative expense in the accompanying consolidated statements of operations. Additionally, we reimbursed certain Class A limited partners for legal, travel and administrative expenses during the years ended December 31, 2009, 2008 and 2007, and for the period November 10, 2005 (Inception) through December 31, 2009 of approximately $0.3 million, $0.6 million, $0.3 million and $1.7 million, respectively. Pursuant to the terms of the corporate reorganization which occurred on December 15, 2009, the rights to receive monitoring fees and reimbursement of expenses by the Class A limited partners were terminated.
F-12
Table of Contents
Cobalt International Energy, Inc.
(pka Cobalt International Energy, L.P.)
(a Development Stage Enterprise)
Notes to Consolidated Financial Statements (Continued)
December 31, 2009 and 2008
9. Business Relationships
On April 6, 2009, we entered into a 10-year alliance with TOTAL in which, through a series of transactions, we combined our respective deepwater U.S. Gulf of Mexico exploratory lease inventory (which excludes the Heidelberg portion of our Ligurian/Heidelberg prospect, our Shenandoah prospect, and all developed or producing properties held by TOTAL in the U.S. Gulf of Mexico) through the exchange of a 40% interest in our leases for a 60% interest in TOTAL's leases, resulting in a current combined alliance portfolio of 215 leases. We will act as operator on behalf of the alliance through the exploration and appraisal phases of development. Upon completion of appraisal operations, operatorship shall be determined by TOTAL and Cobalt, with the greatest importance being placed on majority (or largest) working interest ownership and the respective experience of each party in developments which have required the design, construction and ownership of a permanently anchored host facility to collect and transport oil or natural gas from such development. As part of the alliance, TOTAL committed, among other things to (i) provide a 5th generation deepwater rig to drill a mandatory five-well program on existing Cobalt-operated blocks, (ii) pay up to $300 million to carry a substantial share of costs first allocable to Cobalt based on its 60% ownership interest in the combined alliance properties with respect to the five-well program and certain other exploration and development activities (above the amounts TOTAL has agreed to pay as owner of a 40% interest), (iii) pay an initial amount of approximately $280 million primarily as reimbursement of our share of historical costs in our contributed properties and consideration under purchase and sale agreements, (iv) pay 40% of the general and administrative costs relating to our operations in the U.S. Gulf of Mexico during the 10-year alliance term, and (v) based on the success of the alliance's five-well program (primarily defined as discoveries of petroleum accumulations of at least 100 feet of net pay thickness for Miocene objectives and 250 feet of net pay thickness for Lower Tertiary objectives), pay up to $180 million to carry a substantial share of costs first allocable to Cobalt based on its 60% ownership interest in combined alliance properties with respect to additional wells and certain other exploration and development activities outside of the five-well program, in all cases subject to certain conditions and limitations. The Partnership accounted for the initial $280 million reimbursement from TOTAL as a reduction in the basis held in its U.S. Gulf of Mexico undeveloped leasehold properties. No gain or loss was recognized on the transaction. Any additional carry owed to us based on the success of the alliance's five-well program will increase the commitment by TOTAL to pay a disproportionate share of the cost of additional wells drilled and certain other exploration and development activities incurred outside of the five-well program. This will result in a reduction in Cobalt's net share of costs in any such wells or activities.
Additionally, as part of the alliance, we formed a U.S. Gulf of Mexico-wide area of mutual interest with TOTAL (which excludes the Heidelberg portion of our Ligurian/Heidelberg prospect, our Shenandoah prospect, and all developed or producing properties held by TOTAL in the U.S. Gulf of Mexico), whereby each party has the right to participate in any oil and natural gas lease interest acquired by the other party within this area. The cost to the Partnership and/or TOTAL to participate in an interest acquired by the other party within the area of mutual interest is the proportionate share of both the monetary value attributed to the acquired interest as well as the out-of-pocket costs and expenses of such acquisition.
F-13
Table of Contents
Cobalt International Energy, Inc.
(pka Cobalt International Energy, L.P.)
(a Development Stage Enterprise)
Notes to Consolidated Financial Statements (Continued)
December 31, 2009 and 2008
9. Business Relationships (Continued)
As part of the long-term alliance with TOTAL entered into on April 6, 2009, TOTAL assigned the Transocean DD-I rig to the Partnership for a 270-day term beginning July 7, 2009. The Partnership is obligated to fund approximately $110 million of this obligation and 85% of this amount is recoverable from our U.S. Gulf of Mexico partners.
On May 15, 2008 the Partnership signed a participation agreement with Sonangol (which we subsequently announced on April 22, 2009) whereby they were assigned a 25% non-operated interest of our pre-TOTAL alliance interest in 11 of our deepwater U.S. Gulf of Mexico oil and natural gas exploration leases for $50.1 million and reimbursement of $10.0 million for our exploration and seismic costs related to those leases. The price Sonangol paid us for this interest was based on the price we paid for such leases in the 2007 and 2008 MMS Gulf of Mexico Lease Sales. This transaction resulted in no gain or loss to Cobalt. The Partnership received $60.1 million as consideration from Sonangol in April 2009.
10. Property, Plant, and Equipment
Property, plant, and equipment is stated at cost less accumulated depreciation/amortization and consisted of the following:
| | | | | | | | | | |
| |
| | December 31 | |
|---|
| | Estimated
Useful Life
(Years) | |
|---|
| | 2009 | | 2008 | |
|---|
| |
| | ($ in thousands)
| |
|---|
Unproved oil and gas properties | | | | | $ | 363,515 | | $ | 688,111 | |
Exploratory wells in process | | | | | | 107,226 | | | 71,662 | |
Computer equipment and software | | | 3 | | | 1,300 | | | 918 | |
Office equipment and furniture | | | 3 | | | 995 | | | 909 | |
Leasehold improvements | | | 3 | | | 609 | | | 539 | |
| | | | | | | | | |
| | | | | | 473,645 | | | 762,139 | |
Less: accumulated depreciation and amortization | | | | | | (2,033 | ) | | (1,411 | ) |
| | | | | | | | | |
Property, plant, and equipment, net | | | | | $ | 471,612 | | $ | 760,728 | |
| | | | | | | | | |
The Company recorded $0.6 million, $0.7 million, $0.4 million and $2.0 million of depreciation and amortization expense for the years ended December 31, 2009, 2008 and 2007, and for the period November 10, 2005 (inception) through December 31, 2009, respectively.
The Company evaluates impairment of its oil and gas properties on a field-by-field basis whenever events or changes in circumstances indicate an asset's carrying amount may not be recoverable. All our existing ownership interests in unproved oil and gas leases in the U.S. Gulf of Mexico and offshore Angola and Gabon are in high potential hydrocarbon regions. The recoverability of the carrying amount of these properties is dependent upon the pending determination of commercial viability of
F-14
Table of Contents
Cobalt International Energy, Inc.
(pka Cobalt International Energy, L.P.)
(a Development Stage Enterprise)
Notes to Consolidated Financial Statements (Continued)
December 31, 2009 and 2008
10. Property, Plant, and Equipment (Continued)
proved reserves discovered from our seismic, drilling and exploration programs. For the years ended December 31, 2009, 2008, 2007 and for the period November 10, 2005 (inception) through December 31, 2009, the Company recorded no provision for impairments on its unproved leasehold properties.
Capitalized Exploratory Well Costs
If an exploratory well provides evidence as to the existence of sufficient quantities of hydrocarbons to justify potential completion as a producing well, drilling costs associated with the well are initially capitalized, or suspended, pending a determination as to whether a commercially sufficient quantity of proved reserves can be attributed to the area as a result of drilling. This determination may take longer than one year in certain areas (generally, deepwater and international locations) depending upon, among other things, 1) the amount of hydrocarbons discovered, 2) the outcome of planned geological and engineering studies, 3) the need for additional appraisal drilling activities to determine whether the discovery is sufficient to support an economic development plan and 4) the requirement for government sanctioning in international location before proceeding with development activities.
During 2008 the Company participated in the drilling of the Shenandoah #1 exploration well and the Heidelberg #1 exploratory well, both of which were announced as discoveries in early 2009. As of December 31, 2009 the cost of both wells remained capitalized as the Company continues its technical assessment of the commerciality of both discoveries. On October 28, 2009 the Company announced it had temporarily suspended operations on the Ligurian #1 exploratory well and on February 7, 2010 the Company suspended operations on the Criollo #1 exploratory well. Although both wells encountered oil bearing sands further technical evaluation is required to determine the commerciality of these prospects and portions of both wells were determined to have no future value. As a result the Company has recorded an impairment charge to dry hole expense for the year ended December 31, 2009 of $10.5 million for the impaired portion of the Ligurian #1 exploratory well and $4.0 million for the impaired portion of the Criollo #1 exploratory well representing cost incurred during 2009.
F-15
Table of Contents
Cobalt International Energy, Inc.
(pka Cobalt International Energy, L.P.)
(a Development Stage Enterprise)
Notes to Consolidated Financial Statements (Continued)
December 31, 2009 and 2008
10. Property, Plant, and Equipment (Continued)
The following table reflects the Company's net changes in and the cumulative costs of capitalized exploratory well costs (excluding any related leasehold costs):
| | | | | | | | |
| | Year Ended December 31, | |
|---|
| | 2009 | | 2008(1) | |
|---|
| | ($ in thousands)
| |
|---|
Gulf of Mexico: | | | | | | | |
Beginning of year | | $ | 71,662 | | $ | — | |
Addition to capitalized exploratory well cost pending determination of proved reserves | | | | | | | |
| | Shenandoah #1 Exploratory Well | | | 9,935 | | | 59,410 | |
| | Heidelberg #1 Exploratory Well | | | 8,256 | | | 12,252 | |
| | Ligurian #1 Exploratory Well | | | 18,589 | | | — | |
| | Criollo #1 Exploratory Well | | | 13,268 | | | — | |
| | Other | | | 2 | | | — | |
Reclassifications to wells, facilities, and equipment based on determination of proved reserves | | | — | | | — | |
Amounts charged to expense | | | (14,486 | ) | | | |
| | | | | | |
End of year | | $ | 107,226 | | $ | 71,662 | |
| | | | | | |
- (1)
- There were no drilling activities prior to 2008.
| | | | | | | | | | | |
| |
| | December 31, | |
|---|
| | Spud
Year | |
|---|
| | 2009 | | 2008 | |
|---|
| |
| | ($ in thousands)
| |
|---|
Cumulative costs: | | | | | | | | | | |
| | Shenandoah #1 Exploratory Well | | | 2008 | | $ | 69,345 | | $ | 59,410 | |
| | Heidelberg #1 Exploratory Well | | | 2008 | | | 20,508 | | | 12,252 | |
| | Ligurian #1 Exploratory Well | | | 2009 | | | 8,093 | | | — | |
| | Criollo #1 Exploratory Well | | | 2009 | | | 9,278 | | | — | |
| | Other | | | 2009 | | | 2 | | | — | |
| | | | | | | | | |
| | | | | $ | 107,226 | | $ | 71,662 | |
| | | | | | | | | |
As of December 31, 2009, no exploratory wells have been drilled by the Company in offshore Angola or Gabon.
11. Partners' Capital
Prior to December 15, 2009 and pursuant to the Fourth Amended and Restated Agreement of Limited Partnership of Cobalt International Energy, L.P., dated February 6, 2009 (the "LPA"), and the Reorganization Agreement dated December 2, 2009 between all the partners, the Partnership consisted
F-16
Table of Contents
Cobalt International Energy, Inc.
(pka Cobalt International Energy, L.P.)
(a Development Stage Enterprise)
Notes to Consolidated Financial Statements (Continued)
December 31, 2009 and 2008
11. Partners' Capital (Continued)
of four classes of investors (Class A limited partners, Class B limited partners, Class C limited partners and Class D limited partners) and a general partner ("GP"), CIP GP Corp. (which held no ownership interest). The Class A limited partners had certain approval rights consistent with the business and structure of the Partnership and provided cash capital contributions to the Partnership through a "Class A Commitment Amount" as defined in the LPA. At the corporate reorganization all the outstanding interests of the Partnership were exchanged for 283,200,000 shares of the Company's common stock and as a result the Partnership became wholly-owned by the Company. The general partner of the Partnership, CIP GP Corp, was contributed by certain of the Class A limited partners to the Company for no consideration.
12. Stockholders' Equity
Upon closing of the IPO on December 15, 2009, the Company became authorized to issue 2,000,000,000 shares of common stock, $0.01 par value per share, and 200,000,000 shares of preferred stock, $0.01 par value per share. As a result of the corporate reorganization, all the outstanding partnership interests in Cobalt LP were exchanged for 283,200,000 shares of the Company's common stock, of which 274,392,583 were issued and outstanding as of December 15, 2009 and 8,015,041 were in the form of nonvested restricted shares.
On December 21, 2009, the Company issued 63,000,000 shares of its common stock through the IPO and 3,125,000 shares through a private placement at a price of $13.50 per share.
13. Equity-based Compensation
Prior to the corporate reorganization which occurred December 15, 2009, the Company was organized as a partnership and governed by a limited partnership agreement (LPA). The LPA provided for the grant of Class B, C, and D partnership units to the management and employees of the Company which were subsequently converted into restricted stock as part of the corporate reorganization.
Due to the similarity of this program to a stock award, the Company accounted for this plan in accordance with FASB ASC No. 718,Compensation—Stock Compensation (SFAS 123R), which establishes accounting and reporting standards for stock based compensation plans. We are required to recognize compensation expense over the remaining requisite service period, in an amount equal to the fair value of unit-based payments granted to management and employees. The fair value of the partnership units granted from November 10, 2005 (inception) through December 31, 2008 was determined using the income approach based on the expected probability of success in the discovery of proved reserves in the oil and gas properties owned or anticipated to be owned by the Partnership. The expected value was then discounted to present value using a discount rate based on similar companies in our stage of development and adjusted for specific partnership risks and investors' expectations. The fair value of the partnership units granted after December 31, 2008 but before the IPO date was valued at an assumed fair market value using the anticipated IPO value. For units granted at the corporate reorganization the fair value was calculated at the IPO price of $13.50 per share.
F-17
Table of Contents
Cobalt International Energy, Inc.
(pka Cobalt International Energy, L.P.)
(a Development Stage Enterprise)
Notes to Consolidated Financial Statements (Continued)
December 31, 2009 and 2008
13. Equity-based Compensation (Continued)
The following table summarizes the information about the partnership units awarded on an equivalent share and per share price basis:
| | | | | | | | | | | | | | | | | | | |
| | Years Ended December 31, | |
|---|
| | 2009 | | 2008 | | 2007 | |
|---|
| | Restricted
Shares | | Weighted
Average
Grant
Date
Price per
share | | Restricted
Shares | | Weighted
Average
Grant
Date
Price per
share | | Restricted
Shares | | Weighted
Average
Grant
Date
Price per
share | |
|---|
Non-vested units at beginning of year | | | 9,113,772 | | $ | 0.32 | | | 14,191,916 | | $ | 0.26 | | | 17,102,387 | | $ | 0.17 | |
Granted pre-reorganization | | | 1,043,507 | | | 20.86 | | | 454,742 | | | 1.28 | | | 8,896,608 | | | 0.31 | |
Granted post-reorganization | | | 3,705,425 | | | 13.50 | | | — | | | — | | | — | | | — | |
Vested | | | (5,356,756 | ) | | 0.25 | | | (5,167,822 | ) | | 0.23 | | | (2,846,379 | ) | | 0.17 | |
Forfeited or expired | | | (490,907 | ) | | 0.31 | | | (365,064 | ) | | 0.31 | | | (8,960,700 | ) | | 0.17 | |
| | | | | | | | | | | | | | | | | |
Non-vested units at end of year | | | 8,015,041 | | | 8.50 | | | 9,113,772 | | | 0.32 | | | 14,191,916 | | | 0.26 | |
| | | | | | | | | | | | | | | | | |
Unrecognized compensation | | $ | 60,133,313 | | | | | $ | 2,200,876 | | | | | $ | 2,756,028 | | | | |
| | | | | | | | | | | | | | | | | |
The Company recognizes compensation expense over the requisite service period using the straight-line method in the consolidated statement of operations. For the years ended December 31, 2009, 2008 and 2007, and for the period November 10, 2005 (Inception) through December 31, 2009, the Company recorded equity-based compensation of $3.9 million, $1.7 million, $1.1 million and $8.3 million, respectively. As of December 31, 2009, the non-vested restricted shares awarded under this plan are expected to be recognized over a weighted-average period ranging from 1.5 to 4.9 years.
14. Employee Benefit Plan
In 2006, the Company established the Cobalt International Energy, L.P., defined contribution 401(k) plan (the Plan). All employees of the Company after three months of continuous employment are eligible to participate in the Plan. The plan is discretionary and provides a 6% employee contribution match as determined by the Company's Board of Directors. For the years ended December 31, 2009, 2008 and 2007, and for the period November 10, 2005 (inception) through December 31, 2009, the Company recorded $0, $0.5 million, $0.3 million and $0.9 million, respectively, in benefits contributions to the Plan, which are included in the general and administration expenses. Effective January 1, 2010, the Plan was amended to discontinue the employer's matching contributions.
15. Income Taxes
Prior to corporate reorganization, the Company was not subject to federal or state income taxes. Upon completion of the corporate reorganization, the Company became subject to federal and state income taxes. At the time of the corporate reorganization, the Company recorded a net deferred tax asset of $28.9 million with a corresponding full valuation allowance of $28.9 million for book/tax differences contributed to the corporation by the underlying partners.
F-18
Table of Contents
Cobalt International Energy, Inc.
(pka Cobalt International Energy, L.P.)
(a Development Stage Enterprise)
Notes to Consolidated Financial Statements (Continued)
December 31, 2009 and 2008
15. Income Taxes (Continued)
The components of the income tax provision (benefit) since the corporate reorganization are as follows:
| | | | |
| | Period From
December 15-31,2009 | |
|---|
Current | | $ | — | |
Deferred | | | — | |
| | | | |
Total | | $ | — | |
| | | | |
The reconciliation of income taxes computed at the US federal statutory tax rate to our income tax expense (benefit) for the period from December 15, 2009 through December 31, 2009 is as follows (in thousands):
| | | | |
Net income (loss) as reported for the year ended December 31, 2009 | | $ | (81,257 | ) |
Less: net income (loss) applicable to period before corporate reorganization | | | (46,645 | ) |
| | | | |
Net income (loss) applicable to period after corporate reorganization | | $ | (34,612 | ) |
| | | | |
| | | | | | | |
Income tax expense (benefit) at the federal statutory rate | | $ | (12,114 | ) | | 35.00 | % |
State income taxes | | | — | | | — | |
Deferred income taxes established at date of corporate reorganization | | | (28,867 | ) | | 83.40 | % |
Other | | | 86 | | | 0.25 | % |
Valuation allowance | | | 40,895 | | | 118.15 | % |
| | | | | | |
| | $ | — | | | — | |
| | | | | | |
Deferred income taxes reflect the net tax effects of temporary differences between the carrying amounts of assets and liabilities for financial reporting purposes and the amounts used for income tax
F-19
Table of Contents
Cobalt International Energy, Inc.
(pka Cobalt International Energy, L.P.)
(a Development Stage Enterprise)
Notes to Consolidated Financial Statements (Continued)
December 31, 2009 and 2008
15. Income Taxes (Continued)
purposes. Significant components of our deferred tax assets and liabilities were as follows ($ in thousands):
| | | | | | | |
| | As of
December 31, 2009 | |
|---|
| | Deferred tax liabilities: | | | | |
| | | Oil and gas properties | | $ | 8,374 | |
| | | Other | | | 884 | |
| | | | |
| | | | Total deferred liabilities | | | 9,258 | |
| | | | |
| | Deferred tax assets: | | | | |
| | | Seismic and exploration costs | | $ | 29,592 | |
| | | Tax credits and NOL carry forwards | | | 9,074 | |
| | | Other | | | 11,487 | |
| | | Valuation allowance | | | (40,895 | ) |
| | | | |
| | | | Total deferred tax assets | | | 9,258 | |
| | | | |
Net deferred taxes | | $ | — | |
| | | | |
We have established a full valuation allowance against the deferred tax assets where the Company has determined that it is more likely than not that all of the deferred tax assets will not be realized. Because of the full valuation allowance, no income tax expense or benefit is reflected on the consolidated statement of operations for the period December 15, 2009 through December 31, 2009.
The NOL carryforward of approximately $25,897,000 as of December 31, 2009 begins to expire in 2025. The utilization of the NOL carryforwards may be limited under IRS Section 382 ownership changes.
We adopted the provisions under FASB ASC No. 740,Income Taxes, for FASB Interpretation No. 48,Accounting for Uncertainty in Income Taxes-an interpretation of SFAS No.109, ("FIN 48"); effective December 15, 2009. There were no unrecognized tax benefits nor any accrued interest or penalties associated with unrecognized tax benefits as of the date of the adoption of FIN 48 and through December 31, 2009. The adoption of FIN 48 did not have an effect on our consolidated financial statements based on our current income tax positions.
F-20
Table of Contents
Cobalt International Energy, Inc.
(pka Cobalt International Energy, L.P.)
(a Development Stage Enterprise)
Notes to Consolidated Financial Statements (Continued)
December 31, 2009 and 2008
16. Pro Forma Income (Loss) Per Share (unaudited)
The following table presents the calculation of pro forma basic and diluted income (loss) per share for the year ended December 31, 2009 as discussed further in our summary of significant accounting policies in Note 2 ($ in thousands, except share and per share data):
| | | | |
Net income (loss) as reported | | $ | (81,257 | ) |
Pro forma income tax expense | | | — | |
Pro forma management fees | | | 2,872 | |
| | | | |
Pro forma net income (loss) allocable to common shareholders | | $ | (78,385 | ) |
| | | | |
Pro forma basic and diluted income (loss) per share | |
$ |
(0.33 |
) |
| | | | |
Pro forma weighted average common shares outstanding used in pro forma basic and diluted net income (loss) per common share | | |
236,751,219 | |
| | | | |
17. Contractual Obligations and Commitments
As part of the long-term alliance with TOTAL entered into on April 6, 2009, TOTAL assigned the Transocean DD-I rig to the Partnership for a 270-day term beginning July 7, 2009. The Partnership is obligated to fund approximately $110 million of this obligation and 85% of this amount is recoverable from our U.S. Gulf of Mexico partners. The DD-I rig was released on February 7, 2010 after drilling of the Criollo exploration well and all contractual obligations terminated.
On May 5, 2008, the Partnership entered into a two-year drilling contract with a subsidiary of ENSCO International Incorporated ("ENSCO"), which may be extended to up to four years at the Partnership's option, for the use of an ENSCO 8503 deepwater 5th generation semi-submersible drilling rig in our exploration and development efforts in the U.S. Gulf of Mexico. The partnership expects to take delivery of the ENSCO 8503 drilling rig, which is currently under construction, in the fourth quarter of 2010. The Partnership's aggregate financial commitment for the initial two-year term of this drilling contract is approximately $372 million. We anticipate a substantial portion of this cost will be shared with our U.S. Gulf Mexico partners.
The Partnership has been successful in leasing the exploration rights from the MMS for further exploration in the western and central U.S. Gulf of Mexico. The leases require annual payments in the form of delay rentals as follows ($ in thousands):
| | | | |
| | Year Ended
December 31, | |
|---|
2010 | | $ | 5,847 | |
2011 | | | 5,784 | |
2012 | | | 5,685 | |
2013 | | | 4,897 | |
2014 | | | 4,789 | |
2015+ | | | 10,403 | |
F-21
Table of Contents
Cobalt International Energy, Inc.
(pka Cobalt International Energy, L.P.)
(a Development Stage Enterprise)
Notes to Consolidated Financial Statements (Continued)
December 31, 2009 and 2008
17. Contractual Obligations and Commitments (Continued)
The Partnership recorded $6.4 million, $5.4 million, $2.7 million and $16.0 million in rent expense for the years ended December 31, 2009, 2008 and 2007, and for the period November 10, 2005 (Inception) through December 31, 2009, respectively.
18. Contingencies
We may become a party to various pending or threatened claims and complaints seeking damages or other remedies concerning our commercial operations and other matters in the ordinary course of our business. Although we can give no assurance about the outcome of any potential future legal and administrative proceedings and the effect such an outcome may have on us, management believes that any ultimate liability resulting from the outcome of such proceedings, to the extent not otherwise provided for or covered by insurance, will not have a material adverse effect on our consolidated financial position, results of operations or liquidity.
19. Subsequent Events
On January 7, 2010 the Company closed the sale of an additional 7,978,000 shares of its common stock at the public offering price of $13.50 per share pursuant to the over-allotment option exercised by the underwriters of its recently completed IPO. The exercise of the over-allotment option brings the total proceeds from the IPO to approximately $1.0 billion and the total number of shares sold by the Company to 74,103,000.
On February 24, 2010, we entered into Risk Service Agreements ("RSA") for Blocks 9 and 21 offshore Angola with the national oil company of Angola, Sonangol E.P. and Sonangol P&P. The RSA govern Cobalt's 40% interest in and operatorship of Blocks 9 and 21 offshore Angola and form the basis of Cobalt's exploration, development and production operations on these blocks. Their execution is a key milestone that allows for the commencement of Cobalt's offshore Angola drilling program, currently planned to begin within the next twelve months.
On March 8, 2010, we entered into a rig assignment agreement with Anadarko Petroleum Company providing for the assignment to Cobalt of the Ocean Monarch Drilling Rig to drill the North Platte #1 exploratory well. Cobalt is committed to use the rig for a minimum of 75 days at a day rate of $440,000.
F-22
Table of Contents
Cobalt International Energy, Inc.
(pka Cobalt International Energy, L.P.)
(a Development Stage Enterprise)
Notes to Consolidated Financial Statements (Continued)
December 31, 2009 and 2008
20. Supplemental Cash Flow Information
The following reflects our supplemental cash flow information (in thousands):
| | | | | | | | | | | | | |
| |
| |
| |
| | For the Period
November 10,
2005
(Inception)
through
December 31,
2009 | |
|---|
| | Years Ended December 31, | |
|---|
| | 2009 | | 2008 | | 2007 | |
|---|
Noncash additions to property, plant, and equipment relating to current liabilities and accounts payable | | $ | 4,628 | | $ | 30,455 | | $ | 1,264 | | $ | 4,628 | |
Amount due from Cobalt's partner in Angola for recovery of leasehold bonuses included in joint interest receivable | | $ | 5,250 | | | — | | | — | | $ | 5,250 | |
21. Selected Quarterly Financial Data—Unaudited
Unaudited quarterly financial data for the years ended December 31, 2009 and 2008 are as follows:
| | | | | | | | | | | | | | |
| | 1st Quarter | | 2nd Quarter | | 3rd Quarter | | 4th Quarter | |
|---|
| | ($ in thousands except per share data)
| |
|---|
Year ended December 31, 2009 | | | | | | | | | | | | | |
| | Operating costs and expenses | | $ | 11,630 | | $ | 2,339 | | $ | 15,116 | | $ | 52,685 | |
| | Operating income (loss) | | | (11,630 | ) | | (2,339 | ) | | (15,116 | ) | | (52,685 | ) |
| | Net income (loss) | | | (11,633 | ) | | (2,061 | ) | | (14,986 | ) | | (52,577 | ) |
| | Pro forma basic and diluted income (loss) per share(1) | | $ | (0.05 | ) | $ | (0.01 | ) | $ | (0.06 | ) | $ | (0.21 | ) |
| | | | | | | | | | |
Year ended December 31, 2008 | | | | | | | | | | | | | |
| | Operating costs and expenses | | $ | 7,643 | | $ | 26,478 | | $ | 17,430 | | $ | 21,677 | |
| | Operating income (loss) | | | (7,643 | ) | | (26,478 | ) | | (17,430 | ) | | (21,677 | ) |
| | Net income (loss) | | | (6,715 | ) | | (25,969 | ) | | (17,249 | ) | | (21,663 | ) |
- (1)
- Pro forma basic income (loss) per share was calculated by dividing pro forma net income or loss applicable to common shares by the pro-forma weighted average number of common shares outstanding during the applicable period. Pro forma net income (loss) applicable to common shares reflects net income (loss) as reported and gives effect to (1) an adjustment for income taxes as if the Company was subject to taxation for the entire year and (2) an adjustment to remove management fees paid to our former private equity owners that terminated at the time of the IPO.
22. Supplemental Information on Oil and Gas Exploration and Production Activities (Unaudited)
The supplementary oil and gas data that follows is presented in accordance with SFAS No. 69, "Disclosures about Oil and Gas Producing Activities and includes (1) capitalized costs, costs incurred and results of operations related to oil and gas producing activities, (2) net proved oil and gas reserves producing activities, (3) net proved oil and gas reserves, and (4) a standardized measure of discounted
F-23
Table of Contents
Cobalt International Energy, Inc.
(pka Cobalt International Energy, L.P.)
(a Development Stage Enterprise)
Notes to Consolidated Financial Statements (Continued)
December 31, 2009 and 2008
22. Supplemental Information on Oil and Gas Exploration and Production Activities (Unaudited) (Continued)
future net cash flows relating to proved oil and gas reserves. Since the Company did not have any proved reserves as of December 31, 2009 and 2008, there will be no disclosures on (2), (3) and (4) above.
Capitalized Costs Related to Oil and Gas Activities
| | | | | | | | | | | |
| | U.S. Gulf of
Mexico | | West Africa | | Total | |
|---|
| | ($ in thousands)
| |
|---|
As of December 31, 2009 | | | | | | | | | | |
| | Unproved properties(1) | | $ | 449,996 | | $ | 20,745 | | $ | 470,741 | |
| | Proved properties | | | — | | | — | | | — | |
| | | | | | | | |
| | | 449,996 | | | 20,745 | | | 470,741 | |
Accumulated depreciation, depletion and amortization | | | — | | | — | | | — | |
| | | | | | | | |
Net capitalized costs | | $ | 449,996 | | $ | 20,745 | | $ | 470,741 | |
| | | | | | | | |
As of December 31, 2008 | | | | | | | | | | |
| | Unproved properties | | $ | 733,778 | | $ | 25,995 | | $ | 759,773 | |
| | Proved properties | | | — | | | — | | | — | |
| | | | | | | | |
| | | 733,778 | | | 25,995 | | | 759,773 | |
Accumulated depreciation, depletion and amortization | | | — | | | — | | | — | |
| | | | | | | | |
Net capitalized costs | | $ | 733,778 | | $ | 25,995 | | $ | 759,773 | |
| | | | | | | | |
- (1)
- Capitalized costs are net of proceeds from the sale of unproved leasehold interests transactions that occurred in 2009 of approximately $333.3 million for U.S. Gulf of Mexico and $5.3 million in West Africa.
F-24
Table of Contents
Cobalt International Energy, Inc.
(pka Cobalt International Energy, L.P.)
(a Development Stage Enterprise)
Notes to Consolidated Financial Statements (Continued)
December 31, 2009 and 2008
22. Supplemental Information on Oil and Gas Exploration and Production Activities (Unaudited) (Continued)
Costs Incurred in Oil and Gas Activities
The following table reflects total costs incurred, both capitalized and expensed, for oil and gas property acquisition, exploration and development activities.
| | | | | | | | | | | |
| | U.S. Gulf of
Mexico | | West Africa | | Total | |
|---|
| | ($ in thousands)
| |
|---|
Year ended December 31, 2009 | | | | | | | | | | |
Property acquisition | | | | | | | | | | |
| | Unproved | | $ | 14,250 | | $ | — | | $ | 14,250 | |
| | Proved | | | — | | | — | | | — | |
Exploration | | | 23,280 | | | 21,873 | | | 45,153 | |
Development | | | — | | | — | | | — | |
| | | | | | | | |
Total Costs Incurred | | $ | 37,530 | | $ | 21,873 | | $ | 59,403 | |
| | | | | | | | |
Year ended December 31, 2008 | | | | | | | | | | |
Property acquisition | | | | | | | | | | |
| | Unproved | | $ | 636,532 | | $ | 1,995 | | $ | 638,527 | |
| | Proved | | | — | | | — | | | — | |
Exploration | | | 23,499 | | | 17,775 | | | 41,274 | |
Development | | | — | | | — | | | — | |
| | | | | | | | |
Total Costs Incurred | | $ | 660,031 | | $ | 19,770 | | $ | 679,801 | |
| | | | | | | | |
The following table reflects the total acreage of the Company's existing oil and gas properties:
| | | | | | | | | | | | | |
| | Thousands of Acres | |
|---|
| | Developed | | Undeveloped | |
|---|
| | Gross | | Net | | Gross | | Net | |
|---|
Acreage at December 31, 2009 | | | | | | | | | | | | | |
U.S. Gulf of Mexico | | | — | | | — | | | 1,293 | | | 639 | |
West Africa | | | — | | | — | | | — | | | — | |
| | | | | | | | | | |
Total | | | — | | | | | | 1,293 | | | 639 | |
| | | | | | | | | | |
Acreage at December 31, 2008 | | | | | | | | | | | | | |
U.S. Gulf of Mexico | | | — | | | — | | | 817 | | | 565 | |
West Africa | | | — | | | — | | | — | | | — | |
| | | | | | | | | | |
Total | | | — | | | — | | | 817 | | | 565 | |
| | | | | | | | | | |
F-25
Table of Contents
Exhibit Index
| | | |
| Exhibit Number | | Description of Document |
|---|
| | 3.1* | | Certificate of Incorporation of the Company |
| | 3.2 | | By-laws of the Company (incorporated by reference to Exhibit 3 to the Company's Registration Statement on Form 8-A filed December 11, 2009 (File No. 001-34579)) |
| | 4.1 | | Specimen stock certificate (incorporated by reference to Exhibit 4.1 to the Company's Registration Statement on Form S-1/A filed November 27, 2009 (File No. 333-161734)) |
| | 4.2* | | Reorganization Agreement, dated December 8, 2009, among the Company, the Partnership, Cobalt Mergersub, Inc. and the other parties signatory thereto |
| | 10.1† | | Employment Agreement, dated November 12, 2009, among the Company, the Partnership and Joseph H. Bryant (incorporated by reference to Exhibit 10.1 to the Company's Registration Statement on Form S-1/A filed November 27, 2009 (File No. 333-161734)) |
| | 10.2† | | Severance Agreement, dated October 23, 2009, among the Company, the Partnership and Samuel H. Gillespie (incorporated by reference to Exhibit 10.2 to the Company's Registration Statement on Form S-1/A filed November 27, 2009 (File No. 333-161734)) |
| | 10.3† | | Employment Agreement, dated October 23, 2009, among the Company, the Partnership and Rodney L. Gray (incorporated by reference to Exhibit 10.3 to the Company's Registration Statement on Form S-1/A filed November 27, 2009 (File No. 333-161734)) |
| | 10.4† | | Employment Agreement, dated October 23, 2009, among the Company, the Partnership and James H. Painter (incorporated by reference to Exhibit 10.4 to the Company's Registration Statement on Form S-1/A filed November 27, 2009 (File No. 333-161734)) |
| | 10.5† | | Employment Agreement, dated October 23, 2009, among the Company, the Partnership and James W. Farnsworth (incorporated by reference to Exhibit 10.5 to the Company's Registration Statement on Form S-1/A filed November 27, 2009 (File No. 333-161734)) |
| | 10.6† | | Severance Agreement, dated October 23, 2009, among the Company, the Partnership and John P. Wilkirson (incorporated by reference to Exhibit 10.6 to the Company's Registration Statement on Form S-1/A filed November 27, 2009 (File No. 333-161734)) |
| | 10.7* | | Risk Services Agreement relating to Block 9, between CIE Angola Block 9 Ltd., Sonangol, Sonangol Pesquisa e Produção, S.A., Nazaki Oil and Gás and Alper Oil, Lda |
| | 10.8* | | Risk Services Agreement relating to Block 21, between CIE Angola Block 21 Ltd., Sonangol, Sonangol Pesquisa e Produção, S.A., Nazaki Oil and Gás and Alper Oil, Lda |
| | 10.9 | | Exploration and Production Sharing Contract, dated December 13, 2006, between the Republic of Gabon and Total Gabon, S.A. (incorporated by reference to Exhibit 10.5 to the Company's Registration Statement on Form S-1/A filed October 29, 2009 (File No. 333-161734)) |
| | 10.10 | | Assignment Agreement, dated November 29, 2007, between CIE Gabon Diaba Ltd. and Total Gabon, S.A. (incorporated by reference to Exhibit 10.6 to the Company's Registration Statement on Form S-1/A filed October 29, 2009 (File No. 333-161734)) |
| | 10.11 | | Simultaneous Exchange Agreement, dated April 6, 2009, between the Partnership and TOTAL E&P USA, INC. (incorporated by reference to Exhibit 10.7 to the Company's Registration Statement on Form S-1/A filed October 9, 2009 (File No. 333-161734)) |
| | 10.12 | | Gulf of Mexico Program Management and AMI Agreement, dated April 6, 2009, between the Partnership and TOTAL E&P USA, INC. (incorporated by reference to Exhibit 10.8 to the Company's Registration Statement on Form S-1/A filed October 9, 2009 (File No. 333-161734)) |
Table of Contents
| | | |
| Exhibit Number | | Description of Document |
|---|
| | 10.13 | | Offshore Daywork Drilling Contract, dated May 3, 2008, between the Partnership and ENSCO Offshore Company ("ENSCO") (incorporated by reference to Exhibit 10.9 to the Company's Registration Statement on Form S-1/A filed October 29, 2009 (File No. 333-161734)) |
| | 10.14† | | Form of Restricted Stock Award Agreements relating to the Class B interests (incorporated by reference to Exhibit 10.10 to the Company's Registration Statement on Form S-1/A filed October 29, 2009 (File No. 333-161734)) |
| | 10.15† | | Form of Restricted Stock Award Agreements relating to the Class C interests (incorporated by reference to Exhibit 10.11 to the Company's Registration Statement on Form S-1/A filed October 29, 2009 (File No. 333-161734)) |
| | 10.16† | | Form of Restricted Stock Award Agreements relating to the Class D interests (incorporated by reference to Exhibit 10.12 to the Company's Registration Statement on Form S-1/A filed October 29, 2009 (File No. 333-161734)) |
| | 10.17† | | Long Term Incentive Plan of the Company (incorporated by reference to Exhibit 99.1 to the Company's Registration Statement on Form S-8 filed December 21, 2009 (File No. 333-163883)) |
| | 10.18† | | Deferred Compensation Plan of the Partnership (incorporated by reference to Exhibit 99.2 to the Company's Registration Statement on Form S-8 filed December 21, 2009 (File No. 333-163883)) |
| | 10.19*† | | Annual Incentive Plan of the Company |
| | 10.20† | | Non-Employee Directors Compensation Plan (incorporated by reference to Exhibit 99.2 to the Company's Current Report on Form 8-K filed January 29, 2010 (File No. 001-34579)) |
| | 10.21† | | Non-Employee Directors Deferral Plan (incorporated by reference to Exhibit 99.3 to the Company's Current Report on Form 8-K filed January 29, 2010 (File No. 001-34579)) |
| | 10.22† | | Form of Restricted Stock Unit Award Notification under the Non-Employee Directors Compensation Plan (incorporated by reference to Exhibit 99.4 to the Company's Current Report on Form 8-K filed January 29, 2010 (Filed No. 001-34579)) |
| | 10.23 | | Form of Director Indemnification Agreements (incorporated by reference to Exhibit 10.19 to the Company's Registration Statement on Form S-1/A filed November 27, 2009 (File No. 333-161734)) |
| | 10.24 | | Irrevocable Contract Guarantee, dated May 5, 2008, between the Partnership, ENSCO and the Guarantors named therein (incorporated by reference to Exhibit 10.20 to the Company's Registration Statement on Form S-1/A filed November 27, 2009 (File No. 333-161734)) |
| | 10.25* | | Termination and Release of Irrevocable Contract Guarantee, dated December 9, 2009, between ENSCO and the Guarantors named therein |
| | 21.1* | | List of Subsidiaries |
| | 23.1* | | Consent of Ernst & Young LLP |
| | 31.1* | | Certification of the Chief Executive Officer pursuant to Rule 13a-14(a)/15d-14(a) of the Securities Exchange Act of 1934 |
| | 31.2* | | Certification of the Chief Financial Officer pursuant to Rule 13a-14(a)/15d-14(a) of the Securities Exchange Act of 1934 |
| | 32.1* | | Certification of the Chief Executive Officer pursuant to 18 U.S.C. Section 1350, as adopted pursuant to Section 906 of the Sarbanes-Oxley Act of 2002 |
| | 32.2* | | Certification of the Chief Financial Officer pursuant to 18 U.S.C. Section 1350, as adopted pursuant to Section 906 of the Sarbanes-Oxley Act of 2002 |
- *
- Filed herewith.
- †
- Management contract or compensatory plan or arrangement required to be filed as an exhibit to this Form 10-K pursuant to Item 15(b).