Use these links to rapidly review the document
TABLE OF CONTENTS
PART IV
INDEX TO CONSOLIDATED FINANCIAL STATEMENTS COBALT INTERNATIONAL ENERGY, INC
Table of Contents
UNITED STATES
SECURITIES AND EXCHANGE COMMISSION
Washington, D.C. 20549
Form 10-K
| | |
| (Mark One) | | |
ý |
|
ANNUAL REPORT PURSUANT TO SECTION 13 OR 15(d) OF THE SECURITIES EXCHANGE ACT OF 1934 |
For the fiscal year ended December 31, 2013 |
OR |
o |
|
TRANSITION REPORT PURSUANT TO SECTION 13 OR 15(d) OF THE SECURITIES EXCHANGE ACT OF 1934 |
For the transition period from to |
Commission File Number 001-34579
Cobalt International Energy, Inc.
(Exact name of registrant as specified in its charter)
| | |
Delaware
(State or other jurisdiction of
incorporation or organization) | | 27-0821169
(I.R.S. Employer
Identification No.) |
Cobalt Center
920 Memorial City Way, Suite 100
Houston, Texas 77024
(Address of principal executive offices, including zip code)
(713) 579-9100
(Registrant's telephone number, including area code)
Securities registered pursuant to Section 12(b) of the Securities Act:
| | |
| Title of Each Class | | Name of Each Exchange on Which Registered |
|---|
| Common stock, $0.01 par value | | The New York Stock Exchange |
Securities registered pursuant to Section 12(g) of the Securities Act:None
Indicate by check mark if the registrant is a well-known seasoned issuer, as defined in Rule 405 of the Securities Act. Yes ý No o
Indicate by check mark if the registrant is not required to file reports pursuant to Section 13 or Section 15(d) of the Securities Act. Yes o No ý
Indicate by check mark whether the registrant (1) has filed all reports required to be filed by Section 13 or 15(d) of the Securities Exchange Act of 1934 during the preceding 12 months (or for such shorter period that the registrant was required to file such reports), and (2) has been subject to such filing requirements for the past 90 days. Yes ý No o
Indicate by check mark whether the registrant has submitted electronically and posted on its corporate Web site, if any, every Interactive Data File required to be submitted and posted pursuant to Rule 405 of Regulation S-T (§ 232.405 of this chapter) during the preceding 12 months (or for such shorter period that the registrant was required to submit and post such files). Yes ý No o
Indicate by check mark if disclosure of delinquent filers pursuant to Item 405 of Regulation S-K (§ 229.405 of this chapter) is not contained herein, and will not be contained, to the best of registrant's knowledge, in definitive proxy or information statements incorporated by reference in Part III of this Form 10-K or any amendment to this Form 10-K. ý
Indicate by check mark whether the registrant is a large accelerated filer, an accelerated filer, a non-accelerated filer, or a smaller reporting company. See the definitions of "large accelerated filer," "accelerated filer," and "smaller reporting company" in Rule 12b-2 of the Exchange Act. (Check one):
| | | | | | |
| Large accelerated filerý | | Accelerated filero | | Non-accelerated filero
(Do not check if a
smaller reporting company) | | Smaller reporting companyo |
Indicate by check mark whether the registrant is a shell company (as defined in Rule 12b-2 of the Securities Act). Yes o No ý
As of June 30, 2013, the last business day of the registrant's most recently completed second fiscal quarter, the aggregate market value of the registrant's common stock held by non-affiliates was approximately $7.5 billion.
As of December 31, 2013, the registrant had 411,284,727 shares of common stock outstanding.
DOCUMENTS INCORPORATED BY REFERENCE
Portions of the registrant's proxy statement relating to the 2014 Annual Meeting of Shareholders, to be filed within 120 days of the end of the fiscal year covered by this report, are incorporated by reference into Part III of this Annual Report on Form 10-K.
Table of Contents
Cobalt International Energy, Inc.
| | | | | | |
Item
No. | |
| | Page
No. | |
|---|
| | PART I | | | | |
1 | | Business | | | 3 | |
1A | | Risk Factors | | | 40 | |
1B | | Unresolved Staff Comments | | | 64 | |
2 | | Properties | | | 64 | |
3 | | Legal Proceedings | | | 64 | |
4 | | Mine Safety Disclosures | | | 64 | |
| | PART II | | | | |
5 | | Market for the Registrant's Common Equity, Related Stockholder Matters and Issuer Purchases of Equity Securities | | | 64 | |
6 | | Selected Financial Data | | | 66 | |
7 | | Management's Discussion and Analysis of Financial Condition and Results of Operations | | | 70 | |
7A | | Quantitative and Qualitative Disclosures About Market Risk | | | 83 | |
8 | | Financial Statements and Supplementary Data | | | 84 | |
9 | | Changes in and Disagreements with Accountants on Accounting and Financial Disclosure | | | 84 | |
9A | | Controls and Procedures | | | 84 | |
9B | | Other Information | | | 85 | |
| | PART III | | | | |
10 | | Directors, Executive Officers and Corporate Governance | | | 85 | |
11 | | Executive Compensation | | | 85 | |
12 | | Security Ownership of Certain Beneficial Owners and Management and Related Stockholder Matters | | | 85 | |
13 | | Certain Relationships and Related Transactions, and Director Independence | | | 85 | |
14 | | Principal Accountant Fees and Services | | | 85 | |
| | Glossary of Selected Oil and Gas Terms | | | 86 | |
| | PART IV | | | | |
15 | | Exhibits and Financial Statement Schedules | | | 90 | |
| | Signatures | | | 95 | |
Table of Contents
PART I
Cautionary Note Regarding Forward-Looking Statements
This Annual Report on Form 10-K contains estimates and forward-looking statements, principally in "Business," "Risk Factors" and "Management's Discussion and Analysis of Financial Condition and Results of Operations." Our estimates and forward-looking statements are mainly based on our current expectations and estimates of future events and trends, which affect or may affect our businesses and operations. Although we believe that these estimates and forward-looking statements are based upon reasonable assumptions, they are subject to several risks and uncertainties and are made in light of information currently available to us. Many important factors, in addition to the factors described in this Annual Report on Form 10-K, may adversely affect our results as indicated in forward-looking statements. You should read this Annual Report on Form 10-K and the documents that we have filed as exhibits hereto completely and with the understanding that our actual future results may be materially different from what we expect.
Our estimates and forward-looking statements may be influenced by the following factors, among others:
- •
- our ability to successfully and efficiently execute our project appraisal, development and exploration activities;
- •
- our liquidity and ability to finance our exploration, appraisal, development, and acquisition activities;
- •
- lack or delay of partner, government and regulatory approvals related to our operations;
- •
- projected and targeted capital expenditures and other costs and commitments;
- •
- uncertainties inherent in making estimates of our oil and natural gas data;
- •
- our dependence on our key management personnel and our ability to attract and retain qualified personnel;
- •
- current and future government regulation of the oil and gas industry and our operations;
- •
- changes in environmental laws or the implementation or interpretation of those laws;
- •
- our and our partners' ability to obtain permits and licenses and drill and develop our prospects and discoveries in the U.S. Gulf of Mexico and offshore West Africa;
- •
- termination of or intervention in concessions, licenses, permits, rights or authorizations granted by the United States, Angolan and Gabonese governments to us;
- •
- competition;
- •
- the volatility of oil and gas prices;
- •
- our ability to find, acquire or gain access to new prospects and renew our exploration portfolio;
- •
- the availability, cost and reliability of drilling rigs, containment resources, production equipment and facilities, supplies, personnel and oilfield services;
- •
- the ability of the containment resources we have under contract to perform as designed or contain or cap any oil spill, blow-out or uncontrolled flow of hydrocarbons;
- •
- the availability and cost of developing appropriate infrastructure around and transportation to our prospects, discoveries and appraisal and development projects;
- •
- military operations, civil unrest, piracy, terrorist acts, wars or embargoes;
2
Table of Contents
- •
- our vulnerability to severe weather events, especially tropical storms and hurricanes in the U.S. Gulf of Mexico;
- •
- the cost and availability of adequate insurance coverage;
- •
- our ability to meet our obligations under the agreements governing our indebtedness; and
- •
- other risk factors discussed in the "Risk Factors" section of this Annual Report on Form 10-K.
The words "believe," "may," "will," "aim," "estimate," "continue," "anticipate," "intend," "expect," "plan" and similar words are intended to identify estimates and forward-looking statements. Estimates and forward-looking statements speak only as of the date they were made, and, except to the extent required by law, we undertake no obligation to update or to review any estimate and/or forward-looking statement because of new information, future events or other factors. Estimates and forward-looking statements involve risks and uncertainties and are not guarantees of future performance. As a result of the risks and uncertainties described above, the estimates and forward-looking statements discussed in this Annual Report on Form 10-K might not occur and our future results and our performance may differ materially from those expressed in these forward-looking statements due to, including, but not limited to, the factors mentioned above. Because of these uncertainties, you should not place undue reliance on these forward-looking statements.
Item 1. Business
OVERVIEW
We are an independent exploration and production company with operations in the deepwater U.S. Gulf of Mexico and offshore Angola and Gabon in West Africa. Since our founding in 2005, our oil-focused, below-salt exploration efforts have been successful in each of our operating areas, resulting in nine discoveries out of the fourteen exploration prospects drilled. These nine discoveries consist of North Platte, Heidelberg and Shenandoah in the U.S. Gulf of Mexico; Cameia, Lontra, Mavinga, Bicuar and Orca offshore Angola; and Diaman offshore Gabon.
With these discoveries, our primary focus areas are:
- 1.
- Project Appraisal and Development—to progress our discoveries, which are currently in various stages of appraisal and development, toward project sanction and into proved reserves, production, and cash flow;
- 2.
- Continued Exploration—to simultaneously maintain a robust exploration program on our current acreage; and
- 3.
- New Ventures—to seek the renewal of our worldwide exploration portfolio in locations applicable to our deepwater and below-salt exploration strength.
Each of these focus areas is discussed below by geographic region, followed by background information regarding the geology, plans for appraisal and development, licenses and leaseholds, drilling rigs and drilling results applicable to our geographic regions.
Project Appraisal and Development
U.S. Gulf of Mexico
We and our partners are moving forward on three appraisal and development projects in the U.S. Gulf of Mexico as described below:
Heidelberg Project. Our Heidelberg project was formally sanctioned in mid-2013, and Anadarko Petroleum Corporation ("Anadarko"), as operator, currently estimates first production from Heidelberg in 2016. On February 2, 2009, we announced that the Heidelberg #1 exploration well had encountered
3
Table of Contents
more than 200 feet of net pay thickness in Miocene horizons. Located in approximately 5,200 feet of water in Green Canyon Block 859 within the Miocene trend, this well was drilled to approximately 30,000 feet. An appraisal well was spud on the Heidelberg field in late 2011 in Green Canyon Block 903. On February 16, 2012, Anadarko announced the successful results of the appraisal well, which encountered approximately 250 feet of net pay thickness in high-quality Miocene sands. The appraisal well was drilled to a total depth of 31,030 feet in approximately 5,000 feet of water, about 1.5 miles south and 550 feet structurally up-dip from the Heidelberg #1 exploration well. Log and pressure data from the Heidelberg #1 exploration well and the Heidelberg appraisal well indicate excellent quality, continuous and pressure-connected reservoirs with high-quality oil. On April 19, 2012, Anadarko announced that a sidetrack well performed on the Heidelberg appraisal well successfully confirmed an extension of the Heidelberg field of up to 1,500 acres by encountering an oil/water contact that was approximately 700 feet down structure.
The Heidelberg production facility is designed to produce up to approximately 80,000 barrels of oil per day ("BOPD"). Key contractors to build the production platform and facilities necessary to enable production from the Heidelberg field have been selected and the final design has been completed. Fabrication of the hull and topsides is underway and work continues on schedule for the subsea and export system. We anticipate that Anadarko will begin drilling development wells in the Heidelberg field in the first quarter of 2014. As of December 31, 2013, we had 7.9 million barrels ("MMBbls") of oil and 3.4 billion cubic feet ("Bcf") of gas of net proved undeveloped reserves attributed to the Heidelberg project. For more information regarding our proved undeveloped reserves, please see "—Summary of Oil and Gas Reserves." We own a 9.375% working interest in the Heidelberg project.
North Platte Project. On December 5, 2012, we announced a significant oil discovery at our North Platte prospect on Garden Banks Block 959 in the deepwater U.S. Gulf of Mexico. The North Platte #1 exploration well represents the first discovery in our deepwater U.S. Gulf of Mexico Alliance with TOTAL E&P USA INC. ("Total"). Based on extensive wireline evaluation, the discovery well encountered over 550 net feet of oil pay in multiple high-quality Inboard Lower Tertiary reservoirs. The North Platte oil discovery is particularly important because it provides evidence to support our geologic model of the Inboard Lower Tertiary trend where we hold a substantial acreage position with several follow-on exploration prospects, such as South Platte, Baffin Bay, and Williams Fork. We have conducted bypass coring on the North Platte #1 exploration well, which has provided additional information we will use as we continue our evaluation of the North Platte oil discovery and plans for appraisal. The North Platte #1 exploration well is located in approximately 4,400 feet of water and was drilled to a total depth of approximately 34,500 feet.
As part of our initial development plans for the North Platte project, we continue to analyze the data obtained from the North Platte #1 exploration well as well as improve our seismic imaging over the entire North Platte field. A 5,200 square mile full azimuth 3-D seismic survey over the greater North Platte area has been completed, of which we have licensed data covering approximately 1,350 square miles. This 3-D seismic survey is designed to further improve the sub-salt imaging of the North Platte field as well as several other Inboard Lower Tertiary exploration prospects in which we have working interests. We will use this newly acquired and re-processed 3-D seismic data to optimize potential appraisal and development well locations on North Platte. We are also conducting reservoir fluids analyses and subsea studies to support our appraisal and development efforts there. Reservoir characterization and certain geologic modeling studies have been started in order to better understand reservoir flow, productivity and recovery characteristics of the field. We will utilize this data as we continue to formulate appraisal drilling plans and begin to evaluate potential development options. We currently plan to drill the initial appraisal well in the North Platte field in 2015. The North Platte project is in the early stages of the project development life-cycle and will require substantial additional evaluation and analysis, including appraisal drilling, prior to preparing a development plan and seeking formal project sanction. We are the operator of North Platte and own a 60% working interest.
4
Table of Contents
Shenandoah Project. On February 4, 2009, we announced that Anadarko, as operator, had drilled the Shenandoah #1 exploration well into Inboard Lower Tertiary horizons and encountered net oil pay approaching 300 feet. This well, located in approximately 5,750 feet of water in Walker Ridge Block 52, was drilled to approximately 30,000 feet. The initial appraisal well on the Shenandoah field was spud in the third quarter of 2012 in approximately 5,800 feet of water, about 1.3 miles southwest of the Shenandoah #1 exploration well and was drilled to a total depth of 31,405 feet. On March 19, 2013, we announced that the Shenandoah appraisal well encountered more than 1,000 net feet of oil pay in multiple high quality Inboard Lower Tertiary-aged reservoirs. We expect to participate as a non-operator in an additional appraisal well on the Shenandoah field in 2014. The Shenandoah project is in the early stages of the project development life-cycle and will require substantial additional evaluation and analysis, which may include additional appraisal drilling, prior to the preparation of a development plan and seeking formal project sanction. We own a 20% non-operated working interest in the Shenandoah project.
West Africa
We and our partners are moving forward on our Cameia development project and evaluating our additional discoveries offshore West Africa as described below:
Cameia Project (Block 21). On February 9, 2012, we announced that the Cameia #1 exploration well was drilled in 5,518 feet (1,682 meters) of water to a total depth of 16,030 feet (4,886 meters), at which point an extensive wire-line evaluation program was conducted. The results of this wire-line evaluation program confirmed the presence of a 1,180 foot (360 meter) gross continuous hydrocarbon column with over a 75% net to gross pay estimate. No gas/oil or oil/water contact was evident on the wire line logs. An extended Drill Stem Test ("DST") was performed on the Cameia #1 exploration well to provide additional information. The DST flowed at an un-stimulated sustained rate of 5,010 barrels per day of 44-degree API gravity oil and 14.3 million cubic feet per day of associated gas (approximately 7,400 barrels of oil equivalent per day ("BOEPD")) with minimal bottom-hole pressure drawdown. Upon shut-in, the bottom-hole pressure reverted to its initial state in less than one minute. The well bore used in the DST had a perforated interval of less than one-third of the reservoir section. The flow rate, which was restricted by surface equipment, facility and safety precautions, confirmed the presence of a very thick, high quality reservoir. We believe the well, without such restrictions, would have the potential to produce in excess of 20,000 BOPD. On March 2, 2012, we submitted a declaration of commercial well to Sociedade National de Combustíveis de Angola—Empresa Pública ("Sonangol") with respect to the Cameia #1 exploration well. During 2012, we drilled the Cameia #2 appraisal well, which was located approximately 2.2 miles (3.5 kilometers) south of the Cameia #1 exploration well and was successful in demonstrating lateral continuity within the reservoir originally encountered by the Cameia #1 exploration well. The results from the Cameia #2 appraisal well were also important as the well discovered a lower hydrocarbon-bearing zone at least 440 feet (134 meters) deeper than that which was observed in the Cameia #1 exploration well.
We continue to advance our Cameia project through the project development life-cycle following the drilling of the successful Cameia #2 appraisal well. Our confidence in moving the Cameia project forward is based on the fact that the Cameia #2 appraisal well penetrated hydrocarbons and the well results demonstrated lateral continuity within the reservoir originally encountered by our Cameia #1 exploration well. This provided additional assurance of sufficient areal extent to support our plans to proceed with the evaluation of development options. As part of our development work on our Cameia project, we have continued to define our subsurface imaging by integrating the data from a newly acquired 3-D seismic survey. We are also conducting static and dynamic reservoir modeling and performance simulations. We are utilizing this information to prepare estimates for the cost of and timeline associated with the design, procurement, fabrication and commissioning of equipment and materials, including a floating production, storage and offloading ("FPSO") vessel, as well as the
5
Table of Contents
drilling and completion of development wells. These estimates, combined with our subsurface description, are being used to generate an integrated field development plan for the Cameia project. On February 28, 2014, we will submit a formal declaration of commercial discovery to Sonangol with respect to our Cameia project. We plan to drill an additional appraisal well on the Cameia field in 2014, which is expected to be utilized as a field development well. The results of this well will be used to validate the final facilities design prior to project sanction. We expect to submit the integrated field development plan in mid-2014 for approval by our partners, Sonangol and the Angola Ministry of Petroleum. The integrated field development plan must be approved by our partners, Sonangol and the Angola Ministry of Petroleum before the Cameia development may be formally sanctioned. We expect formal sanction of the Cameia project in late 2014 or early 2015 and first production from the Cameia project in 2017, assuming continued alignment with our partners and Sonangol. We are the operator of and have a 40% working interest in the Cameia project. Our partners in the Cameia project include Sonangol Pesquisa e Produção, S.A. ("Sonangol P&P"), with a 35% working interest, Nazaki Oil and Gáz, S.A. ("Nazaki"), with a 15% working interest, and Alper Oil, Limitada ("Alper"), with a 10% working interest.
Lontra Discovery (Block 20). On December 1, 2013, we announced that our Lontra #1 exploration well had been drilled to a total depth of 13,763 feet (4,195 meters) and encountered approximately 250 feet (75 meters) of net pay in a very high quality reservoir section. The Lontra #1 exploration well encountered both a high liquids content gas interval and an oil interval. A DST was performed on the high liquids content gas interval and successfully produced a sustained flow rate of 2,500 barrels per day of condensate and 39 million cubic feet per day of gas. The DST did not test the oil interval. On December 20, 2013, we submitted a declaration of commercial well to Sonangol regarding the Lontra #1 exploration well. Given that the Lontra #1 exploration well was only recently finished, the Lontra discovery is in the early stages of the project development life-cycle and will require substantial additional evaluation and analysis, including appraisal drilling, prior to preparing a development plan and seeking formal project sanction. Currently, we are evaluating data we obtained from the Lontra #1 exploration well. Our initial development plans for Lontra are to proceed with development of the oil and condensate from the Lontra field independently of any agreement to commercialize the gas present in the Lontra field. We do not currently have contractual rights to sell gas from the Lontra field, although we are working with Sonangol to commercialize the gas present in the Lontra field. We are the operator of and have a 40% working interest in the Lontra discovery. Our partners in Lontra include BP Exploration Angola (Kwanza Benguela) Limited ("BP") and Sonangol P&P, with each partner holding a 30% working interest.
Bicuar Discovery (Block 21). On January 22, 2014, we announced that the Bicuar #1A exploration well was successfully drilled to a total depth of 18,829 feet (5,739 meters) and encountered approximately 180 feet (56 meters) of net pay from multiple pre-salt intervals. Results of an extensive logging, coring and fluid acquisition program confirmed the existence of both oil and condensate in multiple intervals. No free gas zones or water contacts were observed. The results from the Bicuar #1A exploration well are significant because they confirm the first discovery of mobile hydrocarbons tested in the pre-salt syn-rift geologic interval offshore Angola. On February 13, 2014, we submitted a declaration of commercial well to Sonangol regarding the Bicuar #1A exploration well. Given that the Bicuar #1A exploration well was only recently finished, Bicuar is in the very early stages of the project development life-cycle and will require substantial additional evaluation and analysis, including appraisal drilling, prior to preparing a development plan and seeking formal project sanction. We are the operator of and have a 40% working interest in the Bicuar discovery. Our partners in Bicuar include Sonangol P&P (35% working interest), Nazaki (15% working interest), and Alper (10% working interest).
Mavinga Discovery (Block 21). On October 29, 2013, we announced that the Mavinga #1 exploration well had reached total depth and encountered approximately 100 feet (30 meters) of net oil
6
Table of Contents
pay. This discovery was confirmed by the successful production of oil from mini DSTs, direct pressure and permeability measurements and log and core analysis. Efforts to establish a sustained flow rate from a full DST were not successful. We believe that operational issues associated with the DST prevented the production from the oil reservoir during the production test. We estimate a gross oil column of up to 650 feet (200 meters) at the crest of the Mavinga structure updip of the Mavinga #1 exploration well. Additional drilling will be required to confirm the ultimate gross thickness of the crest of the Mavinga structure and Mavinga's reservoir quality. On November 12, 2013, we submitted a declaration of commercial well to Sonangol regarding the Mavinga #1 exploration well. Given that the Mavinga #1 exploration well was only recently finished, our Mavinga discovery is in the very early stages of the development life-cycle and will require substantial additional evaluation and analysis, potentially including appraisal drilling, prior to preparing a development plan and seeking formal project sanction. Given the results of the Mavinga #1 exploration well and its proximity to the location of our Cameia project, our initial development concept for the Mavinga discovery is to eventually tie back the Mavinga field to our Cameia project. Although we estimate formal sanction of the Cameia project in late 2014 or early 2015 and first production from the Cameia project in 2017 (assuming continued alignment with our partners and Sonangol) those estimates and timelines do not include any potential tie-back development to or production from our Mavinga discovery. We do not currently have an estimate on when the Mavinga discovery might be sanctioned or when we might achieve first production. We are the operator of and have a 40% working interest in the Mavinga discovery. Our partners in Mavinga include Sonangol P&P (35% working interest), Nazaki (15% working interest), and Alper (10% working interest).
Orca Discovery (Block 20). On February 27, 2014, we provided an update on our Orca #1 deepwater pre-salt exploration well in Block 20, offshore Angola. The well has reached total depth and has resulted in our fifth consecutive pre-salt discovery in Angola's Kwanza basin. Results of an extensive logging, coring and fluid acquisition program confirmed the existence of 250 feet (76 meters) of net oil pay. Based on all data collected to date, the discovery appears to consist of a large light oil reservoir and a thin condensate and gas cap in the upper sag section of the well. In addition, mobile oil was discovered in the deeper syn-rift section of the well. After running production casing on the well which is currently underway, further evaluation and testing will commence, after which the well will be temporarily abandoned. Over the next several months following full processing and integration of all subsurface data collected from the well, the Block 20 partners will evaluate any additional activities necessary to assess Orca's commerciality. After well operations are complete at Orca #1, we will move the Petroserv SSV Catarina drilling rig to the Cameia #3 location in Angola Block 21.
Diaman Discovery (Diaba Block). On August 19, 2013, we announced that the Diaman #1B exploration well was drilled to a total depth of 18,323 feet (5,585 meters), and encountered approximately 160 to 180 feet (50 to 55 meters) of net hydrocarbons in the objective pre-salt formations on the Diaba Block offshore Gabon. The Diaman #1B exploration well successfully confirmed the existence of a working petroleum system, a salt seal, and high-quality sandstone reservoirs. We and our partners are conducting a full analysis of the Diaman #1B exploration well results in order to determine our future exploration and appraisal drilling activity on the Diaba Block. Diaman is in the very early stages of the project development life-cycle and will require substantial additional evaluation and analysis, including appraisal drilling, prior to proceeding with a development plan. We have a 21.25% non-operated working interest in the Diaman discovery. Our partners in the Diaman discovery include Total Gabon, as operator (42.5% working interest), Marathon Petroleum Corporation (21.25% working interest), and the Republic of Gabon (15% working interest).
7
Table of Contents
Continued Exploration
U.S. Gulf of Mexico
We currently have an extensive below-salt exploration prospect inventory in the deepwater U.S. Gulf of Mexico. During 2014, we plan to focus on maturing our operated below-salt prospect inventory through seismic acquisition and evaluation and well permitting activities for future exploration drilling. Specifically, we plan to focus on maturing our South Platte, Baffin Bay, and Williams Fork prospects, which are Inboard Lower Tertiary prospects in close proximity to our North Platte #1 discovery, for future exploration drilling beginning in 2015. We expect to take delivery of the Rowan Reliance drillship in early 2015 and plan use it to drill one to two exploration wells per year. The Rowan Reliance drillship will also be used for appraisal and development drilling on our North Platte project. Please see "General Information—U.S. Gulf of Mexico—Drilling Rigs" for more information about the Rowan Reliance drillship.
Our near term exploration plans call for the following exploration wells to be drilled:
Anchor #1. We expect to participate as a non-operator in the Anchor #1 (formerly our Racer prospect) exploration well in 2014, which will target Inboard Lower Tertiary horizons and a secondary Miocene target. Currently, we have a 20% working interest in the Anchor prospect and our partners are Chevron U.S.A. Inc. (55%), Venari Resources LLC (12.5%), and Samson Offshore, LLC (12.5%).
Goodfellow #1. We expect to participate as a non-operator in the Goodfellow #1 exploration well, which will target Inboard Lower Tertiary horizons. Currently we have a 21.2% working interest in the Goodfellow prospect and our partners include ENI U.S. Operating Co. Inc. (25.7%), Samson Offshore, LLC (25.7%), and Total (27.4%). Prior to spudding the Goodfellow #1 exploration well, the composition and working interests of the Goodfellow partnership may change.
In addition, we plan to continue maturing our exploration prospects, including Rum Ramsey, Latvian, El Ciervo, Fraser, Mulashidi, Kashmir, Percheron, Rocky Mountain, Saddelbred and Sulu. See "Risk Factors—Risks Relating to Our Business—Our drilling plans are scheduled out over several years, making them susceptible to uncertainties that could materially alter the occurrence or timing of drilling."
West Africa
We currently have an extensive pre-salt exploration prospect inventory offshore West Africa. Our first six exploration wells offshore West Africa have all been successful in discovering hydrocarbons. This represents an exploration success rate of 100%. We have the Petroserv SSV Catarina drilling rig under contract for use in our Angolan drilling campaign and plan to utilize it to drill exploration, appraisal and development wells across our exploration and project portfolio. Please see "General Information—West Africa—Drilling Rigs" for more information about the Petroserv SSV Catarina drilling rig.
Our near term exploration plans call for the following exploration wells to be drilled:
Loengo #1. We have applied for an extension of the initial exploration phase on Block 9 offshore Angola to enable us to drill an exploration well on the Loengo prospect. This extension is currently pending approval by Sonangol and the Angola Ministry of Petroleum. If the extension is approved, we expect to spud the Loengo #1 exploration well in 2014. The Loengo #1 exploration well will target pre-salt horizons in Block 9 offshore Angola, where we are the named operator with a 40% working interest. Loengo was mapped using our 3-D seismic data. Sonangol P&P (35%), Nazaki (15%), and Alper (10%) are our partners in the Loengo prospect.
Mupa #1. We expect to spud the Mupa #1 exploration well by year-end 2014. The Mupa #1 exploration well will target pre-salt horizons in Block 21 offshore Angola, where we are the named
8
Table of Contents
operator with a 40% working interest. Mupa was mapped using our 3-D seismic data. The drilling of our Mupa #1 exploration well will satisfy our minimum work obligations during the initial exploration phase on Block 21. Sonangol P&P (35%), Nazaki (15%), and Alper (10%) are our partners in the Mupa prospect.
Golfinho #1. We may elect to spud the Golfinho #1 exploration well in 2014. The Golfinho #1 exploration well will target pre-salt horizons in Block 20 offshore Angola, where we are the named operator with a 40% working interest. Golfinho was mapped using our 3-D seismic data. BP (30%) and Sonangol P&P (30%) are our partners in the Golfinho prospect.
In addition, we plan to continue maturing up to 20 follow-on oil-focused exploration prospects on Blocks 20 and 21 offshore Angola. With respect to our exploration activities on the Diaba Block offshore Gabon, we and our partners are currently evaluating acquiring additional 3-D seismic data on portions of the Diaba Block and maturing several oil-focused pre-salt prospects for exploration drilling beginning in 2015. See "Risk Factors—Risks Relating to Our Business—Our drilling plans are scheduled out over several years, making them susceptible to uncertainties that could materially alter the occurrence or timing of drilling."
Exploration Prospect Maturation Process
The process of maturing an exploration prospect in both the U.S. Gulf of Mexico and offshore West Africa from initial identification to drill-ready status begins with analyzing regional data, including industry well results, to understand a given trend's specific geology and defining those areas, or "prospects," that offer the highest potential for substantial hydrocarbon deposits while minimizing geologic risks. After these prospects are identified, we further mature our prospects by acquiring and reprocessing high resolution seismic data available in the potential prospect's direct vicinity. This includes advanced imaging information, such as wide-azimuth studies, to further our understanding of a particular prospect's characteristics, including both trapping mechanics and fluid migration patterns. Reprocessing is accomplished through a series of model building steps that incorporate the geometry of the salt and below salt geology to optimize the final image. In addition, we gather publicly available information, such as well logs, which we use to evaluate industry results and activities in order to understand the relationships between industry-drilled prospects and our portfolio of undrilled prospects. As part of the maturation of a prospect to drill-ready status, we also perform substantial drilling-related engineering work, such as generating a proposed well design, including the well evaluation and completion design, and the preparation of pore pressure prediction analysis and reports, site survey reports, and shallow hazard reports. The purpose of this work is to minimize the drilling and operational risk associated with drilling a well on a particular prospect. There are also numerous regulatory filings we must prepare and submit in order to obtain the required permits, authorizations and approvals needed to drill an exploration well on a prospect.
We may decide during any of the foregoing steps of prospect maturation that drilling an exploration well on a particular prospect may not be warranted given the geologic, drilling and economic risk profile that was developed during the prospect maturation process. Once the foregoing items, as applicable, are complete and we have determined that a prospect is ready and desirable for exploration drilling, and the geologic, economic and drilling risks associated with such prospect have been optimally mitigated, such prospect would be considered "mature."
New Ventures
In addition to our existing assets in the U.S. Gulf of Mexico and offshore West Africa and as part of our strategy of renewing our world-wide exploration portfolio, our New Ventures group is actively evaluating additional exploration opportunities. Consistent with our core strengths, our New Ventures strategy is centered on pursuing high-value, deepwater oil-focused exploration opportunities. For
9
Table of Contents
example, following our successful Diaman #1B exploration well on the Diaba Block offshore Gabon, we participated in the Gabon pre-salt license round in 2013. This license round is ongoing, but we expect to be able to announce results from the license round in 2014.
General Information—U.S. Gulf of Mexico
Our U.S. Gulf of Mexico operations target oil-focused prospects in the subsalt Miocene and Inboard Lower Tertiary horizons in the deepwater U.S. Gulf of Mexico.
The subsalt Miocene and Inboard Lower Tertiary horizons in the deepwater U.S. Gulf of Mexico are characterized by well-defined hydrocarbon systems, comprised primarily of high-quality source rock and crude oil, and contain several of the most significant hydrocarbon discoveries in the deepwater U.S. Gulf of Mexico in recent years.
Miocene. The subsalt Miocene trend is an established play in the deepwater U.S. Gulf of Mexico. Discoveries in this trend include Heidelberg, Thunder Horse, Atlantis, Tahiti, Mad Dog, and Knotty Head. This trend is characterized by high quality reservoirs and fluid properties, resulting in high production well rates.
Inboard Lower Tertiary. The Lower Tertiary horizon is an older formation than the Miocene, and, as such, is generally deeper, with greater geologic complexity. The industry has been successful in terms of locating and drilling large hydrocarbon-bearing structures in this interval and several discoveries are progressing towards project sanction. The reservoir quality of the Lower Tertiary has proven to be highly variable. Some regions, including those areas in which many of the historical Lower Tertiary discoveries have been made, exhibit lower permeability and generally lower natural gas content compared to the Miocene horizon.
However, a sub-region in the Lower Tertiary that has exhibited reservoir characteristics more similar to that of existing Miocene discoveries is the Inboard Lower Tertiary trend, which includes our oil discoveries at North Platte and Shenandoah. The Inboard Lower Tertiary is a trend located to the north of existing Outboard Lower Tertiary fields such as St. Malo, Jack and Cascade. We were an early mover in the Inboard Lower Tertiary trend, targeting specific lease blocks as early as 2006. We believe our Inboard Lower Tertiary prospects are characterized by large, well-defined structures of a similar size to historic Outboard Lower Tertiary discoveries, but are differentiated by what we believe to be better reservoir quality and energy based upon data from wells drilled at our North Platte and Shenandoah discoveries. We believe we hold a significant leasehold position in the Inboard Lower Tertiary and, to date, have had an exploration success rate of 50% in the Inboard Lower Tertiary.
In general, the life-cycle of our major project developments begins with a thorough evaluation and analysis of well logs (including offset analog wells), reservoir core samples, fluid samples and, in some cases, the results of production tests from the initial exploration well that encountered what we believe may be commercial hydrocarbons. This information, along with relevant seismic data, is used to generate locations and plans for appraisal and development wells. Depending upon the project, we may choose to drill one or more appraisal wells prior to project sanction and development, each of which will undergo thorough analysis and evaluation. The information we obtain from exploration and appraisal wells is then used to create a development plan, which will include economic assumptions on the costs of drilling and completing development wells, the front-end engineering and design of offshore production and processing facilities, including subsea, umbilical, riser and flowline systems and other related transportation infrastructure. The project will become formally sanctioned when the relevant working interest partners have approved the development plan. Typically, following formal
10
Table of Contents
project sanction, we will commence the construction of offshore production facilities, and proceed with development drilling and the installation of subsea architecture in order to advance the project towards initial production.
A discovery made by the initial exploration well on a prospect does not ensure that we will ultimately develop or produce hydrocarbons from such prospect or that a project development will be economically viable or successful. Following a discovery by an initial exploration well, substantial additional evaluation and analysis, such as the steps described above, will need to be performed prior to official project sanction and development. In addition, substantial amounts of capital are required to progress a project through the project development life-cycle. At any time during the project development life-cycle, we may determine that the project would be uneconomic and abandon the project, despite the fact that the initial exploration well, or subsequent appraisal wells, discovered hydrocarbons. See "Risk Factors—Risks Relating to Our Business—Our discoveries and appraisal and development projects remain subject to varying degrees of additional evaluation, analysis and partner and regulatory approvals prior to official project sanction and production."
As of December 31, 2013, we owned working interests in 243 blocks within the deepwater U.S. Gulf of Mexico, representing approximately 1.4 million gross (0.7 million net) acres. The following schedule shows the developed and undeveloped acres in which we held interests as of December 31, 2013 in the U.S. Gulf of Mexico.
| | | | | | | | | | | | | |
| | Developed
Lease Acres(1) | | Undeveloped
Lease Acres(2) | |
|---|
| | Gross | | Net | | Gross | | Net | |
|---|
U.S. Gulf of Mexico | | | 23,040 | | | 2,160 | | | 1,374,950 | | | 699,854 | |
- (1)
- Our developed lease positions of 23,040 gross (2,160 net) acres are entirely related to our Heidelberg project. The Heidelberg project was sanctioned in mid-2013 and all of the leasehold acreage associated with the Heidelberg project is held by a Suspension of Production, which was granted by the U.S. Department of the Interior for the federally-approved Heidelberg Unit. Anadarko, as operator, estimates first oil production from Heidelberg in 2016.
- (2)
- Our Shenandoah and North Platte projects are not yet sanctioned and therefore the acreage associated with those projects remains classified as undeveloped. We estimate that the North Platte project covers U.S. Gulf of Mexico blocks, either wholly or partially, representing 34,560 gross (20,736 net) acres, and the Shenandoah project covers U.S. Gulf of Mexico blocks, either wholly or partially, representing 12,960 gross (2,650 net) acres. If development projects related to North Platte and Shenandoah are sanctioned, we will evaluate which acreage associated with these projects could then be classified as developed acreage.
The royalties on our lease blocks range from 12.5% to 18.75% with an average of 15.7%.
Most of our U.S. Gulf of Mexico blocks have a 10-year primary term, expiring between 2016 and 2022. Assuming we are able to commence exploration and production activities or successfully exploit our properties during the primary lease term, our leases would extend beyond the primary term, generally for the life of production. Our leasehold interest in the U.S. Gulf of Mexico decreased by 51,840 gross (15,516 net) acres in 2013 due to lease expiration, relinquishment, and sale.
11
Table of Contents
The table below summarizes our undeveloped acreage scheduled to expire in the next five years in the U.S. Gulf of Mexico.
| | | | | | | | | | | | | | | | | | | | | | | | | | | | | | | |
| | Undeveloped Lease Acres Expiry | |
|---|
| | 2014(1) | | 2015(2) | | 2016 | | 2017(1) | | 2018 and
thereafter(2) | |
|---|
| | Gross | | Net | | Gross | | Net | | Gross | | Net | | Gross | | Net | | Gross | | Net | |
|---|
U.S. Gulf of Mexico | | | 168,480 | | | 85,456 | | | 63,360 | | | 23,695 | | | 345,600 | | | 198,501 | | | 86,400 | | | 48,080 | | | 705,350 | | | 343,582 | |
- (1)
- The gross and net acreage numbers reflected in these columns include portions of the estimated 12,960 gross (2,650 net) acres covering U.S. Gulf of Mexico blocks associated with our Shenandoah project, upon which exploration and appraisal wells have both discovered hydrocarbons, but a development project has not yet been sanctioned. We expect that the operator of the Shenandoah project will conduct additional appraisal drilling operations in 2014 and file for a Suspension of Operations or Production in order to perpetuate the acreage associated with the Shenandoah project.
- (2)
- The gross and net acreage numbers reflected in these columns include portions of the estimated 34,560 gross (20,736 net) acres covering U.S. Gulf of Mexico blocks associated with our North Platte project, upon which an exploration well has discovered hydrocarbons, but a development project has not yet been sanctioned. We plan to perpetuate this acreage by an eventual unitization and sanctioned development plan or by filing a Suspension of Operations or Production.
On August 5, 2013, we executed a drilling contract with Rowan Reliance Limited, an affiliate of Rowan Companies plc, for the Rowan Reliance, a new-build, ultra-deepwater dynamically positioned drillship that will support our U.S. Gulf of Mexico drilling campaign. The Rowan Reliance drillship will be capable of operating in water depths of up to 12,000 feet and drilling to measured depths of up to 40,000 feet. The drilling contract provides for a firm three-year commitment, expected to begin in early 2015, at a day rate of approximately $602,000 (inclusive of mobilization fees) and two one-year extension options at day rates to be mutually agreed.
The following table sets forth information with respect to the gross and net oil and gas wells we drilled in the deepwater U.S. Gulf of Mexico during the periods indicated. The information presented is not necessarily indicative of future performance, and should not be interpreted to present any correlation between the number of productive wells drilled and quantities or economic value of any reserves found. Productive wells include wells that have been drilled to the targeted depth and prove, in our opinion, to be capable of producing either oil or gas in sufficient quantities that will justify completion as an oil or gas well. A dry well is an exploration, appraisal or development well that
12
Table of Contents
proves to be incapable of producing either oil or gas in sufficient quantities to justify completion as an oil or gas well.
| | | | | | | | | | | | | | | | | | | |
| | U.S. Gulf of Mexico(1) | |
|---|
| | 2013(2) | | 2012(3) | | 2011 | |
|---|
Wells Drilled | | Gross | | Net | | Gross | | Net | | Gross | | Net | |
|---|
Exploration | | | | | | | | | | | | | | | | | | | |
Productive | | | 1 | | | 0.2 | | | 2 | | | 0.69375 | | | — | | | — | |
Dry | | | 2 | | | 1.2 | | | 1 | | | 0.45 | | | — | | | — | |
Total | | | 3 | | | 1.4 | | | 3 | | | 1.14375 | | | — | | | — | |
- (1)
- We did not drill any development wells in the U.S. Gulf of Mexico during the fiscal years ended December 31, 2013, 2012, and 2011, respectively.
- (2)
- The wells noted include our Shenandoah #2R appraisal well (productive), and our Ardennes #1 (dry) and Aegean #1 (dry) exploration wells.
- (3)
- The wells noted include our North Platte #1 (productive) and Ligurian #2 (dry) exploration wells and our Heidelberg #3 appraisal well (productive).
As of the date of this Annual Report on Form 10-K, we did not have any oil or gas wells drilling in the U.S. Gulf of Mexico.
On April 6, 2009, we announced a long-term alliance with Total in which, through a series of transactions, we combined our respective U.S. Gulf of Mexico exploration lease inventory (which excludes our Heidelberg project, our Shenandoah project, and all developed or producing properties held by Total in the U.S. Gulf of Mexico) through the exchange of a 40% interest in our leases for a 60% interest in Total's leases, resulting in a current combined alliance portfolio covering 239 blocks. The initial mandatory five-well program and Total's obligation to carry a substantial share of our costs associated with those wells concluded at the end of drilling operations on our Aegean #1 exploration well. Pursuant to the alliance, Total remains obligated to pay 40% of the general and administrative costs relating to our operations in the deepwater U.S. Gulf of Mexico during the 10-year alliance term. Total also remains obligated to pay up to $87.8 million to carry up to two-thirds of (i) our costs for drilling or other operations (including seismic) conducted prior to the development phase on our North Platte project, and (ii) our costs for any additional exploration or appraisal wells apart from our North Platte project. We act as operator on behalf of the alliance through the exploration and appraisal phases of development. Upon completion of appraisal operations, operatorship will be determined by Total and ourselves, with the greatest importance being placed on majority (or largest) working interest ownership and the respective experience of each party in developments which have required the design, construction and ownership of a permanently anchored host facility to collect and transport oil or natural gas from such development.
13
Table of Contents
General Information—West Africa
Our West Africa operations include appraisal and development activities on our discoveries as well as the exploration of oil-focused prospects targeting pre-salt geologic horizons in the Kwanza basin offshore Angola and the South Gabon Coastal basin offshore Gabon.
Offshore Angola and Gabon are characterized by the presence of salt formations and oil-bearing sediments located in pre-salt and above salt (Albian) horizons. Given the rifting that occurred when plate tectonics separated the South American and African continents, we believe the geology offshore Angola (Kwanza Basin) and Gabon (South Gabon Coastal Basin) is an analog to the geology offshore Brazil where several pre-salt discoveries are located. The basis for this hypothesis is that 150 million years ago, current day South America and Africa were part of a larger continent that broke apart. As these land masses slowly drifted away from each other, rift basins formed. These basins were filled with organic rich material and sediments, which in time became hydrocarbon source rocks and reservoirs. A thick salt layer was subsequently deposited, forming a seal over the reservoirs. Finally the continents continued to drift apart, forming two symmetric geologic areas separated by the Atlantic Ocean. This symmetry in geology is particularly notable in the deepwater areas offshore Gabon, Angola and the Campos Basin offshore Brazil. From an exploration perspective, we believe this similarity is very meaningful, particularly in the context of pre-salt Brazilian discoveries and our recent pre-salt discoveries at Cameia, Lontra, Mavinga, Bicuar, Orca and Diaman.
In general, the life-cycle of our major project developments begins with a thorough evaluation and analysis of well logs, reservoir core samples, fluid samples and, in some cases, the results of production tests from the initial exploration well that encountered what we believe may be commercial hydrocarbons. This information, along with relevant seismic data, is used to generate locations and plans for appraisal and development wells. In Angola, there are also important regulatory approvals we must obtain from Sonangol throughout the project development life-cycle. For example, under the terms of our applicable licenses in Angola, following a successful exploration well we are required to file a declaration of commercial well with Sonangol, which we have done with respect to our Cameia #1, Mavinga #1, Lontra #1, and Bicuar #1A exploration wells and expect to do so shortly with respect to our Orca #1 exploration well. Under the terms of our applicable licenses in Angola, we have two years from our declaration of commercial well to declare a commercial discovery, unless otherwise agreed by Sonangol. On February 28, 2014, we will submit a formal declaration of commercial discovery to Sonangol with respect to our Cameia project. Depending upon the project, we may choose to drill one or more appraisal wells, each of which will undergo thorough analysis and evaluation. Once we file a declaration of commercial discovery with Sonangol, we have three months to file a development plan with Sonangol for approval. The development plan will include economic assumptions on the costs and timeline for drilling and completing development wells, the front-end engineering design, procurement, installation and commissioning of offshore production and processing facilities such as FPSO vessels, and also includes engineering design, procurement, installation and commissioning of subsea, umbilical, riser and flowline systems and other related transportation infrastructure. The project will become formally sanctioned when the relevant working interest partners have approved the development plan, including Sonangol and the Angola Ministry of Petroleum. Typically, following formal project sanction, we will commence the construction of offshore production facilities, proceed with development drilling and installation of subsea architecture in order to advance the project towards initial production.
A discovery made by the initial exploration well on a prospect does not ensure that we will ultimately develop or produce hydrocarbons from such prospect or that a project development will be
14
Table of Contents
economically viable or successful. Following a discovery by an initial exploration well, substantial additional evaluation and analysis, such as the steps described above, will need to be performed prior to official project sanction and development, including important regulatory approvals. At any time during the project development life-cycle, we may determine that the project would be uneconomic and abandon the project, despite the fact that the initial exploration well, or subsequent appraisal wells, discovered hydrocarbons. See "Risk Factors—Risks Relating to Our Business—Our discoveries and appraisal and development projects remain subject to varying degrees of additional evaluation, analysis and partner and regulatory approvals prior to official project sanction and production."
Block 9 offshore Angola. We acquired our license to explore for, develop and produce oil from Block 9 offshore Angola by executing a Risk Services Agreement ("Block 9 RSA") with Sonangol. The Block 9 RSA governs our 40% working interest in and operatorship of Block 9 offshore Angola and forms the basis of our exploration, development and production operations on this block. The Block 9 RSA provides for an initial exploration period of four years, which is scheduled to expire on March 1, 2014, and an optional exploration period of an additional three years. We have applied for an extension of the exploration period for Block 9 to enable us to drill an exploration well on our Loengo prospect. This extension is currently pending approval by Sonangol and the Angola Ministry of Petroleum. We do not have contractual rights to sell natural gas on Block 9, but we have the right to use the natural gas during lease operations. Any stand-alone gas development cannot hinder or impede the development of liquid hydrocarbons on Block 9. Block 9 is approximately 1 million acres (4,000 square kilometers) in size or approximately 167 U.S. Gulf of Mexico blocks and is located immediately offshore in the southeastern-most portion of the Kwanza Basin. Water depth ranges from zero to more than 3,200 feet (1,000 meters). Sonangol P&P, Nazaki, and Alper are also parties to the Block 9 RSA. For more information regarding our Block 9 license, please see "—Material Agreements—Risk Services Agreements for Blocks 9 and 21 Offshore Angola."
Block 21 offshore Angola. We acquired our license to explore for, develop and produce oil from Block 21 offshore Angola by executing a Risk Services Agreement ("Block 21 RSA") with Sonangol. The Block 21 RSA governs our 40% working interest in and operatorship of Block 21 offshore Angola and forms the basis of our exploration, development and production operations on this block. The Block 21 RSA provides for an initial exploration period of five years, which is scheduled to expire on March 1, 2015, and an optional exploration period of an additional three years. We do not have contractual rights to sell natural gas on Block 21, but we have the right to use the natural gas during lease operations. Any stand-alone gas development cannot hinder or impede the development of liquid hydrocarbons on Block 21. Block 21 is approximately 1.2 million acres (4,900 square kilometers) in size or approximately 200 U.S. Gulf of Mexico blocks. The block is 30 to 90 miles (50 to 140 kilometers) offshore in water depths of 1,300 to 5,900 feet (400 to 1,800 meters) in the central portion of the Kwanza Basin. Sonangol P&P, Nazaki, and Alper are also parties to the Block 21 RSA. For more information regarding our Block 21 license, please see "—Material Agreements—Risk Services Agreements for Blocks 9 and 21 Offshore Angola."
On September 19, 2013, we received a letter from Sonangol notifying us that Nazaki had transferred a 15% working interest in each of Blocks 9 and 21 offshore Angola (out of its 30% working interest in each block) to Sonangol P&P. The letter stated that these transfers were effective as of March 14, 2013 for Block 9 and February 18, 2013 for Block 21, corresponding to the dates of the executive decrees from the Angola Ministry of Petroleum authorizing such transfers. As a result of these transfers, Sonangol P&P now has a working interest of 35% and a current paying interest of 18.75% (which is applicable only during the exploration phase on Blocks 9 and 21) in each of Blocks 9 and 21. Our working interest of 40% and current paying interest of 62.5% (which is applicable only
15
Table of Contents
during the exploration phase on Blocks 9 and 21) in each of Blocks 9 and 21 remains unchanged as a result of these transfers. We are the operator of Blocks 9 and 21.
Block 20 offshore Angola. We acquired our license to explore for, develop and produce oil from Block 20 offshore Angola by executing a Production Sharing Contract (the "Block 20 PSC") with Sonangol. The Block 20 PSC governs our 40% working interest in and operatorship of Block 20 offshore Angola and forms the basis of our exploration, development and production operations on Block 20 offshore Angola. Sonangol P&P, BP and China Sonangol International Holding Limited ("China Sonangol") are also parties to the Block 20 PSC. Subsequent to its execution of the Block 20 PSC, China Sonangol assigned its working interest in Block 20 to BP. The Block 20 PSC provides for an initial exploration period of five years, which is scheduled to expire on January 1, 2017, and an optional exploration period of an additional three years. We do not have contractual rights to sell natural gas on Block 20 offshore Angola, but we have the right to use the natural gas during lease and production operations. Any stand-alone gas development cannot hinder or impede the development of liquid hydrocarbons on Block 20. Block 20 is approximately 1.2 million acres (4,900 square kilometers) in size or approximately 200 U.S. Gulf of Mexico blocks and is centered approximately 75 miles west of Luanda in the deepwater Kwanza Basin. It is immediately to the north of Block 21. For more information regarding our Block 20 license, please see "—Material Agreements—Production Sharing Contract for Block 20 Offshore Angola."
Diaba Block offshore Gabon. We acquired our non-operated 21.25% working interest in the Diaba Block offshore Gabon by entering into an assignment agreement with Total Gabon. Through the assignment we became a party to the Production Sharing Agreement ("PSA") between the operator Total Gabon and the Republic of Gabon. The PSA gives us the right to recover costs incurred and receive a share of the remaining profit from any commercial discoveries made on the block. We have contractual rights to any form of hydrocarbons, including natural gas, discovered on our Gabon license area. The Diaba Block is approximately 2.2 million acres (9,100 square kilometers) in size or approximately 370 U.S. Gulf of Mexico blocks. The block is 40 to 120 miles (60 to 200 kilometers) offshore in water depths of 300 to 10,500 feet (100 to 3,200 meters) in the central portion of the offshore South Gabon Coastal basin.
As of December 31, 2013, our working interests in Blocks 9, 20 and 21 offshore Angola and the Diaba Block offshore Gabon comprised an aggregate 5,652,687 gross (1,840,581 net) undeveloped acres. We do not currently own any working interests in developed acreage offshore Angola, although exploration wells have discovered hydrocarbons at Cameia, Mavinga and Bicuar on Block 21 offshore Angola and at Lontra and Orca on Block 20 offshore Angola. We have filed a declaration of commercial well with respect to each of those exploration wells pursuant to the terms of the Block 21 RSA and the Block 20 PSC except for Orca, which we expect to file shortly. On February 28, 2014, we will submit a formal declaration of commercial discovery to Sonangol with respect to our Cameia project. Upon the approval of a development area by the applicable Angolan government authorities, we will be in a position to specify the acreage assigned to the Cameia project and seek approval of a formal development plan. Likewise, upon approval of development areas by the applicable Angolan government authorities with respect to each of our Mavinga, Bicuar, Lontra and Orca discoveries, we will be in a position to specify the acreage assigned to each respective discovery and seek approval of a formal development plan. In addition, the Diaman #1B exploration well on the Diaba Block offshore Gabon was also successful in discovering hydrocarbons, however, the Diaman discovery remains in the early phases of the development project life-cycle. After the approval of a development plan, the delineation of a development area and the completion of certain other steps, we will evaluate which acreage associated with these discoveries could then be classified as developed acreage. See "Risk Factors—Risks Relating to Our Business—Our discoveries and appraisal and development projects remain subject to varying degrees of additional evaluation, analysis and partner and regulatory approvals prior to official project sanction and production."
16
Table of Contents
The table below summarizes our undeveloped acreage scheduled to expire in the next five years offshore West Africa.
| | | | | | | | | | | | | | | | | | | | | | | | | | | | | | | |
| | Undeveloped Acres Expiring | |
|---|
| | 2014 | | 2015 | | 2016 | | 2017 | | 2018 and
thereafter | |
|---|
| | Gross | | Net | | Gross | | Net | | Gross | | Net | | Gross | | Net | | Gross | | Net | |
|---|
Offshore West Africa | | | | | | | | | | | | | | | | | | | | | | | | | | | | | | | |
Angola: | | | | | | | | | | | | | | | | | | | | | | | | | | | | | | | |
Block 9(1) | | | 988,668 | | | 395,467 | | | | | | | | | — | | | — | | | — | | | — | | | — | | | — | |
Block 20(2) | | | — | | | — | | | — | | | — | | | — | | | — | | | 1,210,569 | | | 484,228 | | | | | | | |
Block 21(3) | | | — | | | — | | | 1,210,816 | | | 484,326 | | | | | | | | | — | | | — | | | — | | | — | |
Gabon: | | | | | | | | | | | | | | | | | | | | | | | | | | | | | | | |
Diaba(4) | | | — | | | — | | | — | | | — | | | 2,242,634 | | | 476,560 | | | | | | | | | — | | | — | |
- (1)
- Pursuant to the Block 9 RSA, our Block 9 acreage will expire as of March 1, 2014. We have applied for an extension of the initial exploration period for Block 9 to enable us to drill an exploration well on our Loengo prospect. This extension is currently pending approval by Sonangol and the Angola Ministry of Petroleum. See "Risk Factors—Risks Relating to Our Business—Under the terms of our various license agreements, we are required to drill wells and declare any discoveries in order to retain exploration and production rights and failure to do so may result in substantial license renewal costs or loss of our interests in the undeveloped parts of our license areas, which may include certain of our prospects."
- (2)
- Pursuant to the Block 20 PSC, our license to acreage not defined by an approved development area will expire as of January 1, 2017, subject to certain extensions. This expiration date may be extended by three years if we notify Sonangol in writing of such extension at least thirty days before January 1, 2017, provided we have otherwise fulfilled our obligations under the agreement and agree to drill additional wells pursuant to the Block 20 PSC. The undeveloped acreage numbers listed in this row include acreage associated with our Lontra and Orca discoveries upon which exploration wells have discovered hydrocarbons, but a formal declaration of commercial discovery has not yet been filed with the applicable Angolan government authorities and therefore an associated development area has not yet been approved.
- (3)
- Pursuant to the Block 21 RSA, our license to acreage not defined by an approved development area will expire as of March 1, 2015, subject to certain extensions. This expiration date may be extended by three years if we notify Sonangol in writing of such extension at least thirty days before March 1, 2015 provided we have otherwise fulfilled our obligations under the agreement and agree to drill additional wells pursuant to the Block 21 RSA. The undeveloped acreage numbers listed in this row include acreage associated with our Cameia, Mavinga and Bicuar projects upon which exploration wells have discovered hydrocarbons and we have filed declarations of commercial wells, but formal declarations of commercial discovery have not yet been filed with the applicable Angolan government authorities and therefore associated development areas have not yet been approved.
- (4)
- Pursuant to the PSA governing the Diaba Block, our license to acreage not defined by an approved development area will expire as of December 31, 2016, subject to certain extensions.
We currently have the Petroserv SSV Catarina under contract for use in our offshore Angolan pre-salt drilling campaign. The drilling contract for the SSV Catarina, a new-build, sixth-generation semi-submersible drilling rig commenced in April 2013 and provides for a firm three-year commitment at a day rate of approximately $600,000 and two one-year extension options at day rates to be mutually agreed. Such rates are subject to standard reimbursement and escalation contractual provisions. We plan to utilize the Petroserv SSV Catarina for exploration, appraisal and development activities on Blocks 9, 20 and 21 offshore Angola.
The following table sets forth information with respect to the gross and net oil and gas wells we drilled offshore West Africa during the periods indicated. The information presented is not necessarily
17
Table of Contents
indicative of future performance, and should not be interpreted to present any correlation between the number of productive wells drilled and quantities or economic value of any reserves found. Productive wells include wells that have been drilled to the targeted depth and prove, in our opinion, to be capable of producing either oil or gas in sufficient quantities that will justify completion as an oil or gas well. A dry well is an exploration, appraisal or development well that proves to be incapable of producing either oil or gas in sufficient quantities to justify completion as an oil or gas well.
| | | | | | | | | | | | | | | | | | | |
| | Offshore West Africa | |
|---|
| | 2013(2) | | 2012(3) | | 2011 | |
|---|
Wells Drilled | | Gross | | Net | | Gross | | Net | | Gross | | Net | |
|---|
Exploration(1) | | | | | | | | | | | | | | | | | | | |
Productive | | | 3 | | | 1.0125 | | | 2 | | | 0.8 | | | — | | | — | |
Dry | | | — | | | — | | | — | | | — | | | — | | | — | |
Total | | | 3 | | | 1.0125 | | | 2 | | | 0.8 | | | — | | | — | |
- (1)
- We did not drill any development wells offshore West Africa during the fiscal years ended December 31, 2013, 2012, and 2011, respectively. The numbers in this table do not reflect our drilling of the surface hole of the Bicuar #1 exploration well in 2011, as we plugged and abandoned the well after drilling only 689 feet (210 meters).
- (2)
- The wells noted include our Mavinga #1, Lontra #1, and Diaman #1B exploration wells (all productive). The drilling results for 2013 do not include the results from our Bicuar #1A exploration well, which we announced on January 22, 2014 had discovered approximately 180 feet (56 meters) of net pay and confirmed the existence of both oil and condensate in multiple intervals. The drilling results from 2013 also do not include the results from our Orca #1 exploration well, which we announced on February 27, 2014 had discovered approximately 250 feet (76 meters) of net oil pay.
- (3)
- The wells noted include our Cameia #1 exploration well and Cameia #2 appraisal well.
The following table sets forth information with respect to the gross and net oil and gas wells that are currently drilling offshore West Africa (including wells that are temporarily suspended) as of the date of this Annual Report on Form 10-K, but does not include oil and gas wells that have been drilled to their targeted depth and have subsequently been either temporarily or permanently plugged and abandoned.
| | | | | |
| West Africa | |
|---|
| Gross(1) | | Net(1) | |
|---|
| | 1 | | | 0.40 | |
- (1)
- The well noted is the Orca #1 exploration well, which as of the date of this Annual Report on Form 10-K had reached total depth, but is still undergoing certain testing and evaluation.
Summary of Oil and Gas Reserves
The summary data with respect to our estimated proved reserves and future cash flows has been prepared by Netherland, Sewell & Associates, Inc. ("NSAI"), our independent reserve engineering firm, in accordance with the definitions and regulations of the Securities and Exchange Commission ("SEC") applicable to companies involved in oil and natural gas producing activities and adjusted for imbalances. The December 31, 2013 reserve report was completed on January 20, 2014, and a copy is included as an exhibit to this report.
18
Table of Contents
As of December 31, 2013, our estimated net proved undeveloped reserves totaled 7.9 MMBbls of oil and 3.4 Bcf of natural gas. The year ended December 31, 2013 was the first year we have established proved reserves and all of our proved reserves are attributable to our interest in the Heidelberg field in the U.S. Gulf of Mexico.
| | | | | | | | | | |
| | Estimated Net Proved Reserves
as of December 31, 2013 | |
|---|
| | Oil (MMBbls) | | Natural Gas (Bcf) | | Total (MMBOE) | |
|---|
Proved Developed | | | 0 | | | 0 | | | 0 | |
Proved Undeveloped | | | 7.9 | | | 3.4 | | | 8.5 | |
All estimated future net cash flows are attributable to projected production from the Heidelberg Field in the U.S. Gulf of Mexico. The table below provides information regarding estimated future net cash flows (excluding derivative contracts) and the benchmark prices used.
| | | | |
| | Estimated Future Net Cash Flows
(in millions, except $ per Bbl/Mcf) | |
|---|
Estimated Future Net Cash Flows | | $ | 522.0 | |
Standardized Measure | |
$ |
277.0 | |
PV-10 | |
$ |
277.0 | |
Benchmark oil price ($/Bbl) | |
$ |
103.90 | |
Benchmark natural gas price ($/Mcf) | | $ | 3.507 | |
The standardized measure of discounted net future cash flows ("Standardized Measure") is the present value of estimated future net cash inflows from proved oil and natural gas reserves, less future development and production costs and future income tax expenses, discounted at 10% per annum to reflect timing of future net cash flows. As of December 31, 2013, the Standardized Measure was approximately $277.0 million.
SEC reporting rules require companies to prepare reserve estimates using reserve definitions and pricing based on 12-month historical un-weighted first-day-of-the-month average prices, rather than year-end prices. Our estimated net proved reserves, future net cash flows, PV-10 and Standardized Measure were determined using index prices for oil and gas and were held constant throughout the life of the assets. For oil volumes, the average Light Louisiana Sweet spot price of $107.13 per barrel was used and was adjusted for quality, transportation fees, and a regional price differential. For gas volumes, the average Henry Hub spot price of $3.670 per MMBtu was used and was adjusted for energy content, transportation fees, and a regional price differential. For the proved reserves, the average spot prices are adjusted by energy content and weighted by production over the remaining lives of the properties to determine the benchmark prices used. Such benchmark prices are $103.90 per barrel of oil and $3.507 per Mcf of gas.
Present value of future net pre-tax cash flows attributable to our estimated net proved reserves (after deducting future development and production costs), discounted at 10% per annum ("PV-10") is a non-GAAP financial measure and is derived from the Standardized Measure, which is the most directly comparable GAAP financial measure. We believe that the presentation of PV-10 is relevant and useful to investors because it presents the relative monetary significance of our properties regardless of tax structure. Further, investors may utilize the measure as a basis for comparison of the relative size
19
Table of Contents
and value of our proved reserves to other companies. We use this measure when assessing the potential return on investment related to our oil and natural gas properties. However, PV-10 is not a substitute for the Standardized Measure. Our PV-10 and the Standardized Measure do not purport to present the fair value of our proved reserves. PV-10 is equal to the Standardized Measure as of December 31, 2013 as the tax basis in our interests in the Heidelberg Field and related net operating loss exceeds the future net cash flows (after deducting future development and production costs) and accordingly there is no tax effect on future cash flows as of December 31, 2013.
We use an Independent Qualified Estimator ("IQE") to generate and update our proved reserves. The IQE is a qualified, industry recognized, external consulting firm with extensive experience in the evaluation and estimation of reserves and resources. This approach provides us with an objective, independent assessment of the reserves which comprise our portfolio.
For the year ended December 31, 2013, we engaged NSAI to prepare independent estimates of the extent and value of the proved reserves of certain of our oil and gas properties. These reports were prepared at our request to estimate our proved reserves and related future net cash flows.
NSAI, our independent reserve engineers, was established in 1961. Over the past 50 years, NSAI has provided services to the worldwide petroleum industry that include the issuance of reserves reports and audits, acquisition and divestiture evaluations, simulation studies, exploration resources assessments, equity determinations, and management and advisory services. NSAI professionals subscribe to a code of professional conduct and NSAI is a Registered Engineering Firm in the State of Texas. NSAI is independent firm of petroleum engineers, geologists, geophysicists, and petrophysicists and does not own an interest in our properties and is not employed on a contingent fee basis.
Our Reserve Evaluation Policy outlines the process and standards by which reserves are estimated, classified and reported for all our proved reserves, whether they are operated by us or operated by others. Our Chief Operating Officer Van P. Whitfield is accountable for the Reserve Evaluation Policy. Mr. Whitfield has over 38 years of experience leading oil and gas exploration and production operations activities globally. He has a Bachelor of Science Degree in Petroleum Engineering from Louisiana State University.
The Reserve Estimation Policy is administered by the Reserves Process Chair ("RPC"). The RPC is accountable for the completion of the annual and any in-year reserve estimates conducted by the IQE. Our Executive Vice President, Execution and Appraisal, James H. Painter acts in the role of RPC. Mr. Painter has over 33 years of experience in the oil and gas industry. Mr. Painter has a Bachelor of Science Degree in Geology from Louisiana State University.
For each reserve evaluation, a qualified technical team is established to provide data to NSAI to enable NSAI to prepare its estimate of the extent and value of the proved reserves of certain of our oil and gas properties. Our qualified technical team works with NSAI to ensure the integrity, accuracy and timeliness of data we furnish to NSAI for purposes of their reserve estimation process. Our qualified technical team has over 100 combined years of industry experience among them with positions of increasing responsibility in engineering and evaluations. Each member of our team at a minimum holds a Bachelor of Science degree in petroleum engineering, geology or other relevant degree.
Our geotechnical, engineering and commercial inputs and interpretations required to calculate the reserves for our portfolio are compiled by our staff. This information is shared with the IQE in an open and collaborative manner, and the IQE is provided full access to complete and accurate information pertaining to the assets and to all applicable personnel. Any differences between reserve
20
Table of Contents
estimates internally generated by us and the IQE that exceed established threshold limits are reviewed to ensure the accuracy of the quantifiable data being used in the assessment; available data has been shared and discussed; and that methodologies and assumptions used in the estimations are clearly understood.
The NSAI technical persons primarily responsible for preparing the estimates set forth in the NSAI reserves report incorporated herein are Mr. Joseph J. Spellman and Mr. Ruurdjan (Rudi) de Zoeten. Mr. Spellman has been practicing consulting petroleum engineering at NSAI since 1989. Mr. Spellman is a Licensed Professional Engineer in the State of Texas (No. 73709) and has over 30 years of practical experience in petroleum engineering. He graduated from University of Wisconsin-Platteville in 1980 with a Bachelor of Science Degree in Civil Engineering. Mr. de Zoeten has been practicing consulting petroleum geology at NSAI since 2008. Mr. de Zoeten is a Licensed Professional Geoscientist in the State of Texas, Geology (No. 3179) and has over 25 years of practical experience in petroleum geosciences. He graduated from the University of Wisconsin, Madison, in 1986 with a Bachelor of Science Degree in Geology and from University of Texas at Austin in 1988 with a Master of Arts Degree in Geology. Both technical principals meet or exceed the education, training, and experience requirements set forth in the Standards Pertaining to the Estimating and Auditing of Oil and Gas Reserves Information promulgated by the Society of Petroleum Engineers; both are proficient in judiciously applying industry standard practices to engineering and geoscience evaluations as well as applying SEC and other industry reserves definitions and guidelines.
Our Audit Committee reviews the processes utilized in the development of our Reserve Evaluation Policy and the Reserve Report prepared by the IQE annually.
Under the SEC rules, proved reserves are those quantities of oil and natural gas, which, by analysis of geoscience and engineering data, can be estimated with reasonable certainty to be economically producible from a given date forward, from known reservoirs, and under existing economic conditions, operating methods, and government regulations. The term "reasonable certainty" implies a high degree of confidence that the quantities of oil and/or natural gas actually recovered will equal or exceed the estimate. Reasonable certainty can be established using techniques that have proved effective by actual comparison of production from projects in the same reservoir interval, an analogous reservoir or by other evidence using reliable technology that establishes reasonable certainty. Reliable technology is a grouping of one or more technologies (including computational methods) that have been field tested and have been demonstrated to provide reasonably certain results with consistency and repeatability in the formation being evaluated or in an analogous formation.
In order to establish reasonable certainty with respect to our estimated proved reserves, NSAI uses technical and economic data including, but not limited to, well logs, geologic maps, seismic data, historical price and cost information, and property ownership interests. The reserves in this report have been estimated using a combination of deterministic and probabilistic methods; these estimates have been prepared in accordance with the Standards Pertaining to the Estimating of and Auditing of Oil & Gas Reserves information promulgated by the Society of Petroleum Engineers (SPE Standards). They used standard engineering and geoscience methods, or a combination of methods, including volumetric analysis, analogy and reservoir modeling that are considered to be appropriate and necessary to categorize and estimate reserves in accordance with SEC definitions and regulations. All of these reserves are for undeveloped locations; such reserves are based on estimates of reservoir volumes and recovery efficiencies along with analogy to properties with similar geologic and reservoir characteristics. As in all aspects of oil and gas evaluation, there are uncertainties inherent in the interpretation of engineering and geoscience data; therefore, the conclusions necessarily represent only informed professional judgment. See "Risk Factors—Risks Relating to Our Business—Our proved reserves are estimates. Any material inaccuracies in our reserves estimates or assumptions underlying our reserves
21
Table of Contents
estimates could cause the quantities and net present value of our reserves to be overstated or understated."
MATERIAL AGREEMENTS
Production Sharing Contract for Block 20 Offshore Angola
On December 15, 2011, the Council of Ministers of Angola published Decree Law No. 303/11 which granted the mining rights for the prospecting, research, development and production of hydrocarbons on Block 20 offshore Angola to Sonangol, as the national concessionaire, and appointed us as the operator of Block 20. On December 20, 2011, CIE Angola Block 20 Ltd., our wholly-owned subsidiary, executed the PSC with Sonangol, Sonangol P&P, BP and China Sonangol. Subsequent to its execution of the PSC, China Sonangol assigned its working interest in Block 20 to BP. The PSC forms the basis of our exploration, development and production operations on Block 20 offshore Angola. We are the operator of and own a 40% working interest in Block 20 offshore Angola. Under the PSC, we are required to drill four exploration wells (with at least one of these wells having a pre-salt objective) and acquire approximately 579 square miles (1,500 square kilometers) of 3-D seismic data all within five years of the signing of the PSC, subject to certain extensions. After this initial five year period ends, subject to any extensions, our rights in the block are only preserved with respect to the development areas on the block on which discoveries have been made and all other portions of the block will be forfeited. We have the right to a 30-year production period. In order to guarantee these exploration work obligations under the PSC, we and BP are required to post a financial guarantee of $360 million. Our share of this financial guarantee is 57.14%, or approximately $206 million. We have delivered a letter of credit to Sonangol for such amount. As we complete our work obligations under the PSC, the amount of this letter of credit will be reduced accordingly. We acquired approximately 1,500 square kilometers of 3-D seismic data in 2012, and, accordingly, our letter of credit was reduced by approximately $17.1 million on August 16, 2012. As a result of completing drilling activities on the Lontra #1 exploration well, we submitted a request to Sonangol on October 31, 2013 to approve the reduction of our letter of credit by approximately $68.6 million. This request is currently pending approval by Sonangol. In addition, pursuant to the PSC, we and BP are required to make certain contributions for bonus, scholarships and for social projects such as the Sonangol Research and Technology Center aggregating $607.5 million, comprised of $242.5 million in the first year after the signing of the PSC, $85 million on each of the first, second and third anniversaries of the signing of the PSC, and $110 million on the fourth anniversary of the signing of the PSC. We are obligated to pay 57.14% of the foregoing costs, less $10 million previously paid, or approximately $337 million. We shall recover all exploration, development, production, administration and services expenditures incurred under the PSC by taking up to a maximum amount of 50% of all liquid hydrocarbons produced from Block 20. In addition, proportionate with our working interest in Block 20, we will receive 40% of a variable revenue stream that the Contractor Group (as defined in the PSC) will be allocated from Sonangol based on the Contractor Group's rate of return, reduced by applicable Angolan taxes, calculated on a quarterly basis. The variable revenue stream paid by Sonangol to the Contractor Group ranges from 10% to 70%, and is inversely related to the applicable rate of return. We do not have contractual rights to sell natural gas from Block 20, but we have the right to use the natural gas during lease operations. Any stand-alone gas development cannot hinder or impede the development of liquid hydrocarbons on Block 20.
Risk Services Agreements for Blocks 9 and 21 Offshore Angola
On June 11, 2009, the Council of Ministers of Angola published Decree Law No. 15/09 and Decree Law No. 14/09 which granted the mining rights for the prospecting, exploration, development and production of hydrocarbons on Blocks 9 and 21 offshore Angola, respectively, to Sonangol, as the national concessionaire, and appointed us as the operator of Blocks 9 and 21, respectively. Pursuant to
22
Table of Contents
these Decree Laws, in October 2009, we completed negotiations with Sonangol and initialed the finalized RSAs for Blocks 9 and 21 offshore Angola. On December 16, 2009, the Council of Ministers of Angola approved the terms of the finalized RSAs. On February 24, 2010, we executed RSAs for Blocks 9 and 21 offshore Angola with Sonangol, Sonangol P&P, Nazaki and Alper. Cobalt, Sonangol P&P, Nazaki and Alper comprise the "Contractor Group" under the RSAs. The RSAs govern our 40% working interest in and operatorship of Blocks 9 and 21 offshore Angola and form the basis of our exploration, development and production operations on these blocks.
- •
- Under the RSA for Block 9, we are required to drill three wells, as well as acquire approximately 386 square miles (1,000 square kilometers) of seismic data within four years of its signing. This four year period may be extended by one extension of three years if we notify Sonangol in writing of such extension at least thirty days before the end of the four year period and if we have otherwise fulfilled our obligations under the agreement. After this initial four or seven year period ends, our rights in the block are only preserved with respect to the development areas on the block on which discoveries have been made and all other portions of the block will be forfeited. After this initial four or seven year period ends, we will also be required to commence production within four years of the date of the commercial discovery, subject to certain extensions. We have the right to a 20 year production period, commencing on the date of the declaration of commercial discovery for each respective development area. In order to guarantee our exploration work obligations under the RSA for Block 9, we and Nazaki are required to post a financial guarantee in the amount of approximately $87.5 million. Our share of this financial guarantee is approximately $54.7 million. In March 2010, we delivered a letter of credit to Sonangol for such amount. As we complete our work obligations under the RSA, the amount of this letter of credit will be reduced accordingly. We acquired approximately 2,500 square kilometers of 3-D seismic data on Block 9 in 2011, and, accordingly, our letter of credit was reduced by approximately $9.375 million on April 25, 2011. As is customary in Angola, we are required to make contributions for Angolan social projects and academic scholarships for Angolan citizens. We made such an initial contribution in March 2010 after the signing of the RSA and will make additional contributions upon each commercial discovery, upon project development sanction and each year after the commencement of production. We have a 40% working interest in Block 9, with Sonangol P&P, Nazaki and Alper holding lesser working interests in the block and sharing in the exploration, development and production costs associated with such block, subject to our obligation to carry a portion of Sonangol P&P's expenses through the exploration phase and Alper's expenses through the exploration phase and first development. Proportionate with our working interest in Block 9, we will receive 40% of a variable revenue stream that the Contractor Group will be allocated from Sonangol based on the Contractor Group's rate of return, calculated on a quarterly basis, and then reduced by applicable Angolan taxes and royalties. The Contractor Group's rate of return for each quarter will be determined by the Contractor Group's variable revenue stream from liquid hydrocarbon production less expenditures and Angolan taxes and royalties from the block. The variable revenue stream paid by Sonangol to the Contractor Group ranges from 72% to 95%, and is inversely related to the applicable rate of return. The Angolan taxes and royalties applicable to the variable revenue stream include the petroleum production tax (at a current tax rate of 20% applied to the Contractor Group's variable revenue stream), the petroleum transaction tax (at a current tax rate of 70% applied to the Contractor Group's variable revenue stream less expenditures less the Contractor Group's specified production allowance, which ranges from 55% to 95% of the Contractor Group's variable revenue stream depending inversely on the Contractor Group's rate of return) and the petroleum income tax (at a current tax rate of 65.75% applied to the Contractor Group's variable revenue stream less expenditures and less petroleum production and petroleum transaction taxes paid). We do not have contractual rights to sell natural gas from Block 9, but we have the right to use the natural gas during lease
23
Table of Contents
operations. Any stand-alone gas development cannot hinder or impede the development of liquid hydrocarbons on Block 9. See "Risk Factors—Risks Relating to Our Business—Under the terms of our various license agreements, we are required to drill wells and declare any discoveries in order to retain exploration and production rights and failure to do so may result in substantial license renewal costs or loss of our interests in the undeveloped parts of our license areas, which may include certain of our prospects."
- •
- Under the RSA for Block 21, we are required to drill four wells within five years of its signing. This five year period may be extended by one extension of three years if we notify Sonangol in writing of such extension at least thirty days before the end of the five year period and if we have otherwise fulfilled our obligations under the agreement. After this initial five or eight year period ends, our rights in the block are only preserved with respect to the development areas on the block on which discoveries have been made and all other portions of the block will be forfeited. After this initial five or eight year period ends, we will also be required to commence production within four years of the date of the commercial discovery, subject to certain extensions. We have the right to a 25 year production period, commencing on the date of the declaration of commercial discovery for each respective development area. In order to guarantee these exploration work obligations under the Risk Services Agreement for Block 21, we and Nazaki are required to post a financial guarantee in the amount of approximately $147.5 million. Our share of this financial guarantee is approximately $92.2 million. In March 2010, we delivered a letter of credit to Sonangol for such amount. As we complete our work obligations under the RSA, the amount of this letter of credit will be reduced accordingly. As a result of completing drilling operations on our Cameia #1 exploration well in 2012, our letter of credit was reduced by approximately $31.25 million on May 25, 2012. As a result of completing drilling activities on the Mavinga #1 and Bicuar #1A exploration wells, we submitted requests to Sonangol on October 31, 2013 and January 14, 2014, respectively, to approve the reduction of our letter of credit by approximately $20.3 million for each well (for an aggregate total of approximately $40.6 million). Each of these requests are currently pending approval by Sonangol. As is customary in Angola, we are required to make contributions for Angolan social projects and academic scholarships for Angolan citizens. We made such an initial contribution in March 2010 after the signing of the RSA and will make additional contributions upon each commercial discovery, upon project development sanction and each year after the commencement of production. We have a 40% working interest in Block 21, with Sonangol P&P, Nazaki and Alper holding lesser working interests in the block and sharing in the exploration, development and production costs associated with such block, subject to our obligation to carry a portion of Sonangol P&P's expenses through the exploration phase and Alper's expenses through the exploration phase and first development. Proportionate with our working interest in Block 21, we will receive 40% of a variable revenue stream that the Contractor Group will be allocated from Sonangol based on the Contractor Group's rate of return, calculated on a quarterly basis, and then reduced by applicable Angolan taxes and royalties. The Contractor Group's rate of return for each quarter will be determined by the Contractor Group's variable revenue stream from liquid hydrocarbon production less expenditures and Angolan taxes and royalties from the block. The variable revenue stream paid by Sonangol to the Contractor Group ranges from 60% to 96%, and is inversely related to the applicable rate of return. The Angolan taxes and royalties applicable to the variable revenue stream include the petroleum production tax (at a current tax rate of 20% applied to the Contractor Group's variable revenue stream), the petroleum transaction tax (at a current tax rate of 70% applied to the Contractor Group's variable revenue stream less expenditures less the Contractor Group's specified production allowance, which ranges from 35% to 90% of the Contractor Group's variable revenue stream depending inversely on the Contractor Group's rate of return) and the petroleum income tax (at a current tax rate of 65.75% applied to the Contractor Group's variable revenue stream less
24
Table of Contents
expenditures and less petroleum production and petroleum transaction taxes paid). We do not have contractual rights to sell natural gas from Block 21, but we have the right to use the natural gas during lease operations. Any stand-alone gas development cannot hinder or impede the development of liquid hydrocarbons on Block 21. See "Risk Factors—Risks Relating to Our Business—Under the terms of our various license agreements, we are required to drill wells and declare any discoveries in order to retain exploration and production rights and failure to do so may result in substantial license renewal costs or loss of our interests in the undeveloped parts of our license areas, which may include certain of our prospects."
COMPETITION
The oil and gas industry is highly competitive. We encounter strong competition from other independent and major oil and gas companies in acquiring properties and securing trained personnel. Many of these competitors have financial and technical resources and staffs substantially larger than ours. As a result, our competitors may be able to pay more for desirable oil and gas properties, or to evaluate, bid for and purchase a greater number of properties than our financial or personnel resources will permit. Furthermore, these companies may also be better able to withstand the financial pressures of unsuccessful drill attempts, delays, sustained periods of volatility in financial markets and generally adverse global and industry-wide economic conditions, and may be better able to absorb the burdens resulting from changes in relevant laws and regulations, which would adversely affect our competitive position.
We are also affected by competition for drilling rigs and the availability of related equipment and personnel. Our exploration success in the Kwanza basin offshore Angola could increase the demand for drilling rigs and related equipment and personnel offshore West Africa which, in turn, could increase the competition for drilling rigs or related oilfield equipment and personnel and adversely affect our ability to secure such equipment or hire such personnel on favorable terms. Furthermore, higher commodity prices generally increase the demand for drilling rigs, supplies, services, equipment and crews, and can lead to shortages of, and increasing costs for, drilling equipment, services and personnel. Over the past three years, oil and gas companies have experienced higher drilling and operating costs. Shortages of, or increasing costs for, experienced drilling crews and equipment and services could restrict our ability to drill wells and conduct our operations.
Competition is also strong for attractive oil and gas producing properties, undeveloped leases and drilling rights, and we cannot assure you that we will be able to compete satisfactorily when attempting to make further acquisitions.
TITLE TO PROPERTY
We believe that we have satisfactory title to our prospect interests in accordance with standards generally accepted in the oil and gas industry. We currently have federal oil and gas leases in 243 blocks within the deepwater U.S. Gulf of Mexico covering approximately 1.4 million gross acres (0.7 million net acres). In West Africa, we currently have a license on the Diaba Block offshore Gabon, and licenses for Blocks 9, 20 and 21 offshore Angola covering a total of approximately 5,652,687 gross (1,840,581 net) acres. We do not have contractual rights to sell natural gas on our Angola blocks, but we have the right to use the natural gas during lease and production operations. We do, however, have contractual rights to any natural gas from our Gabon license area and all of our U.S. Gulf of Mexico leases. Our prospect interests are subject to applicable customary royalty and other interests, liens under operating agreements, liens for current taxes, and other burdens, easements, restrictions and encumbrances customary in the oil and gas industry that we believe do not materially interfere with the use of or affect our carrying value of the prospect interests.
25
Table of Contents
CONTAINMENT RESOURCES
We are a member of several industry groups that provide general and specific oil spill and well containment resources in the U.S. Gulf of Mexico, including the Helix Well Containment Group ("HWCG"), Clean Gulf Associates ("CGA"), the Marine Preservation Association ("MPA"), and National Response Corporation ("NRC").
We are a member of HWCG Holdings, LLC, which in turn wholly owns HWCG, LLC. HWCG, LLC serves as the operating entity for the members of HWCG by carrying out day-to-day business activities and serving as a contracting party for various oil spill and well containment equipment and services on behalf of the HWCG members. Our relationship with HWCG provides us access to the Helix Producer 1, a production handling vessel, and the Helix Q4000, a multi-purpose field intervention and construction vessel. Together with various elements of relevant hardware such as hoses, connectors, risers, and similar equipment, the Helix Producer and the Helix Q4000 form the "Helix Fast Response System". The Helix Fast Response System is currently capable of facilitating control and containment of spills in water depths up to 10,000 feet and has two capping stacks, a 15,000 psig capping stack and a 10,000 psig capping stack. The 10,000 psig capping stack is designed to have capturing and processing capabilities of 130,000 barrels of oil per day and 180 million cubic feet of gas per day. The 15,000 psig capping stack is designed to have capturing and processing capabilities of 55,000 barrels of oil per day and 100 million cubic feet of gas per day. The capping stacks are designed to handle deep, higher-pressure wells and would be used in the event a blowout preventer is ineffective. In addition to us, members of HWCG include operators such as Marathon Oil Company and Noble Energy, Inc., among others.
As a member of MPA, we have access to the resources of the Marine Spill Response Corporation ("MSRC"). MSRC provides a wide variety of surface spill equipment, including a deepwater response fleet, aerial dispersant fleet, and approximately 75% of the existing dispersant material in the U.S. Gulf of Mexico region. NRC is an umbrella response corporation that provides us access to a wide variety of surface spill response equipment as well as a wide group of surface response contractors that can address a surface response as well as play a support role in addressing a subsea well containment event. In addition, we have existing contracts with a number of contractors which have equipment that could assist in well containment efforts as well as with the surface effects of a subsea blowout or in addressing a concurrent surface spill. Examples of such equipment include, but are not limited to, anchor and supply vessels, subsea transponders and communication equipment, subsea cutting equipment, debris removal equipment, air and water monitoring and scientific support vessels, remote-operated vehicles, storage and shuttle vessels, and subsea dispersant equipment.
For our operations offshore West Africa, we have contracts in place with Wild Well Control which provide for subsea well control planning, response management, and access to a 15,000 psig capping stack system, subsea debris removal equipment package, and subsea dispersant application equipment in air freight configuration for mobilization to Angola. We also have contracts in place for the provision of oil spill management, equipment and response services. Specifically, we have contracted with (i) Braemer-Howells, a U.K.-based company with staff in Angola, which provides us access to oil spill response management, equipment and services, (ii) the West and Central African Aerial Surveillance and Dispersant Service, a non-profit organization which provides aerial surveillance and chemical dispersant services offshore Angola utilizing aircraft based in Ghana, and (iii) Oil Spill Response Limited, a U.K.-based company which is wholly owned by exploration and production companies and provides us access to personnel and equipment for oil spill events. We have also developed an Oil Spill Response Plan to address any potential spill, and we have access to equipment which is pre-staged in Angola, including containment boom, skimming systems, chemical dispersant systems, and temporary oil storage systems.
26
Table of Contents
Furthermore, we also have contracts in place with Witt-O'Brien's, The Response Group and J. Connor Consulting for the provision of additional emergency response management services to help us address an incident in either the U.S. Gulf of Mexico or West Africa.
In considering the information above, specific reference should be made to the subsection of this Annual Report on Form 10-K titled "Risk Factors—Risks Relating to Our Business—We are subject to drilling and other operational hazards."
INSURANCE COVERAGE
For our U.S. Gulf of Mexico operations, we purchase insurance limits including a $650 million policy for operator's extra expense, which includes coverage for well control losses, re-drill and pollution clean-up expenses, $450 million of aggregated limits for third-party liability losses including coverage for bodily injury or death and property damage as well as seepage and clean-up of pollution on a sudden and accidental basis, and a $35 million policy for pollution damages as defined under the Oil Pollution Act of 1990 ("OPA"). In addition, we have identified certain of our unencumbered assets in the U.S. Gulf of Mexico to demonstrate $115 million of Oil Spill Financial Responsibility ("OSFR") through self-insurance to the Bureau of Ocean Energy Management ("BOEM") as permitted under the OPA. Towards the end of 2013, we also purchased insurance coverage for our working interest related to construction for our only U.S. Gulf of Mexico sanctioned development project, the Anadarko operated Heidelberg field development.
For our West Africa operations, we purchase operator's extra expense insurance of three times the amount of our nominal authorization-for-expenditure for each well or approximately $450 million to $550 million of limits, per well. In addition, we also purchase $50 million of third-party liability insurance coverage specifically for liabilities arising out of our Angolan operations. Upon anticipated sanction of our operated Cameia field development project in late 2014 or early 2015, we plan to purchase insurance coverage associated with those construction risks.
In general, our current insurance policies cover physical damage to our oil and gas assets. The coverage is designed to repair or replace assets damaged by insurable events. Certain of our stated insurance limits scale down to our working interest in the prospect being drilled, including coverage for well control losses, re-drill and pollution clean-up expenses and certain excess third-party liability coverage. All insurance recovery is subject to various deductibles or retentions as well as specific terms, conditions and exclusions associated with each individual policy. We believe that our coverage limits are sufficient and are consistent with what is held by our peers operating in the deepwater U.S. Gulf of Mexico and West Africa. However, there is no assurance that such coverage will adequately protect us against liability and loss from all potential consequences and damages associated with losses, should they occur. In considering the information above, specific reference should be made to the subsection of this Annual Report on Form 10-K titled "Risk Factors—Risks Relating to Our Business—We may incur substantial losses and become subject to liability claims as a result of future oil and natural gas operations, for which we may not have adequate insurance coverage" and "Risk Factors—Risks Relating to Our Business—We are subject to drilling and other operational hazards."
ENVIRONMENTAL MATTERS AND REGULATION
General
We are, and our future operations will be, subject to various stringent and complex international, foreign, federal, state and local environmental, health and safety laws and regulations governing matters including the emission and discharge of pollutants into the ground, air or water; the generation, storage, handling, use, transportation and disposal of regulated materials; and the health and safety of our employees. These laws and regulations may, among other things:
- •
- require the acquisition of various permits before drilling commences;
- •
- enjoin some or all of the operations of facilities deemed not in compliance with such laws and regulations or permits issued thereunder;
- •
- restrict the types, quantities and concentration of various substances that can be released into the environment in connection with oil and natural gas exploration, drilling, production and transportation activities;
27
Table of Contents
- •
- limit or prohibit drilling activities in certain locations lying within protected or otherwise sensitive areas; and
- •
- require remedial measures to mitigate pollution from our operations.
These laws and regulations may also restrict the rate of oil and natural gas production below the rate that would otherwise be possible. Compliance with these laws can be costly; the regulatory burden on the oil and gas industry increases the cost of doing business in the industry and consequently affects profitability.
Moreover, particularly in light of the Deepwater Horizon incident in the U.S. Gulf of Mexico, public interest in the protection of the environment has increased. Offshore drilling in some areas has been opposed by environmental groups and, in other areas, has been restricted. Our operations could be adversely affected to the extent laws are enacted or other governmental action is taken that prohibits or restricts offshore drilling or imposes environmental requirements that result in increased costs to the oil and gas industry in general, such as more stringent or costly waste handling, disposal, cleanup requirements or financial responsibility and assurance requirements.
Accidental spills or releases may occur in the course of our operations, and we cannot assure you that we will not incur substantial costs and liabilities as a result, including costs relating to claims for damage to natural resources, property and persons. Moreover, environmental laws and regulations are complex, change frequently and have tended to become more stringent over time. Accordingly, we cannot assure you that we have been or will be at all times in compliance with such laws, or that environmental laws and regulations will not change or become more stringent in the future in a manner that could have a material adverse effect on our financial condition and results of operations.
The following is a summary of some of the existing laws or regulatory issues to which we and our business operations are or may be subject to in the future.
Impact of the 2010 U.S. Gulf of Mexico Oil Spill
On April 20, 2010, the Transocean Deepwater Horizon, a semi-submersible offshore drilling rig operating in the deepwater U.S. Gulf of Mexico under contract to BP plc exploded, burned for two days and sank, resulting in loss of life, injuries and a large oil spill. The U.S. government and its regulatory agencies with jurisdiction over oil and gas exploration, including the U.S. Department of the Interior ("DOI") and two of its agencies, the BOEM and the Bureau of Safety and Environmental Enforcement ("BSEE"), which together formerly comprised the Bureau of Ocean Energy Management, Regulation and Enforcement ("BOEMRE"), responded to this incident by imposing moratoria on drilling operations. These agencies adopted numerous new regulations and new interpretations of existing regulations regarding operations in the U.S. Gulf of Mexico that are applicable to us and with which our new applications for exploration plans and drilling permits must prove compliant. These regulations include (i) the Increased Safety Measures for Energy Development on the Outer Continental Shelf—Final Rule, which sets forth increased safety measures for offshore energy development and requires, among other things, that all offshore operators submit written certifications as to compliance with the rules and regulations for operations occurring in the Outer Continental Shelf including the submission of independent third party written certifications as to the capabilities of certain safety devices, such as blowout preventers and their components, (ii) the workplace safety rule, which requires operators to develop and implement a comprehensive Safety and Environmental Management System, or SEMS, for oil and gas operations and codifies and makes mandatory the American Petroleum Institute's Recommended Practice 75, (iii) NTL No 2010-N06, which sets forth requirements for exploration plans, development and production plans and development operations coordination documents to include a blowout scenario, the assumptions and calculations that are used to determine the volume of the worst case discharge scenario, and proposed measures to prevent and mitigate a blowout and (iv) NTL No. 2010-N10, which requires that each operator submit adequate
28
Table of Contents
information demonstrating that it has access to and can deploy containment resources that would be adequate to promptly respond to a blowout or other loss of well control, adds additional requirements to oil spill response plans and requires that operators submit written certifications stating that the operator will conduct all authorized activities in compliance with all applicable regulations. While we have conducted our own internal SEMS assessment and conducted a third party SEMS audit in 2013 to ensure we are in compliance with all applicable regulations related to our SEMS, effective June 4, 2013, the so-called SEMS II Rule amended the work place safety rule to include additional safety requirements. Operators, including us, must comply with the SEMS II Rule by June 4, 2014, and have an independent audit completed by June 4, 2015. In addition, BSEE has recently proposed revisions to 30 CFR 250, subpart H on Oil and Gas Production Safety Systems to address recent technological advances in production safety systems and equipment used to collect and treat oil and gas from Outer Continental Shelf leases. This includes among other things, certain standards concerning the use of best available and safest technology, more rigorous design and testing requirements for boarding shut down valves, and an increase in approved leakage rates for certain safety valves. These and any additional new regulations may result in delays in the permitting process.
Compliance with the new and existing regulations and the interpretations of them may materially increase the cost of and time required to obtain drilling permits or conduct our drilling operations in the U.S. Gulf of Mexico, which may adversely affect our business, financial position or future results of operations.
Oil Pollution Act of 1990
The OPA and regulations thereunder impose liability on responsible parties for damages resulting from oil spills into or upon navigable waters or in the exclusive economic zone of the U.S. Liability under the OPA is strict, joint and several and potentially unlimited. A "responsible party" under the OPA includes the lessee or permittee of the area in which an offshore facility is located. The OPA also requires the lessee or permittee of the offshore area in which a covered offshore facility is located to establish and maintain evidence of financial responsibility to cover potential liabilities related to an oil spill for which such person would be statutorily responsible in an amount that depends on the risk represented by the quantity or quality of oil handled by such facility. The BSEE has promulgated regulations that implement the financial responsibility requirements of the OPA. A failure to comply with the OPA's requirements or inadequate cooperation during a spill response action may subject a responsible party to civil, administrative and/or criminal enforcement actions. There has also been a call from public interest groups, certain governmental officials and, in 2011, the National Commission on the BP Deepwater Horizon Spill and Offshore Drilling for, among other things, increased government oversight of the offshore oil and gas industry, to require more comprehensive financial assurance requirements, to raise or eliminate the economic damages liability cap under OPA, significantly raise daily penalties for OPA infractions and make the environmental review process more stringent. If adopted, certain of these proposals have the potential to adversely affect our operations by restricting areas in which we may carry out exploration or development activities and/or causing us to incur increased operating expenses. In order to satisfy OPA's requirement that we demonstrate at least $150 million of Oil Spill Financial Responsibility, we have (i) identified certain unencumbered assets in the U.S. Gulf of Mexico to the BOEM in order to demonstrate $115 million of Oil Spill Financial Responsibility through self-insurance, and (ii) procured the remaining $35 million of Oil Spill Financial Responsibility through third party insurance coverage.
Clean Water Act
The U.S. Federal Water Pollution Control Act of 1972, or Clean Water Act, as amended ("CWA"), imposes restrictions and controls on the discharge of pollutants, produced waters and other oil and natural gas wastes into waters of the U.S. These controls have become more stringent over the years,
29
Table of Contents
and it is possible that additional restrictions will be imposed in the future. Under the CWA, permits must be obtained to discharge pollutants into regulated waters. In addition, certain state regulations and the general permits issued under the federal National Pollutant Discharge Elimination System program prohibit discharge of produced waters and sand, drilling fluids, drill cuttings and certain other substances related to the oil and gas industry into certain coastal and offshore waters. The CWA provides for civil, criminal and administrative penalties for unauthorized discharges of oil and other hazardous substances and imposes liability on parties responsible for those discharges for the costs of cleaning up related damage and for natural resource damages resulting from the release. Comparable state statutes impose liabilities and authorize penalties in the case of an unauthorized discharge of petroleum or its derivatives, or other hazardous substances, into state waters.
Marine Protected Areas
Executive Order 13158, issued in 2000, directs federal agencies to safeguard existing Marine Protected Areas ("MPAs") in the U.S. and establish new MPAs. The order requires federal agencies to avoid harm to MPAs to the extent permitted by law and to the maximum extent practicable. It also directs the U.S. Environmental Protection Agency ("EPA") to propose regulations under the CWA to ensure appropriate levels of protection for the marine environment. This order and related CWA regulations have the potential to adversely affect our operations by restricting areas in which we may carry out future development and exploration projects and/or causing us to incur increased operating expenses.
Consideration of Environmental Issues in Connection with Governmental Approvals
Our operations frequently require licenses, permits and other governmental approvals. Several federal statutes, including the Outer Continental Shelf Lands Act ("OCSLA"), the National Environmental Policy Act ("NEPA"), and the Coastal Zone Management Act ("CZMA") require federal agencies to evaluate environmental issues in connection with granting such approvals or taking other major agency actions. OCSLA, for instance, requires the DOI to evaluate whether certain proposed activities would cause serious harm or damage to the marine, coastal or human environment, and gives the DOI authority to refuse to issue, suspend or revoke permits and licenses allowing such activities in certain circumstances, including when there is a threat of serious harm or damage to the marine, coastal or human environment. Similarly, NEPA requires DOI and other federal agencies to evaluate major agency actions having the potential to significantly impact the environment. In the course of such evaluations, an agency must prepare an environmental assessment and, potentially, an environmental impact statement. If such NEPA documents are required, the preparation of such could significantly delay the permitting process and involve increased costs. CZMA, on the other hand, aids states in developing a coastal management program to protect the coastal environment from growing demands associated with various uses, including offshore oil and natural gas development. In obtaining various approvals from the DOI, we will have to certify that we will conduct our activities in a manner consistent with any applicable CZMA program. Violation of these foregoing requirements may result in civil, administrative or criminal penalties.
Naturally Occurring Radioactive Materials
Wastes containing naturally occurring radioactive materials ("NORM") may also be generated in connection with our operations. Certain oil and natural gas exploration and production activities may enhance the radioactivity, or the concentration, of NORM. In the U.S., NORM is subject to regulation primarily under individual state radiation control regulations. In addition, NORM handling and management activities are governed by regulations promulgated by the Occupational Safety and Health Administration. These regulations impose certain requirements concerning worker protection; the
30
Table of Contents
treatment, storage and disposal of NORM waste; the management of waste piles, containers and tanks containing NORM; and restrictions on the uses of land with NORM contamination.
Resource Conservation and Recovery Act
The U.S. Resource Conservation and Recovery Act ("RCRA"), and comparable state statutes regulate the generation, transportation, treatment, storage, disposal and cleanup of hazardous and non-hazardous wastes. Under the auspices of the EPA, individual states administer some or all of the provisions of RCRA, sometimes in conjunction with their own more stringent requirements. Drilling fluids, produced waters, and most of the other wastes associated with the exploration, development and production of crude oil or natural gas are currently exempt from RCRA's requirements pertaining to hazardous waste and are regulated under RCRA's non-hazardous waste and other regulatory provisions. A similar exemption is contained in many of the state counterparts to RCRA. At various times in the past, proposals have been made to amend RCRA to rescind the exemption that excludes oil and natural gas exploration and production wastes from regulation as hazardous waste. Accordingly, it is possible that certain oil and natural gas exploration and production wastes now classified as non-hazardous could be classified as hazardous wastes in the future. Any such change could result in an increase in our costs to manage and dispose of wastes, which could have a material adverse effect on our results of operations and financial position. Also, in the course of our operations, we expect to generate some amounts of ordinary industrial wastes, such as waste solvents and waste oils, which may be regulated as hazardous wastes.
Air Pollution Control
The U.S. Clean Air Act ("CAA") and state air pollution laws adopted to fulfill its mandates provide a framework for national, state, regional and local efforts to protect air quality. Our operations utilize equipment that emits air pollutants subject to the CAA and other pollution control laws. These laws require utilization of air emissions abatement equipment to achieve prescribed emissions limitations and ambient air quality standards, as well as operating permits for existing equipment and construction permits for new and modified equipment. Regulatory agencies can impose administrative, civil and criminal penalties for non-compliance with air permits or other requirements of the CAA or other air pollution laws and regulations, including the suspension or termination of permits and monetary fines. Recently, the EPA also proposed new air regulations for oil and gas exploration, production, transmission and storage. These include new source performance standards for volatile organic compounds (VOCs) and sulfur dioxide and air toxics standards issued in April 2012 and updated VOC performance standards for storage tanks used in crude oil and natural gas production and transmission issued in August 2013. These regulations could require us to incur additional expenses to control air emissions by installing emissions control technologies and adhering to a variety of work practice and other requirements.
Superfund
The U.S. Comprehensive Environmental Response, Compensation and Liability Act of 1980, as amended ("CERCLA"), also known as "Superfund," imposes joint and several liability for response costs at certain contaminated properties and damages to natural resources, without regard to fault or the legality of the original act, on some classes of persons who are considered to be responsible for the release of a hazardous substance into the environment. These persons include the current or past owner or operator of the site where the release occurred and anyone who transported, disposed or arranged for the disposal of a hazardous substance at the site. CERCLA also authorizes the EPA and, in some instances, third parties to act in response to threats to the public health or the environment and to seek to recover from the responsible classes of persons the costs they incur and seek natural resource damages.
31
Table of Contents
Protected Species and Habitats
The U.S. federal Endangered Species Act, the federal Marine Mammal Protection Act, and similar federal and state wildlife protection laws prohibit or restrict activities that could adversely impact protected plant and animal species or habitats. Oil and natural gas exploration and production activities could be prohibited or delayed in areas where protected species or habitats may be located, or expensive mitigation may be required to accommodate such activities.
Climate Change
Our operations and the combustion of petroleum and natural gas-based products results in the emission of greenhouse gases ("GHG") that could contribute to global climate change. Climate change regulation has gained momentum in recent years internationally and domestically at the federal, regional, state and local levels. Various U.S. regions and states have already adopted binding climate change legislation. In addition, the U.S. Congress has at times considered the passage of laws to limit the emission of GHGs. In 2009, the U.S. House of Representatives passed, and the U.S. Senate considered but did not pass, legislation that proposed, among other things, a nationwide cap on carbon dioxide and other GHG emissions and a requirement that certain emitters of GHGs, including certain electricity generators and producers and importers of specified fuels, obtain "emission allowances" to meet that cap. It is possible that federal legislation related to GHG emissions will be considered by Congress in the future.
The EPA has issued final and proposed regulations pursuant to the CAA to limit carbon dioxide and other GHG emissions. Under EPA regulations finalized in May 2010 (referred to as the "Tailoring Rule"), the EPA began regulating GHG emissions from certain stationary sources in January 2011. Additionally, on April 1, 2010 and August 28, 2012, the EPA and the National Highway Traffic Safety Administration finalized GHG emissions standards for light-duty vehicles for model years 2012 through 2016 and 2017 through 2025, respectively. On August 9, 2011, these two agencies also announced national efficiency and emissions standards for medium- and heavy-duty engines and vehicles.
On September 22, 2009, the EPA issued a "Mandatory Reporting of Greenhouse Gases" final rule ("Reporting Rule"). The Reporting Rule establishes a comprehensive scheme requiring operators of stationary sources emitting more than established annual thresholds of carbon dioxide-equivalent GHGs to inventory and report their GHG emissions annually on a facility-by-facility basis. On November 9, 2010, the EPA expanded the Reporting Rule to certain oil and natural gas facilities, including producers and offshore exploration and production operations. In June 2013, the Obama Administration also released its Climate Action Plan ("CAP") that, among other things, calls upon the EPA to promulgate greenhouse gas regulations for new and existing power plants. The EPA published its proposed New Source Performance Standards ("NSPSs") for GHG emissions from new power plants on January 8, 2014 and is expected to publish proposed GHG regulations for existing power plants under the Clean Air Act, section 111 by June 2014. In addition, the CAP calls upon EPA and other governmental agencies to identify ways in which to reduce methane emissions from various sectors, including the oil and gas industry. Each of these laws, regulations and initiatives could adversely affect us directly as well as indirectly, as they could decrease the demand for oil and natural gas.
On the international level, various nations, including Angola and Gabon, have committed to reducing their GHG emissions pursuant to the Kyoto Protocol. The Kyoto Protocol was set to expire in 2012. In late 2011, an international climate change conference in Durban, South Africa resulted in, among other things, an agreement to negotiate a new climate change regime by 2015 that would aim to cover all major greenhouse gas emitters worldwide, including the U.S., and take effect by 2020. In November and December 2012, at an international meeting held in Doha, Qatar, the Kyoto Protocol was extended by amendment until 2020. In addition, the Durban agreement to develop the protocol's successor by 2015 and implement it by 2020 was reinforced at a November 2013 international climate
32
Table of Contents
change conference in Warsaw, Poland. U.S. federal climate change legislation or regulation or climate change legislation or regulation in other regions in which we conduct business could have an adverse effect on our results of operations, financial condition and demand for oil and natural gas.
Health and Safety
Our operations are and will be subject to the requirements of the federal U.S. Occupational Safety and Health Act ("OSH Act") and comparable foreign and state statutes. These laws and their implementing regulations strictly govern the protection of the health and safety of employees. In particular, the OSH Act hazard communication standard, EPA community right-to-know regulations under Title III of the Superfund Amendments and Reauthorization Act of 1986 and similar state statutes require that we organize and/or disclose information about hazardous materials used or produced in our operations. Such laws and regulations also require us to ensure our workplaces meet minimum safety standards and provide for compensation to employees injured as a result of our failure to meet these standards as well as civil and/or criminal penalties in certain circumstances.
Other Regulation of the Oil and Gas Industry
The oil and gas industry is regulated by numerous federal, state and local authorities. Legislation affecting the oil and gas industry is under constant review for amendment or expansion, frequently increasing the regulatory burden. Also, numerous departments and agencies, both federal and state, are authorized by statute to issue rules and regulations binding on the oil and gas industry and its individual members, some of which carry substantial penalties for failure to comply. Although the regulatory burden on the oil and gas industry may increase our cost of doing business by increasing the future cost of transporting our production to market, these burdens generally do not affect us any differently or to any greater or lesser extent than they affect other companies in the industry with similar types, quantities and locations of production.
Homeland Security Regulations
The Department of Homeland Security Appropriations Act of 2007 requires the Department of Homeland Security ("DHS") to issue regulations establishing risk-based performance standards for the security of chemical and industrial facilities, including oil and natural gas facilities that are deemed to present "high levels of security risk." The DHS is currently in the process of adopting regulations that will determine whether our operations may in the future be subject to DHS-mandated security requirements. Presently, it is not possible to accurately estimate the costs we could incur, directly or indirectly, to comply with any such facility security laws or regulations, but such expenditures could be substantial.
Development and Production
Development and production operations are subject to various types of regulation at federal, state and local levels. These types of regulation include requiring permits for the drilling of wells, the posting of bonds in connection with various types of activities and filing reports concerning operations. U.S. laws under which we operate may also regulate one or more of the following:
- •
- the location of wells;
- •
- the method of drilling and casing wells;
- •
- the surface use and restoration of properties upon which wells are drilled;
- •
- the plugging and abandoning of wells; and
- •
- notice to surface owners and other third parties.
33
Table of Contents
Regulation of Transportation and Sale of Natural Gas
The availability, terms and cost of transportation significantly affect sales of natural gas. Federal and state regulations govern the price and terms for access to natural gas pipeline transportation. The interstate transportation and sale for resale of natural gas is subject to federal regulation, including regulation of the terms, conditions and rates for interstate transportation, storage and various other matters, primarily by the Federal Energy Regulatory Commission, or FERC. The FERC's regulations for interstate natural gas transmission in some circumstances may also affect the intrastate transportation of natural gas. Upon us reaching the production stage of our business model, such regulations will be applicable to us.
Although gas prices are currently unregulated, Congress historically has been active in the area of gas regulation. We cannot predict whether new legislation to regulate natural gas might be proposed, what proposals, if any, might actually be enacted by Congress or the various state legislatures, and what effect, if any, the proposals might have on the operations of the underlying properties. Sales of condensate and natural gas liquids are not currently regulated and are made at market prices.
U.S. Coast Guard and the U.S. Customs Service
The transportation of drilling rigs to the sites of our prospects in the U.S. Gulf of Mexico and our operation of such drilling rigs is subject to the rules and regulations of the U.S. Coast Guard and the U.S. Customs Service. Such regulation sets safety standards, authorizes investigations into vessel operations and accidents and governs the passage of vessels into U.S. territory. We are required by these agencies to obtain various permits, licenses and certificates with respect to our operations.
Laws and Regulations of Angola and Gabon
Our exploration and production activities offshore Angola and Gabon are subject to Angolan and Gabonese regulations, respectively. Failure to comply with these laws and regulations may result in the suspension or termination of our operations and subject us to administrative, civil and criminal penalties. Moreover, these laws and regulations could change in ways that could substantially increase our costs or affect our operations. The following are summaries of certain applicable regulatory frameworks in Angola and Gabon.
Angola
In Angola, petroleum exploration and development activities are governed by the Petroleum Activities Law (the "Angola PAL"). Pursuant to the Angola PAL, all hydrocarbons located underground are property of the State of Angola, and exploitation rights can only be granted by the President of the Republic to Sonangol, as the national concessionaire. Foreign companies may only engage in petroleum activities in Angola in association with Sonangol through a commercial company or consortium, and generally upon entering a production sharing contract or a risk services agreement.
The Angolan PAL and the regulations thereunder extensively regulate the activities of oil and gas companies operating in Angola, including financial and insurance requirements, local content and involvement requirements, exploration and development processes, and operational matters. Local content regulations stipulate which goods or services relating to the oil and gas industry must be provided by Angolan companies (being companies which are beneficially owned in their majority by Angolan citizens), whether on a sole basis or in association with foreign contractors, and which goods or services may be provided by foreign companies. Goods or services which may be provided by foreign companies are generally subject to a local preference rule, whereby Angolan companies are granted preference in tendering for such activities or services, provided that the price difference in such tender does not exceed 10% of the total tendered amount. The power to make many of the day-to-day
34
Table of Contents
decisions concerning petroleum activities, including the granting of certain consents and authorizations, is vested with Sonangol.
The petroleum agreements entered with Sonangol set forth the main provisions for exploration and production activities, including fiscal terms, mandatory State participation, obligations to meet domestic supply requirements, local training and spending obligations, and ownership of assets used in petroleum operations. Angolan law and these agreements also contain important limitations on assignment of interests in such licenses, including in most cases the need to obtain the consent of Angolan authorities.
Certain industry-specific and general application statutes and regulations govern health, safety and environmental matters under Angolan law. Prior to commencing petroleum operations in Angola, contractors must, among other things, prepare an environmental impact assessment and establish and implement a health and safety plan. Such environmental laws govern the disposal of by-products from petroleum operations and required oil spill preparedness capabilities. Failure to comply with these laws may result in civil and criminal liability, including, without limitation, fines or penalties.
Angola enacted a new Foreign Exchange Law for the Petroleum Sector in 2012, Law N° 2/12, of January 13, 2012, which requires, among other things, that all foreign exchange operations be carried out through Angolan banks, that oil and gas companies open local bank accounts in foreign currencies in order to pay local taxes and to pay for goods and services supplied by non-resident suppliers and service providers, and also that oil and gas companies open local bank accounts in local currency in order to pay for goods and services supplied by resident suppliers and service providers. As a consequence, foreign currency proceeds obtained by oil and gas companies from the sale of their share of production cannot be retained in full outside Angola, as a portion of the proceeds required to settle tax liabilities and pay for local petroleum operations-related expenses must be deposited in and paid through Angolan banks. Furthermore, oil and gas companies are required to convert funds into local currency and deposit such funds in local bank accounts in order to pay for local petroleum operations-related expenses. The Foreign Exchange Law for the Petroleum Sector was further supplemented by Banco Nacional de Angola's Order 20/2012, of April 25, 2012, which details the procedures and mechanisms that must be adopted by oil and gas companies and sets forth a schedule for their phased implementation. Under the new statute, since October 1, 2012, oil companies (including operators) are required to make all payments for goods and services supplied by foreign exchange residents (as defined in the Foreign Exchange Law) out of bank accounts domiciled in Angola, whether in national or foreign currency. As of July 1, 2013, oil and gas exploration and production companies (including operators) are now required to make all payments for goods and services provided by foreign exchange residents in local currency. From October 1, 2013 onwards, operators are required to make all payments for goods and services related to Angolan operations provided by non-residents out of bank accounts domiciled in Angola.
On October 8, 2013, Angola enacted Executive Decree 333/13 ("ED 333/13") which enforces a consumption tax on oil companies. ED 333/13 requires companies that provide taxable services to oil companies to assess the applicable consumption tax, and oil companies, as beneficiary of those services, must pay the net value of the service to the service provider and remit the consumption tax to the Angolan government. The services that are subject to the consumption tax include, but are not limited to, consultancy services, supply of energy, water and telecommunications, leasing of machines and other equipment, private security services and travel services. The applicable consumption tax rates are 5% or 10% of the value of the services depending on the nature of the service rendered.
Executive Decree no. 224/12 of 16 July approved the Operational Discharge Management Regulations. This statute applies to all operational discharges generated during petroleum operations, both onshore and offshore. It sets the zero discharge prohibition establishing that all operational discharges resulting from onshore activities into the ground, inland waters and coastal waters are prohibited, except where duly justified for safety reasons. Discharges of (i) drill cuttings contaminated
35
Table of Contents
with non-water based drilling muds; (ii) non-water based drilling fluids; and (iii) sands produced resulting from operations in the maritime zone are prohibited and must be treated as hazardous waste. This statute requires operators such as ourselves to prepare an Operational Discharge Management Plan for all facilities or groups of facilities under its responsibility. The statute also establishes that the direct discharge of chemical products into the sea and the use of compounds where the content in aromatics is greater than 1% (one percent) as a base for the manufacture of drilling fluids are prohibited. Subsequent to the enactment of this statute, the Angolan Ministry of Petroleum has granted a moratorium on the implementation of these regulations which is currently scheduled to be in effect until January 16, 2015, which maybe further extended.
See "Risk Factors—Risks Related to Our Business—Participants in the oil and gas industry are subject to complex laws that can affect the cost, manner or feasibility of doing business."
Gabon
In Gabon, exploration and development activities are governed by the Law on Petroleum Exploration and Production Activities. Petroleum resources in Gabon are the property of the State of Gabon and petroleum companies undertake operations on behalf of the Government of Gabon. In order to conduct petroleum operations, oil and gas companies must enter into a petroleum agreement, typically a production sharing contract ("PSC"), with the Ministries of Petroleum, Finance and Domains. Such agreement must approved by the Gabon legislature.
A number of other regulations deal with other matters regarding petroleum activities such as taxes, charges, customs, State participation, petroleum exports, local content, training, foreign exchange, safety and environment. Recent changes to local content regulations generally require a 90/10 ratio of Gabon national to foreign expatriate workers involved in petroleum activities. The powers to make many of the day-to-day decisions concerning petroleum activities, including the granting of certain consents and authorizations, are vested with the Hydrocarbons General Directorate, a government authority. In addition, a national oil company—Société Nationale des Hydrocarbures du Gabon—has recently been created to hold, manage and take participations in petroleum activities on behalf of the State.
Petroleum agreements, including PSCs, set forth the main provisions for exploration and production activities, including obligations to meet domestic supply requirements, mandatory State participation; fiscal terms such as production sharing, royalty, bonuses and other charges, limitations on the number of foreign nationals to be employed, local training and spending obligations, and ownership of assets used in petroleum operations. There are important limitations on assignment of interests in a petroleum agreement, including the need to obtain the consent of Gabonese authorities.
Gabon's legislature is considering the enactment of the Hydrocarbons Code, a more comprehensive law governing exploration and development activities in Gabon. Such law is expected to become effective in the near future. However, as a draft of this law has not yet been disclosed publicly, we are unable to determine its contents or likely impact. There can be no assurance that this new law will not materially adversely impact our licenses in Gabon or rights under Gabonese law.
EMPLOYEES
As of December 31, 2013, we had 178 employees. None of these employees are represented by labor unions or covered by any collective bargaining agreement. We believe that relations with our employees are satisfactory. In addition, as of December 31, 2013, we had 114 contractors, consultants and secondees working in our offices and field locations. Our employee base grew by approximately 41% during the year ended December 31, 2013 and has grown by approximately 218% since December 31, 2009.
36
Table of Contents
CORPORATE INFORMATION
We were incorporated pursuant to the laws of the State of Delaware as Cobalt International Energy, Inc. in August 2009 to become a holding company for Cobalt International Energy, L.P. Cobalt International Energy, L.P. was formed as a limited partnership on November 10, 2005 pursuant to the laws of the State of Delaware. Pursuant to the terms of a corporate reorganization that we completed in connection with our initial public offering, all of the interests in Cobalt International Energy, L.P. were exchanged for common stock of Cobalt International Energy, Inc. and, as a result, Cobalt International Energy, L.P. is wholly-owned by Cobalt International Energy, Inc.
AVAILABLE INFORMATION
We make certain filings with the SEC, including our Annual Report on Form 10-K, quarterly reports on Form 10-Q, current reports on Form 8-K, and all amendments and exhibits to those reports. We make such filings available free of charge through our website,http://www.cobaltintl.com, as soon as reasonably practicable after they are filed with the SEC. The filings are also available through the SEC at the SEC's Public Reference Room at 100 F Street, N.E., Washington, D.C. 20549 or by calling 1-800-SEC-0330. Also, these filings are available on the internet at http://www.sec.gov. Our press releases and recent analyst presentations are also available on our website. The information on our website does not constitute a part of this Annual Report on Form 10-K.
EXECUTIVE OFFICERS
The following table sets forth certain information concerning our executive officers as of the date of this Annual Report.
| | | | | |
Name | | Age | | Position |
|---|
Joseph H. Bryant | | | 58 | | Chairman of the Board of Directors and Chief Executive Officer |
Van P. Whitfield | | | 62 | | Chief Operating Officer and Executive Vice President |
John P. Wilkirson | | | 56 | | Chief Financial Officer and Executive Vice President |
James H. Painter | | | 56 | | Executive Vice President, Execution & Appraisal |
James W. Farnsworth | | | 58 | | Chief Exploration Officer and Executive Vice President, Exploration and New Ventures |
Gregory S. Sills | | | 56 | | Executive Vice President and Chief Development Officer |
Michael D. Drennon | | | 58 | | Executive Vice President, Developments |
Jeffrey A. Starzec | | | 37 | | Senior Vice President and General Counsel |
Richard A. Smith | | | 54 | | Senior Vice President and President, Cobalt Angola |
Lynne L. Hackedorn | | | 55 | | Vice President, Government and Public Affairs |
Joseph H. Bryant has served as Chief Executive Officer and Chairman of our Board of Directors since our inception in November 2005. Mr. Bryant has 36 years of experience in the oil and gas industry. Prior to joining Cobalt, from September 2004 to September 2005, he was President and Chief Operating Officer of Unocal Corporation, an oil and gas exploration and production company. From May 2000 to August 2004, Mr. Bryant was President of BP Exploration (Angola) Limited, from January 1997 to May 2000, Mr. Bryant was President of BP Canada Energy Company (including serving as President of Amoco Canada Petroleum Co. between January 1997 and May 2000, prior to its merger with BP Canada), and from 1993 to 1996, Mr. Bryant served as President of a joint venture between Amoco Orient Petroleum Company and the China National Offshore Oil Corporation focused on developing the offshore Liuhua fields. Prior to 1993, Mr. Bryant held executive leadership positions in Amoco Production Company's business units in The Netherlands and the Gulf of Mexico, serving in
37
Table of Contents
many executive capacities and in numerous engineering, financial and operational roles throughout the continental United States. Mr. Bryant served on the board of directors of Berry Petroleum Company from October 2005 until May 2011. Mr. Bryant currently also serves on the board of directors of the American Petroleum Institute. Mr. Bryant holds a Bachelor of Science in Mechanical Engineering from the University of Nebraska.
Van P. Whitfield has served as Chief Operating Officer and Executive Vice President since September 2011. Mr. Whitfield served as our Executive Vice President, Operations and Development from May 2006 until September 2011. Mr. Whitfield has over 39 years of experience leading oil and gas production operations and marketing activities in North America, the United Kingdom and Europe, the Middle East and Asia. Prior to joining Cobalt, from May 2003 to May 2005, Mr. Whitfield served as Senior Vice President, Western Operations of CDX Gas LLC, an independent oil and gas company. From October 2002 to April 2003 he served as Production Unit Leader for the Angola Liquid Natural Gas Project, BP Exploration (Angola) Limited and from June 2001 to October 2002, he held the position of Vice President, Power and Water of ExxonMobil Saudi Arabia (Southern Ghawar) Ltd, an exploration and production company. Mr. Whitfield has also held the positions of Senior Vice President of BP Global Power, President and General Manager of Amoco Netherlands BV and Production Manager of Amoco (U.K.) Exploration Company, both exploration and production companies. In addition, he has held numerous operational and technical leadership positions in various Amoco Production Company locations, including: the position of Production Manager, West Texas and Engineering Manager, Worldwide. Mr. Whitfield has a Bachelor of Science Degree—Petroleum Engineering from Louisiana State University and is a graduate of the Executive Program at Stanford University.
John P. Wilkirson has served as Executive Vice President and Chief Financial Officer since June 2010. From 2007 until June 2010, Mr. Wilkirson served as our Vice President, Strategic Planning and Investor Relations. Mr. Wilkirson has 33 years of experience in the energy industry. Prior to joining Cobalt, from 1998 to 2005, Mr. Wilkirson was Vice President, Strategic Planning and Economics of Unocal Corporation, where his primary responsibilities included identifying and addressing major strategic issues, managing the global asset and investment portfolio, leading the economic analysis and evaluations function and overseeing performance management. He played an instrumental role as the integration executive for Unocal Corporation's merger into Chevron Corporation. Prior to Unocal Corporation, from 1992 to 1997, Mr. Wilkirson was an Engagement Manager at McKinsey & Company, Inc., a management consulting firm, serving energy clients on strategy and performance improvement engagements. Additional industry experience includes positions at Exxon Company USA from 1980 to 1984 and Sohio Petroleum Company and BP from 1984 to 1991, in petroleum engineering and commercial assignments. Mr. Wilkirson has a Bachelor of Science with Highest Honors in Petroleum Engineering and a Master of Business Administration from the University of Texas at Austin.
James H. Painter has served as Executive Vice President, Execution & Appraisal since April 2013. Mr. Painter previously served as our Executive Vice President, Gulf of Mexico from our inception in November 2005 until April 2013. Mr. Painter has more than 34 years of experience in the oil and gas industry. Prior to joining Cobalt, from February 2004 to September 2005, Mr. Painter was the Senior Vice President of Exploration and Technology at Unocal Corporation. Prior to his position at Unocal Corporation (following the merger between Ocean Energy Inc. and Devon Energy Corporation), from April 2003 to October 2003, Mr. Painter served as the Vice President of Exploration at Devon Energy Corporation, an oil and gas exploration and production company. From January 1995 to April 2003, Mr. Painter served in various manager and executive positions at Ocean Energy Inc. (and its predecessor Flores and Rucks, Inc.) with his final position as Senior Vice President of Gulf of Mexico and International Exploration. Additional industry experience includes positions at Forest Oil Corporation, an independent oil and gas exploration and production company, Mobil Oil Corporation
38
Table of Contents
and Superior Oil Company, Inc. Mr. Painter holds a Bachelor of Science in Geology from Louisiana State University.
James W. Farnsworth has served as our Chief Exploration Officer and Executive Vice President, Exploration & New Ventures since April 2013. Mr. Farnsworth previously served as Chief Exploration Officer from our inception in November 2005 until April 2013. Mr. Farnsworth has had more than 33 years of experience in the oil and gas industry. From 2003 to 2005, Mr. Farnsworth held the position of Vice President of World-Wide Exploration and Technology, at BP p.l.c., a global energy company, responsible for BP p.l.c.'s global exploration business inclusive of North America, West Africa, North Africa, South America, Russia and the Far East. His prior positions at BP p.l.c., from 1983 to 2003, include: Vice President of North America Exploration; Vice President of Gulf of Mexico Exploration; Exploration Manager for Alaska; Deepwater Gulf of Mexico Production Manager for Non-operated Fields. Mr. Farnsworth has a Bachelor of Science Degree in Geology from Indiana University and a Masters of Science Degree in Geophysics from Western Michigan University.
Gregory S. Sills has served as Executive Vice President and Chief Development Officer since January 2014. Prior to joining Cobalt, Mr. Sills served as Vice President, Upstream Developments for Marathon Oil Company from 2009 until December 2013. Prior to this, Mr. Sills served as Vice President, Projects for BP p.l.c. from 2007 to 2009. Mr. Sills' additional industry experience includes various manager and executive positions at BP, Phillips Petroleum Company and Atlantic Richfield Company (ARCO) developing oil and gas assets in the United States, United Kingdom, China and Latin America. He is a director of the Engineering and Construction Contracting Association (ECC). Mr. Sills received a Bachelor of Science Degree in Construction Engineering from California Polytechnic State University, and attended a proprietary leadership development program at the Massachusetts Institute of Technology.
Michael D. Drennon has served as Executive Vice President, Developments since April 2013. Mr. Drennon previously served as Executive Vice President, West Africa from April 2010 until April 2013 and has 37 years of industry experience. Prior to joining Cobalt, Mr. Drennon served as Vice President, Operations for Parker Drilling Company from 2005 until April 2010. Mr. Drennon's additional industry experience includes various executive positions at BP and Amoco in the United States, United Kingdom, China, Trinidad, Norway and Angola. Mr. Drennon received a Bachelor of Science Degree in Petroleum Engineering from Texas Tech University in 1977.
Jeffrey A. Starzec has served as Senior Vice President and General Counsel since January 2012. Mr. Starzec also serves as our Corporate Secretary. From June 2009 until December 2011, Mr. Starzec served as our Associate General Counsel and Corporate Secretary. Prior to joining Cobalt, Mr. Starzec practiced corporate and securities law at Vinson & Elkins LLP from July 2006 until June 2009, where he represented a variety of energy companies, including Cobalt in connection with its strategic alliance with Total in the U.S. Gulf of Mexico. Mr. Starzec began his legal career at Baker Botts LLP in 2002 and holds a Bachelor of Science in Economics from Duke University and a J.D. from Harvard Law School.
Richard A. Smith has served as our Senior Vice President and President, Cobalt Angola since November 2013. Mr. Smith previously served as Vice President, Investor Relations, Compliance and Risk Management from December 2012 to November 2013. Mr. Smith served as Vice President, Investor Relations and Planning from October 2011 until December 2012. Mr. Smith served as Vice President, International Business Development, Commercial and Finance from September 2010 until October 2011. From October 2007 until September 2010, Mr. Smith served as our Vice President. Mr. Smith has over 31 years of oil and gas industry experience in North American and international markets. Prior to joining Cobalt, from September 2005 to September 2007, Mr. Smith was Vice President, Joint Venture Development Corporate Affairs for the BP Russia Offshore Strategic Performance Unit, an oil and gas exploration and production unit of BP. From February 2002 to August
39
Table of Contents
2005, he held the position of Vice President and then Executive Director for BP Exploration (Angola) Limited, an oil and gas exploration and production company operating in Angola. Mr. Smith's additional industry experience includes leadership positions at various companies in the oil and gas industry operating in Azerbaijan, Georgia, Turkey, the United Kingdom, the United States and Canada. Mr. Smith holds a Bachelor of Commerce from the University of Calgary.
Lynne L. Hackedorn has served as Vice President, Government and Public Affairs since October 2011. Ms. Hackedorn served as our Vice President, Government, Public Affairs and Land from September 2010 until October 2011. From April 2006 until September 2010, Ms. Hackedorn served as our Vice President, Land. Ms. Hackedorn has over 29 years of experience in the oil and gas industry. Prior to joining Cobalt, from 2001 to 2006, Ms. Hackedorn served as Senior Landman at Hydro Gulf of Mexico, L.L.C., formerly Spinnaker Exploration Company, L.L.C., an oil and gas exploration and production company, handling a variety of land functions within both the shelf and deepwater areas of the Gulf of Mexico. From 1998 to 2001, Ms. Hackedorn held management positions within the offshore Gulf of Mexico regions of Sonat Exploration GOM, Inc. and El Paso Production GOM, Inc., both oil and gas exploration and production companies. From 1994 to 1998, Ms. Hackedorn was a Landman with Zilkha Energy Company, also an oil and gas exploration and production company. Ms. Hackedorn began her career as a Landman in 1984 at ARCO Oil and Gas Company, where she worked in the onshore South Texas region from 1984 until 1990, and then in the offshore Gulf of Mexico region from 1990 until 1994. Ms. Hackedorn currently also serves on the board of directors of National Ocean Industries Association. Ms. Hackedorn earned her Bachelor of Science in Petroleum Land Management from the University of Houston, graduating Magna Cum Laude.
Item 1A. Risk Factors
You should consider and read carefully all of the risks and uncertainties described below, together with all of the other information contained in this Annual Report on Form 10-K, including the consolidated financial statements and the related notes appearing at the end of this Annual Report on Form 10-K. If any of the following risks actually occurs, our business, business prospects, stock price, financial condition, results of operations or cash flows could be materially adversely affected. The risks below are not the only ones facing our company. Additional risks not currently known to us or that we currently deem immaterial may also adversely affect us. This Annual Report on Form 10-K also contains forward-looking statements, estimates and projections that involve risks and uncertainties. Our actual results could differ materially from those anticipated in the forward-looking statements as a result of specific factors, including the risks described below.
Risks Relating to Our Business
Failure to effectively execute our appraisal and development projects could result in significant delays and/or cost over-runs, including the delay of any future production, which could negatively impact our operating results, liquidity and financial position.
We currently have an extensive inventory of appraisal and development projects including Heidelberg, Shenandoah, North Platte, and Cameia, all of which are in the early stages of the project development life-cycle, except for our Heidelberg project. We also have made discoveries at Mavinga, Lontra, Bicuar, Orca and Diaman, which are in various stages of evaluation. Our development projects and discoveries will require substantial additional evaluation and analysis, including appraisal drilling and the expenditure of substantial amounts of capital, prior to preparing a development plan and seeking formal project sanction. First production from these development projects and discoveries is not expected for several years. All of our development projects and discoveries are located in challenging deepwater environments and, given the magnitude and scale of the initial discoveries, will entail significant technical and financial challenges, including extensive subsea tiebacks to an FPSO or production platform, pressure maintenance systems, gas re-injection systems, and other specialized infrastructure. This may include the advancement of technology and equipment necessary to withstand the higher pressures associated with producing oil and gas from Inboard Lower Tertiary horizons.
40
Table of Contents
This level of development activity and complexity requires significant effort from our management and technical personnel and places additional requirements on our financial resources and internal financial controls. In addition, we have increased dependency on third-party technology and service providers and other supply chain participants for these complex projects. We may not be able to fully execute these projects due to:
- •
- inability to obtain sufficient and timely financing;
- •
- inability to attract and/or retain sufficient quantity of personnel with the skills required to bring these complex projects to production on schedule and on budget;
- •
- significant delays in delivery of essential items or performance of services, cost overruns, supplier insolvency, or other critical supply failure could adversely affect project development;
- •
- inability to advance certain technologies;
- •
- lack of partner or government approval for projects;
- •
- civil disturbances, anti-development activities, legal challenges or other interruptions which could prevent access; and
- •
- drilling hazards or accidents or natural disasters.
We may not be able to compensate for, or fully mitigate, these risks.
We have limited proved reserves and areas that we decide to drill may not yield hydrocarbons in commercial quantities or quality, or at all.
We have limited proved reserves and our exploration portfolio consists of identified yet unproven exploration prospects based on available seismic and geological information that indicates the potential presence of hydrocarbons. The exploration, appraisal and development wells we drill may not yield hydrocarbons in commercial quantities or quality, or at all. Our current appraisal and development projects and exploration prospects are in various stages of evaluation that will require substantial additional analysis and interpretation. Even when properly used and interpreted, 2-D and 3-D seismic data and visualization techniques are only tools used to assist geoscientists in identifying subsurface structures and hydrocarbon indicators and do not enable the interpreter to know whether hydrocarbons are, in fact, present in those structures. Exploration wells have been drilled on a limited number of our exploration prospects. In addition, we have drilled a limited number of appraisal wells on our development projects. Undue reliance should not be placed on our limited drilling results or any estimates of the characteristics of our projects or prospects, including any derived calculations of our potential resources or reserves based on these limited results and estimates. Additional appraisal wells, other testing and production data from completed wells will be required to fully appraise our discoveries, to better estimate their characteristics and potential resources and reserves and to ultimately understand their commerciality and economic viability. Accordingly, we do not know how many of our development projects, discoveries or exploration prospects will contain hydrocarbons in sufficient quantities or quality to recover drilling and completion costs or to be economically viable. Even if hydrocarbons are found on our exploration prospects in commercial quantities, construction costs of oil pipelines or FPSO systems, as applicable, and transportation costs may prevent such prospects from being economically viable development projects. We will require various regulatory approvals in order to develop and produce from any of our discoveries, which may not be forthcoming or may be delayed.
Additionally, the analogies drawn by us from available data from other wells, more fully explored prospects or producing fields may not prove valid in respect of our drilling prospects. We may terminate our drilling program for a prospect if data, information, studies and previous reports indicate that the possible development of our prospect is not commercially viable and, therefore, does not merit
41
Table of Contents
further investment. If a significant number of our prospects do not prove to be successful, our business, financial condition and results of operations will be materially adversely affected.
To date, there has been limited exploration, appraisal and development drilling which has targeted the pre-salt horizon in the deepwater offshore West Africa and the Inboard Lower Tertiary trend in the deepwater U.S. Gulf of Mexico, areas in which we intend to focus a substantial amount of our exploration and development efforts.
Our business plan requires substantial additional capital, which we may be unable to raise on acceptable terms in the future, which may in turn limit our ability to execute our development projects and achieve production, conduct exploration activities or renew our exploration portfolio.
We do not currently generate any revenue from operations. We expect our capital outlays and operating expenditures to increase substantially over at least the next several years as we expand our operations. Developing major offshore oil and gas projects, especially in complex and challenging environments, continuing exploration activities and obtaining additional leases or concessional licenses and seismic data are very expensive, and we expect that we will need to raise substantial additional capital, through future private or public equity offerings, asset sales, strategic alliances or debt or project financing, before we generate any revenue from operations.
Our future capital requirements will depend on many factors, including:
- •
- the scope, rate of progress and cost of our project appraisal and development activities;
- •
- the scope, rate of progress and cost of our exploration activities;
- •
- the success of our exploration activities;
- •
- the extent to which we invest in additional oil leases or concessional licenses;
- •
- oil and natural gas prices;
- •
- our ability to locate and acquire hydrocarbon reserves;
- •
- our ability to produce oil or natural gas from those reserves;
- •
- our ability to attract and retain adequate personnel;
- •
- our ability to meet the timelines for development set forth in our license agreements;
- •
- the terms and timing of any drilling and other production-related arrangements that we may enter into;
- •
- the timing of partner and governmental approvals and/or concessions; and
- •
- the effects of competition by other companies operating in the oil and gas industry.
While we believe our operations will be adequately funded at current working interests through at least mid-2015, we do not currently have any commitments for future external funding and we do not expect to generate any revenue from production for several years. Additional financing may not be available on favorable terms, or at all. Even if we succeed in selling additional securities to raise funds, at such time the ownership percentage of our existing stockholders could be diluted, and new investors may demand rights, preferences or privileges senior to those of existing stockholders. If we raise additional capital through debt financing, the financing may involve covenants that restrict our business activities. If we choose to farm-out interests in our leases or licenses, we would dilute our ownership interest subject to the farm-out and any potential value resulting therefrom, and we may lose operating control over such prospects.
42
Table of Contents
In order to protect our exploration and production rights in our license areas, we must meet various drilling and declaration requirements. Assuming we are able to commence exploration and production activities or successfully exploit our properties during the primary license term, our licenses over the developed areas of a prospect could extend beyond the primary term, generally for the life of production. However, unless we make and declare discoveries within certain time periods specified in the documents governing our licenses, our interests in either the undeveloped parts of our license areas (as is the case in Angola and Gabon) or the whole block (as is the case in the deepwater U.S. Gulf of Mexico) may be forfeited, we may be subject to significant penalties or be required to make additional payments in order to maintain such licenses. The costs to maintain licenses may fluctuate and may increase significantly since the original term, and we may not be able to renew or extend such licenses on commercially reasonable terms or at all. If we are not successful in raising additional capital, we may be unable to execute our development projects, continue our exploration activities or successfully exploit our properties, and we may lose the rights to develop these properties upon the expiration of our licenses.
Our discoveries and appraisal and development projects remain subject to varying degrees of additional evaluation, analysis and partner and regulatory approvals prior to official project sanction and production.
Our use of the term "development project" in this Annual Report on Form 10-K in relation to our appraisal and development activities refers to our Heidelberg, Shenandoah, North Platte and Cameia projects. Our use of the term "discoveries" in this Annual Report on Form 10-K in relation to our exploration efforts refers to our existing discoveries: North Platte, Heidelberg, Shenandoah, Cameia, Mavinga, Lontra, Bicuar, Orca and Diaman and is not intended to refer to (i) our exploration portfolio as a whole, (ii) prospects where drilling activities have not discovered hydrocarbons or (iii) our undrilled exploration prospects. A discovery made by the initial exploration well on a prospect does not ensure that we will ultimately develop or produce hydrocarbons from such prospect or that a development project will be economically viable or successful. Following a discovery by an initial exploration well, substantial additional evaluation, analysis, expenditure of capital and partner and regulatory approvals will need to be performed and obtained prior to official project sanction and development, which may include (i) the drilling of appraisal wells, (ii) the evaluation and analysis of well logs, reservoir core samples, fluid samples and the results of production tests from both exploration and appraisal wells, and (iii) the preparation of a development plan which includes economic assumptions on the costs of drilling development wells, and the construction or leasing of offshore production facilities and transportation infrastructure. Regulatory approvals are also required to proceed with certain development plans. Relatively more testing and evaluation of our exploration, appraisal and development wells will be required for our projects and discoveries offshore West Africa than our projects in the U.S. Gulf of Mexico given the limited amount of drilling that has taken place in pre-salt horizons offshore West Africa. Any of the foregoing steps of evaluation and analysis may render a particular development project uneconomic, and we may ultimately decide to abandon the project, despite the fact that the initial exploration well, or subsequent appraisal wells, discovered hydrocarbons. We may not be successful in obtaining partner or regulatory approvals to develop a particular discovery, which could prevent us from proceeding with development and ultimately producing hydrocarbons from such discovery, even if we believe a development would be economically successful.
We are a development stage enterprise and our future performance is uncertain.
We are a development stage enterprise and will continue to be so until commencement of substantial production from our properties, which will depend upon our ability to execute the appraisal and development of our projects and progress our projects through the project appraisal and development life-cycle, including the approval of development plans, obtaining formal project sanction, achieving successful appraisal and development drilling results and constructing or leasing production
43
Table of Contents
facilities and related subsea infrastructure. Our ability to commence production will also depend upon us being able to obtain substantial additional capital funding on a timely basis and attract and retain adequate personnel. We do not expect to commence production for at least several years, and therefore we do not expect to generate any revenue from production for a long time. Companies in their initial stages of development face substantial business and financial risks and may suffer significant losses. We have generated substantial net losses and negative cash flows from operating activities since our inception and expect to continue to incur substantial net losses as we continue our project appraisal and development activities, our exploration drilling program and our new venture activities. We face challenges and uncertainties in financial and commercial planning as a result of the complex nature of our business, the unavailability of historical data (particularly offshore West Africa) and uncertainties regarding the nature, scope and results of our future activities and financial commitments. In the event that our appraisal, development or exploration drilling schedules are not completed, or are delayed, modified or terminated, our operating results will be adversely affected and our operations will differ materially from the activities described in this Annual Report on Form 10-K. As a result of industry factors or factors relating specifically to us, we may have to change our methods of conducting business, which may cause a material adverse effect on our results of operations and financial condition.
Drilling wells is speculative, often involving significant costs that may be more than our estimates, and may not result in any discoveries or additions to our future production or reserves. Any material inaccuracies in drilling costs, estimates or underlying assumptions will materially affect our business.
Exploring for and developing oil reserves involves a high degree of operational and financial risk, which precludes definitive statements as to the time required and costs involved in reaching certain objectives. The budgeted costs of drilling, completing and operating exploration, appraisal and development wells are often exceeded and can increase significantly when drilling costs rise due to a tightening in the supply of various types of oilfield equipment and related services. Drilling may be unsuccessful for many reasons, including geological conditions, weather, cost overruns, equipment shortages and mechanical difficulties. Exploration wells bear a much greater risk of financial loss than development wells. In the past we have experienced unsuccessful drilling efforts. Moreover, the successful drilling of an oil well does not necessarily result in a profit on investment. A variety of factors, both geological and market-related, can cause a well or an entire development project to become uneconomic or only marginally economic. Our initial drilling sites, and any potential additional sites that may be developed, require significant additional exploration and development, regulatory approval and commitments of resources prior to commercial development. We face additional risks in the Inboard Lower Tertiary Trend in the U.S. Gulf of Mexico and offshore Angola and Gabon due to a general lack of infrastructure and, in the case of offshore Angola and Gabon, underdeveloped oil and gas industries and increased transportation expenses due to geographic remoteness. Thus, this may require either a single well to be exceptionally productive, or the existence of multiple successful wells, to allow for the development of a commercially viable field. If our actual drilling and development costs are significantly more than our estimated costs, we may not be able to continue our business operations as proposed and would be forced to modify our plan of operation.
We contract with third parties to conduct drilling and related services on our development projects and exploration prospects for us. Such third parties may not perform the services they provide us on schedule or within budget. Furthermore, the drilling equipment, facilities and infrastructure owned and operated by the third parties we contract with is highly complex and subject to malfunction and breakdown. Any malfunctions or breakdowns may be outside our control and result in delays, which could be substantial. Any delays in our drilling campaign caused by equipment, facility or equipment malfunction or breakdown could materially increase our costs of drilling and cause an adverse effect on our business, financial position and results of operations.
44
Table of Contents
Our proved reserves are estimates. Any material inaccuracies in our reserves estimates or assumptions underlying our reserves estimates could cause the quantities and net present value of our reserves to be overstated or understated.
There are numerous uncertainties inherent in estimating oil and natural gas reserves and their value. Reservoir engineering is a subjective process of estimating underground accumulations of crude oil and natural gas that cannot be measured in an exact manner. Because of the high degree of judgment involved, the accuracy of any reserve estimate is inherently imprecise, and a function of the quality of available data and the engineering and geological interpretation. Our reserves estimates are based on 12-month average prices; therefore, reserves quantities will change when actual prices increase or decrease. In addition, results of drilling, testing, and production may substantially change the reserve estimates for a given reservoir over time. The estimates of our proved reserves and estimated future net revenues also depend on a number of factors and assumptions that may vary considerably from actual results, including:
- •
- historical production from an area compared with production from similar producing areas;
- •
- assumed effects of regulation by governmental agencies and court rulings;
- •
- assumptions concerning future oil and natural-gas prices, future operating costs and capital expenditures;
- •
- estimates of future severance and excise taxes, workover costs, and remedial costs;
For these reasons, estimates of the economically recoverable quantities of oil and natural gas attributable to any particular group of properties, classifications of those reserves and estimates of the future net cash flows expected from them prepared by different engineers or by the same engineers but at different times may vary substantially. Accordingly, reserves estimates may be subject to upward or downward adjustment, and actual production, revenue and expenditures with respect to our reserves likely will vary, possibly materially, from estimates. Additionally, because our reserves estimates are calculated using volumetric analysis, those estimates are less reliable than the estimates based on a lengthy production history. Volumetric analysis involves estimating the volume of a reservoir based on the net feet of pay of the structure and an estimation of the area covered by the structure. In addition, realization or recognition of proved undeveloped reserves will depend on our development schedule and plans. A change in future development plans for proved undeveloped reserves could cause the discontinuation of the classification of these reserves as proved.
Development drilling may not result in commercially productive quantities of oil and gas reserves.
Our exploration success has provided us with a number of major development projects on which we are moving forward. We must successfully execute our development projects, including development drilling, in order to generate future production and cash flow. However, development drilling is not always successful and the profitability of development projects may change over time.
For example, in new development projects available data may not allow us to completely know the extent of the reservoir or choose the best locations for drilling development wells. Therefore, a development well we drill may be a dry hole or result in noncommercial quantities of hydrocarbons. Projects in frontier areas may require the development of special technology for development drilling or well completion and we may not have the knowledge or expertise in applying new technology. Our efforts may result in a dry hole or a well that finds noncommercial quantities of hydrocarbons. All costs of development drilling and other development activities are capitalized, even if the activities do not result in commercially productive quantities of hydrocarbon reserves. This puts a property at higher risk for future impairment if commodity prices decrease or operating or development costs increase.
45
Table of Contents
Our drilling plans are scheduled out over several years, making them susceptible to uncertainties that could materially alter the occurrence or timing of drilling.
Our drilling plans on our acreage are scheduled our over a multi-year period. Our drilling plans depend on a number of factors, including the availability of capital and equipment, qualified personnel, seasonal conditions, regulatory approvals, oil prices, costs and drilling results. The final determination on whether to drill any exploration, appraisal, or development well, including the exact drilling location, will be dependent upon the factors described elsewhere in this Annual Report on Form 10-K as well as, to some degree, the results of our drilling activities. Because of these uncertainties, we do not know if the drilling locations we have identified or targeted will be drilled in the location we currently anticipate, within our expected timeframe or at all or if we will be able to economically produce oil or gas from these or any other potential drilling locations. As such, our actual drilling plans and locations may be materially different from our current expectations, which could adversely affect our results of operations and financial condition.
We are not, and may not be in the future, the operator on all of our acreage, and do not, and may not in the future, hold all of the working interests in our acreage. Therefore, we will not be able to control the timing of exploration or development efforts, associated costs, or the rate of production of any non-operated and to an extent, any non-wholly owned, assets.
Currently, we are not the operator on approximately 15% of our deepwater U.S. Gulf of Mexico blocks, and we are not the operator on the Diaba Block offshore Gabon. As we carry out our exploration and development programs, we may enter into arrangements with respect to existing or future prospects that result in a greater proportion of our prospects being operated by others. In addition, the terms of our current or future licenses or leases may require at least the majority of working interests to approve certain actions. As a result, we may have limited ability to exercise influence over the operations of the prospects operated by our partners or which are not wholly-owned by us, as the case may be. Dependence on the operator or our partners could prevent us from realizing our target returns for those prospects. Further, it may be difficult for us to minimize the cycle time between discovery and initial production with respect to prospects for which we do not operate or wholly-own. The success and timing of exploration and development activities operated by our partners will depend on a number of factors that will be largely outside of our control, including:
- •
- the timing and amount of capital expenditures;
- •
- the operator's expertise and financial resources;
- •
- partner, government and regulatory approvals;
- •
- selection of technology; and
- •
- the rate of production of reserves, if any.
Furthermore, even though we are the operator of Blocks 9, 20 and 21 offshore Angola, we are required to obtain the prior approval of Sonangol for most of our operational activities. This limited ability to exercise control over the operations of some of our prospects may cause a material adverse effect on our results of operations and financial condition.
The inability of one or more third parties who contract with us to meet their obligations to us may adversely affect our financial results.
We may be liable for certain costs if third parties who contract with us are unable to meet their commitments under such agreements. We are currently exposed to credit risk through joint interest receivables from our block and/or lease partners. As a result of our exploration success, we have a large inventory of development projects which will require significant capital expenditures and have
46
Table of Contents
long development cycle times. Our partners, both in the U.S. Gulf of Mexico and West Africa, must be able to fund their share of investment costs through the lengthy development cycle, through cash flow from operations, external credit facilities, or other sources, including project financing arrangements. Our partners may not be successful in obtaining such financing, which could negatively impact the progress and timeline for development. In addition to project development costs, our partners must also be able to fund their share of exploration and other operating expenses. If any of our partners in the blocks or leases in which we hold interests are unable to fund their share of the exploration and development expenses, we may be liable for such costs. In addition, if any of the service providers we contract with to conduct development or exploration activities file for bankruptcy or are otherwise unable to fulfill their obligations to us, we may face increased costs and delays in locating replacement vendors. The inability or failure of third parties we contract with to meet their obligations to us or their insolvency or liquidation may adversely affect our financial results.
We are dependent on certain members of our management and technical team and our inability to retain or recruit qualified personnel may impair our ability to grow our business.
Our investors must rely upon the ability, expertise, judgment and discretion of our management and the success of our technical team in identifying, discovering and developing oil reserves and progressing our development projects toward first production. Our performance and success are dependent, in part, upon key members of our management and technical team, and their loss or departure could be detrimental to our future success. You must be willing to rely to a significant extent on our management's discretion and judgment. The vast majority of our senior management and technical team's equity in us will vest and their employment agreements will expire prior to January 1, 2015. In addition, a significant portion of our employee base is at or near retirement age. Furthermore, we utilize the services of a number of individual consultants for contractually fixed periods of time. Our inability to retain or recruit qualified personnel may impair our ability to grow our business and develop our discoveries, which could have a material adverse effect on our results of operations and financial condition, as well as on the market price of our common stock.
Under the terms of our various license agreements, we are required to drill wells and declare any discoveries in order to retain exploration and production rights and failure to do so may result in substantial license renewal costs or loss of our interests in the undeveloped parts of our license areas, which may include certain of our prospects.
In order to protect our exploration and production rights in our license areas, we must meet various drilling and declaration requirements. In general, unless we make and declare discoveries within certain time periods specified in our various license agreements and leases, our interests in the undeveloped parts of our license (as is the case in Angola and Gabon) or the whole block (as is the case in the deepwater U.S. Gulf of Mexico) areas may lapse and we may be subject to significant penalties or be required to make additional payments in order to maintain such licenses. For example, under the Block 9 RSA, we are required to drill three exploration wells within four years of the signing of the Block 9 RSA, or March 1, 2014, subject to certain extensions. Currently, we have not drilled any exploration wells on Block 9. We have applied for an extension of the initial exploration period for Block 9 to enable us to drill an exploration well on our Loengo prospect, however, this extension is currently pending approval by Sonangol and the Angola Ministry of Petroleum. If Sonangol or the Angola Ministry of Petroleum does not approve this extension, we will forfeit our acreage on Block 9 offshore Angola, impair the $2.5 million paid for our working interest in Block 9 and may have to relinquish $45.3 million that secures work program obligations on Block 9. We can make no assurances that we will receive an extension of the initial exploration period on Block 9 or what the terms of the extension might be. It is possible we will forfeit some or all of our acreage on Block 9 offshore Angola.
47
Table of Contents
Under the Block 21 RSA, in order to preserve our rights in this block, we are required to drill four exploration wells within five years of the signing of the Block 21 RSA, or March 1, 2015, subject to certain extensions. Currently, we have drilled three exploration wells on Block 21. Under the Block 20 PSC, in order to preserve our rights in the block, we will be required to drill four exploration wells within five years of the signing of the Block 20 PSC, or January 1, 2017, subject to certain extensions. Currently, we have drilled two exploration wells on Block 20.
Furthermore, as required by our license agreements, within thirty days following a successful exploration well, we are required to submit a declaration of commercial well to Sonangol. Within two years after the date of the declaration of commercial well, we must submit to Sonangol a formal declaration of commercial discovery. Within three months from the declaration of commercial discovery, we are required to submit a development plan to Sonangol and the Angola Ministry of Petroleum for review and approval. Given our exploration success, we now have five complex appraisal and development projects offshore Angola, including Cameia, Mavinga, Lontra, Orca and Bicuar, each of which we must progress through the project development life-cycle in order to comply with the deadlines outlined above. Our failure or inability to meet these deadlines could jeopardize our production rights or result in forfeiture of our production rights with respect to these projects, which would have a material adverse effect on our results of operations and financial condition, as well as on the market price of our common stock.
In addition, most of our deepwater U.S. Gulf of Mexico blocks have a 10-year primary term, expiring between 2016 and 2022. Generally, we are required to commence exploration activities or successfully exploit our properties during the primary lease term in order for these leases to extend beyond the primary lease term. Accordingly, we may not be able to drill all of the prospects we have identified on our leases or licenses prior to the expiration of their respective terms. Should the prospects we have identified under the licenses or leases currently in place yield discoveries, we cannot assure you that we will not face delays in drilling these prospects or otherwise have to relinquish these prospects. The costs to maintain licenses over such areas may fluctuate and may increase significantly since the original term, and we may not be able to renew or extend such licenses on commercially reasonable terms or at all. Our actual drilling activities may therefore materially differ from our current expectations, which could adversely affect our business. For each of our blocks and license areas, we cannot assure you that any renewals or extensions will be granted or whether any new agreements or leases will be available on commercially reasonable terms, or, in some cases, at all.
We may be subject to risks in connection with acquisitions and the integration of significant acquisitions may be difficult.
We periodically evaluate acquisitions of prospects and licenses, reserves and other strategic transactions that appear to fit within our overall business strategy. The successful acquisition of these assets requires an assessment of several factors, including:
- •
- recoverable reserves;
- •
- future oil and natural gas prices and their appropriate differentials;
- •
- development and operating costs; and
- •
- potential environmental and other liabilities.
The accuracy of these assessments is inherently uncertain. In connection with these assessments, we perform a review of the subject assets that we believe to be generally consistent with industry practices. Our review will not reveal all existing or potential problems nor will it permit us to become sufficiently familiar with the assets to fully assess their deficiencies and potential recoverable reserves. Inspections may not always be performed on every well, and environmental problems are not necessarily observable even when an inspection is undertaken. Even when problems are identified, the
48
Table of Contents
seller may be unwilling or unable to provide effective contractual protection against all or part of the problems. We may not be entitled to contractual indemnification for environmental liabilities and could acquire assets on an "as is" basis. Significant acquisitions and other strategic transactions may involve other risks, including:
- •
- diversion of our management's attention to evaluating, negotiating and integrating significant acquisitions and strategic transactions;
- •
- the challenge and cost of integrating acquired operations, information management and other technology systems and business cultures with those of ours while carrying on our ongoing business;
- •
- difficulty associated with coordinating geographically separate organizations; and
- •
- the challenge of attracting and retaining personnel associated with acquired operations.
The process of integrating operations could cause an interruption of, or loss of momentum in, the activities of our business. Members of our senior management may be required to devote considerable amounts of time to this integration process, which will decrease the time they will have to manage our business. If our senior management is not able to effectively manage the integration process, or if any significant business activities are interrupted as a result of the integration process, our business could suffer.
If we fail to realize the anticipated benefits of a significant acquisition, our results of operations may be adversely affected.
The success of a significant acquisition will depend, in part, on our ability to realize anticipated growth opportunities from combining the acquired assets or operations with those of ours. Even if a combination is successful, it may not be possible to realize the full benefits we may expect in estimated proved reserves, production volume, cost savings from operating synergies or other benefits anticipated from an acquisition or realize these benefits within the expected time frame. Anticipated benefits of an acquisition may be offset by operating losses relating to changes in commodity prices, increased interest expense associated with debt incurred or assumed in connection with the transaction, adverse changes in oil and gas industry conditions, or by risks and uncertainties relating to the exploration prospects of the combined assets or operations, or an increase in operating or other costs or other difficulties, including the assumption of environmental or other liabilities in connection with the acquisition. If we fail to realize the benefits we anticipate from an acquisition, our results of operations may be adversely affected.
A substantial or extended decline in oil and natural gas prices may adversely affect our business, financial condition and results of operations.
The price that we will receive for our oil and natural gas production will significantly affect our revenue, profitability, access to capital and future growth rate. The market price of oil and natural gas affects the valuation of our business and price of our common stock despite the fact that we currently do not produce or sell oil or natural gas. Historically, the oil and natural gas markets have been volatile and will likely continue to be volatile in the future. Oil and natural gas prices depend on numerous factors. These factors include, but are not limited to, the following:
- •
- changes in supply and demand for oil and natural gas;
- •
- the actions of the Organization of the Petroleum Exporting Countries;
- •
- the price and quantity of imports of foreign oil and natural gas;
- •
- speculation as to the future price of oil and the speculative trading of oil futures contracts;
49
Table of Contents
- •
- global economic conditions;
- •
- political and economic conditions, including embargoes, in oil-producing countries or affecting other oil-producing activities, particularly in the Middle East, Africa, Russia and South America;
- •
- the continued threat of terrorism and the impact of military and other action, including U.S. military operations in the Middle East;
- •
- the level of global oil and natural gas exploration and production activity;
- •
- the level of global oil and natural gas inventories and oil and natural gas refining capacities;
- •
- weather conditions and other natural disasters;
- •
- technological advances affecting energy consumption;
- •
- domestic and foreign governmental regulations;
- •
- proximity and capacity of oil and natural gas pipelines and other transportation facilities;
- •
- the price and availability of competitors' supplies of oil and natural gas; and
- •
- the price and availability of alternative fuels.
Oil and natural gas prices have fluctuated dramatically in recent times and will likely continue to be volatile in the future. Lower oil and natural gas prices may not only decrease our revenues on a per unit basis but also may reduce the amount of oil and natural gas that we can produce economically. A substantial or extended decline in oil and natural gas prices may materially and adversely affect our future business, financial condition, the market price of our common stock, results of operations, liquidity or ability to finance planned capital expenditures.
We are subject to numerous risks inherent to the exploration and production of oil and natural gas.
Oil and natural gas exploration and production activities involve many risks that a combination of experience, knowledge and careful evaluation may not be able to overcome. Our future success will depend on the success of our exploration and production activities and on the future existence of the infrastructure and technology that will allow us to take advantage of our findings. Additionally, our properties are located in deepwater, which generally increases the capital and operating costs, technical challenges and risks associated with exploration and production activities. As a result, our exploration and production activities are subject to numerous risks, including the risk that drilling will not result in commercially viable production. Our decisions to purchase, explore, develop or otherwise exploit prospects or properties will depend in part on the evaluation of seismic data through geophysical and geological analyses, production data and engineering studies, the results of which are often inconclusive or subject to varying interpretations.
Furthermore, the marketability of expected production from our prospects will also be affected by numerous factors. These factors include, but are not limited to, market fluctuations of prices, proximity, capacity and availability of pipelines, the availability of processing facilities, equipment availability and government regulations (including, without limitation, regulations relating to prices, taxes, royalties, allowable production, importing and exporting of hydrocarbons, environmental protection and climate change). The effect of these factors, individually or jointly, may result in us not receiving an adequate return on invested capital.
50
Table of Contents
We are subject to drilling and other operational hazards.
The exploration and production business involves a variety of operating risks, including, but not limited to:
- •
- blowouts, cratering and explosions;
- •
- mechanical and equipment problems;
- •
- uncontrolled flows or leaks of oil or well fluids, natural gas or other pollution;
- •
- fires and gas flaring operations;
- •
- marine hazards with respect to offshore operations;
- •
- formations with abnormal pressures;
- •
- pollution, other environmental risks and geological problems; and
- •
- weather conditions and natural disasters.
These risks are particularly acute in deepwater drilling and exploration for natural resources. Any of these events could result in loss of human life, significant damage to property, environmental damage, impairment of our operations, delays in our drilling operations, increased costs and substantial losses. In accordance with customary industry practice, we expect to maintain insurance against some, but not all, of these risks and losses. We do not carry business interruption insurance. The occurrence of any of these events, whether or not covered by insurance, could have a material adverse effect on our results of operations and financial condition, as well as on the market price of our common stock.
We are members of several industry groups that provide general and specific oil spill and well containment resources in the U.S. Gulf of Mexico and offshore West Africa. Through these industry groups, as described under "Business—Containment Resources", we have contractual rights to access certain oil spill and well containment resources. We can make no assurance that these resources will perform as designed or be able to fully contain or cap any oil spill, blow-out or uncontrolled flow of hydrocarbons. Furthermore, our contracts for the use of oil spill and well containment resources contain strict indemnity provisions that generally require us to indemnify the contractor for all losses incurred as a result of assisting us in our oil spill and well containment efforts, subject to certain exceptions and limitations. In the event we experience a subsea blowout, explosion, fire, uncontrolled flow of hydrocarbons or any of the other operational risks identified above, the oil spill and well containment resources which we have contractual rights to will not prevent us from incurring losses or shield us from liability, which could be substantial and have a material adverse effect on our results of operations and financial condition, as well as on the market price of our common stock.
The high cost or unavailability of drilling rigs, equipment, personnel, oil field services and infrastructure could adversely affect our ability to execute our exploration and development plans on a timely basis and within budget.
Our industry is cyclical and, from time to time, there is a shortage of drilling rigs, equipment, supplies or qualified personnel, often during periods of higher oil prices or in emerging areas of exploration. During these periods and within these areas, the costs of drilling rigs, equipment, supplies and personnel are substantially greater and their availability may be limited. Additionally, these services may not be available on commercially reasonable terms. The high cost or unavailability of drilling rigs, equipment, supplies, personnel and other oil field services could adversely affect our ability to execute our exploration and development plans on a timely basis and within budget, which could have a material adverse effect on our business, financial condition or results of operations.
Our ability to produce hydrocarbons will depend substantially on the availability and capacity of gathering systems, pipelines and processing facilities owned and operated by third parties. Additionally, such infrastructure may not be available on commercially reasonable terms. We may be required to shut in oil wells because of the absence of a market or because access to pipelines, gathering systems or processing facilities may be limited or unavailable. If that were to occur, then we would be unable to realize revenue from those wells until arrangements were made to deliver the production to market, which could have a material adverse effect on our business, financial condition or results of operations.
51
Table of Contents
Our operations will involve special risks that could adversely affect operations.
Offshore operations are subject to a variety of operating risks specific to the marine environment, such as capsizing, collisions and damage or loss from hurricanes or other adverse weather conditions. These conditions can cause substantial damage to facilities and interrupt our operations. As a result, we could incur substantial expenses that could reduce or eliminate the funds available for exploration, development or leasehold acquisitions, or result in loss of equipment and properties.
Deepwater exploration generally involves greater operational and financial risks than exploration on the shelf. Deepwater drilling generally requires more time and more advanced drilling technologies, involving a higher risk of technological failure and usually higher drilling costs. Such risks are particularly applicable to our deepwater exploration efforts in the Inboard Lower Tertiary trend and pre-salt offshore Angola and Gabon, as there has been relatively limited drilling activity in these areas. In addition, there may be production risks of which we are currently unaware. Whether we use existing pipeline infrastructure, participate in the development of new subsea infrastructure or use floating production systems to transport oil from producing wells, if any, these operations may require substantial time for installation, or encounter mechanical difficulties and equipment failures that could result in significant cost overruns and delays. Furthermore, deepwater operations generally, and operations in the Inboard Lower Tertiary and offshore West Africa trends in particular, lack the physical and oilfield service infrastructure present on the shelf. As a result, a significant amount of time may elapse between a deepwater discovery and the marketing of the associated hydrocarbons, increasing both the financial and operational risk involved with these operations. Because of the lack and high cost of this infrastructure, reserve discoveries we make in the deepwater, if any, may never be economically producible.
Our operations in the U.S. Gulf of Mexico may be adversely impacted by tropical storms and hurricanes.
Tropical storms, hurricanes and the threat of tropical storms and hurricanes often result in the shutdown of operations in the U.S. Gulf of Mexico as well as operations within the path and the projected path of the tropical storms or hurricanes. In the future, during a shutdown period, we may be unable to access wellsites and our services may be shut down. Additionally, tropical storms or hurricanes may cause evacuation of personnel and damage to offshore drilling rigs and other equipment, which may result in suspension of our operations. The shutdowns, related evacuations and damage can create unpredictability in activity and utilization rates, as well as delays and cost overruns, which may have a material adverse effect on our results of operations and financial condition, as well as on the market price of our common stock.
The geographic concentration of our properties in the U.S. Gulf of Mexico and offshore Angola and Gabon subjects us to an increased risk of loss of revenue or curtailment of production from factors specifically affecting the U.S. Gulf of Mexico and offshore Angola and Gabon.
Our properties are concentrated in three countries: the U.S. Gulf of Mexico and offshore Angola and Gabon. Some or all of these properties could be affected should such regions experience:
- •
- severe weather or natural disasters;
- •
- moratoria on drilling or permitting delays;
- •
- delays in or the inability to obtain regulatory approvals;
- •
- delays or decreases in production;
- •
- delays or decreases in the availability of drilling rigs and related equipment, facilities, personnel or services;
52
Table of Contents
- •
- delays or decreases in the availability of capacity to transport, gather or process production; and/or
- •
- changes in the regulatory, political and fiscal environment.
For example, in response to the Deepwater Horizon incident in 2010, the U.S. government and its regulatory agencies with jurisdiction over oil and gas exploration, including the DOI and the BOEM and BSEE, imposed moratoria on drilling operations, required operators to reapply for exploration plans and drilling permits and adopted extensive new regulations, which effectively had halted drilling operations in the deepwater U.S. Gulf of Mexico for a period of time. Additionally, oil and gas properties and facilities located in the U.S. Gulf of Mexico were significantly damaged by Hurricanes Katrina and Rita in 2005, which required our competitors to spend a significant amount of time and capital on inspections, repairs, debris removal, and the drilling of replacement wells. We maintain insurance coverage for only a portion of these risks. There also may be certain risks covered by insurance where the policy does not reimburse us for all of the costs related to a loss. We do not carry business interruption insurance.
Due to the concentrated nature of our portfolio of properties, a number of our properties could experience any of the same conditions at the same time, resulting in a relatively greater impact on our results of operations than they might have on other companies that have a more diversified portfolio of properties.
Regulations enacted as a result of the Deepwater Horizon drilling rig accident and resulting oil spill may have significantly increased certain of the risks we face and increased the cost of operations in the U.S. Gulf of Mexico.
On April 20, 2010, the Transocean Deepwater Horizon, a semi-submersible offshore drilling rig operating in the deepwater U.S. Gulf of Mexico under contract to BP plc exploded, burned for two days and sank, resulting in loss of life, injuries and a large oil spill. The U.S. government and its regulatory agencies with jurisdiction over oil and gas exploration, including the DOI, BOEM and BSEE, responded to this incident by imposing moratoria on drilling operations and adopting numerous new regulations and new interpretations of existing regulations regarding operations in the U.S. Gulf of Mexico. Compliance with these new regulations has increased the cost of our drilling operations in the U.S. Gulf of Mexico.
The successful execution of our U.S. Gulf of Mexico business plan depends on our ability to continue our exploration and appraisal efforts. A prolonged suspension of or delay in our drilling operations would adversely affect our business, financial position or future results of operations.
Furthermore, the Deepwater Horizon incident may have increased certain of the risks we face, including, without limitation, the following:
- •
- increased governmental regulation and enforcement of our and our industry's operations in a number of areas, including health and safety, financial responsibility, environmental, licensing, taxation, equipment specifications and inspections and training requirements;
- •
- increased difficulty in obtaining leases and permits to drill offshore wells, including as a result of any bans or moratoria placed on offshore drilling;
- •
- potential legal challenges to the issuance of permits and the conducting of our operations;
- •
- higher drilling and operating costs;
- •
- higher royalty rates and fees on leases acquired in the future;
- •
- higher insurance costs and increased potential liability thresholds under proposed legislation and regulations;
53
Table of Contents
- •
- decreased partner participation in wells we operate;
- •
- higher capital costs as a result of any increase to the risks we or our industry face; and
- •
- less favorable investor perception of the risk-adjusted benefits of deepwater offshore drilling.
The occurrence of any of these factors, or their continuation, could have a material adverse effect on our business, financial position or future results of operations.
We face various risks associated with increased activism against oil and gas exploration and development activities.
Opposition toward oil and gas drilling and development activity has been growing globally and is particularly pronounced in the United States. Companies in the oil and gas industry are often the target of activist efforts from both individuals and non-governmental organizations regarding safety, human rights, environmental compliance, sustainability, and business practices. Anti-development activists are working to, among other things, reduce access to federal and state government lands and delay or cancel certain operations such as offshore drilling and development. For example, environmental activists have recently challenged lease sales and decisions to grant air-quality permits in the U.S. Gulf of Mexico for offshore drilling.
Future activist efforts could result in the following:
- •
- delay or denial of drilling permits;
- •
- shortening of lease terms or reduction in lease size;
- •
- restrictions or delays on our ability to obtain additional seismic data;
- •
- restrictions on installation or operation of gathering or processing facilities;
- •
- restrictions on the use of certain operating practices;
- •
- legal challenges or lawsuits;
- •
- damaging publicity about us;
- •
- increased costs of doing business;
- •
- reduction in demand for our products; and
- •
- other adverse effects on our ability to develop our properties.
Our need to incur costs associated with responding to these initiatives or complying with any resulting new legal or regulatory requirements resulting from these activities that are substantial and not adequately provided for, could have a material adverse effect on our business, financial condition and results of operations.
We may be exposed to liabilities under the U.S. Foreign Corrupt Practices Act, and any determination that we violated the U.S. Foreign Corrupt Practices Act could have a material adverse effect on our business.
We are subject to the U.S. Foreign Corrupt Practices Act ("FCPA") and other laws that prohibit improper payments or offers of payments to foreign governments and their officials and political parties for the purpose of obtaining or retaining business. We do business and may do additional business in the future in countries and regions in which we may face, directly or indirectly, corrupt demands by officials, tribal or insurgent organizations, or private entities. Thus, we face the risk of unauthorized payments or offers of payments by one of our employees or consultants, given that these parties may not always be subject to our control. Our existing safeguards and any future improvements may prove
54
Table of Contents
to be less than effective, and our employees and consultants may engage in conduct for which we might be held responsible.
In connection with entering into our RSAs for Blocks 9 and 21 offshore Angola, two Angolan-based E&P companies were assigned as part of the contractor group by the Angolan government. We had not worked with either of these companies in the past, and, therefore, our familiarity with these companies was limited. In the fall of 2010, we were made aware of allegations of a connection between senior Angolan government officials and one of these companies, Nazaki Oil and Gáz, S.A. ("Nazaki"), which is a full paying member of the contractor group. In March 2011, the SEC commenced an informal inquiry into these allegations. To avoid non-overlapping information requests, we voluntarily contacted the U.S. Department of Justice ("DOJ") with respect to the SEC's informal request and offered to respond to any requests the DOJ may have. Since such time, we have been complying with all requests from the SEC and DOJ with respect to their inquiry. In November 2011, a formal order of investigation was issued by the SEC related to our operations in Angola. We are fully cooperating with the SEC and DOJ investigations, have conducted an extensive investigation into these allegations and believe that our activities in Angola have complied with all laws, including the FCPA. We cannot provide any assurance regarding the duration, scope, developments in, results of or consequences of these investigations.
In the future, we may be partnered with other companies with whom we are unfamiliar. Violations of the FCPA may result in severe criminal or civil sanctions, and we may be subject to other liabilities, which could negatively affect our business, operating results and financial condition. In addition, the government may seek to hold us liable for successor liability FCPA violations committed by companies in which we invest or that we acquire.
Our operations may be adversely affected by political and economic circumstances in the countries in which we operate.
Our oil and gas exploration, development and production activities are subject to political and economic uncertainties (including but not limited to changes, sometimes frequent or marked, in energy policies or the personnel administering them), expropriation of property, cancellation or modification of contract rights, foreign exchange restrictions, currency fluctuations, royalty and tax increases and other risks arising out of governmental sovereignty over the areas in which our operations are conducted, as well as risks of loss due to civil strife, acts of war, piracy, guerrilla activities and insurrection. Some of these risks may be higher in the developing countries in which we conduct our activities, namely, Angola and Gabon.
Our operations are exposed to risks of war, local economic conditions, political disruption, civil disturbance and governmental policies that may:
- •
- disrupt our operations;
- •
- restrict the movement of funds or limit repatriation of profits;
- •
- in the case of our non-U.S. operations, lead to U.S. government or international sanctions; and
- •
- limit access to markets for periods of time.
Disruptions may occur in the future, and losses caused by these disruptions may occur that will not be covered by insurance. Consequently, our exploration, development and production activities may be substantially affected by factors which could have a material adverse effect on our financial condition and results of operations. Furthermore, in the event of a dispute arising from non-U.S. operations, we may be subject to the exclusive jurisdiction of courts outside the U.S. or may not be successful in subjecting non-U.S. persons to the jurisdiction of courts in the U.S., which could adversely affect the outcome of such dispute.
55
Table of Contents
Our operations may also be adversely affected by laws and policies of the jurisdictions, including Angola, Gabon, the United States, the Cayman Islands and other jurisdictions, in which we do business, that affect foreign trade and taxation. Changes in any of these laws or policies or the implementation thereof, could have a material adverse effect on our results of operations and financial position, as well as on the market price of our common stock.
The oil and gas industry, including the acquisition of exploration acreage worldwide, is intensely competitive.
The international oil and gas industry is highly competitive in all aspects, including the exploration for, and the development of, new sources of oil and gas. We operate in a highly competitive environment for acquiring exploration acreage and hiring and retaining trained personnel. Many of our competitors possess and employ financial, technical and personnel resources substantially greater than us, which can be particularly important in the areas in which we operate. These companies may be able to pay more for productive or prospective properties and prospects and to evaluate, bid for and purchase a greater number of properties and prospects than our financial or personnel resources permit. Furthermore, these companies may also be better able to withstand the financial pressures of unsuccessful drill attempts, delays, sustained periods of volatility in financial markets and generally adverse global and industry-wide economic conditions, and may be better able to absorb the burdens resulting from changes in relevant laws and regulations, which would adversely affect our competitive position. Our ability to acquire additional exploration prospects and to find and develop reserves in the future will depend on our ability to evaluate and select suitable properties and to consummate transactions in a highly competitive environment. Also, there is substantial competition for available capital for investment in the oil and gas industry. As a result of these and other factors, we may not be able to compete successfully in an intensely competitive industry, which could have a material adverse effect on our results of operations and financial condition, as well as on the market price of our common stock.
Participants in the oil and gas industry are subject to complex laws that can affect the cost, manner or feasibility of doing business.
Exploration and production activities in the oil and gas industry are subject to extensive local, state, federal and international regulations. We may be required to make large expenditures to comply with governmental regulations, particularly in respect of the following matters:
- •
- licenses and leases for drilling operations;
- •
- foreign exchange and banking;
- •
- royalty increases, including retroactive claims;
- •
- drilling and development bonds and social payment obligations;
- •
- reports concerning operations;
- •
- the spacing of wells;
- •
- unitization of oil accumulations;
- •
- remediation or investigation activities for environmental purposes; and
- •
- taxation.
Under these and other laws and regulations, we could be liable for personal injuries, property damage and other types of damages for which we may not maintain insurance coverage. Failure to comply with these laws and regulations also may result in the suspension or termination of our operations and subject us to administrative, civil and criminal penalties. Moreover, these laws and regulations could change in ways that could substantially increase our costs. Any such liabilities,
56
Table of Contents
penalties, suspensions, terminations or regulatory changes could have a material adverse effect on our results of operations and financial condition, as well as on the market price of our common stock.
Angola recently enacted a new Foreign Exchange Law for the Petroleum Sector, which requires, among other things, that all foreign exchange operations be carried out through Angolan banks, that oil and gas exploration and production companies open local bank accounts in foreign currencies in order to pay local taxes and to pay for goods and services supplied by non-resident suppliers and service providers, and also that oil and gas exploration and production companies open local bank accounts in local currency in order to pay for goods and services supplied by resident suppliers and service providers. See "Business—Laws and Regulations of Angola and Gabon—Angola" for more information. As a consequence, any foreign currency proceeds we obtain from the sale of our share of oil and gas production in Angola cannot be retained in full outside Angola, as a portion of the proceeds required to settle tax liabilities and pay for local petroleum operations-related expenses must be deposited in and paid through Angolan banks. Furthermore, until we achieve oil and gas production in Angola, we will be required to convert funds into local Angolan currency and deposit such funds in local banks in order to pay for our local petroleum operations-related expenses. There can be no assurance that a liquid foreign exchange market will continue to exist in Angola or that we won't be adversely affected by foreign exchange rate fluctuations (which we may not be able to hedge against). In addition, in order to comply with this law and related regulations, we are required to assess the residency status of our vendors and contractors in Angola to determine which rules apply to each specific vendor or contractor (whether they be resident vendors and contractors or non-resident vendors and contractors). These new rules require additional compliance efforts and costs on our and other industry participants' part, and may in some cases cause delay or other issues in connection with the acquisition of or payments for goods and services. Any of these consequences could have a material adverse effect on our results of operations.
A cyber incident could result in information theft, data corruption, operational disruption, and/or financial loss.
The oil and gas industry has become increasingly dependent on digital technologies to conduct day-to-day operations including certain exploration, development and production activities. For example, software programs are used to interpret seismic data, manage drilling rigs, conduct reservoir modeling and reserves estimation, and to process and record financial and operating data.
We depend on digital technology, including information systems and related infrastructure as well as cloud application and services, to process and record financial and operating data, communicate with our employees and business partners, analyze seismic and drilling information, estimate quantities of oil and gas reserves and for many other activities related to our business. Our business partners, including vendors, service providers, purchasers of our production, and financial institutions, are also dependent on digital technology. The complexity of the technologies needed to explore for and develop oil and gas in increasingly difficult physical environments, such as below-salt deepwater, and global competition for oil and gas resources make certain information more attractive to thieves.
As dependence on digital technologies has increased, cyber incidents, including deliberate attacks or unintentional events, have also increased. A cyber-attack could include gaining unauthorized access to digital systems for purposes of misappropriating assets or sensitive information, corrupting data, or causing operational disruption, or result in denial-of-service on websites. For example, in 2012, a wave of network attacks impacted Saudi Arabia's oil industry and breached financial institutions in the US. Certain countries, including China, Russia and Iran, are believed to possess cyber warfare capabilities and are credited with attacks on American companies and government agencies.
Our technologies, systems, networks, and those of our business partners may become the target of cyber-attacks or information security breaches that could result in the unauthorized release, gathering,
57
Table of Contents
monitoring, misuse, loss or destruction of proprietary and other information, or other disruption of our business operations. In addition, certain cyber incidents, such as surveillance, may remain undetected for an extended period. A cyber incident involving our information systems and related infrastructure, or that of our business partners, could disrupt our business plans and negatively impact our operations. Although to date we have not experienced any cyber-attacks, there can be no assurance that we will not be the target of cyber-attacks in the future or suffer such losses related to any cyber-incident. As cyber threats continue to evolve, we may be required to expend significant additional resources to continue to modify or enhance our protective measures or to investigate and remediate any information security vulnerabilities.
We and our operations are subject to numerous environmental, health and safety regulations which may result in material liabilities and costs.
We are, and our future operations will be, subject to various international, foreign, federal, state and local environmental, health and safety laws and regulations governing, among other things, the emission and discharge of pollutants into the ground, air or water, the generation, storage, handling, use and transportation of regulated materials and the health and safety of our employees. We are required to obtain various environmental permits from governmental authorities for our operations, including drilling permits for our wells. There is a risk that we have not been or will not be at all times in complete compliance with these permits and the environmental laws and regulations to which we are subject. If we violate or fail to comply with these laws, regulations or permits, we could be fined or otherwise sanctioned by regulators, including through the revocation of our permits or the suspension or termination of our operations. If we fail to obtain permits in a timely manner or at all (due to opposition from community or environmental interest groups, governmental delays, changes in laws or the interpretation thereof or any other reasons), such failure could impede our operations, which could have a material adverse effect on our results of operations and our financial condition.
We, as the named lessee or as the designated operator under our current and future oil leases and licenses, could be held liable for all environmental, health and safety costs and liabilities arising out of our actions and omissions as well as those of our third-party contractors. To the extent we do not address these costs and liabilities or if we are otherwise in breach of our lease or license requirements, our leases or licenses could be suspended or terminated. We have contracted with and intend to continue to hire third parties to perform the majority of the drilling and other services related to our operations. There is a risk that we may contract with third parties with unsatisfactory environmental, health and safety records or that our contractors may be unwilling or unable to cover any losses associated with their acts and omissions. Accordingly, we could be held liable for all costs and liabilities arising out of the acts or omissions of our contractors, which could have a material adverse effect on our results of operations and financial condition.
As the designated operator of certain of our leases and licenses, we are required to maintain bonding or insurance coverage for certain risks relating to our operations, including environmental risks. We maintain insurance at levels that we believe are consistent with current industry practices, but we are not fully insured against all risks. Our insurance may not cover any or all environmental claims that might arise from our operations or those of our third-party contractors. If a significant accident or other event occurs and is not fully covered by our insurance, or our third-party contractors have not agreed to bear responsibility, such accident or event could have a material adverse effect on our results of operations and our financial condition. In addition, we may not be able to obtain required bonding or insurance coverage at all or in time to meet our anticipated startup schedule for each well, and if we fail to obtain this bonding or coverage, such failure could have a material adverse effect on our results of operations and financial condition.
Releases to deepwater of regulated substances are common, and under certain environmental laws, we could be held responsible for all of the costs relating to any contamination caused by us or our
58
Table of Contents
contractors, at our facilities and at any third party waste disposal sites used by us or on our behalf. These costs could be material. In addition, offshore oil exploration and production involves various hazards, including human exposure to regulated substances, including naturally occurring radioactive materials. As such, we could be held liable for any and all consequences arising out of human exposure to such substances or other damage resulting from the release of regulated substances to the environment, endangered species, property or to natural resources.
Particularly since the Deepwater Horizon event in the U.S. Gulf of Mexico in 2010, there has been an increased interest in making regulation of deepwater oil and gas exploration and production more stringent in the U.S. If adopted, certain proposals such as a significant increase or elimination of financial liability caps for economic damages, could significantly raise daily penalties for infractions and require significantly more comprehensive financial assurance requirements under OPA which could affect our results of operations and our financial condition.
In addition, we expect continued attention to climate change issues. Various countries and U.S. states and regions have agreed to regulate emissions of greenhouse gases ("GHG"), including methane (a primary component of natural gas) and carbon dioxide, a byproduct of oil and natural gas combustion. Additionally, the U.S. Congress has in the past and may in the future consider legislation requiring reductions in GHG emissions. The EPA began regulating GHG emissions from certain stationary sources on January 2, 2011 and has enacted GHG emissions standards for certain classes of vehicles. The EPA has adopted rules requiring the reporting of GHG emissions, including from certain offshore oil and natural gas production facilities on an annual basis. In addition, in accordance with the Obama Administration's June 2013 Climate Action Plan, the EPA published proposed rules in January 2014 to regulate GHG emissions from new power plants and is expected to publish proposed GHG emissions rules applicable to existing power plants by June 2014. The regulation of GHGs and the physical impacts of climate change in the areas in which we, our customers and the end-users of our products operate could adversely impact our operations and the demand for our products.
Environmental, health and safety laws are complex, change frequently and have tended to become increasingly stringent over time. Our costs of complying with current and future environmental, health and safety laws, and our liabilities arising from releases of, or exposure to, regulated substances may adversely affect our results of operations and our financial condition. See "Business—Environmental Matters and Regulation."
Non-U.S. holders of our common stock, in certain situations, could be subject to U.S. federal income tax upon the sale, exchange or other disposition of our common stock.
Our assets consist primarily of interests in U.S. oil and gas properties (which constitute U.S. real property interests for purposes of determining whether we are a U.S. real property holding corporation) and interests in non-U.S. oil and gas properties, the relative values of which at any time may be uncertain and may fluctuate significantly over time. Therefore, we may be, now or at any time while a non-U.S. investor owns our common stock, a U.S. real property holding corporation. As a result, under the Foreign Investment in Real Property Tax Act ("FIRPTA"), certain non-U.S. investors may be subject to U.S. federal income tax on gain from the disposition of shares of our common stock, in which case they would also be required to file U.S. tax returns with respect to such gain. Whether these FIRPTA provisions apply depends on the amount of our common stock that such non-U.S. investors hold and whether, at the time they dispose of their shares, our common stock is regularly traded on an established securities market (such as the New York Stock Exchange ("NYSE")) within the meaning of the applicable Treasury Regulations. So long as our common stock is listed on the NYSE, only a non-U.S. investor who has held, actually or constructively, more than 5% of our common stock may be subject to U.S. federal income tax on the disposition of our common stock under FIRPTA.
59
Table of Contents
We may incur substantial losses and become subject to liability claims as a result of future oil and natural gas operations, for which we may not have adequate insurance coverage.
Several external factors could arise which would significantly impact our ability to effectively insure our oil and natural gas exploration and development operations. Should legislation be passed to increase the minimum insurance limit of the OSFR policy required for future U.S. Gulf of Mexico oil and natural gas exploration, there is no assurance that we will be able to obtain this insurance. The insurance markets may not provide products to financially insure us against all operational risks. For instance, civil penalties for environmental pollution can be very severe and may not be insurable. For some risks, we may not obtain insurance if we believe the market price of available insurance is excessive or prohibitive relative to the risks presented. For instance, we do not purchase business interruption or wind insurance due to the market pricing.
Even when insurance is purchased, exclusions in coverage, unanticipated circumstances and potentially large indemnity obligations may have a material adverse effect on our operations and financial condition. Because third-party contractors and other service providers are used in our offshore operations, we may not realize the intended protections of worker's compensation laws in dealing with their employees. Generally, under our contracts with drilling and other oilfield service contractors, we are obligated, subject to certain exceptions and limitations, to indemnify such contractors for all claims arising out of damage to our property, injury or death to our employees and pollution emanating from the well-bore, including pollution resulting from blow-outs and uncontrolled flows of hydrocarbons.
Our level of indebtedness may increase and thereby reduce our financial flexibility.
In December 2012 we issued $1.38 billion aggregate principal amount of 2.625% convertible senior notes due 2019 (the "notes"). The notes do not contain restrictive covenants, and we may incur significant additional indebtedness in the future in order to make investments or acquisitions or to explore, appraise or develop our oil and natural gas assets. Our level of indebtedness could affect our operations in several ways, including the following:
- •
- a significant portion or all of our cash flows, if and when generated, could be used to service our indebtedness;
- •
- a high level of indebtedness could increase our vulnerability to general adverse economic and industry conditions;
- •
- a high level of indebtedness may place us at a competitive disadvantage compared to our competitors that are less leveraged and therefore, may be able to take advantage of opportunities that our indebtedness could prevent us from pursuing; and
- •
- a high level of indebtedness may impair our ability to obtain additional financing in the future for our development projects, exploration drilling program, working capital, capital expenditures, acquisitions, general corporate or other purposes.
A high level of indebtedness increases the risk that we may default on our debt obligations. Our ability to meet our debt obligations and to reduce our level of indebtedness depends on our future performance. General economic conditions, risks associated with exploring for and producing oil and natural gas, oil and natural gas prices and financial, business and other factors affect our operations and our future performance. Many of these factors are beyond our control. We may not be able to generate sufficient cash flows to pay the interest on our indebtedness and future working capital, borrowings or equity financing may not be available to pay or refinance such indebtedness. Factors that will affect our ability to raise cash through an offering of our equity securities or a refinancing of our indebtedness include financial market conditions, the value of our assets and our performance at the time we need capital.
60
Table of Contents
Conversions of the notes may adversely affect our financial condition and operating results.
Holders of notes will be entitled to convert the notes at their option at any time up until the maturity date, being December 1, 2019. If one or more holders elect to convert their notes, unless we elect to satisfy our conversion obligation by delivering solely shares of our common stock (other than cash in lieu of any fractional share), we would be required to settle a portion or all of our conversion obligation through the payment of cash, which could adversely affect our liquidity. In addition, even if holders do not elect to convert their notes, we could be required under applicable accounting rules to reclassify all or a portion of the outstanding principal of the notes as a current rather than long-term liability, which would result in a material reduction of our net working capital.
The accounting method for convertible debt securities that may be settled in cash, such as the notes, could have a material effect on our reported financial results.
In May 2008, the Financial Accounting Standards Board, which we refer to as FASB, issued FASB Staff Position No. APB 14-1, Accounting for Convertible Debt Instruments That May Be Settled in Cash Upon Conversion (Including Partial Cash Settlement), which has subsequently been codified as Accounting Standards Codification 470-20, Debt with Conversion and Other Options, which we refer to as ASC 470-20. Under ASC 470-20, an entity must separately account for the liability and equity components of the convertible debt instruments (such as the notes) that may be settled entirely or partially in cash upon conversion in a manner that reflects the issuer's economic interest cost. The effect of ASC 470-20 on the accounting for the notes is that the equity component is required to be included in the additional paid-in capital section of stockholders' equity on our consolidated balance sheet, and the value of the equity component would be treated as original issue discount for purposes of accounting for the debt component of the notes. As a result, we will be required to record a greater amount of non-cash interest expense in current periods presented as a result of the amortization of the discounted carrying value of the notes to their face amount over the term of the notes. We will report lower net income in our financial results because ASC 470-20 will require interest to include both the current period's amortization of the debt discount and the instrument's coupon interest, which could adversely affect our reported or future financial results, the trading price of our common stock and the trading price of the notes.
In addition, convertible debt instruments like the notes that may be settled in cash, stock or a combination of cash and stock are currently accounted for utilizing the if converted method, the effect of which is that conversion will not be assumed for purposes of computing diluted earnings per share if the effect would be antidilutive. Under the if-converted method, for diluted earnings per share purposes, convertible debt is antidilutive whenever its interest, net of tax and nondiscretionary adjustments, per common share obtainable on conversion exceeds basic earnings per share. Dilutive securities that are issued during a period and dilutive convertible securities for which conversion options lapse, or for which related debt is extinguished during a period, will be included in the denominator of diluted earnings per share for the period that they were outstanding. Likewise, dilutive convertible securities converted during a period will be included in the denominator for the period prior to actual conversion. Moreover, interest charges applicable to the convertible debt will be added back to the numerator. We cannot be sure that the accounting standards in the future will continue to permit the use of the if converted method. If we are unable to use the if-converted method in accounting for the shares issuable upon conversion of the notes, then our diluted earnings per share would be reduced.
61
Table of Contents
Risks Relating to our Common Stock
Our stock price may be volatile, and investors in our common stock could incur substantial losses.
Our stock price may be volatile. The stock market in general has experienced extreme volatility that has often been unrelated to the operating performance of particular companies. The market price for our common stock may be influenced by many factors, including, but not limited to:
- •
- to what extent our exploration wells are successful;
- •
- the price of oil and natural gas;
- •
- the success of our development operations, and the marketing of any oil and gas we produce;
- •
- regulatory developments in the United States and foreign countries where we operate;
- •
- the recruitment or departure of key personnel;
- •
- quarterly or annual variations in our financial results or those of companies that are perceived to be similar to us;
- •
- market conditions in the industries in which we compete and issuance of new or changed securities;
- •
- increases in operating costs, including cost overruns associated with our exploration and development activities;
- •
- analysts' reports or recommendations;
- •
- the failure of securities analysts to cover our common stock or changes in financial estimates by analysts;
- •
- the inability to meet the financial estimates of analysts who follow our common stock;
- •
- the issuance or sale of any additional securities of ours;
- •
- investor perception of our company and of the industry in which we compete and areas in which we operate; and
- •
- general economic, political and market conditions.
A substantial portion of our total outstanding shares may be sold into the market at any time. This could cause the market price of our common stock to drop significantly, even if our business is doing well.
All of the shares sold in our public offerings are freely tradable without restrictions or further registration under the federal securities laws, unless purchased by our "affiliates" as that term is defined in Rule 144 under the Securities Act of 1933, as amended (the "Securities Act"). Substantially all the remaining shares of common stock are restricted securities as defined in Rule 144 under the Securities Act. Restricted securities may be sold in the U.S. public market only if registered or if they qualify for an exemption from registration, including by reason of Rules 144 or 701 under the Securities Act. All of our restricted shares are eligible for sale in the public market, subject in certain circumstances to the volume, manner of sale limitations with respect to shares held by our affiliates, and other limitations under Rule 144. Additionally, we have registered all shares of our common stock that we may issue under our employee and director benefit plans. These shares can be freely sold in the public market upon issuance, unless pursuant to their terms these stock awards have transfer restrictions attached to them. Sales of a substantial number of shares of our common stock, or the perception in the market that the holders of a large number of shares intend to sell shares, could reduce the market price of our common stock.
62
Table of Contents
Conversion of the notes may dilute the ownership interest of existing stockholders, including holders who have previously converted their notes.
The conversion of some or all of the notes may dilute the ownership interests of existing stockholders. Any sales in the public market of any shares of our common stock issuable upon such conversion could adversely affect prevailing market prices of our common stock. In addition, the anticipated conversion of the notes into shares of our common stock or a combination of cash and shares of our common stock could depress the price of our common stock.
Holders of our common shares will be diluted if additional shares are issued.
We may issue additional shares of common stock, preferred stock, warrants, rights, units and debt securities for general corporate purposes, including, but not limited to, repayment or refinancing of borrowings, working capital, capital expenditures, investments and acquisitions. We may issue additional shares of common stock in connection with complementary or strategic acquisitions of assets or businesses. We also issue restricted stock to our executive officers, employees and independent directors as part of their compensation. If we issue additional shares of common stock in the future, it may have a dilutive effect on our current outstanding stockholders.
Ownership of our capital stock is concentrated among our largest stockholders and their affiliates.
Our former financial sponsors collectively own approximately 26% of our outstanding common stock. These stockholders have influence over all matters that require approval by our stockholders, including the election of directors and approval of significant corporate transactions. This concentration of ownership may limit your ability to influence corporate matters, and as a result, actions may be taken that you may not view as beneficial. Furthermore, these stockholders may sell their shares of common stock at any time. Such sales could be substantial and adversely affect the market price of our common stock.
Provisions of our certificate of incorporation and by-laws could discourage potential acquisition proposals and could deter or prevent a change in control.
Some provisions in our certificate of incorporation and by-laws, as well as Delaware statutes, may have the effect of delaying, deferring or preventing a change in control. These provisions, including those providing for the possible issuance of shares of our preferred stock and the right of the board of directors to amend the by-laws, may make it more difficult for other persons, without the approval of our board of directors, to make a tender offer or otherwise acquire a substantial number of shares of our common stock or to launch other takeover attempts that a stockholder might consider to be in his or her best interest. These provisions could limit the price that some investors might be willing to pay in the future for shares of our common stock.
Provisions of the notes could discourage an acquisition of us by a third party.
Certain provisions of the notes could make it more difficult or more expensive for a third party to acquire us, or may even prevent a third party from acquiring us. For example, upon the occurrence of a fundamental change, holders of the notes will have the right, at their option, to require us to repurchase all of their notes or any portion of the principal amount of such notes in integral multiples of $1,000. In addition, the acquisition of us by a third party could require us, under certain circumstances, to increase the conversion rate for a holder who elects to convert its notes in connection with such acquisition. By discouraging an acquisition of us by a third party, these provisions could have the effect of depriving the holders of our common stock of an opportunity to sell their common stock at a premium over prevailing market prices.
63
Table of Contents
We do not intend to pay dividends on our common shares and, consequently, your only opportunity to achieve a return on your investment is if the price of our shares appreciates.
We do not plan to declare dividends on shares of our common stock in the foreseeable future. Consequently, investors must rely on sales of their shares of common stock after price appreciation, which may never occur, as the only way to realize a return on their investment.
Item 1B. Unresolved Staff Comments
Not applicable.
Item 2. Properties
Please refer to the information under the captions "Business" elsewhere in this Annual Report on Form 10-K.
Item 3. Legal Proceedings
We are not currently party to any legal proceedings. However, from time to time we may be subject to various lawsuits, claims and proceedings that arise in the normal course of business, including employment, commercial, environmental, safety and health matters. It is not presently possible to determine whether any such matters will have a material adverse effect on our consolidated financial position, results of operations, or liquidity.
Item 4. Mine Safety Disclosures
Not applicable.
PART II
Item 5. Market for Registrant's Common Equity, Related Stockholder Matters and Issuer Purchases of Equity Securities
Market Information
Our common stock is traded on the NYSE under the symbol "CIE." On January 31, 2014, the last reported sale price for our common stock on NYSE was $16.37 per share. The following table sets forth, for the periods indicated, the reported high and low sale prices for our common stock on the NYSE.
| | | | | | | |
| | High | | Low | |
|---|
Year ending December 31, 2014 | | | | | | | |
First Quarter (through January 31, 2014) | | $ | 17.65 | | $ | 15.90 | |
Year ended December 31, 2013 | | | | | | | |
Fourth Quarter | | $ | 25.31 | | $ | 13.75 | |
Third Quarter | | | 30.27 | | | 24.15 | |
Second Quarter | | | 29.34 | | | 24.65 | |
First Quarter | | | 28.56 | | | 22.25 | |
Year ended December 31, 2012 | | | | | | | |
Fourth Quarter | | $ | 29.45 | | $ | 19.90 | |
Third Quarter | | | 28.69 | | | 20.59 | |
Second Quarter | | | 31.36 | | | 19.68 | |
First Quarter | | | 36.51 | | | 15.63 | |
64
Table of Contents
Performance Graph
The following performance graph and related information shall not be deemed "soliciting material" or to be "filed" with the SEC, nor shall information be incorporated by reference into any future filing under the Securities Act of 1933 or Securities Exchange Act of 1934, each as amended, except to the extent that we specifically incorporate it by reference into such filing.
The following stock price performance graph is intended to allow review of stockholder returns, expressed in terms of the appreciation of our common stock relative to two broad-based stock performance indices. The information is included for historical comparative purposes only and should not be considered indicative of future stock performance. The graph compares the yearly percentage change in the cumulative total stockholder return on our common stock with the cumulative total return of the Standard & Poor's Composite 500 Stock Index and of the Dow Jones U.S. Exploration & Production Index (formerly Dow Jones Secondary Oil Stock Index) from December 16, 2009, the date we commenced trading on the New York Stock Exchange, through December 31, 2013.
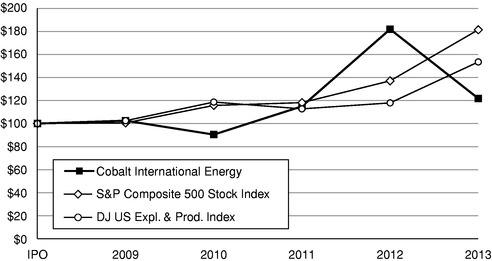
An investment of $100 is assumed to have been made in our common stock, in the S&P's Composite 500 Stock Index (with reinvestment of all dividends) and in the Dow Jones U.S. Exploration & Production Index on December 16, 2009, and its relative performance is tracked through December 31, 2013:
| | | | | | | | | | | | | | | | | | | |
| |
| | Year Ended December 31, | |
|---|
| | As of December 16, 2009 | |
|---|
| | 2009 | | 2010 | | 2011 | | 2012 | | 2013 | |
|---|
Cobalt International Energy, Inc. | | $ | 100.00 | | $ | 102.52 | | $ | 90.44 | | $ | 114.96 | | $ | 181.93 | | $ | 121.85 | |
S&P's Composite 500 Stock Index | | | 100.00 | | | 100.60 | | | 115.75 | | | 118.19 | | | 137.09 | | | 181.47 | |
Dow Jones U.S. Exploration & Production Index | | | 100.00 | | | 102.51 | | | 118.68 | | | 112.79 | | | 117.96 | | | 153.52 | |
Holders
As of December 31, 2013, there were approximately 178 holders of record of our common stock. The number of record holders does not include holders of shares in "street names" or persons, partnerships, associations, corporations or other entities identified in security position listings maintained by depositories.
65
Table of Contents
Dividend Policy
At the present time, we intend to retain all of our future earnings, if any, generated by our operations for the development and growth of our business. The decision to pay dividends on our common stock is at the discretion of our board of directors and depends on our financial condition, results of operations, capital requirements and other factors that our board of directors deems relevant.
Item 6. Selected Financial Data
The selected historical financial information set forth below should be read in conjunction with "Management's Discussion and Analysis of Financial Condition and Results of Operations" and with our financial statements and the notes to those financial statements included elsewhere in this Annual Report on Form 10-K. The consolidated statements of operations and cash flows information for the years ended December 31, 2013, 2012, 2011, 2010, and 2009 were derived from Cobalt International Energy, Inc.'s audited financial statements.
66
Table of Contents
Consolidated Statement of Operations Information:
| | | | | | | | | | | | | | | | |
| | Year Ended December 31, | |
|---|
| | 2013 | | 2012 | | 2011 | | 2010 | | 2009 | |
|---|
| | ($ in thousands except per share data)
| |
|---|
Oil and gas revenue | | $ | — | | $ | — | | $ | — | | $ | — | | $ | — | |
Operating costs and expenses | | | | | | | | | | | | | | | | |
Seismic and exploration | | | 74,213 | | | 61,583 | | | 32,239 | | | 45,030 | | | 30,666 | |
Dry hole expense and impairment | | | 351,050 | | | 134,085 | | | 45,732 | | | 44,178 | | | 14,486 | |
General and administrative | | | 105,547 | | | 87,963 | | | 59,130 | | | 48,063 | | | 35,996 | |
Depreciation and amortization | | | 1,874 | | | 1,197 | | | 735 | | | 787 | | | 622 | |
| | | | | | | | | | | | |
| | | | | | | | | | | | | | | | | |
Total operating costs and expenses | | | 532,684 | | | 284,828 | | | 137,836 | | | 138,058 | | | 81,770 | |
| | | | | | | | | | | | |
| | | | | | | | | | | | | | | | | |
Operating income (loss) | | | (532,684 | ) | | (284,828 | ) | | (137,836 | ) | | (138,058 | ) | | (81,770 | ) |
Other income (expense): | | | | | | | | | | | | | | | | |
Gain on sale of assets | | | 2,993 | | | — | | | — | | | — | | | — | |
Interest income | | | 6,043 | | | 5,041 | | | 4,199 | | | 1,582 | | | 513 | |
Interest expense | | | (65,376 | ) | | (3,212 | ) | | — | | | — | | | — | |
| | | | | | | | | | | | |
| | | | | | | | | | | | | | | | | |
Total other income (expense) | | | (56,340 | ) | | 1,829 | | | 4,199 | | | 1,582 | | | 513 | |
| | | | | | | | | | | | |
| | | | | | | | | | | | | | | | | |
Net income (loss) before income tax | | | (589,024 | ) | | (282,999 | ) | | (133,637 | ) | | (136,476 | ) | | (81,257 | ) |
Income tax expense (benefit)(1)(2) | | | — | | | — | | | — | | | — | | | — | |
| | | | | | | | | | | | |
| | | | | | | | | | | | | | | | | |
Net income (loss) | | $ | (589,024 | ) | $ | (282,999 | ) | $ | (133,637 | ) | $ | (136,476 | ) | $ | (81,257 | ) |
| | | | | | | | | | | | |
| | | | | | | | | | | | | | | | | |
| | | | | | | | | | | | | | | | | |
| | | | | | | | | | | | |
Basic and diluted income (loss) per common share | | $ | (1.45 | ) | $ | (0.70 | ) | $ | (0.35 | ) | $ | (0.39 | ) | | | |
| | | | | | | | | | | | | |
| | | | | | | | | | | | | | | | | |
| | | | | | | | | | | | | | | | | |
| | | | | | | | | | | | | |
Weighted average number of common shares—basic and diluted | | | 406,839,997 | | | 403,356,174 | | | 376,603,520 | | | 349,342,050 | | | | |
| | | | | | | | | | | | | |
| | | | | | | | | | | | | | | | | |
| | | | | | | | | | | | | | | | | |
| | | | | | | | | | | | | |
Pro forma net income (loss) (unaudited)(1): | | | | | | | | | | | | | | | | |
Net income (loss) as reported | | | | | | | | | | | | | | $ | (81,257 | ) |
Pro forma income tax expense(2) | | | | | | | | | | | | | | | — | |
Pro forma management fees(3) | | | | | | | | | | | | | | | 2,872 | |
| | | | | | | | | | | | | | | | |
| | | | | | | | | | | | | | | | | |
Pro forma net income (loss) allocable to common shareholders | | | | | | | | | | | | | | $ | (78,385 | ) |
| | | | | | | | | | | | | | | | |
| | | | | | | | | | | | | | | | | |
| | | | | | | | | | | | | | | | | |
| | | | | | | | | | | | | | | | |
Pro forma basic and diluted income (loss) per share(4) | | | | | | | | | | | | | | $ | (0.33 | ) |
| | | | | | | | | | | | | | | | |
| | | | | | | | | | | | | | | | | |
| | | | | | | | | | | | | | | | | |
| | | | | | | | | | | | | | | | |
Pro forma weighted average number of common shares—basic and diluted(5) | | | | | | | | | | | | | | | 236,751,219 | |
| | | | | | | | | | | | | | | | |
| | | | | | | | | | | | | | | | �� | |
| | | | | | | | | | | | | | | | | |
| | | | | | | | | | | | | | | | |
- (1)
- Upon completion of our initial public offering in 2009, Cobalt International Energy, L.P. became wholly-owned by Cobalt International Energy, Inc. Upon the completion of our corporate reorganization, all of Cobalt International Energy, L.P.'s outstanding limited partnership interests were exchanged for shares of Cobalt International Energy, Inc.'s common stock based on these interests' relative rights as set forth
67
Table of Contents
in Cobalt International Energy, L.P.'s limited partnership agreement. Additionally, we became subject to federal and state income taxes.
- (2)
- No income tax benefit has been reflected since a full valuation allowance has been established against the deferred tax asset that would have been generated as a result of the operating results.
- (3)
- Upon completion of our corporate reorganization, the right of our former financial sponsors to receive a management fee terminated.
- (4)
- Nonvested restricted stock awards of 8,015,041 as of December 31, 2009 were excluded from the pro forma calculation of diluted income (loss) per common share because they were anti-dilutive for the applicable period.
- (5)
- The pro forma weighted average common shares outstanding have been calculated as if the conversion of all partnership units into shares of common shares occurred as of the beginning of the year.
Consolidated Balance Sheet Information:
| | | | | | | | | | | | | | | | |
| | As of December 31, | |
|---|
| | 2013 | | 2012 | | 2011 | | 2010 | | 2009 | |
|---|
| | ($ in thousands)
| |
|---|
Cash and cash equivalents(1) | | $ | 192,460 | | $ | 1,425,815 | | $ | 292,546 | | $ | 302,720 | | $ | 1,093,100 | |
Short-term restricted funds | | | 200,339 | | | 90,440 | | | 69,009 | | | — | | | — | |
Short-term investments(2) | | | 1,319,380 | | | 789,668 | | | 858,293 | | | 534,933 | | | — | |
Total current assets | | | 1,967,443 | | | 2,456,742 | | | 1,335,094 | | | 889,632 | | | 1,153,946 | |
Total property, plant and equipment(3) | | | 1,476,275 | | | 1,099,756 | | | 863,326 | | | 463,769 | | | 471,612 | |
Long-term restricted funds | | | 104,496 | | | 395,652 | | | 270,235 | | | 338,515 | | | 186,547 | |
Long-term investments | | | 14,661 | | | 36,267 | | | 47,232 | | | 40,003 | | | — | |
Total assets | | | 3,633,673 | | | 4,011,459 | | | 2,527,944 | | | 1,746,443 | | | 1,812,105 | |
Total current liabilities(4) | | | 340,967 | | | 160,956 | | | 238,069 | | | 24,559 | | | 70,523 | |
Total long term liabilities(5) | | | 1,163,560 | | | 1,161,285 | | | 210,961 | | | 2,850 | | | — | |
Total partners' capital/stockholders' equity | | | 2,129,146 | | | 2,689,218 | | | 2,078,914 | | | 1,719,034 | | | 1,741,582 | |
Total liabilities and partners' capital/stockholders' equity | | | 3,633,673 | | | 4,011,459 | | | 2,527,944 | | | 1,746,443 | | | 1,812,105 | |
- (1)
- The decrease in cash and cash equivalents from December 31, 2012 to 2013 was primarily due to the investment in held-to-maturity securities from the proceeds we received upon the issuance of our 2.625% convertible senior notes due 2019 in December 2012. The increase in cash and cash equivalents from December 31, 2011 to December 31, 2012 was due to the proceeds that we received on December 17, 2012 from the issuance of our 2.625% convertible senior notes due 2019. These proceeds were temporarily held in money market funds as of December 31, 2012. The decrease from December 31, 2009 to December 31, 2010 was due to increases in investment in short-term and long-term investments. Cash and cash equivalents at December 31, 2009 includes the proceeds from our initial public offering.
- (2)
- The increase in short-term investments from December 31, 2012 to December 31, 2013 was attributable to the investment of the proceeds from the issuance of our 2.625% convertible senior notes in December 2012. The increase in investments from December 31, 2010 to December 31, 2011 was attributed to the investment of the proceeds from the equity offering of common stock during 2011.
- (3)
- The increase from December 31, 2012 to December 31, 2013 primarily reflects the capitalized costs for the Mavinga #1, Lontra #1, Bicuar #1A, Orca #1 and Diaman #1B exploration well costs. The increase from December 31, 2011 to 2012 reflects acquisition of unproved leases in the U.S.
68
Table of Contents
Gulf of Mexico and the capitalized costs for the Heidelberg #3 and Cameia #2 appraisal wells and the North Platte #1 exploration well. The increase from December 31, 2010 to December 31, 2011 reflects the acquisition costs of Block 20 offshore Angola. The decrease in 2010 reflects the farm-out of the U.S. Gulf of Mexico lease interests to Total and Sonangol.
- (4)
- The increase in current liabilities at December 31, 2013 was due to year-end accruals for exploration costs primarily in West Africa and the short-term portion of the social and bonus payment obligations for Blocks 9, 20 and 21. The decrease in current liabilities at December 31, 2012 was primarily attributed to the payment of certain bonus obligations for Block 20 during 2012. The increase in current liabilities at December 31, 2011 consists of year-end accruals for exploration costs in the U.S. Gulf of Mexico and West Africa and the short-term portion of the social and bonus payment obligations for Blocks 9, 20 and 21.
- (5)
- The significant increase in long-term liabilities from December 31, 2011 to December 31, 2012 reflects the issuance of the 2.625% convertible senior notes due 2019 on December 17, 2012. The increase in long-term liabilities at December 31, 2011 reflects the long-term portion of the social and bonus payment obligations for Blocks 9, 20 and 21.
Consolidated Statement of Cash Flows Information:
| | | | | | | | | | | | | | | | |
| | Year Ended December 31, | |
|---|
| | 2013 | | 2012 | | 2011 | | 2010 | | 2009 | |
|---|
| | ($ in thousands)
| |
|---|
Net cash provided by (used in): | | | | | | | | | | | | | | | | |
Operating activities | | $ | (216,368 | ) | $ | (140,397 | ) | $ | (57,795 | ) | $ | (133,264 | ) | $ | (75,486 | ) |
Investing activities | | | (1,015,995 | ) | | (564,761 | ) | | (430,391 | ) | | (758,372 | ) | | 87,123 | |
Financing activities | | | (992 | ) | | 1,838,427 | | | 478,012 | | | 101,256 | | | 1,076,360 | |
69
Table of Contents
Item 7. Management's Discussion and Analysis of Financial Condition and Results of Operations
The following discussion contains forward-looking statements that involve risks and uncertainties. Our actual results may differ materially from those discussed in the forward-looking statements as a result of various factors, including, without limitation, those set forth in "Risk Factors," "Cautionary Note Regarding Forward-Looking Statements," and the other matters set forth in this Annual Report on Form 10-K. The following discussion of our financial condition and results of operations should be read in conjunction with our financial statements and the notes thereto included elsewhere in this Annual Report on Form 10-K, as well as the information presented under "Selected Financial Data." Due to the fact that we have not generated any revenues, we believe that the financial information contained in this Annual Report on Form 10-K is not indicative of, or comparable to, the financial profile that we expect to have once we begin to generate revenues. Except to the extent required by law, we undertake no obligation to update publicly any forward-looking statements for any reason, even if new information becomes available or other events occur in the future.
We are an independent exploration and production company with operations in the deepwater U.S. Gulf of Mexico and offshore Angola and Gabon in West Africa. Since our founding in 2005, our oil-focused, below-salt exploration efforts have been successful in each of our operating areas, resulting in nine discoveries out of the fourteen exploration prospects drilled. These nine discoveries consist of North Platte, Heidelberg and Shenandoah in the U.S. Gulf of Mexico; Cameia, Lontra, Mavinga, Bicuar and Orca offshore Angola; and Diaman offshore Gabon.
Factors Affecting Comparability of Future Results
You should read this management's discussion and analysis of our financial condition and results of operations in conjunction with our historical financial statements included elsewhere in this Annual Report on Form 10-K. Below are the period-to-period comparisons of our historical results and the analysis of our financial condition. In addition to the impact of the matters discussed in "Risk Factors," our future results could differ materially from our historical results due to a variety of factors, including the following:
Success in the Discovery and Development of Oil and Gas Reserves. Because we have no operating history in the production of oil and gas, our future results of operations and financial condition will be directly affected by our ability to discover and develop reserves through our drilling activities. The calculation of our geological and petrophysical estimates is complex and imprecise, and it is possible that our future exploration will not result in additional discoveries, and, even if we are able to successfully make such discoveries, there is no certainty that the discoveries will be commercially viable to produce. Our results of operations will be adversely affected in the event that our estimated oil and gas asset base does not result in reserves that may eventually be commercially developed.
Oil and Gas Revenue. We have not yet commenced oil and gas production. If and when we do commence production, we expect to generate revenue from such production. No oil and gas revenue is reflected in our historical financial statements.
Production Costs. We have not yet commenced oil and gas production. If and when we do commence production, we will incur production costs. Production costs are the costs incurred in the operation of producing and processing our production and are primarily comprised of lease operating expense, workover costs and production and ad valorem taxes. No production costs are reflected in our historical financial statements.
General and Administrative Expenses. These costs include expenses associated with our staff costs, information technology, rent, travel, annual and quarterly reporting, investor relations, registrar and transfer agent fees, incremental insurance costs, and accounting and legal services.
70
Table of Contents
Depreciation, Depletion and Amortization. We have not yet commenced oil or natural gas production. If and when we do commence production, we will amortize the costs of successful exploration, appraisal, drilling and field development using the unit-of-production method based on total estimated proved developed oil and gas reserves. Costs of acquiring proved and unproved leasehold properties and associated asset retirement costs will be amortized using the unit-of-production method based on total estimated proved developed and undeveloped reserves. No depletion of oil and gas properties is reflected in our historical financial statements.
Demand and Price. The demand for oil and gas is susceptible to volatility related to, among other factors, the level of global economic activity and may also fluctuate depending on the performance of specific industries. We expect that a decrease in economic activity, in the United States and elsewhere, would adversely affect demand for oil and gas we expect to produce. Since we have not generated revenues, these key factors will only affect our financial statements when we produce and sell hydrocarbons.
We expect to earn income from:
- •
- domestic and international sales, which consist of sales of oil and natural gas;
- •
- sales to international markets; and
- •
- other sources, including services, investment income and foreign exchange gains.
We expect that our expenses will include:
- •
- costs of sales (which are composed of production costs, insurance, and costs associated with the operation of our wells);
- •
- maintenance and repair of property and equipment;
- •
- costs of acquiring new leases or licenses;
- •
- costs of acquiring seismic data;
- •
- depreciation, amortization and impairment of fixed assets;
- •
- depletion of oilfields;
- •
- exploration costs;
- •
- selling expenses (which include expenses relating to the transportation, marketing and distribution of our products) and general and administrative expenses; and
- •
- interest expense and foreign exchange losses.
We expect that fluctuations in our financial condition and results of operations will be driven by a combination of factors, including:
- •
- the volumes of oil and natural gas we produce and sell;
- •
- changes in the domestic and international prices of oil and natural gas, which are denominated in U.S. dollars;
- •
- fluctuations in the royalty rates on the leases that we hold;
- •
- our success in future bidding rounds for leases and concessions;
- •
- political and economic conditions in the United States, Angola and Gabon; and
- •
- the amount of taxes and duties that we are required to pay with respect to our future operations, by virtue of our status as a U.S. company and our involvement in the oil and gas industry.
71
Table of Contents
Results of Operations
We operate our business in two geographic segments: the U.S. Gulf of Mexico and West Africa. The discussion of the results of operations and the period-to-period comparisons presented below for each operating segment and our consolidated operations analyzes our historical results. The following discussion may not be indicative of future results.
Fiscal Years Ended December 31, 2013 vs. 2012
| | | | | | | | | | | | | |
| | Year Ended
December 31, | |
| |
| |
|---|
| | Increase
(Decrease) | | Percentage
Change | |
|---|
| | 2013 | | 2012 | |
|---|
| | ($ in thousands)
| |
|---|
U.S. Gulf of Mexico Segment: | | | | | | | | | | | | | |
Oil and gas revenue | | $ | — | | $ | — | | $ | — | | | — | % |
Operating costs and expenses | | | | | | | | | | | | | |
Seismic and exploration | | | 48,688 | | | 32,874 | | | 15,814 | | | 48 | % |
Dry hole expense and impairment | | | 207,039 | | | 134,085 | | | 72,954 | | | 54 | % |
General and administrative | | | 72,777 | | | 63,270 | | | 9,507 | | | 15 | % |
Depreciation and amortization | | | 1,328 | | | 967 | | | 361 | | | 37 | % |
| | | | | | | | | | |
| | | | | | | | | | | | | | |
Total operating costs and expenses | | | 329,832 | | | 231,196 | | | 98,636 | | | 43 | % |
| | | | | | | | | | |
| | | | | | | | | | | | | | |
Operating income (loss) | | | (329,832 | ) | | (231,196 | ) | | 98,636 | | | 43 | % |
West Africa Segment: | | |
| | |
| | |
| | |
| |
Oil and gas revenue | | $ | — | | $ | — | | $ | — | | | — | % |
Operating costs and expenses | | | | | | | | | | | | | |
Seismic and exploration | | | 25,525 | | | 28,709 | | | (3,184 | ) | | (11 | )% |
Dry hole expense and impairment | | | 144,011 | | | — | | | 144,011 | | | — | % |
General and administrative | | | 32,770 | | | 24,693 | | | 8,077 | | | 33 | % |
Depreciation and amortization | | | 546 | | | 230 | | | 316 | | | 137 | % |
| | | | | | | | | | |
| | | | | | | | | | | | | | |
Total operating costs and expenses | | | 202,852 | | | 53,632 | | | 149,220 | | | 278 | % |
| | | | | | | | | | |
| | | | | | | | | | | | | | |
Operating income (loss) | | | (202,852 | ) | | (53,632 | ) | | 149,220 | | | 278 | % |
Consolidated Operations: | | |
| | |
| | |
| | |
| |
Oil and gas revenue | | $ | — | | $ | — | | $ | — | | | — | % |
Operating costs and expenses | | | | | | | | | | | | | |
Seismic and exploration | | | 74,213 | | | 61,583 | | | 12,630 | | | 21 | % |
Dry hole expense and impairment | | | 351,050 | | | 134,085 | | | 216,965 | | | 162 | % |
General and administrative | | | 105,547 | | | 87,963 | | | 17,584 | | | 20 | % |
Depreciation and amortization | | | 1,874 | | | 1,197 | | | 677 | | | 57 | % |
| | | | | | | | | | |
| | | | | | | | | | | | | | |
Total operating costs and expenses | | | 532,684 | | | 284,828 | | | 247,856 | | | 87 | % |
| | | | | | | | | | |
| | | | | | | | | | | | | | |
Operating income (loss) | | | (532,684 | ) | | (284,828 | ) | | 247,856 | | | 87 | % |
Other income (expense) | | | | | | | | | | | | | |
Gain on sale of assets | | | 2,993 | | | — | | | 2,993 | | | — | % |
Interest income | | | 6,043 | | | 5,041 | | | 1,002 | | | 20 | % |
Interest expense | | | (65,376 | ) | | (3,212 | ) | | 62,164 | | | 1935 | % |
| | | | | | | | | | |
| | | | | | | | | | | | | | |
Total other income (expense) | | | (56,340 | ) | | 1,829 | | | 58,169 | | | 3180 | % |
| | | | | | | | | | |
| | | | | | | | | | | | | | |
Net income (loss) before income tax | | | (589,024 | ) | | (282,999 | ) | | 306,025 | | | 108 | % |
Income tax expense (benefit) | | | — | | | — | | | — | | | — | |
| | | | | | | | | | |
| | | | | | | | | | | | | | |
Net income (loss) | | $ | (589,024 | ) | $ | (282,999 | ) | $ | 306,025 | | | 108 | % |
| | | | | | | | | | |
| | | | | | | | | | | | | | |
| | | | | | | | | | | | | | |
| | | | | | | | | | |
72
Table of Contents
Oil and gas revenue. We have not yet commenced oil production in the U.S. Gulf of Mexico. Therefore, we did not realize any oil and gas revenue during the years ended December 31, 2013 and 2012.
Operating costs and expenses. Our operating costs and expenses for our U.S. Gulf of Mexico operations consisted of the following during the years ended December 31, 2013 and 2012:
Seismic and exploration. Seismic and exploration costs increased by approximately $15.8 million during the year ended December 31, 2013, as compared to the year ended December 31, 2012. The increase was primarily due to a $16.6 million increase in seismic costs and a $0.3 million increase in delay rentals, offset by the decrease of $1.1 million in exploration expenses which were primarily attributable to standby and regulatory acceptance costs incurred for Ensco 8503 drilling rig during the year ended December 31, 2012. There were no standby costs incurred for the Ensco 8503 drilling rig during the year ended December 31, 2013.
Dry hole expense and impairment. Dry hole expense and impairment increased by $73.0 million during the year ended December 31, 2013, as compared to the year ended December 31, 2012. The increase is due to impairment of unproved leasehold properties and dry hole expense written off against exploration wells as reflected in the following table:
| | | | | | | | | | |
| | Year Ended December 31, | |
|---|
| | 2013 | | 2012 | | Increase
(Decrease) | |
|---|
| | (in thousands)
| |
|---|
Impairment of Unproved leasehold: | | | | | | | | | | |
Ligurian prospect | | $ | — | | $ | 41,861 | | $ | (41,861 | ) |
Ardennes prospect | | | 29,122 | | | — | | | 29,122 | |
Aegean prospect | | | 38,499 | | | — | | | 38,499 | |
Other leasehold(1) | | | 10,002 | | | 8,298 | | | 1,704 | |
Amortization of leasehold with carrying value under $1 million | | | 9,417 | | | 10,007 | | | (590 | ) |
Dry Hole Expense: | | | | | | | | | | |
Ligurian #1 exploration well | | | 631 | | | 8,100 | | | (7,469 | ) |
Ligurian #2 exploration well | | | — | | | 48,994 | | | (48,994 | ) |
Heidelberg #3 appraisal well side track | | | — | | | 4,109 | | | (4,109 | ) |
Shenandoah #2 appraisal well | | | — | | | 12,716 | | | (12,716 | ) |
Ardennes #1 exploration well | | | 66,133 | | | — | | | 66,133 | |
Aegean #1 exploration well | | | 53,235 | | | — | | | 53,235 | |
| | | | | | | | |
| | | | | | | | | | | |
| | $ | 207,039 | | $ | 134,085 | | $ | 72,954 | |
| | | | | | | | |
| | | | | | | | | | | |
| | | | | | | | | | | |
| | | | | | | | |
- (1)
- Other leasehold includes certain unproved oil and gas leases for properties in the U.S. Gulf of Mexico with carrying value greater than $1 million that we have no exploration activity planned, based on our three-year exploration plan, during the remaining term of the leases.
General and administrative. General and administrative costs increased by $9.5 million during the year ended December 31, 2013 as compared to the year ended December 31, 2012. The increase in general and administrative costs during this period was primarily attributed to an $11.4 million increase in staff related expenses which includes non-cash equity compensation, a $12.9 million increase in legal and other consulting fees, an $8.0 million increase in insurance and office support costs, offset by an increase of $22.8 million in recoveries from partners due to the increase in drilling activities.
Depreciation and amortization. Depreciation and amortization did not change significantly during the year ended December 31, 2013 as compared to the year ended December 31, 2012.
73
Table of Contents
West Africa Segment:
Oil and gas revenue. We have not yet commenced oil production in West Africa. Therefore, we did not realize any oil and gas revenue during the years ended December 31, 2013 and 2012.
Operating costs and expenses. Our operating costs and expenses for the West Africa operations consisted of the following during the years ended December 31, 2013 and 2012:
Seismic and exploration. Seismic and exploration costs decreased by approximately $3.2 million during the year ended December 31, 2013, as compared to the year ended December 31, 2012. The decrease of $3.2 million was primarily attributed to an increase of $4.7 million in seismic costs, offset by a decrease of $7.9 million in other exploration costs. During the year ended December 31, 2012, approximately $11.7 million in standby costs were incurred associated with the drilling of the Cameia #2 appraisal well as compared to $3.6 million in standby costs incurred in early 2013 associated with drilling equipment issues with the Ocean Confidence drilling rig.
Dry hole expense and impairment. Dry hole expense and impairment increased by $144.0 million during the year ended December 31, 2013, as compared to the year ended December 31, 2012. The increase is due to dry hole expense during the years ended December 31, 2013 as reflected in the following table:
| | | | | | | | | | |
| | Year Ended December 31, | |
|---|
| | 2013 | | 2012 | | Increase
(Decrease) | |
|---|
| | ($ in thousands)
| |
|---|
Dry Hole Expense(1): | | | | | | | | | | |
Cameia #2 drill stem test | | $ | 81,607 | | $ | — | | $ | 81,607 | |
Diaman #1 exploration well | | | 17,066 | | | — | | | 17,066 | |
Mavinga #1 exploration well | | | 12,520 | | | — | | | 12,520 | |
Lontra #1 exploration well | | | 32,247 | | | — | | | 32,247 | |
Other Impairment: | | | | | | | | | | |
Obsolete inventory | | | 571 | | | — | | | 571 | |
| | | | | | | | |
| | | | | | | | | | | |
| | | | | | | | | | | |
| | | | | | | | |
| | $ | 144,011 | | $ | — | | $ | 144,011 | |
| | | | | | | | |
| | | | | | | | | | | |
| | | | | | | | | | | |
| | | | | | | | |
- (1)
- The amounts listed above and charged to dry hole expense for our Lontra #1 and Mavinga #1 exploration wells only relate to the costs associated with drilling the lowest intervals beneath the pay zones. The majority of the well costs associated with our Lontra #1 and Mavinga #1 exploration wells have been capitalized as of December 31, 2013 and will remain suspended pending further evaluation of these wells. The amounts listed above for our Diaman #1 exploration well were charged to dry hole expense because this well encountered mechanical problems early in the drilling process and was re-spud as the Diaman #1B exploration well.
General and administrative. General and administrative costs increased by $8.1 million during the year ended December 31, 2013 as compared to the year ended December 31, 2012. The increase in general and administrative costs during this period was primarily attributed to a $2.1 million increase in staff related expenses in Angola, a $4.5 million increase in other office related expenses and a $1.5 million increase for contractors and consulting services incurred in support of West Africa operations during the year ended December 31, 2013.
Depreciation and amortization. Depreciation and amortization did not change significantly during the year ended December 31, 2013 as compared to the year ended December 31, 2012.
Consolidated:
Other income (expense). Other income (expense) increased by $58.2 million for the year ended December 31, 2013 as compared to the year ended December 31, 2012. The increase was primarily due
74
Table of Contents
to the increase of $1.0 million from interest earned in investment securities and $3.0 million in gain on sale of other assets, offset by $62.2 million recognized for the interest expense associated with our 2.625% convertible senior notes due 2019 during the year ended December 31, 2012.
Income taxes. As a result of net operating losses, for income tax purposes, we recorded a net deferred tax asset of $461.6 million and $269.6 million with a corresponding full valuation of $461.6 million and $269.6 million for the years ended December 31, 2013 and 2012, respectively.
Fiscal Years Ended December 31, 2012 vs. 2011
| | | | | | | | | | | | | |
| | Year Ended
December 31, | |
| |
| |
|---|
| | Increase
(Decrease) | | Percentage
Change | |
|---|
| | 2012 | | 2011 | |
|---|
| | ($ in thousands)
| |
|---|
U.S. Gulf of Mexico Segment: | | | | | | | | | | | | | |
Oil and gas revenue | | $ | — | | $ | — | | $ | — | | | — | % |
Operating costs and expenses | | | | | | | | | | | | | |
Seismic and exploration | | | 32,874 | | | 10,707 | | | 22,167 | | | 207 | % |
Dry hole expense and impairment | | | 134,085 | | | 23,323 | | | 110,762 | | | 475 | % |
General and administrative | | | 63,270 | | | 45,742 | | | 17,528 | | | 38 | % |
Depreciation and amortization | | | 967 | | | 653 | | | 314 | | | 48 | % |
| | | | | | | | | | |
| | | | | | | | | | | | | | |
Total operating costs and expenses | | | 231,196 | | | 80,425 | | | 150,771 | | | 187 | % |
| | | | | | | | | | |
| | | | | | | | | | | | | | |
Operating income (loss) | | | (231,196 | ) | | (80,425 | ) | | 150,771 | | | 187 | % |
West Africa Segment: | | |
| | |
| | |
| | |
| |
Oil and gas revenue | | $ | — | | $ | — | | $ | — | | | — | % |
Operating costs and expenses | | | | | | | | | | | | | |
Seismic and exploration | | | 28,709 | | | 21,532 | | | 7,177 | | | 33 | % |
Dry hole expense and impairment | | | — | | | 22,409 | | | (22,409 | ) | | (100 | )% |
General and administrative | | | 24,693 | | | 13,388 | | | 11,305 | | | 84 | % |
Depreciation and amortization | | | 230 | | | 82 | | | 148 | | | 180 | % |
| | | | | | | | | | |
| | | | | | | | | | | | | | |
Total operating costs and expenses | | | 53,632 | | | 57,411 | | | (3,779 | ) | | (7 | )% |
| | | | | | | | | | |
| | | | | | | | | | | | | | |
Operating income (loss) | | | (53,632 | ) | | (57,411 | ) | | (3,779 | ) | | (7 | )% |
Consolidated Operations: | | |
| | |
| | |
| | |
| |
Oil and gas revenue | | $ | — | | $ | — | | $ | — | | | — | % |
Operating costs and expenses | | | | | | | | | | | | | |
Seismic and exploration | | | 61,583 | | | 32,239 | | | 29,344 | | | 91 | % |
Dry hole expense and impairment | | | 134,085 | | | 45,732 | | | 88,353 | | | 193 | % |
General and administrative | | | 87,963 | | | 59,130 | | | 28,833 | | | 49 | % |
Depreciation and amortization | | | 1,197 | | | 735 | | | 462 | | | 63 | % |
| | | | | | | | | | |
| | | | | | | | | | | | | | |
Total operating costs and expenses | | | 284,828 | | | 137,836 | | | 146,992 | | | 107 | % |
| | | | | | | | | | |
| | | | | | | | | | | | | | |
Operating income (loss) | | | (284,828 | ) | | (137,836 | ) | | 146,992 | | | 107 | % |
Other income (expense) | | | | | | | | | | | | | |
Interest income | | | 5,041 | | | 4,199 | | | 842 | | | 20 | % |
Interest expense | | | (3,212 | ) | | — | | | 3,212 | | | — | |
| | | | | | | | | | |
| | | | | | | | | | | | | | |
Total other income (expense) | | | 1,829 | | | 4,199 | | | (2,370 | ) | | (57 | )% |
| | | | | | | | | | |
| | | | | | | | | | | | | | |
Net income (loss) before income tax | | | (282,999 | ) | | (133,637 | ) | | 149,362 | | | 112 | % |
Income tax expense (benefit) | | | — | | | — | | | — | | | — | |
| | | | | | | | | | |
| | | | | | | | | ��� | | | | | |
Net income (loss) | | $ | (282,999 | ) | $ | (133,637 | ) | $ | 149,362 | | | 112 | % |
| | | | | | | | | | |
| | | | | | | | | | | | | | |
| | | | | | | | | | | | | | |
| | | | | | | | | | |
75
Table of Contents
Oil and gas revenue. We have not yet commenced oil production in the U.S. Gulf of Mexico. Therefore, we did not realize any oil and gas revenue during the years ended December 31, 2012 and 2011.
Operating costs and expenses. Our operating costs and expenses for our U.S. Gulf of Mexico operations consisted of the following during the years ended December 31, 2012 and 2011:
Seismic and exploration. Seismic and exploration costs increased by approximately $22.2 million during the year ended December 31, 2012, as compared to the year ended December 31, 2011. The increase was primarily due to a $24.5 million increase in seismic costs and a $0.3 million increase in delay rentals offset by the decrease of $2.6 million in exploration expenses which were primarily attributable to standby and regulatory acceptance costs incurred for Ensco 8503 drilling rig during the year ended December 31, 2011.
Dry hole expense and impairment. Dry hole expense and impairment increased by $110.8 million during the year ended December 31, 2012, as compared to the year ended December 31, 2011. The increase is due to impairment of unproved leasehold properties and dry hole expense written off against exploration wells as reflected in the following table:
| | | | | | | | | | |
| | Year Ended December 31, | |
|---|
| | 2012 | | 2011 | | Increase
(Decrease) | |
|---|
| | (in thousands)
| |
|---|
Impairment of Unproved leasehold: | | | | | | | | | | |
Ligurian prospect | | $ | 41,861 | | $ | — | | $ | 41,861 | |
Other leasehold(1) | | | 8,298 | | | — | | | 8,298 | |
Amortization of leasehold with carrying value under $1 million | | | 10,007 | | | 9,127 | | | 880 | |
Dry Hole Expense: | | | | | | | | | | |
Ligurian #1 exploration well | | | 8,100 | | | — | | | 8,100 | |
Ligurian #2 exploration well | | | 48,994 | | | — | | | 48,994 | |
Heidelberg #2 appraisal well | | | — | | | 5,999 | | | (5,999 | ) |
Heidelberg #3 appraisal well side track | | | 4,109 | | | — | | | 4,109 | |
Shenandoah #2 appraisal well | | | 12,716 | | | — | | | 12,716 | |
Criollo #1 exploration well | | | — | | | 8,197 | | | (8,197 | ) |
| | | | | | | | |
| | | | | | | | | | | |
| | $ | 134,085 | | $ | 23,323 | | $ | 110,762 | |
| | | | | | | | |
| | | | | | | | | | | |
| | | | | | | | | | | |
| | | | | | | | |
- (1)
- Other leasehold includes certain unproved oil and gas leases for properties in the U.S. Gulf of Mexico with carrying value greater than $1 million that we have no exploration activity planned, based on our three-year exploration plan, during the remaining term of the leases.
76
Table of Contents
General and administrative. General and administrative costs increased by $17.5 million during the year ended December 31, 2012 as compared to the year ended December 31, 2011. The increase in general and administrative costs during this period was primarily attributed to a $16.6 million increase in staff related expenses which includes non-cash equity compensation, a $6.8 million increase in legal and other consulting fees, a $1.0 million increase in information and technology expenses, a $2.3 million increase in office rent and facilities due to the move to our new office building in Houston and a $2.6 million increase in other office related expenses, offset by an increase of $11.8 million in recoveries from partners due to the increase in drilling activities.
Depreciation and amortization. Depreciation and amortization did not change significantly during the year ended December 31, 2012 as compared to the year ended December 31, 2011.
West Africa Segment:
Oil and gas revenue. We have not yet commenced oil production in West Africa. Therefore, we did not realize any oil and gas revenue during the years ended December 31, 2012 and 2011.
Operating costs and expenses. Our operating costs and expenses for the West Africa operations consisted of the following during the years ended December 31, 2012 and 2011:
Seismic and exploration. Seismic and exploration costs increased by approximately $7.2 million during the year ended December 31, 2012, as compared to the year ended December 31, 2011. The increase was due to the net effect of $9.7 million for standby costs associated with drilling of the Cameia #2 appraisal well charged to other exploration expenses which were offset by decrease of $2.5 million incurred in seismic costs during the year ended December 31, 2012.
Dry hole expense and impairment. Dry hole expense and impairment decreased by $22.4 million during the year ended December 31, 2012, as compared to the year ended December 31, 2011. The decrease was due to a $22.4 million charge against the Bicuar #1 exploration well during the year ended December 31, 2011. The Company did not have any dry hole charge for West Africa operations for the year ended December 31, 2012.
General and administrative. General and administrative costs increased by $11.3 million during the year ended December 31, 2012 as compared to the year ended December 31, 2011. The increase in general and administrative costs during this period was primarily attributed to a $2.4 million increase in office rent and facilities related to the move to the new office building in Luanda, a $1.1 million increase in expatriate housing and related costs, a $1.3 million increase in other office related expenses and a $6.5 million increase for contractors and consulting services incurred in support of West Africa operations during the year ended December 31, 2012.
Depreciation and amortization. Depreciation and amortization did not change significantly during the year ended December 31, 2012 as compared to the year ended December 31, 2011.
Consolidated:
Other income. Other income decreased by $2.4 million for the year ended December 31, 2012 as compared to the year ended December 31, 2011. The decrease was primarily due to increase of $0.8 million from interest earned on investment securities offset by $3.2 million recognized for interest expense associated with our 2.625% convertible senior notes due 2019 during the year ended December 31, 2012.
Income taxes. As a result of net operating losses, for income tax purposes, we recorded a net deferred tax asset of $269.6 million and $177.2 million with a corresponding full valuation of $269.6 million and $177.2 million for the years ended December 31, 2012 and 2011, respectively.
77
Table of Contents
We are a development stage enterprise and will continue to be so until commencement of substantial production from our oil and natural gas properties. Our Heidelberg project was formally sanctioned in mid-2013, and Anadarko, as operator, currently estimates first production from Heidelberg in 2016. We continue to advance our Cameia project through the project development life-cycle following the drilling of the successful Cameia #2 appraisal well. On February 28, 2014, we will submit a formal declaration of commercial discovery to Sonangol with respect to our Cameia project. We plan to drill an additional appraisal well on the Cameia field in 2014 and expect to submit the integrated field development plan in mid-2014 for approval by our partners, Sonangol and the Angola Ministry of Petroleum. We expect formal sanction of the Cameia project in late 2014 or early 2015 and first production from the Cameia project in 2017, assuming continued alignment with our partners and Sonangol.
Until substantial production is achieved, our primary sources of liquidity are expected to be cash on hand, amounts paid pursuant to the terms of our Total alliance and funds from future equity and debt financings, asset sales and farm-out arrangements.
We expect to incur substantial expenditures and generate significant operating losses as we continue to:
- •
- progress each of our discoveries through the project appraisal and development life-cycle towards first production and cash flow;
- •
- continue our exploration activity on our existing acreage;
- •
- seek the renewal of our worldwide exploration portfolio in locations applicable to our deepwater and below-salt exploration strength; and
- •
- incur expenses related to operating as a public company and compliance with regulatory requirements.
Our future financial condition and liquidity will be impacted by, among other factors, the success of our project development and exploration efforts, the number of commercially viable hydrocarbon discoveries made and the quantities of hydrocarbons discovered, the speed with which we can bring such discoveries to production, whether and to what extent we invest in additional oil leases and concessional licenses, and the actual cost of exploration, appraisal and development of our prospects.
As of December 31, 2013, we had approximately $1.8 billion in liquidity, which includes cash and cash equivalents, short-term restricted cash, short-term investments, long-term restricted cash and long-term investments. This amount does not include the $87.8 million Total is obligated to pay us pursuant to the terms of our U.S. Gulf of Mexico alliance. We expect to expend approximately $750 to $850 million for our capital and operating expenditures in 2014. Our full year 2013 capital and operating expenditures were approximately $877 million. We expect that our existing cash on hand will be sufficient to fund our planned exploration and appraisal drilling program and development activities at current working interests through at least mid-2015. However, we may require additional funds earlier than we currently expect in order to execute our strategy as planned. We may seek additional funding through asset sales, farm-out arrangements and equity and debt financings. Additional funding may not be available to us on acceptable terms or at all. In addition, the terms of any financing may adversely affect the holdings or the rights of our existing stockholders. For example, if we raise additional funds by issuing additional equity securities, further dilution to our existing stockholders will result. If we are unable to obtain funding on a timely basis or on acceptable terms, we may be required to significantly curtail one or more of our exploration and appraisal drilling programs. We also could be required to seek funds through arrangements with collaborators or others that may require us to
78
Table of Contents
relinquish rights to some of our prospects which we would otherwise develop on our own, or with a majority working interest.
Cash Flows
| | | | | | | | | | |
| | Year Ended December 31. | |
|---|
| | 2013 | | 2012 | | 2011 | |
|---|
| | ($ in thousands)
| |
|---|
Net cash provided by (used in): | | | | | | | | | | |
Operating Activities | | $ | (216,368 | ) | $ | (140,397 | ) | $ | (57,795 | ) |
Investing Activities | | | (1,015,995 | ) | | (564,761 | ) | | (430,391 | ) |
Financing Activities | | | (992 | ) | | 1,838,427 | | | 478,012 | |
Operating activities. Net cash of $216.4 million and $140.4 million used in operating activities during 2013 and 2012, respectively, were primarily related to cash payments for seismic and exploration expenses incurred in the U.S. Gulf of Mexico and West Africa and the purchase of inventory for West Africa. The $57.8 million used in operating activities during 2011 was primarily related to cash payments for seismic and exploration expenses incurred in the U.S. Gulf of Mexico and West Africa.
Investing activities. Net cash used in investing activities in 2013 was approximately $1,016.0 million, compared with net cash used in investing activities of approximately $564.8 million and $430.4 million in 2012 and 2011, respectively. The net cash used in 2013 primarily relates to capital expenditures relating to the Ardennes #1 and Aegean #1 exploration wells in the deepwater U.S. Gulf of Mexico and the Mavinga #1, Lontra #1, Bicuar #1A and Diaman #1B exploration wells offshore Angola. The net cash used in 2012 primarily relates to capital expenditures for the North Platte #1 exploration well in the deepwater U.S. Gulf of Mexico and the Cameia #1 exploration well and Cameia #2 appraisal well offshore Angola. The $430.4 million used in investing activities during 2011 was primarily related to capital expenditures for the Bicuar #1A and Cameia #1 exploration wells offshore Angola.
Financing activities. Net cash used by financing activities in 2013 was approximately $1.0 million, compared with net cash provided by financing activities of approximately $1.8 billion and $478.0 million in 2012 and 2011, respectively. The $1.0 million net cash used in financing activities relates to the debt issuance costs paid during 2013. The increase in net cash provided by financing activities in 2012 compared to 2011 was attributed to the net proceeds we received from the issuance of our 2.625% convertible senior notes due 2019 in December 2012 and our public offering of common stock in February 2012.
79
Table of Contents
Contractual Obligations
The following table summarizes by period the payments due for our estimated contractual obligations as of December 31, 2013:
| | | | | | | | | | | | | | | | | | | | | | |
| | Payments Due By Year | |
|---|
| | 2014 | | 2015 | | 2016 | | 2017 | | 2018 | | Thereafter | | Total | |
|---|
| | ($ in thousands)
| |
|---|
Drilling Rig and Related Contracts | | $ | 349,000 | | $ | 521,000 | | $ | 295,000 | | $ | 207,000 | | $ | — | | $ | — | | $ | 1,372,000 | |
Operating Leases | | | 13,000 | | | 11,000 | | | 8,000 | | | 5,000 | | | 4,000 | | | 8,000 | | | 49,000 | |
Lease Rentals(1) | | | 6,000 | | | 6,000 | | | 4,000 | | | 3,000 | | | 1,000 | | | 1,000 | | | 21,000 | |
Social Payment Obligations(2) | | | 49,000 | | | 51,000 | | | 63,000 | | | 6,000 | | | 5,000 | | | — | | | 174,000 | |
Long-term Debt Obligations(3): | | | | | | | | | | | | | | | | | | | | | | |
Principal | | | — | | | — | | | — | | | — | | | — | | | 1,380,000 | | | 1,380,000 | |
Interest | | | 36,000 | | | 36,000 | | | 36,000 | | | 36,000 | | | 36,000 | | | 37,000 | | | 217,000 | |
| | | | | | | | | | | | | | | | |
| | | | | | | | | | | | | | | | | | | | | | | |
Total | | $ | 453,000 | | $ | 625,000 | | $ | 406,000 | | $ | 257,000 | | $ | 46,000 | | $ | 1,426,000 | | $ | 3,213,000 | |
| | | | | | | | | | | | | | | | |
| | | | | | | | | | | | | | | | | | | | | | | |
| | | | | | | | | | | | | | | | | | | | | | | |
| | | | | | | | | | | | | | | | |
- (1)
- Relates to the annual delay rental payments payable to the Office of Natural Resources Revenue within the U.S. Department of the Interior with respect to our U.S. Gulf of Mexico leases. These annual payments are required to maintain the leases from year to year.
- (2)
- Includes our contractual payment obligations for social projects such as the Sonangol Research and Technology Center and academic scholarships for Angolan students that we were and are contractually obligated to pay in consideration for the Angolan government granting us the licenses to explore for and develop hydrocarbons offshore Angola. Pursuant to the terms of the RSAs for Blocks 9 and 21 and the PSC for Block 20, we are not required to pay annual rental payments to maintain the licenses from year to year.
- (3)
- Represents principal amount of our 2.625% convertible senior notes due December 2019 and interest payable semi-annually in arrears on June 1 and December 1 of each year, beginning on June 1, 2013.
In the future, we may be party to additional contractual arrangements including arrangements listed below, which will subject us to further contractual obligations:
- •
- credit facilities and other debt instruments;
- •
- contracts for the lease of additional drilling rigs;
- •
- contracts for the provision of production facilities;
- •
- infrastructure construction contracts; and
- •
- long term oil and gas property lease arrangements.
Off-Balance Sheet Arrangements
As of December 31, 2013, we did not have any off-balance sheet arrangements.
Critical Accounting Policies
This discussion of financial condition and results of operations is based upon the information reported in our consolidated financial statements, which have been prepared in accordance with generally accepted accounting principles in the United States. The preparation of our financial statements requires us to make assumptions and estimates that affect the reported amounts of assets,
80
Table of Contents
liabilities, revenues and expenses, as well as the disclosure of contingent assets and liabilities at the date of our financial statements. We base our assumptions and estimates on historical experience and other sources that we believe to be reasonable at the time. Actual results may vary from our estimates. Our significant accounting policies are detailed in Note 2 to our consolidated financial statements. We have outlined below certain accounting policies that are of particular importance to the presentation of our financial position and results of operations and require the application of significant judgment or estimates by our management.
Revenue Recognition. We plan to follow the "sales" (or cash) method of accounting for oil and gas revenues. Under this method, we will recognize revenues on the volumes sold. The volumes sold may be more or less than the volumes to which we are entitled based on our ownership interest in the property. These differences result in a condition known in the industry as a production imbalance. For the year ended December 31, 2013, no revenues have been recognized in our financial statements.
We recognize interest income on bank balances and deposits on a time basis, by reference to the principal outstanding and at the effective interest rate applicable.
Cash and Cash Equivalents. Cash and cash equivalents consist of all demand deposits and funds invested in highly liquid instruments with original maturities of three months or less from the date of purchase. Demand deposits typically exceed federally insured limits; however we periodically assess the financial condition of the institutions where these funds are held as well as the credit ratings of the issuers of the highly liquid instruments and believe that the credit risk is minimal.
Investments. We adopted a policy on accounting for our investments, which consist of debt securities, money market funds and certificates of deposit, based on the accounting guidance relating to "Accounting for Certain Investments in Debt and Equity Securities." The debt securities are carried at amortized costs and classified as held-to-maturity as we have the intent and ability to hold them until they mature. The net carrying value of held-to-maturity securities is adjusted for amortization of premiums and accretion of discounts to maturity over the life of the securities. Money market funds and certificates of deposit are carried at face value.
We conduct a regular assessment of our debt securities with unrealized losses to determine whether securities have other-than-temporary impairment. This assessment considers, among other factors, the nature of the securities, credit rating or financial condition of the issuer, the extent and duration of the unrealized loss, market conditions and whether we intend to sell or whether it is more likely than not that we will be required to sell the debt securities.
Property, Plant and Equipment. We use the "successful efforts" method of accounting for our oil and gas properties. Acquisition costs for unproved leasehold properties and costs of drilling exploration wells are capitalized pending determination of whether proved reserves can be attributed to the areas as a result of drilling those wells. Under the successful efforts method of accounting, proved leasehold costs are capitalized and amortized over the proved developed and undeveloped reserves on a units-of-production basis. Successful drilling costs, costs of development and developmental dry holes are capitalized and amortized over the proved developed reserves on a units-of-production basis. Unproved leasehold costs are capitalized and are not amortized, pending an evaluation of their exploration potential. Significant unproved leasehold costs are assessed on an individual basis periodically to determine if an impairment of the cost of individual properties has occurred. Factors taken into account for impairment analysis include results of the technical studies conducted, lease terms and management's future exploration plans. The cost of impairment is charged to expense in the period in which it occurs. Costs incurred for exploration dry holes, geological, and geophysical work (including the cost of seismic data), and delay rentals are charged to expense as incurred. Costs of other property and equipment are depreciated on a straight-line basis based on their respective useful lives.
81
Table of Contents
Inventory. Inventories consist of various tubular products that will be used in our drilling programs. The inventory is stated at the average cost. Cost is determined using a weighted average method comprised of the purchase price and other directly attributable costs.
Income Taxes. Prior to December 15, 2009, no provision for U.S. federal income taxes related to our operations was included in the accompanying financial statements. As a partnership, we were not subject to federal or state income tax, and the tax effect of our activities accrued to the partners. The Partnership had obligations associated with providing certain tax-related information to the partners and registrations and filings with applicable governmental taxing authorities.
Effective December 15, 2009, we began using the liability method of accounting for income taxes in accordance with accounting guidance relating to "Income Taxes" as clarified byAccounting for Uncertainty in Income Taxes. Under this method, deferred tax assets and liabilities are determined by applying tax rates in effect at the end of a reporting period to the cumulative temporary differences between the tax bases of assets and liabilities and their reported amounts in the financial statements. Since we are in development stage and there can be no assurance that we will generate any earnings or any specific level of earnings in future years, we will establish a valuation allowance for deferred tax assets (net of liabilities).
Use of Estimates. The preparation of our consolidated financial statements in conformity with United States generally accepted accounting principles requires us to make estimates and assumptions that impact our reported assets and liabilities, disclosure of contingent assets and liabilities at the date of our consolidated financial statements and the reported amounts of revenues and expenses during the reporting period. Significant estimates include: (i) accruals related to expenses, (ii) assumptions used in estimating fair value of equity-based awards and the fair value of the liability component of the convertible senior notes and (iii) assumptions used in impairment testing. Although we believe these estimates are reasonable, actual results could differ from these estimates.
Estimates of Proved Oil & Natural Gas Reserves. Reserve quantities and the related estimates of future net cash flows affect our periodic calculations of depletion and impairment of our oil and natural gas properties. Proved oil and natural gas reserves are the estimated quantities of crude oil, natural gas and natural gas liquids which geological and engineering data demonstrate with reasonable certainty to be recoverable in future periods from known reservoirs under existing economic and operating conditions. As of December 31, 2013, we have proved undeveloped reserves in the Gulf of Mexico. Estimated reserve quantities and future cash flows were estimated by independent petroleum consultants and prepared in accordance with guidelines established by the SEC and the Financial Accounting Standards Board. The accuracy of these reserve estimates is a function of:
- •
- the quality and quantity of available data and the engineering and geological interpretation of that data;
- •
- estimates regarding the amount and timing of future operating cost, severance taxes, development cost and workover cost, all of which may in fact vary considerably from actual results;
- •
- the accuracy of various mandated economic assumptions (such as the future prices of oil and natural gas); and
- •
- the judgments of the persons preparing the estimates.
Asset Retirement Obligations. We currently do not have any oil and natural gas production or any legal obligations to incur decommissioning costs. Should such production occur in the future, we expect to have significant obligations under our lease agreements and federal regulation to remove our equipment and restore land or seabed at the end of oil and natural gas production operations. These asset retirement obligations ("ARO") are primarily associated with plugging and abandoning wells and
82
Table of Contents
removing and disposing of offshore oil and natural gas platforms. Estimating the future restoration and removal cost is difficult and requires us to make estimates and judgments because most of the removal obligations are many years in the future and contracts and regulation often have vague descriptions of what constitutes, removal. Asset removal technologies and cost are constantly changing, as are regulatory, political, environmental, safety and public relations considerations. Pursuant to the accounting guidance relating to "Assets Retirement Obligations", we are required to record a separate liability for the discounted present value of our asset retirement obligations, with an offsetting increase to the related oil and natural gas properties representing asset retirement costs on our balance sheet. The cost of the related oil and natural gas asset, including the asset retirement cost, is depreciated over the useful life of the asset. The asset retirement obligation is recorded at its estimated fair value, measured by reference to the expected future cash outflows required to satisfy the retirement obligation discounted at our credit-adjusted risk-free interest rate. Accretion expense is recognized over time as the discounted liability is accreted to its expected settlement value.
Inherent to the present value calculation are numerous estimates, assumptions and judgments, including the ultimate settlement amounts, inflation factors, credit adjusted risk-free rates, timing of settlement and changes in the legal, regulatory, environmental and political environments. To the extent future revisions to these assumptions impact the present value of the abandonment liability, we will make corresponding adjustments to both the asset retirement obligation and the related oil and natural gas property asset balance. Increases in the discounted abandonment liability and related oil and natural gas assets resulting from the passage of time will be reflected as additional accretion and depreciation expense in the consolidated statement of operations.
Earnings (Loss) Per Share. Basic earnings (loss) per share was calculated by dividing net income or loss applicable to common shares by the weighted average number of common shares outstanding during the periods presented. Diluted earnings (loss) per share incorporate the potential dilutive impact of our 2.625% convertible senior notes due 2019, stock options, unvested restricted stock and restricted stock units outstanding during the periods presented, unless their effect is anti-dilutive. In addition, we apply the if-converted method to our convertible debt instruments, the effect of which is that conversion will not be assumed for purposes of computing diluted earnings (loss) per share if the effect would be anti-dilutive.
Equity-Based Compensation. We account for stock-based compensation at fair value. We grant various types of stock-based awards including stock options, restricted stock and performance-based awards. The fair value of stock option awards is determined by using the Black-Scholes-Merton option-pricing model. For restricted stock awards with market conditions, the fair value of the awards is measured using the asset-or-nothing option pricing model. Restricted stock awards without market conditions and the performance-based awards are valued using the market price of our common stock on the grant date. We record compensation cost, net of estimated forfeitures, on a straight-line basis for stock-based compensation awards over the requisite service period except for performance-based awards. For performance-based awards, compensation cost is recognized over the requisite service period as and when we determine that the achievement of the performance condition is probable, using the per-share fair value measured at grant date.
Item 7A. Quantitative and Qualitative Disclosures About Market Risk
The primary objective of the following information is to provide forward-looking quantitative and qualitative information about our potential exposure to market risks. The term "market risks" refers to the risk of loss arising from changes in commodity prices, interest rates, foreign currency exchange rates, and other relevant market risks. The disclosures are not meant to be precise indicators of expected future losses, but rather indicators of reasonably possible losses. This forward-looking information provides indicators of how we view and manage our ongoing market risk exposures. All of
83
Table of Contents
our market risk sensitive instruments will be entered into for purposes of risk management and not for speculation.
Due to the historical volatility of commodity prices, if and when we commence production, we may enter into various derivative instruments to manage our exposure to volatility of commodity market prices. We may use options (including floors and collars) and fixed price swaps to mitigate the impact of downward swings in commodity prices to our cash flow. All contracts will be settled with cash and would not require the delivery of physical volumes to satisfy settlement. While in times of higher commodity prices this strategy may result in our having lower net cash inflows than we would otherwise have if we had not utilized these instruments, management believes the risk reduction benefits of such a strategy would outweigh the potential costs.
We may borrow under fixed rate and variable rate debt instruments that give rise to interest rate risk. Our objective in borrowing under fixed or variable rate debt is to satisfy capital requirements while minimizing our costs of capital.
Item 8. Financial Statements and Supplementary Data
The information required is included in this report as set forth in the "Index to Consolidated Financial Statements" on page F-1 to this Annual Report on Form 10-K.
Item 9. Changes in and Disagreements with Accountants on Accounting and Financial Disclosure
None
Item 9A. ��Controls and Procedures
Conclusion Regarding the Effectiveness of Disclosure Controls and Procedures
As of December 31, 2013, we carried out an evaluation under the supervision and with the participation of our management, including our Chief Executive Officer ("CEO") and our Chief Financial Officer ("CFO"), as to the effectiveness, design and operation of our disclosure controls and procedures. This evaluation considered the various processes carried out under the direction of our disclosure committee in an effort to ensure that information required to be disclosed in the U.S. Securities and Exchange Commission reports we file or submit under the Exchange Act is accurate, complete and timely. Our management, including our CEO and CFO, does not expect that our disclosure controls and procedures or our internal controls will prevent and/or detect all errors and all fraud. A control system, no matter how well conceived and operated, can provide only reasonable, not absolute, assurance that the objectives of the control system are met. Further, the design of a control system must reflect the fact that there are resource constraints, and the benefit of controls must be considered relative to their costs. Because of the inherent limitation in all control systems, no evaluation of controls can provide absolute assurance that all control issues and instances of fraud, if any, within our company have been detected. Our disclosure controls and procedures are designed to provide reasonable assurance of achieving their objectives and our CEO and CFO concluded that our disclosure controls and procedures (as defined in Exchange Act Rules 13a-15(e) and 15d-15(e)) were effective as of December 31, 2013.
Management's Report on Internal Control over Financial Reporting
The information required to be furnished pursuant to this item is set forth under the caption "Management's Report on Internal Control over Financial Reporting" in Item 8 of this Annual Report on Form 10-K.
84
Table of Contents
Attestation Report of the Registered Public Accounting Firm
The information required to be furnished pursuant to this item is set forth under the caption "Report of Independent Registered Public Accounting Firm" in Item 8 of this Annual Report on Form 10-K.
Changes in Internal Control Over Financial Reporting
During the fourth quarter ended December 31, 2013, we acquired and implemented the Quorum enterprise resource planning software ("Quorum") and have aligned the controls relating to the Quorum applications to our existing control environment. As of December 31, 2013, management has included Quorum in its assessment of the effectiveness of internal control over financial reporting.
There have been no other changes in our internal control over financial reporting during the fourth quarter ended December 31, 2013, that have materially affected, or are reasonably likely to materially affect, our internal control over financial reporting.
Item 9B. Other Information
None.
PART III
Item 10. Directors, Executive Officers and Corporate Governance
The information required by this item is set forth under the captions "Election of Directors," "Corporate Governance" and "Section 16(a) Beneficial Ownership Reporting Compliance" in our definitive Proxy Statement (the "2014 Proxy Statement") for our annual meeting of stockholders to be held on April 29, 2014, which sections are incorporated herein by reference.
Pursuant to Item 401(b) of Regulation S-K, the information required by this item with respect to our executive officers is set forth in Part I of this Annual Report on Form 10-K.
Item 11. Executive Compensation
The information required by this item is set forth in the sections entitled "Election of Directors—Director Compensation," "Executive Compensation" and "Corporate Governance" in the 2014 Proxy Statement, which sections are incorporated herein by reference.
Item 12. Security Ownership of Certain Beneficial Owners and Management and Related Stockholder Matters
The information required by this item is set forth in the sections entitled "Security Ownership of Certain Beneficial Owners and Management" and "Executive Compensation—Equity Compensation Plan Information" in the 2014 Proxy Statement, which sections are incorporated herein by reference.
Item 13. Certain Relationships and Related Transactions, and Director Independence
The information required by this item is set forth in the section entitled "Corporate Governance" and "Certain Relationships and Related Transactions" in the 2014 Proxy Statement, which sections are incorporated herein by reference.
85
Table of Contents
Item 14. Principal Accounting Fees and Services
The information required by this item is set forth in the section entitled "Ratification of Appointment of Independent Auditors" in the 2014 Proxy Statement, which section is incorporated herein by reference.
GLOSSARY OF SELECTED OIL AND GAS TERMS
| | |
"2-D seismic data" | | Two-dimensional seismic data, being an interpretive data that allows a view of a vertical cross-section beneath a prospective area. |
"3-D seismic data" | | Three-dimensional seismic data, being geophysical data that depicts the subsurface strata in three dimensions. 3-D seismic data typically provides a more detailed and accurate interpretation of the subsurface strata than 2-D seismic data. |
"Angola PAL" | | Angola Petroleum Activities Law. |
"Appraisal well" | | A well drilled after an exploration well to gain more information on the drilled reservoirs. |
"Barrel" | | A standard measure of volume for petroleum corresponding to approximately 42 gallons at 60 degrees Fahrenheit. |
"Bbl" | | Barrel. |
"Bcf" | | Billion cubic feet. |
"Below-salt" | | A term encompassing both subsalt, as used in connection with the U.S. Gulf of Mexico, and pre-salt, as used in connection with offshore West Africa. |
"Block 9 RSA" | | Risk Service Agreement governing Block 9 offshore Angola. |
"Block 21 RSA" | | Risk Service Agreement governing Block 21 offshore Angola. |
"Block 20 PSC" | | Production Sharing Contract governing Block 20 offshore Angola. |
"Blowouts" | | Blowout is the uncontrolled release of a formation fluid, usually gas, from a well being drilled, typically for petroleum production. |
"BOEPD" | | Barrels of oil equivalent per day. Natural gas is converted on the basis of six Mcf of gas per one barrel of crude oil equivalent. This ratio reflects an energy content equivalency and not a price or revenue equivalency. |
"BOPD" | | Barrels of oil per day. |
"Btu" | | British thermal unit. |
"Completion" | | The procedure used in finishing and equipping an oil or natural gas well for production. |
"Delay rental" | | Payment made to the lessor under a non-producing oil and natural gas lease at the beginning or end of each year to continue the lease in force for another year during its primary term. |
"Development" | | The phase in which an oil field is brought into production by drilling development wells and installing appropriate production systems. |
86
Table of Contents
| | |
"Development well" | | A well drilled to a known formation in a discovered field, usually offsetting a producing well on the same or an adjacent oil and natural gas lease. |
"Drilling and completion costs" | | All costs, excluding operating costs, of drilling, completing, testing, equipping and bringing a well into production or plugging and abandoning it, including all labor and other construction and installation costs incident thereto, location and surface damages, cementing, drilling mud and chemicals, drillstem tests and core analysis, engineering and well site geological expenses, electric logs, costs of plugging back, deepening, rework operations, repairing or performing remedial work of any type, costs of plugging and abandoning any well participated in by us, and reimbursements and compensation to well operators. |
"Dry hole" | | An exploration, appraisal or development well that proves to be incapable of producing either oil or gas in sufficient quantities to justify completion as an oil or gas well. |
"DST" | | Drill stem test |
"E&P" | | Exploration and production. |
"Exploration well" | | A well drilled either (a) in search of a new and as yet undiscovered pool of oil or natural gas or (b) with the hope of significantly extending the limits of a pool already developed. |
"Farm-out" | | An agreement whereby the owner of the leasehold or working interest agrees to assign a portion of his interest in certain acreage subject to the drilling of one or more specific wells or other performance by the assignee as a condition of the assignment. Under a farm-out, the owner of the leasehold or working interest may retain some interest such as an overriding royalty interest, an oil and natural gas payment, offset acreage or other type of interest. |
"Field" | | A geographical area under which an oil or natural gas reservoir lies in commercial quantities. |
"FERC" | | Federal Energy Regulatory Commission |
"FPSO" | | Floating Production, Storage and Offloading system. |
"Gathering system" | | Pipelines and other facilities that transport oil from wells and bring it by separate and individual lines to a central delivery point for delivery into a transmission line or mainline. |
"Gross acre" | | An acre in which a working interest is owned. The number of gross acres is the total number of acres in which an interest is owned. |
"Horizon" | | A zone of a particular formation; that part of a formation of sufficient porosity and permeability to form a petroleum reservoir. |
"IQE" | | Independent Qualified Estimator. |
"Leases" | | Full or partial interests in oil or natural gas properties authorizing the owner of the lease to drill for, produce and sell oil and natural gas upon payment of rental, bonus, royalty or any other payments. |
87
Table of Contents
| | |
"MBOE" | | Thousand barrels of oil equivalent. Natural gas is converted on the basis of six Mcf of gas per one barrel of crude oil equivalent. This ratio reflects an energy content equivalency and not a price or revenue equivalency. |
"MMBOE" | | Million barrels of oil equivalent. Natural gas is converted on the basis of six Mcf of gas per one barrel of crude oil equivalent. This ratio reflects an energy content equivalency and not a price or revenue equivalency. |
"Mcf" | | Thousand cubic feet. |
"MMBbls" | | Million barrels. |
"MMBtu" | | Million British thermal units. |
"Natural gas" | | Natural gas is a combination of light hydrocarbons that, in average pressure and temperature conditions, is found in a gaseous state. In nature, it is found in underground accumulations, and may potentially be dissolved in oil or may also be found in its gaseous state. |
"Net pay thickness" | | The vertical extent of the effective hydrocarbon-bearing rock (expressed in feet). The net pay thickness encountered by an exploration well may differ from the mean net pay thickness of the prospect due to several factors, including the relative location of the exploration well on the structure, potential thickness variations that may occur across the prospect and the extent to which potential reservoir horizons are penetrated. |
"NORM" | | Naturally occurring radioactive materials. |
"NSAI" | | Netherland, Sewell & Associates, Inc. |
"Oil and natural gas lease" | | A legal instrument executed by a mineral owner granting the right to another to explore, drill, and produce subsurface oil and natural gas. An oil and natural gas lease embodies the legal rights, privileges and duties pertaining to the lessor and lessee. |
"OPEC" | | Organization of the Petroleum Exporting Countries. |
"Operator" | | A party that has been designated as manager for exploration, drilling, and/or production on a lease. The operator is the party that is responsible for (a) initiating and supervising the drilling and completion of a well and/or (b) maintaining the producing well. |
"Play" | | A project associated with a prospective trend of potential prospects, but which requires more data acquisition and/or evaluation in order to define specific leads or prospects. |
"Porosity" | | Porosity is the percentage of pore volume or void space, or that volume within rock that can contain fluids. Porosity can be a relic of deposition (primary porosity, such as space between grains that were not compacted together completely) or can develop through alteration of the rock (secondary porosity, such as when feldspar grains or fossils are preferentially dissolved from sandstones). |
88
Table of Contents
| | |
"Productive well" | | A well that has been drilled to the targeted depth and proves, in our opinion, to be capable of producing either oil or gas in sufficient quantities that will justify completion as an oil or gas well. |
"Prospect(s)" | | Potential trap which may contain hydrocarbons and is supported by the necessary amount and quality of geologic and geophysical data to indicate a probability of oil and/or natural gas accumulation ready to be drilled. The five required elements (generation, migration, reservoir, seal and trap) must be present for a prospect to work and if any of them fail neither oil nor natural gas will be present, at least not in commercial volumes. |
"Proved reserves" | | Estimated quantities of crude oil and natural gas which geological and engineering data demonstrate with reasonable certainty to be economically recoverable in future years from known reservoirs under existing economic and operating conditions, as well as additional reserves expected to be obtained through confirmed improved recovery techniques, as defined in SEC Regulation S-X 4-10(a)(2). |
"PSA" | | Production Sharing Agreement. |
"PV-10" | | Present value of future net pre-tax cash flows attributable to our estimated net proved reserves (after deducing future development and production costs), discounted at 10% per annum. |
"Reservoir" | | A subsurface body of rock having sufficient porosity and permeability to store and to allow for the mobility of fluids/hydrocarbons included in its pores. |
"Royalty" | | A fractional undivided interest in the production of oil and natural gas wells, or the proceeds therefrom to be received free and clear of all costs of development, operations or maintenance. |
"RPC" | | Reserves Process Chair. |
"SEC" | | United States Securities and Exchange Commission. |
"Shut in" | | To close the valves on a well so that it stops producing. |
"Spud" | | The very beginning of drilling operations of a new well, occurring when the drilling bit penetrates the surface utilizing a drilling rig capable of drilling the well to the authorized total depth. |
"Standardized Measure" | | The present value of estimated future net cash inflows from proved oil and natural gas reserves, less future development and production costs and future income tax expenses, discounted at 10% per annum to reflect timing of future net cash flows. |
"Working interest" | | An interest in an oil and natural gas lease entitling the holder at its expense to conduct drilling and production operations on the leased property and to receive the net revenues attributable to such interest, after deducting the landowner's royalty, any overriding royalties, production costs, taxes and other costs. |
"Workover" | | Operations on a producing well to restore or increase production. |
89
Table of Contents
PART IV
Item 15. Exhibits and Financial Statement Schedules
- (a)
- The following documents are filed as part of this Annual Report on Form 10-K:
- (1)
- Financial Statements
Cobalt International Energy, Inc. (pka Cobalt International Energy, L.P.)
| | | | |
Management's Report on Internal Control over Financial Reporting | | | F-2 | |
Reports of Independent Registered Public Accounting Firm | | | F-3 | |
Consolidated Balance Sheets of Cobalt International Energy, Inc. as of December 31, 2013 and 2012 | | | F-5 | |
Consolidated Statements of Operations of Cobalt International Energy, Inc. for the years ended December 31, 2013, 2012 and 2011, and for the period November 10, 2005 (Inception) through December 31, 2013 | | | F-6 | |
Consolidated Statements of Changes in Partners' Capital and Stockholders' Equity of Cobalt International Energy, Inc. for the years ended December 31, 2013, 2012 and 2011, and for the period November 10, 2005 (Inception) through December 31, 2013. | | | F-7 | |
Consolidated Statements of Cash Flows of Cobalt International Energy, Inc. for the years ended December 31, 2013, 2012 and 2011, and for the period November 10, 2005 (Inception) through December 31, 2013 | | | F-8 | |
Notes to Consolidated Financial Statements | | | F-9 | |
- (2)
- Financial Statement Schedule
Not applicable.
90
Table of Contents
The following exhibits are filed with this Annual Report on Form 10-K or incorporated by reference:
| | | |
Exhibit
Number | | Description of Document |
|---|
| | | | Certificate of Incorporation, Bylaws and Specimen Stock Certificate |
| | | | |
| | 3.1 | | Certificate of Incorporation of the Company (incorporated by reference to Exhibit 3.1 to the Company's Annual Report on Form 10-K filed March 30, 2010 (File No. 001-34579)) |
| | | | |
| | 3.2 | | By-laws of the Company (incorporated by reference to Exhibit 3 to the Company's Registration Statement on Form 8-A filed December 11, 2009 (File No. 001-34579)) |
| | | | |
| | 4.1 | | Specimen stock certificate (incorporated by reference to Exhibit 4.1 to the Company's Registration Statement on Form S-1/A filed November 27, 2009 (File No. 333-161734)) |
| | | | |
| | | | Instruments relating to Debt Securities |
| | | | |
| | 4.2 | | Senior Debt Indenture, dated as of December 17, 2012 (incorporated by reference to Exhibit 4.1 to the Company's Current Report on Form 8-K filed December 17, 2012 (File No. 001-34579)) |
| | | | |
| | 4.3 | | First Supplemental Indenture, dated as of December 17, 2012 (incorporated by reference to Exhibit 4.2 to the Company's Current Report on Form 8-K filed December 17, 2012 (File No. 001-34579)) |
| | | | |
| | 4.4 | | Form of 2.625% Convertible Senior Note due 2019 (incorporated by reference to Exhibit 4.3 to the Company's Current Report on Form 8-K filed December 17, 2012 (File No. 001-34579)) |
| | | | |
| | | | Operating Agreements |
| | | | |
| | 10.1 | | Risk Services Agreement relating to Block 9, between CIE Angola Block 9 Ltd., Sonangol, Sonangol Pesquisa e Produção, S.A., Nazaki Oil and Gás and Alper Oil, Lda (incorporated by reference to Exhibit 10.7 to the Company's Annual Report on Form 10-K filed March 30, 2010 (File No. 001-34579)) |
| | | | |
| | 10.2 | | Risk Services Agreement relating to Block 21, between CIE Angola Block 21 Ltd., Sonangol, Sonangol Pesquisa e Produção, S.A., Nazaki Oil and Gás and Alper Oil, Lda (incorporated by reference to Exhibit 10.8 to the Company's Annual Report on Form 10-K filed March 30, 2010 (File No. 001-34579)) |
| | | | |
| | 10.3 | | Production Sharing Contract, dated December 20, 2011, between CIE Angola Block 20 Ltd., Sociedade Nacional de Combustíveis de Angola—Empresa Pública, Sonangol Pesquisa e Produção, S.A., BP Exploration Angola (Kwanza Benguela) Limited, and China Sonangol International Holding Limited (incorporated by reference to Exhibit 10.20 to the Company's Annual Report on Form 10-K filed February 21, 2012 (File No. 001-34579)) |
| | | | |
| | 10.4 | | Exploration and Production Sharing Contract, dated December 13, 2006, between the Republic of Gabon and Total Gabon, S.A. (incorporated by reference to Exhibit 10.5 to the Company's Registration Statement on Form S-1/A filed October 29, 2009 (File No. 333-161734)) |
| | | | |
| | 10.5 | | Assignment Agreement, dated November 29, 2007, between CIE Gabon Diaba Ltd. and Total Gabon, S.A. (incorporated by reference to Exhibit 10.6 to the Company's Registration Statement on Form S-1/A filed October 29, 2009 (File No. 333-161734)) |
| |
| | |
91
Table of Contents
| | | |
Exhibit
Number | | Description of Document |
|---|
| | 10.6 | | Simultaneous Exchange Agreement, dated April 6, 2009, between the Partnership and TOTAL E&P USA, INC. (incorporated by reference to Exhibit 10.7 to the Company's Registration Statement on Form S-1/A filed October 9, 2009 (File No. 333-161734)) |
| | | | |
| | 10.7 | | Gulf of Mexico Program Management and AMI Agreement, dated April 6, 2009, between the Partnership and TOTAL E&P USA, INC. (incorporated by reference to Exhibit 10.8 to the Company's Registration Statement on Form S-1/A filed October 9, 2009 (File No. 333-161734)) |
| | | | |
| | 10.8 | | Offshore Daywork Drilling Contract, dated May 3, 2008, between the Partnership and Ensco Offshore Company (incorporated by reference to Exhibit 10.9 to the Company's Registration Statement on Form S-1/A filed October 29, 2009 (File No. 333-161734)) |
| | | | |
| | 10.10 | | International Daywork Drilling Contract—Offshore, dated November 8, 2010 between CIE Angola Block 21 Ltd. and Z North Sea Ltd. (incorporated by reference to Exhibit 10.1 to the Company's Quarterly Report on Form 10-Q filed November 12, 2010 (File No. 001-34579)). |
| | | | |
| | 10.11 | | Offshore Drilling Contract between CIE Angola Block 21 Ltd. and Universal Energy Resources, Inc., dated July 30, 2012 (incorporated by reference to Exhibit 10.1 to the Company's Quarterly Report on Form 10-Q filed October 30, 2012 (File No. 001-34579)) |
| | | | |
| | 10.12 | | Offshore Drilling Contract between Cobalt International Energy, L.P. and Rowan Reliance Limited, dated August 5, 2013 (incorporated by reference to Exhibit 10.1 to the Company's Quarterly Report on Form 10-Q filed October 29, 2013 (File No. 001-34579)) |
| | | | |
| | | | Financing Agreements |
| | | | |
| | 10.13 | | Underwriting Agreement dated as of December 11, 2012 (incorporated by reference to Exhibit 1.1 to the Company's Current Report on Form 8-K filed December 17, 2012 (File No. 001-34579)) |
| | | | |
| | 10.14 | | Underwriting Agreement dated as of January 15, 2013 (incorporated by reference to Exhibit 1.1 to the Company's Current Report on Form 8-K filed January 18, 2013 (File No. 001-34579)) |
| | | | |
| | 10.15 | | Underwriting Agreement dated as of May 7, 2013 (incorporated by reference to Exhibit 1.1 to the Company's Current Report on Form 8-K filed May 10, 2013 (File No. 001-34579)) |
| | | | |
| | | | Agreements with Stockholders and Directors |
| | | | |
| | 10.16 | | Amended and Restated Stockholders Agreement, dated February 21, 2013, among the Company and the stockholders that are signatory thereto (incorporated by reference to Exhibit 10.36 to the Company's Annual Report on Form 10-K filed February 26, 2013 (File No. 001-34579)) |
| | | | |
| | 10.17 | | Registration Rights Agreement, dated December 15, 2009, among the Company and the parties that are signatory thereto (incorporated by reference to Exhibit 10.31 to the Company's Annual Report on Form 10-K filed February 21, 2012 (File No. 001-34579)) |
| | | | |
| | 10.18 | | Form of Director Indemnification Agreements (incorporated by reference to Exhibit 10.19 to the Company's Registration Statement on Form S-1/A filed November 27, 2009 (File No. 333-161734)) |
| | | | |
| | | | Management Contracts/Compensatory Plans or Arrangements |
| | | | |
| | 10.19 | † | Amended and Restated Long Term Incentive Plan of the Company (incorporated by reference to Exhibit 10.15 to the Company's Annual Report on Form 10-K filed February 26, 2013 (File No. 001-34579)) |
| |
| | |
92
Table of Contents
| | | |
Exhibit
Number | | Description of Document |
|---|
| | 10.20 | † | Form of Restricted Stock Award Agreements relating to the Class B interests (incorporated by reference to Exhibit 10.10 to the Company's Registration Statement on Form S-1/A filed October 29, 2009 (File No. 333-161734)) |
| | | | |
| | 10.21 | † | Form of Restricted Stock Award Agreements relating to the Class C interests (incorporated by reference to Exhibit 10.11 to the Company's Registration Statement on Form S-1/A filed October 29, 2009 (File No. 333-161734)) |
| | | | |
| | 10.22 | † | Form of Restricted Stock Award Agreements relating to the Class D interests (incorporated by reference to Exhibit 10.12 to the Company's Registration Statement on Form S-1/A filed October 29, 2009 (File No. 333-161734)) |
| | | | |
| | 10.23 | † | Form of Non-Qualified Stock Option Award Agreement (incorporated by reference to Exhibit 10.26 to the Company's Annual Report on Form 10-K filed March 1, 2011 (File No. 001-34579)). |
| | | | |
| | 10.24 | † | Form of Restricted Stock Unit Award Agreement (incorporated by reference to Exhibit 10.27 to the Company's Annual Report on Form 10-K filed March 1, 2011 (File No. 001-34579)). |
| | | | |
| | 10.25 | † | Deferred Compensation Plan of the Company (incorporated by reference to Exhibit 10.35 to the Company's Annual Report on Form 10-K filed February 26, 2013 (File No. 001-34579)) |
| | | | |
| | 10.26 | † | Annual Incentive Plan of the Company (incorporated by reference to Exhibit 10.19 to the Company's Annual Report on Form 10-K filed March 30, 2010 (File No. 001-34579)) |
| | | | |
| | 10.27 | † | Employment Agreement, dated November 12, 2009, among the Company, the Partnership and Joseph H. Bryant (incorporated by reference to Exhibit 10.1 to the Company's Registration Statement on Form S-1/A filed November 27, 2009 (File No. 333-161734)) |
| | | | |
| | 10.28 | † | Employment Agreement, dated October 23, 2009, among the Company, the Partnership and James H. Painter (incorporated by reference to Exhibit 10.4 to the Company's Registration Statement on Form S-1/A filed November 27, 2009 (File No. 333-161734)) |
| | | | |
| | 10.29 | † | Employment Agreement, dated October 23, 2009, among the Company, the Partnership and James W. Farnsworth (incorporated by reference to Exhibit 10.5 to the Company's Registration Statement on Form S-1/A filed November 27, 2009 (File No. 333-161734)) |
| | | | |
| | 10.30 | † | Severance Agreement, dated October 23, 2009, among the Company, the Partnership and John P. Wilkirson (incorporated by reference to Exhibit 10.6 to the Company's Registration Statement on Form S-1/A filed November 27, 2009 (File No. 333-161734)) |
| | | | |
| | 10.31 | † | Employment Agreement, dated September 6, 2011, between the Company and Van P. Whitfield (incorporated by reference to Exhibit 10.1 to the Company's Current Report on Form 8-K filed September 8, 2011 (File No. 001-34579)) |
| | | | |
| | 10.32 | † | Severance Agreement, dated April 1, 2010, between the Company and Michael D. Drennon (incorporated by reference to Exhibit 10.30 to the Company's Annual Report on Form 10-K filed February 21, 2012 (File No. 001-34579)) |
| | | | |
| | 10.33 | † | Form of Amendment to Employment Agreements with Joseph H. Bryant, James H. Painter and James W. Farnsworth and Severance Agreements with Samuel H. Gillespie and John P. Wilkirson (incorporated by reference to Exhibit 10.3 to the Company's Quarterly Report on Form 10-Q filed November 12, 2010 (File No. 001-34579)). |
| | | | |
| | 10.34 | † | Non-Employee Directors Compensation Plan (incorporated by reference to Exhibit 99.2 to the Company's Current Report on Form 8-K filed January 29, 2010 (File No. 001-34579)) |
| |
| | |
93
Table of Contents
| | | |
Exhibit
Number | | Description of Document |
|---|
| | 10.35 | † | Non-Employee Directors Deferral Plan (incorporated by reference to Exhibit 99.3 to the Company's Current Report on Form 8-K filed January 29, 2010 (File No. 001-34579)) |
| | | | |
| | 10.36 | † | Form of Restricted Stock Unit Award Notification under the Non-Employee Directors Compensation Plan (incorporated by reference to Exhibit 99.4 to the Company's Current Report on Form 8-K filed January 29, 2010 (Filed No. 001-34579)) |
| | | | |
| | | | Other Exhibits |
| | | | |
| | 12.1 | * | Statement re: Computation of Ratio of Earnings to Fixed Charges |
| | | | |
| | 21.1 | * | List of Subsidiaries |
| | | | |
| | 23.1 | * | Consent of Ernst & Young LLP |
| | | | |
| | 23.2 | * | Consent of Netherland, Sewell & Associates, Inc. |
| | | | |
| | 31.1 | * | Certification of the Chief Executive Officer pursuant to Rule 13a-14(a)/15d-14(a) of the Securities Exchange Act of 1934 |
| | | | |
| | 31.2 | * | Certification of the Chief Financial Officer pursuant to Rule 13a-14(a)/15d-14(a) of the Securities Exchange Act of 1934 |
| | | | |
| | 32.1 | * | Certification of the Chief Executive Officer pursuant to 18 U.S.C. Section 1350, as adopted pursuant to Section 906 of the Sarbanes-Oxley Act of 2002 |
| | | | |
| | 32.2 | * | Certification of the Chief Financial Officer pursuant to 18 U.S.C. Section 1350, as adopted pursuant to Section 906 of the Sarbanes-Oxley Act of 2002 |
| | | | |
| | 99.1 | * | Report of Netherland, Sewell & Associates, Inc. |
| | | | |
| | 101.INS | * | XBRL Instance Document |
| | | | |
| | 101.SCH | * | XBRL Schema Document |
| | | | |
| | 101.CAL | * | XBRL Calculation Linkbase Document |
| | | | |
| | 101.DEF | * | XBRL Definition Linkbase Document |
| | | | |
| | 101.LAB | * | XBRL Labels Linkbase Document |
| | | | |
| | 101.PRE | * | XBRL Presentation Linkbase Document |
- *
- Filed herewith.
- †
- Management contract or compensatory plan or arrangement required to be filed as an exhibit to this Form 10-K pursuant to Item 15(b).
94
Table of Contents
SIGNATURES
Pursuant to the requirements of Section 13 or 15(d) of the Securities Exchange Act of 1934, the Registrant has duly caused this report to be signed on its behalf by the undersigned, thereunto duly authorized.
| | | | | | |
| | | Cobalt International Energy, Inc. |
|
|
By: |
|
/s/ JOSEPH H. BRYANT
|
| | | | | Name: | | Joseph H. Bryant |
| | | | | Title: | | Chairman of the Board of Directors and
Chief Executive Officer |
Dated: February 27, 2014
Pursuant to the requirements of the Securities Exchange Act of 1934, this report has been signed below by the following persons on behalf of the Registrant and in the capacities and on the dates indicated.
| | | | |
Signature | | Title | | Date |
|---|
|
|
|
|
|
/s/ JOSEPH H. BRYANT
Joseph H. Bryant | | Chairman of the Board of Directors and Chief Executive Officer (Principal Executive Officer) | | February 27, 2014 |
/s/ JOHN P. WILKIRSON
John P. Wilkirson |
|
Chief Financial Officer and Executive Vice President (Principal Financial Officer and Principal Accounting Officer) |
|
February 27, 2014 |
/s/ JACK E. GOLDEN
Jack E. Golden |
|
Director |
|
February 27, 2014 |
/s/ KAY BAILEY HUTCHISON
Kay Bailey Hutchison |
|
Director |
|
February 27, 2014 |
/s/ JON A. MARSHALL
Jon A. Marshall |
|
Director |
|
February 27, 2014 |
/s/ KENNETH W. MOORE
Kenneth W. Moore |
|
Director |
|
February 27, 2014 |
95
Table of Contents
| | | | |
Signature | | Title | | Date |
|---|
|
|
|
|
|
/s/ MYLES W. SCOGGINS
Myles W. Scoggins | | Director | | February 27, 2014 |
/s/ WILLIAM P. UTT
William P. Utt |
|
Director |
|
February 27, 2014 |
/s/ D. JEFF VAN STEENBERGEN
D. Jeff van Steenbergen |
|
Director |
|
February 27, 2014 |
/s/ MARTIN H. YOUNG, JR.
Martin H. Young, Jr. |
|
Director |
|
February 27, 2014 |
96
Table of Contents
INDEX TO CONSOLIDATED FINANCIAL STATEMENTS
COBALT INTERNATIONAL ENERGY, INC
| | | | |
Management's Report on Internal Control over Financial Reporting | | | F-2 | |
Reports of Independent Registered Public Accounting Firm | | | F-3 | |
Consolidated Balance Sheets of Cobalt International Energy, Inc. as of December 31, 2013 and 2012 | | | F-5 | |
Consolidated Statements of Operations of Cobalt International Energy, Inc. for the years ended December 31, 2013, 2012 and 2011, and for the period November 10, 2005 (Inception) through December 31, 2013 | | | F-6 | |
Consolidated Statements of Changes in Partners' Capital and Stockholders' Equity of Cobalt International Energy, Inc. for the years ended December 31, 2013, 2012 and 2011, and for the period November 10, 2005 (Inception) through December 31, 2013. | | | F-7 | |
Consolidated Statements of Cash Flows of Cobalt International Energy, Inc. for the years ended December 31, 2013, 2012 and 2011, and for the period November 10, 2005 (Inception) through December 31, 2013 | | | F-8 | |
Notes to Consolidated Financial Statements | | | F-9 | |
F-1
Table of Contents
MANAGEMENT'S REPORT ON INTERNAL CONTROL OVER FINANCIAL REPORTING
Our management is responsible for establishing and maintaining adequate internal control over financial reporting, as defined by Securities and Exchange Commission rules adopted under the Securities Exchange Act of 1934, as amended. Our internal control over financial reporting is designed to provide reasonable assurance regarding the reliability of financial reporting and the preparation of financial statements for external purposes in accordance with accounting principles generally accepted in the United States (GAAP). Our internal control over financial reporting includes those policies and procedures that:
- •
- pertain to the maintenance of records that, in reasonable detail, accurately and fairly reflect the transactions and dispositions of our assets;
- •
- provide reasonable assurance that transactions are recorded as necessary to permit preparation of financial statements in accordance with GAAP, and that our receipts and expenditures are being made only in accordance with authorizations of management and our directors; and
- •
- provide reasonable assurance regarding prevention or timely detection of unauthorized acquisition, use or disposition of our assets that could have a material effect on the consolidated financial statements.
There are inherent limitations to the effectiveness of internal control over financial reporting, however well designed, including the possibility of human error and the possible circumvention of or overriding of controls. The design of an internal control system is also based in part upon assumptions and judgments made by management about the likelihood of future events, and there can be no assurance that an internal control will be effective under all potential future conditions. As a result, even an effective system of internal controls can provide no more than reasonable assurance with respect to the fair presentation of financial statements and the processes under which they were prepared.
Under the supervision and with the participation of our management, including our Chief Executive Officer and Chief Financial Officer, we conducted an evaluation of the effectiveness of our internal control over financial reporting based on the framework inInternal Control—Integrated Framework issued by the Committee of Sponsoring Organizations of the Treadway Commission.
Based on our evaluation, we concluded that our internal control over financial reporting was effective as of December 31, 2013. The effectiveness of our internal control over financial reporting as of December 31, 2013 has been audited by Ernst & Young LLP, an independent registered public accounting firm, as stated in their report, which is included herein.
| | |
/s/ JOSEPH H. BRYANT
Joseph H. Bryant
Chairman of the Board of Directors and Chief Executive Officer | | /s/ JOHN P. WILKIRSON
John P. Wilkirson
Chief Financial Officer and Executive Vice President |
F-2
Table of Contents
Report of Independent Registered Public Accounting Firm
The Board of Directors and Stockholders of
Cobalt International Energy, Inc.
We have audited Cobalt International Energy, Inc.'s (a development stage enterprise) internal control over financial reporting as of December 31, 2013, based on criteria established in Internal Control—Integrated Framework issued by the Committee of Sponsoring Organizations of the Treadway Commission (1992 framework) (the COSO criteria). Cobalt International Energy, Inc.'s management is responsible for maintaining effective internal control over financial reporting, and for its assessment of the effectiveness of internal control over financial reporting included in the accompanying Management's Report on Internal Control over Financial Reporting. Our responsibility is to express an opinion on the company's internal control over financial reporting based on our audit.
We conducted our audit in accordance with the standards of the Public Company Accounting Oversight Board (United States). Those standards require that we plan and perform the audit to obtain reasonable assurance about whether effective internal control over financial reporting was maintained in all material respects. Our audit included obtaining an understanding of internal control over financial reporting, assessing the risk that a material weakness exists, testing and evaluating the design and operating effectiveness of internal control based on the assessed risk, and performing such other procedures as we considered necessary in the circumstances. We believe that our audit provides a reasonable basis for our opinion.
A company's internal control over financial reporting is a process designed to provide reasonable assurance regarding the reliability of financial reporting and the preparation of financial statements for external purposes in accordance with generally accepted accounting principles. A company's internal control over financial reporting includes those policies and procedures that (1) pertain to the maintenance of records that, in reasonable detail, accurately and fairly reflect the transactions and dispositions of the assets of the company; (2) provide reasonable assurance that transactions are recorded as necessary to permit preparation of financial statements in accordance with generally accepted accounting principles, and that receipts and expenditures of the company are being made only in accordance with authorizations of management and directors of the company; and (3) provide reasonable assurance regarding prevention or timely detection of unauthorized acquisition, use or disposition of the company's assets that could have a material effect on the financial statements.
Because of its inherent limitations, internal control over financial reporting may not prevent or detect misstatements. Also, projections of any evaluation of effectiveness to future periods are subject to the risk that controls may become inadequate because of changes in conditions, or that the degree of compliance with the policies or procedures may deteriorate.
In our opinion, Cobalt International Energy, Inc. maintained, in all material respects, effective internal control over financial reporting as of December 31, 2013, based on the COSO criteria.
We also have audited, in accordance with the standards of the Public Company Accounting Oversight Board (United States), the 2013 consolidated financial statements of Cobalt International Energy, Inc. (a development stage enterprise) and our report dated February 27, 2014 expressed an unqualified opinion thereon.
/s/ERNST & YOUNG LLP
Houston, Texas
February 27, 2014
F-3
Table of Contents
Report of Independent Registered Public Accounting Firm
The Board of Directors and Stockholders of
Cobalt International Energy, Inc.
We have audited the accompanying consolidated balance sheets of Cobalt International Energy, Inc. (a development stage enterprise) as of December 31, 2013 and 2012, and the related consolidated statements of operations, changes in partners' capital and stockholders' equity, and cash flows for each of the three years in the period ended December 31, 2013 and for the period November 10, 2005 (inception) through December 31, 2013. These financial statements are the responsibility of the Company's management. Our responsibility is to express an opinion on these financial statements based on our audits.
We conducted our audits in accordance with the standards of the Public Company Accounting Oversight Board (United States). Those standards require that we plan and perform the audit to obtain reasonable assurance about whether the financial statements are free of material misstatement. An audit includes examining, on a test basis, evidence supporting the amounts and disclosures in the financial statements. An audit also includes assessing the accounting principles used and significant estimates made by management, as well as evaluating the overall financial statement presentation. We believe that our audits provide a reasonable basis for our opinion.
In our opinion, the financial statements referred to above present fairly, in all material respects, the consolidated financial position of Cobalt International Energy, Inc. at December 31, 2013 and 2012, and the consolidated results of its operations and its cash flows for each of the three years in the period ended December 31, 2013 and for the period November 10, 2005 (inception) through December 31, 2013, in conformity with U.S. generally accepted accounting principles.
We also have audited, in accordance with the standards of the Public Company Accounting Oversight Board (United States), Cobalt International Energy, Inc.'s (a development stage enterprise) internal control over financial reporting as of December 31, 2013, based on criteria established in Internal Control—Integrated Framework issued by the Committee of Sponsoring Organizations of the Treadway Commission (1992 framework) and our report dated February 27, 2014 expressed an unqualified opinion thereon.
/s/ERNST & YOUNG LLP
Houston, Texas
February 27, 2014
F-4
Table of Contents
Cobalt International Energy, Inc.
(a Development Stage Enterprise)
Consolidated Balance Sheets
| | | | | | | |
| | December 31, | |
|---|
| | 2013 | | 2012 | |
|---|
| | ($ in thousands, except per
share data)
| |
|---|
Assets | | | | | | | |
Current assets: | | | | | | | |
Cash and cash equivalents | | $ | 192,460 | | $ | 1,425,815 | |
Joint interest and other receivables | | | 124,639 | | | 61,592 | |
Prepaid expenses and other current assets | | | 55,857 | | | 23,941 | |
Inventory | | | 74,768 | | | 65,286 | |
Short-term restricted funds | | | 200,339 | | | 90,440 | |
Short-term investments | | | 1,319,380 | | | 789,668 | |
| | | | | | |
| | | | | | | | |
Total current assets | | | 1,967,443 | | | 2,456,742 | |
Property, plant, and equipment: | | | | | | | |
Oil and gas properties, successful efforts method of accounting, net of accumulated depletion of $0 | | | 1,464,383 | | | 1,094,464 | |
Other property and equipment, net of accumulated depreciation and amortization of $4,394 and $2,533, as of December 31, 2013 and 2012, respectively | | | 11,892 | | | 5,292 | |
| | | | | | |
| | | | | | | | |
Total property, plant, and equipment, net | | | 1,476,275 | | | 1,099,756 | |
| | | | | | |
| | | | | | | | |
Long-term restricted funds | | | 104,496 | | | 395,652 | |
Long-term investments | | | 14,661 | | | 36,267 | |
Deferred income taxes | | | 17,061 | | | — | |
Other assets | | | 53,737 | | | 23,042 | |
| | | | | | |
| | | | | | | | |
Total assets | | $ | 3,633,673 | | $ | 4,011,459 | |
| | | | | | |
| | | | | | | | |
| | | | | | | | |
| | | | | | |
Liabilities and Stockholders' Equity | | | | | | | |
Current liabilities: | | | | | | | |
Trade and other accounts payable | | $ | 131,428 | | $ | 67,876 | |
Accrued liabilities | | | 143,459 | | | 44,061 | |
Short-term contractual obligations | | | 49,019 | | | 49,019 | |
Deferred income taxes | | | 17,061 | | | — | |
| | | | | | |
| | | | | | | | |
Total current liabilities | | | 340,967 | | | 160,956 | |
| | | | | | |
| | | | | | | | |
Long-term debt | | | 1,035,980 | | | 991,191 | |
Long-term contractual obligations | | | 124,901 | | | 168,238 | |
Other long-term liabilities | | | 2,679 | | | 1,856 | |
| | | | | | |
| | | | | | | | |
Total long-term liabilities | | | 1,163,560 | | | 1,161,285 | |
| | | | | | |
| | | | | | | | |
Stockholders' equity: | | | | | | | |
Common stock, $0.01 par value per share; 2,000,000,000 shares authorized 406,949,839 and 406,596,884 issued and outstanding as of December 31, 2013 and 2012, respectively | | | 4,069 | | | 4,066 | |
Additional paid-in capital | | | 3,641,936 | | | 3,612,987 | |
Accumulated deficit during the development stage | | | (1,516,859 | ) | | (927,835 | ) |
| | | | | | |
| | | | | | | | |
Total stockholders' equity | | | 2,129,146 | | | 2,689,218 | |
| | | | | | �� |
| | | | | | | | |
Total liabilities and stockholders' equity | | $ | 3,633,673 | | $ | 4,011,459 | |
| | | | | | |
| | | | | | | | |
| | | | | | | | |
| | | | | | |
See accompanying notes.
F-5
Table of Contents
Cobalt International Energy, Inc.
(a Development Stage Enterprise)
Consolidated Statements of Operations
| | | | | | | | | | | | | |
| |
| |
| |
| | For the Period
November 10, 2005
(Inception)
Through
December 31, 2013 | |
|---|
| | Year Ended December 31 | |
|---|
| | 2013 | | 2012 | | 2011 | |
|---|
| | ($ in thousands except per share data)
| |
|---|
Oil and gas revenue | | $ | — | | $ | — | | $ | — | | $ | — | |
Operating costs and expenses: | | | | | | | | | | | | | |
Seismic and exploration | | | 74,213 | | | 61,583 | | | 32,239 | | | 464,385 | |
Dry hole expense and impairment | | | 351,050 | | | 134,085 | | | 45,732 | | | 589,783 | |
General and administrative | | | 105,547 | | | 87,963 | | | 59,130 | | | 411,489 | |
Depreciation and amortization | | | 1,874 | | | 1,197 | | | 735 | | | 6,626 | |
| | | | | | | | | | |
| | | | | | | | | | | | | | |
Total operating costs and expenses | | | 532,684 | | | 284,828 | | | 137,836 | | | 1,472,283 | |
| | | | | | | | | | |
| | | | | | | | | | | | | | |
Operating income (loss) | | | (532,684 | ) | | (284,828 | ) | | (137,836 | ) | | (1,472,283 | ) |
Other income (expense): | | | | | | | | | | | | | |
Gain on sale of assets | | | 2,993 | | | — | | | — | | | 2,993 | |
Interest income | | | 6,043 | | | 5,041 | | | 4,199 | | | 21,087 | |
Interest expense | | | (65,376 | ) | | (3,212 | ) | | — | | | (68,656 | ) |
| | | | | | | | | | |
| | | | | | | | | | | | | | |
Total other income (expense) | | | (56,340 | ) | | 1,829 | | | 4,199 | | | (44,576 | ) |
| | | | | | | | | | |
| | | | | | | | | | | | | | |
Net income (loss) before income tax | | | (589,024 | ) | | (282,999 | ) | | (133,637 | ) | | (1,516,859 | ) |
Income tax expense | | | — | | | — | | | — | | | — | |
| | | | | | | | | | |
| | | | | | | | | | | | | | |
Net income (loss) | | $ | (589,024 | ) | $ | (282,999 | ) | $ | (133,637 | ) | $ | (1,516,859 | ) |
| | | | | | | | | | |
| | | | | | | | | | | | | | |
| | | | | | | | | | | | | | |
| | | | | | | | | | |
Basic and diluted income (loss) per common share | | $ | (1.45 | ) | $ | (0.70 | ) | $ | (0.35 | ) | | | |
| | | | | | | | | | | |
| | | | | | | | | | | | | | |
| | | | | | | | | | | | | | |
| | | | | | | | | | | |
Basic and diluted weighted average common shares outstanding | | | 406,839,997 | | | 403,356,174 | | | 376,603,520 | | | | |
| | | | | | | | | | | |
| | | | | | | | | | | | | | |
| | | | | | | | | | | | | | |
| | | | | | | | | | | |
See accompanying notes.
F-6
Table of Contents
Cobalt International Energy, Inc.
(a Development Stage Enterprise)
Consolidated Statements of Changes in Partners' Capital and Stockholders' Equity
| | | | | | | | | | | | | | | | | | | | | | | | | |
| | General
Partner | | Class A
Limited
Partners | | Class B
Limited
Partners | | Class C
Limited
Partners | | Common
Stock | | Additional
Paid-in
Capital | | Accumulated
Deficit
During
Development
Stage | | Total | |
|---|
| | ($ in thousands)
| |
|---|
Balance, November 10, 2005 (inception) through December 31, 2008 | | | — | | | 1,029,572 | | | 4,365 | | | — | | | — | | | — | | | (293,466 | ) | | 740,471 | |
Class A limited partners' contributions | | | — | | | 227,166 | | | — | | | — | | | — | | | — | | | — | | | 227,166 | |
Class B and C limited partners' equity compensation | | | — | | | — | | | 2,619 | | | 734 | | | — | | | — | | | — | | | 3,353 | |
Common stock issued upon corporate reorganization | | | — | | | (1,256,738 | ) | | (6,984 | ) | | (734 | ) | | 2,743 | | | 1,261,713 | | | — | | | — | |
Equity based compensation | | | — | | | — | | | — | | | — | | | — | | | 15,074 | | | — | | | 15,074 | |
Common stock issued at initial public offering including over-allotment portion, net of offering costs | | | — | | | — | | | — | | | — | | | 710 | | | 907,805 | | | — | | | 908,515 | |
Common stock issued at private placement | | | — | | | — | | | — | | | — | | | 32 | | | 42,156 | | | — | | | 42,188 | |
Common stock issued for restricted stock | | | — | | | — | | | — | | | — | | | 22 | | | (22 | ) | | — | | | — | |
Net income (loss) | | | — | | | — | | | — | | | — | | | — | | | — | | | (217,733 | ) | | (217,733 | ) |
| | | | | | | | | | | | | | | | | | |
| | | | | | | | | | | | | | | | | | | | | | | | | | |
Balance, December 31, 2010 | | $ | — | | $ | — | | $ | — | | $ | — | | $ | 3,507 | | $ | 2,226,726 | | $ | (511,199 | ) | $ | 1,719,034 | |
Common stock issued at public offering, net of costs | | | — | | | — | | | — | | | — | | | 357 | | | 477,846 | | | — | | | 478,203 | |
Common stock issued for restricted stock | | | — | | | — | | | — | | | — | | | 12 | | | (12 | ) | | — | | | — | |
Equity based compensation | | | — | | | — | | | — | | | — | | | — | | | 15,505 | | | — | | | 15,505 | |
Common stock withheld for taxes on equity based compensation | | | — | | | — | | | — | | | — | | | (1 | ) | | (190 | ) | | — | | | (191 | ) |
Net income (loss) | | | — | | | — | | | — | | | — | | | — | | | — | | | (133,637 | ) | | (133,637 | ) |
| | | | | | | | | | | | | | | | | | |
| | | | | | | | | | | | | | | | | | | | | | | | | | |
Balance, December 31, 2011 | | $ | — | | $ | — | | $ | — | | $ | — | | $ | 3,875 | | $ | 2,719,875 | | $ | (644,836 | ) | $ | 2,078,914 | |
Common stock issued at public offering, net of costs | | | — | | | — | | | — | | | — | | | 181 | | | 489,128 | | | — | | | 489,309 | |
Common stock issued for restricted stock and restricted stock units | | | — | | | — | | | — | | | — | | | 10 | | | (10 | ) | | — | | | — | |
Equity based compensation | | | — | | | — | | | — | | | — | | | — | | | 22,410 | | | — | | | 22,410 | |
Exercise of stock options | | | — | | | — | | | — | | | — | | | — | | | 338 | | | — | | | 338 | |
Common stock withheld for taxes on equity based compensation | | | — | | | — | | | — | | | — | | | — | | | (170 | ) | | — | | | (170 | ) |
Conversion option relating to 2.625% convertible senior notes, net of allocated costs | | | — | | | — | | | — | | | — | | | — | | | 381,416 | | | — | | | 381,416 | |
Net income (loss) | | | — | | | — | | | — | | | — | | | — | | | — | | | (282,999 | ) | | (282,999 | ) |
| | | | | | | | | | | | | | | | | | |
| | | | | | | | | | | | | | | | | | | | | | | | | | |
Balance, December 31, 2012 | | $ | — | | $ | — | | $ | — | | $ | — | | $ | 4,066 | | $ | 3,612,987 | | $ | (927,835 | ) | $ | 2,689,218 | |
Common stock issued for restricted stock and stock options | | | — | | | — | | | — | | | — | | | 3 | | | (3 | ) | | — | | | — | |
Equity based compensation | | | — | | | — | | | — | | | — | | | — | | | 28,754 | | | — | | | 28,754 | |
Exercise of stock options | | | — | | | — | | | — | | | — | | | — | | | 198 | | | — | | | 198 | |
Net income (loss) | | | — | | | — | | | — | | | — | | | — | | | — | | | (589,024 | ) | | (589,024 | ) |
| | | | | | | | | | | | | | | | | | |
| | | | | | | | | | | | | | | | | | | | | | | | | | |
Balance, December 31, 2013 | | $ | — | | $ | — | | $ | — | | $ | — | | $ | 4,069 | | $ | 3,641,936 | | $ | (1,516,859 | ) | $ | 2,129,146 | |
| | | | | | | | | | | | | | | | | | |
| | | | | | | | | | | | | | | | | | | | | | | | | | |
| | | | | | | | | | | | | | | | | | | | | | | | | | |
| | | | | | | | | | | | | | | | | | |
See accompanying notes.
F-7
Table of Contents
Cobalt International Energy, Inc.
(a Development Stage Enterprise)
Consolidated Statements of Cash Flows
| | | | | | | | | | | | | |
| |
| |
| |
| | For the Period
November 10, 2005
(Inception)
Through
December 31, 2013 | |
|---|
| | Year Ended December 31 | |
|---|
| | 2013 | | 2012 | | 2011 | |
|---|
| | ($ In thousands)
| |
|---|
Cash flows provided from operating activities | | | | | | | | | | | | | |
Net income (loss) | | $ | (589,024 | ) | $ | (282,999 | ) | $ | (133,637 | ) | $ | (1,516,859 | ) |
Adjustments to reconcile net loss to net cash used in operating activities: | | | | | | | | | | | | | |
Depreciation and amortization | | | 1,874 | | | 1,197 | | | 735 | | | 6,626 | |
Dry hole expense and impairment | | | 351,050 | | | 134,085 | | | 45,732 | | | 589,783 | |
Gain on sale of assets | | | (2,993 | ) | | — | | | — | | | (2,993 | ) |
Equity based compensation | | | 28,754 | | | 22,410 | | | 15,505 | | | 89,461 | |
Amortization of premium (accretion of discount) | | | 21,955 | | | 15,091 | | | 22,082 | | | 56,497 | |
Amortization of debt discount | | | 46,847 | | | — | | | — | | | 48,520 | |
Other | | | — | | | — | | | — | | | 580 | |
Changes in operating assets and liabilities: | | | | | | | | | | | | | |
Joint interest and other receivables | | | (62,967 | ) | | (1,518 | ) | | (59,515 | ) | | (128,161 | ) |
Inventory | | | (10,052 | ) | | (29,237 | ) | | (1,621 | ) | | (75,338 | ) |
Prepaid expense and other current assets | | | (31,915 | ) | | (1,726 | ) | | (13,209 | ) | | (55,857 | ) |
Deferred charges | | | (32,753 | ) | | (10,985 | ) | | 2,467 | | | (32,679 | ) |
Trade and other accounts payable | | | 63,552 | | | (3,309 | ) | | 59,196 | | | 131,428 | |
Accrued liabilities and other | | | (696 | ) | | 16,594 | | | 4,470 | | | 47,071 | |
| | | | | | | | | | |
| | | | | | | | | | | | | | |
Net cash provided by (used in) operating activities | | | (216,368 | ) | | (140,397 | ) | | (57,795 | ) | | (841,921 | ) |
| | | | | | | | | | |
| | | | | | | | | | | | | | |
Cash flows from investing activities | | | | | | | | | | | | | |
Capital expenditures for oil and gas properties | | | (80,439 | ) | | (142,841 | ) | | — | | | (927,387 | ) |
Capital expenditures for other property and equipment | | | (8,483 | ) | | (5,139 | ) | | (782 | ) | | (18,549 | ) |
Exploration wells drilling in process | | | (581,194 | ) | | (329,534 | ) | | (86,979 | ) | | (1,192,169 | ) |
Proceeds from sale of oil and gas properties | | | 3,006 | | | — | | | — | | | 342,007 | |
Change in restricted cash | | | 180,729 | | | 29,573 | | | (541 | ) | | (131,353 | ) |
Proceeds from maturity of investment securities | | | 1,366,977 | | | 1,082,876 | | | 1,288,067 | | | 3,966,031 | |
Purchase of investment securities | | | (1,896,591 | ) | | (1,199,696 | ) | | (1,630,156 | ) | | (5,526,528 | ) |
| | | | | | | | | | |
| | | | | | | | | | | | | | |
Net cash provided by (used in) investing activities | | | (1,015,995 | ) | | (564,761 | ) | | (430,391 | ) | | (3,487,948 | ) |
| | | | | | | | | | |
| | | | | | | | | | | | | | |
Cash flows from financing activities | | | | | | | | | | | | | |
Capital contributions prior to IPO—Class A limited partners | | | — | | | — | | | — | | | 1,256,180 | |
Proceeds from initial public offering, net of costs | | | — | | | — | | | — | | | 950,702 | |
Proceeds from public offering, net of costs | | | — | | | 489,309 | | | 478,203 | | | 967,513 | |
Proceeds from debt offering, net of costs | | | (1,190 | ) | | 1,348,950 | | | — | | | 1,347,760 | |
Proceed from exercise of stock options | | | 198 | | | 338 | | | — | | | 536 | |
Payments for common stock withheld for taxes on equity based compensation | | | — | | | (170 | ) | | (191 | ) | | (362 | ) |
| | | | | | | | | | |
| | | | | | | | | | | | | | |
Net cash provided by (used in) financing activities | | | (992 | ) | | 1,838,427 | | | 478,012 | | | 4,522,329 | |
| | | | | | | | | | |
| | | | | | | | | | | | | | |
Net increase (decrease) in cash and cash equivalents | | | (1,233,355 | ) | | 1,133,269 | | | (10,174 | ) | | 192,460 | |
Cash and cash equivalents, beginning of period | | | 1,425,815 | | | 292,546 | | | 302,720 | | | — | |
| | | | | | | | | | |
| | | | | | | | | | | | | | |
Cash and cash equivalents, end of period | | $ | 192,460 | | $ | 1,425,815 | | $ | 292,546 | | $ | 192,460 | |
| | | | | | | | | | |
| | | | | | | | | | | | | | |
| | | | | | | | | | | | | | |
| | | | | | | | | | |
Cash paid for interest | | $ | 34,615 | | $ | — | | $ | — | | $ | 34,615 | |
Non-Cash Disclosures | | | | | | | | | | | | | |
Change in accrued capital expenditures | | $ | 58,769 | | $ | (105,802 | ) | $ | 357,900 | | $ | 58,769 | |
Transfer of investment securities to and from restricted funds | | $ | 26 | | $ | 178,830 | | $ | — | | $ | 178,804 | |
See accompanying notes.
F-8
Table of Contents
Cobalt International Energy, Inc.
(a Development Stage Enterprise)
Notes to Consolidated Financial Statements
1. Organization and Operations
Organization
Cobalt International Energy, Inc. (the "Company") is an independent exploration and production company with operations in the deepwater U.S. Gulf of Mexico and offshore Angola and Gabon in West Africa.
The terms "Company," "Cobalt," "we," "us," "our," "ours," and similar terms refer to Cobalt International Energy, Inc. unless the context indicates otherwise.
2. Summary of Significant Accounting Policies
Basis of Presentation
The accompanying consolidated financial statements include the financial statements of Cobalt International Energy, Inc. and all of its wholly owned subsidiaries. All significant intercompany transactions and amounts have been eliminated for all years presented. Because the Company is a development stage enterprise, it has presented its financial statements in accordance with accounting guidance relating to "Development Stage Entities."
At December 31, 2013, the accompanying consolidated financial statements include the accounts of Cobalt and its wholly owned subsidiary, Cobalt International Energy, L.P. ("Partnership"). Prior to the effective date of a corporate reorganization, both entities were under common control arising from common direct or indirect ownership of each. The transfer of the Partnership interests to Cobalt represented a reorganization of entities under common control and was accounted for at historical cost.
Reclassifications
Certain reclassifications have been made to prior periods' financial statements to conform to the current presentation in the consolidated statements of cash flows.
Use of Estimates
The preparation of financial statements in conformity with United States generally accepted accounting principles ("GAAP") requires the Company to make estimates and assumptions that affect the reported amounts of assets including proved reserves and liabilities and disclosure of contingent assets and liabilities at the date of the financial statements and the reported amounts of revenues and expenses during the reporting period. Significant estimates the Company makes include (a) accruals related to expenses, (b) assumptions used in estimating fair value of equity based awards and the fair value of the liability component of the convertible senior notes and (c) assumptions used in impairment testing. Although the Company believes these estimates are reasonable, actual results could differ from these estimates.
Fair Value Measurements
The fair values of the Company's cash and cash equivalents, joint interest and other receivables, restricted funds and investments approximate their carrying amounts due to their short-term duration. The hierarchy below lists three levels of fair value based on the extent to which inputs used in measuring fair value are observable in the market. The Company categorizes each of its fair value
F-9
Table of Contents
Cobalt International Energy, Inc.
(a Development Stage Enterprise)
Notes to Consolidated Financial Statements (Continued)
2. Summary of Significant Accounting Policies (Continued)
measurements as applicable to one of these three levels based on the lowest level input that is significant to the fair value measurement in its entirety. The levels are:
Level 1—Quoted prices in active markets that are accessible at the measurement date for identical assets or liabilities. This category includes the Company's cash and money market funds.
Level 2—Quoted prices in non-active markets or in active markets for similar assets or liabilities, and inputs other than quoted prices that are observable, for the asset or liability, either directly or indirectly for substantially the full contractual term of the asset or liability being measured. This category includes the Company's U.S. Treasury bills, U.S. Treasury notes, U.S. Government agency securities, commercial paper, corporate bonds, municipal bonds and certificates of deposits.
Level 3—Inputs that are generally unobservable and typically reflect management's estimate of assumptions that market participants would use in pricing the asset or liability. The Company does not currently have any financial instruments categorized as Level 3.
Revenue Recognition
The Company will follow the "sales" (or cash) method of accounting for oil and gas revenues. Under this method, the Company will recognize revenues on the volumes sold. The volumes sold may be more or less than the volumes to which the Company is entitled based on its ownership interest in the property. These differences result in a condition known in the industry as a production imbalance. For the years ended December 31, 2013, 2012, 2011 and for the period November 10, 2005 (Inception) through December 31, 2013, no revenues have been recognized in these consolidated financial statements.
Cash and Cash Equivalents
Cash and cash equivalents consist of demand deposits and funds invested in highly liquid instruments with maturities of three months or less from the date of purchase. Demand deposits typically exceed federally insured limits; however, the Company periodically assesses the financial condition of the institutions where these funds are held as well as the credit ratings of the issuers of the highly liquid instruments and believes that the credit risk is minimal.
Restricted Funds
Restricted funds primarily consist of funds held in escrow accounts and collateral for letters of credit relating to our operations in the U.S. Gulf of Mexico and offshore Angola.
Investments
The Company's policy on accounting for its investments, which consist entirely of debt securities money market funds and certificates of deposit, is based on the accounting guidance relating to "Accounting for Certain Investments in Debt and Equity Securities." The Company considers all highly liquid interest-earning investments with a maturity of three months or less at the date of purchase to be cash equivalents. Investments with original maturities of greater than three months and remaining maturities of less than one year are classified as short-term investments. Investments with maturities
F-10
Table of Contents
Cobalt International Energy, Inc.
(a Development Stage Enterprise)
Notes to Consolidated Financial Statements (Continued)
2. Summary of Significant Accounting Policies (Continued)
beyond one year are classified as long-term investments. The debt securities are carried at amortized costs and classified as held-to-maturity securities as the Company has the positive intent and ability to hold them until they mature. The net carrying value of held-to-maturity debt securities is adjusted for amortization of premiums and accretion of discounts to maturity over the life of the securities. Held-to-maturity debt securities are stated at amortized cost, which approximated fair market value as of December 31, 2013 and 2012. Money market funds and certificates of deposit are carried at face value. Income related to these securities is reported as a component of interest income in the Company's consolidated statement of operations.See Note 7—Investments.
Investments are considered to be impaired when a decline in fair value is determined to be other-than-temporary. The Company conducts a regular assessment of its debt securities with unrealized losses to determine whether securities have other-than-temporary impairment ("OTTI"). This assessment considers, among other factors, the nature of the securities, credit rating or financial condition of the issuer, the extent and duration of the unrealized loss, market conditions and whether the Company intends to sell or whether it is more likely than not that the Company will be required to sell the debt securities. As of December 31, 2013 and 2012, the Company has no OTTI in its debt securities.
Capitalized Interest
For exploration and development projects that have not commenced production, interest is capitalized as part of the historical cost of developing and constructing assets. Capitalized interest is determined by multiplying the Company's weighted-average borrowing cost on debt by the average amount of qualifying costs incurred. Once an asset subject to interest capitalization is completed and placed in service, the associated capitalized interest is expensed through depreciation or impairment.See Note 9—Property, Plant, and Equipment and Note 11—Long-term Debt.
Joint Interest and Other Receivables
Joint interest and other receivables result primarily from billing shared costs under the respective operating agreements to the Company's partners. These receivables are usually settled within 30 days of the invoice date.
Property, Plant, and Equipment
The Company uses the "successful efforts" method of accounting for its oil and gas properties. Acquisition costs for unproved leasehold properties and costs of drilling exploration wells are capitalized pending determination of whether proved reserves can be attributed to the areas as a result of drilling those wells. Under the successful efforts method of accounting, proved leasehold costs are capitalized and amortized over the proved developed and undeveloped reserves on a units-of-production basis. Successful drilling costs, costs of development and developmental dry holes are capitalized and amortized over the proved developed reserves on a units-of-production basis. Significant unproved leasehold costs are capitalized and are not amortized, pending an evaluation of their exploration potential. Unproved leasehold costs are assessed periodically to determine if an impairment of the cost of individual properties has occurred. Factors taken into account for impairment analysis include results of the technical studies conducted, lease terms and management's future
F-11
Table of Contents
Cobalt International Energy, Inc.
(a Development Stage Enterprise)
Notes to Consolidated Financial Statements (Continued)
2. Summary of Significant Accounting Policies (Continued)
exploration plans. The cost of impairment is charged to expense in the period in which it occurs. Costs incurred for exploration dry holes, geological and geophysical work (including the cost of seismic data), and delay rentals are charged to expense as incurred. Costs of other property and equipment are depreciated on a straight-line basis based on their respective useful lives.
Asset Retirement Obligations
The Company currently does not have any oil and natural gas production or any legal obligations to incur decommissioning costs. Should such production occur in the future, the Company expects to have significant obligations under its lease agreements and federal regulation to remove its equipment and restore land or seabed at the end of oil and natural gas production operations. These asset retirement obligations are primarily associated with plugging and abandoning wells and removing and disposing of offshore oil and natural gas platforms. Estimating the future restoration and removal cost is difficult and requires the Company to make estimates and judgments because most of the removal obligations are many years in the future and contracts and regulation often have vague descriptions of what constitutes removal. Asset removal technologies and cost are constantly changing, as are regulatory, political, environmental, safety and public relations considerations. Pursuant to the accounting guidance relating to "Assets Retirement Obligations", the Company is required to record a separate liability for the estimated fair value of its asset retirement obligations, with an offsetting increase to the related oil and natural gas properties representing asset retirement costs on its balance sheet. The cost of the related oil and natural gas asset, including the asset retirement cost, is depreciated over the useful life of the asset. The estimated fair value of asset retirement obligations is measured by reference to the expected future cash outflows required to satisfy the retirement obligation discounted at the Company's credit-adjusted risk-free interest rate. Accretion expense is recognized over time as the discounted liability is accreted to its expected settlement value.
Inherent to the present value calculation are numerous estimates, assumptions and judgments, including the ultimate settlement amounts, inflation factors, credit adjusted risk-free rates, timing of settlement and changes in the legal, regulatory, environmental and political environments. To the extent future revisions to these assumptions impact the present value of the abandonment liability, the Company will make corresponding adjustments to both the asset retirement obligation and the related oil and natural gas property asset balance. Increases in the discounted abandonment liability and related oil and natural gas assets resulting from the passage of time will be reflected as additional accretion and depreciation expense in the consolidated statements of operations.
Inventory
Inventories consist of various tubular products that are used in the Company's drilling programs. The products are stated at the average cost. Cost is determined using a weighted average method comprised of the purchase price and other directly attributable costs.
Income Taxes
The Company applied the liability method of accounting for income taxes in accordance with accounting guidance related to "Income Taxes" as clarified by "Accounting for Uncertainty in Income Taxes." Under this method, deferred tax assets and liabilities are determined by applying tax rates in
F-12
Table of Contents
Cobalt International Energy, Inc.
(a Development Stage Enterprise)
Notes to Consolidated Financial Statements (Continued)
2. Summary of Significant Accounting Policies (Continued)
effect at the end of a reporting period to the cumulative temporary differences between the tax bases of assets and liabilities and their reported amounts in the financial statements. Since the Company is in development stage and there can be no assurance that the Company will generate any earnings or any specific level of earnings in future years, the Company has established a valuation allowance that equals its net deferred tax assets.See Note 17.
Equity-Based Compensation
The Company accounts for stock-based compensation at fair value. The Company grants various types of stock-based awards including stock options, restricted stock and performance-based awards. The fair value of stock option awards is determined using the Black-Scholes-Merton option-pricing model. For restricted stock awards with market conditions, the fair value of the awards is measured using the asset-or-nothing option pricing model. Restricted stock awards without market conditions and the performance-based awards are valued using the market price of the Company's common stock on the grant date. The Company records compensation cost, net of estimated forfeitures, on a straight-line basis for stock-based compensation awards over the requisite service period except for performance-based awards. For performance-based awards, compensation cost is recognized over the requisite service period as and when the Company determines that the achievement of the performance condition is probable, using the per-share fair value measured at grant date.See Note 15.
Earnings (Loss) Per Share
Basic income (loss) per share was calculated by dividing net income or loss applicable to common shares by the weighted average number of common shares outstanding during the periods presented. The calculation of diluted income (loss) per share should include the potential dilutive impact of non-vested restricted shares, non-vested restricted stock units, outstanding stock options and the Company's 2.625% convertible senior notes due 2019, during the period, unless their effect is anti-dilutive. For the year ended December 31, 2013, 6,735,046 shares of non-vested restricted stock, non-vested restricted stock units, outstanding stock options and 2.625% convertible senior notes due 2019, were excluded from the diluted income (loss) per share because they are anti-dilutive. For the year ended December 31, 2012, 5,617,697 shares of non-vested restricted stock, non-vested restricted stock units and outstanding stock options were excluded from the diluted income (loss) per share because they are anti-dilutive.
Operating Costs and Expenses
Expenses consist primarily of the costs of acquiring and processing of geological and geophysical data, exploration and appraisal drilling expenses, consultants, telecommunications, payroll and benefit costs, information system and legal costs, office rent, contract costs, and bookkeeping and audit fees.
F-13
Table of Contents
Cobalt International Energy, Inc.
(a Development Stage Enterprise)
Notes to Consolidated Financial Statements (Continued)
3. Cash and Cash Equivalents
As of December 31, 2013 and 2012, cash and cash equivalents consisted of the following:
| | | | | | | |
| | December 31, | |
|---|
| | 2013 | | 2012 | |
|---|
| | (in thousands)
| |
|---|
Cash at banks | | $ | 82,428 | | $ | 65,935 | |
Money market funds | | | 75,039 | | | 1,105,148 | |
Held-to-maturity securities(1) | | | 34,993 | | | 254,732 | |
| | | | | | |
| | | | | | | | |
| | $ | 192,460 | | $ | 1,425,815 | |
| | | | | | |
| | | | | | | ��� | |
| | | | | | | | |
| | | | | | |
- (1)
- These securities mature three months or less from date of purchase.
4. Restricted Funds
Restricted funds consisted of the following:
| | | | | | | |
| | December 31, | |
|---|
| | 2013 | | 2012 | |
|---|
| | (in thousands)
| |
|---|
Short-term: | | | | | | | |
Collateral on Letters of Credit for Angola(1) | | $ | 200,339 | | $ | — | |
Ensco 8503 escrow account(2) | | | — | | | 90,440 | |
| | | | | | |
| | | | | | | | |
| | $ | 200,339 | | $ | 90,440 | |
| | | | | | |
| | | | | | | | |
| | | | | | | | |
| | | | | | |
Long-term: | | | | | | | |
Ensco 8503 escrow account(2) | | | — | | | 90,440 | |
Collateral on Letters of Credit for Angola(1) | | | 104,496 | | | 304,492 | |
Other vendor restricted deposits | | | — | | | 720 | |
| | | | | | |
| | | | | | | | |
| | $ | 104,496 | | $ | 395,652 | |
| | | | | | |
| | | | | | | | |
| | | | | | | | |
| | | | | | |
- (1)
- As of December 31, 2013 and December 31, 2012, $304.8 million and $304.5 million, respectively, was held in a collateral account established to secure letters of credit issued in support of the Company's contractually agreed work program obligations on Blocks 9, 20 and 21 offshore Angola. As of December 31, 2013, the collateral in this account was invested in U.S. Treasury bills and Treasury notes purchased at discounts and at premiums, respectively, resulting in a net carrying value of $304.8 million. The contractual maturities of these securities are within one year. The $200.3 million classified as short-term restricted funds at December 31, 2013 includes $153.6 million of cash collateral associated with work program obligations which have been completed for Blocks 20 and 21 and for which the Company expects to receive distribution of the collateral in 2014. The remaining $46.7 million secures work program obligations of $45.3 million for Block 9 for which the initial exploration phase expires on March 1, 2014, if not extended.
- (2)
- As of December 31, 2012, $180.9 million was held in an escrow account established in December 2009 as a guarantee of performance to Ensco Offshore Company ("Ensco") for the Ensco 8503 drilling rig contract. As of December 31, 2013 the escrow account balance was refunded to the Company pursuant to the terms of the drilling rig contract. The drilling rig contract expired in January 2014.
F-14
Table of Contents
Cobalt International Energy, Inc.
(a Development Stage Enterprise)
Notes to Consolidated Financial Statements (Continued)
5. Joint Interests and Other Receivables
As of December 31, 2013 and 2012, the balance in joint interest and other receivables consisted of the following:
| | | | | | | |
| | December 31, | |
|---|
| | 2013 | | 2012 | |
|---|
| | (in thousands)
| |
|---|
Partners in the U.S. Gulf of Mexico | | $ | 68,664 | | $ | 52,439 | |
Partners in West Africa(1) | | | 46,897 | | | 2,185 | |
Accrued interest on investment securities | | | 5,632 | | | 3,647 | |
Other | | | 3,446 | | | 3,321 | |
| | | | | | |
| | | | | | | | |
| | $ | 124,639 | | $ | 61,592 | |
| | | | | | |
| | | | | | | | |
| | | | | | | | |
| | | | | | |
- (1)
- The amount of $46.9 million as of December 31, 2013 includes $15.7 million related to the Company's partners on Block 20 offshore Angola and $31.2 million related to the outstanding balance due from the Company's partners on Blocks 9 and 21 offshore Angola, a portion of which is currently past due but the Company expects to recover.
6. Prepaid Expenses and Other Current Assets
As of December 31, 2013 and 2012, prepaid expenses and other current assets consisted of the following:
| | | | | | | |
| | December 31, | |
|---|
| | 2013 | | 2012 | |
|---|
| | (in thousands)
| |
|---|
Prepaid expenses: | | | | | | | |
Prepaid expenses(1) | | $ | 37,796 | | $ | 11,729 | |
Other current assets: | | | | | | | |
Cash advance to joint venture partner(2) | | | 9,685 | | | 351 | |
Rig mobilization, regulatory and other related costs(3) | | | 8,376 | | | 11,861 | |
| | | | | | |
| | | | | | | | |
| | $ | 55,857 | | $ | 23,941 | |
| | | | | | |
| | | | | | | | |
| | | | | | | | |
| | | | | | |
- (1)
- As of December 31, 2013, prepaid expenses include $11.5 million of the prepaid and unamortized portion of payments made for software licenses, related maintenance fees, insurance and $26.3 million of prepaid costs associated with the Ensco drilling rig contract. The drilling rig contract terminated in January 2014 and upon receipt and application of prepaid amounts against the final invoice from Ensco, any remaining balance of the prepayment will be refunded to the Company. As of December 31, 2012, the $11.7 million in prepaid expenses consisted of the prepaid and unamortized portion of payments made for software licenses, related maintenance fees and insurance.
- (2)
- As of December 31, 2013, the $9.7 million in other current assets relates to payment of cash calls made to our joint interest partner, Total Gabon, for operating costs to drill the Diaman #1B exploration well. This prepayment will be applied against the joint interest bills upon receipt from Total Gabon.
F-15
Table of Contents
Cobalt International Energy, Inc.
(a Development Stage Enterprise)
Notes to Consolidated Financial Statements (Continued)
6. Prepaid Expenses and Other Current Assets (Continued)
- (3)
- As of December 31, 2013, the $8.4 million in other current assets relates to the short-term portion of the mobilization and regulatory acceptance testing costs associated with the SSV Catarina drilling rig. As of December 31, 2012, the $11.9 million in other current assets relates to the remaining balance of the mobilization and equipment upgrade costs associated with the Ensco 8503 drilling rig. These costs are amortized on a straight-line basis over the terms of the respective drilling contracts.
7. Investments
The Company's investments in held-to-maturity securities which are recorded at amortized cost and approximate fair market value were as follows at December 31, 2013 and 2012:
| | | | | | | |
| | December 31, | |
|---|
| | 2013 | | 2012 | |
|---|
| | (in thousands)
| |
|---|
U.S. Treasury securities | | $ | 304,834 | | $ | 483,775 | |
Corporate securities | | | 856,002 | | | 510,691 | |
Commercial paper | | | 408,033 | | | 562,975 | |
Certificates of deposit | | | 105,000 | | | 7,000 | |
| | | | | | |
| | | | | | | | |
Total | | $ | 1,673,869 | | $ | 1,564,441 | |
| | | | | | |
| | | | | | | | |
| | | | | | | | |
| | | | | | |
The Company's held-to-maturity securities were included in the following captions in the Company's balance sheets:
| | | | | | | |
| | December 31, | |
|---|
| | 2013 | | 2012 | |
|---|
| | (in thousands)
| |
|---|
Cash and cash equivalents | | $ | 34,993 | | $ | 254,732 | |
Short-term investments | | | 1,319,380 | | | 789,668 | |
Short-term restricted funds | | | 200,339 | | | 90,440 | |
Long-term restricted funds | | | 104,496 | | | 393,334 | |
Long-term investments | | | 14,661 | | | 36,267 | |
| | | | | | |
| | | | | | | | |
| | $ | 1,673,869 | | $ | 1,564,441 | |
| | | | | | |
| | | | | | | | |
| | | | | | | | |
| | | | | | |
The contractual maturities of these held-to-maturity securities at December 31, 2013 and 2012 were as follows:
| | | | | | | | | | | | | |
| | December 31, | |
|---|
| | 2013 | | 2012 | |
|---|
| | Amortized
Cost | | Estimated Fair
Value | | Amortized
Cost | | Estimated Fair
Value | |
|---|
| | ($ in thousands)
| |
|---|
Within 1 year | | $ | 1,659,208 | | $ | 1,659,208 | | $ | 1,528,174 | | $ | 1,528,174 | |
After 1 year | | | 14,661 | | | 14,661 | | | 36,267 | | | 36,267 | |
| | | | | | | | | | |
| | | | | | | | | | | | | | |
| | $ | 1,673,869 | | $ | 1,673,869 | | $ | 1,564,441 | | $ | 1,564,441 | |
| | | | | | | | | | |
| | | | | | | | | | | | | | |
| | | | | | | | | | | | | | |
| | | | | | | | | | |
F-16
Table of Contents
Cobalt International Energy, Inc.
(a Development Stage Enterprise)
Notes to Consolidated Financial Statements (Continued)
8. Fair Value Measurements
The following tables summarize the Company's significant financial instruments as categorized by the fair value measurement hierarchy:
| | | | | | | | | | | | | | | | |
| | Level 1 | | Level 2 | |
| |
|---|
| | Carrying
Value | | Fair
Value(1) | | Carrying
Value | | Fair
Value(1) | | Balance as of
December 31,
2013 | |
|---|
| | ($ in thousands)
| |
|---|
Cash and cash equivalents: | | | | | | | | | | | | | | | | |
Cash | | $ | 82,428 | | $ | 82,428 | | $ | — | | $ | — | | $ | 82,428 | |
Money market funds | | | 75,039 | | | 75,039 | | | — | | | — | | | 75,039 | |
Commercial paper | | | — | | | — | | | 9,993 | | | 9,993 | | | 9,993 | |
Certificate of deposits | | | | | | | | | 25,000 | | | 25,000 | | | 25,000 | |
| | | | | | | | | | | | |
| | | | | | | | | | | | | | | | | |
Subtotal | | | 157,467 | | | 157,467 | | | 34,993 | | | 34,993 | | | 192,460 | |
| | | | | | | | | | | | |
| | | | | | | | | | | | | | | | | |
Short-term restricted funds: | | | | | | | | | | | | | | | | |
U.S. Treasury notes | | | — | | | — | | | 200,339 | | | 200,339 | | | 200,339 | |
| | | | | | | | | | | | |
| | | | | | | | | | | | | | | | | |
Subtotal | | | — | | | — | | | 200,339 | | | 200,339 | | | 200,339 | |
| | | | | | | | | | | | |
| | | | | | | | | | | | | | | | | |
Short-term investments: | | | | | | | | | | | | | | | | |
Corporate bonds | | | — | | | — | | | 848,307 | | | 848,307 | | | 848,307 | |
Commercial paper | | | — | | | — | | | 391,073 | | | 391,073 | | | 391,073 | |
Certificates of deposits | | | — | | | — | | | 80,000 | | | 80,000 | | | 80,000 | |
| | | | | | | | | | | | |
| | | | | | | | | | | | | | | | | |
Subtotal | | | — | | | — | | | 1,319,380 | | | 1,319,380 | | | 1,319,380 | |
| | | | | | | | | | | | |
| | | | | | | | | | | | | | | | | |
Long-term restricted funds: | | | | | | | | | | | | | | | | |
U.S. Treasury notes | | | — | | | — | | | 104,496 | | | 104,496 | | | 104,496 | |
| | | | | | | | | | | | |
| | | | | | | | | | | | | | | | | |
Subtotal | | | — | | | — | | | 104,496 | | | 104,496 | | | 104,496 | |
| | | | | | | | | | | | |
| | | | | | | | | | | | | | | | | |
Long-term investments: | | | | | | | | | | | | | | | | |
Commercial paper | | | — | | | — | | | 6,967 | | | 6,967 | | | 6,967 | |
Corporate bonds | | | — | | | — | | | 7,694 | | | 7,694 | | | 7,694 | |
| | | | | | | | | | | | |
| | | | | | | | | | | | | | | | | |
Subtotal | | | — | | | — | | | 14,661 | | | 14,661 | | | 14,661 | |
| | | | | | | | | | | | |
| | | | | | | | | | | | | | | | | |
Total | | $ | 157,467 | | $ | 157,467 | | $ | 1,673,869 | | $ | 1,673,869 | | $ | 1,831,336 | |
| | | | | | | | | | | | |
| | | | | | | | | | | | | | | | | |
| | | | | | | | | | | | | | | | | |
| | | | | | | | | | | | |
F-17
Table of Contents
Cobalt International Energy, Inc.
(a Development Stage Enterprise)
Notes to Consolidated Financial Statements (Continued)
8. Fair Value Measurements (Continued)
| | | | | | | | | | | | | | | | |
| | Level 1 | | Level 2 | |
| |
|---|
| | Balance as of
December 31,
2012 | |
|---|
| | Carrying Value | | Fair Value(1) | | Carrying Value | | Fair Value(1) | |
|---|
| | ($ in Thousands)
| |
|---|
Cash and cash equivalents: | | | | | | | | | | | | | | | | |
Cash | | $ | 65,935 | | $ | 65,935 | | $ | — | | $ | — | | $ | 65,935 | |
Money market funds | | | 1,105,148 | | | 1,105,148 | | | — | | | — | | | 1,105,148 | |
Commercial paper | | | — | | | — | | | 247,206 | | | 247,206 | | | 247,206 | |
Corporate bonds | | | — | | | — | | | 7,526 | | | 7,526 | | | 7,526 | |
| | | | | | | | | | | | |
| | | | | | | | | | | | | | | | | |
Subtotal | | | 1,171,083 | | | 1,171,083 | | | 254,732 | | | 254,732 | | | 1,425,815 | |
| | | | | | | | | | | | |
| | | | | | | | | | | | | | | | | |
Short-term restricted funds: | | | | | | | | | | | | | | | | |
U.S. Treasury bills | | | — | | | — | | | 90,440 | | | 90,440 | | | 90,440 | |
| | | | | | | | | | | | |
| | | | | | | | | | | | | | | | | |
Subtotal | | | — | | | — | | | 90,440 | | | 90,440 | | | 90,440 | |
| | | | | | | | | | | | |
| | | | | | | | | | | | | | | | | |
Short-term investments: | | | | | | | | | | | | | | | | |
Corporate bonds | | | — | | | — | | | 466,898 | | | 466,898 | | | 466,898 | |
Commercial paper | | | — | | | — | | | 315,769 | | | 315,769 | | | 315,769 | |
Certificate of deposits | | | — | | | — | | | 7,001 | | | 7,001 | | | 7,001 | |
| | | | | | | | | | | | |
| | | | | | | | | | | | | | | | | |
Subtotal | | | — | | | — | | | 789,668 | | | 789,668 | | | 789,668 | |
| | | | | | | | | | | | |
| | | | | | | | | | | | | | | | | |
Long-term restricted funds: | | | | | | | | | | | | | | | | |
Money market funds | | | 2,318 | | | 2,318 | | | — | | | — | | | 2,318 | |
U.S. Treasury bills | | | — | | | — | | | 178,216 | | | 178,216 | | | 178,216 | |
U.S. Treasury notes | | | — | | | — | | | 215,118 | | | 215,118 | | | 215,118 | |
| | | | | | | | | | | | |
| | | | | | | | | | | | | | | | | |
Subtotal | | | 2,318 | | | 2,318 | | | 393,334 | | | 393,334 | | | 395,652 | |
| | | | | | | | | | | | |
| | | | | | | | | | | | | | | | | |
Long-term investments: | | | | | | | | | | | | | | | | |
Corporate bonds | | | — | | | — | | | 36,267 | | | 36,267 | | | 36,267 | |
| | | | | | | | | | | | |
| | | | | | | | | | | | | | | | | |
Subtotal | | | — | | | — | | | 36,267 | | | 36,267 | | | 36,267 | |
| | | | | | | | | | | | |
| | | | | | | | | | | | | | | | | |
Total | | $ | 1,173,401 | | $ | 1,173,401 | | $ | 1,564,441 | | $ | 1,564,441 | | $ | 2,737,842 | |
| | | | | | | | | | | | |
| | | | | | | | | | | | | | | | | |
| | | | | | | | | | | | | | | | | |
| | | | | | | | | | | | |
- (1)
- As of December 31, 2013 and 2012, the Company did not record any OTTI on these assets.
F-18
Table of Contents
Cobalt International Energy, Inc.
(a Development Stage Enterprise)
Notes to Consolidated Financial Statements (Continued)
9. Property, Plant, and Equipment
Property, plant, and equipment is stated at cost less accumulated depreciation/amortization and consisted of the following:
| | | | | | | | | |
| |
| | December 31, | |
|---|
| | Estimated
Useful Life
(Years) | |
|---|
| | 2013 | | 2012 | |
|---|
| |
| | ($ in thousands)
| |
|---|
Oil and Gas Properties: | | | | | | | | | |
Proved properties: | | | | | | | | | |
Well and development costs | | | | $ | 92,579 | | $ | — | |
| | | | | | | | |
| | | | | | | | | | |
Total proved properties | | | | | 92,579 | | | — | |
| | | | | | | | |
| | | | | | | | | | |
Unproved properties: | | | | | | | | | |
Oil and gas leasehold | | | | $ | 754,894 | | $ | 721,853 | |
Less: accumulated valuation allowance | | | | | (160,913 | ) | | (78,413 | ) |
| | | | | | | | |
| | | | | | | | | | |
| | | | | 593,981 | | | 643,440 | |
Exploration wells in process | | | | | 777,823 | | | 451,024 | |
| | | | | | | | |
| | | | | | | | | | |
Total unproved properties | | | | | 1,371,804 | | | 1,094,464 | |
| | | | | | | | |
| | | | | | | | | | |
Total oil and gas properties, net | | | | | 1,464,383 | | | 1,094,464 | |
| | | | | | | | |
| | | | | | | | | | |
Other Property and Equipment: | | | | | | | | | |
Computer equipment and software | | 3 | | | 5,115 | | | 3,166 | |
Office equipment and furniture | | 3 - 5 | | | 2,132 | | | 2,093 | |
Vehicles | | 3 | | | 265 | | | 268 | |
Leasehold improvements | | 3 - 10 | | | 2,456 | | | 2,298 | |
Running tools and equipment | | 3 | | | 6,318 | | | — | |
| | | | | | | | |
| | | | | | | | | | |
| | | | | 16,286 | | | 7,825 | |
Less: accumulated depreciation and amortization(1) | | | | | (4,394 | ) | | (2,533 | ) |
| | | | | | | | |
| | | | | | | | | | |
Total other property and equipment, net | | | | | 11,892 | | | 5,292 | |
| | | | | | | | |
| | | | | | | | | | |
Property, plant, and equipment, net | | | | $ | 1,476,275 | | $ | 1,099,756 | |
| | | | | | | | |
| | | | | | | | | | |
| | | | | | | | | | |
| | | | | | | | |
- (1)
- During the year ended December 31, 2012, the Company wrote off $2.2 million of old computer equipment and leasehold improvements which were fully depreciated and therefore had no impact on the consolidated statements of operations and consolidated statements of cash flow.
The Company recorded $1.9 million, $1.2 million and $0.7 million of depreciation and amortization expense for the years ended December 31, 2013, 2012 and 2011, respectively, and $6.6 million for the period November 10, 2005 (inception) through December 31, 2013, respectively.
F-19
Table of Contents
Cobalt International Energy, Inc.
(a Development Stage Enterprise)
Notes to Consolidated Financial Statements (Continued)
9. Property, Plant, and Equipment (Continued)
Proved Oil and Gas Properties
The Heidelberg project was formally sanctioned for development in mid-2013. As a result of the project sanction, the Company reclassified its Heidelberg exploration well costs to proved property well and development costs and these costs will be amortized when the related proved developed reserves are produced. As of December 31, 2013, the well and development costs consist of $31.6 million relating to exploration well costs for the Heidelberg #1 exploration well and Heidelberg #3 appraisal well and $61.0 million for costs associated with well development.
Unproved Oil and Gas Properties
On December 20, 2011, the Company acquired a 40% working interest in Block 20 offshore Angola for a total consideration of $347.1 million, of which $337.1 million is contractually scheduled to be paid over five years commencing in January 2012. As of December 31, 2013, out of the $337.1 million, $165.7 million has been paid and the remaining $171.4 million was accrued in short-term and long-term contractual obligations.See Note 12—Contractual Obligations. In addition to the Block 20 interests, the Company has $10.8 million of unproved property acquisition costs relating to its 40% interests in Blocks 9 and 21 offshore Angola and its 21.25% working interest in the Diaba Block offshore Gabon.
As of December 31, 2013, the Company also has $236.1 million of unproved property acquisition costs, net of valuation allowance for impairment, relating to its U.S. Gulf of Mexico properties. On February 26, 2013, the Company executed a Purchase and Sale agreement (the "PSA") to sell its ownership interests on an unproved oil and gas property on Mississippi Canyon Block 209 for a total consideration of $5.6 million. The Company received $1.5 million at closing and an additional $1.5 million in September 2013 when the buyer commenced operations on the property. Pursuant to the terms and conditions of the PSA, the Company will receive the remaining $2.6 million contingent upon the purchaser's commencement of production on this property in the future. For the year ended December 31, 2013, the Company recognized a gain of $3.0 million on the sale of assets as a result of this transaction. During the year ended December 31, 2013, the Company paid a total consideration of $37.6 million for acquisition of ownership interests in unproved oil and gas properties on Garden Banks Block 822, Mississippi Canyon Block 605 and Walker Ridge Block 232 in the U.S. Gulf of Mexico.
As of December 31, 2013 and December 31, 2012, the Company has a net total of $594.0 million and $643.4 million, respectively, of unproved property acquisition costs on the consolidated balance sheets.
Acquisition costs of unproved properties are assessed for impairment during the holding period and transferred to proved oil and gas properties to the extent associated with successful exploration activities. There are no impairment indicators to date that would require the Company to impair the unproved properties in Blocks 20 and 21 offshore Angola and in the Diaba Block offshore Gabon. For the unproved properties associated with Block 9 offshore Angola, the initial exploration phase expires on March 1, 2014 under the Risk Service Agreement for Block 9. The Company has requested an extension of the initial exploration phase and such extension is pending approval by Sonangol and the Angola Ministry of Petroleum. If the extension is not approved, the Company will forfeit its acreage on Block 9, impair the $2.5 million paid for its working interest in Block 9 and may have to relinquish $45.3 million that secures work program obligations on Block 9. Oil and gas leases for unproved
F-20
Table of Contents
Cobalt International Energy, Inc.
(a Development Stage Enterprise)
Notes to Consolidated Financial Statements (Continued)
9. Property, Plant, and Equipment (Continued)
properties in the U.S. Gulf of Mexico with a carrying value greater than $1.0 million are assessed individually for impairment based on the Company's current exploration plans and an allowance for impairment is provided if impairment is indicated. Leases that are individually less than $1.0 million in carrying value or are near expiration are amortized on a group basis over the average terms of the leases at rates that provide for full amortization of leases upon lease expiration. These leases have expiration dates ranging from 2014 through 2022. As of December 31, 2013 and 2012, the balance for unproved properties that were subject to amortization before impairment provision was $68.9 million and $69.1 million, respectively. The Company recorded a lease impairment allowance of $87.0 million, $60.2 million and $9.1 million for the years ended December 31, 2013, 2012 and 2011, respectively, and $165.6 million for the period November 10, 2005 (inception) through December 31, 2013.
Capitalized Exploration Well Costs
If an exploration well provides evidence as to the existence of sufficient quantities of hydrocarbons to justify potential completion as a producing well, drilling costs associated with the well are initially capitalized, or suspended, pending a determination as to whether a commercially sufficient quantity of proved reserves can be attributed to the area as a result of drilling. This determination may take longer than one year in certain areas (generally, deepwater and international locations) depending upon, among other things, (i) the amount of hydrocarbons discovered, (ii) the outcome of planned geological and engineering studies, (iii) the need for additional appraisal drilling activities to determine whether the discovery is sufficient to support an economic development plan and (iv) the requirement for government sanctioning in international locations before proceeding with development activities.
The following tables reflect the Company's net changes in and the cumulative costs of capitalized exploration well costs (excluding any related leasehold costs):
| | | | | | | | | | |
| | December 31,
2013 | | December 31,
2012 | | December 31,
2011 | |
|---|
| | ($ in thousands)
| |
|---|
Beginning of period | | $ | 451,024 | | $ | 178,338 | | $ | 106,881 | |
Additions to capitalized exploration | | | | | | | | | | |
U.S. Gulf of Mexico: | | | | | | | | | | |
Exploration well costs | | | 154,877 | | | 178,295 | | | 11,214 | |
Capitalized interest | | | 3,928 | | | — | | | — | |
West Africa: | | | | | | | | | | |
Exploration well costs | | | 457,608 | | | 168,309 | | | 96,849 | |
Capitalized interest | | | 12,271 | | | — | | | — | |
Reclassifications to wells, facilities, and equipment based on determination of proved reserves | | | (38,446 | ) | | — | | | — | |
Amounts charged to expense(1) | | | (263,439 | ) | | (73,918 | ) | | (36,606 | ) |
| | | | | | | | |
| | | | | | | | | | | |
End of period | | $ | 777,823 | | $ | 451,024 | | $ | 178,338 | |
| | | | | | | | |
| | | | | | | | | | | |
| | | | | | | | | | | |
| | | | | | | | |
- (1)
- The amount of $263.4 million for the year ended December 31, 2013 represents $120.0 million of impairment charges on exploration wells drilled in the U.S. Gulf of Mexico which did not encounter commercial hydrocarbons, $126.3 million of impairment
F-21
Table of Contents
Cobalt International Energy, Inc.
(a Development Stage Enterprise)
Notes to Consolidated Financial Statements (Continued)
9. Property, Plant, and Equipment (Continued)
charges on exploration wells drilled offshore Angola which failed to flow measurable hydrocarbons from drill stem tests and a portion of the cost of exploration wells drilled offshore Angola that were determined to have no utility in the lowest interval beneath the pay zone and $17.1 million of impairment charges on the exploration well drilled offshore Gabon which needed to be re-spud due to mechanical problems with the wellbore. The amount of $73.9 million for the year ended December 31, 2012 represents impairment charges on exploration wells drilled in the U.S. Gulf of Mexico which did not encounter commercial hydrocarbons.
| | | | | | | |
| | December 31,
2013 | | December 31,
2012 | |
|---|
| | ($ in thousands)
| |
|---|
Cumulative costs: | | | | | | | |
U.S. Gulf of Mexico | | | | | | | |
Exploration well costs | | $ | 204,707 | | $ | 208,275 | |
Capitalized interest | | | 3,928 | | | — | |
West Africa | | | | | | | |
Exploration well costs | | | 556,917 | | | 242,749 | |
Capitalized interest | | | 12,271 | | | — | |
| | | | | | |
| | | | | | | | |
| | $ | 777,823 | | $ | 451,024 | |
| | | | | | |
| | | | | | | | |
| | | | | | | | |
| | | | | | |
Well costs capitalized for a period greater than one year after completion of drilling (included in table above) | | $ | 399,775 | | $ | 194,853 | |
| | | | | | |
| | | | | | | | |
| | | | | | | | |
| | | | | | |
As of December 31, 2013, capitalized exploration well costs that have been suspended longer than one year are associated with the Company's Shenandoah, North Platte and Cameia discoveries. These well costs are suspended pending ongoing evaluation including, but not limited to, results of additional appraisal drilling, well-test analysis, additional geological and geophysical data and approval of a development plan. Management believes these discoveries exhibit sufficient indications of hydrocarbons to justify potential development and is actively pursuing efforts to fully assess them. If additional information becomes available that raises substantial doubt as to the economic or operational viability of these discoveries, the associated costs will be expensed at that time. The Heidelberg discovery has been sanctioned for development and the Heidelberg capitalized exploration and appraisal well costs were reclassified to development costs as of December 31, 2013.
F-22
Table of Contents
Cobalt International Energy, Inc.
(a Development Stage Enterprise)
Notes to Consolidated Financial Statements (Continued)
10. Other Assets
As of December 31, 2013 and 2012, the balance in other assets consisted of the following:
| | | | | | | |
| | December 31, | |
|---|
| | 2013 | | 2012 | |
|---|
| | (in thousands)
| |
|---|
Debt issue cost(1) | | $ | 20,983 | | $ | 23,042 | |
Long-term portion of prepaid shorebase leases | | | 3,241 | | | — | |
Rig mobilization costs(2) | | | 11,153 | | | — | |
Long-term accounts receivable(3) | | | 17,923 | | | — | |
Other | | | 437 | | | — | |
| | | | | | |
| | | | | | | | |
| | $ | 53,737 | | $ | 23,042 | |
| | | | | | |
| | | | | | | | |
| | | | | | | | |
| | | | | | |
- (1)
- As of December 31, 2013 and 2012, the $21.0 million and $23.0 million in debt issue cost relate to the issuance of the Company's 2.625% convertible senior notes due 2019, as described in Note 11, and which are amortized over the life of the notes using the effective interest method.
- (2)
- The $11.2 million as of December 31, 2013 relates to costs associated with the long-term mobilization and the regulatory acceptance testing of the SSV Catarina drilling rig. These costs are amortized over the term of the drilling rig contract.
- (3)
- On March 16, 2012, Angola enacted Presidential Decree No. 3/12, which, among other things, provided that Angolan private petroleum companies are exempt from any requirement to carry Sonangol P&P. As a result of this statute, one of the Company's partners in Angola has taken the position that it is no longer required to pay a 3.75% cost interest attributable to Sonangol P&P's share of expenses. As of December 31, 2013, these expenditures totaled approximately $17.9 million, which is classified as a long term receivable as the Company expects this amount to be recovered pursuant to the terms of the Risk Services Agreements governing Blocks 9 and 21.
11. Long-term Debt
On December 17, 2012, the Company issued $1.38 billion aggregate principal amount of its 2.625% convertible senior notes due 2019 (the "Notes"). The Notes are the Company's senior unsecured obligations and interest is payable semi-annually in arrears on June 1 and December 1 of each year. For the year ended December 31, 2013, the Company paid $34.6 million in interest on the notes. The Notes will mature on December 1, 2019, unless earlier repurchased or converted in accordance with the terms of the Notes. The Notes may be converted at the option of the holder at any time prior to 5:00 p.m., New York City time, on the second scheduled trading day immediately preceding the maturity date, in multiples of $1,000 principal amount. The Notes are convertible at an initial conversion rate of 28.023 shares of common stock per $1,000 principal amount, representing an initial conversion price of approximately $35.68 per share for a total of approximately 38.7 million underlying shares. The conversion rate is subject to adjustment upon the occurrence of certain events, as defined in the indenture governing the Notes, but will not be adjusted for any accrued and unpaid interest except in limited circumstances. Upon conversion, the Company's conversion obligation may be
F-23
Table of Contents
Cobalt International Energy, Inc.
(a Development Stage Enterprise)
Notes to Consolidated Financial Statements (Continued)
11. Long-term Debt (Continued)
satisfied, at the Company's option, in cash, shares of common stock or a combination of cash and shares of common stock.
Holders of the Notes who convert their Notes in connection with a "make-whole fundamental change", as defined in the indenture governing the Notes, may be entitled to a make-whole premium in the form of an increase in the conversion rate. Additionally, in the event of a fundamental change, as defined in the indenture governing the Notes, holders of the Notes may require the Company to repurchase for cash all or a portion of their Notes equal to $1,000 or a multiple of $1,000 at a fundamental change repurchase price equal to 100% of the principal amount of Notes, plus accrued and unpaid interest, if any, to, but not including, the fundamental change repurchase date.
Upon the occurrence of an Event of Default, as defined within the Indenture governing the Notes, the Trustee or the Holders of at least 25% in aggregate principal amount of the Notes then outstanding may declare 100% of the principal of, and accrued and unpaid interest on, all the Notes to be due and payable immediately.
In accordance with accounting guidance relating to, "Debt with Conversion and Other Options", the Company separately accounts for the liability and equity conversion components of the Notes due to the Company's option to settle the conversion obligation in cash. The fair value of the debt excluding the conversion feature at the date of issuance was estimated to be approximately $989.5 million and was calculated based on the fair value of similar non-convertible debt instruments. The resulting value of the conversion option of $390.5 million was recognized as a debt discount and recorded as additional paid-in capital on the Company's consolidated balance sheets. Total debt issue cost on the Notes was $32.2 million of which $23.1 million was allocated to the liability component of the Notes and $9.1 million to the equity component of the Notes. The debt discount and the liability component of the debt issue costs are amortized over the term of the Notes. The effective interest rate used to amortize the debt discount and the liability component of the debt issue costs was approximately 8.40% based on the Company's estimated non-convertible borrowing rate as of the date the Notes were issued. Since the Company incurred losses for all periods, the impact of the conversion option would be anti-dilutive to the earnings per share and therefore was not included in the calculation.
The carrying amounts of the liability components of the Notes were as follows:
| | | | | | | | | | | | | | | | | | | |
| | December 31, 2013 | | December 31, 2012 | |
|---|
| | Principal
Amount | | Unamortized
discount(1) | | Carrying
Amount | | Principal
Amount | | Unamortized
discount | | Carrying
Amount | |
|---|
| | ($ in thousands)
| |
|---|
Carrying amount of liability component | | | | | | | | | | | | | | | | | | | |
2.625% convertible senior notes due 2019 | | $ | 1,380,000 | | $ | (344,020 | ) | $ | 1,035,980 | | $ | 1,380,000 | | $ | (388,809 | ) | $ | 991,191 | |
| | | | | | | | | | | | | | |
| | | | | | | | | | | | | | | | | | | | |
| | | | | | | | | | | | | | | | | | | | |
| | | | | | | | | | | | | | |
- (1)
- Unamortized discount will be amortized over the remaining life of the Notes which is 6 years.
F-24
Table of Contents
Cobalt International Energy, Inc.
(a Development Stage Enterprise)
Notes to Consolidated Financial Statements (Continued)
11. Long-term Debt (Continued)
The carrying amounts of the equity components of the Notes were as follows:
| | | | | | | |
| | December 31,
2013 | | December 31,
2012 | |
|---|
| | ($ in thousands)
| |
|---|
Debt discount relating to value of conversion option | | $ | 390,540 | | $ | 390,540 | |
Debt issue costs | | | (9,124 | ) | | (9,124 | ) |
| | | | | | |
| | | | | | | | |
Total | | $ | 381,416 | | $ | 381,416 | |
| | | | | | |
| | | | | | | | |
| | | | | | | | |
| | | | | | |
Fair Value The fair value of the Notes excluding the conversion feature was $1,227.1 million and $989.5 million as of December 31, 2013 and 2012, respectively, and was calculated based on the fair value of similar non-convertible debt instruments (level 2) since an observable quoted price of the Notes or a similar asset or liability is not readily available.
Interest expense associated with the 2.625% convertible senior notes due 2019 was as follows:
| | | | | | | | | | | | | |
| |
| |
| |
| | For the Period
November 10, 2005
(Inception)
through
December 31, 2013 | |
|---|
| | For Year Ended December 31, | |
|---|
| | 2013 | | 2012 | | 2011 | |
|---|
| | ($ in thousands)
| |
|---|
Interest expense associated with accrued interest(1) | | $ | 18,529 | | $ | 1,294 | | $ | — | | $ | 19,823 | |
Interest expense associated with accretion of debt discount | | | 44,789 | | | 1,843 | | | — | | | 46,632 | |
Interest expense associated with amortization of debt issue costs | | | 2,058 | | | 75 | | | — | | | 2,133 | |
| | | | | | | | | | |
| | | | | | | | | | | | | | |
Total | | $ | 65,376 | | $ | 3,212 | | $ | — | | $ | 68,588 | |
| | | | | | | | | | |
| | | | | | | | | | | | | | |
| | | | | | | | | | | | | | |
| | | | | | | | | | |
- (1)
- The $18.5 million and $1.3 million for the years ended December 31, 2013 and 2012, respectively, represent interest expense net of capitalized amounts of $17.7 million and $0 million, respectively.
F-25
Table of Contents
Cobalt International Energy, Inc.
(a Development Stage Enterprise)
Notes to Consolidated Financial Statements (Continued)
12. Contractual Obligations
The short-term and long-term contractual obligations consist of the following:
| | | | | | | |
| | December 31, | |
|---|
| | 2013 | | 2012 | |
|---|
| | ($ in thousands)
| |
|---|
Short-term Contractual Obligations: | | | | | | | |
Social obligation payments for Block 9, offshore Angola | | $ | 150 | | $ | 150 | |
Social obligation payments for Block 21, offshore Angola | | | 300 | | | 300 | |
Social obligation and bonus payments for Block 20, offshore Angola(1)(2) | | | 48,569 | | | 48,569 | |
| | | | | | |
| | | | | | | | |
| | $ | 49,019 | | $ | 49,019 | |
| | | | | | |
| | | | | | | | |
| | | | | | | | |
| | | | | | |
Long-term Contractual Obligations: | | | | | | | |
Social obligation payments for Block 9, offshore Angola | | $ | 669 | | $ | 848 | |
Social obligation payments for Block 21, offshore Angola | | | 1,381 | | | 1,684 | |
Social obligation and bonus payments for Block 20, offshore Angola(2) | | | 122,851 | | | 165,706 | |
| | | | | | |
| | | | | | | | |
| | $ | 124,901 | | $ | 168,238 | |
| | | | | | |
| | | | | | | | |
| | | | | | | | |
| | | | | | |
- (1)
- $42.9 million of this amount was paid in January 2014.
- (2)
- The total amount of social obligation payments for Block 20 has been capitalized.See Note 9.
13. Stockholders' Equity
On January 15, 2012, the Company withheld the issuance of an aggregate amount of 9,127 shares of its common stock, at a price of $18.74 per share, to satisfy tax withholding obligations of certain of its officers that arose upon the distribution of deferred stock compensation.
On February 29, 2012, the Company issued 18,050,000 shares of common stock at a public offering price of $28.00 per share.
On December 17, 2012, the Company issued $1.38 billion aggregate principal amount of its 2.625% convertible senior notes due 2019. As of December 31, 2013 and 2012, $381.4 million was recorded as the equity component of the Notes.See also Note 11—Long-term Debt.
F-26
Table of Contents
Cobalt International Energy, Inc.
(a Development Stage Enterprise)
Notes to Consolidated Financial Statements (Continued)
14. Seismic and Exploration Expenses
Seismic and exploration expenses consisted of the following:
| | | | | | | | | | | | | |
| |
| |
| |
| | For the Period
November 10, 2005
(Inception)
through
December 31, 2013 | |
|---|
| | For Year Ended December 31, | |
|---|
| | 2013 | | 2012 | | 2011 | |
|---|
| | ($ in thousands)
| |
|---|
Seismic costs | | $ | 63,721 | | $ | 42,447 | | $ | 20,443 | | $ | 405,769 | |
Seismic cost recovery(1) | | | — | | | — | | | — | | | (25,126 | ) |
Leasehold delay rentals | | | 6,660 | | | 6,383 | | | 6,075 | | | 39,562 | |
Force Majeure expense(2) | | | — | | | — | | | — | | | 13,549 | |
Drilling rig expense | | | 3,832 | | | 12,753 | | | 5,721 | | | 30,631 | |
| | | | | | | | | | |
| | | | | | | | | | | | | | |
| | $ | 74,213 | | $ | 61,583 | | $ | 32,239 | | $ | 464,385 | |
| | | | | | | | | | |
| | | | | | | | | | | | | | |
| | | | | | | | | | | | | | |
| | | | | | | | | | |
- (1)
- These amounts represent reimbursement from partners of past seismic costs incurred by the Company.
- (2)
- These amounts represent expenditures resulting from suspension of drilling activities in the U.S. Gulf of Mexico as a result of the explosion and sinking of the Deepwater Horizon drilling rig in the U.S. Gulf of Mexico, the resulting oil spill and the regulatory response thereto and other exploration expenses.
15. Equity based Compensation
Overview. Under the Company's Long Term Incentive Plan (the "Incentive Plan"), the Company may issue stock options, stock appreciation rights, restricted stock, restricted stock units, performance awards and other stock-based awards to employees. At December 31, 2013, approximately 7.5 million shares remain available for grant under the Incentive Plan.
On January 28, 2010, the Company adopted the Non-Employee Directors Compensation Plan (the "NED Plan"). Under the NED Plan, the Company may issue options, restricted stock units, other stock-based award or retainers to non-employee directors. At December 31, 2013, 500,158 shares remain available for grant under the NED Plan.
In accordance with ASC No. 718,Compensation—Stock Compensation, the Company recognizes compensation cost for equity-based compensation to employees and non-employee directors over the period during which the recipient is required to provide service in exchange for the award, based on the fair value of the equity instrument on the date of grant, net of estimated forfeitures. If actual forfeitures differ from the Company's estimates, additional adjustments to compensation expense will be required in future periods.
Restricted Stock. The Company accounted for the restricted stock based on ASC Topic 718 as described above. For restricted stock awards with market conditions, the fair value of the awards is measured using the asset-or-nothing option pricing model. Restricted stock awards without market conditions and the performance-based awards are valued using the market price of the Company's common stock on the grant date. The Company records compensation cost, net of estimated
F-27
Table of Contents
Cobalt International Energy, Inc.
(a Development Stage Enterprise)
Notes to Consolidated Financial Statements (Continued)
15. Equity based Compensation (Continued)
forfeitures, for stock-based compensation awards over the requisite service period except for performance-based awards. For performance-based awards, compensation cost is recognized over the requisite service period as and when the Company determines that the achievement of the performance condition is probable, using the per-share fair value measured at grant date.
The following table summarizes the information about the restricted stock awarded to employees for each of the three years in the period ended December 31, 2013:
| | | | | | | | | | | | | | | | | | | |
| | Years Ended December 31, | |
|---|
| | 2013 | | 2012 | | 2011 | |
|---|
| | Restricted
Shares | | Weighted
Average
Grant Date
Fair Value
Per Share | | Restricted
Shares | | Weighted
Average
Grant Date
Fair Value
Per Share | | Restricted
Shares | | Weighted
Average
Grant Date
Fair Value
Per Share | |
|---|
Non-vested shares at beginning of year | | | 4,040,825 | | $ | 13.05 | | | 4,599,783 | | $ | 11.27 | | | 5,570,895 | | $ | 9.77 | |
Granted | | | 620,840 | | $ | 24.58 | | | 487,710 | | $ | 26.01 | | | 214,792 | | $ | 8.54 | |
Vested | | | (239,317 | ) | $ | 17.37 | | | (738,628 | ) | $ | 13.05 | | | (1,185,904 | ) | $ | 3.75 | |
Forfeited or expired | | | (87,462 | ) | $ | 20.91 | | | (308,040 | ) | $ | 12.17 | | | — | | | — | |
| | | | | | | | | | | | | | | | | |
| | | | | | | | | | | | | | | | | | | | |
Non-vested shares at end of year | | | 4,334,886 | | $ | 14.31 | | | 4,040,825 | | $ | 13.05 | | | 4,599,783 | | $ | 11.27 | |
| | | | | | | | | | | | | | | | | |
| | | | | | | | | | | | | | | | | | | | |
| | | | | | | | | | | | | | | | | | | | |
| | | | | | | | | | | | | | | | | |
Weighted-average vesting period remaining | | | 1.22 years | | | | | | 1.87 years | | | | | | 2.5 years | | | | |
| | | | | | | | | | | | | | | | | |
| | | | | | | | | | | | | | | | | | | | |
| | | | | | | | | | | | | | | | | | | | |
| | | | | | | | | | | | | | | | | |
Unrecognized compensation ($ in thousands) | | $ | 22,467 | | | | | $ | 23,827 | | | | | $ | 29,559 | | | | |
| | | | | | | | | | | | | | | | | |
| | | | | | | | | | | | | | | | | | | | |
| | | | | | | | | | | | | | | | | | | | |
| | | | | | | | | | | | | | | | | |
A total of 39,818 restricted stock unit awards were granted to non-employee directors during the year ended December 31, 2013 for annual retainers. As of December 31, 2013, the Company has granted a cumulative total of 177,763 restricted stock units to non-employee directors. For the year ended December 31, 2013 and 2012, the Company also granted 15,318 and 12,221 shares of common stock, respectively, as retainer awards to non-employee directors who elected to be compensated by stock in lieu of cash payments. The weighted average fair value of these shares at grant date was $25.40 per share.
Non-Qualified Stock Options. The Company grants non-qualified stock options to employees at an exercise price equal to the market value of the Company's common stock on the grant date. The non-qualified stock option awards have contractual terms of 10 years. The options granted in December 2010 vest ratably over a four-year period from date of grant, the options granted in February 2012 cliff vest on December 31, 2014 and the options granted in February 2013 vest 50% on December 31, 2015 and 50% on December 31, 2016.
The fair value of each stock option granted is determined using the Black-Scholes-Merton option-pricing model based on several assumptions. These assumptions are based on management's best
F-28
Table of Contents
Cobalt International Energy, Inc.
(a Development Stage Enterprise)
Notes to Consolidated Financial Statements (Continued)
15. Equity based Compensation (Continued)
estimate at the time of grant. The Company used the following the weighted average of each assumption based on the grants in 2013:
| | | | |
| | 2013 | |
|---|
Expected Term in Years | | | 6.68 | |
Expected Volatility | | | 61.58 | % |
Expected Dividends | | | 0. | % |
Risk-Free Interest Rate | | | 1.28 | % |
The Company estimates expected volatility based on an analysis of its stock price since the IPO and comparing the stock price volatility for the period from IPO date through December 31, 2013 with the historical stock price volatility of a similar exploration and production company. The Company estimates the expected term of its option awards based on the vesting period and average remaining contractual term, referred to as the "simplified method". The Company uses this method to provide a reasonable basis for estimating its expected term based on a lack of sufficient historical employee exercise data on stock option awards.
A summary of the stock options activities for the year ended December 31, 2013 is presented below:
| | | | | | | | | | | | | |
| | Shares | | Weighted
Average
Exercise
Price | | Weighted-Average
Remaining
Contractual Term
(years) | | Aggregate
Intrinsic Value
(thousands) | |
|---|
Outstanding at January 1, 2013 | | | 1,434,393 | | $ | 17.87 | | | 8.3 | | $ | 12,158 | |
Granted | | | 959,023 | | $ | 23.78 | | | 9.1 | | | | |
Exercised | | | (13,985 | ) | $ | 12.45 | | | 6.9 | | $ | 219 | |
Forfeited or expired | | | (40,713 | ) | $ | 22.89 | | | | | | | |
| | | | | | | | | | | | | |
| | | | | | | | | | | | | | |
Outstanding at December 31, 2013 | | | 2,338,718 | | $ | 20.24 | | | 8.0 | | $ | 3,937 | |
| | | | | | | | | | | | | |
| | | | | | | | | | | | | | |
| | | | | | | | | | | | | | |
| | | | | | | | | | | | | |
Vested or expected to vest at December 31, 2013 | | | 1,568,748 | | $ | 23.83 | | | 8.5 | | $ | 965 | |
| | | | | | | | | | | | | |
| | | | | | | | | | | | | | |
| | | | | | | | | | | | | | |
| | | | | | | | | | | | | |
Exercisable at December 31, 2013 | | | 737,973 | | $ | 12.45 | | | 6.9 | | $ | 2,952 | |
| | | | | | | | | | | | | |
| | | | | | | | | | | | | | |
| | | | | | | | | | | | | | |
| | | | | | | | | | | | | |
The weighted-average grant-date fair value of stock options granted during 2013 and 2012 was $14.08 and $17.92 per option, respectively, using the Black-Scholes option-pricing model. As of December 31, 2013, $14.0 million of total unrecognized compensation cost related to stock option is expected to be recognized over a weighted-average period of 2.15 years.
Restricted Stock Units. On December 3, 2010, the Company granted 198,838 restricted stock units to employees based on the Restricted Stock Unit (RSU) Award Agreement. Under the RSU Award Agreement the share-based payment is earned based on the number of successful wells drilled during the three year period ending December 31, 2013. The RSU award will vest within a range of 0% to 200% of the number of RSU shares awarded on scheduled vesting dates contingent upon the recipient's continued service at each vesting date and based on the achievement of successful wells drilled as defined in the RSU Award Agreement. In no event shall the recipients vest in an amount greater than 200% of the Award or in aggregate 397,676 RSU shares. The percentage of the RSU
F-29
Table of Contents
Cobalt International Energy, Inc.
(a Development Stage Enterprise)
Notes to Consolidated Financial Statements (Continued)
15. Equity based Compensation (Continued)
awards vested at each of the three year periods ending December 31, 2013 is calculated by the number of successful wells drilled during the respective years multiplied by vesting percentage ranging from 25% to 37.5%. The RSU Award Agreement therefore has multiple implicit service periods which are determined by and when the Company drills a successful well. The fair value of the RSUs at grant date was $12.45 per share. However, on February 24, 2012, the Company amended certain terms and conditions of its RSU award agreement which resulted in the Company using the fair value of $30.50 per share at modification date to recognize the equity based compensation expense for the RSUs that vested during 2012 and 2013.
A summary of the restricted stock units activities for the year ended December 31, 2013 is presented below:
| | | | | | | | | | | | | | | | | | | |
| | Years Ended December 31, | |
|---|
| | 2013 | | 2012 | | 2011 | |
|---|
| | Number of
shares
relating
Restricted
Stock Units | | Weighted
Average
Grant Date
Fair Value
Per Unit | | Number of
shares
relating
Restricted
Stock Units | | Weighted
Average
Grant Date
Fair Value
Per Unit | | Number of
shares
relating
Restricted
Stock Units | | Weighted
Average
Grant Date
Fair Value
Per Unit | |
|---|
Non-vested at beginning of year | | | 109,275 | | $ | 30.50 | | | 198,838 | | $ | 12.45 | | | 198,838 | | $ | 12.45 | |
Granted | | | — | | | — | | | — | | | — | | | — | | | — | |
Vested | | | (87,401 | ) | $ | 30.50 | | | (74,537 | ) | $ | 30.50 | | | — | | | — | |
Forfeited or expired | | | (250 | ) | $ | 30.50 | | | (15,026 | ) | $ | 30.50 | | | — | | | — | |
| | | | | | | | | | | | | | | | | |
| | | | | | | | | | | | | | | | | | | | |
Non-vested at end of year(1) | | | 21,624 | | $ | 30.50 | | | 109,275 | | $ | 30.50 | | | 198,838 | | $ | 12.45 | |
| | | | | | | | | | | | | | | | | |
| | | | | | | | | | | | | | | | | | | | |
| | | | | | | | | | | | | | | | | | | | |
| | | | | | | | | | | | | | | | | |
Weighted-average period remaining | | | — | | | | | | 1 year | | | | | | 2 years | | | | |
| | | | | | | | | | | | | | | | | |
| | | | | | | | | | | | | | | | | | | | |
| | | | | | | | | | | | | | | | | | | | |
| | | | | | | | | | | | | | | | | |
- (1)
- For the year ended December 31, 2013, the Company recognized $4.6 million in stock compensation expenses for a probable vesting of 129,611 RSU shares during the first quarter of 2014 based on the performance target achieved from the success of three exploration wells drilled in 2013. The vesting of 129,611 RSU shares in 2014 will exceed the total outstanding RSUs of 21,624 at December 31, 2013 as reported in the above table due to the aggregate payout of 162.5% of the target amount of 198,838 RSUs since inception. Payouts of 37.5%, 50% and 75% of the target amount were approved by the Company's board of directors for each of the three years in the period ended December 31, 2013, totaling 162.5% of the target amount. This is within the range of 0% to 200% vesting percentage of the target amount under the terms of the applicable RSU Award Agreements. Since the vesting of 129,611 RSUs is the final tranche of RSUs vesting under the applicable RSU Award Agreements, there was no unrecognized compensation associated with the RSUs as of December 31, 2013
F-30
Table of Contents
Cobalt International Energy, Inc.
(a Development Stage Enterprise)
Notes to Consolidated Financial Statements (Continued)
15. Equity based Compensation (Continued)
The table below summarizes the equity-based compensation costs recognized for each of the three years in the period ended December 31, 2013, and for the period November 10, 2005 (inception) through December 31, 2013:
| | | | | | | | | | | | | |
| |
| |
| |
| | For the Period
November 10, 2005
(Inception)
through
December 31, 2013 | |
|---|
| | For Year Ended December 31, | |
|---|
| | 2013 | | 2012 | | 2011 | |
|---|
| | ($ in thousands)
| |
|---|
Restricted stock: | | | | | | | | | | | | | |
Employees | | $ | 15,470 | | $ | 13,378 | | $ | 12,860 | | $ | 62,064 | |
Non-employee directors | | | 1,260 | | | 970 | | | 804 | | | 3,541 | |
Stock options: | | | | | | | | | | | | | |
Employees | | | 7,405 | | | 3,790 | | | 1,841 | | | 13,137 | |
Restricted stock units (performance-based) | | | 4,619 | | | 4,272 | | | — | | | 8,891 | |
Deferred stock compensation(1) | | | — | | | — | | | — | | | 1,828 | |
| | | | | | | | | | |
| | | | | | | | | | | | | | |
| | $ | 28,754 | | $ | 22,410 | | $ | 15,505 | | $ | 89,461 | |
| | | | | | | | | | |
| | | | | | | | | | | | | | |
| | | | | | | | | | | | | | |
| | | | | | | | | | |
- (1)
- In December 2008, the Company adopted a deferred compensation plan and provided certain executive officers the opportunity to defer under the Plan all or a portion of their salary and/or annual bonus for 2009. Amounts deferred under the Plan generally are deemed to be invested in a money market account prior to the IPO and shares of the Company's common stock following the IPO. Subject to accelerated payment under specified circumstances, the deferred amounts were distributed to these executives in January 2012 in the form of shares of the Company's common stock. All of the shares under the Plan were distributed to these executives during 2012.
16. Employee Benefit Plan
In 2006, the Company established the Cobalt International Energy, L.P., defined contribution 401(k) plan (the Plan). All employees of the Company after three months of continuous employment are eligible to participate in the Plan. The plan is discretionary and provides a 6% employee contribution match as determined by the Company's Board of Directors. Effective December 31, 2009, the Plan was amended to discontinue the employer's matching contributions. Effective January 1, 2012, the Company reinstituted the 6% employee contribution match. For each of the years ended December 31, 2013, 2012 and 2011, the Company recorded $0.8 million, $0.5 million and $0 million, respectively, in benefits contributions to the Plan, which are included in the general and administrative expenses. For the period November 10, 2005 (inception) through December 31, 2013, the Company recorded a cumulative of $2.8 million in benefits contributions to the Plan.
17. Income Taxes
For the years ended December 31, 2013, 2012 and 2011, the Company recorded a net deferred tax asset of $461.6 million, $269.6 million and $177.2 million, respectively with a corresponding full valuation allowance of $461.6 million, $269.6 million and $177.2 million, respectively, for the net tax
F-31
Table of Contents
Cobalt International Energy, Inc.
(a Development Stage Enterprise)
Notes to Consolidated Financial Statements (Continued)
17. Income Taxes (Continued)
effects of temporary differences between the carrying amounts of assets and liabilities for financial reporting purposes and the amounts used for income tax purposes.
The components of the income tax provision (benefit) are as follows:
| | | | | | | | | | |
| | Year Ended
December 31, | |
|---|
| | 2013 | | 2012 | | 2011 | |
|---|
| | ($ in thousands)
| |
|---|
Current taxes: | | | | | | | | | | |
U.S. federal | | $ | — | | $ | — | | $ | — | |
Foreign | | | — | | | — | | | — | |
Deferred taxes: | | | | | | | | | | |
U.S. federal | | | — | | | — | | | — | |
Foreign | | | — | | | — | | | — | |
| | | | | | | | |
| | | | | | | | | | | |
Total | | $ | — | | $ | — | | $ | — | |
| | | | | | | | |
| | | | | | | | | | | |
| | | | | | | | | | | |
| | | | | | | | |
The reconciliation of income taxes computed at the U.S. federal statutory tax rate to the Company's income tax expense (benefit) for each of the three years in the period ended December 31, 2013 are as follows:
| | | | | | | | | | |
| | Year Ended December 31, | |
|---|
| | 2013 | | 2012 | | 2011 | |
|---|
| | ($ in thousands)
| |
|---|
U.S.: | | | | | | | | | | |
Net income (loss) as reported | | $ | (387,210 | ) | $ | (229,372 | ) | $ | (76,231 | ) |
Less: net income (loss) applicable to period before corporate reorganization | | | — | | | — | | | — | |
Foreign: | | | | | | | | | | |
Net income (loss) as reported | | | (201,814 | ) | $ | (53,627 | ) | $ | (57,406 | ) |
Less: net income (loss) applicable to period before corporate reorganization | | | — | | | — | | | — | |
| | | | | | | | |
| | | | | | | | | | | |
Net income (loss) applicable to period after corporate reorganization | | $ | (589,024 | ) | $ | (282,999 | ) | $ | (133,637 | ) |
| | | | | | | | |
| | | | | | | | | | | |
| | | | | | | | | | | |
| | | | | | | | |
F-32
Table of Contents
Cobalt International Energy, Inc.
(a Development Stage Enterprise)
Notes to Consolidated Financial Statements (Continued)
17. Income Taxes (Continued)
| | | | | | | | | | | | | | | | | | | |
| | Year Ended December 31, | |
|---|
| | 2013 | | 2012 | | 2011 | |
|---|
| | ($ in thousands)
| |
|---|
Income tax expense (benefit) at the federal statutory rate | | $ | (206,159 | ) | | 35.0 | % | $ | (99,050 | ) | | 35.0 | % | $ | (46,773 | ) | | 35.0 | % |
State income taxes, net of federal income tax benefit | | | (489 | ) | | 0.1 | % | | (512 | ) | | 0.2 | % | | (2,579 | ) | | 1.9 | % |
Foreign income tax | | | (70,994 | ) | | 12.1 | % | | 4,447 | | | -1.6 | % | | (30,407 | ) | | 22.8 | % |
Other | | | 366 | | | -0.1 | % | | 2,678 | | | -0.9 | % | | 117 | | | 0.1 | % |
Valuation allowance(1) | | | 277,276 | | | -47.1 | % | | 92,437 | | | -32.7 | % | | 79,642 | | | 59.6 | % |
| | | | | | | | | | | | | | |
| | | | | | | | | | | | | | | | | | | | |
| | $ | — | | $ | — | | $ | — | | | — | | $ | — | | | — | |
| | | | | | | | | | | | | | |
| | | | | | | | | | | | | | | | | | | | |
| | | | | | | | | | | | | | | | | | | | |
| | | | | | | | | | | | | | |
- (1)
- The change in the deferred tax asset valuation allowance of $277.3 million for the year ended December 31, 2013, excludes a $85.3 million net decrease in valuation allowance due to previously unrecorded foreign deferred tax assets and a deferred tax liability related to the Company's convertible debt instrument that did not impact the rate reconciliation.
Deferred income taxes reflect the net tax effects of temporary differences between the carrying amounts of assets and liabilities for financial reporting purposes and the amounts used for income tax
F-33
Table of Contents
Cobalt International Energy, Inc.
(a Development Stage Enterprise)
Notes to Consolidated Financial Statements (Continued)
17. Income Taxes (Continued)
purposes. The significant components of the Company's deferred tax assets and liabilities were as follows:
| | | | | | | |
| | As of December 31, | |
|---|
| | 2013 | | 2012 | |
|---|
| | ($ in thousands)
| |
|---|
Short-term deferred tax liabilities: | | | | | | | |
2.625% convertible senior notes due 2019(1) | | $ | 17,061 | | $ | — | |
| | | | | | |
| | | | | | | | |
Total short-term deferred tax liabilities | | | 17,061 | | | — | |
| | | | | | |
| | | | | | | | |
Long-term deferred tax liabilities: | | | | | | | |
2.625% convertible senior notes due 2019 | | $ | 103,951 | | $ | — | |
Oil and gas properties | | | 22,135 | | | 23,867 | |
| | | | | | |
| | | | | | | | |
Total long-term deferred tax liabilities | | | 126,086 | | | 23,867 | |
| | | | | | |
| | | | | | | | |
Long-term deferred tax assets: | | | | | | | |
Seismic and exploration costs | | | 280,095 | | | 100,414 | |
Stock based compensation | | | 20,842 | | | 12,340 | |
Domestic NOL carry forwards | | | 273,163 | | | 158,310 | |
Foreign NOL carry forwards | | | 28,633 | | | 20,624 | |
Other | | | 1,976 | | | 1,818 | |
Valuation allowance | | | (461,562 | ) | | (269,639 | ) |
| | | | | | |
| | | | | | | | |
Total long-term deferred assets | | | 143,147 | | | 23,867 | |
| | | | | | |
| | | | | | | | |
Net long-term deferred assets | | | 17,061 | | | — | |
| | | | | | |
| | | | | | | | |
Net deferred tax assets | | $ | — | | $ | — | |
| | | | | | |
| | | | | | | | |
| | | | | | | | |
| | | | | | |
- (1)
- The recognition of the liability and equity components of the debt resulted in a taxable temporary basis difference and recorded as an adjustment to additional paid-in capital.
The Company has established a full valuation allowance against the deferred tax assets where the Company has determined that it is more likely than not that all of the deferred tax assets will not be realized. Because of the full valuation allowance, no income tax expense or benefit is reflected on the consolidated statement of operations for each of the three years in the period ended December 31, 2013, 2012 and 2011.
The NOL carryforward for federal and state income tax purposes of approximately $787.2 million and $51.9 million as of December 31, 2013 begins to expire in 2025 and 2024, respectively. The utilization of the NOL carryforwards is dependent upon generating sufficient future taxable income in the appropriate jurisdictions within the carryforward period.
As of December 31, 2013, the Company had NOL carryforward for foreign income tax purposes of approximately $54.4 million which begins to expire in 2014. The Company has determined that it is more likely than not, that the foreign NOLs will not be fully realized. Therefore, a full valuation allowance was established for these net deferred tax assets.
F-34
Table of Contents
Cobalt International Energy, Inc.
(a Development Stage Enterprise)
Notes to Consolidated Financial Statements (Continued)
17. Income Taxes (Continued)
There were no unrecognized tax benefits or accrued interest or penalties associated with unrecognized tax benefits as of December 31, 2013 and 2012.
18. Commitments
The following table summarizes by period the payments due for the Company's estimated commitments, excluding long-term debt, as of December 31, 2013:
| | | | | | | | | | | | | | | | | | | |
| | Payments Due By Year | |
|---|
| | 2014 | | 2015 | | 2016 | | 2017 | | 2018 | | Thereafter | |
|---|
| | ($ in thousands)
| |
|---|
Drilling Rig and Related Contracts | | $ | 349,000 | | $ | 521,000 | | $ | 295,000 | | $ | 207,000 | | $ | — | | $ | — | |
Operating Leases | | | 13,000 | | | 11,000 | | | 8,000 | | | 5,000 | | | 4,000 | | | 8,000 | |
Lease Rentals(1) | | | 6,000 | | | 6,000 | | | 4,000 | | | 3,000 | | | 1,000 | | | 1,000 | |
Social Payment Obligations(2) | | | 49,019 | | | 50,619 | | | 62,854 | | | 5,714 | | | 5,714 | | | — | |
| | | | | | | | | | | | | | |
| | | | | | | | | | | | | | | | | | | | |
Total | | $ | 417,019 | | $ | 588,619 | | $ | 369,854 | | $ | 220,714 | | $ | 10,714 | | $ | 9,000 | |
| | | | | | | | | | | | | | |
| | | | | | | | | | | | | | | | | | | | |
| | | | | | | | | | | | | | | | | | | | |
| | | | | | | | | | | | | | |
- (1)
- Relates to the annual delay rental payments payable to the Office of Natural Resources Revenue within the U.S. Department of the Interior with respect to the Company's U.S. Gulf of Mexico leases. These annual payments are required to maintain the leases from year to year.
- (2)
- Includes the Company's contractual payment obligations for social projects such as the Sonangol Research and Technology Center and academic scholarships for Angolan students that the Company was and is contractually obligated to pay in consideration for the Angolan government granting it the licenses to explore for and develop hydrocarbons offshore Angola. Pursuant to the terms of the Risk Services Agreements for Blocks 9 and 21 and the Production Sharing Agreement for Block 20, the Company is not required to pay annual rental payments to maintain the licenses from year to year.
�� The Company recorded $6.7 million, $12.1 million and $7.7 million of office and delay rental expense for the years ended December 31, 2013, 2012 and 2011, respectively, and a cumulative of $49.1 million for the period November 10, 2005 (Inception) through December 31, 2013.
F-35
Table of Contents
Cobalt International Energy, Inc.
(a Development Stage Enterprise)
Notes to Consolidated Financial Statements (Continued)
19. Segment Information
The Company currently has two geographic operating segments for its operations. The operating segments are focused in the deepwater U.S. Gulf of Mexico and offshore West Africa. The following tables provide the geographic operating segment information for each of the three years in the period ended December 31, 2013:
| | | | | | | | | | |
| | United States | | West Africa | | Total | |
|---|
| | ($ in thousands)
| |
|---|
Year ended December 31, 2013 | | | | | | | | | | |
Operating costs and expense | | $ | 329,832 | | $ | 202,852 | | $ | 532,684 | |
| | | | | | | | |
| | | | | | | | | | | |
Operating income (loss) | | | (329,832 | ) | | (202,852 | ) | | (532,684 | ) |
| | | | | | | | |
| | | | | | | | | | | |
Other income (expense) | | | | | | | | | (56,340 | ) |
Net income (loss) | | | | | | | | $ | (589,024 | ) |
| | | | | | | | | | |
| | | | | | | | | | | |
| | | | | | | | | | | |
| | | | | | | | | | |
Additions to Property and Equipment, net(1) | | $ | 44,124 | | $ | 332,395 | | $ | 376,519 | |
| | | | | | | | |
| | | | | | | | | | | |
| | | | | | | | | | | |
| | | | | | | | |
Year ended December 31, 2012 | | | | | | | | | | |
Operating costs and expense | | $ | 231,196 | | $ | 53,632 | | $ | 284,828 | |
| | | | | | | | |
| | | | | | | | | | | |
Operating income (loss) | | | (231,196 | ) | | (53,632 | ) | | (284,828 | ) |
| | | | | | | | |
| | | | | | | | | | | |
Other income (expense) | | | | | | | | | 1,829 | |
Net income (loss) | | | | | | | | $ | (282,999 | ) |
| | | | | | | | | | |
| | | | | | | | | | | |
| | | | | | | | | | | |
| | | | | | | | | | |
Additions to Property and Equipment, net(1) | | $ | 67,068 | | $ | 169,362 | | $ | 236,430 | |
| | | | | | | | |
| | | | | | | | | | | |
| | | | | | | | | | | |
| | | | | | | | |
Year ended December 31, 2011 | | | | | | | | | | |
Operating costs and expense | | $ | 80,425 | | $ | 57,411 | | $ | 137,836 | |
| | | | | | | | |
| | | | | | | | | | | |
Operating income (loss) | | | (80,425 | ) | | (57,411 | ) | | (137,836 | ) |
| | | | | | | | |
| | | | | | | | | | | |
Other income (expense) | | | | | | | | | 4,199 | |
Net income (loss) | | | | | | | | $ | (133,637 | ) |
| | | | | | | | | | |
| | | | | | | | | | | |
| | | | | | | | | | | |
| | | | | | | | | | |
Additions to Property and Equipment, net(1) | | $ | (12,324 | ) | $ | 411,882 | | $ | 399,558 | |
| | | | | | | | |
| | | | | | | | | | | |
| | | | | | | | | | | |
| | | | | | | | |
- (1)
- These amounts are net of accumulated allowance for impairment on oil and gas properties and accumulated depreciation and amortization on other property and equipment.
20. Contingencies
The Company is not currently party to any legal proceedings. However, from time to time the Company may be subject to various lawsuits, claims and proceedings that arise in the normal course of business, including employment, commercial, environmental, safety and health matters. It is not presently possible to determine whether any such matters will have a material adverse effect on the Company's consolidated financial position, results of operations, or liquidity.
F-36
Table of Contents
Cobalt International Energy, Inc.
(a Development Stage Enterprise)
Notes to Consolidated Financial Statements (Continued)
21. Related Party Transactions
On February 20, 2013, the Company entered into software licensing and consulting service agreements with Quorum Business Solutions, Inc. ("Quorum") and Quorum Business Solutions (U.S.A.), Inc, related to certain enterprise resource planning software. Under these agreements, Quorum will license, host, and support this software for us for an initial term of three years. The approximate value of these agreements is $1.5 million. Quorum is owned in part by Riverstone Holdings, LLC, one of our former financial sponsors. For the year ended December 31, 2013, the Company incurred a total of $1.3 million in costs relating to Quorum. The Company did not have any material related party transactions for the years ended December 31, 2012 and 2011.
22. Selected Quarterly Financial Data—Unaudited
Unaudited quarterly financial data for the years ended December 31, 2013 and 2012 are as follows:
| | | | | | | | | | | | | |
| | 1st Quarter | | 2nd Quarter | | 3rd Quarter | | 4th Quarter | |
|---|
| | ($ in thousands)
| |
|---|
Year ended December 31, 2013 | | | | | | | | | | | | | |
Operating costs and expenses | | $ | 112,452 | | $ | 65,365 | | $ | 145,663 | | $ | 209,204 | |
Operating income (loss) | | | (112,452 | ) | | (65,365 | ) | | (145,663 | ) | | (209,204 | ) |
Net income (loss) | | | (128,087 | ) | | (78,818 | ) | | (160,000 | ) | | (222,119 | ) |
Basic and diluted income (loss) per common share(1) | | $ | (0.31 | ) | $ | (0.19 | ) | $ | (0.39 | ) | $ | (0.55 | ) |
Year ended December 31, 2012 | | | | | | | | | | | | | |
Operating costs and expenses | | $ | 37,715 | | $ | 142,155 | | $ | 40,553 | | $ | 64,405 | |
Operating income (loss) | | | (37,715 | ) | | (142,155 | ) | | (40,553 | ) | | (64,405 | ) |
Net income (loss) | | | (36,531 | ) | | (140,723 | ) | | (39,214 | ) | | (66,531 | ) |
Basic and diluted income (loss) per common share(1) | | $ | (0.09 | ) | $ | (0.35 | ) | $ | (0.10 | ) | $ | (0.16 | ) |
- (1)
- Totals may not add due to rounding.
23. Supplemental Information on Oil and Gas Exploration and Production Activities (Unaudited)
The unaudited supplemental information on oil and gas exploration activities that follows is presented in accordance with supplemental disclosure requirements under ASC No. 932,"Extractive Activities—Oil and Gas" ("ASC No. 932") and the Securities and Exchange Commission's final rule,Modernization of Oil and Gas Reporting. Disclosures include (1) capitalized costs, costs incurred and results of operations related to oil and gas producing activities, (2) net proved oil and gas reserves, and (3) a standardized measure of discounted future net cash flows relating to proved oil and gas reserves. Since the Company did not have any production activities for each of the three years in the period ended December 31, 2013, 2012 and 2011, there will be no disclosures on results of operations related to oil and gas producing activities.
F-37
Table of Contents
Cobalt International Energy, Inc.
(a Development Stage Enterprise)
Notes to Consolidated Financial Statements (Continued)
23. Supplemental Information on Oil and Gas Exploration and Production Activities (Unaudited) (Continued)
Capitalized Costs Related to Oil and Gas Activities
| | | | | | | | | | |
| | U.S. Gulf
of Mexico | | West Africa | | Total | |
|---|
| | ($ in thousands)
| |
|---|
As of December 31, 2013 | | | | | | | | | | |
Unproved properties(1) | | $ | 605,658 | | $ | 927,059 | | $ | 1,532,717 | |
Accumulated valuation allowance | | | (160,913 | ) | | — | | | (160,913 | ) |
| | | | | | | | |
| | | | | | | | | | | |
| | | 444,745 | | | 927,059 | | | 1,371,804 | |
Proved properties | | | 92,579 | | | — | | | 92,579 | |
| | | | | | | | |
| | | | | | | | | | | |
Net capitalized costs | | $ | 537,324 | | $ | 927,059 | | $ | 1,464,383 | |
| | | | | | | | |
| | | | | | | | | | | |
| | | | | | | | | | | |
| | | | | | | | |
As of December 31, 2012 | | | | | | | | | | |
Unproved properties | | $ | 572,257 | | $ | 600,620 | | $ | 1,172,877 | |
Accumulated valuation allowance | | | (78,413 | ) | | — | | | (78,413 | ) |
| | | | | | | | |
| | | | | | | | | | | |
| | | 493,844 | | | 600,620 | | | 1,094,464 | |
Proved properties | | | — | | | — | | | — | |
| | | | | | | | |
| | | | | | | | | | | |
Net capitalized costs | | $ | 493,844 | | $ | 600,620 | | $ | 1,094,464 | |
| | | | | | | | |
| | | | | | | | | | | |
| | | | | | | | | | | |
| | | | | | | | |
- (1)
- Unproved properties include capitalized costs net of sale/like-kind exchange of leasehold interest transactions that occurred in 2013 and 2012 of approximately $10.7 million and $0.8 million, respectively, for the U.S. Gulf of Mexico. No gain or loss was recognized for these transactions for the years ended December 31, 2013 and 2012.
F-38
Table of Contents
Cobalt International Energy, Inc.
(a Development Stage Enterprise)
Notes to Consolidated Financial Statements (Continued)
23. Supplemental Information on Oil and Gas Exploration and Production Activities (Unaudited) (Continued)
Costs Incurred in Oil and Gas Activities
The following table reflects total costs incurred, both capitalized and expensed, for oil and gas property acquisition, exploration and development activities.
| | | | | | | | | | |
| | U.S. Gulf
of Mexico | | West Africa | | Total | |
|---|
| | ($ in thousands)
| |
|---|
Year ended December 31, 2013 | | | | | | | | | | |
Property acquisition | | | | | | | | | | |
Unproved | | $ | 37,584 | | $ | — | | $ | 37,584 | |
Proved | | | — | | | — | | | — | |
Exploration | | | | | | | | | | |
Capitalized | | | 158,806 | | | 469,879 | | | 628,685 | |
Expensed | | | 48,688 | | | 25,525 | | | 74,213 | |
Development | | | 54,133 | | | — | | | 54,133 | |
| | | | | | | | |
| | | | | | | | | | | |
Total Costs Incurred | | $ | 299,211 | | $ | 495,404 | | $ | 794,615 | |
| | | | | | | | |
| | | | | | | | | | | |
| | | | | | | | | | | |
| | | | | | | | |
Year ended December 31, 2012 | | | | | | | | | | |
Property acquisition | | | | | | | | | | |
Unproved | | $ | 19,961 | | $ | — | | $ | 19,961 | |
Proved | | | — | | | — | | | — | |
Exploration | | | | | | | | | | |
Capitalized | | | 178,295 | | | 168,309 | | | 346,604 | |
Expensed | | | 32,874 | | | 28,709 | | | 61,583 | |
Development | | | — | | | — | | | — | |
| | | | | | | | |
| | | | | | | | | | | |
Total Costs Incurred | | $ | 231,130 | | $ | 197,018 | | $ | 428,148 | |
| | | | | | | | |
| | | | | | | | | | | |
| | | | | | | | | | | |
| | | | | | | | |
Year ended December 31, 2011 | | | | | | | | | | |
Property acquisition | | | | | | | | | | |
Unproved | | $ | — | | $ | 337,126 | | $ | 337,126 | |
Proved | | | — | | | — | | | — | |
Exploration | | | | | | | | | | |
Capitalized | | | 11,214 | | | 96,849 | | | 108,063 | |
Expensed | | | 10,707 | | | 21,532 | | | 32,239 | |
Development | | | — | | | — | | | — | |
| | | | | | | | |
| | | | | | | | | | | |
Total Costs Incurred | | $ | 21,921 | | $ | 455,507 | | $ | 477,428 | |
| | | | | | | | |
| | | | | | | | | | | |
| | | | | | | | | | | |
| | | | | | | | |
F-39
Table of Contents
Cobalt International Energy, Inc.
(a Development Stage Enterprise)
Notes to Consolidated Financial Statements (Continued)
23. Supplemental Information on Oil and Gas Exploration and Production Activities (Unaudited) (Continued)
All of the Company's proved reserves are located in the U.S. Gulf of Mexico. Reserve quantity information for the year ended December 31, 2013 is as follows:
| | | | | | | | | | |
| | Natural Gas
(in Bcf) | | Oil and
Condensate
(in MMBbls) | | Equivalent
Volumes
(in MMBOE) | |
|---|
Proved undeveloped reserves: | | | | | | | | | | |
Beginning of year | | | — | | | | | | | |
Discoveries | | | 3.4 | | | 7.9 | | | 8.5 | |
End of year | | | 3.4 | | | 7.9 | | | 8.5 | |
The reserves as of December 31, 2013 presented above were prepared by the independent engineering firm, Netherland, Sewell & Associates, Inc. ("NSAI"). These reserves are located in the U.S. Gulf of Mexico. Proved oil and natural gas reserves are the estimated quantities of oil and natural gas which geological and engineering data demonstrate, with reasonable certainty, to be recoverable in future years from known reservoirs under economic and operating conditions (i.e., prices and costs) existing at the time the estimate is made. Proved developed oil and natural gas reserves are proved reserves that can be expected to be recovered through existing wells and equipment in place and under operating methods being utilized at the time the estimates were made. A variety of methodologies are used to determine the Company's proved reserve estimates. The principal methodologies employed are decline curve analysis, advance production type curve matching, petro-physics/log analysis and analogy. Some combination of these methods is used to determine reserve estimates in substantially all of the Company's fields. The Company emphasizes that reserve estimates are inherently imprecise and that estimates of new discoveries and undeveloped locations are more imprecise than estimates of established proved producing oil and gas properties. Accordingly, these estimates are expected to change as future information becomes available.
Standardized Measure of Discounted Future Net Cash Flows Relating to Proved Oil and Gas Reserves
The Company follows the guidelines prescribed in ASC No. 932 for computing a standardized measure of future net cash flows and changes therein relating to estimated proved reserves. The following summarizes the policies used in the preparation of the accompanying oil and natural gas reserve disclosures, standardized measures of discounted future net cash flows from proved oil and natural gas reserves and the reconciliations of standardized measures from year to year.
The information is based on estimates of proved reserves attributable to the Company's interest in oil and natural gas properties as of December 31, 2013. The Company did not have proved reserves as of December 31, 2012. These estimates were prepared by NSAI.
The standardized measure of discounted future net cash flows from production of proved reserves was developed as follows:
- (1)
- Estimates are made of quantities of proved reserves and future periods during which they are expected to be produced based on year-end economic conditions.
F-40
Table of Contents
Cobalt International Energy, Inc.
(a Development Stage Enterprise)
Notes to Consolidated Financial Statements (Continued)
23. Supplemental Information on Oil and Gas Exploration and Production Activities (Unaudited) (Continued)
- (2)
- The estimated future cash flows are compiled by applying the twelve month average of the first of the month prices of crude oil and natural gas relating to the Company's proved reserves to the year-end quantities of those reserves for reserves.
- (3)
- The future cash flows are reduced by estimated production costs, costs to develop and produce the proved reserves and abandonment costs, all based on year-end economic conditions, plus Company overhead incurred.
- (4)
- Future income tax expenses are based on year-end statutory tax rates giving effect to the remaining tax basis in the oil and natural gas properties, other deductions, credits and allowances relating to the Company's proved oil and natural gas reserves.
- (5)
- Future net cash flows are discounted to present value by applying a discount rate of 10%.
The assumptions used to compute the standardized measure are those prescribed by the U.S. Generally Accepted Accounting Principles. These assumptions do not necessarily reflect the Company's expectations of actual revenues to be derived from those reserves, nor their present value. The limitations inherent in the reserve quantity estimation process, as discussed previously, are equally applicable to the standardized measure computations, since these reserve quantity estimates are the basis for the valuation process. The Company emphasizes that reserve estimates are inherently imprecise and that estimates of new discoveries and undeveloped locations are more imprecise than estimates of established proved producing oil and gas properties. The standardized measure of discounted future net cash flows does not purport, nor should it be interpreted, to present the fair value of the Company's oil and natural gas reserves. An estimate of fair value would also take into account, among other things, the recovery of reserves not presently classified as proved, anticipated future changes in prices and costs and a discount factor more representative of the time value of money and the risks inherent in reserve estimates.
Prices used in the report prepared by NSAI are based on the 12-month unweighted arithmetic average of the first-day-of-the-month price for each month in the period January through December 2013. For oil volumes, the average Light Louisiana Sweet spot price of $107.13 per barrel is adjusted for quality, transportation fees, and a regional price differential. For gas volumes, the average Henry Hub spot price of $3.670 per MMbtu is adjusted for energy content, transportation fees, and a regional price differential. All prices are held constant throughout the lives of the properties. For the proved reserves, the average adjusted product prices weighted by production over the remaining lives of the properties are $103.90 per barrel of oil and $3.507 per Mcf of gas.
F-41
Table of Contents
Cobalt International Energy, Inc.
(a Development Stage Enterprise)
Notes to Consolidated Financial Statements (Continued)
23. Supplemental Information on Oil and Gas Exploration and Production Activities (Unaudited) (Continued)
Information with respect to the Company's estimated discounted future net cash flows related to its proved natural gas reserves as of December 31, 2013 is as follows ($ in thousands):
| | | | |
| | 2013 | |
|---|
Future cash inflows | | $ | 830,287 | |
Future production costs | | | (6,400 | ) |
Future development costs | | | (302,278 | ) |
Future income tax expense(1) | | | — | |
| | | | |
| | | | | |
Future net cash flows | | | 521,609 | |
10% annual discount for estimated timing of cash flows | | | (244,976 | ) |
| | | | |
| | | | | |
Standardized measure of discounted future net cash flows | | $ | 276,633 | |
| | | | |
| | | | | |
| | | | | |
| | | | |
- (1)
- There is no future income tax expense as of December 31, 2013, as the tax basis of the oil and gas properties in the United States and net operating losses attributable to oil and gas operations exceed the future net revenues.
Information with respect to the Company's standardized measure of discounted future net cash flows as of December 31, 2013 is as follows ($ in thousands):
| | | | |
| | 2013 | |
|---|
Standardized measure, beginning | | $ | — | |
Discoveries | | | 276,633 | |
| | | | |
| | | | | |
Standardized measure, ending | | $ | 276,633 | |
| | | | |
| | | | | |
| | | | | |
| | | | |
F-42
Table of Contents
Exhibit Index
| | | |
Exhibit
Number | | Description of Document |
|---|
| | | | Certificate of Incorporation, Bylaws and Specimen Stock Certificate |
| | | | |
| | 3.1 | | Certificate of Incorporation of the Company (incorporated by reference to Exhibit 3.1 to the Company's Annual Report on Form 10-K filed March 30, 2010 (File No. 001-34579)) |
| | | | |
| | 3.2 | | By-laws of the Company (incorporated by reference to Exhibit 3 to the Company's Registration Statement on Form 8-A filed December 11, 2009 (File No. 001-34579)) |
| | | | |
| | 4.1 | | Specimen stock certificate (incorporated by reference to Exhibit 4.1 to the Company's Registration Statement on Form S-1/A filed November 27, 2009 (File No. 333-161734)) |
| | | | |
| | | | Instruments relating to Debt Securities |
| | | | |
| | 4.2 | | Senior Debt Indenture, dated as of December 17, 2012 (incorporated by reference to Exhibit 4.1 to the Company's Current Report on Form 8-K filed December 17, 2012 (File No. 001-34579)) |
| | | | |
| | 4.3 | | First Supplemental Indenture, dated as of December 17, 2012 (incorporated by reference to Exhibit 4.2 to the Company's Current Report on Form 8-K filed December 17, 2012 (File No. 001-34579)) |
| | | | |
| | 4.4 | | Form of 2.625% Convertible Senior Note due 2019 (incorporated by reference to Exhibit 4.3 to the Company's Current Report on Form 8-K filed December 17, 2012 (File No. 001-34579)) |
| | | | |
| | | | Operating Agreements |
| | | | |
| | 10.1 | | Risk Services Agreement relating to Block 9, between CIE Angola Block 9 Ltd., Sonangol, Sonangol Pesquisa e Produção, S.A., Nazaki Oil and Gás and Alper Oil, Lda (incorporated by reference to Exhibit 10.7 to the Company's Annual Report on Form 10-K filed March 30, 2010 (File No. 001-34579)) |
| | | | |
| | 10.2 | | Risk Services Agreement relating to Block 21, between CIE Angola Block 21 Ltd., Sonangol, Sonangol Pesquisa e Produção, S.A., Nazaki Oil and Gás and Alper Oil, Lda (incorporated by reference to Exhibit 10.8 to the Company's Annual Report on Form 10-K filed March 30, 2010 (File No. 001-34579)) |
| | | | |
| | 10.3 | | Production Sharing Contract, dated December 20, 2011, between CIE Angola Block 20 Ltd., Sociedade Nacional de Combustíveis de Angola—Empresa Pública, Sonangol Pesquisa e Produção, S.A., BP Exploration Angola (Kwanza Benguela) Limited, and China Sonangol International Holding Limited (incorporated by reference to Exhibit 10.20 to the Company's Annual Report on Form 10-K filed February 21, 2012 (File No. 001-34579)) |
| | | | |
| | 10.4 | | Exploration and Production Sharing Contract, dated December 13, 2006, between the Republic of Gabon and Total Gabon, S.A. (incorporated by reference to Exhibit 10.5 to the Company's Registration Statement on Form S-1/A filed October 29, 2009 (File No. 333-161734)) |
| | | | |
| | 10.5 | | Assignment Agreement, dated November 29, 2007, between CIE Gabon Diaba Ltd. and Total Gabon, S.A. (incorporated by reference to Exhibit 10.6 to the Company's Registration Statement on Form S-1/A filed October 29, 2009 (File No. 333-161734)) |
| | | | |
| | 10.6 | | Simultaneous Exchange Agreement, dated April 6, 2009, between the Partnership and TOTAL E&P USA, INC. (incorporated by reference to Exhibit 10.7 to the Company's Registration Statement on Form S-1/A filed October 9, 2009 (File No. 333-161734)) |
| |
| | |
Table of Contents
| | | |
Exhibit
Number | | Description of Document |
|---|
| | 10.7 | | Gulf of Mexico Program Management and AMI Agreement, dated April 6, 2009, between the Partnership and TOTAL E&P USA, INC. (incorporated by reference to Exhibit 10.8 to the Company's Registration Statement on Form S-1/A filed October 9, 2009 (File No. 333-161734)) |
| | | | |
| | 10.8 | | Offshore Daywork Drilling Contract, dated May 3, 2008, between the Partnership and Ensco Offshore Company (incorporated by reference to Exhibit 10.9 to the Company's Registration Statement on Form S-1/A filed October 29, 2009 (File No. 333-161734)) |
| | | | |
| | 10.10 | | International Daywork Drilling Contract—Offshore, dated November 8, 2010 between CIE Angola Block 21 Ltd. and Z North Sea Ltd. (incorporated by reference to Exhibit 10.1 to the Company's Quarterly Report on Form 10-Q filed November 12, 2010 (File No. 001-34579)). |
| | | | |
| | 10.11 | | Offshore Drilling Contract between CIE Angola Block 21 Ltd. and Universal Energy Resources, Inc., dated July 30, 2012 (incorporated by reference to Exhibit 10.1 to the Company's Quarterly Report on Form 10-Q filed October 30, 2012 (File No. 001-34579)) |
| | | | |
| | 10.12 | | Offshore Drilling Contract between Cobalt International Energy, L.P. and Rowan Reliance Limited, dated August 5, 2013 (incorporated by reference to Exhibit 10.1 to the Company's Quarterly Report on Form 10-Q filed October 29, 2013 (File No. 001-34579)) |
| | | | |
| | | | Financing Agreements |
| | | | |
| | 10.13 | | Underwriting Agreement dated as of December 11, 2012 (incorporated by reference to Exhibit 1.1 to the Company's Current Report on Form 8-K filed December 17, 2012 (File No. 001-34579)) |
| | | | |
| | 10.14 | | Underwriting Agreement dated as of January 15, 2013 (incorporated by reference to Exhibit 1.1 to the Company's Current Report on Form 8-K filed January 18, 2013 (File No. 001-34579)) |
| | | | |
| | 10.15 | | Underwriting Agreement dated as of May 7, 2013 (incorporated by reference to Exhibit 1.1 to the Company's Current Report on Form 8-K filed May 10, 2013 (File No. 001-34579)) |
| | | | |
| | | | Agreements with Stockholders and Directors |
| | | | |
| | 10.16 | | Amended and Restated Stockholders Agreement, dated February 21, 2013, among the Company and the stockholders that are signatory thereto (incorporated by reference to Exhibit 10.36 to the Company's Annual Report on Form 10-K filed February 26, 2013 (File No. 001-34579)) |
| | | | |
| | 10.17 | | Registration Rights Agreement, dated December 15, 2009, among the Company and the parties that are signatory thereto (incorporated by reference to Exhibit 10.31 to the Company's Annual Report on Form 10-K filed February 21, 2012 (File No. 001-34579)) |
| | | | |
| | 10.18 | | Form of Director Indemnification Agreements (incorporated by reference to Exhibit 10.19 to the Company's Registration Statement on Form S-1/A filed November 27, 2009 (File No. 333-161734)) |
| |
| | |
Table of Contents
| | | |
Exhibit
Number | | Description of Document |
|---|
| | | | Management Contracts/Compensatory Plans or Arrangements |
| | | | |
| | 10.19 | † | Amended and Restated Long Term Incentive Plan of the Company (incorporated by reference to Exhibit 10.15 to the Company's Annual Report on Form 10-K filed February 26, 2013 (File No. 001-34579)) |
| | | | |
| | 10.20 | † | Form of Restricted Stock Award Agreements relating to the Class B interests (incorporated by reference to Exhibit 10.10 to the Company's Registration Statement on Form S-1/A filed October 29, 2009 (File No. 333-161734)) |
| | | | |
| | 10.21 | † | Form of Restricted Stock Award Agreements relating to the Class C interests (incorporated by reference to Exhibit 10.11 to the Company's Registration Statement on Form S-1/A filed October 29, 2009 (File No. 333-161734)) |
| | | | |
| | 10.22 | † | Form of Restricted Stock Award Agreements relating to the Class D interests (incorporated by reference to Exhibit 10.12 to the Company's Registration Statement on Form S-1/A filed October 29, 2009 (File No. 333-161734)) |
| | | | |
| | 10.23 | † | Form of Non-Qualified Stock Option Award Agreement (incorporated by reference to Exhibit 10.26 to the Company's Annual Report on Form 10-K filed March 1, 2011 (File No. 001-34579)). |
| | | | |
| | 10.24 | † | Form of Restricted Stock Unit Award Agreement (incorporated by reference to Exhibit 10.27 to the Company's Annual Report on Form 10-K filed March 1, 2011 (File No. 001-34579)). |
| | | | |
| | 10.25 | † | Deferred Compensation Plan of the Company (incorporated by reference to Exhibit 10.35 to the Company's Annual Report on Form 10-K filed February 26, 2013 (File No. 001-34579)) |
| | | | |
| | 10.26 | † | Annual Incentive Plan of the Company (incorporated by reference to Exhibit 10.19 to the Company's Annual Report on Form 10-K filed March 30, 2010 (File No. 001-34579)) |
| | | | |
| | 10.27 | † | Employment Agreement, dated November 12, 2009, among the Company, the Partnership and Joseph H. Bryant (incorporated by reference to Exhibit 10.1 to the Company's Registration Statement on Form S-1/A filed November 27, 2009 (File No. 333-161734)) |
| | | | |
| | 10.28 | † | Employment Agreement, dated October 23, 2009, among the Company, the Partnership and James H. Painter (incorporated by reference to Exhibit 10.4 to the Company's Registration Statement on Form S-1/A filed November 27, 2009 (File No. 333-161734)) |
| | | | |
| | 10.29 | † | Employment Agreement, dated October 23, 2009, among the Company, the Partnership and James W. Farnsworth (incorporated by reference to Exhibit 10.5 to the Company's Registration Statement on Form S-1/A filed November 27, 2009 (File No. 333-161734)) |
| | | | |
| | 10.30 | † | Severance Agreement, dated October 23, 2009, among the Company, the Partnership and John P. Wilkirson (incorporated by reference to Exhibit 10.6 to the Company's Registration Statement on Form S-1/A filed November 27, 2009 (File No. 333-161734)) |
| | | | |
| | 10.31 | † | Employment Agreement, dated September 6, 2011, between the Company and Van P. Whitfield (incorporated by reference to Exhibit 10.1 to the Company's Current Report on Form 8-K filed September 8, 2011 (File No. 001-34579)) |
| | | | |
| | 10.32 | † | Severance Agreement, dated April 1, 2010, between the Company and Michael D. Drennon (incorporated by reference to Exhibit 10.30 to the Company's Annual Report on Form 10-K filed February 21, 2012 (File No. 001-34579)) |
Table of Contents
| | | |
Exhibit
Number | | Description of Document |
|---|
| | | | |
| | 10.33 | † | Form of Amendment to Employment Agreements with Joseph H. Bryant, James H. Painter and James W. Farnsworth and Severance Agreements with Samuel H. Gillespie and John P. Wilkirson (incorporated by reference to Exhibit 10.3 to the Company's Quarterly Report on Form 10-Q filed November 12, 2010 (File No. 001-34579)). |
| | | | |
| | 10.34 | † | Non-Employee Directors Compensation Plan (incorporated by reference to Exhibit 99.2 to the Company's Current Report on Form 8-K filed January 29, 2010 (File No. 001-34579)) |
| | | | |
| | 10.35 | † | Non-Employee Directors Deferral Plan (incorporated by reference to Exhibit 99.3 to the Company's Current Report on Form 8-K filed January 29, 2010 (File No. 001-34579)) |
| | | | |
| | 10.36 | † | Form of Restricted Stock Unit Award Notification under the Non-Employee Directors Compensation Plan (incorporated by reference to Exhibit 99.4 to the Company's Current Report on Form 8-K filed January 29, 2010 (Filed No. 001-34579)) |
| | | | |
| | | | Other Exhibits |
| | | | |
| | 12.1 | * | Statement re: Computation of Ratio of Earnings to Fixed Charges |
| | | | |
| | 21.1 | * | List of Subsidiaries |
| | | | |
| | 23.1 | * | Consent of Ernst & Young LLP |
| | | | |
| | 23.2 | * | Consent of Netherland, Sewell & Associates, Inc. |
| | | | |
| | 31.1 | * | Certification of the Chief Executive Officer pursuant to Rule 13a-14(a)/15d-14(a) of the Securities Exchange Act of 1934 |
| | | | |
| | 31.2 | * | Certification of the Chief Financial Officer pursuant to Rule 13a-14(a)/15d-14(a) of the Securities Exchange Act of 1934 |
| | | | |
| | 32.1 | * | Certification of the Chief Executive Officer pursuant to 18 U.S.C. Section 1350, as adopted pursuant to Section 906 of the Sarbanes-Oxley Act of 2002 |
| | | | |
| | 32.2 | * | Certification of the Chief Financial Officer pursuant to 18 U.S.C. Section 1350, as adopted pursuant to Section 906 of the Sarbanes-Oxley Act of 2002 |
| | | | |
| | 99.1 | * | Report of Netherland, Sewell & Associates, Inc. |
| | | | |
| | 101.INS | * | XBRL Instance Document |
| | | | |
| | 101.SCH | * | XBRL Schema Document |
| | | | |
| | 101.CAL | * | XBRL Calculation Linkbase Document |
| | | | |
| | 101.DEF | * | XBRL Definition Linkbase Document |
| | | | |
| | 101.LAB | * | XBRL Labels Linkbase Document |
| | | | |
| | 101.PRE | * | XBRL Presentation Linkbase Document |
- *
- Filed herewith.
- †
- Management contract or compensatory plan or arrangement required to be filed as an exhibit to this Form 10-K pursuant to Item 15(b).