Issuer Free Writing Prospectus
Dated November 30, 2009
Filed Pursuant to Rule 433
Registration Statement No. 333-161805

| Second Step Conversion and Offering December 2009 Investment Opportunity in a Premier Banking Franchise N O R T H W E S T |
| This presentation is for informational purposes only and does not constitute an offer to sell nor a solicitation of an offer to buy shares of common stock of Northwest Bancshares, Inc. The offer is made only by the prospectus, as supplemented. Please refer to the prospectus dated November 9, 2009. The shares of common stock of Northwest Bancshares, Inc. are not deposits or savings accounts and are not insured or guaranteed by the Federal Deposit Insurance Corporation or any other government agency. 2 |
| Forward-Looking Statements 3 This presentation contains forward-looking statements, which can be identified by the use of words such as "estimate," "project," "believe," "intend," "anticipate," "plan," "seek," "expect" and words of similar meaning. These forward-looking statements include, but are not limited to: statements of our goals, intentions and expectations; statements regarding our business plans, prospects, growth and operating strategies; statements regarding the asset quality of our loan and investment portfolios; and estimates of our risks and future costs and benefits. These forward-looking statements are based on current beliefs and expectations of our management and are inherently subject to significant business, economic and competitive uncertainties and contingencies, many of which are beyond our control. In addition, these forward-looking statements are subject to assumptions with respect to future business strategies and decisions that are subject to change. The following factors, among others, could cause actual results to differ materially from the anticipated results or other expectations expressed in the forward-looking statements: changes in laws or government regulations or policies affecting financial institutions, including changes in regulatory fees and capital requirements; general economic conditions, either nationally or in our market areas, that are worse than expected; competition among depository and other financial institutions; inflation and changes in the interest rate environment that reduce our margins or reduce the fair value of financial instruments; adverse changes in the securities markets; our ability to enter new markets successfully and capitalize on growth opportunities; our ability to successfully integrate acquired entities, if any; changes in consumer spending, borrowing and savings habits; changes in our organization, compensation and benefit plans; our ability to continue to increase and manage our commercial and residential real estate, multi-family, and commercial and industrial loans; possible impairments of securities held by us, including those issued by government entities and government sponsored enterprises; the level of future deposit premium assessments; the impact of the current recession on our loan portfolio (including cash flow and collateral values), investment portfolio, customers and capital market activities; the impact of the current governmental effort to restructure the U.S. financial and regulatory system; changes in the financial performance and/or condition of our borrowers; and the effect of changes in accounting policies and practices, as may be adopted by the regulatory agencies, as well as the Securities and Exchange Commission, the Public Company Accounting Oversight Board, the Financial Accounting Standards Board and other accounting standard setters. Because of these and other uncertainties, our actual future results may be materially different from the results indicated by these forward- looking statements. Please see "Risk Factors" beginning on page 26 of the prospectus. |
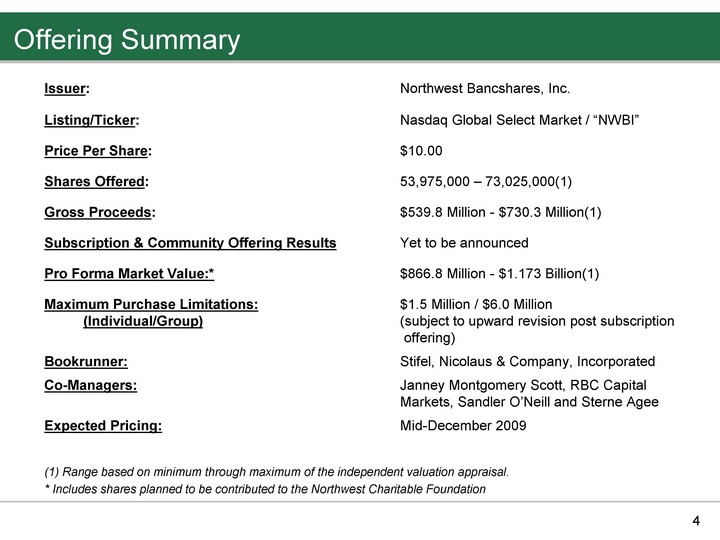
| Offering Summary 4 Issuer: Northwest Bancshares, Inc. Listing/Ticker: Nasdaq Global Select Market / "NWBI" Price Per Share: $10.00 Shares Offered: 53,975,000 - 73,025,000(1) Gross Proceeds: $539.8 Million - $730.3 Million(1) Subscription & Community Offering Results Yet to be announced Pro Forma Market Value:* $866.8 Million - $1.173 Billion(1) Maximum Purchase Limitations: $1.5 Million / $6.0 Million (Individual/Group) (subject to upward revision post subscription offering) Bookrunner: Stifel, Nicolaus & Company, Incorporated Co-Managers: Janney Montgomery Scott, RBC Capital Markets, Sandler O'Neill and Sterne Agee Expected Pricing: Mid-December 2009 (1) Range based on minimum through maximum of the independent valuation appraisal. * Includes shares planned to be contributed to the Northwest Charitable Foundation |
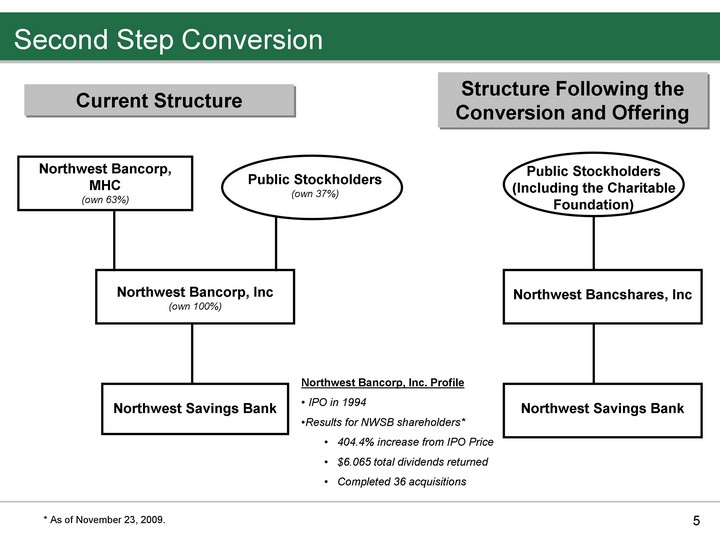
| Second Step Conversion 5 Current Structure Northwest Bancorp, MHC (own 63%) Public Stockholders (own 37%) Northwest Bancorp, Inc (own 100%) Northwest Savings Bank Northwest Bancorp, Inc. Profile IPO in 1994 Results for NWSB shareholders* 404.4% increase from IPO Price $6.065 total dividends returned Completed 36 acquisitions Structure Following the Conversion and Offering Public Stockholders (Including the Charitable Foundation) Northwest Bancshares, Inc Northwest Savings Bank * As of November 23, 2009. |

| Reasons for the Conversion - Why Now? 6 Leveraged existing capital to 6.7% tangible common equity Substantial acquisition opportunities in our markets Greater ability to do stock for stock acquisitions Continued denovo and organic growth are expected Create more liquidity in our common stock |

| Key Investment Merits 7 Experienced and disciplined acquiror Experienced and cohesive management team Conservative loan underwriting Represents a premier banking franchise at an attractive price |
| Corporate Overview |
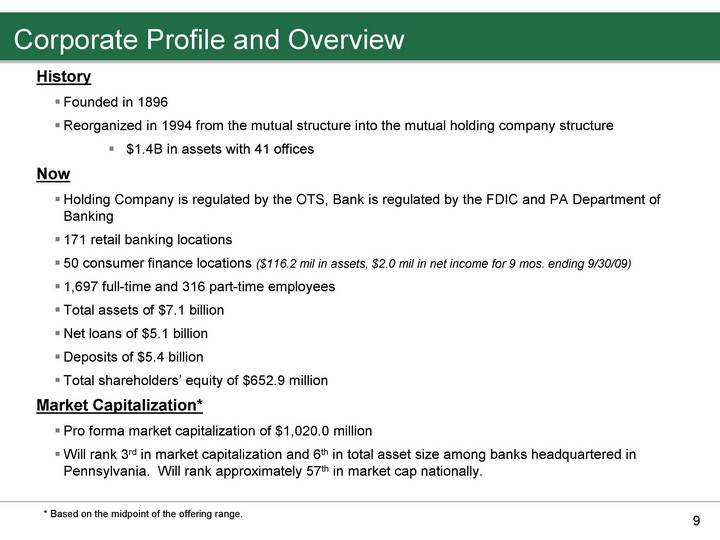
| Corporate Profile and Overview 9 History Founded in 1896 Reorganized in 1994 from the mutual structure into the mutual holding company structure $1.4B in assets with 41 offices Now Holding Company is regulated by the OTS, Bank is regulated by the FDIC and PA Department of Banking 171 retail banking locations 50 consumer finance locations ($116.2 mil in assets, $2.0 mil in net income for 9 mos. ending 9/30/09) 1,697 full-time and 316 part-time employees Total assets of $7.1 billion Net loans of $5.1 billion Deposits of $5.4 billion Total shareholders' equity of $652.9 million Market Capitalization* Pro forma market capitalization of $1,020.0 million Will rank 3rd in market capitalization and 6th in total asset size among banks headquartered in Pennsylvania. Will rank approximately 57th in market cap nationally. * Based on the midpoint of the offering range. |

| Attractive Franchise 10 |
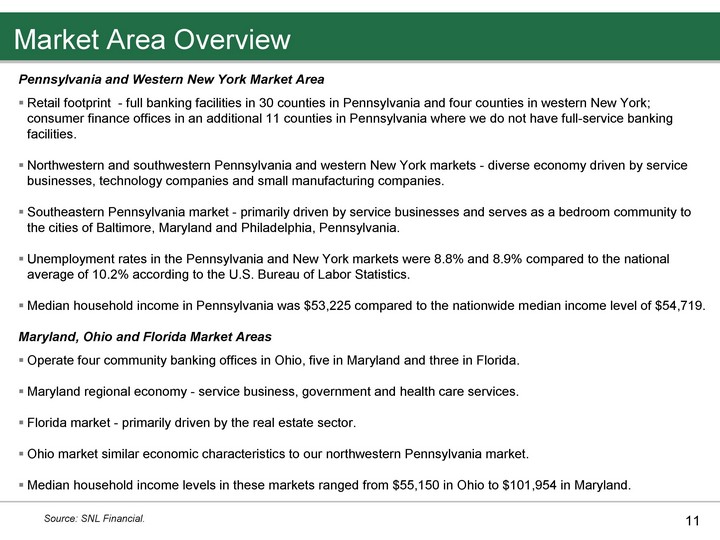
| Market Area Overview 11 Pennsylvania and Western New York Market Area Retail footprint - full banking facilities in 30 counties in Pennsylvania and four counties in western New York; consumer finance offices in an additional 11 counties in Pennsylvania where we do not have full-service banking facilities. Northwestern and southwestern Pennsylvania and western New York markets - diverse economy driven by service businesses, technology companies and small manufacturing companies. Southeastern Pennsylvania market - primarily driven by service businesses and serves as a bedroom community to the cities of Baltimore, Maryland and Philadelphia, Pennsylvania. Unemployment rates in the Pennsylvania and New York markets were 8.8% and 8.9% compared to the national average of 10.2% according to the U.S. Bureau of Labor Statistics. Median household income in Pennsylvania was $53,225 compared to the nationwide median income level of $54,719. Maryland, Ohio and Florida Market Areas Operate four community banking offices in Ohio, five in Maryland and three in Florida. Maryland regional economy - service business, government and health care services. Florida market - primarily driven by the real estate sector. Ohio market similar economic characteristics to our northwestern Pennsylvania market. Median household income levels in these markets ranged from $55,150 in Ohio to $101,954 in Maryland. Source: SNL Financial. |
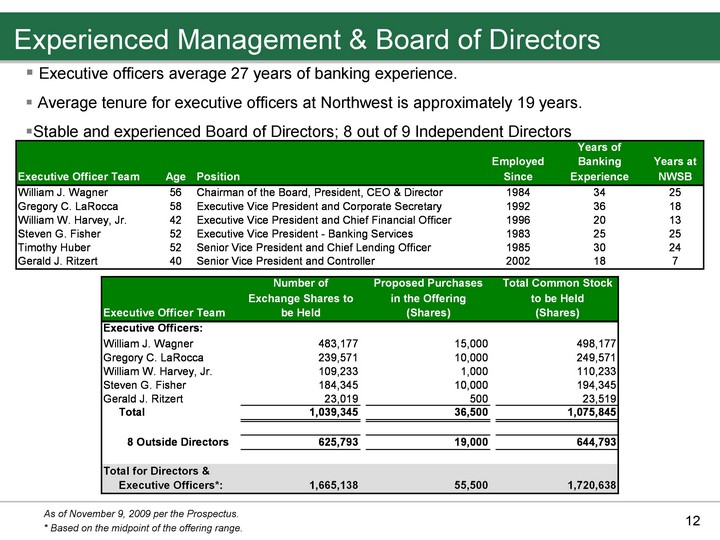
| Experienced Management & Board of Directors 12 Executive officers average 27 years of banking experience. Average tenure for executive officers at Northwest is approximately 19 years. Stable and experienced Board of Directors; 8 out of 9 Independent Directors As of November 9, 2009 per the Prospectus. * Based on the midpoint of the offering range. |
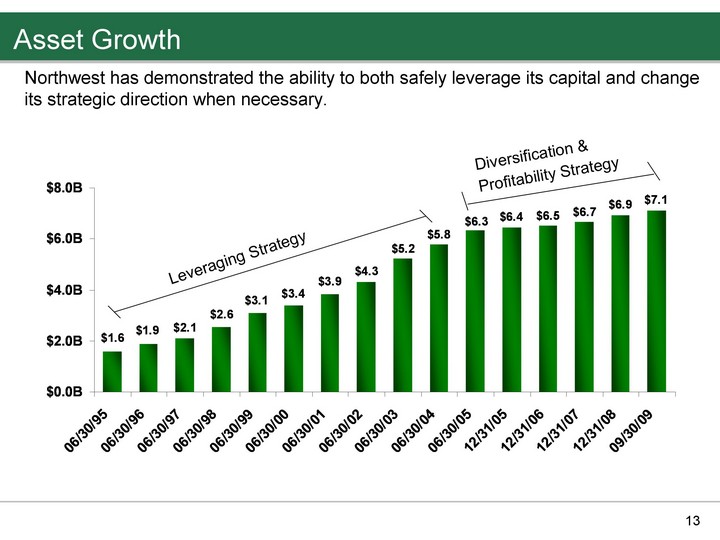
| Asset Growth 13 Leveraging Strategy Diversification & Profitability Strategy Northwest has demonstrated the ability to both safely leverage its capital and change its strategic direction when necessary. |

| Growth of Our Franchise Since IPO 14 About 50% of our balance sheet growth was organic, the other 50% was accomplished through mergers and acquisitions. Organic Growth 55 De Novo Branch Openings 23 Northwest Consumer Discount offices Merger and Acquisition activity: Branch Purchases - 10 acquisitions with 8 different banks from which we acquired 43 offices Whole Bank Acquisitions - 13 acquisitions from which we acquired 32 new offices Northwest Consumer Discount Company - 10 acquisitions from which we added 10 offices We have also acquired an asset management company, a brokerage office and a benefits consulting firm |
| Stock Performance and Per Share Information |

| Price Performance Since IPO (11/4/94) 16 Source: SNL Financial As of November 23, 2009 Since its IPO in 1994, Northwest has significantly outperformed the Nasdaq Bank Index and the S&P 500 Index. |

| Book Value Per Share 17 Increased 348% CAGR 9.14% |
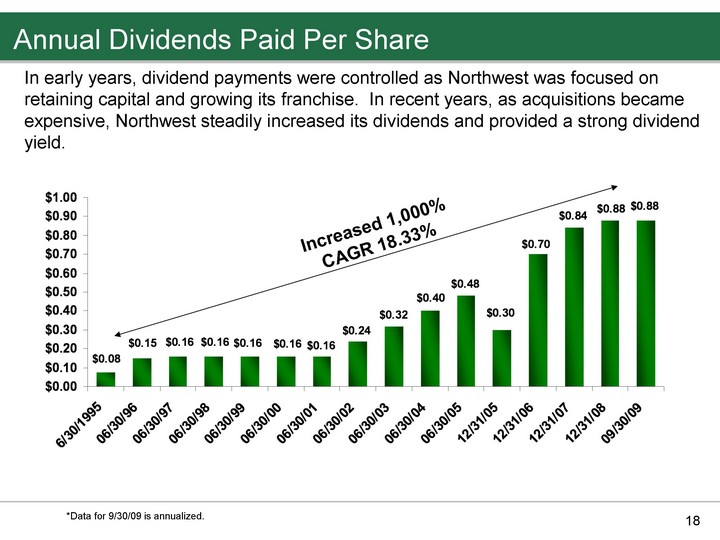
| Annual Dividends Paid Per Share 18 *Data for 9/30/09 is annualized. In early years, dividend payments were controlled as Northwest was focused on retaining capital and growing its franchise. In recent years, as acquisitions became expensive, Northwest steadily increased its dividends and provided a strong dividend yield. Increased 1,000% CAGR 18.33% |
| Historical Operating Performance |

| Interest Rate Spread 20 While organic and acquisition growth successfully leveraged Northwest's capital, net interest spread was relatively flat and below peer averages. Changes in loan and deposit mix were needed to improve profitability ratios. |

| Composition of Loan Portfolio 21 December 2005 September 2009 |
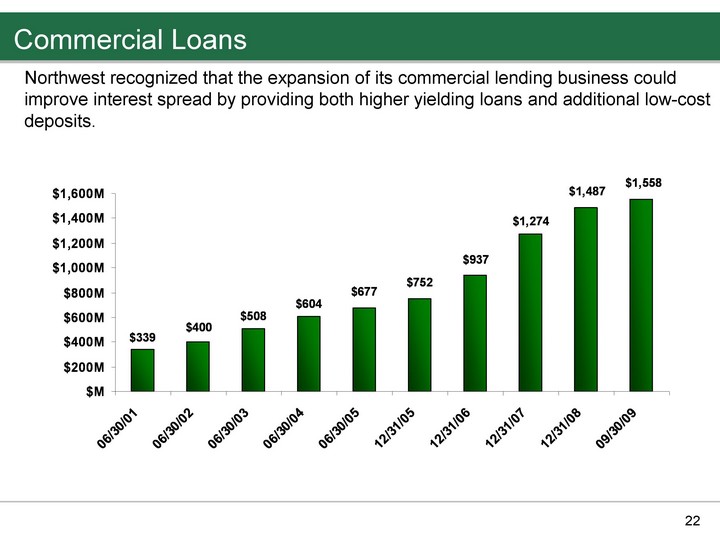
| Commercial Loans 22 Northwest recognized that the expansion of its commercial lending business could improve interest spread by providing both higher yielding loans and additional low-cost deposits. |
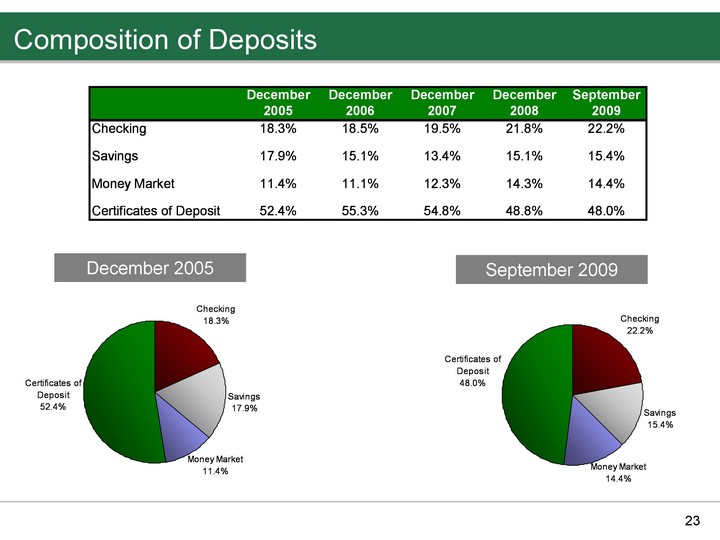
| Composition of Deposits 23 December 2005 September 2009 |
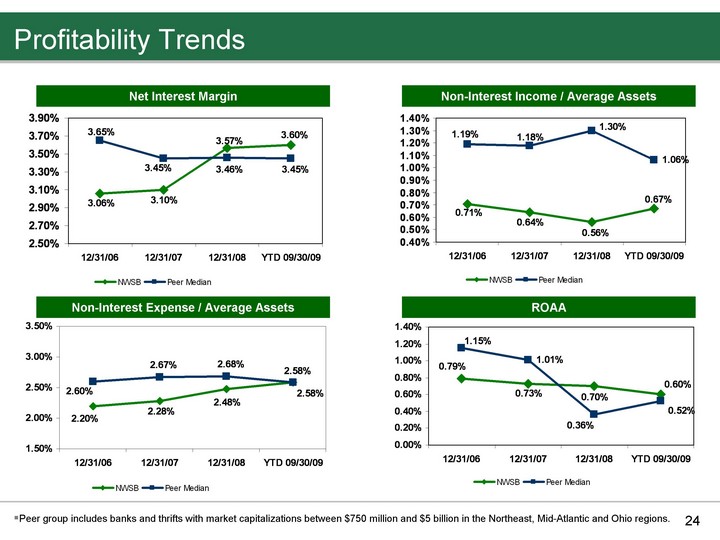
| Profitability Trends 24 Net Interest Margin Non-Interest Income / Average Assets Non-Interest Expense / Average Assets ROAA Peer group includes banks and thrifts with market capitalizations between $750 million and $5 billion in the Northeast, Mid-Atlantic and Ohio regions. |
| Asset Quality |
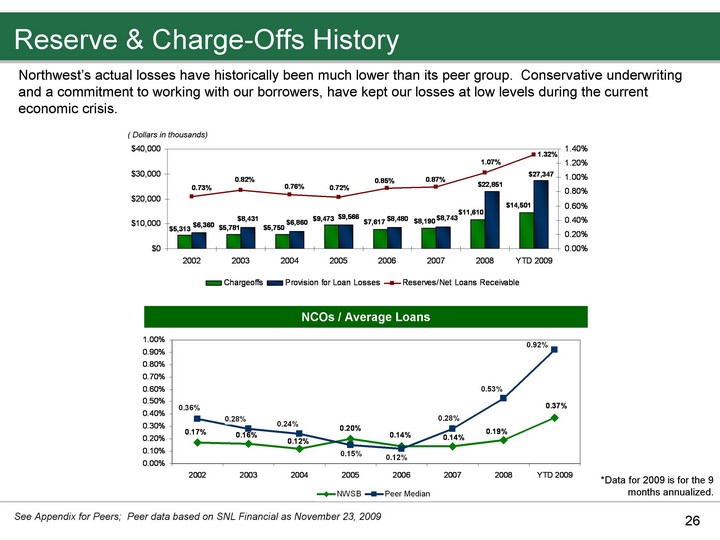
| Reserve & Charge-Offs History 26 *Data for 2009 is for the 9 months annualized. NCOs / Average Loans Northwest's actual losses have historically been much lower than its peer group. Conservative underwriting and a commitment to working with our borrowers, have kept our losses at low levels during the current economic crisis. See Appendix for Peers; Peer data based on SNL Financial as November 23, 2009 ( Dollars in thousands) |
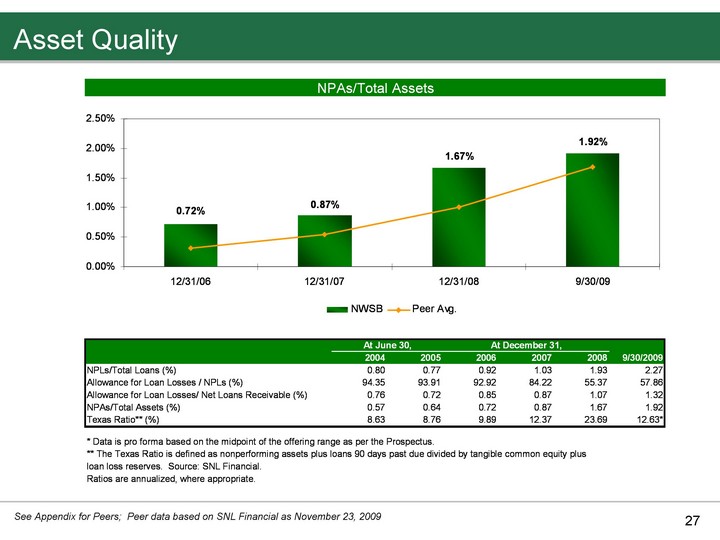
| Asset Quality 27 See Appendix for Peers; Peer data based on SNL Financial as November 23, 2009 |
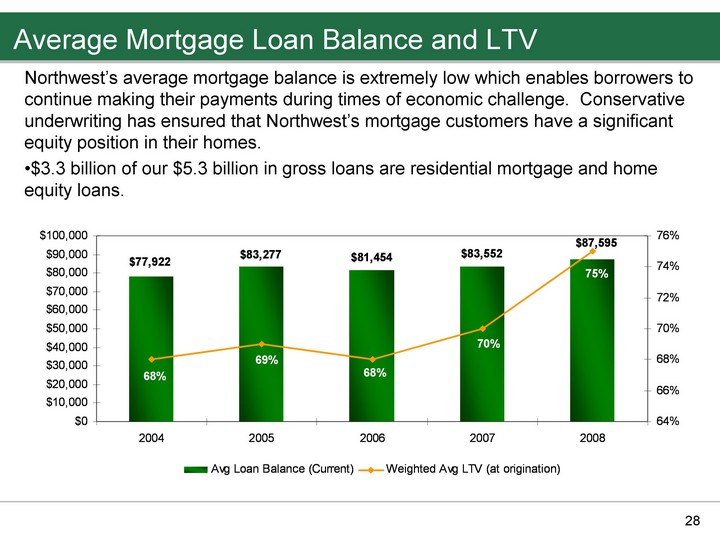
| Average Mortgage Loan Balance and LTV 28 Northwest's average mortgage balance is extremely low which enables borrowers to continue making their payments during times of economic challenge. Conservative underwriting has ensured that Northwest's mortgage customers have a significant equity position in their homes. $3.3 billion of our $5.3 billion in gross loans are residential mortgage and home equity loans. |
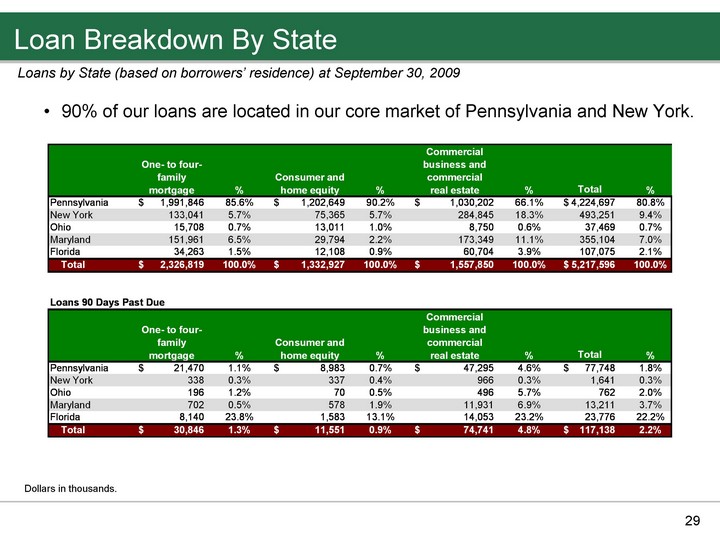
| Loan Breakdown By State 29 Dollars in thousands. Loans by State (based on borrowers' residence) at September 30, 2009 90% of our loans are located in our core market of Pennsylvania and New York. |
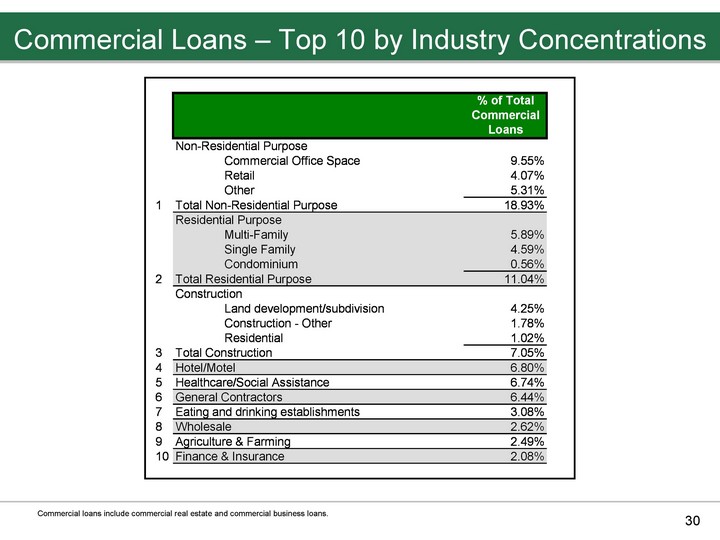
| Commercial Loans - Top 10 by Industry Concentrations 30 Commercial loans include commercial real estate and commercial business loans. |
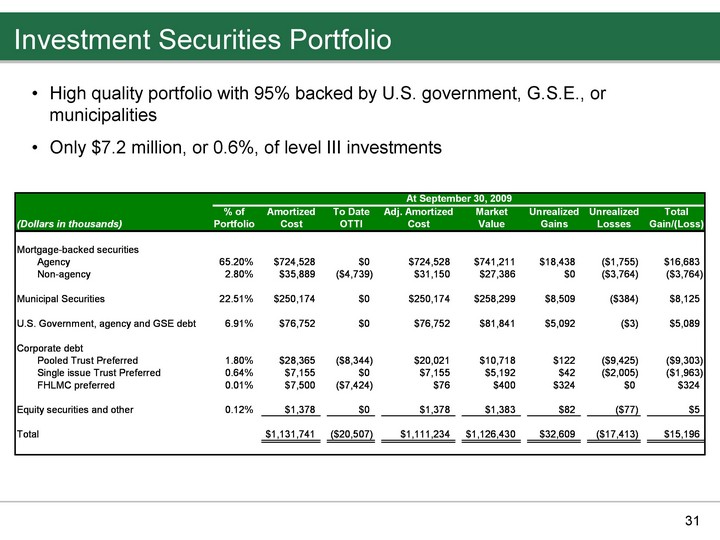
| Investment Securities Portfolio 31 High quality portfolio with 95% backed by U.S. government, G.S.E., or municipalities Only $7.2 million, or 0.6%, of level III investments |
| Second Step Offering Information |
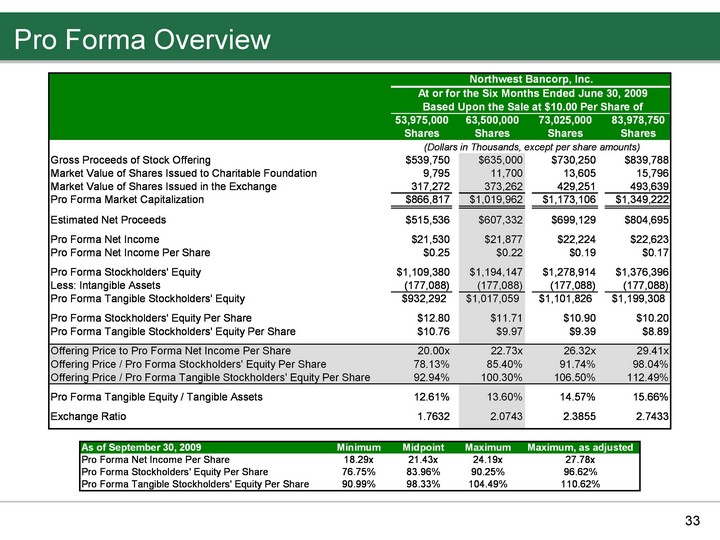
| Pro Forma Overview 33 |

| Attractive Valuation 34 Northwest Bancshares, Inc. * Peer Group (1) Median Price / Book Value 84.0% 92.3% Price / Tang. Book Value 98.3% 156.1% Price / LTM Core Earnings 18.1x** 21.0x Market Capitalization ($M) $1,020.0 $1,400.1 Dividend Yield 4.20% 3.45% * Data is pro forma based on the midpoint of the offering as of September 30, 2009. ** Price / LTM core earnings is as of June 30, 2009 from RP's appraisal report. (1) See Appendix for Peers; Peer data based on SNL Financial as November 23, 2009 |
| Use of Proceeds |
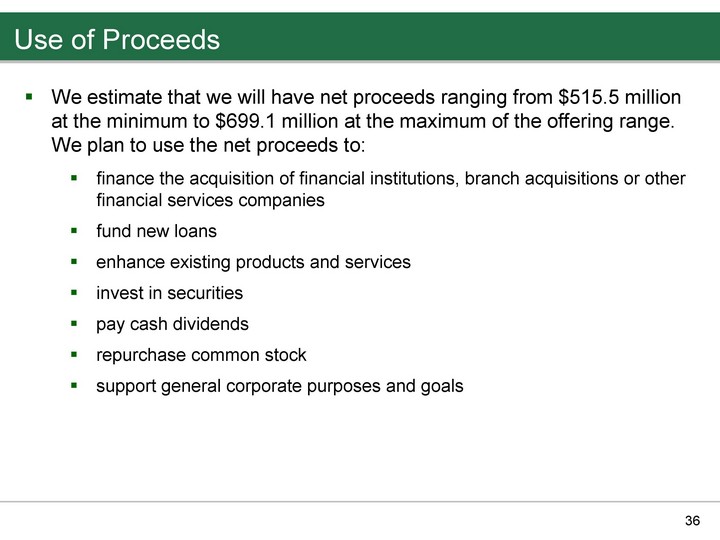
| Use of Proceeds 36 We estimate that we will have net proceeds ranging from $515.5 million at the minimum to $699.1 million at the maximum of the offering range. We plan to use the net proceeds to: finance the acquisition of financial institutions, branch acquisitions or other financial services companies fund new loans enhance existing products and services invest in securities pay cash dividends repurchase common stock support general corporate purposes and goals |

| Disciplined Acquisition Strategy 37 Opportunity in our market areas: In PA, NY, OH and MD - approximately 170 public and private banks and thrifts with assets between $400 million and $6.5 billion On a selective basis, we would consider: whole bank acquisitions FDIC assisted transactions branch divestitures |

| Disciplined Acquisition Strategy 38 Acquisition criteria Strategic first preference is for acquisitions within our current markets secondarily, we prefer acquisitions in contiguous or near contiguous market areas prefer banks that add complementary products and services, diversified deposit mixes and strong branch networks |
| Investment Opportunity |

| Investment Opportunity in Northwest 40 Things we plan to do: Continuing our evolution of becoming more bank-like Continue our disciplined acquisition strategy in our current or adjacent markets Focus on self-originated small business and commercial credits vs. residential loans Dividends and stock buybacks Things we don't plan to do: Originate subprime or alt-a loans Originate option ARMs Lend outside of our market area Purchase participations in commercial or commercial real estate loans Change our fundamental business plan Experienced management team Conservative credit culture Substantial growth opportunities in attractive markets Attractive valuation |
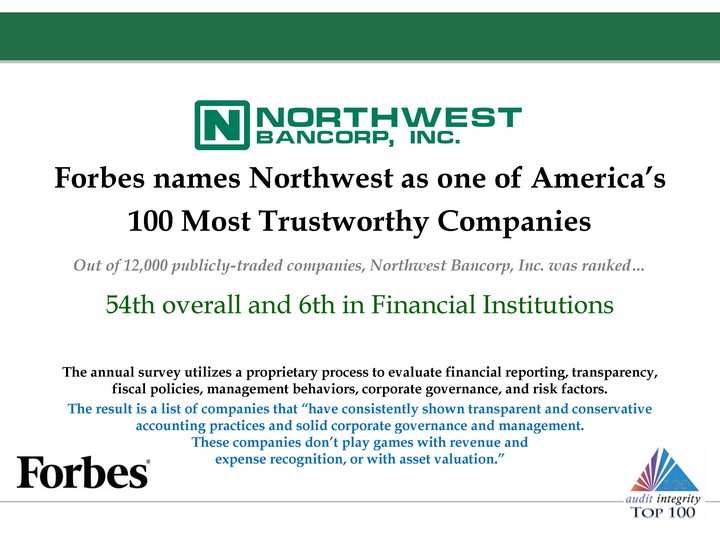
| Forbes names Northwest as one of America's 100 Most Trustworthy Companies The annual survey utilizes a proprietary process to evaluate financial reporting, transparency, fiscal policies, management behaviors, corporate governance, and risk factors. The result is a list of companies that "have consistently shown transparent and conservative accounting practices and solid corporate governance and management. These companies don't play games with revenue and expense recognition, or with asset valuation." 54th overall and 6th in Financial Institutions Out of 12,000 publicly-traded companies, Northwest Bancorp, Inc. was ranked... |

| Appendix |
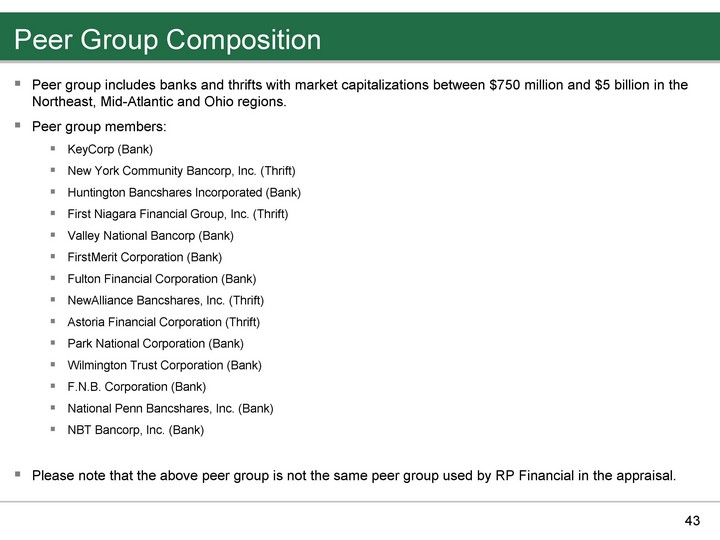
| Peer Group Composition 43 Peer group includes banks and thrifts with market capitalizations between $750 million and $5 billion in the Northeast, Mid-Atlantic and Ohio regions. Peer group members: KeyCorp (Bank) New York Community Bancorp, Inc. (Thrift) Huntington Bancshares Incorporated (Bank) First Niagara Financial Group, Inc. (Thrift) Valley National Bancorp (Bank) FirstMerit Corporation (Bank) Fulton Financial Corporation (Bank) NewAlliance Bancshares, Inc. (Thrift) Astoria Financial Corporation (Thrift) Park National Corporation (Bank) Wilmington Trust Corporation (Bank) F.N.B. Corporation (Bank) National Penn Bancshares, Inc. (Bank) NBT Bancorp, Inc. (Bank) Please note that the above peer group is not the same peer group used by RP Financial in the appraisal. |