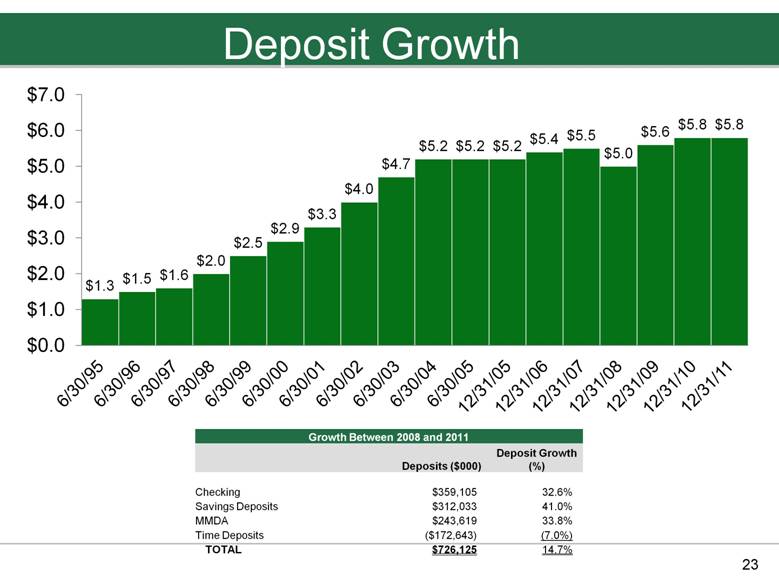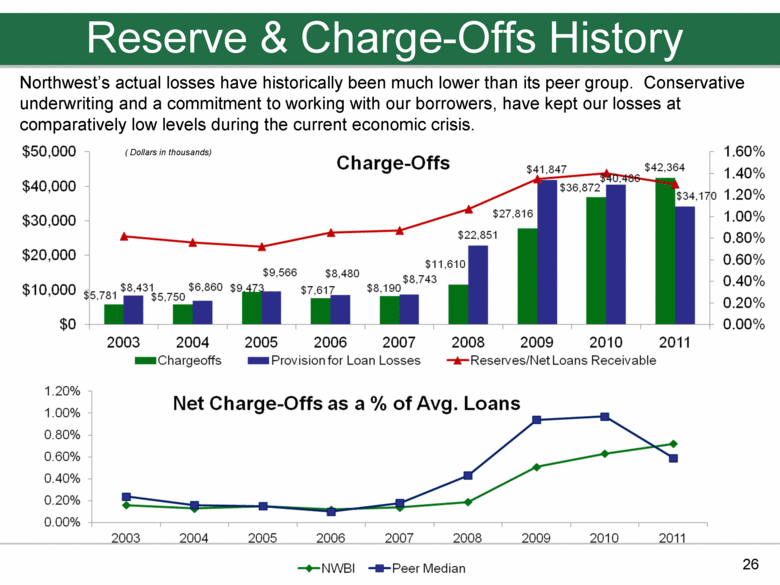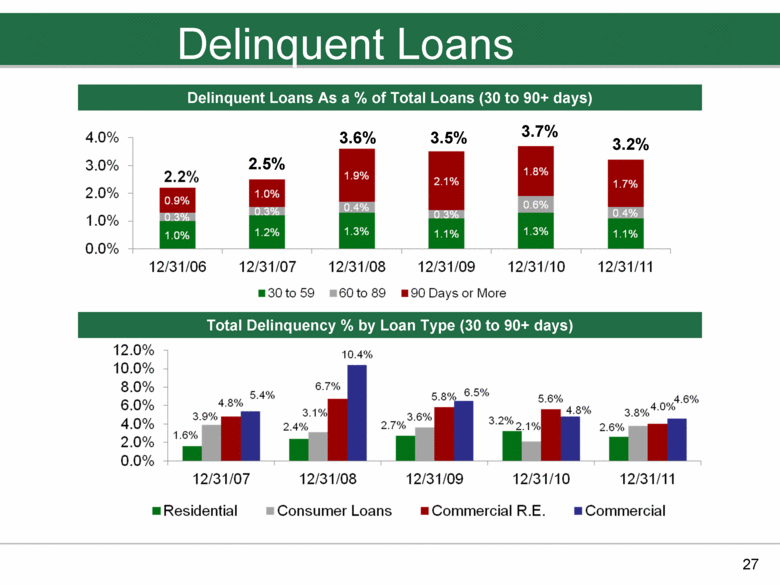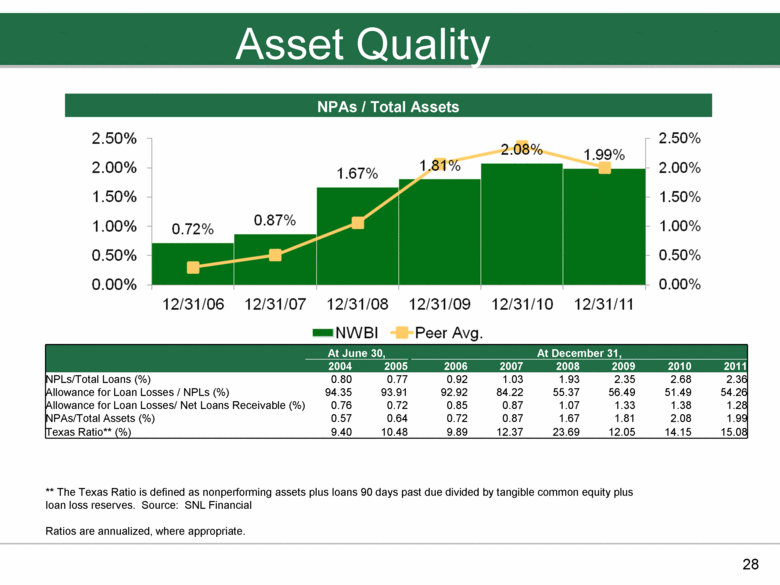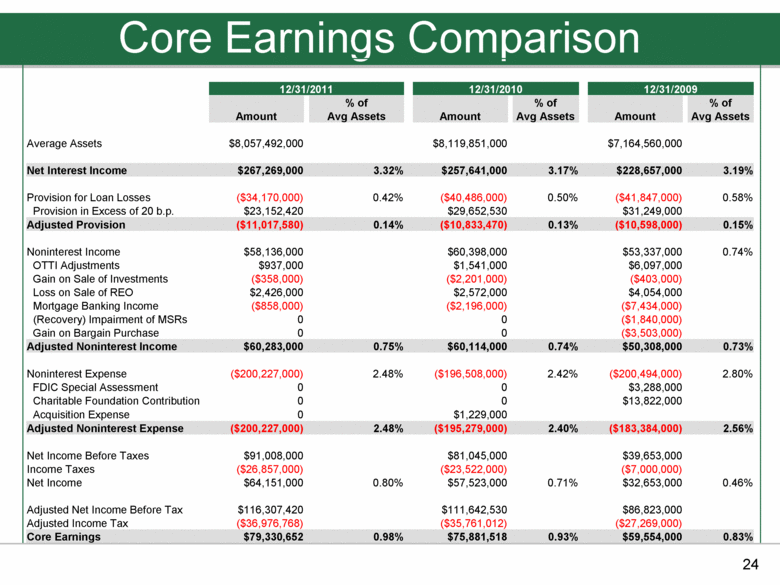
| Core Earnings Comparison 24 12/31/2011 12/31/2010 12/31/2009 % of % of % of Amount Avg Assets Amount Avg Assets Amount Avg Assets Average Assets $8,057,492,000 $8,119,851,000 $7,164,560,000 Net Interest Income $267,269,000 3.32% $257,641,000 3.17% $228,657,000 3.19% Provision for Loan Losses ($34,170,000) 0.42% ($40,486,000) 0.50% ($41,847,000) 0.58% Provision in Excess of 20 b.p. $23,152,420 $29,652,530 $31,249,000 Adjusted Provision ($11,017,580) 0.14% ($10,833,470) 0.13% ($10,598,000) 0.15% Noninterest Income $58,136,000 $60,398,000 $53,337,000 0.74% OTTI Adjustments $937,000 $1,541,000 $6,097,000 Gain on Sale of Investments ($358,000) ($2,201,000) ($403,000) Loss on Sale of REO $2,426,000 $2,572,000 $4,054,000 Mortgage Banking Income ($858,000) ($2,196,000) ($7,434,000) (Recovery) Impairment of MSRs 0 0 ($1,840,000) Gain on Bargain Purchase 0 0 ($3,503,000) Adjusted Noninterest Income $60,283,000 0.75% $60,114,000 0.74% $50,308,000 0.73% Noninterest Expense ($200,227,000) 2.48% ($196,508,000) 2.42% ($200,494,000) 2.80% FDIC Special Assessment 0 0 $3,288,000 Charitable Foundation Contribution 0 0 $13,822,000 Acquisition Expense 0 $1,229,000 Adjusted Noninterest Expense ($200,227,000) 2.48% ($195,279,000) 2.40% ($183,384,000) 2.56% Net Income Before Taxes $91,008,000 $81,045,000 $39,653,000 Income Taxes ($26,857,000) ($23,522,000) ($7,000,000) Net Income $64,151,000 0.80% $57,523,000 0.71% $32,653,000 0.46% Adjusted Net Income Before Tax $116,307,420 $111,642,530 $86,823,000 Adjusted Income Tax ($36,976,768) ($35,761,012) ($27,269,000) Core Earnings $79,330,652 0.98% $75,881,518 0.93% $59,554,000 0.83% |


