|
Exhibit 99.1 
|
Western New York Branch Acquisition
(Greater Buffalo MSA)
April 29, 2016
|
|
This press release contains statements that may be considered forward-looking statements within the meaning of Section 27A of the Securities Act of 1933 and Section 21E of the Securities Exchange Act of 1934. These forward-looking statements are intended to be covered by the safe harbor provisions of the Private Securities Litigation Reform Act of 1995, and this statement is included for purposes of complying with these safe harbor provisions. Readers should not place undue reliance on such forward-looking statements, which speak only as of the date made. These forward-looking statements are based on current plans and expectations, which are subject to a number of risk factors and uncertainties that could cause future results to differ materially from historical performance or future expectations. These differences may be the result of various factors, including, among others: (1) failure of the parties to satisfy the closing conditions in the purchase and assumption agreement in a timely manner or at all; (2) failure to obtain governmental approvals for the acquisition of the branches; (3) disruptions to the parties’ businesses as a result of the announcement and pendency of the branch acquisition; (4) costs or difficulties related to the integration of the business of the acquired branches following the closing of the transaction; (5) the risk that the anticipated benefits, cost savings and any other savings from the transaction may not be fully realized or may take longer than expected to realize; (6) changes in general business, industry or economic conditions or competition; (7) changes in any applicable law, rule, regulation, policy, guideline or practice governing or affecting financial holding companies and their subsidiaries or with respect to tax or accounting principles or otherwise; (8) adverse changes or conditions in the capital and financial markets; (9) changes in interest rates or credit availability; (10) the inability to realize expected cost savings or achieve other anticipated benefits in connection with the proposed branch acquisition; (11) changes in the quality or composition of loan and investment portfolios; (12) adequacy of loan loss reserves and changes in loan default and charge-off rates; (13) increased competition and its effect on pricing, spending, third-party relationships and revenues; (14) continued relationships with major customers; (15) deposit attrition, necessitating increased borrowings to fund loans and investments; (16) rapidly changing technology; (17) unanticipated regulatory or judicial proceedings and liabilities and other costs; (18) changes in the cost of funds, demand for loan products or demand for financial services; and (19) other economic, competitive, governmental or technological factors affecting operations, markets, products, services and prices.
The foregoing list should not be construed as exhaustive, and KeyCorp/First Niagara Financial Group, Inc. and Northwest Bancshares, Inc. undertake no obligation to subsequently revise any forward-looking statements to reflect events or circumstances after the date of such statements, or to reflect the occurrence of anticipated or unanticipated events or circumstances.
For additional factors that could cause actual results to differ materially from those expressed in the forward-looking statements, please see filings by KeyCorp, First Niagara Financial Group, Inc. and Northwest Bancshares, Inc. with the SEC, including KeyCorp, First Niagara Financial
Group, Inc., and Northwest Bancshares, Inc.’s Annual Report on Form 10-K for the year ended December 31, 2015, respectively.
Forward-Looking Statements
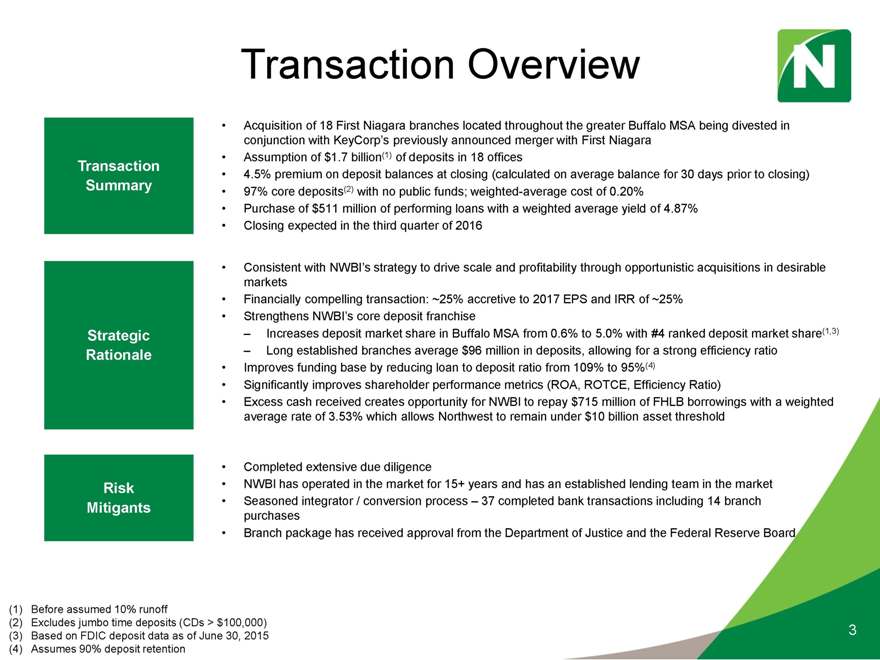
Transaction Overview
Acquisition of 18 First Niagara branches located throughout the greater Buffalo MSA being divested in conjunction with KeyCorp’s previously announced merger with First Niagara
Transaction • Assumption of $1.7 billion(1) of deposits in 18 offices
4.5% premium on deposit balances at closing (calculated on average balance for 30 days prior to closing)
Summary • 97% core deposits(2) with no public funds; weighted-average cost of 0.20%
Purchase of $511 million of performing loans with a weighted average yield of 4.87%
Closing expected in the third quarter of 2016
Consistent with NWBI’s strategy to drive scale and profitability through opportunistic acquisitions in desirable markets
Financially compelling transaction: ~25% accretive to 2017 EPS and IRR of ~25%
Strengthens NWBI’s core deposit franchise
Strategic – Increases deposit market share in Buffalo MSA from 0.6% to 5.0% with #4 ranked deposit market share(1,3) Rationale – Long established branches average $96 million in deposits, allowing for a strong efficiency ratio
Improves funding base by reducing loan to deposit ratio from 109% to 95%(4)
Significantly improves shareholder performance metrics (ROA, ROTCE, Efficiency Ratio)
Excess cash received creates opportunity for NWBI to repay $715 million of FHLB borrowings with a weighted average rate of 3.53% which allows Northwest to remain under $10 billion asset threshold
Completed extensive due diligence
Risk • NWBI has operated in the market for 15+ years and has an established lending team in the market Mitigants • Seasoned integrator / conversion process – 37 completed bank transactions including 14 branch purchases
Branch package has received approval from the Department of Justice and the Federal Reserve Board
(1) | | Before assumed 10% runoff |
(2) | | Excludes jumbo time deposits (CDs > $100,000) |
(3) | | Based on FDIC deposit data as of June 30, 2015 3 (4) Assumes 90% deposit retention |
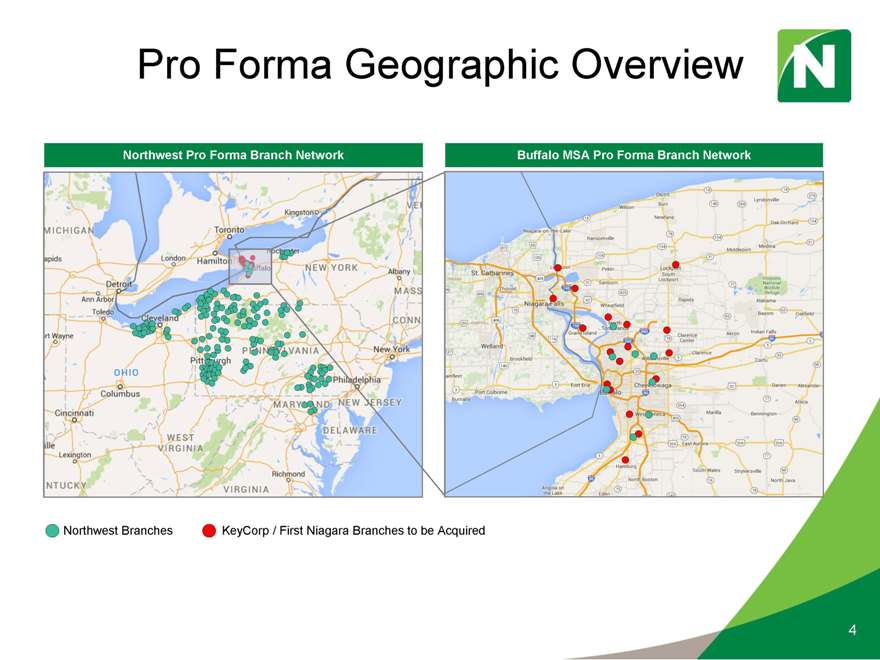
Pro Forma Geographic Overview
Northwest Pro Forma Branch Network Buffalo MSA Pro Forma Branch Network
Northwest Branches KeyCorp / First Niagara Branches to be Acquired
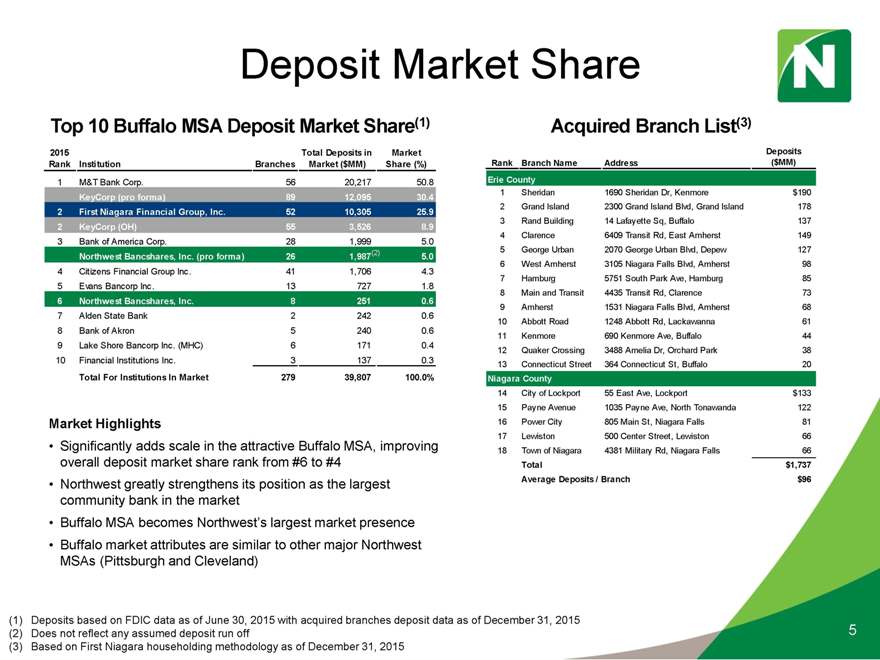
Deposit Market Share
Top 10 Buffalo MSA Deposit Market Share(1)
2015 Total Deposits in Market Rank Institution Branches Market ($MM) Share (%)
1 M&T Bank Corp. 56 20,217 50.8
KeyCorp (pro forma) 89 12,095 30.4
2 First Niagara Financial Group, Inc. 52 10,305 25.9
2 KeyCorp (OH) 55 3,526 8.9
3 Bank of America Corp. 28 1,999 5.0
(2)
Northwest Bancshares, Inc. (pro forma) 26 1,987 5.0
4 Citizens Financial Group Inc. 41 1,706 4.3
5 Evans Bancorp Inc. 13 727 1.8
6 Northwest Bancshares, Inc. 8 251 0.6
7 Alden State Bank 2 242 0.6
8 Bank of Akron 5 240 0.6
9 Lake Shore Bancorp Inc. (MHC) 6 171 0.4
10 Financial Institutions Inc. 3 137 0.3
Total For Institutions In Market 279 39,807 100.0%
Market Highlights
Significantly adds scale in the attractive Buffalo MSA, improving overall deposit market share rank from #6 to #4
Northwest greatly strengthens its position as the largest community bank in the market
Buffalo MSA becomes Northwest’s largest market presence
Buffalo market attributes are similar to other major Northwest MSAs (Pittsburgh and Cleveland)
Acquired Branch List(3)
Deposits Rank Branch Name Address ($MM) Erie County
1 Sheridan 1690 Sheridan Dr, Kenmore $190
2 Grand Island 2300 Grand Island Blvd, Grand Island 178
3 Rand Building 14 Lafayette Sq, Buffalo 137
4 Clarence 6409 Transit Rd, East Amherst 149
5 George Urban 2070 George Urban Blvd, Depew 127
6 West Amherst 3105 Niagara Falls Blvd, Amherst 98
7 Hamburg 5751 South Park Ave, Hamburg 85
8 Main and Transit 4435 Transit Rd, Clarence 73
9 Amherst 1531 Niagara Falls Blvd, Amherst 68
10 Abbott Road 1248 Abbott Rd, Lackawanna 61
11 Kenmore 690 Kenmore Ave, Buffalo 44
12 Quaker Crossing 3488 Amelia Dr, Orchard Park 38
13 Connecticut Street 364 Connecticut St, Buffalo 20
Niagara County
14 City of Lockport 55 East Ave, Lockport $133
15 Payne Avenue 1035 Payne Ave, North Tonawanda 122
16 Power City 805 Main St, Niagara Falls 81
17 Lewiston 500 Center Street, Lewiston 66
18 Town of Niagara 4381 Military Rd, Niagara Falls 66
Total $1,737 Average Deposits / Branch $96
(1) Deposits based on FDIC data as of June 30, 2015 with acquired branches deposit data as of December 31, 2015
(2) Does not reflect any assumed deposit run off 5 (3) Based on First Niagara householding methodology as of December 31, 2015
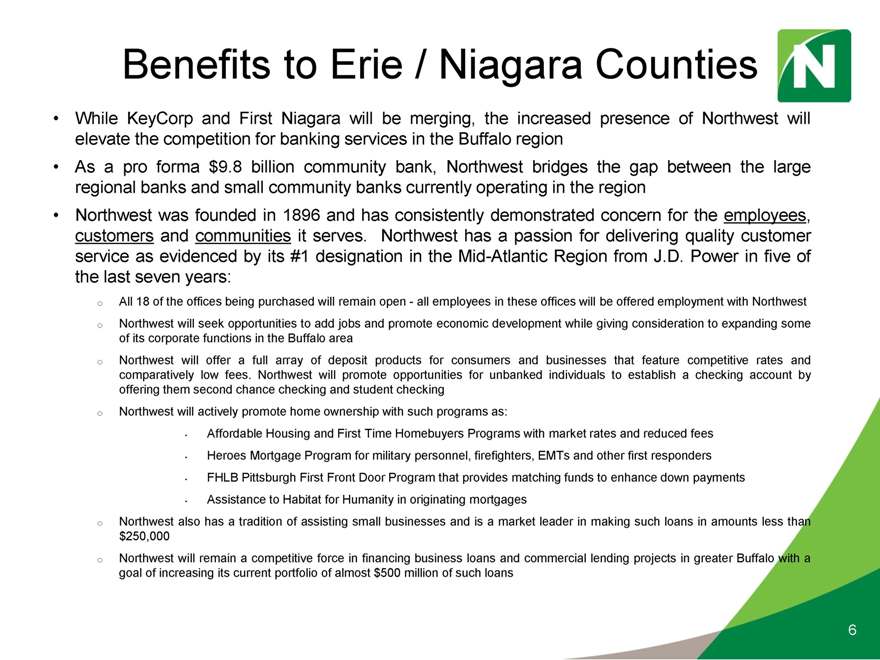
Benefits to Erie / Niagara Counties
While KeyCorp and First Niagara will be merging, the increased presence of Northwest will elevate the competition for banking services in the Buffalo region
As a pro forma $9.8 billion community bank, Northwest bridges the gap between the large regional banks and small community banks currently operating in the region
Northwest was founded in 1896 and has consistently demonstrated concern for the employees, customers and communities it serves. Northwest has a passion for delivering quality customer service as evidenced by its #1 designation in the Mid-Atlantic Region from J.D. Power in five of the last seven years:
o All 18 of the offices being purchased will remain open—all employees in these offices will be offered employment with Northwest o Northwest will seek opportunities to add jobs and promote economic development while giving consideration to expanding some of its corporate functions in the Buffalo area o Northwest will offer a full array of deposit products for consumers and businesses that feature competitive rates and comparatively low fees. Northwest will promote opportunities for unbanked individuals to establish a checking account by offering them second chance checking and student checking o Northwest will actively promote home ownership with such programs as:
Affordable Housing and First Time Homebuyers Programs with market rates and reduced fees
Heroes Mortgage Program for military personnel, firefighters, EMTs and other first responders
FHLB Pittsburgh First Front Door Program that provides matching funds to enhance down payments
Assistance to Habitat for Humanity in originating mortgages o Northwest also has a tradition of assisting small businesses and is a market leader in making such loans in amounts less than $250,000 o Northwest will remain a competitive force in financing business loans and commercial lending projects in greater Buffalo with a goal of increasing its current portfolio of almost $500 million of such loans
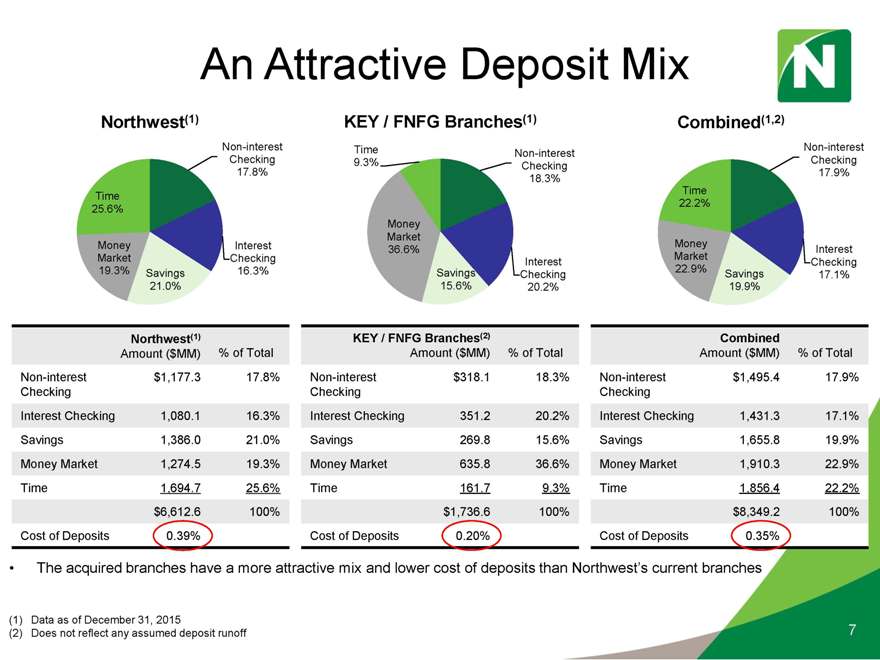
An Attractive Deposit Mix
Northwest(1)
Non-interest Checking 17.8%
Time 25.6%
Money Interest Market Checking 19.3% Savings 16.3% 21.0%
KEY / FNFG Branches(1)
Time Non-interest 9.3% Checking 18.3%
Money Market 36.6%
Interest Savings Checking 15.6% 20.2%
Combined(1,2)
Non-interest Checking 17.9% Time 22.2%
Money
Interest Market Checking 22.9% Savings 17.1% 19.9%
Northwest(1)
Amount ($MM) % of Total Non-interest $1,177.3 17.8% Checking
Interest Checking 1,080.1 16.3% Savings 1,386.0 21.0% Money Market 1,274.5 19.3% Time 1,694.7 25.6% $6,612.6 100%
Cost of Deposits 0.39%
KEY / FNFG Branches(2)
Amount ($MM) % of Total
Non-interest $318.1 18.3% Checking
Interest Checking 351.2 20.2% Savings 269.8 15.6% Money Market 635.8 36.6% Time 161.7 9.3% $1,736.6 100%
Cost of Deposits 0.20%
Combined
Amount ($MM) % of Total
Non-interest $1,495.4 17.9% Checking
Interest Checking 1,431.3 17.1% Savings 1,655.8 19.9% Money Market 1,910.3 22.9% Time 1,856.4 22.2% $8,349.2 100%
Cost of Deposits 0.35%
The acquired branches have a more attractive mix and lower cost of deposits than Northwest’s current branches
(1) | | Data as of December 31, 2015 |
(2) | | Does not reflect any assumed deposit runoff 7 |
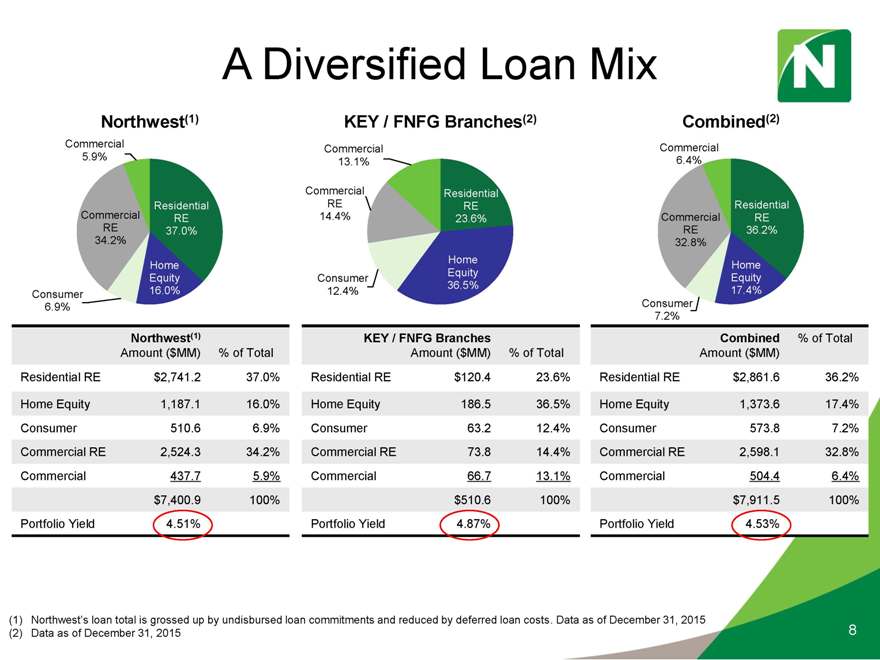
A Diversified Loan Mix
Northwest(1)
Commercial
5.9%
Commercial Residential RE RE
34.2% 37.0% Home Equity Consumer 16.0%
6.9%
KEY / FNFG Branches(2)
Commercial 13.1%
Commercial Residential RE RE
14.4% 23.6%
Home Equity Consumer 36.5% 12.4%
Combined(2)
Commercial 6.4%
Residential Commercial RE
RE 36.2% 32.8%
Home Equity 17.4% Consumer 7.2%
Northwest(1)
Amount ($MM) % of Total Residential RE $2,741.2 37.0% Home Equity 1,187.1 16.0% Consumer 510.6 6.9% Commercial RE 2,524.3 34.2% Commercial 437.7 5.9% $7,400.9 100% Portfolio Yield 4.51%
KEY / FNFG Branches
Amount ($MM) % of Total Residential RE $120.4 23.6% Home Equity 186.5 36.5% Consumer 63.2 12.4% Commercial RE 73.8 14.4%
Commercial 66.7 13.1% $510.6 100% Portfolio Yield 4.87%
7.2%
Combined % of Total Amount ($MM)
Residential RE $2,861.6 36.2% Home Equity 1,373.6 17.4% Consumer 573.8 7.2% Commercial RE 2,598.1 32.8%
Commercial 504.4 6.4% $7,911.5 100% Portfolio Yield 4.53%
(1) Northwest’s loan total is grossed up by undisbursed loan commitments and reduced by deferred loan costs. Data as of December 31, 2015
(2) | | Data as of December 31, 2015 8 |
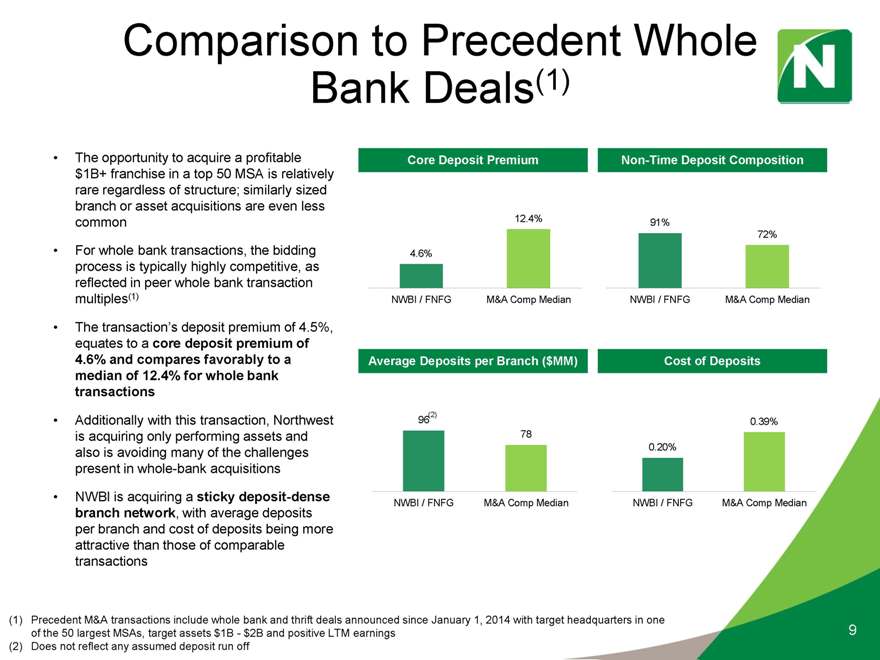
Comparison to Precedent Whole Bank Deals(1)
The opportunity to acquire a profitable $1B+ franchise in a top 50 MSA is relatively rare regardless of structure; similarly sized branch or asset acquisitions are even less common
For whole bank transactions, the bidding process is typically highly competitive, as reflected in peer whole bank transaction multiples(1)
• The transaction’s deposit premium of 4.5%, equates to a core deposit premium of 4.6% and compares favorably to a median of 12.4% for whole bank transactions
Additionally with this transaction, Northwest is acquiring only performing assets and also is avoiding many of the challenges present in whole-bank acquisitions
NWBI is acquiring a sticky deposit-dense branch network, with average deposits per branch and cost of deposits being more attractive than those of comparable transactions
Core Deposit Premium Non-Time Deposit Composition
12.4% 91%
72%
4.6%
NWBI / FNFG M&A Comp Median NWBI / FNFG M&A Comp Median
Average Deposits per Branch ($MM) Cost of Deposits
96 0.39% 78
0.20%
NWBI / FNFG M&A Comp Median NWBI / FNFG M&A Comp Median
(1) Precedent M&A transactions include whole bank and thrift deals announced since January 1, 2014 with target headquarters in one of the 50 largest MSAs, target assets $1B—$2B and positive LTM earnings 9 (2) Does not reflect any assumed deposit run off
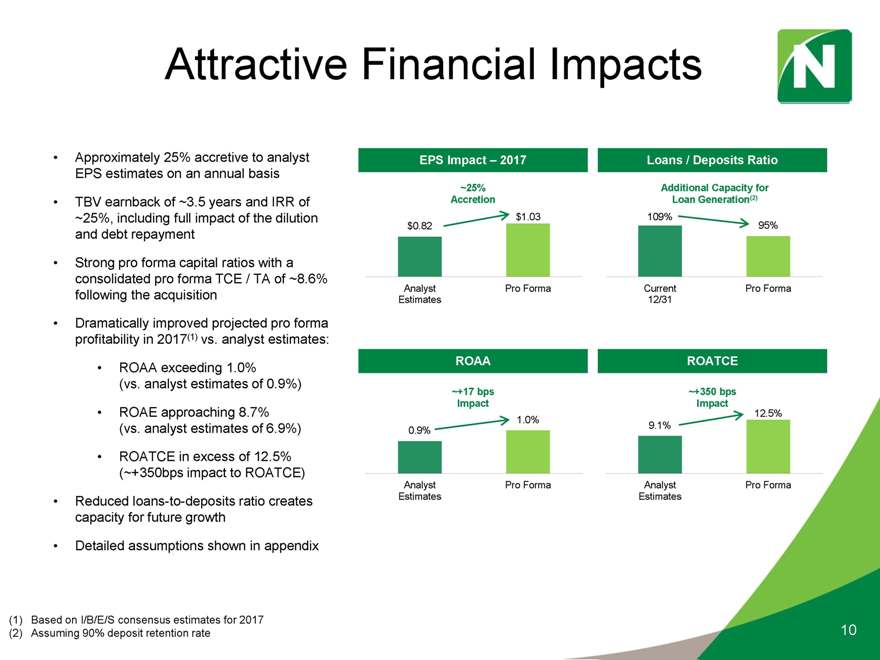
Attractive Financial Impacts
Approximately 25% accretive to analyst EPS estimates on an annual basis
TBV earnback of ~3.5 years and IRR of ~25%, including full impact of the dilution and debt repayment
Strong pro forma capital ratios with a consolidated pro forma TCE / TA of ~8.6% following the acquisition
Dramatically improved projected pro forma profitability in 2017(1) vs. analyst estimates:
ROAA exceeding 1.0%
(vs. analyst estimates of 0.9%)
ROAE approaching 8.7% (vs. analyst estimates of 6.9%)
ROATCE in excess of 12.5% (~+350bps impact to ROATCE)
Reduced loans-to-deposits ratio creates capacity for future growth
Detailed assumptions shown in appendix
EPS Impact – 2017 Loans / Deposits Ratio
~25% Additional Capacity for Accretion Loan Generation(2)
$1.03 109% 95%
$0.82
Analyst Pro Forma Current Pro Forma Estimates 12/31
ROAA ROATCE
~+17 bps ~+350 bps Impact Impact
12.5%
1.0%
9.1%
0.9%
Analyst Pro Forma Analyst Pro Forma Estimates Estimates
(1) | | Based on I/B/E/S consensus estimates for 2017 |
(2) | | Assuming 90% deposit retention rate 10 |
Funding Transformation
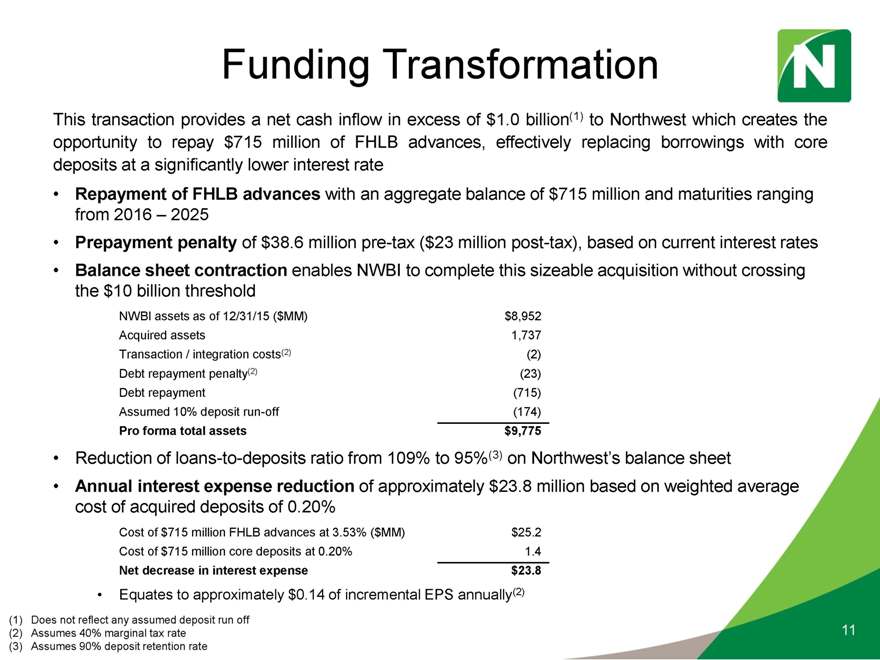
This transaction provides a net cash inflow in excess of $1.0 billion(1) to Northwest which creates the opportunity to repay $715 million of FHLB advances, effectively replacing borrowings with core deposits at a significantly lower interest rate
Repayment of FHLB advances with an aggregate balance of $715 million and maturities ranging from 2016 – 2025
Prepayment penalty of $38.6 million pre-tax ($23 million post-tax), based on current interest rates
Balance sheet contraction enables NWBI to complete this sizeable acquisition without crossing the $10 billion threshold
NWBI assets as of 12/31/15 ($MM) $8,952
Acquired assets 1,737
Transaction / integration costs (2) Debt repayment penalty(2) (23)
Debt repayment (715)
Assumed 10% deposit run-off (174)
Pro forma total assets $9,775
Reduction of loans-to-deposits ratio from 109% to 95%(3) on Northwest’s balance sheet
Annual interest expense reduction of approximately $23.8 million based on weighted average cost of acquired deposits of 0.20%
Cost of $715 million FHLB advances at 3.53% ($MM) $25.2 Cost of $715 million core deposits at 0.20% 1.4
Net decrease in interest expense $23.8
Equates to approximately $0.14 of incremental EPS annually(2)
(1) | | Does not reflect any assumed deposit run off |
(2) | | Assumes 40% marginal tax rate 11 (3) Assumes 90% deposit retention rate |
Estimated EPS & TBV Impact
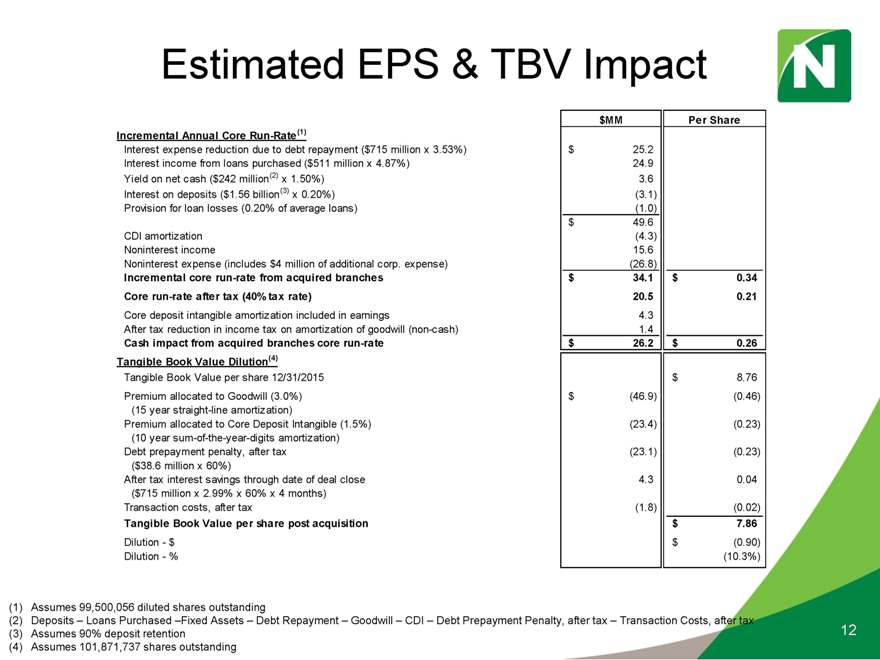
$MM Per Share Incremental Annual Core Run-Rate(1)
Interest expense reduction due to debt repayment ($715 million x 3.53%) $ 25.2 Interest income from loans purchased ($511 million x 4.87%) 24.9 Yield on net cash ($242 million(2) x 1.50%) 3.6 Interest on deposits ($1.56 billion(3) x 0.20%) (3.1) Provision for loan losses (0.20% of average loans) (1.0) $ 49.6 CDI amortization (4.3) Noninterest income 15.6 Noninterest expense (includes $4 million of additional corp. expense) (26.8)
Incremental core run-rate from acquired branches $ 34.1 $ 0.34 Core run-rate after tax (40% tax rate) 20.5 0.21
Core deposit intangible amortization included in earnings 4.3 After tax reduction in income tax on amortization of goodwill (non-cash) 1.4
Cash impact from acquired branches core run-rate $ 26.2 $ 0.26 Tangible Book Value Dilution(4)
Tangible Book Value per share 12/31/2015 $ 8.76 Premium allocated to Goodwill (3.0%) $ (46.9) (0.46) (15 year straight-line amortization) Premium allocated to Core Deposit Intangible (1.5%) (23.4) (0.23) (10 year sum-of-the-year-digits amortization) Debt prepayment penalty, after tax (23.1) (0.23)
($38.6 million x 60%)
After tax interest savings through date of deal close 4.3 0.04
($715 million x 2.99% x 60% x 4 months)
Transaction costs, after tax (1.8) (0.02)
Tangible Book Value per share post acquisition $ 7.86
Dilution—$ $ (0.90) Dilution—% (10.3%)
(1) | | Assumes 99,500,056 diluted shares outstanding |
(2) Deposits – Loans Purchased –Fixed Assets – Debt Repayment – Goodwill – CDI – Debt Prepayment Penalty, after tax – Transaction Costs, after tax
(3) | | Assumes 90% deposit retention 12 (4) Assumes 101,871,737 shares outstanding |
Appendix: Comparable Deals
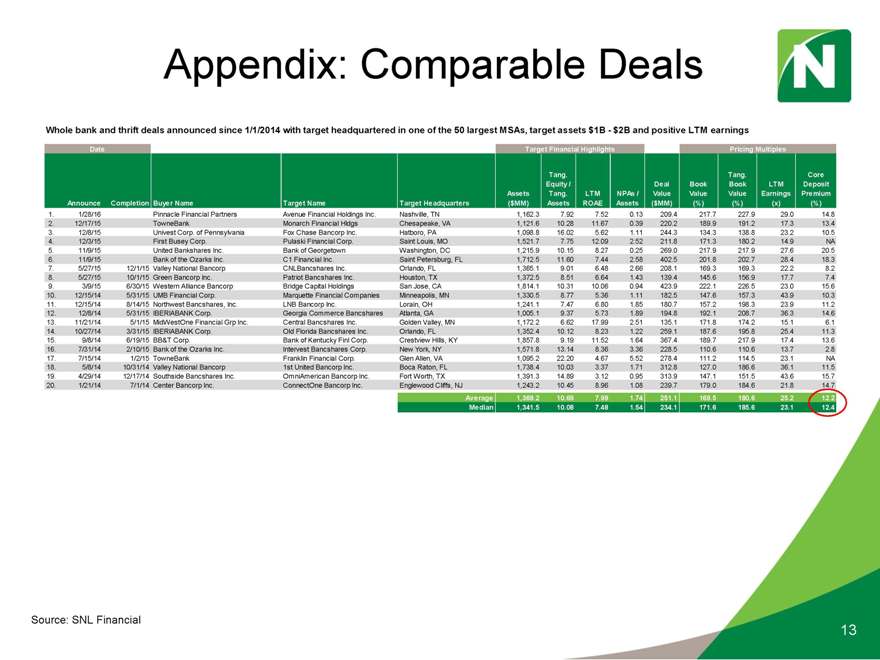
Whole bank and thrift deals announced since 1/1/2014 with target headquartered in one of the 50 largest MSAs, target assets $1B—$2B and positive LTM earnings
Date Target Financial Highlights Pricing Multiples
Tang. Tang. Core Equity / Deal Book Book LTM Deposit Assets Tang. LTM NPAs / Value Value Value Earnings Premium Announce Completion Buyer Name Target Name Target Headquarters ($MM) Assets ROAE Assets ($MM) (%) (%) (x) (%)
1. 1/28/16 Pinnacle Financial Partners Avenue Financial Holdings Inc. Nashville, TN 1,162.3 7.92 7.52 0.13 209.4 217.7 227.9 29.0 14.8
2. 12/17/15 TowneBank Monarch Financial Hldgs Chesapeake, VA 1,121.6 10.28 11.67 0.39 220.2 189.9 191.2 17.3 13.4
3. 12/8/15 Univest Corp. of Pennsylvania Fox Chase Bancorp Inc. Hatboro, PA 1,098.8 16.02 5.62 1.11 244.3 134.3 138.8 23.2 10.5
4. 12/3/15 First Busey Corp. Pulaski Financial Corp. Saint Louis, MO 1,521.7 7.75 12.09 2.52 211.8 171.3 180.2 14.9 NA
5. 11/9/15 United Bankshares Inc. Bank of Georgetown Washington, DC 1,215.9 10.15 8.27 0.25 269.0 217.9 217.9 27.6 20.5
6. 11/9/15 Bank of the Ozarks Inc. C1 Financial Inc. Saint Petersburg, FL 1,712.5 11.60 7.44 2.58 402.5 201.8 202.7 28.4 18.3
7. 5/27/15 12/1/15 Valley National Bancorp CNLBancshares Inc. Orlando, FL 1,365.1 9.01 6.48 2.66 208.1 169.3 169.3 22.2 8.2
8. 5/27/15 10/1/15 Green Bancorp Inc. Patriot Bancshares Inc. Houston, TX 1,372.5 8.51 6.64 1.43 139.4 145.6 156.9 17.7 7.4
9. 3/9/15 6/30/15 Western Alliance Bancorp Bridge Capital Holdings San Jose, CA 1,814.1 10.31 10.06 0.94 423.9 222.1 226.5 23.0 15.6 10. 12/15/14 5/31/15 UMB Financial Corp. Marquette Financial Companies Minneapolis, MN 1,330.5 8.77 5.36 1.11 182.5 147.6 157.3 43.9 10.3 11. 12/15/14 8/14/15 Northwest Bancshares, Inc. LNB Bancorp Inc. Lorain, OH 1,241.1 7.47 6.80 1.85 180.7 157.2 198.3 23.9 11.2 12. 12/8/14 5/31/15 IBERIABANK Corp. Georgia Commerce Bancshares Atlanta, GA 1,005.1 9.37 5.73 1.89 194.8 192.1 208.7 36.3 14.6 13. 11/21/14 5/1/15 MidWestOne Financial Grp Inc. Central Bancshares Inc. Golden Valley, MN 1,172.2 6.62 17.99 2.51 135.1 171.8 174.2 15.1 6.1 14. 10/27/14 3/31/15 IBERIABANK Corp. Old Florida Bancshares Inc. Orlando, FL 1,352.4 10.12 8.23 1.22 259.1 187.6 195.8 25.4 11.3 15. 9/8/14 6/19/15 BB&T Corp. Bank of Kentucky Finl Corp. Crestview Hills, KY 1,857.8 9.19 11.52 1.64 367.4 189.7 217.9 17.4 13.6 16. 7/31/14 2/10/15 Bank of the Ozarks Inc. Intervest Bancshares Corp. New York, NY 1,571.8 13.14 8.36 3.36 228.5 110.6 110.6 13.7 2.8 17. 7/15/14 1/2/15 TowneBank Franklin Financial Corp. Glen Allen, VA 1,095.2 22.20 4.67 5.52 278.4 111.2 114.5 23.1 NA 18. 5/8/14 10/31/14 Valley National Bancorp 1st United Bancorp Inc. Boca Raton, FL 1,738.4 10.03 3.37 1.71 312.8 127.0 186.6 36.1 11.5 19. 4/29/14 12/17/14 Southside Bancshares Inc. OmniAmerican Bancorp Inc. Fort Worth, TX 1,391.3 14.89 3.12 0.95 313.9 147.1 151.5 43.6 15.7 20. 1/21/14 7/1/14 Center Bancorp Inc. ConnectOne Bancorp Inc. Englewood Cliffs, NJ 1,243.2 10.45 8.96 1.08 239.7 179.0 184.6 21.8 14.7
Average 1,369.2 10.69 7.99 1.74 251.1 169.5 180.6 25.2 12.2 Median 1,341.5 10.08 7.48 1.54 234.1 171.6 185.6 23.1 12.4
(1) | | Source: SNL Financial |
13
Appendix: Conservative Assumptions
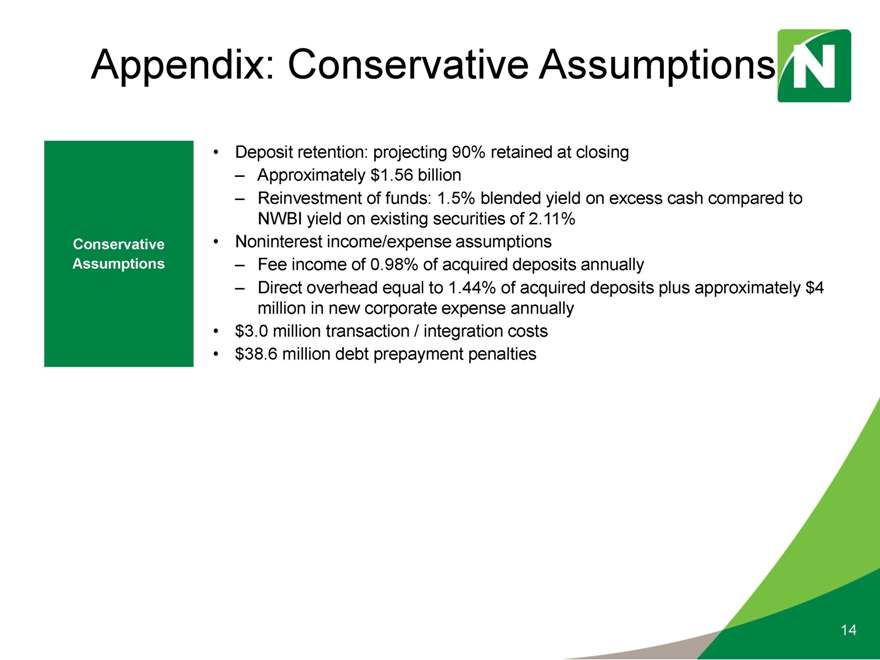
Deposit retention: projecting 90% retained at closing
– Approximately $1.56 billion
– Reinvestment of funds: 1.5% blended yield on excess cash compared to NWBI yield on existing securities of 2.11% Conservative • Noninterest income/expense assumptions Assumptions – Fee income of 0.98% of acquired deposits annually
– Direct overhead equal to 1.44% of acquired deposits plus approximately $4 million in new corporate expense annually
$3.0 million transaction / integration costs
$38.6 million debt prepayment penalties
14