$9,000,000,000 $8,000,000,000 $7,000,000,000 $6,000,000,000 $5,000,000,000 $4,000,000,000 $3,000,000,000 $2,000,000,000 $1,000,000,000 $0

From prior year March 31, December 31, From prior year (excluding UCB) Assets 2019 2018 $ Change % Change UCB $ Change % Change Total cash and marketable securities 957,251 893,004 64,247 7.2% Mortgage loans - one- to four- family 2,867,161 2,864,470 2,691 0.1% 5,574 (2,883) -0.10% Home equity loans and lines of credit 1,324,405 1,258,422 65,983 5.2% 85,853 (19,870) -1.58% Consumer loans 931,062 859,713 71,349 8.3% 622 70,727 8.23% Commercial real estate loans 2,799,309 2,471,821 327,488 13.2% 285,438 42,050 1.70% Commercial business loans 647,938 597,013 50,925 8.5% 30,353 20,572 3.45% A Total loans receivable 8,569,875 8,051,439 518,436 6.4% 407,840 110,596 1.37% Allowance for loan losses (55,721) (55,214) (507) 0.9% Loans receivable, net 8,514,154 7,996,225 517,929 6.5% Other assets 825,683 718,544 107,139 14.9% B Total assets $10,297,088 $ 9,607,773 689,315 7.2% 537,907 151,408 1.58% Liabilities and Shareholders' equity Liabilities Noninterest-bearing demand deposits $ 1,992,126 $ 1,736,156 255,970 14.7% 137,298 118,672 6.84% Interest-bearing demand deposits 1,583,049 1,455,460 127,589 8.8% 90,313 37,276 2.56% Money market demand accounts 1,778,806 1,661,623 117,183 7.1% 81,828 35,355 2.13% Savings deposits 1,711,216 1,636,099 75,117 4.6% 49,430 25,687 1.57% Time deposits 1,527,327 1,404,841 122,486 8.7% 120,510 1,976 0.14% C Total deposits 8,592,524 7,894,179 698,345 8.8% 479,379 218,966 2.77% Other liabilities 388,288 455,956 (67,668) (14.8%) Total liabilities 8,980,812 8,350,135 630,677 7.6% Total shareholders' equity 1,316,276 1,257,638 58,638 4.7% 43,289 15,349 1.22% Total liabilities and shareholders' equity $10,297,088 $ 9,607,773 689,315 7.2%
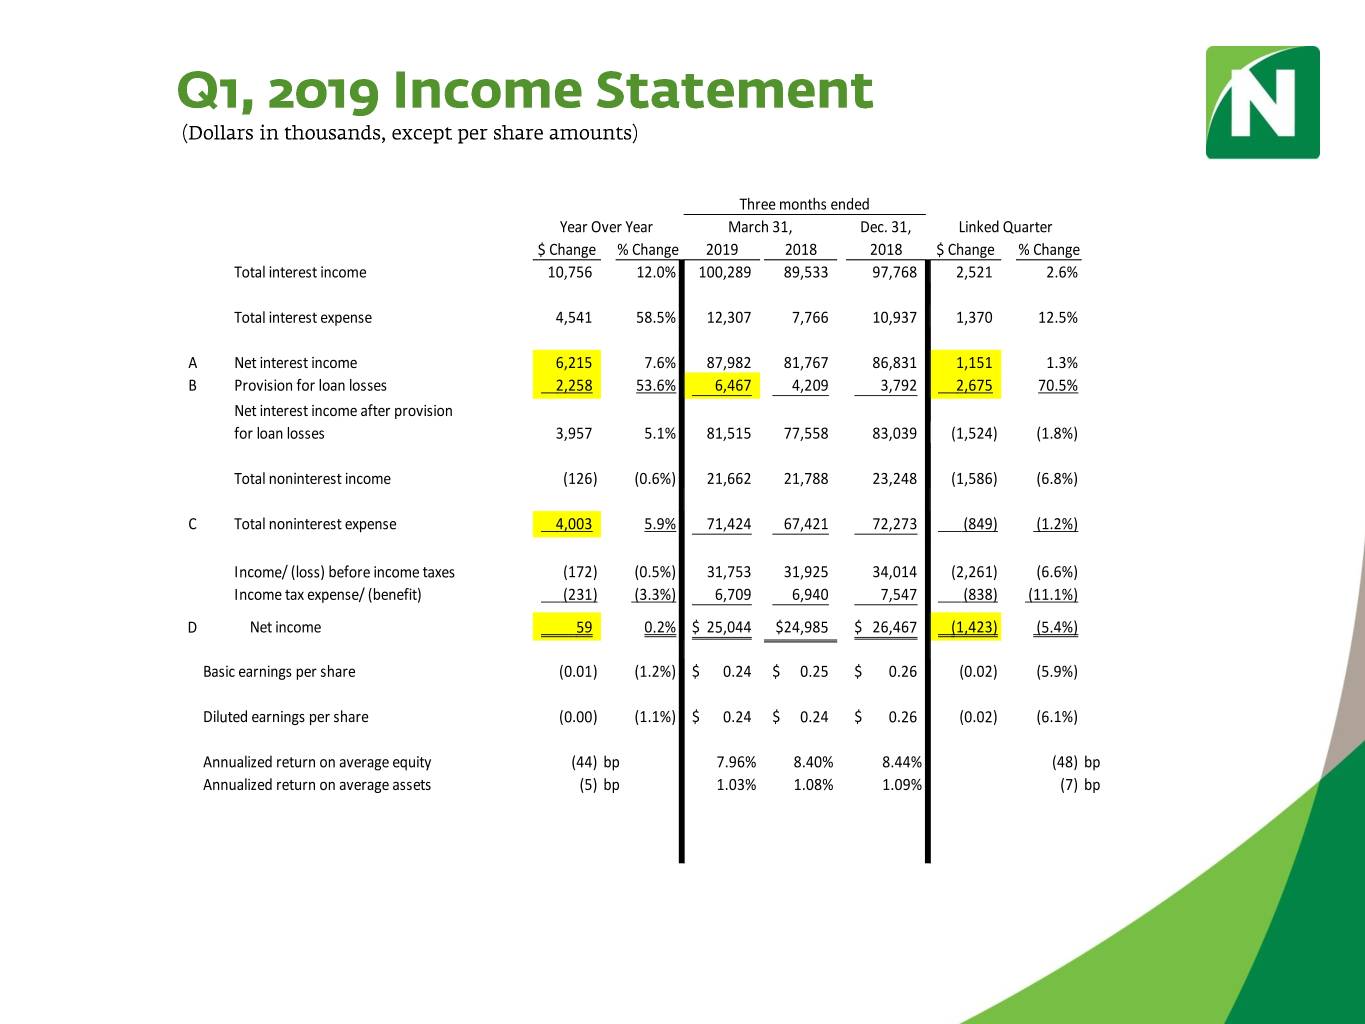
Three months ended Year Over Year March 31, Dec. 31, Linked Quarter $ Change % Change 2019 2018 2018 $ Change % Change Total interest income 10,756 12.0% 100,289 89,533 97,768 2,521 2.6% Total interest expense 4,541 58.5% 12,307 7,766 10,937 1,370 12.5% A Net interest income 6,215 7.6% 87,982 81,767 86,831 1,151 1.3% B Provision for loan losses 2,258 53.6% 6,467 4,209 3,792 2,675 70.5% Net interest income after provision for loan losses 3,957 5.1% 81,515 77,558 83,039 (1,524) (1.8%) Total noninterest income (126) (0.6%) 21,662 21,788 23,248 (1,586) (6.8%) C Total noninterest expense 4,003 5.9% 71,424 67,421 72,273 (849) (1.2%) Income/ (loss) before income taxes (172) (0.5%) 31,753 31,925 34,014 (2,261) (6.6%) Income tax expense/ (benefit) (231) (3.3%) 6,709 6,940 7,547 (838) (11.1%) D Net income 59 0.2% $ 25,044 $24,985 $ 26,467 (1,423) (5.4%) Basic earnings per share (0.01) (1.2%) $ 0.24 $ 0.25 $ 0.26 (0.02) (5.9%) Diluted earnings per share (0.00) (1.1%) $ 0.24 $ 0.24 $ 0.26 (0.02) (6.1%) Annualized return on average equity (44) bp 7.96% 8.40% 8.44% (48) bp Annualized return on average assets (5) bp 1.03% 1.08% 1.09% (7) bp

