0001471265us-gaap:FairValueInputsLevel2Memberus-gaap:FairValueMeasurementsRecurringMemberus-gaap:FederalHomeLoanMortgageCorporationCertificatesAndObligationsFHLMCMemberus-gaap:CollateralizedDebtObligationsMember2023-12-31
UNITED STATES SECURITIES AND EXCHANGE COMMISSION
Washington, D.C. 20549
FORM 10-K
☒ Annual Report Pursuant to Section 13 or 15(d) of the Securities Exchange Act of 1934.
For the Fiscal Year Ended December 31, 2024
OR
☐ Transition Report Pursuant to Section 13 or 15(d) of the Securities Exchange Act of 1934.
For the transition period from _____ to _____
Commission File No. 001-34582
NORTHWEST BANCSHARES, INC.
(Exact name of registrant as specified in its charter)
| | | | | | | | | | | | | | | | | |
| Maryland | | 27-0950358 |
| (State or other jurisdiction of incorporation or organization) | | (I.R.S. Employer Identification Number) |
| | | | | |
| 3 Easton Oval, | Suite 500, | Columbus, | Ohio | | 43219 |
| (Address of Principal Executive Offices) | | (Zip Code) |
(814) 726-2140
(Registrant’s telephone number)
Securities Registered Pursuant to Section 12(b) of the Act:
| | | | | | | | | | | | | | |
Title of each class | | Trading symbol(s) | | Name of each exchange on which registered |
| Common Stock, $0.01 Par Value | | NWBI | | The Nasdaq Stock Market, LLC |
Securities Registered Pursuant to Section 12(g) of the Act:
None
Indicate by check mark if the registrant is a well-known seasoned issuer, as defined in Rule 405 of the Securities Act. Yes ☒ No ☐
Indicate by check mark if the registrant is not required to file reports pursuant to Section 13 or Section 15(d) of the Act. Yes ☐ No ☒
Indicate by check mark whether the Registrant (1) has filed all reports required to be filed by Section 13 or 15(d) of the Securities Exchange Act of 1934 during the preceding twelve months (or for such shorter period that the Registrant was required to file such reports) and (2) has been subject to such requirements for the past 90 days. Yes ☒ No ☐
Indicate by check mark whether the registrant has submitted electronically every Interactive Data File required to be submitted pursuant to Rule 405 of Regulation S-T (§ 232.405 of this chapter) during the preceding 12 months (or for such shorter period that the registrant was required to submit such files). Yes ☒ No ☐
Indicate by check mark whether the registrant is a large accelerated filer, an accelerated filer, a non-accelerated filer, smaller reporting company, or an emerging growth company. See the definition of “large accelerated filer,” “accelerated filer,” “smaller reporting company,” and “emerging growth company” in Rule 12b-2 of the Exchange Act.
☒ Large accelerated filer ☐ Accelerated filer
☐ Non-accelerated filer ☐ Smaller reporting company
☐ Emerging growth company
If an emerging growth company, indicate by check mark if the registrant has elected not to use the extended transition period for complying with any new or revised financial accounting standards provided pursuant to Section 13(a) of the Exchange Act. ☐
Indicate by check mark whether the registrant has filed a report on and attestation to its management’s assessment of the effectiveness of its internal control over financial reporting under Section 404(b) of the Sarbanes-Oxley Act (15 U.S.C. 7262(b)) by the registered public accounting firm that prepared or issued its audit report. ☒
If securities are registered pursuant to Section 12(b) of the Act, indicate by check mark whether the financial statements of the registrant included in the filing reflect the correction of an error to previously issued financial statements. Yes ☐ No ☒
Indicate by check mark whether any of those error corrections are restatements that required a recovery analysis of incentive-based compensation received by any of the registrant’s executive officers during the relevant recovery period pursuant to §240.10D-1(b). Yes ☐ No ☒
Indicate by check mark whether the Registrant is a shell company (as defined in Rule 12b-2 of the Exchange Act). Yes ☐ No ☒
As of February 18, 2025, there were 127,514,857 shares outstanding of the Registrant’s Common Stock.
The aggregate market value of the voting and non-voting common equity held by non-affiliates of the Registrant, computed by reference to the last sale price on June 30, 2024, as reported by the Nasdaq Global Select Market, was approximately $1.347 billion.
DOCUMENTS INCORPORATED BY REFERENCE
Proxy Statement for the 2025 Annual Meeting of Shareholders of the Registrant (Part III).
TABLE OF CONTENTS
FORWARD-LOOKING STATEMENTS
This document contains forward-looking statements, which can be identified by the use of words such as “estimate,” “project,” “believe,” “intend,” “anticipate,” “plan,” “seek,” “expect” and words of similar meaning. These forward-looking statements include, but are not limited to:
•statements of our goals, intentions and expectations;
•statements regarding our business plans, prospects, growth and operating strategies;
•statements regarding the asset quality of our loan and investment portfolios;
•estimates of our risks and future costs and benefits; and
•certain plans and expectations relating to the Merger (as defined below) between the Company and Penns Woods (as defined below).
These forward-looking statements are based on current beliefs and expectations of our management and are inherently subject to significant business, economic and competitive uncertainties and contingencies, many of which are beyond our control. In addition, these forward-looking statements are subject to assumptions with respect to future business strategies and decisions that are subject to change.
The following factors, among others, could cause actual results to differ materially from the anticipated results or other expectations expressed in the forward-looking statements:
•the possibility that any of the anticipated benefits of the proposed Merger will not be realized or will not be realized within the expected time period; the risk that integration of Penns Woods operations with those of the Company will be materially delayed or will be more costly or difficult than expected; the Company’s and Penns Woods’ inability to meet expectations regarding the timing, completion and accounting and tax treatments of the Merger; the inability to complete the Merger due to the failure of Penns Woods’ shareholders to adopt the Merger Agreement (as defined below); the failure to satisfy other conditions to completion of the Merger, including receipt of required regulatory and other approvals; the failure of the proposed Merger to close for any other reason; the diversion of management’s attention from ongoing business operations and opportunities due to the Merger; the challenges of integrating and retaining key employees; the effect of the announcement of the Merger on the Company’s, Penns Woods’ or the combined company’s respective customer and employee relationships and operating results; the possibility that the Merger may be more expensive to complete than anticipated, including as a result of unexpected factors or events; the dilution caused by the Company’s issuance of additional shares of its common stock in connection with the Merger; and other factors that may affect the results of operations and financial condition of the Company, Penns Woods and the combined company
•inflation and changes in the interest rate environment that reduce our margins, our loan origination, or the fair value of financial instruments;
•changes in asset quality, including increases in default rates on loans and higher levels of nonperforming loans and loan charge-offs generally;
•changes in laws, government regulations or supervision, examination and enforcement priorities affecting financial institutions, including as part of the regulatory reform agenda of the Trump administration, as well as changes in regulatory fees and capital requirements;
•changes in federal, state, or local tax laws and tax rates;
•general economic conditions, either nationally or in our market areas, that are different than expected, including inflationary or recessionary pressures or those related to changes in monetary, fiscal, regulatory and tariff policies of the U.S. government, including policies of the U.S. Department of Treasury and Board of Governors of the Federal Reserve System (the “Federal Reserve Board”);
•adverse changes in the securities and credit markets;
•instability or breakdown in the financial services sector, including failures or rumors of failures of other depository institutions, along with actions taken by governmental agencies to address such turmoil;
•cyber-security concerns, including an interruption or breach in the security of our website or other information systems;
•technological changes that may be more difficult or expensive than expected;
•changes in liquidity, including the size and composition of our deposit portfolio, and the percentage of uninsured deposits in the portfolio;
•the ability of third-party providers to perform their obligations to us;
•competition among depository and other financial institutions, including with respect to deposit gathering, service charges and fees;
•our ability to enter new markets successfully and capitalize on growth opportunities;
•our ability to manage our growth internally and our ability to successfully integrate acquired entities, businesses or branch offices;
•changes in consumer spending, borrowing and saving habits;
•our ability to continue to increase and manage our commercial, including commercial real estate, and personal loans;
•possible impairments of securities held by us, including those issued by government entities and government sponsored enterprises;
•changes in the value of our goodwill or other intangible assets;
•the impact of the economy on our loan portfolio (including cash flow and collateral values), investment portfolio, customers and capital market activities;
•our ability to receive regulatory approvals for proposed transactions or new lines of business;
•the effects of any federal government shutdown or the inability of the federal government to manage debt limits;
•changes in the financial performance and/or condition of our borrowers;
•the effect of changes in accounting policies and practices, as may be adopted by the regulatory agencies, as well as the Securities and Exchange Commission (the “SEC”), the Public Company Accounting Oversight Board, the Financial Accounting Standards Board (“FASB”) and other accounting standard setters;
•changes in the level and direction of loan delinquencies and write-offs and changes in estimates of the adequacy of the allowance for credit losses;
•our ability to access cost-effective funding;
•the effect of global or national war, conflict, or terrorism;
•our ability to manage market risk, credit risk and operational risk;
•the disruption to local, regional, national and global economic activity caused by infectious disease outbreaks, and the significant impact that any such outbreaks may have on our growth, operations and earnings;
•the effects of natural disasters and extreme weather events;
•changes in our ability to continue to pay dividends, either at current rates or at all;
•our ability to retain key employees; and
•our compensation expense associated with equity allocated or awarded to our employees.
Because of these and other uncertainties, our actual future results may be materially different from the results indicated by these forward-looking statements. Please see “Item 1A. Risk Factors”.
Except as may be required by law, we disclaim any intention or obligation to update or revise any forward-looking statements, whether as a result of new information, future events or otherwise.
ITEM 1. BUSINESS
Northwest Bancshares, Inc.
Northwest Bancshares, Inc., a Maryland corporation, was incorporated in 2009 to be the successor corporation to Northwest Bancorp, Inc., the former stock holding company for Northwest Bank, upon completion of the mutual-to-stock conversion of Northwest Bancorp, MHC. The terms “Northwest”, “the Company”, “we”, “us” and “our” refer to Northwest Bancshares, Inc., unless indicated otherwise by the context.
The conversion was completed in 2009 when the Company sold 68,878,267 shares of common stock at $10.00 per share in the related offering. Concurrent with the completion of the offering, shares of Northwest Bancorp, Inc. common stock owned by public stockholders were exchanged for shares of Northwest Bancshares, Inc.’s common stock. We also issued 1,277,565 shares of common stock and contributed $1.0 million in cash from the offering proceeds to Northwest Charitable Foundation, a charitable foundation that we established for the benefit of the communities in which Northwest Bank operates. As of December 31, 2024, the Company had 127,508,003 shares outstanding and a market capitalization of approximately $1.682 billion.
Our executive offices are located at 3 Easton Oval, Suite 500, Columbus, Ohio 43219. We also maintain administrative offices located at 100 Liberty Street, Warren, Pennsylvania 16365. The telephone number for these addresses is (814) 726-2140.
The Company’s website (www.northwest.com) contains a direct link to Northwest Bancshares, Inc.’s filings with the SEC, including copies of annual reports on Form 10-K, quarterly reports on Form 10-Q, current reports on Form 8-K, and amendments to these filings, if any. Information on our website shall not be considered a part of this report. Copies of our filings may be obtained, without charge, by written request to Shareholder Relations, 100 Liberty Street, P.O. Box 128, Warren, Pennsylvania 16365, or emailing shareholderrelations@northwest.com.
Northwest Bank
Northwest Bank is a Pennsylvania-chartered savings bank headquartered in Warren, Pennsylvania, which is located in northwestern Pennsylvania. Northwest Bank is a community-oriented financial institution offering personal and commercial banking solutions, investment management and trust services. Northwest Bank’s mutual savings bank predecessor was founded in 1896.
As of December 31, 2024, Northwest Bank operated 141 community-banking locations throughout its market area in Pennsylvania, western New York, eastern Ohio, and Indiana. Our principal lending activities are the origination of loans secured by first mortgages on owner-occupied, one-to-four-family residences, shorter term consumer loans, and commercial business and commercial real estate loans.
Our principal sources of funds are personal and business deposits, borrowed funds and the principal and interest payments on loans and marketable securities. Our principal source of income is interest received on loans and marketable securities. Our principal expenses are the cost of employee compensation and benefits and the interest paid on deposits and borrowed funds.
Northwest Bank’s principal executive office is located at 100 Liberty Street, Warren, Pennsylvania 16365, and the telephone number at that address is (814) 726-2140.
Agreement to Acquire Penns Woods
On December 16, 2024, the Company and Penns Woods Bancorp, Inc., a Pennsylvania corporation (“Penns Woods”), entered into an Agreement and Plan of Merger (the “Merger Agreement”). The Merger Agreement provides for a business combination whereby Penns Woods will merge with and into the Company (the “Merger”), with the Company as the surviving corporation in the merger. Immediately after the effective time of the Merger (the “Effective Time”), or at such later time as the Company determines, Penns Woods’ wholly-owned subsidiary banks, Luzerne Bank, a Pennsylvania-chartered state bank, and Jersey Shore State Bank, a Pennsylvania-chartered state bank, will merge with and into Northwest Bank, with Northwest Bank as the surviving bank in the subsidiary bank mergers. The boards of directors of Northwest and Penns Woods have unanimously approved entry into the Merger Agreement and the transactions contemplated thereby.
Under the terms and subject to the conditions of the Merger Agreement, at the Effective Time, each share of Penns Woods’ common stock, $5.55 par value, issued and outstanding immediately prior to the Effective Time (except for Treasury Shares (as provided for in the Merger Agreement)), will be converted, in accordance with the procedures set forth in the Merger Agreement, into a right to receive 2.385 shares of common stock, $0.01 par value, of the Company.
Under the terms and subject to the conditions of the Merger Agreement, the Company agreed to fill the current vacancy on its Board of Directors (or otherwise expand its Board of Directors by one director and fill the resulting vacancy) with Penns Woods director, Richard A. Grafmyre, effective at the Effective Time and subject to the Company’s standard corporate governance practices and standard director evaluation process.
The Merger is expected to close in the third quarter of 2025, pending satisfaction of various closing conditions, including: (i) the receipt of Penns Woods’ shareholders adoption and approvals; (ii) authorization for listing on the Nasdaq Stock Market LLC of the shares of common stock of the Company to be issued in the Merger; (iii) the receipt of required regulatory approvals, including the approval of the Federal Reserve Board and the Pennsylvania Department of Banking and Securities; (iv) effectiveness of the registration statement on Form S-4 for the shares of common stock of the Company to be issued in the Merger; (v) the absence of any order, injunction or other legal restraint preventing or making illegal the completion of the Merger or any of the other transactions contemplated by the Merger Agreement.
Market Area and Competition
Northwest Bank is headquartered in northwestern Pennsylvania and has expanded primarily through acquisitions, into the southwestern and central regions of Pennsylvania, as well as western New York, northeastern Ohio, and Indiana. As of December 31, 2024, we operated 141 community banking locations across these market areas. All of the aforementioned market areas are served by a number of competing financial institutions. As a result, we encounter strong competition both in attracting deposits and in originating loans. Our most direct competition for deposits comes from other banks, brokerage houses and credit unions in our market areas. We expect continued competition from these financial institutions in the foreseeable future. With the continued acceptance of internet banking by our customers and consumers generally, competition for deposits has increased from institutions operating outside of our market area.
The following description of our market area is based upon information obtained from SNL Securities, the Bureau of Labor Statistics, the Federal Housing Financial Agency and the Mortgage Bankers Association.
Pennsylvania Market Area. Our retail branch network of 82 community banking offices within the Commonwealth of Pennsylvania encompasses 24 counties. Our western Pennsylvania market has a diverse economy driven by healthcare and education industries, service businesses, technology companies and small manufacturing operations. Our southeastern Pennsylvania market is primarily driven by service businesses but also serves as a bedroom community to the cities of Baltimore, Maryland and Philadelphia, Pennsylvania.
Our Pennsylvania market area has a total population of approximately 4.3 million and total households of approximately 1.8 million as of December 31, 2024. The Pennsylvania markets in which we operate our retail branches contain approximately half of Pennsylvania’s population and a similar percentage of households. These markets have experienced a 2.1% decrease in population between 2020 and 2024. As of December 31, 2024, the market’s average median household income has decreased over the last year by 2.1%, to $66,127, compared to the national median income level of $78,770. The household income growth rate in Pennsylvania of 7.8%, is projected to be slightly lower than the national average growth rates during the next five years of 8.8%. As of December 31, 2024, the market’s unemployment rate was 3.3%, slightly lower than both the Commonwealth of Pennsylvania rate of 3.6% and the national average of 4.1%.
As of September 30, 2024, the most recent date for which data is available, the House Price Index for the last four quarters in the state of Pennsylvania increased by 5.4%, compared to an increase in the national average of 4.3%. As of September 30, 2024, the foreclosure rate for mortgage loans on one-to-four unit residential properties in the state of Pennsylvania was one in every 7,424 housing units, compared to the national average of one in every 4,578 housing units.
Western New York Market Area. Our retail branch network of 28 community banking offices in New York encompasses four counties in the western portion of the state. This market has a diverse economy driven by healthcare and education industries, service businesses, technology companies and small manufacturing operations.
Our New York market area has a total population of approximately 2.0 million and total households of approximately 864,000 as of December 31, 2024. This area has experienced a decrease in population between 2020 and 2024, of 1.5%. The average median household income in this market increased by 5.6% over the last year to $69,253 as of December 31, 2024, compared to the national median income level of $78,770. As of December 31, 2024, the unemployment rate for our New York market area was 4.4%, compared to the national average of 4.1%.
As of September 30, 2024, the House Price Index for the last four quarters in our New York market increased by 7.0%, compared to an increase in the national average of 4.3%. As of September 30, 2024, the foreclosure rate for mortgage loans on one-to-four unit residential properties in the state of New York was one in every 4,829 housing units, compared to the national average of one in every 4,578 housing units.
Northeastern Ohio Market Area. Our retail branch network of 11 community banking offices in Ohio includes two counties in northeastern Ohio, including the Cleveland metro area. The major employment sectors in this market are similar to the contiguous market in western Pennsylvania.
Our Ohio market area has a total population of approximately 857,000 and total households of approximately 357,000 as of December 31, 2024. This area has experienced an increase in population between 2020 and 2024, of 2.3%. The median household income for our Ohio market increased 2.2% over the last year to $70,100 as of December 31, 2024, compared to the national median income level of $78,770. As of December 31, 2024, the unemployment rate for our Ohio market was 4.4%, compared to the national average of 4.1%.
As of September 30, 2024, the House Price Index for the last four quarters in our Ohio market area increased by 6.6%, compared to an increase in the national average of 4.3%. As of September 30, 2024, the foreclosure rate for mortgage loans on one-to-four unit residential properties in the state of Ohio was one in every 3,450 housing units, compared to the national average of one in every 4,578 housing units.
Indiana Market Area. Our retail branch network of 20 community banking offices in Indiana includes nine counties in Indiana. This market has a diverse economy driven by healthcare and education industries, service businesses, technology companies and small manufacturing operations.
Our Indiana market area has a total population of approximately 934,000 and total households of approximately 368,000 as of December 31, 2024. The population of this area has remained stable between 2020 and 2024. The median household income for our Indiana market increased 2.6% over the last year to $62,248 as of December 31, 2024, compared to the national median income level of $78,770. As of December 31, 2024, the unemployment rate for our Indiana market was 4.5%, compared to the national average of 4.1%.
As of September 30, 2024, the House Price Index for the last four quarters in our Indiana market area increased by 6.4%, compared to an increase in the national average of 4.3%. As of September 30, 2024, the foreclosure rate for mortgage loans on one-to-four unit residential properties in the state of Indiana was one in every 3,441 housing units, compared to the national average of one in every 4,578 housing units.
Lending Activities
General. Our principal lending activities are the origination of fixed and adjustable-rate loans collateralized by one-to-four-family residential real estate, shorter term consumer loans and loans collateralized by multi-family residential and commercial real estate as well as commercial business loans. Generally, we focus our lending activities in the geographic areas where we maintain offices.
In an effort to manage interest rate risk, we have sought to make our interest-earning assets more interest rate sensitive by originating adjustable-rate loans, such as adjustable-rate residential mortgage loans and home equity lines of credit, and by originating short-term and medium-term fixed-rate consumer loans. In recent years we have emphasized the origination of commercial real estate loans and commercial business loans, which generally have adjustable-rates of interest and shorter maturities than one-to-four-family residential real estate loans. Because we originate a substantial amount of long-term fixed-rate mortgage loans collateralized by one-to-four-family residential real estate, when possible, we originate and underwrite loans according to standards that allow us to sell them into the secondary mortgage market for purposes of managing interest-rate risk and liquidity. The sale of mortgage loans supports our strategy to grow the consumer and commercial loan portfolios faster than our portfolio of long-term fixed-rate residential mortgage loans. We currently sell low-yielding fixed-rate residential mortgage loans with maturities of more than 15 years, and on a more limited basis, those with maturities of 15 years or less, while retaining all adjustable-rate residential mortgage loans. With the build out of our Columbus, Ohio mortgage fulfillment center, our intention is to sell more loans into the secondary market on a servicing released basis. We also retain servicing on some of the mortgage loans we sell which generates monthly service fee income. We generally retain in our portfolio all consumer loans that we originate while we periodically sell participation loans in the multi-family residential, commercial real estate and commercial business loans that we originate in an effort to reduce the concentration of certain individual credits and the risk associated with certain businesses, industries or geographies.
Residential Mortgage Loans. We offer residential mortgage loans with terms typically ranging from 15 to 30 years, with either fixed or adjustable interest rates. Our mortgage loans are amortized on a monthly basis with both principal and interest due monthly. Originations of fixed-rate residential mortgage loans versus adjustable-rate residential mortgage loans are monitored on an ongoing basis. The percentage of adjustable-rate residential mortgage originations to total originations is affected significantly by the level of market interest rates, customer preference, our interest rate sensitivity and liquidity position, as well as loan products offered by our competitors. Therefore, even when our strategy is to increase the origination of adjustable-rate residential mortgage loans, market conditions may be such that there is greater demand for fixed-rate mortgage loans. Adjustable-rate residential mortgage loans totaled $95 million, or 1%, of our gross loan portfolio at December 31, 2024.
Our fixed-rate residential mortgage loan products offer fixed rates for up to 30 years. Whenever possible, our fixed-rate residential mortgages are originated and underwritten according to secondary mortgage market guidelines in order to manage credit risk, as well as interest rate risk and liquidity risk. Our adjustable-rate residential mortgage loans offer initial interest rate adjustment periods of five, seven, and ten years, terms up to 30 years and adjustments based on changes in designated market indices.
We generally limit the maximum loan-to-value on both fixed-rate and adjustable-rate residential mortgage loans without private mortgage insurance, to 80% of the lesser of appraised values or purchase prices of real estate serving as collateral for our mortgage loans. Limited special financing programs allow for insured loans with loan-to-value ratios of up to 97%, and uninsured loans with loan-to-value ratios up to 100%. The appraisal process is managed by the Northwest Appraising Department, and appraisals are performed by our in-house appraiser staff or by appraisers deemed qualified by our Residential Appraising Manager. We require fire and casualty insurance, as well as a title guaranty regarding good title, on all properties securing our residential mortgage loans. We also require flood insurance for loans secured by properties located within special flood hazard areas.
Included in our $3.2 billion portfolio of residential mortgage loans as of December 31, 2024 are construction loans of $7 million, or 0.2% of our gross loan portfolio. We offer fixed-rate and adjustable-rate residential construction-to-permanent loans primarily for the construction of owner-occupied one-to-four-family residences in our market area to owners who have a contract for construction. Construction loans are originated with terms of up to 30 years with an allowance of up to one year for construction. Advances are made as construction is completed, and interest is charged on the total amount of credit extended. At the end of the construction period, repayment terms convert to fully amortizing payments, with both principal and interest due monthly. Construction lending generally involves a greater degree of credit risk than permanent residential mortgage lending, as repayment of construction loans is often dependent upon the successful completion of construction projects. Construction delays or the inability of borrowers to sell properties once construction is completed may impair borrowers’ ability to repay loans. Private mortgage insurance is required for construction loans with loan-to-value ratios in excess of 80%, and the maximum loan-to-value ratio for construction loans is 95% of the lower of cost to build or as-completed appraised value.
In addition, we originate loans within our market area that are secured by individual unimproved or improved lots. Land loans for the construction of owner-occupied residential real estate properties are currently offered with fixed rates for terms of up to ten years. The maximum loan-to-value ratio for these loans is 80% of the as-completed appraised value.
Our residential mortgage loans customarily include due-on-sale clauses, which are provisions giving us the right to declare loans immediately due and payable in the event, among other things, borrowers sell or otherwise dispose of underlying real properties serving as collateral for loans.
Home Equity Loans and Lines of Credit. Generally, our home equity loans are secured by the borrower’s principal residence with a maximum loan-to-value ratio, including the principal balances of both the first and subordinate mortgage loans, of 95% or less. We generally underwrite home equity loans and lines of credit in a manner similar to our underwriting of residential mortgage loans.
Home equity loans are offered on a fixed-rate basis with amortized terms of up to 20 years. Principal and interest is due monthly. At December 31, 2024, our fixed-rate home equity loans totaled $722 million, or 6% of gross loans.
Home equity lines of credit are offered on an adjustable-rate basis with terms of up to 25 years, including a draw period of 10 years each. Although home equity lines of credit require interest-only payments during draw periods, they are underwritten using amortizing principal and interest payments based on current rates of equivalent fixed-rate products. The disbursed portion of home equity lines of credit totaled $423 million, or 4% of gross loans, with $728 million remaining undistributed as of December 31, 2024.
Other Consumer Loans. The principal types of other consumer loans we offer are direct and indirect automobile loans, sales finance loans, unsecured personal loans, credit card loans, and loans secured by investment accounts. These loans are typically offered with maturities of ten years or less.
The underwriting standards we employ for consumer loans include a determination of the applicant’s credit history and an assessment of ability to meet existing obligations and payments on the proposed loan. The stability of the applicant’s monthly income may be determined by verification of gross monthly income from primary employment, and additionally, from any verifiable secondary income. Creditworthiness of the applicant is of primary consideration; however, the underwriting process also includes a comparison of the value of the collateral in relation to the proposed loan amount for secured products.
Consumer loans entail greater credit risk than residential mortgage loans, particularly in the case of consumer loans that are unsecured or secured by assets that depreciate rapidly, such as automobiles, mobile homes, boats, and recreation vehicles. In such cases, repossessed collateral for a defaulted consumer loan may not provide an adequate source of repayment for the outstanding loan and the remaining deficiency often does not warrant further substantial collection efforts against the borrower. In particular, amounts realizable on the sale of repossessed automobiles may be significantly reduced based upon the condition of the automobiles and the lack of demand for used automobiles. At December 31, 2024, other consumer loans totaled $1.9 billion, or 17% of gross loans.
Commercial Real Estate Loans. Our multi-family commercial real estate loans are secured by multi-family residences, such as rental properties, student housing, and senior living facilities. Our other commercial real estate loans are secured by nonresidential properties such as hotels, commercial offices, medical buildings, manufacturing facilities and retail establishments. At December 31, 2024, a significant portion of our multi-family commercial real estate and commercial real estate loans were secured by properties located within our market area.
Our largest commercial loan relationship, including commercial real estate, had an aggregate total exposure of $114.1 million as of December 31, 2024. The largest component of this exposure is attributed to loans secured by student housing, which comprised $53.3 million of exposure at December 31, 2024, which additional loans secured by multi-family residential, commercial office, hotel and retail buildings. This relationship is also our largest commercial real estate loan relationship as of December 31, 2024, with $112.5 million of the exposure attributed to commercial real estate loans. All of the underlying loans were performing in accordance with their terms as of December 31, 2024.
Multi-family commercial and commercial real estate loans are offered with both adjustable and fixed interest rates. The terms of each multi-family residential and commercial real estate loan are negotiated on a case-by-case basis. We generally originate multi-family commercial and commercial real estate loans in amounts up to 80% of the appraised value of the property collateralizing the loan. At December 31, 2024, commercial real estate loans totaled $2.9 billion, or 26% of gross loans.
Loans secured by multi-family commercial and commercial real estate generally involve a greater degree of credit risk than residential mortgage loans and carry larger loan balances. This increased credit risk is a result of several factors, including the concentration of principal in a limited number of loans and borrowers, the effects of general economic conditions on income producing properties, and the increased difficulty of evaluating and monitoring these types of loans. Furthermore, the repayment of loans secured by multi-family commercial and commercial real estate is typically dependent upon the successful operation of the related real estate property. If the cash flow from the project is reduced, the borrower’s ability to repay the loan may be impaired.
Commercial Loans. We offer commercial loans to finance various activities in our market area, some of which are secured in part by additional real estate collateral. At December 31, 2024, our largest commercial loan relationship had an aggregate total exposure of
$65.0 million, and operates in the manufacturing space. These loans were performing in accordance with their agreed upon terms as of December 31, 2024.
Commercial business loans are offered with both fixed and adjustable interest rates. Underwriting standards we employ for commercial business loans include a determination of the applicant’s ability to meet existing obligations and payments on the proposed loan from operating cash flows generated by the applicant’s business. The financial strength of each applicant is also assessed through a review of financial statements provided by the applicant.
We originate commercial loans through our network of Small Business and Commercial Loan Officers located in our areas. In addition, our Commercial Finance group originates loans where multiple banks may be involved in the credit facilities. These loans are made to companies operating in our market area. Many of these companies carry public debt ratings.
Commercial loans generally have higher interest rates than residential loans, but they also may involve a higher risk of default since their repayment is generally dependent on the successful operation of the borrower’s business. We strive to obtain personal guarantees from the borrower or a third party as a condition to originating commercial loans. At December 31, 2024, commercial loans totaled $2.0 billion, or 18% of gross loans.
Loan Originations, Solicitation, Processing and Commitments. Upon receiving a retail loan application, we obtain a credit report and may verify employment to confirm specific information relating to the applicant’s employment, income, and credit standing. In the case of a real estate loan, either an in-house appraiser, or an approved external appraiser, appraises the real estate intended to secure the proposed loan. For certain home equity loans we may use an approved alternative valuation such as an assessed value or Automated Value Model (AVM). A loan underwriter checks the loan document file for accuracy and completeness and verifies the information provided.
For our personal loans, including residential mortgage loans, home equity loans and lines of credit, automobile loans and credit cards and other unsecured loans, we have implemented a credit approval process based on a laddered individual loan authority system. Real estate secured loans are underwritten centrally by our underwriting team. Non-real estate loans are underwritten by local loan officers and/or a centralized underwriting team who are granted various levels of authority based on their lending experience and expertise. These authority levels are reviewed by the Credit Committee on at least an annual basis.
For commercial loans, aggregate credit exposures over $1.0 million are underwritten by Commercial Credit Management. Our commercial loan policy assigns individual lending limits for our various commercial credit underwriters and dual authority consisting of an individual from Commercial Credit Management and Credit Risk Officers. Lending authorities are established by the Credit Committee. The Senior Loan Committee meets weekly to approve extensions of credit in excess of the maximum dual authority limits. The Credit Committee meets monthly to review the assigned lending limits and to monitor our lending policies, loan activity, economic conditions, and concentrations of credit.
The Northwest Credit Committee has established a policy to make no loans, either individually or in the aggregate to one borrower or single source of repayment (the “Total Credit Exposure Limit”), in excess of $30.0 million. For loans originated and managed within the Corporate Finance portfolio, the Total Credit Exposure limit is increased to $50.0 million for borrowers with a strong credit profile and a risk rating of 3 or better. The Aggregate Credit Exposure, which represents total relationship exposure which may include multiple distinct borrowers, limit is $100.0 million. Criticized/classified loans exceeding $5.0 million or unusual loan requests are reviewed with the Risk Management Committee of the Board of Directors at each quarterly meeting. In addition, the Chief Credit Officer has the authority to require that the Board of Directors review any loan that has been approved by the Senior Loan Committee with which the Chief Credit Officer has specific concerns.
After a loan is approved, a loan commitment letter is promptly issued to the borrower. At December 31, 2024, we had commitments to originate $190 million of loans.
Loan Origination Fees and Costs. We defer loan origination fees received from borrowers and costs to originate loans and amortize such amounts as an adjustment of yield over the life of the loan by using the level yield method. Deferred loan fees and costs are recognized as part of interest income immediately upon prepayment or the sale of the related loan. At December 31, 2024, we had $63 million of net deferred loan origination fees. Loan origination fees vary with the volume and type of loans and commitments originated and purchased, principal repayments, and competitive conditions in the marketplace.
Loan origination costs were $16.3 million, $16.4 million and $18.2 million for the years ended December 31, 2024, 2023 and 2022, respectively.
Loans-to-One Borrower. As of December 31, 2024, the largest aggregate amount loaned to one borrower, or related borrowers, totaled $114.1 million in exposure and was secured by student housing, multi-family residential, commercial office, hotel, and retail
buildings. Our second largest lending relationship totaled $65.8 million in exposure and was secured by office space, and medical facilities. Our third largest commercial relationship totaled $65.0 million in exposure and was secured by business assets. Our fourth largest commercial relationship totaled $60.0 million in exposure and was secured by non-marketable securities. Our fifth largest commercial relationship totaled $58.6 million in exposure and was secured by a nursing home. All of these loans were performing in accordance with their terms at December 31, 2024.
Investment Activities
Our Board of Directors has primary responsibility for establishing and overseeing our investment policy. The Board of Directors has delegated authority to implement the investment policy to our Chief Financial Officer. The investment policy is reviewed at least annually, and any changes to the policy are subject to approval by the Board of Directors. The overall objectives of the investment policy are to maintain a portfolio of high quality and diversified investments, to provide liquidity, and to control interest rate risk while providing an acceptable return. The investment portfolio is also used to provide collateral for qualified deposits and borrowings, to provide additional earnings when loan production is low, and to reduce our tax liability. The policy dictates that investment decisions give consideration to the safety of principal, liquidity requirements and potential returns.
Our investment policy does permit the purchase of complex securities, derivatives and other high-risk securities as long as the investment has a pre-purchase sensitivity analysis completed and the results are within our our established range. The policy does not permit additional investments in pooled trust preferred securities, or single issuer trust preferred securities.
At the time of purchase, we designate a security as either held-to-maturity or available-for-sale based upon our ability and intentions. Securities available-for-sale are carried at fair value and securities held-to-maturity are carried at amortized cost. On a quarterly basis, we measure expected credit losses on held-to-maturity debt securities on a collective basis by major security type. Available-for-sale debt securities in an unrealized loss position are reviewed for impairment at least quarterly. If impairment exists, credit related impairment losses are recorded through an allowance for credit losses while noncredit related impairment losses are recorded in accumulated other comprehensive income (for available-for-sale securities). The fair values of our securities are based on published or securities dealers’ market values, when available. See Note 4 to the Consolidated Financial Statements for a detailed analysis and description of our investment portfolio and valuation techniques.
We purchase debentures and mortgage-backed securities that generally are issued by the Federal Home Loan Bank (“FHLB”), Fannie Mae (“FNMA”), Freddie Mac (“FHLMC”) or Ginnie Mae (“GNMA”). Historically, we have invested in mortgage-backed securities to achieve positive interest rate spreads with minimal administrative expense and to lower our credit risk as a result of the guarantees provided by FHLMC, FNMA or GNMA.
Sources of Funds
General. Deposits are the primary funding source for lending and other investing purposes. In addition to deposits, we derive funds from the amortization, prepayment and sale of loans and mortgage-backed securities, the maturity of investment securities, operations and, if needed, borrowings. Scheduled loan principal repayments are a relatively stable source of funds, while deposit inflows and outflows and loan prepayments and sales are influenced significantly by general interest rates and market conditions. Borrowings may be used on a short-term basis to compensate for reductions in the availability of funds from other sources or on a longer-term basis for general business purposes, including to manage interest rate risk.
Deposits. Personal and business deposits are generated from our market area by offering a broad selection of deposit instruments including checking accounts, savings accounts, money market deposit accounts, term certificate accounts and individual retirement accounts. While we accept deposits of $250,000 or more, we do not offer premium rates for such deposits. In addition, we purchased $200.0 million of brokered certificates of deposit as of December 31, 2024. Deposit account terms vary according to the minimum balance required, the period of time during which the funds must remain on deposit, and the interest rate, among other factors. We regularly execute changes in our deposit rates based upon general market interest rates, competition, and liquidity requirements. As of December 31, 2024, $1.9 billion, or 16%, of total deposits were uninsured as they exceeded the FDIC’s $250,000 limit of deposit insurance per depositor, per FDIC-insured bank, per account ownership category.
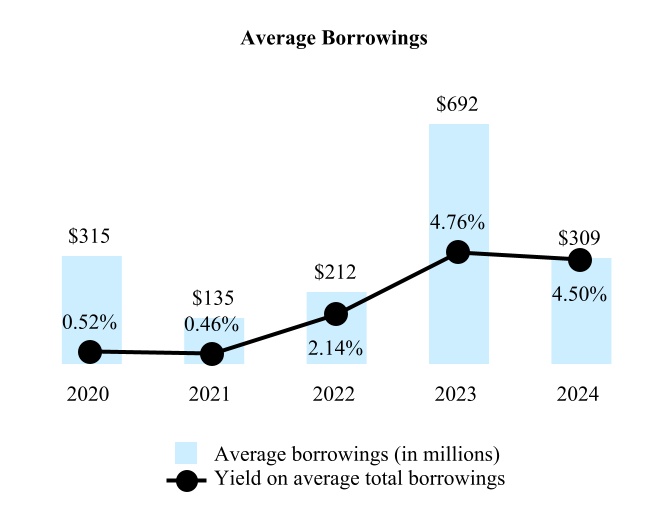
Borrowings. We may utilize borrowings to supplement our supply of lendable funds and to meet deposit withdrawal requirements. Borrowings from the FHLB of Pittsburgh typically are collateralized by a portion of our real estate loans. In addition to the FHLB, we have borrowing facilities with the Federal Reserve Bank of Cleveland and two correspondent banks. We also borrow funds, in the form of corporate repurchase agreements, from municipalities, corporations and school districts.
Northwest Bank is a member of the FHLB of Pittsburgh. The FHLB functions as a central bank providing credit for Northwest Bank and other member financial institutions. As a member, Northwest Bank is required to own capital stock in the FHLB of Pittsburgh and is authorized to apply for borrowings on the security of certain of its real estate loans, provided certain standards related to
creditworthiness have been met. Borrowings are made pursuant to several different programs. Each credit program has its own interest rate and range of maturities. Depending on the program, limitations on the amount of borrowings are based either on a fixed percentage of a member institution’s net worth or on the FHLB’s assessment of the institution’s creditworthiness.
On September 9, 2020, the Company issued $125 million of 4.00% fixed-to-floating rate subordinated notes with a maturity date of September 15, 2030. The subordinated notes, which qualify as Tier 2 capital, bear interest at an annual rate of 4.00%, payable semi-annually in arrears commencing on March 15, 2021, and a floating rate of interest equivalent to the 3-month Term Secured Overnight Financing Rate (“SOFR”) plus 3.89% payable quarterly in arrears commencing on December 15, 2025. During the year ended December 31, 2024, the Company had $114.8 million of subordinated notes outstanding. The subordinated debt issuance costs of approximately $1.8 million are being amortized over five years on a straight-line basis into interest expense.
Risk Management
General. Our Enterprise Risk Management (ERM) program is designed to ensure that significant risks are identified, measured, monitored and addressed. Our ERM program reflects our risk appetite, governance, culture and reporting. We manage enterprise risk using our Board-approved Risk Management Policy, which includes Board-level oversight, risk management committees, and a dedicated risk management team led by our Chief Risk Officer (CRO). Our Board determines the level of risk we are willing to accept in pursuit of our objectives, through the ERM program and well-defined risk appetite statements developed thereunder. We utilize the “three lines of defense” risk management model to assign roles, responsibilities and accountabilities for taking and managing risk.
Board and Board Committees. Our Board of Directors, as a whole and through its committees, maintains responsibility for the oversight of risk management, including monitoring the “tone at the top”, adherence to our risk appetite, our risk culture and overseeing emerging and strategic risks. Our Board’s Risk Management Committee (BRMC) has primary responsibility for oversight of enterprise risk management. The BRMC consists entirely of independent directors and provides a regular report to the full Board regarding matters reviewed at it’s Committee meetings. The Bank has a comprehensive Enterprise Risk Management Policy, approved by the Board of Directors.
Risk Management Roles and Responsibilities. In addition to our Board and Board Committees, responsibility for risk management also flows to other individuals and entities throughout the Company, including various management committees and executive management. Our Enterprise Risk Management Policy defines our “three lines of defense” risk management model, which includes the following:
•The “first line of defense” is comprised of the business areas that engage in activities that generate revenue or provide operational support or services that introduce risk to the Company. The first line of defense is responsible for, among other things, identifying, owning, managing and controlling key risks associated with their activities, timely addressing issues and remediation, and implementing processes and procedures to strengthen the risk and control environment. The first line of defense identifies and manages key risk indicators and risks and controls consistent with the Company’s risk appetite. The executive officers who serve as leaders in the “first line of defense,” are responsible for ensuring that their respective functions operate within established risk limits, in accordance with our risk appetite. These leaders are also responsible for identifying risks, considering risk when developing strategic plans, budgets and new products, and implementing appropriate controls when pursuing business strategies and objectives. In addition, these leaders are responsible for deploying sufficient financial resources and qualified personnel to manage the risks inherent in our business activities.
•The “second line of defense” includes an independent risk management team charged with oversight and monitoring of risk within the business. The second line of defense is responsible for, among other things, formulating and overseeing our Enterprise Risk Management Policy and related policies and procedures, effectively challenging the first line of defense and identifying, measuring, monitoring and reporting on aggregate risks of the business and support functions.
Our risk management team, which is led by our CRO, provides oversight of our risk profile and is responsible for maintaining a compliance program that includes compliance risk assessments, policy development, testing and reporting activities.
The CRO manages our risk management team and is responsible for establishing and implementing standards for the identification, management, measurement, monitoring and reporting of risk on an enterprise-wide basis. The CRO is responsible for developing an appropriate risk appetite with corresponding limits that aligns with supervisory expectations and proposing our risk appetite to the Board of Directors. The CRO regularly reports to the Board Risk Management Committee as well as the Bank’s Enterprise Risk Management Committee (“ERMC”) on risk management matters.
•The “third line of defense” is comprised of the Internal Audit organization. The third line of defense provides an independent review and objective assessment of the design and operating effectiveness of the first and second lines of defense, governance, policies, procedures, processes and internal controls, and reports its findings to executive management and the Board, through the Audit Committee. Internal Audit is responsible for performing periodic, independent reviews and testing compliance with the Company’s and the Bank’s risk management policies and standards, as well as with regulatory guidance and industry best practices. Internal Audit also assesses the design of the Company’s and the Bank’s policies and standards and validates the effectiveness of risk management controls and reports the results of such reviews to the Audit Committee.
Management Committees. The ERMC is the highest-management-level committee at the Bank to oversee risks and is responsible for risk governance and oversight and makes recommendations on the Bank’s risk appetite. The ERMC monitors compliance with limits and related escalation requirements and oversees implementation of risk policies.
In addition to the ERMC, we maintain the following management-level committees to oversee our risk categories: Compliance Risk Management Committee; Credit Committee; Model Risk Management Committee; Operational Risk Management Committee; and the Asset/Liability Committee. Each of these Committees is responsible for one or more of the Bank’s eight risk categories, which are described in greater detail below under the heading “Risk Categories”. For its risk category(ies) of responsibility, each Committee provides risk governance, risk oversight and monitoring. Each Committee reviews key risk exposures, trends and significant compliance matters, and provides guidance on steps to monitor, control and escalate significant risks. We include the risk information provided by the ERMC, and these management-level risk committees, along with additional risk information that is identified at the holding company level in our determination and assessment of the risks that are presented to and discussed with our Board and Board Committees.
Risk Categories. We evaluate the potential impact of a risk event on us by assessing the customer, partner, financial, reputational, and legal and regulatory impacts and have divided risk into the following categories.
Compliance Risk. Risk arising from violations of consumer protection laws and/or or regulations, and/or nonconformance with policies and procedures. This risk exposes Northwest to regulatory enforcement actions, fines, civil money penalties, customer reimbursement, and/or statutory or punitive damages. This can further result in diminished reputation, limited business opportunities, and/or merger and acquisition restrictions.
Our Compliance organization is responsible for establishing and maintaining our Compliance Management System. We seek to manage and mitigate compliance risk by assessing, controlling, monitoring, measuring and reporting the legal and regulatory risks to which we are exposed. The Compliance Risk Management Committee, chaired by the Chief Compliance Officer, oversees the implementation and execution of the Compliance Management System and monitors compliance exposures to manage compliance risks.
Credit Risk. Risk arising from an obligor’s failure to meet the terms of any contract or otherwise perform as agreed. Credit Risk is found in all activities in which settlement or repayment depends on counterparty, issuer, or borrower performance. We are exposed to credit risk on the loans we make to our customers. Our credit risk relates to the risk that our borrowers will not repay their loan balances. To minimize our risk of loan write-offs, we have developed policies and procedures outlining our underwriting guidelines across all loan types. The loan policies contain guidance and establish requirements specific to loan types for each line of business. They also establish appropriate and accurate financial information requirements to assist in making loan decisions, which may vary based on loan type, risk profile and secondary investor requirement, if applicable. Loan portfolios of all types are monitored as part of ongoing independent credit review and administration functions which ensure underwriting quality, loan administration, collateral, diversity (by industry, geography, products and borrowers) adhere to policy requirements. The credit risk on our loan portfolio is quantified through our allowance for credit losses which is recorded net within loans on our Consolidated Balance Sheets. Credit risk is overseen and monitored by the Credit Committee.
Market Risk. Risk of financial loss arising from adverse changes in markets, primarily in interest rates. Movements in interest rates have the potential to adversely affect net interest income and the market value of assets and liabilities.
Our principal market risk exposures arise from volatility in interest rates and their impact on earnings and capital. While we use various techniques to analyze, measure, assess and manage the financial impact of changes in interest rates, we believe an interest rate sensitivity analysis best reflects the risk inherent in our business. The interest rate sensitivity analysis calculates the impact on net interest income from instantaneous and sustained increases or decreases in market interest rates. Actual changes in our net interest income will depend on many factors, and therefore may differ from our estimated risk to changes in interest rates. The Asset/Liability Committee assists the Board of Directors and bank management in overseeing, reviewing, and monitoring market and treasury risk.
Model and Data Risk. Refers to the potential for adverse consequences from business decisions based on incorrect or misused model or tool outputs and reports. This risk can lead to financial loss, poor business and strategic decision making and reputational damage. This risk may result from (1) input errors, including inaccurate or unrepresentative data; (2) design flaws resulting in inaccurate calculations, valuations, estimates, or forecasts; or (3) incorrect or improper usage or a misunderstanding about a model’s limitations and assumptions.
We manage model risk through a comprehensive model governance framework, including policies and procedures for model development, maintenance and performance monitoring activities, independent model validation and change management capabilities. We also assess model performance on an ongoing basis. Model and Data risk oversight and monitoring is conducted by the Model Risk Management Committee.
Operational Risk. Risk arising from failed internal processes, people, and systems or from adverse external events. Operational losses result from internal fraud, external fraud, business disruptions and system failures, damage to physical assets, inadequate or inappropriate employment practices and workplace safety, improper customer products and business practices, and failures in execution, delivery, and process management.
Operational risk is inherent in all business activities and can impact us through direct or indirect financial loss, brand damage, customer dissatisfaction, and legal and regulatory penalties. We have implemented an operational risk framework that is defined in the Operational Risk Management Policy. The Operational Risk Management Committee, chaired by our Chief Operational Risk Officer, oversees and monitors operational risk exposures, including escalating issues and recommending policies, procedures and practices to manage operational risks.
Additionally, we maintain a cybersecurity program, which is led by our Chief Information Security Officer (“CISO”). For more information, see Item 1C. Cybersecurity.
Treasury Risk. Risk arising from the inability to meet payment obligations in full and on time when they become due, whether caused by an inability to access funding sources or manage fluctuations in cash flows.
Our primary Treasury objective is to maintain a liquidity profile that will enable us, even in times of stress or market disruption, to fund our existing assets and meet liabilities in a timely manner and at an acceptable cost. Policy and risk appetite limits require us to ensure that sufficient liquid assets are available to survive liquidity stresses over a specified period if time. The Asset/Liability Committee assists the Board of Directors, as well as management, in overseeing, reviewing, and monitoring treasury risk.
Reputational Risk. Risk arising from negative public opinion. This risk may impair competitiveness by affecting the ability to establish new relationships or services or continue servicing existing relationships. Reputational risk is inherent in all of Northwest’s activities and requires management to exercise an abundance of caution in dealing with stakeholders, including customers, investors, employees, and the community.
Executive management is responsible for considering the Reputational risk implications of business activities and strategies and ensuring the relevant subject matter experts are engaged as needed.
Strategic Risk. Risk arising from events or business decisions that may prevent Northwest from achieving its strategic objectives. Examples of strategic risk include adverse business decisions, poor implementation of business decisions, or the inability to adapt to changes in the economic competitive environment. This risk is a function of a bank’s strategic goals and business strategies.
Subsidiary Activities
Northwest Bancshares, Inc.’s sole direct consolidated subsidiary is Northwest Bank. Northwest Bancshares, Inc. also owns all of the common stock of seven statutory business trusts: Northwest Bancorp Capital Trust III, a Delaware statutory business trust, Northwest Bancorp Statutory Trust IV, a Connecticut statutory business trust, LNB Trust II, a Delaware statutory business trust, Union National Capital Trust I, a Delaware statutory business trust, Union National Capital Trust II, a Delaware statutory business trust, MFBC Statutory Trust I, a Delaware statutory business trust, and Universal Preferred Trust, a Delaware statutory business trust (the “Trusts”). At December 31, 2024, the Trusts have issued a total of $129 million of trust preferred securities. The Trusts are not consolidated with Northwest Bancshares, Inc. At December 31, 2024, Northwest Bancshares, Inc.’s investment in the Trusts totaled $4 million, and the Trusts had assets of $130 million, net of discounts due to fair value adjustments made at the time of acquisition of Union Community Bank and MutualFirst Financial, Inc.
At December 31, 2024, Northwest Bank had three active wholly-owned subsidiaries; Great Northwest Corporation, Northwest Capital Group, Inc., and Mutual Federal Interest Corporation. For financial reporting purposes all of these companies are included in the Consolidated Financial Statements of Northwest Bancshares, Inc.
Great Northwest Corporation holds equity investments in government-assisted, low-income housing projects in various locations throughout our market area. At December 31, 2024, Northwest Bank had an equity investment in Great Northwest Corporation of $14.4 million. For the year ended December 31, 2024, Great Northwest Corporation had net income of $178,000, generated primarily from federal low-income housing tax credits.
Northwest Capital Group, Inc.’s principal activity is to own, operate and ultimately divest of properties that were acquired in foreclosure. At December 31, 2024, Northwest Bank had an equity investment of $11.6 million in Northwest Capital Group, Inc., with a $28,000 net loss reported for the year ended December 31, 2024.
Mutual Federal Interest Corporation, which is a Nevada corporation, holds and manages a portion of the Northwest Bank investment portfolio and consumer closed-end first mortgage loans. At December 31, 2024, Northwest Bank had an equity investment in Mutual Federal Interest Corporation of $1.550 billion. For the year ended December 31, 2024, Mutual Federal Interest Corporation had net income of $11.3 million.
Northwest Bank strategically ceased operating several business lines in prior periods.
Northwest Settlement Agency, LLC provided title insurance to borrowers of Northwest Bank and other lenders. At December 31, 2024, Northwest Bank had an equity investment in Northwest Settlement Agency, LLC of $3.7 million.
Allegheny Services, Inc. was a Delaware investment company that held mortgage loans originated through our wholesale lending operation as well as municipal bonds. At December 31, 2024, Northwest Bank had an equity investment in Allegheny Services, Inc. of $876.2 million.
The Bert Company (doing business as Northwest Insurance Services), was an employee benefits and property and casualty insurance agency specializing in commercial and personal insurance as well as retirement benefit plans and was sold during the second quarter of 2021. At December 31, 2024, Northwest Bank had an equity investment of $29.2 million in The Bert Company.
Northwest Advisors, Inc., a federally registered investment advisor, which provided investment management programs and investment portfolio planning services, ceased operations and became inactive during 2018. At December 31, 2024, Northwest Bank had an equity investment in Northwest Advisors, Inc. of $819,000.
Northwest Financial Services, Inc. provided retail brokerage services and became inactive during the fourth quarter of 2017. At December 31, 2024, Northwest Bank had an equity investment in Northwest Financial Services of $9.5 million.
On July 14, 2017, Northwest Consumer Discount Company, Inc. became inactive as all consumer finance offices were closed. At December 31, 2024, Northwest Bank had an equity investment in Northwest Consumer Discount Company of $44.3 million.
Human Capital Management
Workforce Demographics. As of December 31, 2024, we had 1,884 full-time and 143 part-time employees, or 1,956 full-time equivalent employees (“FTEs”). This represents a decrease of 142 FTEs, or 6.8%, from December 31, 2023 when we had 2,030 full-time and 135 part-time employees, or 2,098 FTEs. This decrease is a result of our efforts to optimize our retail network. As a financial institution, approximately 41% of our employee population are employed at our 130 full-service banking offices and eleven free-standing drive-up locations across Pennsylvania, New York, Ohio, and Indiana, and approximately 3% are employed at our customer call centers. Our annual turnover rate (voluntary and involuntary) was 29.6% as of December 31, 2024. None of our employees are represented by a collective bargaining group.
As a community-based bank, our reputation is an extremely valuable and important component of our business. We strive to conduct our business in a manner that enhances our reputation. This is done, in part, by recruiting, hiring and retaining employees who share our core values of being an integral part of the communities we serve.
Inclusion and Workplace Environment. At Northwest Bank, we know that in order to succeed, we must create and maintain an environment where all employees, whatever their background or role, can contribute, innovate and thrive. We are committed to foster a workplace where we all feel accepted, seen and heard. One way we have engaged our entire employee population is through our 5 Employee Resource Groups (ERGSs). This has provided an opportunity to leverage diverse talents and perspectives.
Workforce Health and Safety. The health and safety of our employees, their families and the communities we serve is our top priority. In order to maintain safety in the workplace, Northwest Bank has an inclusive Safety Focus Group that includes various levels of positions up through senior leadership. The committee was established in order to encourage employee involvement and highlight the importance of safety in the workplace.
Compensation and Benefits. Our compensation program is designed to attract and retain talented individuals to support our business objectives and achieve our strategic goals. We provide employees with compensation packages that include base salaries, and if eligible, incentive compensation, annual bonuses, and equity incentives. In addition, we also offer employees a 401(k) plan with an employer match contribution, medical, dental, vision, disability, life, wellness plan, employee assistance plan, flexible work arrangement, paid time off, flexible spending accounts, and voluntary benefits.
SUPERVISION AND REGULATION
General
As a bank holding company, the Company is required to comply with the rules and regulations of the Federal Reserve Board and is also required to file certain reports with, and subject to examination by, the Federal Reserve Board. Because it has $10 billion or more in total consolidated assets, the Company is subject to additional statutory and regulatory requirements, including enhanced risk management and corporate governance processes and examination and supervision for compliance with federal financial consumer protection laws by the Consumer Financial Protection Bureau (the “CFPB”). The Company is also subject to the disclosure and regulatory requirements of the Securities Act of 1933, as amended (the “Securities Act”) , and the Securities Exchange Act of 1934, as amended (the “Exchange Act”), both as administered by the SEC, as well as the rules of Nasdaq that apply to companies with securities listed on the NASDAQ Global Select Market.
The Company’s sole direct consolidated subsidiary is Northwest Bank. Northwest Bank is a Pennsylvania-chartered stock savings bank that is not a member of the Federal Reserve System and its deposit accounts are insured up to applicable limits by the FDIC’s Deposit Insurance Fund (the “DIF”). Northwest Bank is subject to extensive regulation by the Department of Banking and Securities of the Commonwealth of Pennsylvania (the “Department of Banking”), as its chartering agency, and by the FDIC, as its primary federal regulator and the insurer of its deposit accounts. Northwest Bank must file reports with the Department of Banking and the FDIC concerning its activities and financial condition in addition to obtaining regulatory approvals prior to entering into certain transactions including acquisitions of other financial institutions. Northwest Bank is examined periodically by the Department of Banking and the FDIC to test Northwest Bank’s compliance with various laws and regulations.
This regulation and supervision, as well as federal and state law, establishes a comprehensive framework of activities in which the Company and Northwest Bank may engage and is intended primarily for the protection and benefit of depositors and other customers, the DIF, the U.S. banking and financial system, and the broader economy, not for the protection or benefit of the Company’s shareholders or non-deposit creditors. The regulatory structure also gives the regulatory authorities extensive discretion in connection with their supervisory and enforcement activities and with their examination policies, including policies with respect to the classification of assets, establishment of adequate credit loss reserves for regulatory purposes and risk management and governance. Any change in these laws or regulations or any heightened supervisory environment, including by the Federal Reserve Board, the Department of Banking, the FDIC or the CFPB, could have a material adverse impact on the Company, Northwest Bank and their respective operations. The Trump administration is expected to create further changes to the federal regulatory and supervisory framework, the impact of which is difficult to assess. Changes in our regulatory and supervisory framework may also have a material adverse affect on the Company and Northwest Bank’s business, operations, and earnings.
Set forth below is a brief description of certain regulatory requirements that are applicable to the Company and Northwest Bank. The description below is limited to certain material aspects of the statutes and regulations addressed, and is not intended to be a complete description of such statutes and regulations and their effects on the Company and Northwest Bank.
Federal Bank Holding Company Regulation
General
As a bank holding company, the Company is subject to regulation under the Bank Holding Company Act, as amended (the “BHCA”), and to regulation, examination and supervision by, and periodic reporting to, the Federal Reserve Board. The Federal Reserve Board has supervisory and enforcement authority over the Company and any non-bank subsidiaries. Among other things, this authority permits the Federal Reserve Board to restrict or prohibit activities that are determined to be a risk to Northwest Bank.
Pause on Major Federal Reserve Board Rulemakings
In January 2025, the Federal Reserve Board stated that Vice Chair of Supervision Michael Barr would step down from the position, effective, February 28, 2025. The Federal Reserve Board stated that it will not issue any major rulemakings from the time of the announcement until a new vice chair for supervision is confirmed by the U.S. Senate.
Permissible Activities
As a bank holding company, the Company and its subsidiaries are generally limited to activities deemed by the Federal Reserve Board to be the business of banking or closely related activities that are incidental to banking. A bank holding company that meets certain criteria may elect to become a financial holding company and thereby engage in a broader array of activities that are financial in nature, such as underwriting equity securities and insurance, as well as those incidental or complementary to financial activities. The Company has not elected to become a financial holding company.
Bank Acquisitions by the Company
Federal law prohibits a bank holding company, including the Company, from acquiring, directly or indirectly, more than 5% of a class of voting securities of another bank or bank holding company or all or substantially all of the assets of a bank, or merging or consolidating with another bank holding company, without prior written approval of the Federal Reserve Board. In evaluating applications by bank holding companies to acquire banks, the Federal Reserve Board considers, among other factors, the financial and managerial resources and future prospects of the parties, the effect of the acquisition on the risk to the DIF, the convenience and needs of the community, competitive factors and compliance with anti-money laundering laws.
Late in the Biden administration, the standards by which bank and financial institution acquisitions would be evaluated have been undergoing review and change by the Office of the Comptroller of the Currency (the “OCC”), FDIC and U.S Department of Justice (the “DOJ”), but not by the Federal Reserve Board. In September 2024, the FDIC and the DOJ finalized changes to their bank merger review policies in the form of non-binding guidance. Whether and how the guidance might be further changed or interpreted by the Trump administration is uncertain. The FDIC’s final policy statement addresses, among other things, the scope of transactions subject to FDIC approval. The final policy statement also addresses a more rigorous FDIC process for evaluating Bank Merger Act applications, and the FDIC Board’s heightened expectations with respect to the Bank Merger Act’s statutory factors.
In addition, the DOJ withdrew its 1995 Bank Merger Guidelines and issued the 2024 Banking Addendum to 2023 Merger Guidelines (“2024 Banking Addendum”). The DOJ clarified that it will assess competition considerations in connection with bank and bank holding company mergers using its 2023 Merger Guidelines, which is the general merger review framework the DOJ now uses to evaluate transactions in all segments of the economy, and 2024 Banking Addendum. The 2024 Banking Addendum provides guidance on how the DOJ will assess competition in the specific context of bank and bank holding company mergers. An analysis under the 2023 Merger Guidelines and 2024 Banking Addendum may include consideration of theories of harm and relevant markets not considered under the 1995 Bank Merger Guidelines, which focused primarily on concentrations of deposits and branches. The effects of these changes and the Trump administration’s interpretation of merger policies remain uncertain.
Acquisition of the Company
Any holder, other than an individual, of 25% or more of a class of the Company’s voting stock, or a lesser percentage if such holder otherwise exercises a “controlling influence” over the Company, is subject to regulation as a bank holding company under the BHCA. In addition, any person other than a bank holding company is required to obtain prior non-objection of the Federal Reserve Board to acquire 10% or more of a class of voting stock of the Company under the Change in Bank Control Act, as amended (the “CIBCA”). In July 2024, the FDIC released a proposed rule to amend its regulations under the CIBCA. The proposed rule removes an explicit exemption for transactions where the Federal Reserve Board reviews a notice under the CIBCA. The effect of these proposed changes would be to provide the FDIC with discretion to require a CIBCA notice in addition to any CIBCA notice required by the Federal Reserve Board.
Source of Strength Doctrine
The “source of strength doctrine” requires bank holding companies to provide assistance to their subsidiary depository institutions in the event such subsidiary depository institutions experience financial difficulty. The Federal Reserve Board has issued regulations requiring that all bank holding companies serve as a source of financial and managerial strength to their subsidiary depository institutions.
Capital Requirements
The Federal Reserve Board and FDIC require bank holding companies, including the Company, and federally insured depository institutions, including Northwest Bank, to meet several minimum capital standards: a common equity Tier 1 capital to risk-based assets ratio of 4.5%, a Tier 1 capital to risk-based assets ratio of 6.0%, a total capital to risk-based assets ratio of 8.0%, and a Tier 1 capital to total assets leverage ratio of 4.0%.
In determining the amount of risk-weighted assets for purposes of calculating risk-based capital ratios, all assets, including certain off-balance-sheet assets (e.g., recourse obligations, direct credit substitutes, residual interests) are multiplied by a risk weight factor assigned by the regulations based on the risks believed inherent in the type of asset. Higher levels of capital are required for asset categories believed to present greater risk.
Common equity Tier 1 capital is generally defined as common stockholders’ equity and retained earnings. Tier 1 capital is generally defined as common equity Tier 1 and additional Tier 1 capital. Additional Tier 1 capital includes certain noncumulative perpetual preferred stock and related surplus and minority interests in equity accounts of consolidated subsidiaries. Total capital includes Tier 1 capital (common equity Tier 1 capital plus additional Tier 1 capital) and Tier 2 capital. Tier 2 capital is comprised of capital instruments and related surplus, meeting specified requirements, and may include cumulative preferred stock and long-term perpetual preferred stock, mandatory convertible securities, intermediate preferred stock and subordinated debt. Also included in Tier 2 capital is the allowance for credit losses limited to a maximum of 1.25% of risk-weighted assets and, for institutions that have exercised an opt-out election regarding the treatment of Accumulated Other Comprehensive Income, up to 45% of net unrealized gains on available-for-sale equity securities with readily determinable fair market values. Calculation of all types of regulatory capital is subject to deductions and adjustments specified in the regulations. Northwest Bank exercised this opt-out election during the year ended December 31, 2024.
Each of the Company and Northwest Bank must hold a “capital conservation buffer” consisting of 2.5% of common equity Tier 1 capital to risk-weighted assets above the amount necessary to meet its minimum risk-based capital requirements in order to avoid limitations on capital distributions, including dividends, and certain discretionary bonus payments to management. As of December 31, 2024, Northwest Bank’s capital exceeded all applicable regulatory requirements and it had an appropriate capital conservation buffer.
The following table presents the minimum regulatory capital ratios, minimum ratio plus capital conservation buffer and well-capitalized minimums that the Company and Northwest Bank must satisfy.
| | | | | | | | | | | | | | | | | | | | | | | | | | | | | |
| | | | Minimum regulatory
capital ratio | | Minimum
ratio + capital conservation buffer | | Well capitalized minimums (1) | | Actual |
| CET1 risk based capital ratio | Northwest Bancshares, Inc. | | 4.50 | % | | 7.00 | % | | N/A | | 12.63 | % |
| Northwest Bank | | 4.50 | % | | 7.00 | % | | 6.50 | % | | 12.63 | % |
| | | | | | | | | |
| Tier 1 risk based capital ratio | Northwest Bancshares, Inc. | | 6.00 | % | | 8.50 | % | | 6.00 | % | | 13.82 | % |
| Northwest Bank | | 6.00 | % | | 8.50 | % | | 8.00 | % | | 12.63 | % |
| | | | | | | | | |
| Total risk based capital ratio | Northwest Bancshares, Inc. | | 8.00 | % | | 10.50 | % | | 10.00 | % | | 16.08 | % |
| Northwest Bank | | 8.00 | % | | 10.50 | % | | 10.00 | % | | 13.81 | % |
| | | | | | | | | |
| Tier 1 leverage ratio | Northwest Bancshares, Inc. | | 4.00 | % | | N/A | | N/A | | 10.39 | % |
| Northwest Bank | | 4.00 | % | | N/A | | 5.00 | % | | 9.50 | % |
(1) Reflects the well-capitalized standard applicable to Northwest Bank and the well-capitalized standard applicable to the Company under the Federal Reserve Board’s Regulation Y.
Any institution that fails any of the regulatory capital requirements is subject to enforcement action by the Federal Reserve Board or FDIC, as applicable. Such action may include a capital directive, a cease and desist order, civil money penalties, restrictions on an institution’s operations, termination of federal deposit insurance, and the appointment of a conservator or receiver. Such action, through enforcement proceedings or otherwise, may require a variety of corrective measures. For information regarding enforcement actions under the “prompt corrective action” framework under federal law, see “Supervision and Regulation—Federal Banking Regulation—Prompt Corrective Action.”
Capital Distributions. The Company is a legal entity separate and distinct from its banking and other subsidiaries and relies on dividends from Northwest Bank as its primary source of funding. There are limitations on the payment of dividends by the Northwest Bank to the Company, as well as by the Company to its shareholders. For information on dividend limitations under Pennsylvania law, see “Supervision and Regulation—Pennsylvania Savings Bank Law—Dividends.”
The Company and Northwest Bank must maintain the applicable common equity Tier 1 capital conservation buffer of 2.5% to avoid becoming subject to restrictions on capital distributions, including dividends. For more information on the common equity Tier 1 capital conservation buffer, see “Supervision and Regulation— Federal Bank Holding Company Regulation—Capital Requirements.”
Federal Reserve Board policy provides that a bank holding company should not pay cash dividends unless (1) its net income over the last four quarters, net of dividends paid, is sufficient to fully fund the dividends, (2) the prospective rate of earnings retention appears consistent with the capital needs, asset quality, and overall financial condition of the bank holding company and its subsidiaries, and (3) the bank holding company will continue to meet minimum required capital adequacy ratios. The policy also provides that a bank holding company should inform the Federal Reserve Board reasonably in advance of declaring or paying a dividend that exceeds earnings for the period for which the dividend is being paid, or that could result in a material adverse change to the bank holding
company’s capital structure. Bank holding companies also are expected to consult with the Federal Reserve Board before materially increasing dividends. The Federal Reserve Board could prohibit or limit the payment of dividends by the Company if it determines that payment of the dividend would constitute an unsafe or unsound practice.
A bank holding company that is not well capitalized or well managed, or that is subject to any unresolved supervisory issues, is required to give the Federal Reserve Board prior written notice of any repurchase or redemption of its outstanding equity securities if the gross consideration for repurchase or redemption, when combined with the net consideration paid for all such repurchases or redemptions during the preceding 12 months, will be equal to 10% or more of the company’s consolidated net worth. The Federal Reserve Board may disapprove such a repurchase or redemption if it determines that the proposal would constitute an unsafe and unsound practice or violate a law or regulation. However, Federal Reserve Board guidance generally provides for bank holding company consultation with Federal Reserve Board staff prior to engaging in a repurchase or redemption of a bank holding company’s stock, even if a formal written notice is not required.
These regulatory requirements and expectations may affect the ability of the Company to pay dividends, repurchase shares of its common stock or otherwise engage in capital distributions.
Pennsylvania Savings Bank Law
The Pennsylvania Banking Code of 1965, as amended (the “Banking Code”), contains detailed provisions governing the organization, operations, corporate powers, savings and investment authority, branching, and rights and responsibilities of directors, officers and employees of Pennsylvania savings banks. A Pennsylvania savings bank may locate or change the location of its principal place of business and establish an office anywhere in, or adjacent to, Pennsylvania, with the prior approval of the Department of Banking. The Banking Code delegates extensive rule making power and administrative discretion to the Department of Banking in its supervision and regulation of state-chartered savings banks.
Although the Department of Banking may accept the examinations and reports of the FDIC in lieu of its own examination, the current practice is for the Department of Banking to conduct joint examinations with the FDIC. The Department of Banking may order any savings bank to discontinue any violation of law or unsafe or unsound business practice and may direct any director, officer, or employee of a savings bank engaged in a violation of law, unsafe or unsound practice or breach of fiduciary duty to show cause at a hearing before the Department of Banking why such person should not be removed. Pennsylvania law provides for the Department of Banking’s examination and enforcement authority over subsidiaries of Pennsylvania institutions and authorizes the assessment of civil money penalties of up to $25,000 under certain circumstances for violations of laws or orders related to the institution or unsafe or unsound practices or breaches of fiduciary duties. The Department of Banking may also appoint a receiver or conservator for an institution in appropriate cases.
Northwest Bank is subject to capital guidelines of the Department of Banking. Although not adopted in regulation form, the Department of Banking requires 6% leverage capital and 10% risk-based capital. The components of leverage and risk-based capital are substantially the same as those defined by the FDIC, which are discussed above.
Northwest Bank is subject to Department of Banking regulations that limit the amount that a bank may lend relative to appraised values of real estate securing the loans, as determined by an appraisal at the time of loan origination. Such regulations permit a maximum loan-to-value of 95% for residential properties and 80% for all other real estate secured loans as established by the FDIC guidance.
Loans-to-One Borrower Limitation
In accordance with the Banking Code, a Pennsylvania chartered savings bank, with certain limited exceptions, may lend to a single or related group of borrowers an amount equal to up to 15% of its capital accounts, defined as the aggregate of capital, surplus, undivided profits, capital securities and reserve for credit losses. The Northwest Bank Credit Committee has established an internal lending limit, either individually or in the aggregate to one customer, or a single source of repayment, of $30.0 million, or $50.0 million for loans originated and managed within the Corporate Finance portfolio for borrowers with a strong credit profile and a risk rating of 3 or better, and Aggregate Credit Exposure of $100.0 million. As of December 31, 2024 we had no credit relationships that were equal to or exceeded our $30.0 million internal limit for individual borrowers, 4 credit relationships that were equal to or exceeded our $50.0 million internal limit for individual borrowers within the corporate finance portfolio, and one credit relationship that was equal to or exceeded the $100.0 million internal limit for Aggregate Credit Exposure.
Dividends
The Company’s ability to pay dividends depends, to a large extent, upon Northwest Bank’s ability to pay dividends to the Company. The Banking Code states that no dividend may be paid out of surplus without approval of the Department of Banking. Dividends may
be paid out of accumulated net earnings. No dividend may generally be paid that would result in Northwest Bank failing to comply with its regulatory capital requirements.
Federal Banking Regulation
Northwest Bank is also subject to extensive regulation, examination and supervision by the FDIC, as its primary federal regulator. Such regulation and supervision:
•Limits the activities and investment authority of Northwest Bank;
•Establishes assessment rates for maintaining the DIF;
•Establishes various capital categories resulting in various levels of regulatory scrutiny applied to the institutions in a particular category;
•Establishes standards for safety and soundness; and
•Establishes a continuing and affirmative obligation, consistent with Northwest Bank’s safe and sound operation, to help meet the credit needs of its community, including low- and moderate-income neighborhoods;
The FDIC is required by law to examine each regulated institution every twelve months. The FDIC has the authority to order any savings bank and its directors, officers, or employees to discontinue any violation of law or unsafe or unsound banking practice.
Activities and Investments of Insured State-Chartered Banks
Federal law generally limits the activities as principal and equity investments of state-chartered banks insured by the FDIC and its subsidiaries to those that are permissible for national banks. Before engaging in a new activity as principal that is not permissible for a national bank or otherwise permissible under federal law or FDIC regulations, an insured state-chartered bank must seek approval from the FDIC to engage in such activity. The FDIC will not approve the activity unless the insured state-chartered bank meets its minimum capital requirements, and the FDIC determines that the activity does not present a significant risk to the DIF.
Insurance of Deposit Accounts
The deposit accounts of Northwest Bank are insured by the DIF to the maximum amount provided by law. The FDIC insures deposits up to the standard maximum deposit insurance amount of $250,000 per depositor for each account ownership category. This insurance is backed by the full faith and credit of the United States Government.
The FDIC charges insured depository institutions premiums to maintain the DIF, based on the risk each institution poses to the DIF. The FDIC may increase an insured depository institution’s insurance premiums based on various factors, including the FDIC’s assessment of its risk profile. Assessments for institutions with $10 billion or more of assets, such as Northwest Bank, are primarily based on a scorecard approach by the FDIC, including factors such as examination ratings and modeling measuring the institution’s ability to withstand asset-related and funding-related stress and potential loss to the DIF should the bank fail.
In response to the bank failures in early 2023, the FDIC implemented a special assessment to recover the losses to the DIF at an annual rate of approximately 13.4 basis points over eight quarterly collection periods, which began in 2024, and currently projects that the special assessment will be collected for an additional two quarters beyond the initial eight-quarter collection period, at a lower rate. The base for the special assessment is equal to an insured depository institution’s estimated uninsured deposits reported as of December 31, 2022, adjusted to exclude the first $5 billion. The FDIC may impose additional special assessments from time to time based on the actual losses incurred by the FDIC as a result of the March 2023 bank failures or future failures.
Insurance of deposits may be terminated by the FDIC upon a finding that the institution has engaged or is engaging in unsafe and unsound practices, is in an unsafe or unsound condition to continue operations or has violated any applicable law, regulation, rule, order or condition imposed by the FDIC or written agreement entered into with the FDIC.
Prompt Corrective Action
Federal law requires, among other things, that federal banking agencies take “prompt corrective action” (“PCA”) with respect to insured depository institutions that do not meet minimum capital requirements. For this purpose, federal law establishes five capital categories: (1) well capitalized, (2) adequately capitalized, (3) undercapitalized, (4) significantly undercapitalized and (5) critically undercapitalized. Failure to be well-capitalized or to meet minimum capital requirements could result in certain mandatory and possible additional discretionary actions by regulators that, if undertaken, could have a material adverse effect on the Company’s operations or financial condition. For example, “brokered deposits,” as defined by FDIC regulations, may only be accepted by well capitalized depository institutions without prior regulatory approval or, with a waiver from the FDIC, by adequately capitalized depository institutions. Institutions that fall into an “undercapitalized” category are subject to a variety of mandatory and discretionary
supervisory actions, including a restriction on capital distributions and the requirement to file a capital restoration plan with the regulators. Performance under the capital restoration plan must be guaranteed by the parent bank holding company up to the lesser of the amount of the capital deficiency when deemed undercapitalized. As of December 31, 2024, Northwest Bank was well capitalized as defined above.
| | | | | | | | | | | | | | | | | | | | | | | | | | | | | |
| | Well capitalized | | Adequately capitalized | | Undercapitalized | | Significantly undercapitalized | | Actual |
| CET1 risk based capital ratio | ≥ 6.5% | | ≥ 4.5% | | < 4.5% | | < 3.0% | | 12.63 | % |
| Tier 1 risk based capital ratio | ≥ 8.0% | | ≥ 6.0% | | < 6.0% | | < 4.0% | | 12.63 | % |
| Total risk based capital ratio | ≥ 10.0% | | ≥ 8.0% | | < 8.0% | | < 6.0% | | 13.81 | % |
| Tier 1 leverage ratio | ≥ 5.0% | | ≥ 4.0% | | < 4.0% | | < 3.0% | | 9.50 | % |
Safety and Soundness Guidelines
The federal banking agencies, including the FDIC, have adopted guidelines prescribing safety and soundness standards relating to internal controls, risk management, information systems, internal audit systems, loan documentation, credit underwriting, interest rate exposure, asset growth and compensation, fees and benefits. These guidelines in general require appropriate systems and practices to identify and manage specified risks and exposures. The guidelines prohibit excessive compensation as an unsafe and unsound practice and characterize compensation as excessive when the amounts paid are unreasonable or disproportionate to the services performed by an executive officer or employee, director or principal shareholder. In addition, the federal banking agencies have adopted regulations that authorize but do not require an agency to order an institution that has been given notice by the agency that it is not in compliance with any of the safety and soundness standards to submit a compliance plan. If after being so notified, an institution fails to submit an acceptable compliance plan, the agency must issue an order directing action to correct the deficiency and may issue an order directing other actions, including those that may limit growth or capital distributions.
Transactions with Affiliates
Section 18(j) of the Federal Deposit Insurance Act applies the limits of Sections 23A and 23B of the Federal Reserve Act and the Federal Reserve Board’s implementing regulation, Regulation W, to transactions between FDIC-insured state nonmember banks and their affiliates, such as Northwest Bank and the Company. In general, transactions with affiliates must be on terms and under circumstances that are substantially the same, or at least as favorable to the bank, as comparable transactions with non-affiliates. In addition, certain types of transactions with affiliates are restricted to an aggregate percentage of the bank’s capital stock and surplus. Certain transactions with affiliates are required to be secured by specified collateral. The Company and the Bank are also subject to the “Volcker Rule,” which contains prohibitions on proprietary trading and certain investments in, and relationships with, hedge funds, private equity funds and similar funds.
Federal Home Loan Bank System
Northwest Bank is a member of the Federal Home Loan Bank System, which consists of 11 regional Federal Home Loan Banks. The Federal Home Loan Bank System provides a central credit facility primarily for member institutions. As a member of the Federal Home Loan Bank of Pittsburgh, Northwest Bank is required to acquire and hold shares of capital stock in the Federal Home Loan Bank in specified amounts. As of December 31, 2024, Northwest Bank was in compliance with this requirement.
Real Estate Lending Standards and Guidance
The federal banking agencies have adopted uniform regulations prescribing standards for extensions of credit that are secured by liens or interests in real estate or made for the purpose of financing permanent improvements to real estate. Under these regulations, all insured depository institutions, such as Northwest Bank, must adopt and maintain written policies establishing appropriate limits and standards for extensions of credit that are secured by liens or interests in real estate or are made for the purpose of financing permanent improvements to real estate. These policies must establish loan portfolio diversification standards, prudent underwriting standards (including loan-to-value limits) that are clear and measurable, loan administration procedures, and documentation, approval and reporting requirements. The real estate lending policies must reflect consideration of the federal banking agencies’ Interagency Guidelines for Real Estate Lending Policies.
The federal banking agencies have also jointly issued guidance on “Concentrations in Commercial Real Estate Lending” (the “CRE Lending Guidance”), which defines commercial real estate loans as exposures secured by raw land, land development and construction (including 1-4 family residential construction), multi-family property, and non-farm nonresidential property where the primary or a significant source of repayment is derived from rental income associated with the property (that is, loans for which 50% or more of the source of repayment comes from third-party, non-affiliated, rental income) or the proceeds of the sale, refinancing, or permanent financing of the property. The CRE Lending Guidance requires that appropriate processes be in place to identify, monitor and control
risks associated with real estate lending concentrations. If a concentration is present, management must employ heightened risk management practices that address key elements, including board and management oversight and strategic planning, portfolio management, development of underwriting standards, risk assessment and monitoring through market analysis and stress testing, and maintenance of increased capital levels as needed to support the level of commercial real estate lending. The required heightened risk management practices could include enhanced strategic planning, underwriting policies, risk management, internal controls, portfolio stress testing and risk exposure limits as well as appropriately designed compensation and incentive programs. Higher allowances for credit losses and capital levels may also be required. The CRE Lending Guidance states that the following metrics may indicate a concentration of commercial real estate loans, but that these metrics are neither limits nor a safe harbor: (1) total reported loans for construction, land development, and other land represent 100% or more of total risk-based capital; or (2) total reported loans secured by multi-family properties, nonfarm non-residential properties (excluding those that are owner-occupied), and loans for construction, land development, and other land represent 300% or more of total risk-based capital and the bank’s commercial real estate loan portfolio has increased 50% or more during the prior 36 months.
Community Reinvestment Act
All FDIC-insured institutions have a responsibility under the Community Reinvestment Act (the “CRA”) and related regulations to help meet the credit needs of their communities, including low- and moderate-income neighborhoods. The CRA requires Northwest Bank’s primary federal banking agency, the FDIC, to assess the institution’s record of compliance with the CRA. Institutions are assigned one of four ratings: “Outstanding,” “Satisfactory,” “Needs to Improve,” or “Substantial Noncompliance.” These ratings under the CRA are taken into account by the Federal Reserve Board and the OCC when considering merger or other specified applications that the Company or Northwest Bank may submit from time to time. Northwest Bank received an “Outstanding” rating at its most recent CRA evaluation.
On October 24, 2023, the FDIC, the Federal Reserve Board, and the OCC issued a final rule to strengthen and modernize the CRA regulations. Under the final rule, banks with assets of at least $2 billion as of December 31 in both of the prior two calendar years will be a “large bank.” The agencies would evaluate large banks under four performance tests: the Retail Lending Test, the Retail Services and Products Test, the Community Development Financing Test, and the Community Development Services Test. The rule was intended to begin taking effect on April 1, 2024, with most of the provisions to become applicable on January 1, 2026, and additional requirements to become applicable on January 1, 2027.
Several banking industry groups filed a lawsuit seeking to invalidate the CRA final rule, in which they argued that the federal banking agencies exceeded their statutory authority in adopting the CRA final rule. In March 2024, a federal judge granted an injunction to extend the CRA final rule’s effective date. The effective date will be extended each day the injunction remains in place, pending the resolution of the lawsuit. It is unknown whether and when the CRA final rule will become effective.
Consumer Protection Laws
Northwest Bank is subject to a number of federal laws designed to protect its customers. These consumer protection laws apply to a broad range of its activities and to various aspects of its business and include laws relating to interest rates, fair lending, disclosures of credit terms and estimated transaction costs to consumer borrowers, debt collection practices, the use of and the provision of information to consumer reporting agencies, and the prohibition of unfair, deceptive or abusive acts or practices in connection with the offer, sale or provision of consumer financial products and services. Administration of many of these consumer protection rules are the responsibility of the CFPB, which has exclusive supervisory authority over insured depository institutions with more than $10 billion in total assets and any affiliates thereof. The CFPB also has authority to define and prevent unfair, deceptive and abusive practices in the consumer financial area, and expanded data collecting powers for purposes of determining bank compliance with the fair lending laws.
In December 2024, the CFPB issued a final rule that would become effective on October 1, 2025, which, if it goes into effect as currently issued, would including imposing certain requirements on overdraft fees, similar to those that apply to credit cards, unless the financial institution limits the overdraft fee to an amount that covers the institution’s costs and losses to provide the service or $5.
In addition, the Federal Reserve Board has proposed, but not yet finalized, amendments to Regulation II that would lower the cap on debit interchange fees and institute a process for automatically recalculating the debit interchange fee cap every two years based upon a biennial survey of large debit card issuers.
The Bank Secrecy Act and USA PATRIOT Act
The Bank Secrecy Act (the “BSA”), as amended by the Uniting and Strengthening America by Providing Appropriate Tools Required to Intercept and Obstruct Terrorism Act of 2001 (the “USA PATRIOT Act”), and its implementing regulations require Northwest Bank to implement a compliance program designed to detect and prevent money laundering, terrorist financing, and other illicit
financial crimes. The BSA, as amended, and its implementing regulations require Northwest Bank to implement, among other things, internal controls, policies and procedures; conduct customer due diligence; and adhere to certain recordkeeping and reporting requirements.
The Anti-Money Laundering Act of 2020 (the “AML Act”), enacted as part of the National Defense Authorization Act, requires the U.S. Treasury Department’s Financial Crimes Enforcement Network (“FinCEN”) to issue a number of rules that will update and expand the BSA’s regulatory requirements. For example, the AML Act requires FinCEN to issue National Anti-Money Laundering ]and Countering the Financing of Terrorism Priorities (the “National Priorities”), which the agency did in June 2021, and to conduct studies and issue regulations that may alter some of the due diligence, record-keeping and reporting requirements that the BSA and USA PATRIOT Act impose on banks. FinCEN has yet to issue a final rule that establishes the compliance obligations of financial institutions with respect to the National Priorities, and several other mandatory rulemakings under the AML Act remain outstanding. The AML Act also promotes increased information-sharing and use of technology and increases penalties for violations of the BSA and includes whistleblower incentives, both of which could increase the prospect of regulatory enforcement. The AML Act also includes the Corporate Transparency Act (the “CTA”), which requires FinCEN to, among other things, establish a national beneficial ownership information registry. In September 2022, FinCEN issued the final Beneficial Ownership Information Reporting Requirements rule (the “BOI Reporting Rule”) which, effective January 1, 2024, requires certain “reporting companies” to file beneficial ownership information reports with FinCEN that will be stored in the national beneficial ownership registry and will detail the reporting company’s beneficial owners. In December 2023, FinCEN issued the final Beneficial Ownership Information Access and Safeguards rule—the second of three rulemakings that would implement the CTA—which governs access to the national beneficial ownership registry. FinCEN has not yet issued the third CTA-implementing regulation, which will amend the beneficial ownership requirements applicable to banks and other covered financial institutions under FinCEN’s existing Customer Due Diligence rule. The constitutionality of the CTA is subject to ongoing litigation.
The USA PATRIOT Act also required the federal banking agencies to take into consideration the effectiveness of controls designed to combat money laundering activities in determining whether to approve a merger or other acquisition application. Accordingly, if we engage in a merger or other acquisition, our controls designed to combat money laundering would be considered as part of the application process. We have established policies, procedures and systems designed to comply with the BSA, as amended, and its implementing regulations.
Federal Securities Laws
Our common stock is registered with the SEC under Section 12(b) of the Exchange Act. We are also subject to the proxy rules, tender offer rules, insider trading restrictions, annual and periodic reporting, and other requirements of the Exchange Act.
Sarbanes-Oxley Act of 2002
The Sarbanes-Oxley Act of 2002 was enacted to increase corporate responsibility, to provide for enhanced penalties for accounting and auditing improprieties at publicly traded companies, and to protect investors by improving the accuracy and reliability of corporate disclosures pursuant to the securities laws. In particular, the Sarbanes-Oxley Act established, among other things: (i) requirements for audit and other key Board of Directors committees involving independence, expertise levels, and specified responsibilities; (ii) responsibilities regarding the oversight of financial statements by the Chief Executive Officer and Chief Financial Officer of the reporting company; (iii) standards for auditors and the regulation of audits, including independence provisions which restrict non-audit services that accountants may provide to their audit clients; (iv) increased disclosure and reporting obligations for the reporting company and its directors and executive officers including accelerated reporting of company stock transactions; (v) a prohibition of personal loans to directors and officers, except certain loans made by insured financial institutions on non-preferential terms and in compliance with other bank regulator requirements; and (vii) a range of new and increased civil and criminal penalties for fraud and other violations of the securities laws. The Sarbanes-Oxley Act generally applies to all companies that file or are required to file periodic reports with the SEC, under the Exchange Act. The Company has policies, procedures and systems designed to comply with this Act and its implementing regulations.
Data Privacy and Cybersecurity
Data privacy and cybersecurity are areas of significant and increasing federal and state regulation. Like other businesses in the U.S., the Company and its non-banking subsidiaries are subject to the rules and regulations promulgated under the authority of the Federal Trade Commission which regulates unfair or deceptive acts or practices, including with respect to data privacy and cybersecurity. Other federal and state laws and regulations impact the Company’s ability to share certain information with affiliates and non-affiliates for marketing and/or non-marketing purposes. Moreover, the U.S. Congress has recently considered, and is currently considering, various proposals for more comprehensive data privacy and cybersecurity legislation, to which the Company and its subsidiaries may be subject if passed.
Financial institutions, including the Company and Northwest Bank, are also subject to the Gramm-Leach-Bliley Act which, among other things: (i) imposes certain limitations on their ability to share nonpublic personal information about their customers with nonaffiliated third parties; (ii) requires that they provide certain disclosures to customers about their information collection, sharing and security practices and afford customers the right to “opt out” of any information sharing by them with nonaffiliated third parties (with certain exceptions); and (iii) requires that they develop, implement and maintain a written comprehensive information security program containing appropriate safeguards based on their size and complexity, the nature and scope of their activities, and the sensitivity of customer information they process, as well as plans for responding to cybersecurity breaches. Like other lenders, Northwest Bank also uses credit bureau data in its underwriting activities, and use of such data is regulated under the Fair Credit Reporting Act, which regulates reporting information to credit bureaus, prescreening individuals for credit offers, sharing of information between affiliates, and using affiliate data for marketing purposes. Similar state laws may impose additional requirements on Northwest Bank.
In November 2021, the Federal Reserve Board, the Office of the Comptroller of the Currency and the FDIC adopted a regulation that, among other things, requires a banking organization to notify its primary federal regulators as soon as possible (and in any event within 36 hours) after identifying a “computer-security incident” that the banking organization believes in good faith has materially disrupted or degraded, or is reasonably likely to materially disrupt or degrade, its business or operations in a manner that would, among other things, jeopardize the viability of its operations, result in customers being unable to access their deposit and other accounts, result in a material loss of revenue, profit or stock price, or pose a threat to the stability of the U.S. financial sector.
The enactment of the Cyber Incident Reporting for Critical Infrastructure Act (“CIRCIA”) in 2022, once rulemaking is complete, will separately require, among other things, covered entities to report significant cyber incidents, including ransomware attacks, to the Cybersecurity and Infrastructure Agency (“CISA”) within 72 hours from the time the covered entity reasonably believes the incident occurred (and within 24 hours of making a ransom payment as a result of a ransomware attack). The CISA proposed a rule under the CIRCIA in April 2024 that, among other things, would clarify the scope of cyber incidents to be reported and would further define covered entities subject to the CIRCIA to expressly include companies in the financial services sector that are required to report cyber incidents their respective primary federal regulators.
States also have enacted, and are increasingly proposing or enacting, legislation that relates to data privacy and cybersecurity, such as the California Consumer Privacy Act, as amended by the California Privacy Rights Act. In addition, laws in all 50 U.S. states require businesses to provide notice under certain circumstances to consumers whose personal information has been disclosed as a result of a data breach.
For more information on data privacy and cybersecurity-related risks, see “Item 1A. Risk Factors” under the headings “Data privacy and cybersecurity are areas of heightened legislative and regulatory scrutiny” and “Risks associated with system failures, interruptions, or cybersecurity breaches could negatively affect our earnings.”
ITEM 1A. RISK FACTORS
In addition to factors discussed in the description of our business and elsewhere in this report, as well as other filings we make with the SEC, the following are factors that could adversely affect our future results of operations and financial condition.
Risks Related to our Lending Activities
Our commercial loan portfolio is increasing and the inherently higher risk of loss may lead to additional provisions for credit losses or charge-offs, which would negatively impact earnings and capital.
Commercial loans generally expose a lender to greater risk of non-payment and loss than one- to four-family residential mortgage loans because repayment of the loans often depends on the successful operation of the business and the income stream of the borrowers. Such loans typically involve larger loan balances to single borrowers or groups of related borrowers compared to one- to four-family residential mortgage loans. Also, many of our commercial borrowers have more than one loan outstanding with us. Consequently, an adverse development with respect to one loan or one credit relationship can expose us to a significantly greater risk of loss compared to an adverse development with respect to a one- to four-family residential mortgage loan. Commercial business loans expose us to additional risk since they typically are dependent on the borrower’s ability to make repayments from the cash flows of the business and are secured by non-real estate collateral that may depreciate over time. Further, our commercial business loans may be secured by collateral other than real estate, such as inventory and accounts receivable, the value of which may be more difficult to appraise, control or collect and may be more susceptible to fluctuation in value at the time of default. In addition, if we foreclose on these loans, our holding period for the collateral may be longer than for a single or multi-family residential property if there are fewer potential purchasers of the collateral.
The level of our commercial real estate loan portfolio may subject us to additional regulatory scrutiny.
The FDIC and the other federal banking regulatory agencies have jointly promulgated the CRE Lending Guidance on sound risk management practices for financial institutions with concentrations in commercial real estate lending. Under the CRE Lending Guidance, a financial institution that, like us, is actively involved in commercial real estate lending should perform a risk assessment to identify concentrations. A financial institution may have a concentration in commercial real estate lending if, among other factors, (i) total reported loans for construction, land acquisition and development, and other land represent 100% or more of total capital, or (ii) total reported loans secured by multi-family and non-farm residential properties, loans for construction, land acquisition and development and other land, and loans otherwise sensitive to the general commercial real estate market, including loans to commercial real estate related entities, represent 300% or more of total capital. Based on these factors, we have a concentration in multi-family and commercial real estate lending, as such loans represent 357% of total bank capital as of December 31, 2024. The particular focus of the guidance is on exposure to commercial real estate loans that are dependent on the cash flow from the real estate held as collateral and that are likely to be at greater risk to conditions in the commercial real estate market (as opposed to real estate collateral held as a secondary source of repayment or as an abundance of caution). The purpose of the CRE Lending Guidance is to guide banks in developing risk management practices and capital levels commensurate with the level and nature of real estate concentrations. The CRE Lending Guidance states that management should employ heightened risk management practices including board and management oversight and strategic planning, development of underwriting standards, risk assessment and monitoring through market analysis and stress testing. While we believe we have implemented policies and procedures with respect to our commercial real estate loan portfolio consistent with this guidance, bank regulators could require us to implement additional policies and procedures consistent with their interpretation of the guidance that may result in additional costs to us or that may result in a curtailment of our multi-family and commercial real estate lending that would adversely affect our loan originations and profitability. For additional information, see “Supervision and Regulation—Federal Banking Regulation—Real Estate Lending Standards and Guidance.”
If the allowance for credit losses is not sufficient to cover actual credit losses, our earnings could decrease.
Our customers may not repay their loans according to the original terms, and the collateral, if any, securing the payment of these loans may be insufficient to pay any remaining loan balance. We may experience significant credit losses, which may have a material adverse effect on operating results. We make various assumptions and judgments about the collectability of the loan portfolio, including the creditworthiness of borrowers and the value of the real estate and other assets serving as collateral for the repayment of loans. If our assumptions prove to be incorrect, the allowance for credit losses may not be sufficient to cover losses inherent in our loan portfolio, resulting in additions to the allowance. Material additions to the allowance would materially decrease net income.
Our emphasis on originating commercial real estate and commercial loans is one of the more significant factors in evaluating the allowance for credit losses. As we continue to increase the amount of such loans, increased provisions for credit losses may be necessary, which would decrease our earnings. In addition, any future credit deterioration could require us to increase our allowance for credit losses in the future.
Bank regulators periodically review our allowance for credit losses and may require an increase to the provision for credit losses or further loan charge-offs. Any increase in our allowance for credit losses or loan charge-offs resulting from these reviews may have a material adverse effect on our results of operations or financial condition.
The foreclosure process may adversely impact our recoveries on non-performing loans.
The judicial foreclosure process is protracted, which delays our ability to resolve non-performing loans through the sale of the underlying collateral. The longer timelines have been the result of the economic crisis, additional consumer protection initiatives related to the foreclosure process, increased documentary requirements and judicial scrutiny, and, both voluntary and mandatory programs under which lenders may consider loan modifications or other alternatives to foreclosure. These reasons and the legal and regulatory responses have impacted the foreclosure process and completion time of foreclosures for residential mortgage lenders. This may result in a material adverse effect on collateral values and our ability to minimize its losses.
Risks Related to Laws and Regulations
Changes in laws and regulations and the cost of compliance with new laws and regulations may adversely affect our operations and our income.
The Company and Northwest Bank operate in a highly regulated industry and are subject to extensive laws, regulation, supervision and examination by the Federal Reserve Board, the Department of Banking, the FDIC and the CFPB. These laws and regulations are imposed primarily for the protection and benefit of depositors and other customers, the DIF the U.S. banking and financial system, and the broader economy, not for the protection or benefit of the Company’s investors or non-deposit creditors. These regulatory authorities have extensive discretion in connection with their supervisory and enforcement activities, including the ability to impose restrictions on Northwest Bank’s operations, reclassify assets, determine the adequacy of Northwest Bank’s allowance for credit losses and determine the level of deposit insurance premiums assessed. The laws and regulations applicable to us are subject to frequent
change and interpretations and the supervisory environment may be heightened at the regulators’ discretion. For example, the Company is unable to predict what, if any, changes to the regulatory environment may be enacted by Congress, both chambers of which became under Republican control beginning in 2025, or the new presidential administration and what the impact of any changes will be on the Company. We expect the Trump administration will seek to implement a regulatory reform agenda that is significantly different than that of the Biden administration, impacting the rulemaking, supervision, examination, and enforcement priorities of the federal banking agencies. Any change in these regulations and oversight, whether in the form of regulatory policy, new regulations or legislation or additional deposit insurance premiums could have a material impact on our operations.
The potential exists for additional federal or state laws and regulations, or changes in policy, affecting lending and funding practices and liquidity standards. Moreover, bank regulatory agencies have been active in responding to concerns and trends identified in examinations, and have issued many formal enforcement orders requiring capital ratios in excess of regulatory requirements. In addition, new laws and regulations may increase our costs of regulatory compliance and of doing business, and otherwise affect our operations. New laws and regulations may significantly affect the markets in which we do business, the markets for and value of our loans and investments, the fees we can charge and our ongoing operations, costs and profitability.
Non-compliance with the Bank Secrecy Act, as amended, and its implementing regulations, or other laws and regulations could result in fines or sanctions.
The BSA, as amended, and its implementing regulations require certain financial institutions, such as banks, to develop compliance programs that prevent the financial institutions from being used to facilitate money laundering, terrorist financing and other illicit financial crimes. If a financial institution detects suspicious activities, financial institutions are obligated to, among other things, file suspicious activity reports with the U.S. Treasury’s FinCEN. The BSA, as amended, and its implementing regulations also require financial institutions to establish procedures for identifying and verifying the identity of customers seeking to open accounts at the financial institution. Failure to comply with the Bank Secrecy, as amended, and its implementing regulations could result in fines or sanctions or affect our ability to pursue further acquisition opportunities. During the last year, several banking institutions have received large fines for non-compliance with the BSA, as amended, and its implementing regulations. While we have developed policies and procedures designed to promote compliance with the BSA, as amended, and its implementing regulations, these policies and procedures may not be effective in preventing violations of the law.
We are subject to numerous laws designed to protect consumers, including the Community Reinvestment Act and fair lending laws, and failure to comply with these laws could lead to material penalties and other sanctions.
The CRA, the Equal Credit Opportunity Act, the Fair Housing Act and other fair lending laws and regulations impose nondiscriminatory lending requirements on financial institutions. The DOJ and other federal agencies are responsible for enforcing these laws and regulations. A successful regulatory challenge to an institution’s performance under the CRA or fair lending laws and regulations could result in a wide variety of sanctions, including the required payment of damages and civil money penalties, injunctive relief, restrictions on mergers and acquisitions activity, restrictions on expansion and restrictions on entering new business lines. Private parties may also have the ability to challenge an institution’s performance under fair lending laws in private class action litigation. Such actions could have a material adverse effect on our business, financial condition and results of operations.
We could become subject to more stringent capital requirements, which could adversely impact our return on equity, require us to raise additional capital, or constrain us from paying dividends or repurchasing shares.
Federal regulations establish minimum capital requirements for bank holding companies and insured depository institutions, including minimum risk-based capital and leverage ratios. Unrealized gains and losses on certain “available-for-sale” securities holdings are to be included for purposes of calculating regulatory capital requirements unless a one-time opt-out was exercised, which we exercised. The regulations also establish a “capital conservation buffer” of 2.5%. An institution will be subject to limitations on paying dividends, engaging in share repurchases, and paying discretionary bonuses if its capital level falls below the 2.5% capital conservation buffer. The primary source of funds for the Company is dividends from Northwest Bank, which is also subject these obligations to maintain sufficient capital and by other restrictions on its dividends under federal and Pennsylvania law.
From time to time, the regulators implement changes to these regulatory capital requirements. The application of more stringent capital requirements could, among other things, result in lower returns on equity, require the raising of additional capital, and result in regulatory actions if we were to be unable to comply with such requirements. Changes to applicable capital requirements, including to asset risk weightings for risk-based capital calculations, items included or deducted in calculating regulatory capital and/or capital buffers, could result in management modifying its business strategy, and could limit our ability to make distributions, including paying out dividends or buying back shares. Furthermore, changes to the Basel III capital rules, including the implementation of Basel III endgame, that apply to banking organizations that are larger or more internationally active than the Company and Northwest may be informally applied or considered by the Federal Reserve Board and the FDIC in their regulation, supervision and examination of, and indirectly adversely impact, smaller institutions such as the Company and the Bank.
The Federal Reserve Board may require us to commit capital resources to support Northwest Bank.
Federal law requires that a holding company act as a source of financial and managerial strength to its subsidiary bank and to commit resources to support such subsidiary bank. Under the “source of strength” doctrine, the Federal Reserve Board may require a holding company to make capital injections into a troubled subsidiary bank and may charge the holding company with engaging in unsafe and unsound practices for failure to commit resources to a subsidiary bank. A capital injection may be required at times when the holding company may not have sufficient resources and therefore may be required to borrow the funds or raise capital. Any borrowing or capital raise could occur at a time that is more difficult and expensive and could have an adverse effect on our business, financial condition, and results of operations.
Legal and regulatory proceedings and related matters could adversely affect us or the financial services industry in general.
We, and other participants in the financial services industry upon whom we rely to operate, have been and may in the future become involved in legal and regulatory proceedings. Most of the proceedings we consider to be in the normal course of our business are typical for the industry; however, it is inherently difficult to assess the outcome of these matters, and other participants in the financial services industry or we may not prevail in any proceeding or litigation. For example, financial institutions, such as ourselves, are subject to comprehensive regulation and periodic examination by federal and state banking regulators and face significant regulatory scrutiny, which can lead to proceedings that result in remedial actions. These actions include the power to enjoin “unsafe or unsound” practices, to require affirmative actions to correct any conditions resulting from any violation or practice, to issue an administrative order that can be judicially enforced, to direct an increase in the Company’s capital, to restrict the Company’s growth, to change the asset composition of the Company’s portfolio or balance sheet, to assess civil money penalties against the Company’s officers or directors, to remove officers and directors and, if it is concluded that such conditions cannot be corrected or there is an imminent risk of loss to depositors, to terminate Northwest Bank’s deposit insurance. There could be substantial cost and management diversion in such litigation and proceedings, and any adverse determination could have a materially adverse effect on our business, brand or image, or our financial condition and results of our operations.
Data privacy and cybersecurity are areas of heightened legislative and regulatory scrutiny.
As data privacy and cybersecurity risks for the financial services industry have significantly increased in recent years, data privacy and cybersecurity issues have become the subject of increasing legislative and regulatory scrutiny. For more information regarding applicable data privacy and cybersecurity laws and regulations, see “Item 1. Business” under the heading “Supervision and Regulation—Data Privacy and Cybersecurity.”
We also make public statements about our collection, use, transfer, storage, disclosure and other processing of personal information through our privacy policies, information provided on our website and press statements. Although we endeavor to comply with our public statements and documentation, we may at times fail to do so or be alleged to have failed to do so. Our public statements and documentation that provide promises and assurances about data privacy and cybersecurity can subject us to liability or regulatory action if they are found to be deceptive, unfair or misrepresentative of our actual practices. Further, our agreements with third parties may also contain contractual commitments with which we are required to adhere related to data privacy and cybersecurity.
Ensuring that our collection, use, transfer, storage, disclosure and other processing of personal information complies with increasingly stringent and evolving data privacy and cybersecurity laws and regulations, as well as our contractual commitments and other obligations related to data privacy and cybersecurity, can increase our costs, expose us to increased liability and regulatory risk, and result in other adverse effects. We also may be adversely affected if we become subject to new data privacy or cybersecurity laws and regulations or if existing laws and regulations are amended or interpreted in such a manner that requires us to change our business practices, policies or systems or otherwise incur significant additional costs in order to comply. Any failure to address data privacy and cybersecurity concerns or to comply with applicable data privacy or cybersecurity laws, regulations, contractual commitments or other obligations, or any perceived failure with respect to the foregoing, even if unfounded, could result in litigation, liability, regulatory action, fines, penalties, sanctions, claims, orders to cease or change our processing of personal information, changes to our business practices, reputational harm or other adverse effects.
Risks Related to Market Interest Rates
The reversal of the historically low interest rate environment has and may continue to adversely affect our net interest income and profitability.
The Federal Reserve Board decreased benchmark interest rates significantly, to near zero, in response to the COVID-19 pandemic. Beginning in 2022, the Federal Reserve Board reversed its policy of near zero interest rates given its concerns over inflation. Market interest rates have risen significantly in response to the Federal Reserve Board’s rate increases. Although they have decreased since
late 2023 in response to the Federal Reserve Board’s rate decreases, they remain at historically high levels. As discussed below, the increase in market interest rates has had, and may continue to have, an adverse effect on our net interest income and profitability.
Changes in interest rates could adversely affect our results of operations and financial condition.
Our results of operations and financial condition could be significantly affected by changes in interest rates. Our results of operations and net interest income depend substantially on our net interest income, which is the difference between the interest income we earn on our interest-earning assets, such as loans and investment securities, and the interest expense we pay on our interest-bearing liabilities, such as deposits, borrowings and trust preferred securities. Our net interest income could be adversely impacted by changes in the level and pace of change of interest rates or the slope of the Treasury yield curve, as well as balance sheet growth, customer loan and deposit preferences and competitive dynamics. In addition, our net interest income may be adversely affected by resurgent inflationary pressures and new global supply chain challenges, fiscal policies, geopolitical matters, including as a result of changes in U.S. presidential administrations or Congress, the implementation of tariffs and other protectionist trade policies, weather events or other developments.
Changes in interest rates may also affect the average life of loans and mortgage-related securities. Decreases in interest rates can result in increased prepayments of loans and mortgage-related securities, as borrowers refinance to reduce their borrowing costs. Under these circumstances, we are subject to reinvestment risk to the extent that we are unable to reinvest the cash received from such prepayments at rates that are comparable to the rates on existing loans and investment securities. Additionally, increases in interest rates may decrease loan demand and make it more difficult for borrowers to repay adjustable rate loans. Also, increases in interest rates may extend the life of fixed rate assets, which would restrict our ability to reinvest in higher yielding alternatives, and may result in customers withdrawing certificates of deposit early so long as the early withdrawal penalty is less than the interest they could receive as a result of the higher interest rates.
Changes in interest rates also affect the current fair value of our interest-earning investment securities portfolio. Generally, the value of securities moves inversely with changes in interest rates. At December 31, 2024, the fair value of our investment and mortgage-backed securities portfolio totaled $1.7 billion. Net unrealized losses on these securities totaled $282 million at December 31, 2024. During the year ended December 31, 2024, we incurred other comprehensive loss of $6 million related to net changes in unrealized holding losses in the available-for-sale investment securities portfolio.
The current level of, or any increases in market interest rates may reduce our mortgage banking income. We generate revenues primarily from gains on the sale of mortgage loans to investors, and from the amortization of deferred mortgage servicing rights. We recognized noninterest income of $2 million on mortgage banking activities during the year ended December 31, 2024. We also earn interest on loans held for sale while awaiting delivery to our investors. In a rising or higher interest rate environment, our mortgage loan originations may decrease, resulting in fewer loans that are available for sale. This would result in a decrease in interest income and a decrease in revenues from loan sales. In addition, our results of operations are affected by the amount of noninterest expense associated with mortgage banking activities, such as salaries and employee benefits, occupancy, equipment, data processing and other operating costs. During periods of reduced loan demand, our results of operations may be adversely affected to the extent that we are unable to reduce expenses commensurate with the decline in mortgage loan origination activity.
Hedging against interest rate exposure may adversely affect our earnings.
On occasion we have employed various financial methodologies that limit, or “hedge,” the adverse effects of rising or decreasing interest rates on our loan portfolios and short-term liabilities. We also engage in hedging strategies with respect to arrangements with our customers. Our hedging activity varies based on the level and volatility of interest rates and other changing market conditions. Hedging strategies can be imperfect and may fail to protect us from loss. Moreover, hedging activities could result in costs if the hedge proves to be ineffective. Additionally, hedging activities could fail to protect us or adversely affect us because, among other things:
•available interest rate hedging may not correlate to the risk for which protection is sought;
•the duration of the hedge may not match the duration of the related asset or liability;
•the counterparty in the hedging transaction may default on its obligation to pay;
•the credit quality of the counterparty may degrade to such an extent that it impairs our ability to sell or assign our side of the hedging transaction;
•the value of derivatives used for hedging may be adjusted from time to time in accordance with accounting rules to reflect changes in fair value; and/or
•downward adjustments, or “mark-to-market” losses, would reduce our stockholders’ equity.
Risks Related to Economic Conditions
A worsening of economic conditions in our market area could reduce demand for our products and services and/or result in increases in our level of non-performing loans, which could adversely affect our operations, financial condition and earnings.
Our performance is significantly impacted by the general economic conditions in our primary markets in Pennsylvania, New York, Ohio, and Indiana. At December 31, 2024, 36% of our loan portfolio was secured by properties located in Pennsylvania, and 16% of our loan portfolio was secured by properties located in New York, with a large portion of the rest of our loans secured by real estate located in Ohio and Indiana. Local economic conditions have a significant impact on the ability of our borrowers to repay loans and the value of the collateral securing loans.
A deterioration in economic conditions could result in the following consequences, any of which could have a material adverse effect on our business, financial condition, liquidity and results of operations:
•demand for our products and services may decline;
•loan delinquencies, problem assets and foreclosures may increase;
•we may increase our allowance for credit losses;
•collateral for loans, especially real estate, may decline in value, in turn reducing customers’ future borrowing power, and reducing the value of assets and collateral associated with existing loans; and
•the net worth and liquidity of loan guarantors may decline, impairing their ability to honor commitments to us.
In addition, deflationary pressures could have a significant negative effect on our borrowers, especially our business borrowers, and the values of underlying collateral securing loans, which could negatively affect our financial performance.
The monetary policies of the Federal Reserve Board could adversely affect our business, financial condition and results of operations.
In addition to being affected by general economic conditions, our earnings and growth are affected by the policies of the Federal Reserve Board. An important function of the Federal Reserve Board is to regulate the money supply and credit conditions. Among the instruments used by the Federal Reserve Board to implement these objectives are open market purchases and sales of U.S. government securities, adjustments of the discount rate and changes in banks’ reserve requirements against bank deposits. These instruments are used in varying combinations to influence overall economic growth and the distribution of credit, bank loans, investments and deposits. Their use also affects interest rates charged on loans or paid on deposits.
The monetary policies of the Federal Reserve Board have had a significant effect on the operating results of financial institutions in the past and are expected to continue to do so in the future. The effects of such policies upon our business, financial condition and results of operations cannot be predicted.
Inflation can have an adverse impact on our business and on our customers.
Inflation risk is the risk that the value of assets or income from investments will be worth less in the future as inflation decreases the value of money. Inflation generally increases the cost of goods and services we use in our business operations, such as electricity and other utilities, which increases our non-interest expenses. Furthermore, our customers are also affected by inflation and the rising costs of goods and services used in their households and businesses, which could have a negative impact on their ability to repay their loans with us. Sustained higher interest rates by the Federal Reserve Board to tame persistent inflationary price pressures could also push down asset prices and weaken economic activity. A deterioration in economic conditions in the United States and our markets could result in an increase in loan delinquencies and non-performing assets, decreases in loan collateral values and a decrease in demand for our products and services, all of which, in turn, would adversely affect our business, financial condition and results of operations.
Beginning in 2022, in response to a pronounced rise in inflation, the Federal Reserve Board reversed its policy of “near zero” interest rates and has materially increased the target federal funds rate. As discussed under “Risks Related to Market Interest Rates—Changes in interest rates could adversely affect our results of operations and financial condition,” as inflation increases and market interest rates rise the value of our investment securities, particularly those with longer maturities, would decrease, although this effect can be less pronounced for floating rate instruments.
We could be adversely affected by the soundness of other financial institutions and other third parties we rely on.
Adverse developments affecting the overall strength and soundness of other financial institutions, the financial services industry as a whole and the general economic climate and the U.S. Treasury market could have a negative impact on perceptions about the strength and soundness of the Company’s business even if the Company is not subject to the same adverse developments. In addition, adverse developments with respect to third parties with whom the Company has important relationships could also negatively impact
perceptions about the Company. These perceptions about the Company could cause its business to be negatively affected and exacerbate the other risks that the Company faces.
The Company may be impacted by actual or perceived soundness of other financial institutions, including as a result of the financial or operational failure of a major financial institution, or concerns about the creditworthiness of such a financial institution or its ability to fulfill its obligations, which can cause substantial and cascading disruption within the financial markets and increased expenses, including FDIC insurance premiums, and could affect the Company’s ability to attract and retain depositors and to borrow or raise capital. For example, during 2023 the FDIC took control and was appointed receiver of Silicon Valley Bank, Signature Bank, and First Republic Bank. The failure of other banks and financial institutions and the measures taken by governments, businesses, and other organizations in response to those events could adversely impact the Company’s business, financial condition and results of operations. These bank failures have led to an increased customer and regulatory focus on funding and liquidity at financial institutions, the composition of its deposits, including the amount of uninsured deposits, the amount of accumulated other comprehensive loss, capital levels and interest rate risk management. If we are unable to meet the increased expectations of our customers and regulatory agencies, it may have a material adverse effect on our financial condition and results of operations.
The Company’s ability to engage in routine funding transactions could be adversely affected by the actions and commercial soundness of other financial institutions. Financial services institutions are interrelated as a result of trading, clearing, counterparty or other relationships. We have exposure to many different industries and counterparties, and routinely execute transactions with counterparties in the financial services industry, including commercial banks, the FHLB, brokers and dealers, investment banks and other institutional customers. As a result, defaults by, or even rumors or questions about, one or more financial services institutions, or the financial services industry generally, have led to market-wide liquidity problems and losses of depositor, creditor and counterparty confidence and could lead to losses or defaults by the Company or by other institutions. Many of these transactions expose us to credit risk in the event of a default by a counterparty or client. In addition, our credit risk may be exacerbated when our collateral cannot be foreclosed upon or is liquidated at prices not sufficient to recover the full amount of the credit or derivative exposure due. Furthermore, successful operation of our debit card and cash management solutions business depends on the soundness of third party processors, clearing agents and others that we rely on to conduct our merchant business. Any losses resulting from such third parties could adversely affect our business, financial condition and results of operations.
A lack of liquidity could adversely affect the Company’s financial condition and results of operations.
Liquidity is essential to the Company’s business. The Company relies on its ability to generate deposits and effectively manage the repayment of its liabilities to ensure that there is adequate liquidity to fund operations. An inability to raise funds through deposits, borrowings, the sale and maturities of loans and securities and other sources could have a substantial negative effect on liquidity. The Company’s most important source of funds is its deposits. Deposit balances can decrease when customers perceive alternative investments as providing a better risk adjusted return, which are strongly influenced by such external factors as the direction of interest rates, local and national economic conditions and the availability and attractiveness of alternative investments. Further, the demand for deposits may be reduced due to a variety of factors such as negative trends in the banking sector, the level of and/or composition of our uninsured deposits, demographic patterns, changes in customer preferences, reductions in consumers’ disposable income, the monetary policy of the Federal Reserve Board or regulatory actions that decrease customer access to particular products. Increased adoption of consumer banking technology can result in reduced deposit stickiness due to the relative ease with which depositors may transfer deposits if confidence is lost in Northwest Bank. If customers move money out of bank deposits and into other investments such as money market funds, the Company would lose a relatively low-cost source of funds, which would increase its funding costs and reduce net interest income. Any changes made to the rates offered on deposits to remain competitive with other financial institutions may also adversely affect profitability and liquidity.
Other primary sources of funds consist of cash flows from operations, maturities and sales of investment securities and/or loans, brokered deposits, borrowings from the FHLB and/or Federal Reserve discount window, and unsecured borrowings. The Company also may borrow funds from third-party lenders, such as other financial institutions. The Company’s access to funding sources in amounts adequate to finance or capitalize its activities, or on terms that are acceptable, could be impaired by factors that affect the Company directly or the financial services industry or economy in general, such as disruptions in the financial markets or negative views and expectations about the prospects for the financial services industry, a decrease in the level of the Company’s business activity as a result of a downturn in markets or by one or more adverse regulatory actions against the Company or the financial sector in general. Any decline in available funding could adversely impact the Company’s ability to originate loans, invest in securities, meet expenses, or to fulfill obligations such as meeting deposit withdrawal demands, any of which could have a material adverse impact on its liquidity, business, financial condition and results of operations.
Risks Related to our Business Strategy
Acquisitions may disrupt our business and dilute stockholder value.
We regularly evaluate merger and acquisition opportunities with other financial institutions and financial services companies. As a result, negotiations may take place and future mergers or acquisitions involving cash, debt, or equity securities may occur at any time. We would seek acquisition partners that offer us either significant market presence or the potential to expand our market footprint and improve profitability through economies of scale or expanded services. For example, on December 16, 2024, we entered into the Merger Agreement with Penns Woods. The Merger Agreement provides for a business combination whereby Penns Woods will merge with and into the Company, with the Company as the surviving corporation in the merger.
Acquiring other banks, such as Penns Woods, businesses, or branches may have an adverse effect on our financial results and may involve various other risks commonly associated with acquisitions, including, among other things:
•difficulty in estimating the value of the target company;
•payment of a premium over book and market values that may dilute our tangible book value and earnings per share in the short and long term;
•potential exposure to unknown or contingent liabilities of the target company;
•exposure to potential asset quality problems of the target company;
•potential volatility in reported income associated with goodwill impairment losses;
•difficulty and expense of integrating the operations and personnel of the target company;
•inability to realize the expected revenue increases, cost savings, increases in geographic or product presence, and/or other projected benefits of the acquisition;
•potential disruption to our business;
•potential diversion of our management’s time and attention;
•the possible loss of key employees and customers of the target company; and
•potential changes in banking or tax laws or regulations that may affect the target company.
Loans that were acquired as part of our acquisitions of other depository institutions, such as Penns Woods, were not underwritten or originated in accordance with our credit standards, including environmental matters, and we did not have long-standing relationships with many of these borrowers at the time of acquisition. The acquired loans are re-risked at that date of acquisition based on our credit standards, which can temporarily increase loans classified as special mention and substandard for a period of time until these loans are integrated and conform to our credit standards. Although we reviewed the loan portfolios of each institution acquired as part of the diligence process, and believe that we have established reasonable credit marks with regard to all loans acquired, we may incur losses in excess of the credit marks with regard to these acquired loans, and any such losses, if they occur, may have a material adverse effect on our business, financial condition, and results of operations.
Our merger with Penns Woods and other mergers and acquisitions may not enhance our cash flows, business, financial condition, results of operations or prospects as expected and such acquisitions may have an adverse effect on our results of operations, particularly during periods in which the acquisitions are being integrated into our operations.
Our continued pace of growth may require us to raise additional capital during unfavorable market conditions.
We are required by federal regulatory authorities to maintain adequate levels of capital to support our operations. We anticipate that we will have sufficient capital resources to satisfy our capital requirements for the foreseeable future. We may at some point, however, need to raise additional capital to support our continued growth. If we raise capital through the issuance of additional shares of our common stock or other securities, it would dilute the ownership interests of existing stockholders and may dilute the per share book value of our common stock. New investors may also have rights, preferences and privileges senior to our current stockholders, which may adversely impact our current stockholders. Also, the need to raise additional capital may force our management to spend more time in managerial and financing-related activities than in operational activities.
Our ability to raise additional capital, if needed, will depend on conditions in the capital markets at that time, which are outside of our control, and on our financial performance. Accordingly, we may not be able to raise additional capital, if needed, with favorable terms. If we cannot raise additional capital when needed, our ability to further expand our operations through internal growth and acquisitions could be materially impaired.
New lines of business or new products and services may subject us to additional risks.
From time to time, we may implement new lines of business or offer new products and services within existing lines of business. In addition, we will continue to make investments in research, development, and marketing for new products and services. There are substantial risks and uncertainties associated with these efforts, particularly in instances where the markets are not fully developed. In developing and marketing new lines of business and/or new products and services we may invest significant time and resources. Initial timetables for the development and introduction of new lines of business and/or new products or services may not be achieved and price and profitability targets may not prove feasible. Furthermore, if customers do not perceive our new offerings as providing
significant value, they may fail to accept our new products and services. External factors, such as compliance with regulations, competitive alternatives, and shifting market preferences, may also impact the successful implementation of a new line of business or a new product or service. Furthermore, the burden on management and our information technology of introducing any new line of business and/or new product or service could have a significant impact on the effectiveness of our system of internal controls. Failure to successfully manage these risks in the development and implementation of new lines of business or new products or services could have a material adverse effect on our business, financial condition and results of operations.
Our business strategy includes growth, and our financial condition and results of operations could be negatively affected if we fail to grow or fail to manage our growth effectively.
Our business strategy includes growth in assets, deposits and the scale of our operations. Achieving our growth targets will require us to attract customers that currently bank at other financial institutions in our market, thereby increasing our share of the market. Our ability to successfully grow will depend on a variety of factors, including our ability to attract and retain experienced bankers, the continued availability of desirable business opportunities, the competitive responses from other financial institutions in our market area and our ability to manage our growth. In order to successfully manage our growth, the Company may need to adopt and effectively implement new or revise existing policies, procedures, and controls, as well as hire additional employees or pay higher salaries to retain existing employees, to maintain credit quality, control costs and oversee the Company’s operations. Growth opportunities may not be available or we may not be able to manage our growth successfully. If we do not manage our growth effectively, our financial condition and operating results could be negatively affected.
Uncertainties associated with increased loan originations may result in errors in our judgment of collectability, which may lead to additional provisions for credit losses or charge-offs, which would negatively affect our operations.
Increasing loan originations would likely require us to lend to borrowers with which we have limited experience. Accordingly, we would not have a significant payment history pattern with which to judge future collectability. Further, newly originated loans have not been subjected to unfavorable economic conditions. As a result, it may be difficult to predict the future performance of newly originated loans. These loans may have delinquency or charge-off levels above our recent historical experience, which could adversely affect our future performance.
Risk Related to Competitive Matters
Strong competition may limit growth and profitability.
Competition in the banking and financial services industry is intense. We compete with commercial banks, savings institutions, mortgage brokerage firms, credit unions, finance companies, fintech companies, money market funds and other mutual funds, insurance companies, and brokerage and investment banking firms operating locally and elsewhere. Many of these competitors (whether regional or national institutions) have substantially greater resources and lending limits than we have and may offer certain services that we do not or cannot provide. In addition, some have competitive advantages such as the credit union exemption from paying federal income tax. Competitive factors driven by consumer sentiment or otherwise can also reduce our ability to generate fee income, such as through overdraft fees. Our profitability depends upon our ability to successfully compete in our market areas.
We may be subject to intellectual property-related disputes or may fail to effectively obtain, maintain, defend, or enforce our intellectual property rights.
Our competition, or other third parties, may allege that we have infringed, misappropriated, or otherwise violated their intellectual property rights or challenge our rights in intellectual property that is important to our business. To defend against such allegations and challenges, we may have to engage in litigation that could be expensive, time-consuming, disruptive to our operations, and distracting to management. We may not be successful in defending against any such allegations or challenges, which could subject us to significant monetary damages, require significant license fees or royalty payments (which also may not be available on acceptable terms), restrict our ability to offer our products or services, or otherwise require changes to the way we conduct our business.
We rely on, and expect to continue to rely on, a variety of measures to obtain, maintain, defend, and enforce our intellectual property rights, including intellectual property laws and contractual provisions, including confidentiality agreements, invention assignments, and intellectual property licenses. These measures may not prevent third parties from infringing, misappropriating or otherwise violating our intellectual property rights or otherwise duplicating or improving upon our products or services, any of which may adversely affect our competitive position. Any of the foregoing could have a material adverse effect on our business, financial condition and results of operations.
Risks Related to Operational Matters
Risks associated with system failures, interruptions, or cybersecurity breaches could negatively affect our earnings.
Information technology systems are critical to our business. We use various information technology systems to manage our customer relationships, general ledger, deposits, and loans. We have established policies and procedures to prevent or limit the impact of system failures, interruptions, and cybersecurity breaches, but such events may still occur or may not be adequately addressed if they do occur. In addition, any compromise of our information technology systems could deter customers from using our products and services. Although we rely on information technology systems designed to provide security and authentication necessary to effect the secure transmission of data, these precautions may not protect our information technology systems from system failures, interruptions, or cybersecurity breaches.
Despite the defensive measures we take designed to manage our internal technological and operational infrastructure, threats may originate externally from foreign governments, state-sponsored actors, organized crime, terrorists, hackers, and other third parties or internally from within our organization, including our personnel or third-party providers (including infrastructure-support providers and application developers). Furthermore, we may not be able to ensure that all of our clients, suppliers and other third-party providers, counterparties and other third parties have appropriate controls in place to protect the confidentiality of the information that they exchange with us, particularly where such information is transmitted by electronic means. Our heavy reliance on information technology systems exposes us to operational risks, which include the risk of malfeasance by personnel or persons outside of our organization, denial of service attacks, computer viruses, worms, ransomware, social engineering (including phishing attacks), service outages, software bugs or defects, server failures, errors relating to transaction processing and technology, failures to properly implement systems upgrades, breaches of our internal control systems and compliance requirements, business continuation and disaster recovery issues and other system failures, interruptions, or cybersecurity breaches. Such risks have significantly increased in recent years in part because of the proliferation of new technologies, including artificial intelligence, and the use of the internet and telecommunications technologies to conduct financial transactions.
In addition, we outsource a significant amount of our data processing to, and otherwise rely on, certain third-party providers, and our ability to monitor such third-party providers’ data privacy and cybersecurity practices is limited. If these third-party providers encounter difficulties or experience system failures, interruptions, or cybersecurity breaches, or if we have difficulty communicating with them, our ability to adequately process and account for transactions could be affected, and our business operations could be adversely affected. Additionally, any system failures, interruptions or cybersecurity breaches impacting such third-party providers may not be disclosed to us in a timely manner, and we cannot guarantee that we can obtain adequate or any reimbursement from such third-party providers in the event we should suffer any disruption, compromise, failure, liability, reputational harm or other cost or expense. Due to applicable laws and regulations or contractual obligations, we may be held responsible for system failures, interruptions, or cybersecurity breaches attributed to such third-party providers as they relate to the information we share with them.
The occurrence, or perceived occurrence (whether unfounded or not), of any system failure, interruption, or cybersecurity breach affecting our information technology systems, or those of our third-party providers, could damage our reputation, result in a loss of customers and business, violate applicable laws and regulations, subject us to additional regulatory scrutiny, or expose us to litigation, liability or other costs or expenses. Any of these events could have a material adverse effect on our financial condition and results of operations.
In addition, any insurance coverage we may have may not be adequate to compensate for losses from any of the foregoing. We also cannot be sure that such insurance coverage will continue to be available on acceptable terms or at all or that any applicable insurer will not deny coverage as to any future claim.
Our risk management framework may not be effective in mitigating risk and reducing the potential for significant losses.
Our risk management framework is designed to minimize risk and loss to us. We seek to identify, measure, monitor, report and control our exposure to risk, including strategic, market, liquidity, credit, interest rate, compliance and operational risks. While we use a broad and diversified set of risk monitoring and mitigation techniques, these techniques are inherently limited because they cannot anticipate the existence or future development of currently unanticipated or unknown risks. Recent economic conditions and heightened legislative and regulatory scrutiny of the financial services industry, among other developments, have increased our level of risk. Accordingly, we could suffer losses as a result of our failure to properly anticipate and manage these risks.
Our board of directors relies to a large degree on management and outside consultants in overseeing cybersecurity risk management.
The Board of the Company has an Innovation and Technology Sub-Committee, consisting of wholly independent directors chartered, among other items, with a focus on cybersecurity risk. Additionally, the Company’s Board has a designated Risk Management Sub-Committee with the responsibility of monitoring enterprise level risks, including those related to cybersecurity. Furthermore, management of the Company has both an Enterprise Risk Management Committee and an Information Technology Steering
Committee (“ITSC”), both of which are comprised of the most senior members of management, including the Chief Executive Officer, Chief Information Officer (“CIO”), and Chief Operating Officer. The ITSC meets monthly, or more frequently if needed, and the ERMC meets quarterly, or more frequently if needed. Material items related to cybersecurity are reported to the Innovation and Technology and Risk Management Sub-Committees. The Company also engages outside consultants to support its cybersecurity efforts. The directors of the Company do not have significant experience in cybersecurity risk management in other business entities comparable to the Company and rely on members of management, including, but not limited to, the CISO, CIO, Chief Operational Risk Management Officer, Chief Technology Officer and Chief Data Officer, for cybersecurity guidance.
Our business may be adversely affected by an increasing prevalence of fraud and other financial crimes.
Our loans to businesses and individuals and our deposit relationships and related transactions are subject to exposure to the risk of loss due to fraud and other financial crimes. Incidents of fraud and other financial crimes could also lead to significant reputational risks and other negative effects on our financial condition and results of operations. Nationally, reported incidents of fraud and other financial crimes have increased. We have also experienced losses due to apparent fraud and other financial crimes. While we have policies and procedures designed to prevent such losses, losses may still occur.
Risks Related to Environmental and Other Global Matters
We are subject to environmental liability risk associated with lending activities.
A significant portion of our loan portfolio is secured by real estate, and we could become subject to environmental liabilities with respect to one or more of these properties. During the ordinary course of business, we may foreclose on and take title to properties securing defaulted loans. In doing so, there is a risk that hazardous or toxic substances could be found on these properties. If hazardous conditions or toxic substances are found on these properties, we may be liable for remediation costs, as well as for personal injury and property damage, civil fines and criminal penalties regardless of when the hazardous conditions or toxic substances first affected any particular property. Environmental laws may require us to incur substantial expenses to address unknown liabilities and may materially reduce the affected property’s value or limit our ability to use or sell the affected property. In addition, future laws or regulations or more stringent interpretations or enforcement policies with respect to existing laws and regulations may increase our exposure to environmental liability, and heightened pressure from investors and other stakeholders may require to incur additional expenses with respect to environmental matters. Although we have policies and procedures to perform an environmental review before initiating any foreclosure action on nonresidential real property, these reviews may not be sufficient to detect all potential environmental hazards. The remediation costs and any other financial liabilities associated with an environmental hazard could have a material adverse effect on us.
A slowdown in economic growth or a resumption of recessionary economic conditions due to global events could have an adverse effect on our business in the future.
The economy is subject to worldwide events, such as the COVID-19 pandemic and geopolitical tensions in the Middle East and Europe, as well as domestic events, any or all of which could impact inflationary pressures and interest rates to dampen demand. These and other political and market developments are affecting and could continue to affect consumer confidence levels and cause adverse changes in loan payment patterns, causing increases in delinquencies and default rates, which may impact our charge-offs and the provision for credit losses. Changes in the financial services industry and the effects of current and future law and regulations that may be imposed in response to future market developments also could negatively affect us by restricting our business operations, including our ability to originate or sell loans, and adversely impact our financial performance.
Climate-related risks could adversely affect our business and performance, including indirectly through impacts on our customers.
There continues to be concern, including on the part of our regulators, regarding climate change and its impacts. Climate change could manifest as a financial risk to us either through changes in the physical climate or from the process of transitioning to a low-carbon economy. Both physical risks and transition risks associated with climate change could have negative impacts on the financial condition or creditworthiness of our customers, and on its exposure to those customers. Physical risks include the increased frequency or severity of acute weather events, such as floods, wildfires and tropical cyclones, and chronic shifts in the climate, such as persistent changes in precipitation levels, rising sea levels, or increases in average ambient temperature. Transition risks arise from societal adjustment to a low-carbon economy, such as changes in public policy, adoption of new technologies or changes in consumer preferences towards low-carbon goods and services. These risks could also be influenced by changes in the physical climate.
Concerns over the anticipated and unanticipated impacts of climate change (including physical risk and transition risk) have led and will continue to lead to governmental efforts to mitigate those impacts. We may be compelled to change or cease some of our business or operational practices or to incur additional capital, compliance, and other costs because of climate- or environmental-driven
changes in applicable law or supervisory expectations or due to related political, social, market, or similar pressure. We and our customers may face cost increases, asset value reductions, operating process changes and other issues. In addition, we could face reductions in creditworthiness on the part of some customers or in the value of asset securing loans. Our efforts to take these risks into account in making lending and other decisions may not be effective in protecting us from the negative impact of new laws and regulations or changes in consumer or business behavior.
Further, there is increased scrutiny of climate change-related policies, goals and disclosures. Our stakeholders may disagree with these policies and goals or, conversely, believe that these policies and goals are insufficient. This may lead to a decrease in demand for our products and services or damage to our reputation. We may also incur additional costs and require additional resources as we evolve our strategy, practices and related disclosures with respect to these matters. In addition, there are and will continue to be challenges related to capturing, verifying, analyzing and disclosing climate-related data that is subject to measurement uncertainties.
Our business, financial condition, and results of operations could be adversely affected by natural disasters, health epidemics, and other catastrophic events.
We could be adversely affected if key personnel or a significant number of employees were to become unavailable due to a pandemic, natural disaster, war, act of terrorism, accident, or other reason. Any of these events could result in the temporary reduction of operations, employees, and customers, which could limit our ability to provide services. Additionally, many of our borrowers may suffer property damage, experience interruption of their businesses or lose their jobs after such events. Those borrowers might not be able to repay their loans, and the collateral for such loans may decline significantly in value.
Risks Related to Accounting Matters
If our intangible assets, including goodwill, are either partially or fully impaired in the future, it would decrease earnings.
We are required to test our goodwill and other identifiable intangible assets for impairment on an annual basis and more regularly if indicators of impairment exist. The impairment testing process considers a variety of factors, including the current market price of our common stock, the estimated net present value of our assets and liabilities and information concerning the terminal valuation of similar insured depository institutions. Future impairment testing may result in a partial or full impairment of the value of our goodwill or other identifiable intangible assets, or both. If an impairment determination is made in a future reporting period, our earnings and the book value of these intangible assets will be reduced by the amount of the impairment. However, the recording of such an impairment loss would have no impact on the tangible book value of our shares of common stock or our regulatory capital levels.
Changes in management’s estimates and assumptions may have a material impact on our Consolidated Financial Statements and our financial condition or operating results.
In preparing this annual report as well as periodic reports we are required to file under the Exchange Act, including our Consolidated Financial Statements, our management is and will be required under applicable rules and regulations to make estimates and assumptions as of a specified date. These estimates and assumptions are based on management’s best estimates and experience as of that date and are subject to substantial risk and uncertainty. Materially different results may occur as circumstances change and additional information becomes known. Areas requiring significant estimates and assumptions by management include our evaluation of the adequacy of our allowance for credit losses.
Risks Related to Investment Activities
We could record future losses on our investment securities portfolio.
A number of factors or combinations of factors could require us to conclude in one or more future reporting periods that an unrealized loss that exists with respect to these and other securities constitutes a credit related impairment, which could result in material losses to us. These factors include, but are not limited to, failure by the issuer to make scheduled interest payments, the issuer of the securities and their creditworthiness, any changes to the rating of the security and any adverse conditions specifically related to the security that would render us unable to forecast a full recovery in value. In addition, the fair values of securities could decline if the overall economy and the financial condition of some of the issuers deteriorates and there remains limited liquidity for these securities. During the year ended December 31, 2024, we incurred other comprehensive losses of $6 million related to net changes in unrealized holding losses in the available-for-sale investment securities portfolio.
See “Item 7. Management’s Discussion and Analysis of Financial Condition and Results of Operations—Balance Sheet Analysis—Securities” for a discussion of our securities portfolio and the unrealized losses related to the portfolio, as well as the “Marketable Securities” and “Disclosures about Fair Value of Financial Instruments” footnotes to the audited financial statements.
Our exposure to municipalities may lead to operating losses.
Our municipal bond portfolio may be impacted by the effects of economic stress on state and local governments. At December 31, 2024, we had $69 million invested in debt obligations of states, municipalities and political subdivisions (collectively referred to as our municipal bond portfolio). We also had $204 million of loans outstanding to municipalities and political subdivisions. State and local governments may experience financial stress due to: (i) declining revenues; (ii) large unfunded liabilities to government workers; and (iii) entrenched cost structures. Additionally, the debt-to-gross domestic product ratios for the majority of states have been deteriorating due to, among other factors, declines in federal monetary assistance. These challenges have led to speculation about the potential for a significant deterioration in the municipal bond market, which could materially affect our results of operations, financial condition and liquidity. We may not be able to mitigate the exposure in our municipal portfolio if state and local governments are unable to fulfill their obligations. The risk of widespread issuer defaults may also increase if there are changes in legislation that permit states, or additional municipalities and political subdivisions, to file for bankruptcy protection or if there are judicial interpretations that, in a bankruptcy or other proceeding, lessen the value of any structural protections.
The financial services sector represents a significant concentration within our investment portfolio.
Within our investment portfolio, we have a significant amount of corporate debt and mortgage-backed securities issued by companies in the financial services sector. Given current market conditions, this sector has an enhanced level of credit risk.
Potential downgrades of U.S. government securities by one or more of the credit ratings agencies could have a material adverse effect on our operations, earnings and financial condition.
A possible downgrade of the sovereign credit ratings of the U.S. government and a decline in the perceived creditworthiness of U.S. government-related obligations could impact the value of our investments, and the availability and pricing of funding transactions collateralized by those instruments. We cannot predict if, when or how any changes to the credit ratings or perceived creditworthiness of these organizations will affect economic conditions. Such ratings actions could result in a significant adverse impact on us. Among other things, a downgrade in the U.S. government’s credit rating could adversely impact the value of our securities portfolio and may trigger requirements that we post additional collateral for trades relative to these securities. A downgrade of the sovereign credit ratings of the U.S. government or the credit ratings of related institutions, agencies or instruments would significantly exacerbate the other risks to which we are subject and any related adverse effects on the business, financial condition and results of operations.
Risks Related to Our Debit and Credit Activities
Changes in card network rules or standards could adversely affect our business.
In order to provide our debit card and cash management solutions, we are members of the Visa network. As such, we are subject to card network rules that could subject us to a variety of fines or penalties that may be assessed on us. The termination of our membership or any changes in card network rules or standards, including interpretation and implementation of existing rules or standards, could increase the cost of operating our merchant services business or limit our ability to provide debit card and cash management solutions to or through our customers, and could have a material adverse effect on our business, financial condition and results of operations.
Changes in card network fees could impact our operations.
From time to time, the card networks increase the fees, known as interchange fees, that they charge to acquirers and that we charge to our merchants. It is possible that competitive pressures will result in us absorbing a portion of such increases in the future, which would increase our costs, reduce our profit margin and adversely affect our business and financial condition. In addition, the card networks require certain capital requirements. An increase in the required capital level would further limit our use of capital for other purposes.
Our business could suffer if there is a decline in the use of debit cards as a payment mechanism or if there are adverse developments with respect to the financial services industry in general.
As the financial services industry evolves, consumers may find debit financial services to be less attractive than traditional or other financial services. Consumers might not use debit card financial services for any number of reasons, including the general perception of our industry. If consumers do not continue or increase their usage of debit cards, including making changes in the way debit cards are loaded, our operating revenues and debit card deposits may remain at current levels or decline. Any projected growth for the industry may not occur or may occur more slowly than estimated. If consumer acceptance of debit financial services does not continue to develop or develops more slowly than expected or if there is a shift in the mix of payment forms, such as cash, credit cards, and debit cards, away from our products and services, it could have a material adverse effect on our financial position and results of operations.
Other Risks Related to Our Business
The corporate governance provisions in our articles of incorporation and bylaws, and the corporate governance provisions under Maryland law, may prevent or impede the holders of our common stock from obtaining representation on our Board of Directors and may impede takeovers of the Company that our board might conclude are not in the best interest of us or our stockholders.
Provisions in our articles of incorporation and bylaws may prevent or impede holders of our common stock from obtaining representation on our Board of Directors and may make takeovers of Northwest Bancshares, Inc. more difficult. As a result, our stockholders may not have the opportunity to participate in such a transaction, which could provide a premium over the prevailing price of our common stock. The provisions that may discourage takeover attempts or make them more difficult include that our Board of Directors is divided into three staggered classes. A classified board makes it more difficult for stockholders to change a majority of the directors because it generally takes at least two annual elections of directors for this to occur. Our articles of incorporation include a provision that no person will be entitled to vote any shares of our common stock in excess of 10% of our outstanding shares of common stock. This limitation does not apply to the purchase of shares by a tax-qualified employee stock benefit plan established by us. In addition, our articles of incorporation and bylaws restrict who may call special meetings of stockholders and how directors may be removed from office. Additionally, in certain instances, the Maryland General Corporation Law requires a super majority vote of our stockholders to approve a merger or other business combination with a large stockholder, if the proposed transaction is not approved by a majority of our directors.
Our ability to maintain our reputation is critical to the success of our business and the failure to do so may materially adversely affect our performance.
Our reputation is one of the most valuable components of our business. A key component of our business strategy is to rely on our reputation for customer service and knowledge of local markets to expand our presence by capturing new business opportunities from existing and prospective customers in our current market and contiguous areas. As such, we strive to conduct our business in a manner that enhances our reputation. This is done, in part, by recruiting, hiring and retaining employees who share our core values of being an integral part of the communities we serve, delivering superior service to our customers and caring about our customers and associates. If our reputation is negatively affected by the actions of our employees, by our inability to conduct our operations in a manner that is appealing to current or prospective customers, or otherwise, our business and operating results may be adversely affected.
If our government banking deposits were lost within a short period of time, this could negatively impact our liquidity and earnings.
As of December 31, 2024, we held $618 million of deposits from municipalities throughout Pennsylvania, New York, Ohio, and Indiana. These deposits may be more volatile than other deposits. If a significant amount of these deposits were withdrawn within a short period of time, it could have a negative impact on our short-term liquidity and have an adverse impact on our earnings.
Our funding sources may prove insufficient to replace deposits at maturity and support our future growth.
We must maintain sufficient liquidity to respond to the needs of depositors and borrowers. As such, we utilize a diverse set of funding sources in addition to core deposits. As we continue to grow, we are likely to become more dependent on these sources, which may include FHLB advances, proceeds from the sale of loans, federal funds purchased and brokered certificates of deposit. Adverse operating results or changes in industry conditions could lead to difficulty or an inability to maintain timely access to these additional funding sources. Our financial flexibility will be materially constrained if we are unable to maintain our access to funding or if adequate financing is not available to accommodate future growth at acceptable interest rates. If we are required to rely more heavily on more expensive funding sources to support future growth, our revenues may not increase proportionately to cover our costs. In this case, our operating margins and profitability would be adversely affected.
A protracted government shutdown may result in reduced loan originations and related gains on sale and could negatively affect our financial condition and results of operations.
During any protracted federal government shutdown, we may not be able to close certain loans and we may not be able to recognize non-interest income on the sale of loans. Some of the loans we originate are sold directly to government agencies, and some of these sales may be unable to be consummated during the shutdown. In addition, we believe that some borrowers may determine not to proceed with their home purchase and not close on their loans, which would result in a permanent loss of the related non-interest income. A federal government shutdown could also result in reduced income for government employees or employees of companies that engage in business with the federal government, which could result in greater loan delinquencies, increases in our nonperforming, criticized and classified assets and a decline in demand for our products and services.
Our inability to tailor our retail delivery model to respond to consumer preferences in banking may negatively affect earnings.
We have expanded our market presence through acquisitions and growth. Our branch network continues to be a very significant source of new business generation, however, consumers continue to migrate much of their routine banking to self-service channels. In recognition of this shift in consumer patterns, we regularly review our branch network, which has resulted in branch consolidation accompanied by the enhancement of our capabilities to serve its customers through alternate delivery channels. The benefits of this strategy will depend on our ability to realize expected expense reductions without experiencing significant customer attrition.
ITEM 1B. UNRESOLVED STAFF COMMENTS
Not applicable.
ITEM 1C. CYBERSECURITY
Risk Management and Strategy
Our risk management program is designed to identify, assess, and mitigate risks across various aspects of the Company, including credit, market, treasury, operational, compliance, model and data, and reputational risks. Cybersecurity is a critical component of this program, given the increasing reliance on technology and potential for system failure, interruption, or a cybersecurity breach to occur, which could disrupt business operations or compromise confidential, personal, sensitive or proprietary information. Our CISO is primarily responsible for this cybersecurity component and is a key member of the organization, reporting directly to the CIO (who then reports directly to our Chief Executive Officer) and, as discussed below, periodically to the Innovation and Technology Committee, Enterprise Risk Committee and to our Board of Directors. To date, the Company has not, to its knowledge, experienced an incident materially affecting or reasonably likely to materially affect the Company.
In an effort to prepare for and respond to system failures, interruptions or cybersecurity breaches, the Company has implemented a multi-layered cybersecurity program that integrates people, technology, and processes and is intended to comply with the information security standards established pursuant to the Gramm-Leach-Bliley Act (GLBA) 12 CFR 364, Appendix B. This cybersecurity program includes employee training, the use of innovative technologies, and the implementation of policies and procedures in the areas of information security, data governance, business continuity and disaster recovery, privacy, third-party risk management, and incident response. Our objective for managing cybersecurity risk is to avoid or minimize the impacts of external threat events or other efforts that penetrate, disrupt or misuse our systems or information. The cybersecurity program is built upon a foundation of advanced security technology, our internal employee team, and operations based on industry best practice and recommendations from the National Institute of Standards and Technology (NIST) Cybersecurity Maturity Framework, Federal Financial Institutions Examination Council (FFIEC) Guidelines, and Center for Internet Security (CIS) Benchmarks. This consists of controls designed to govern, identify, protect, detect, respond and recover from system failures, interruptions, and cybersecurity breaches. Our CISO and our CIO, along with key members of their teams, regularly collaborate with peer banks, industry groups, and policymakers to discuss cybersecurity trends and issues and identify best practices. The cybersecurity program is periodically reviewed by such personnel with the goal of addressing changing threats and conditions.
We also employ a variety of preventative and monitoring tools designed to monitor, block, and provide alerts regarding suspicious activity including suspected. We have established processes and systems designed to mitigate cybersecurity risk, including regular and ongoing education and training for employees, preparedness simulations and tabletop exercises, and recovery and resilience tests. We engage in regular assessments of our infrastructure, software systems, and network architecture, using internal cybersecurity experts and third-party specialists. We also actively monitor our email gateways for incoming and outgoing malicious emails and monitor remote connections as a significant portion of our workforce has the option to work remotely.
The Company relies on third-party vendor solutions to support its operations. Many of these their-party vendors, especially in the financial services industry, have access to confidential, personal, sensitive and proprietary information. To mitigate the cyber, privacy and other operational risks associated with the use of third-party vendors, the Company maintains a third-party risk management program, which is implemented through a third-party risk management policy and includes a detailed onboarding process and periodic reviews of third-party vendors with access to confidential, personal, sensitive and propriety information. The third-party risk management policy applies to any business arrangement between the Company and another individual or entity, by contract or otherwise, in alignment with the Interagency Guidance on Third-Party Relationships: Risk Management. The third-party risk management program is audited periodically in accordance with our Board approved internal audit plan.
We leverage internal and third-party auditors and independent third-party sources to periodically review our processes, systems, and controls related to our cybersecurity security program. This includes assessing control design and operating effectiveness and recommendations to strengthen our cybersecurity program. Regular internal monitoring is integral to the Company’s risk assessment process, which includes regular testing of internal key controls, systems, and procedures. In addition, independent third-party penetration testing of the effectiveness of security controls and preparedness measures is conducted at least annually or more often, if warranted by the risk assessment or other external factors. Management determines the scope and objectives of the penetration analysis.
We maintain both an incident response plan and a crisis management plan (the “Plans”) that provide a documented framework for responding to actual or potential system failures, interruptions, or cybersecurity breaches, including timely notification of and escalation to the appropriate Board-approved management committees as discussed further below. The Plans are coordinated through the Business Resiliency Manager and Major Incident Manager, who ultimately report to the CISO and the CIO respectively, and key
members of management who are embedded into the Plans by their design. The Plans facilitate coordination across multiple parts of our organization and are evaluated at least annually.
Integral elements of the Plans related to the Company’s response to cybersecurity vulnerabilities include the following:
•Identifying the appropriate team and any appropriate sub-teams to address specific system failures, interruptions, or cybersecurity breaches, or categories thereof.
•Coordinating incident or crisis management activities, including developing, maintaining, and following appropriate procedures to respond to and document identified system failures, interruptions, or cybersecurity breaches.
•Conducting post-incident reviews to gather feedback on incident response procedures and address any identified gaps in cybersecurity measures.
•Providing training and conducting periodic exercises to promote employee and stakeholder preparedness and awareness of the Plans.
•Reviewing the Plans at least annually, or whenever there is a material change in the Company’s business practices that may reasonably affect its incident response procedures.
Not withstanding our defensive measures and processes, the threats posed by system failures, interruptions, or cybersecurity breaches are severe. For further discussion of risks from cybersecurity threats, see the section captioned “Risks Related to Operational Matters” in Item 1A. Risk Factors.
Governance. Our CISO is accountable for managing our enterprise cybersecurity department and delivering our cybersecurity program. The responsibilities of this department include privacy, resiliency, cybersecurity risk assessment, defense operations, incident response, vulnerability assessment, threat intelligence, identity access governance, and the evaluation of third-party risk management and business resilience as it relates to the cybersecurity program.
The foregoing responsibilities are covered on a day-to-day basis by our CISO and their team. The cybersecurity department consists of cybersecurity professionals with varying degrees of education and experience. Individuals within the cybersecurity department are generally subject to professional education and certification requirements. Our CISO has substantial relevant expertise and formal training in the areas of cybersecurity risk management, including 25 years of cybersecurity experience in the financial services, retail, insurance sectors.
Our Board of Directors has established management committees including the Innovation and Technology Steering Committee (ITSC), which focuses on overseeing our information security and technology programs, including management’s actions to identify, assess, mitigate, and remediate or prevent material cybersecurity issues and risks, and the Operational Risk Management Committee, which focuses on the identification, monitoring, assessment, and management of risk associated with our cybersecurity program. These committees provide oversight and governance of the cybersecurity program and are chaired by the CIO and Chief Operational Risk Management Officer, respectively, and include the CISO and other key departmental managers from throughout the Company. The ITSC meets quarterly and the Operational Risk Management Committee meets at least quarterly to provide oversight of the risk management strategy, standards, policies, practices, controls, and mitigation and prevention efforts employed to manage cybersecurity risks. More frequent meetings occur from time to time in accordance with the incident response plan to facilitate timely informing and monitoring efforts. The CISO reports summaries of key issues, including significant system failures, interruptions or cybersecurity breaches, discussed at committee meetings and the actions taken to the Innovation and Technology Committee of our Board of Directors on a quarterly basis (or more frequently as may be required by the incident response plan). Additionally, the Chief Operational Risk Management Officer reports summaries of key cybersecurity risks to the Risk Committee of our Board of Directors on a quarterly basis.
The Innovation and Technology Committee of our Board of Directors is responsible for overseeing our cybersecurity program, including management’s actions to identify, assess, mitigate, and remediate or prevent material cybersecurity issues and risks. Our CISO and our CIO provide quarterly reports to the Innovation and Technology Committee regarding our cybersecurity program, key enterprise cybersecurity initiatives, and other matters relating to cybersecurity processes. The Innovation and Technology Committee reviews and approves our cybersecurity and technology budgets and strategies annually. Additionally, the Risk Committee of our Board of Directors reviews key metrics summarizing our cybersecurity risk profile on a quarterly basis. The Innovation and Technology Committee and Risk Committee each provide a report of their activities to our full Board of Directors at each Board meeting.
Lastly, at least annually, the CISO reports directly to our Board of Directors the overall status of the cybersecurity program and the Company’s compliance with the Interagency Guidelines for Safeguarding Customer Information. Any material findings related to the risk assessment, risk management and control decisions, service provider arrangements, results of testing, system failures, interruptions or cybersecurity breaches are discussed as are management’s responses and any recommendations for program changes.
ITEM 2. PROPERTIES
As of December 31, 2024, we conducted our business through our main office located in Warren, Pennsylvania, 74 other full-service offices and eight free-standing drive-up locations throughout our market area in central and western Pennsylvania, 27 full-service offices and one free-standing drive-up location in western New York, 10 full-service offices and one free-standing drive-up location in eastern Ohio, and 19 full-service offices and one free-standing drive-up location in Indiana. At December 31, 2024, our premises and equipment had an aggregate net book value of approximately $124 million.
ITEM 3. LEGAL PROCEEDINGS
Northwest Bancshares, Inc. and its subsidiaries are subject to various legal actions arising in the normal course of business. In the opinion of management, the resolution of these legal actions is not expected to have a material adverse effect on our financial condition and/or results of operations. See Note 19 in the notes to the Consolidated Financial Statements.
ITEM 4. MINE SAFETY DISCLOSURES
Not applicable.
PART II
ITEM 5. MARKET FOR REGISTRANT’S COMMON EQUITY, RELATED STOCKHOLDER MATTERS AND ISSUER PURCHASES OF EQUITY SECURITIES
Our common stock is listed on the NASDAQ Global Select Market under the symbol “NWBI”. As of February 18, 2025, we had 23 registered market makers, 10,243 stockholders of record (excluding the number of persons or entities holding stock in street name through various brokerage firms), and 127,514,857 shares outstanding.
Payment of dividends on our shares of common stock is subject to determination and declaration by the Board of Directors and will depend upon a number of factors, including capital requirements, regulatory limitations on the payment of dividends, our results of operations and financial condition, tax considerations and general economic conditions. No assurance can be given that dividends will continue to be declared or, if declared, what the amount of dividends will be. See “Item 1. Business—Supervision and Regulation—Federal Bank Holding Company Regulation—Source of Strength Doctrine” and “Item 1. Business—Supervision and Regulation—Federal Bank Holding Company Regulation—Capital Distributions” for additional information regarding our ability to pay dividends.
There were no sales of unregistered securities during the quarter ended December 31, 2024.
On December 13, 2012, the Board of Directors approved a program that authorizes the repurchase of approximately 5,000,000 shares of common stock. This program does not have an expiration date. During the year ended December 31, 2024, we did not repurchase any shares and there are a maximum of 2,261,130 remaining shares that can be purchased under the current repurchase program.
Stock Performance Graph
The following stock performance graph compares (a) the cumulative total return on our common stock between December 31, 2019 and December 31, 2024, (b) the cumulative total return on stocks included in the Total Return Index for the NASDAQ Stock Market (US) over such period, and (c) the cumulative total return on stocks included in the NASDAQ Bank Index over such period. Cumulative return assumes the reinvestment of dividends, and is expressed in dollars based on an assumed investment of $100.
There can be no assurance that our stock performance will continue in the future with the same or similar trend depicted in the graph. We will not make or endorse any predictions as to future stock performance.
COMPARISON OF 5 YEAR CUMULATIVE TOTAL RETURN
Among Northwest Bancshares, Inc., the NASDAQ Composite Index, and the NASDAQ Bank Index
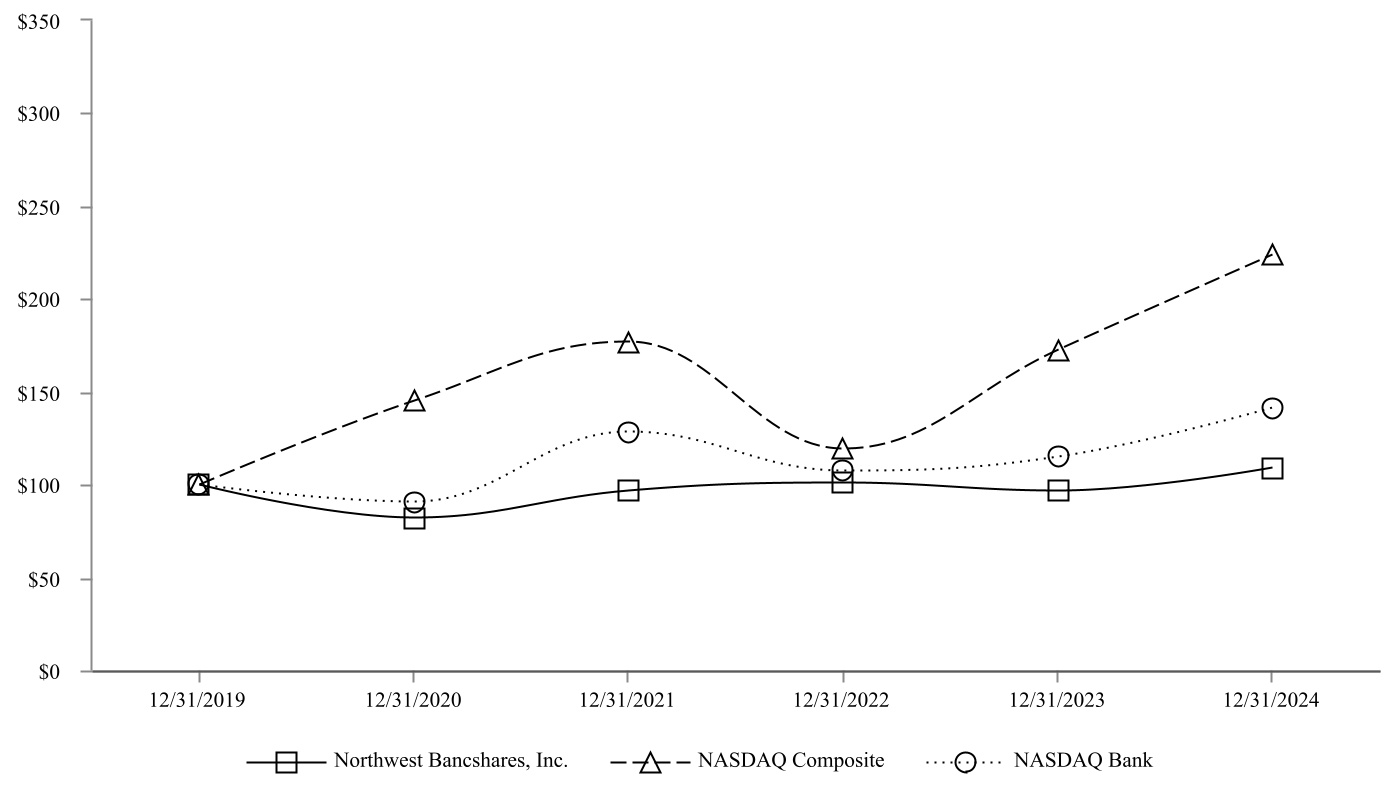
| | | | | | | | | | | | | | | | | | | | | | | | | | | | | | | | | | | |
| At December 31, |
| | 2019 | | 2020 | | 2021 | | 2022 | | 2023 | | 2024 |
| Northwest Bancshares, Inc. | 100.00 | | | 82.01 | | | 96.62 | | | 101.06 | | | 96.63 | | | 108.85 | |
| NASDAQ Composite | 100.00 | | | 144.92 | | | 177.06 | | | 119.45 | | | 172.77 | | | 223.87 | |
| NASDAQ Bank | 100.00 | | | 90.81 | | | 128.28 | | | 107.54 | | | 114.99 | | | 141.59 | |
ITEM 6. [RESERVED]
ITEM 7. MANAGEMENT’S DISCUSSION AND ANALYSIS OF FINANCIAL CONDITION AND RESULTS OF OPERATIONS
Our principal business consists of collecting deposits and making loans primarily secured by various types of collateral, including real estate and other assets in the markets in which we are located. Attracting and maintaining deposits is affected by a number of factors, including interest rates paid on competing deposits and other investments offered by other financial and non-financial institutions, account maturities, fee structures, and levels of personal income and savings. Lending activities are affected by the demand for funds and thus are influenced by interest rates, the number and quality of alternative lenders and regional economic conditions. Sources of funds for lending activities include deposits, borrowings, repayments on loans, cash flows from investment and mortgage-backed securities and income provided from operations.
Our earnings depend primarily on net interest income, which is the difference between interest earned on our interest-earning assets, consisting primarily of loans and investment securities, and the interest paid on interest-bearing liabilities, consisting primarily of deposits, borrowed funds, and trust-preferred securities. Net interest income is a function of our interest rate spread, which is the difference between the average yield earned on our interest-earning assets and the average rate paid on our interest-bearing liabilities, as well as a function of the average balance of interest-earning assets compared to the average balance of interest-bearing liabilities. Also contributing to our earnings is noninterest income, which consists primarily of service charges and fees on loan and deposit products and services, fees related to investment management and trust services, net gains and losses on the sale of assets, including SBA loans, and mortgage banking income. Net interest income and noninterest income are offset by provisions for credit losses, general administrative and other expenses, including employee compensation and benefits, occupancy expense and processing costs, as well as by state and federal income tax expense.
Our net income was $100 million, or $0.79 per diluted share, for the year ended December 31, 2024 compared to $135 million, or $1.06 per diluted share, for the year ended December 31, 2023, and $134 million, or $1.05 per diluted share, for the year ended December 31, 2022. The provision for credit losses was $25 million for the year ended December 31, 2024 compared to $23 million for the year ended December 31, 2023, and $28 million for the year ended December 31, 2022.
Selected Financial and Other Data
The summary financial information presented below is derived in part from the Company’s Consolidated Financial Statements. The following is only a summary and should be read in conjunction with the Consolidated Financial Statements and notes included elsewhere in this document. The information at December 31, 2024 and 2023 and for the years ended December 31, 2024, 2023 and 2022 is derived in part from the audited Consolidated Financial Statements that appear in this document.
| | | | | | | | | | | | | | | | | |
| | At December 31, |
| | 2024 | | 2023 | | | | | | |
| | (In thousands) |
| Selected Consolidated Financial Data: | | | | | | | | | |
| Total assets | $ | 14,408,224 | | | 14,419,105 | | | | | | | |
| Cash and cash equivalents | 288,378 | | | 122,260 | | | | | | | |
| Marketable securities held-to-maturity | 124,462 | | | 124,458 | | | | | | | |
| Marketable securities available-for-sale | 120,237 | | | 182,068 | | | | | | | |
| Mortgage-backed securities held-to-maturity | 626,124 | | | 690,381 | | | | | | | |
| Mortgage-backed securities available-for-sale | 988,707 | | | 861,291 | | | | | | | |
| Loans held-for-sale | 76,331 | | | 8,768 | | | | | | | |
| Loans receivable, net of allowance for credit losses: | | | | | | | | | |
| Residential mortgage loans | 3,163,922 | | | 3,401,224 | | | | | | | |
| Home equity loans | 1,144,551 | | | 1,222,455 | | | | | | | |
| Consumer loans | 1,970,813 | | | 2,097,917 | | | | | | | |
| Commercial real estate loans | 2,801,652 | | | 2,918,968 | | | | | | | |
| Commercial loans | 1,982,257 | | | 1,640,234 | | | | | | | |
| Total loans receivable, net | 11,063,195 | | | 11,280,798 | | | | | | | |
| Deposits | 12,144,554 | | | 11,979,902 | | | | | | | |
| Borrowed funds | 200,331 | | | 398,895 | | | | | | | |
| Subordinated debt | 114,538 | | | 114,189 | | | | | | | |
| Shareholders’ equity | 1,596,856 | | | 1,551,317 | | | | | | | |
| | | | | | | | | | | | | | | | | | | | | |
| | For the years ended December 31, |
| | 2024 | | 2023 | | 2022 | | | | |
| | (In thousands except per share data) |
| Selected Consolidated Operating Data: | | | | | | | | | |
| Total interest income | $ | 669,196 | | | 587,922 | | | 448,798 | | | | | |
| Total interest expense | 233,618 | | | 152,239 | | | 28,117 | | | | | |
| Net interest income | 435,578 | | | 435,683 | | | 420,681 | | | | | |
| Provision for credit losses | 24,505 | | | 22,874 | | | 28,315 | | | | | |
| Net interest income after provision for credit losses | 411,073 | | | 412,809 | | | 392,366 | | | | | |
| Noninterest income | 87,010 | | | 113,823 | | | 110,849 | | | | | |
| Noninterest expense | 368,537 | | | 351,554 | | | 329,523 | | | | | |
| Income before income taxes | 129,546 | | | 175,078 | | | 173,692 | | | | | |
| Income tax expense | 29,268 | | | 40,121 | | | 40,026 | | | | | |
| Net income | $ | 100,278 | | | 134,957 | | | 133,666 | | | | | |
| Earnings per share: | | | | | | | | | |
| Basic | $ | 0.79 | | | 1.06 | | | 1.05 | | | | | |
| Diluted | $ | 0.79 | | | 1.06 | | | 1.05 | | | | | |
| | | | | | | | | | | | | | | | | | | | | |
| | At or for the year ended December 31, |
| | 2024 | | 2023 | | 2022 | | | | |
| Selected Financial Ratios and Other Data: | | | | | | | | | |
| Return on average assets (1), (5), (6), (7) | 0.70 | % | | 0.95 | % | | 0.94 | % | | | | |
| Return on average equity (2), (5), (6), (7) | 6.41 | % | | 8.94 | % | | 8.80 | % | | | | |
| Average capital to average assets | 10.87 | % | | 10.58 | % | | 10.71 | % | | | | |
| Capital to total assets | 11.08 | % | | 10.76 | % | | 10.57 | % | | | | |
| Tangible common equity to tangible assets (8) | 8.65 | % | | 8.30 | % | | 8.03 | % | | | | |
| Net interest rate spread (3) | 2.66 | % | | 2.86 | % | | 3.11 | % | | | | |
| Net interest margin (4) | 3.26 | % | | 3.28 | % | | 3.20 | % | | | | |
| Noninterest expense to average assets (5), (6), (7) | 2.56 | % | | 2.46 | % | | 2.32 | % | | | | |
| Efficiency ratio (5), (6), (7) | 70.52 | % | | 63.98 | % | | 62.00 | % | | | | |
| Noninterest income to average assets | 0.60 | % | | 0.80 | % | | 0.78 | % | | | | |
| Net interest income to noninterest expense (5), (6), (7) | 1.18x | | 1.24x | | 1.28x | | | | |
| Dividend payout ratio | 101.27 | % | | 75.47 | % | | 76.19 | % | | | | |
| Nonperforming loans to net loans receivable | 0.56 | % | | 0.86 | % | | 0.76 | % | | | | |
| Nonperforming assets to total assets | 0.54 | % | | 0.67 | % | | 0.58 | % | | | | |
| Allowance for credit losses to nonperforming loans | 188.24 | % | | 129.01 | % | | 143.98 | % | | | | |
| Allowance for credit losses to loans receivable | 1.04 | % | | 1.10 | % | | 1.08 | % | | | | |
| Average interest-earning assets to average interest-bearing liabilities | 1.35x | | 1.37x | | 1.41x | | | | |
| Number of banking offices | 141 | | | 142 | | | 150 | | | | | |
| | | | | | | | | |
(1)Represents net income divided by average assets.
(2)Represents net income divided by average equity.
(3)Represents average yield on interest-earning assets less average cost of interest-bearing liabilities (shown on a fully taxable equivalent (“FTE”) basis).
(4)Represents net interest income as a percentage of average interest-earning assets (shown on a FTE basis).
(5) 2022 includes $5.6 million in merger, asset disposition and restructuring expense.
(6) 2023 includes $6.7 million in merger, asset disposition and restructuring expense.
(7) 2024 includes $5.8 million in merger, asset disposition and restructuring expense and a $39.4 loss on sale of investments.
(8) Excludes goodwill and other intangible assets (non-GAAP).
The following non-GAAP financial measures used by the Company provide information useful to investors in understanding our operating performance and trends, and facilitate comparisons with the performance of our peers. The following table summarizes the non-GAAP financial measures derived from amounts reported in the Company’s Consolidated Statements of Financial Condition.
| | | | | | | | | | | | | | | | | |
| As of December 31, |
| 2024 | | 2023 | | 2022 |
| Tangible common equity to assets | | | | | |
| Total shareholders’ equity | $ | 1,596,856 | | | 1,551,317 | | | 1,491,486 | |
| Less: goodwill and intangible assets | (383,834) | | | (386,287) | | | (389,557) | |
| Tangible common equity | $ | 1,213,022 | | | 1,165,030 | | | 1,101,929 | |
| | | | | |
| Total assets | $ | 14,408,224 | | | 14,419,105 | | | 14,113,324 | |
| Less: goodwill and intangible assets | (383,834) | | | (386,287) | | | (389,557) | |
| Tangible assets | $ | 14,024,390 | | | 14,032,818 | | | 13,723,767 | |
| | | | | |
| Tangible common equity to tangible assets | 8.65 | % | | 8.30 | % | | 8.03 | % |
Critical Accounting Estimates
Our significant accounting policies are described in Note 1 of the notes to the Consolidated Financial Statements. Certain accounting policies are important to the understanding of our financial condition, since they require management to make difficult, complex or subjective judgments, some of which may relate to matters that are inherently uncertain. Estimates associated with these policies are susceptible to material changes as a result of changes in facts and circumstances, including, but without limitation, changes in interest rates, performance of the economy, financial condition of borrowers and laws and regulations. The following is the accounting estimate we believe is critical.
Allowance for Credit Losses. We recognize that losses will be experienced on assets and that the risk of loss varies with the type of asset, the creditworthiness of a borrower, general economic conditions and the quality of the collateral, if any. We maintain an allowance for expected lifetime losses in the loan portfolio. The allowance for credit losses represents management’s estimate of
lifetime expected losses based on all available information. The allowance for credit losses is based on management’s evaluation of relevant available information, from internal and external sources, relating to past events, current conditions and reasonable and supportable forecasts. The loan portfolio is reviewed regularly by management in its determination of the allowance for credit losses. The methodology for assessing the appropriateness of the allowance includes a review of historical losses, peer group comparisons, industry data and economic conditions. As an integral part of their examination process, regulatory agencies periodically review our allowance for credit losses and may require us to make additional provisions for estimated losses based upon judgments different from those of management. In establishing the allowance for credit losses, a combination of statistical models are applied to various pools of outstanding loans. We use a 24 month forecasting period and revert to historical average loss rates thereafter. Credit relationships that have been classified as substandard or doubtful and are greater than or equal to $1.0 million are reviewed by the Credit Administration department to determine if they no longer continue to demonstrate similar risk characteristics to their loan pool. If a loan no longer demonstrates similar risk characteristics to their loan pool they are removed from the pool and an individual assessment is performed. The allowance calculation is also supplemented with qualitative reserves that take into consideration the current portfolio and specific risk characteristics, such as changes in underwriting standards, portfolio mix, delinquency level, or term, as well as changes in environmental conditions, among other factors, that have occurred but are not yet reflected in the quantitative model component.
Our allowance for credit losses is sensitive to a number of inputs, most notably the macroeconomic forecast assumptions as well as the reasonable and supportable forecasting periods that are incorporated in our estimate of credit losses. Therefore, as the macroeconomic environment and related forecasts change or decisions are made to shorten or lengthen the forecasting period, the allowance for credit losses may change materially. The following sensitivity analyses do not represent management’s expectations of the deterioration of our portfolios or the economic environment, but are provided as hypothetical scenarios to assess the sensitivity of the allowance for credit losses to changes in key inputs. We utilized a multi-scenario based macroeconomic forecast in determining the December 31, 2024 allowance for credit losses, which included a weighting of three scenarios: an upside scenario, a baseline scenario and a downside scenario. We placed the most weight on the baseline scenario, with the remaining weight split evenly between the upside and downside scenarios. If we placed 100% weighting on the downside scenario, the quantitative allowance for credit losses would have been approximately $31 million higher.
Although management believes that it uses the best information available to establish the allowance for credit losses, future adjustments to the allowance for credit losses may be necessary and results of operations could be adversely affected if circumstances differ substantially from the assumptions used in making the determinations. Because future events affecting borrowers and collateral cannot be predicted with certainty, there can be no assurance that the existing allowance for credit losses is adequate or that increases will not be necessary should the quality of assets deteriorate as a result of the factors discussed previously. Any material increase in the allowance for credit losses may adversely affect our financial condition and results of operations. The allowance is based on information known at the time of the review. Changes in factors underlying the assessment could have a material impact on the amount of the allowance that is necessary and the amount of provision to be charged against earnings. Such changes could impact future results. For further information related to our allowance for credit losses, see Note 1(f) of the notes to the Consolidated Financial Statements.
Recently Issued Accounting Standards
The following Accounting Standard Updates (“ASU”) issued by the Financial Accounting Standards Board (“FASB”) have not yet been adopted.
In October 2023, the FASB issued ASU No. 2023-06, “Disclosure Improvements.” This ASU includes amendments on several subtopics in the FASB Accounting Standards Codification (“Codification”) to incorporate certain disclosures and presentation requirements currently residing in SEC Regulations S-X and S-K. The adoption of this ASU may lead to certain disclosures being relocated into the financial statements. The effective date for each amendment will be the date on which the SEC’s removal of that related disclosure from Regulation S-X or Regulation S-K becomes effective, with early adoption prohibited. These amendments are to be applied prospectively. If the SEC has not removed the applicable requirements from Regulation S-X or Regulation S-K by June 30, 2027, the pending content of the related amendment will be removed from the Codification and will not become effective for any entity. We do not believe this guidance will have a material impact on the Company’s financial statements.
In December 2023, the FASB issued ASU No. 2023-09, “Improvements to Income Tax Disclosures.” This ASU requires additional disaggregated disclosures on entity’s effective tax rate reconciliation and additional details on income taxes paid. This guidance is effective for annual periods beginning after December 15, 2025, with early adoption permitted. This ASU is applied prospectively with the option to apply the ASU retrospectively. We do not believe this guidance will have a material impact on the Company’s financial statements.
In November 2024, the FASB issued ASU 2024-03, “Income Statement-Reporting Comprehensive Income—Expense Disaggregation Disclosures (Subtopic 220-40): Disaggregation of Income Statement Expenses”. The guidance requires disaggregated disclosure of
specified expense categories. The guidance also requires disclosure of total selling expenses and how the Company defines selling expenses. The guidance is effective for fiscal years beginning after December 15, 2026, and interim periods within annual periods beginning after December 15, 2027. Prospective application is required, with retrospective application permitted. The Company is currently evaluating the effect the updated guidance will have on the Company’s financial statement disclosures.
Assets. Total assets at December 31, 2024 were flat at $14.4 billion, a decreasing slightly by $11 million from December 31, 2023. This decrease in assets was driven by decreases in personal banking loans receivable, partially offset by increases in cash and cash equivalents and commercial banking loans receivable. A discussion of significant changes follows.
Cash and cash equivalents. Cash and cash equivalents increased by $166 million, or 136%, to $288 million at December 31, 2024, from $122 million at December 31, 2023. This increase was primarily due to growth in our deposits coupled with a focus on profitability and credit discipline while investing these cash flows into commercial loans.
Marketable securities. Marketable securities remained flat at $1.9 billion at both December 31, 2024 and December 31, 2023. Available-for-sale marketable securities increased $66 million driven by the securities portfolio restructure in the current year, while held-to-maturity securities decreased $64 million drive by maturities and regular monthly cash flows. During the second quarter the Company restructured our security portfolio by selling 15% of available-for-sale securities during the year in order to reallocate these funds into higher interest-earning products.
The following table sets forth certain information regarding the amortized cost and fair value of our available-for-sale marketable securities portfolio and mortgage-backed securities portfolio at the dates indicated.
| | | | | | | | | | | | | | | | | | | | | | | | | | | |
| | At December 31, |
| | 2024 | | 2023 | | |
| | Amortized
cost | | Fair
value | | Amortized
cost | | Fair
value | | | | |
| | (In thousands) |
| Residential mortgage-backed securities available-for-sale: | | | | | | | | | | | |
| Fixed rate pass-through | $ | 237,892 | | | 220,417 | | | 209,069 | | | 183,874 | | | | | |
| Variable rate pass-through | 3,738 | | | 3,789 | | | 7,140 | | | 7,080 | | | | | |
| | | | | | | | | | | |
| Fixed rate agency CMOs | 852,648 | | | 719,833 | | | 789,842 | | | 646,787 | | | | | |
| Variable rate agency CMOs | 44,740 | | | 44,668 | | | 23,965 | | | 23,550 | | | | | |
| Total residential mortgage-backed securities available-for-sale | 1,139,018 | | | 988,707 | | | 1,030,016 | | | 861,291 | | | | | |
| Marketable securities available-for-sale: | | | | | | | | | | | |
| U.S. Government, agency and GSEs | 45,411 | | | 35,509 | | | 115,755 | | | 98,911 | | | | | |
| Municipal securities | 68,807 | | | 58,627 | | | 85,766 | | | 75,469 | | | | | |
| Corporate debt issues | 25,429 | | | 26,101 | | | 8,466 | | | 7,688 | | | | | |
| | | | | | | | | | | |
| Total marketable securities available-for-sale | $ | 1,278,665 | | | 1,108,944 | | | 1,240,003 | | | 1,043,359 | | | | | |
The following table sets forth certain information regarding the amortized cost and fair value of our held-to-maturity marketable securities portfolio and mortgage-backed securities portfolio at the dates indicated.
| | | | | | | | | | | | | | | | | | | | | | | | | | | |
| | At December 31, |
| | 2024 | | 2023 | | |
| | Amortized
cost | | Fair
value | | Amortized
cost | | Fair
value | | | | |
| | (In thousands) |
| Residential mortgage-backed securities held-to-maturity: | | | | | | | | | | | |
| Fixed rate pass-through | $ | 132,816 | | | 112,635 | | | 147,874 | | | 127,040 | | | | | |
| Variable rate pass-through | 364 | | | 365 | | | 449 | | | 450 | | | | | |
| Fixed rate agency CMOs | 492,415 | | | 414,426 | | | 541,529 | | | 463,835 | | | | | |
| Variable rate agency CMOs | 529 | | | 524 | | | 529 | | | 523 | | | | | |
| Total residential mortgage-backed securities held-to-maturity | 626,124 | | | 527,950 | | | 690,381 | | | 591,848 | | | | | |
| Marketable securities held-to-maturity: | | | | | | | | | | | |
| U.S. Government and agencies | 124,462 | | | 109,998 | | | 124,458 | | | 107,658 | | | | | |
| Total marketable securities held-to-maturity | $ | 750,586 | | | 637,948 | | | 814,839 | | | 699,506 | | | | | |
The following table sets forth information regarding the issuers and the carrying value of our mortgage-backed securities at the dates indicated.
| | | | | | | | | | | | | |
| | At December 31, |
| | 2024 | | 2023 | | |
| | (In thousands) |
| Residential mortgage-backed securities: | | | | | |
| FNMA | $ | 443,354 | | | 568,160 | | | |
| GNMA | 668,668 | | | 407,441 | | | |
| FHLMC | 502,805 | | | 576,066 | | | |
| | | | | |
| Other (including non-agency) | 4 | | | 5 | | | |
| Total residential mortgage-backed securities | $ | 1,614,831 | | | 1,551,672 | | | |
Marketable Securities Portfolio Maturities and Yields. The following table sets forth the scheduled maturities, carrying values, amortized cost, market values and weighted average yields for our marketable securities and mortgage-backed securities portfolios at December 31, 2024. The annualized weighted average yields are calculated by taking the interest of the marketable securities divided by the amortized cost. Adjustable-rate mortgage-backed securities are included in the period in which interest rates are next scheduled to adjust.
| | | | | | | | | | | | | | | | | | | | | | | | | | | | | | | | | | | | | | | | | | | | | | | | | | | | | | | | | | | | | | | | | |
| | One year or less | | More than one year
to five years | | More than five years
to ten years | | More than ten years | | Total |
| | Amortized
cost | | Annualized
weighted
average
yield | | Amortized
cost | | Annualized
weighted
average
yield | | Amortized
cost | | Annualized
weighted
average
yield | | Amortized
cost | | Annualized
weighted
average
yield | | Amortized
cost | | Fair
value | | Annualized
weighted
average
yield |
| | (Dollars in thousands) |
Marketable securities
available-for-sale: | | | | | | | | | | | | | | | | | | | | | |
| Government sponsored entities | $ | — | | | — | % | | $ | 122 | | | 6.10 | % | | $ | — | | | — | % | | $ | — | | | — | % | | $ | 122 | | | 118 | | | 6.10 | % |
U.S. Government and
agency obligations | — | | | — | % | | — | | | — | % | | — | | | — | % | | 45,289 | | | 1.27 | % | | 45,289 | | | 35,391 | | | 1.27 | % |
| Municipal securities | — | | | — | % | | 888 | | | 3.87 | % | | 16,662 | | | 3.22 | % | | 51,257 | | | 1.83 | % | | 68,807 | | | 58,627 | | | 2.19 | % |
| Corporate debt issues | — | | | — | % | | 5,485 | | | 5.30 | % | | 19,944 | | | 7.48 | % | | — | | | — | % | | 25,429 | | | 26,101 | | | 7.01 | % |
| | | | | | | | | | | | | | | | | | | | | |
| Total marketable securities available-for-sale | — | | | — | % | | 6,495 | | | 5.12 | % | | 36,606 | | | 5.54 | % | | 96,546 | | | 1.57 | % | | 139,647 | | | 120,237 | | | 2.77 | % |
| Residential mortgage-backed securities available-for-sale: | | | | | | | | | | | | | | | | | | | | | |
| Pass-through certificates | 3,738 | | | 5.96 | % | | 459 | | | 3.27 | % | | 79 | | | 6.04 | % | | 237,354 | | | 4.19 | % | | 241,630 | | | 224,206 | | | 4.22 | % |
| CMOs | 44,739 | | | 5.42 | % | | 349 | | | 1.48 | % | | 5,549 | | | 0.96 | % | | 846,751 | | | 2.52 | % | | 897,388 | | | 764,501 | | | 2.65 | % |
Total residential
mortgage-backed securities available-for-sale | 48,477 | | | 5.47 | % | | 808 | | | 2.49 | % | | 5,628 | | | 1.03 | % | | 1,084,105 | | | 2.88 | % | | 1,139,018 | | | 988,707 | | | 2.98 | % |
Marketable securities
held-to-maturity: | | | | | | | | | | | | | | | | | | | | | |
U.S. Government and
agency obligations | — | | | — | % | | 124,462 | | | 1.00% | | — | | | — | % | | — | | | — | % | | 124,462 | | | 109,998 | | | 1.00 | % |
| | | | | | | | | | | | | | | | | | | | | |
| | | | | | | | | | | | | | | | | | | | | |
| | | | | | | | | | | | | | | | | | | | | |
| Total investment securities held-to-maturity | — | | | — | % | | 124,462 | | | 1.00% | | — | | | — | % | | — | | | — | % | | 124,462 | | | 109,998 | | | 1.00 | % |
| Residential mortgage-backed securities held-to-maturity: | | | | | | | | | | | | | | | | | | | | | |
| Pass-through certificates | 364 | | | 4.31 | % | | 24 | | | 2.33 | % | | 20,184 | | | 1.31 | % | | 112,608 | | | 1.29 | % | | 133,180 | | | 113,000 | | | 1.30 | % |
| CMOs | 529 | | | 5.40 | % | | 19,956 | | | 0.92 | % | | — | | | — | % | | 472,459 | | | 2.22 | % | | 492,944 | | | 414,950 | | | 2.17 | % |
Total residential
mortgage-backed securities held-to-maturity | 893 | | | 4.95 | % | | 19,980 | | | 0.92 | % | | 20,184 | | | 1.31 | % | | 585,067 | | | 2.04 | % | | 626,124 | | | 527,950 | | | 1.99 | % |
| Total marketable securities and mortgage-backed securities | $ | 49,370 | | | 5.46 | % | | $ | 151,745 | | | 1.17 | % | | $ | 62,418 | | | 3.77 | % | | $ | 1,765,718 | | | 2.53 | % | | $ | 2,029,251 | | | 1,746,892 | | | 2.54 | % |
Further information and analysis of our investment portfolio, including tables with information related to gross unrealized gains and losses on available-for sale and held-to-maturity marketable securities and tables showing the fair value and gross unrealized losses on marketable securities aggregated by investment category and length of time that the individual securities have been in a continuous unrealized loss position are located in Note 4 of the Notes to the Consolidated Financial Statements.
Loans Receivable. Gross loans receivable decreased by $226 million, or 2%, to $11.2 billion at December 31, 2024, from $11.4 billion at December 31, 2023. Our personal banking loan portfolio decreased by $451 million, or 7%, to $6.3 billion at December 31, 2024 from $6.8 billion at December 31, 2023. Cash flows from our personal banking portfolio were partially redirected to fund commercial banking growth, which increased by $225 million, or 5%, to $4.9 billion at December 31, 2024 from $4.6 billion at December 31, 2023. This represents organic loan growth resulting from the new commercial lending verticals that we implemented during the prior year. Specifically, our commercial and industrial (C&I) loan portfolio increased by $349 million, or 21% compared to December 31, 2023.
Set forth below are selected data related to the composition of our loan portfolio by type of loan as of the dates indicated.
| | | | | | | | | | | | | | | | | | | | | | | | | | | | |
| | At December 31, |
| | 2024 | | 2023 | | | |
| | Amount | | Percent | | Amount | | Percent | | | | | |
| | (Dollars in thousands) |
| Personal Banking: | | | | | | | | | | | | |
| | | | | | | | | | | | |
| Residential mortgage loans | $ | 3,178,269 | | | 28.4 | % | | $ | 3,419,417 | | | 30.0 | % | | | | | |
| Home equity loans | 1,149,396 | | | 10.3 | % | | 1,227,858 | | | 10.8 | % | | | | | |
| Vehicle loans | 1,870,843 | | | 16.7 | % | | 2,008,601 | | | 17.6 | % | | | | | |
| Consumer loans (1) | 124,242 | | | 1.1 | % | | 117,426 | | | 1.0 | % | | | | | |
| Total Personal Banking | 6,322,750 | | | 56.5 | % | | 6,773,302 | | | 59.4 | % | | | | | |
| | | | | | | | | | | | |
| Commercial Banking: | | | | | | | | | | | | |
| Commercial real estate | 2,495,726 | | | 22.3 | % | | 2,628,457 | | | 23.1 | % | | | | | |
| Commercial real estate - owner occupied | 354,136 | | | 3.2 | % | | 345,553 | | | 3.0 | % | | | | | |
| Commercial loans | 2,007,402 | | | 18.0 | % | | 1,658,729 | | | 14.5 | % | | | | | |
| Total Commercial Banking | 4,857,264 | | | 43.5 | % | | 4,632,739 | | | 40.6 | % | | | | | |
| Total loans receivable, gross | 11,180,014 | | | 100.0 | % | | 11,406,041 | | | 100.0 | % | | | | | |
| | | | | | | | | | | | |
| | | | | | | | | | | | |
| Total allowance for credit losses | (116,819) | | | | | (125,243) | | | | | | | | |
| Total loans receivable, net | $ | 11,063,195 | | | | | $ | 11,280,798 | | | | | | | | |
(1) Consists primarily of secured and unsecured personal loans.
The following table sets forth the maturity of our loan portfolio at December 31, 2024. Demand loans and loans having no stated schedule of repayments and no stated maturity are reported as due in one year or less. Adjustable and floating-rate loans are included in the period in which the contractual repayment is due or they contractually mature, if interest only, and fixed-rate loans are included in the period in which the contractual repayment is due.
| | | | | | | | | | | | | | | | | | | | | | | | | | | | | | | | |
| At December 31, 2024 (In thousands) | | Due in one year or less | | Due after
one year
through
five years | | Due after
five years
through
fifteen years | | Due after fifteen years | | Total |
| Personal Banking: | | | | | | | | | | |
| Residential mortgage loans | | $ | 143,885 | | | 538,185 | | | 1,209,252 | | | 1,279,787 | | | 3,171,109 | |
| Home equity loans | | 92,592 | | | 324,528 | | | 551,015 | | | 177,307 | | | 1,145,442 | |
| Consumer loans | | 522,614 | | | 1,293,898 | | | 123,844 | | | — | | | 1,940,356 | |
| Total Personal Banking | | 759,091 | | | 2,156,611 | | | 1,884,111 | | | 1,457,094 | | | 6,256,907 | |
| | | | | | | | | | |
| Commercial Banking: | | | | | | | | | | |
| Commercial real estate loans | | 678,048 | | | 1,422,338 | | | 686,684 | | | 66,509 | | | 2,853,579 | |
| Commercial loans | | 503,525 | | | 1,377,577 | | | 128,200 | | | 261 | | | 2,009,563 | |
| Total Commercial Banking | | 1,181,573 | | | 2,799,915 | | | 814,884 | | | 66,770 | | | 4,863,142 | |
| | | | | | | | | | |
| Total Loans | | $ | 1,940,664 | | | 4,956,526 | | | 2,698,995 | | | 1,523,864 | | | 11,120,049 | |
| | | | | | | | | | |
| Net unearned income and unamortized premiums and discounts | | | | | | | | | | 59,965 | |
| Total loans receivable | | | | | | | | | | 11,180,014 | |
The following table sets forth at December 31, 2024, the dollar amount of all fixed-rate loans due one year or more after December 31, 2024.
| | | | | | | | | | | | | | | | | | | | | | | | | | |
| At December 31, 2024 (In thousands) | | Due after
one year
through
five years | | Due after
five years
through
fifteen years | | Due after fifteen years | | Total |
| Personal Banking: | | | | | | | | |
| Residential mortgage loans | | $ | 528,448 | | | 1,177,339 | | | 1,237,462 | | | 2,943,249 | |
| Home equity loans | | 276,251 | | | 343,488 | | | 20,361 | | | 640,100 | |
| Consumer loans | | 1,281,539 | | | 123,580 | | | — | | | 1,405,119 | |
| Total Personal Banking | | 2,086,238 | | | 1,644,407 | | | 1,257,823 | | | 4,988,468 | |
| | | | | | | | |
| Commercial Banking: | | | | | | | | |
| Commercial real estate loans | | 437,327 | | | 18,642 | | | 4 | | | 455,973 | |
| Commercial loans | | 344,387 | | | 41,849 | | | — | | | 386,236 | |
| Total Commercial Banking | | 781,714 | | | 60,491 | | | 4 | | | 842,209 | |
| | | | | | | | |
| Total Loans | | $ | 2,867,952 | | | 1,704,898 | | | 1,257,827 | | | 5,830,677 | |
The following table sets forth at December 31, 2024, the dollar amount of all adjustable-rate loans due one year or more after December 31, 2024. Adjustable and floating-rate loans are included in the table based on the contractual due date of the loan.
| | | | | | | | | | | | | | | | | | | | | | | | | | |
| At December 31, 2024 (In thousands) | | Due after
one year
through
five years | | Due after
five years
through
fifteen years | | Due after fifteen years | | Total |
| Personal Banking: | | | | | | | | |
| Residential mortgage loans | | $ | 9,737 | | | 31,913 | | | 42,325 | | | 83,975 | |
| Home equity loans | | 48,277 | | | 207,527 | | | 156,946 | | | 412,750 | |
| Consumer loans | | 12,359 | | | 264 | | | — | | | 12,623 | |
| Total Personal Banking | | 70,373 | | | 239,704 | | | 199,271 | | | 509,348 | |
| | | | | | | | |
| Commercial Banking: | | | | | | | | |
| Commercial real estate loans | | 985,011 | | | 668,042 | | | 66,505 | | | 1,719,558 | |
| Commercial loans | | 1,033,190 | | | 86,351 | | | 261 | | | 1,119,802 | |
| Total Commercial Banking | | 2,018,201 | | | 754,393 | | | 66,766 | | | 2,839,360 | |
| | | | | | | | |
| Total Loans | | $ | 2,088,574 | | | 994,097 | | | 266,037 | | | 3,348,708 | |
The following table provides the various loan sectors in our commercial real estate portfolio at December 31, 2024:
| | | | | | | | | |
| | | December 31, 2024 |
| Property type | | | Percent of portfolio |
| Retail Building | | | 13.4 | % |
| 5 or More Unit Dwelling | | | 13.3 | |
| Commercial Office Building - non-owner occupied | | | 10.5 | |
| Nursing Home | | | 10.4 | |
| Manufacturing & Industrial Building | | | 5.8 | |
| Warehouse/Storage Building | | | 4.3 | |
| Multi-use building - commercial, retail and residential | | | 4.2 | |
| Commercial office building - owner occupied | | | 4.2 | |
| Residential acquisition & development - 1-4 family, townhouses and apartments | | | 4.1 | |
| Multi-use building - office and warehouse | | | 3.5 | |
| Other Medical Facility | | | 2.9 | |
| Single Family Dwelling | | | 2.4 | |
| Student Housing | | | 2.4 | |
| Hotel/Motel | | | 2.3 | |
| Agricultural Real Estate | | | 2.2 | |
| Commercial acquisition and development | | | 2.0 | |
| All Other Types | | | 12.1 | |
| Total | | | 100.0 | % |
The following table describes our commercial real estate portfolio by state at December 31, 2024:
| | | | | | | | | |
| | | December 31, 2024 |
| State | | | Percent of portfolio |
| New York | | | 34.4 | % |
| Pennsylvania | | | 29.6 | |
| Ohio | | | 18.7 | |
| Indiana | | | 8.3 | |
| All other | | | 9.0 | |
| Total | | | 100.0 | % |
Deposits. Total deposits increased by $165 million, or 1%, to $12.1 billion at December 31, 2024 from $12.0 billion at December 31, 2023. This increase was driven by a $75 million, or 3% increase in time deposits as we continued to competitively position our deposits products, a $66 million, or 3% increase in savings deposits and a $40 million or 2% increase in money market deposits. Partially offsetting these increases was a decrease in non-interest bearing deposit accounts of $48 million or 2% due to seasonality in customer deposit accounts.
As of December 31, 2024, we had $201 million of brokered deposits, which made up 7% of our time deposits and 2% of our total deposit balance at year end. The balance carried an average all-in cost of 4.32% and an average original term of 12 months. These purchases were through a registered broker, as part of an Asset/Liability Committee (“ALCO”) strategy to increase and diversify funding sources.
In addition, at year end we had $713 million of deposits through our participation in the Intrafi Network Deposits and FIS Insured Deposit programs. These deposits are part of a reciprocal program that allows our depositors to receive expanded FDIC insurance coverage above the insurance coverage available to our depositors at a single FDIC-insured institution, by placing multiple interest-bearing demand accounts at other member banks and Northwest receives an equal amount of deposits from other member banks. The balance carried an average cost of 3.68%.
The following table sets forth the dollar amount of deposits in the various types of accounts we offered at the dates indicated.
| | | | | | | | | | | | | | | | | | | | | | | | | | | | | | | | | | | | | | | | | |
| | At December 31, |
| | 2024 | | 2023 | | |
| | Balance | | Percent (1) | | Rate (2) | | Balance | | Percent (1) | | Rate (2) | | | | | | |
| | (Dollars in thousands) |
| Savings deposits | $ | 2,171,251 | | | 17.9 | % | | 1.12 | % | | $ | 2,105,234 | | | 17.6 | % | | 0.42 | % | | | | | | |
| Demand deposits | 5,287,919 | | | 43.5 | % | | 0.52 | % | | 5,303,569 | | | 44.3 | % | | 0.22 | % | | | | | | |
| Money market deposit accounts | 2,007,739 | | | 16.5 | % | | 1.72 | % | | 1,968,218 | | | 16.4 | % | | 1.26 | % | | | | | | |
| Time deposits: | | | | | | | | | | | | | | | | | |
| Maturing within 1 year | 2,547,129 | | | 21.0 | % | | 4.08 | % | | 2,464,022 | | | 20.6 | % | | 4.44 | % | | | | | | |
| Maturing 1 to 3 years | 109,727 | | | 0.9 | % | | 1.96 | % | | 98,229 | | | 0.8 | % | | 0.86 | % | | | | | | |
| Maturing more than 3 years | 20,789 | | | 0.2 | % | | 0.46 | % | | 40,630 | | | 0.3 | % | | 0.24 | % | | | | | | |
| Total certificates | 2,677,645 | | | 22.1 | % | | 4.46 | % | | 2,602,881 | | | 21.7 | % | | 2.31 | % | | | | | | |
| Total deposits | $ | 12,144,554 | | | 100.0 | % | | 1.69 | % | | $ | 11,979,902 | | | 100.0 | % | | 0.88 | % | | | | | | |
(1) Represents percentage of total deposits.
(2) Represents weighted average nominal rate at year end.
The following table sets forth the dollar amount of deposits in each state by branch location as of December 31, 2024.
| | | | | | | | | | | | | | |
| State | | Balance | | Percent |
| | | (Dollars in thousands) |
| Pennsylvania | | $ | 7,550,050 | | | 62.1 | % |
| New York | | 2,814,777 | | | 23.2 | % |
| Ohio | | 727,003 | | | 6.0 | % |
| Indiana | | 1,052,724 | | | 8.7 | % |
| Total | | $ | 12,144,554 | | | 100.0 | % |
The following table indicates the amount of our certificates of deposits of $250,000 or more by time remaining until maturity at December 31, 2024.
| | | | | | | | |
| Maturity period | | Certificates of deposit |
| | | (In thousands) |
| Three months or less | | $ | 141,194 | |
| Over three months through six months | | 123,113 | |
| Over six months through twelve months | | 104,198 | |
| Over twelve months | | 5,420 | |
| Total | | $ | 373,925 | |
At December 31, 2024 and 2023, we had total deposits in excess of $250,000 per depositor per account ownership category (the limit for FDIC insurance) of $1.9 billion and $1.8 billion, respectively. At those dates, we had no deposits that were uninsured for any other reason. The following table provides details regarding the Company’s uninsured deposits portfolio:
| | | | | | | | | | | | | | | | | | | | | |
| As of December 31, 2024 | | |
| Balance | | Percent of
total deposits | | Number of relationships | | | | |
| Uninsured deposits per the Call Report (1) | $ | 3,131,231 | | | 25.8 | % | | 5,233 | | | | | |
| Less intercompany deposit accounts | 1,244,219 | | | 10.3 | % | | 11 | | | | | |
| Less collateralized deposit accounts | 413,479 | | | 3.4 | % | | 224 | | | | | |
| Uninsured deposits excluding intercompany and collateralized accounts | $ | 1,473,533 | | | 12.1 | % | | 4,998 | | | | |
| | | | | | | | | |
| | | | | | | | | |
(1) Uninsured deposits presented may be different from actual amounts due to titling of accounts.
Our largest uninsured depositor, excluding intercompany and collateralized deposit accounts, had an aggregate uninsured deposit balance of $26.2 million, or 0.22% of total deposits, as of December 31, 2024. Our top ten largest uninsured depositors, excluding intercompany and collateralized deposit accounts, had an aggregate uninsured deposit balance of $167.4 million, or 1.38% of total deposits, as of December 31, 2024. The average uninsured deposit account balance, excluding intercompany and collateralized accounts, was $295,000 as of December 31, 2024.
Borrowings. Borrowings decreased by $198 million, or 39%, to $315 million at December 31, 2024 from $513 million at December 31, 2023. This decrease was a result of growth in lower cost deposits which enabled the paydown of FHLB advances during the year.
The following table sets forth information concerning our borrowings at the dates and for the periods indicated.
| | | | | | | | | | | | | |
| | During the years ended December 31, |
| | 2024 | | 2023 | | |
| | (Dollars in thousands) |
| FHLB borrowings: | | | | | |
| Average balance outstanding | $ | 254,033 | | | 568,350 | | | |
| Maximum outstanding at end of any month during year | 493,300 | | | 787,300 | | | |
| Balance outstanding at end of year | 175,000 | | | 338,500 | | | |
| Weighted average interest rate during year | 5.49 | % | | 5.37 | % | | |
| Weighted average interest rate at end of year | 4.64 | % | | 5.70 | % | | |
| | | | | |
| Collateralized borrowings: | | | | | |
| Average balance outstanding | $ | 26,061 | | | 63,694 | | | |
| Maximum outstanding at end of any month during year | 35,278 | | | 101,059 | | | |
| Balance outstanding at end of year | 22,323 | | | 35,495 | | | |
| Weighted average interest rate during year | 1.71 | % | | 1.09 | % | | |
| Weighted average interest rate at end of year | 1.73 | % | | 1.72 | % | | |
| | | | | |
| Collateral received: | | | | | |
| Average balance outstanding | $ | 31,326 | | | 37,942 | | | |
| Maximum outstanding at end of any month during year | 55,900 | | | 62,300 | | | |
| Balance outstanding at end of year | 3,008 | | | 24,900 | | | |
| Weighted average interest rate during year | 5.35 | % | | 5.28 | % | | |
| Weighted average interest rate at end of year | 4.65 | % | | 5.26 | % | | |
| | | | | |
| Subordinated borrowings: | | | | | |
| Average balance outstanding | $ | 114,378 | | | 114,029 | | | |
| Maximum outstanding at end of any month during year | 114,538 | | | 114,189 | | | |
| Balance outstanding at end of year | 114,538 | | | 114,189 | | | |
| Weighted average interest rate during year | 4.00 | % | | 4.00 | % | | |
| Weighted average interest rate at end of year | 4.00 | % | | 4.00 | % | | |
| | | | | |
| Total borrowings: | | | | | |
| Average balance outstanding | $ | 425,798 | | | 784,015 | | | |
| Maximum outstanding at end of any month during year | 681,027 | | | 1,009,462 | | | |
| Balance outstanding at end of year | 314,869 | | | 513,084 | | | |
| Weighted average interest rate during year | 4.85 | % | | 4.82 | % | | |
| Weighted average interest rate at end of year | 4.20 | % | | 5.02 | % | | |
Shareholders’ equity. Total shareholders’ equity at December 31, 2024 was $1.60 billion, or $12.52 per share, an increase of $46 million, or 2.9%, from $1.55 billion, or $12.20 per share, at December 31, 2023. This increase was the result of net income of $100 million for the year ended December 31, 2024, as well as a decrease in accumulated other comprehensive loss of $39 million due primarily to a decrease in unrealized loss in the available-for-sale investment portfolio. These changes were partially offset by $102 million of cash dividend payments during the year ended December 31, 2024.
Comparison of Results of Operations for the Years Ended December 31, 2024 and 2023
Net Income
Net income for the year ended December 31, 2024 was $100 million, or $0.79 per diluted share, a decrease of $35 million, or 25.7%, from $135 million, or $1.06 per diluted share, for the year ended December 31, 2023. The decrease in net income resulted, primarily from a decrease in noninterest income of $27 million, or 23.6%, resulting from a loss on investment sale as part of our securities portfolio restructure. Additionally contributing to the decrease in net income was an increase in noninterest expense of $17 million or 4.8%, partially offset by a decrease in the provision for credit losses of $2 million, or 7.1%, and a decrease in income taxes of $11 million or 27.1%. Net income for the year ended December 31, 2024 represents a return on average equity and average assets of 6.41% and 0.70%, respectively, compared to 8.94% and 0.95% for the year ended December 31, 2023. A discussion of significant changes follows.
Net Interest Income
To make it easier to compare both the results across several periods and the yields on various types of earning assets (some taxable, some not), we present net interest income in the discussion below on a fully taxable equivalent “FTE basis” (i.e., as if all income were taxable and at the same rate). For example, $100 of tax-exempt income would be presented as $126, an amount that, if taxed at the statutory federal income tax rate of 21%, would yield $100. See the “Average Balance Sheet” for information regarding tax-equivalent adjustments and GAAP results.
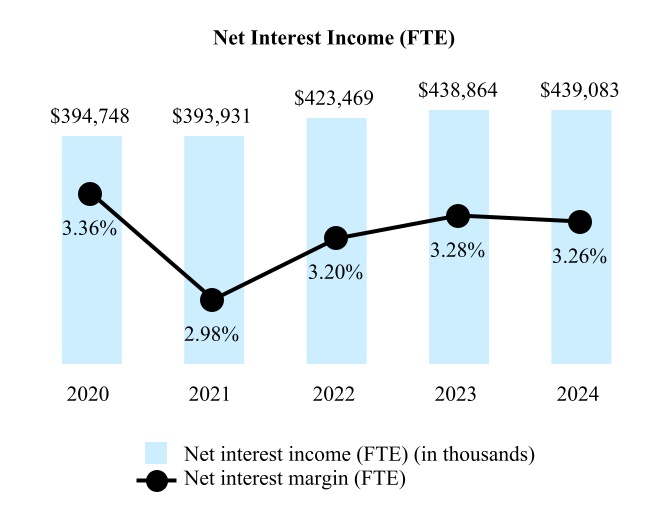
Net interest income for 2024 was $436 million, which remained flat compared to 2023. Net interest income (FTE) was $439 million for 2024 and net interest margin (FTE) was 3.26%. Compared to the prior year, net interest income (FTE) increased $0.2 million and net interest margin (FTE) decreased by two basis points. The increase in net interest income (FTE) and decrease in net interest margin (FTE) was driven by an increase in interest income resulting from higher earning asset yields offset by an increase in interest-bearing deposit costs and a shift in funding mix to higher cost deposits due to the higher interest rate environment.
Average loans receivable increased $185 million, or 2%, from the year ended December 31, 2023. This increase was driven by commercial loans, which grew by $433 million, as we have continued to build-out our commercial lending verticals, and commercial real estate loans, which grew by $119 million from the same period. These increases were offset partially by a $368 million decrease in personal banking loans from the year ended December 31, 2023. Interest income on loans receivable increased by $72 million, or 13%, from 2023 as the result of increases in both the average yield and the average balance on loans receivable. The average yield on loans receivable increased due to the elevated market interest rates as well as a change in mix to higher yield loan products.
Average investments declined 7% from the year ended December 31, 2023 driven by the sale of investment securities during the second quarter of 2024 coupled with regular principal payments and maturities. Interest income on investment securities increased by $7 million, or 17%, from the year ended December 31, 2023 due to the increase in the average yield on investments (FTE) to 2.25% for 2024 which was partially offset by a decline in the average balance of investments for both periods.
Average deposits grew 4% from 2023 driven by an increase in our average time deposits due to customer preferences for this fixed maturity product type which grew by $845 million from the year ended December 31, 2023. This increase was partially offset by a $217 million decrease in money market balances as customers shifted balances into higher yielding time deposit accounts. Interest expense on deposits increased by $100 million, or 95%, from 2023 primarily attributable to increases in both the average yield and average balance of deposit accounts as we continued competitively positioning our deposit products.
Compared to the year ended December 31, 2023, average borrowings saw a 55% reduction primarily attributable to the strategic pay-down of wholesale borrowings. This decrease was made possible by a substantial increase in cash reserves, resulting from the sale of investment securities during the year, as well as a notable rise in the average balance of deposits. The decrease in the average balance of borrowings resulted in a decrease in interest expense on borrowings by $19 million from 2023.
Average Balance Sheets
The following table sets forth average balance sheets, average yields, on a fully taxable equivalent basis, and average costs, and certain other information at and for the periods indicated. All average balances are daily average balances. Non-accrual loans are included in the computation of average balances. The yields set forth below include the effect of deferred fees and discounts and premiums that are amortized or accreted to interest income or expense. The effect of these fees is not considered material. The average yield for loans receivable and investment securities are calculated on a FTE basis. There were no out-of-period adjustments or other exclusions from the amounts presented in the table.
| | | | | | | | | | | | | | | | | | | | | | | | | | | | | | | | | | | | | | | | | | | | | | | | | | | | | |
| | For the years ended December 31, |
| | 2024 | | 2023 | | 2022 |
| | Average
balance | | Interest | | Average
yield/cost
(11) | | Average
balance | | Interest | | Average
yield/cost
(11) | | Average
balance | | Interest | | Average
yield/cost
(11) |
| | (Dollars in thousands) |
| Interest-earning assets: | | | | | | | | | | | | | | | | | |
| Loans receivable (includes FTE adjustments of $2,928, $2,477, and $1,954, respectively) (1), (2), (3) | $ | 11,285,219 | | | 618,704 | | | 5.48 | % | | $ | 11,100,118 | | | 546,136 | | | 4.92 | % | | $ | 10,318,898 | | | 409,782 | | | 3.97 | % |
| Mortgage-backed securities (4) | 1,739,141 | | | 39,793 | | | 2.29 | % | | 1,822,375 | | | 32,886 | | | 1.80 | % | | 1,968,528 | | | 30,804 | | | 1.56 | % |
| Investment securities (includes FTE adjustments of $576, $704, and $834, respectively) (4), (5) | 287,118 | | | 5,825 | | | 2.03 | % | | 357,436 | | | 6,312 | | | 1.77 | % | | 381,518 | | | 6,671 | | | 1.75 | % |
| FHLB stock, at cost | 24,948 | | | 1,891 | | | 7.58 | % | | 39,467 | | | 2,868 | | | 7.27 | % | | 17,065 | | | 730 | | | 4.27 | % |
| Interest-earning deposits | 126,097 | | | 6,487 | | | 5.15 | % | | 55,998 | | | 2,901 | | | 5.11 | % | | 567,609 | | | 3,599 | | | 0.63 | % |
| Total interest-earning assets (includes FTE adjustments of $3,504, $3,181, and $2,788, respectively) | 13,462,523 | | | 672,700 | | | 5.00 | % | | 13,375,349 | | | 591,103 | | | 4.42 | % | | 13,253,618 | | | 451,586 | | | 3.41 | % |
| Noninterest-earning assets (6) | 922,648 | | | | | | | 894,415 | | | | | | | 924,080 | | | | | |
| Total assets | $ | 14,385,171 | | | | | | | $ | 14,269,809 | | | | | | | $ | 14,177,698 | | | | | |
| Interest-bearing liabilities: | | | | | | | | | | | | | | | | | |
| Savings deposits | $ | 2,142,852 | | | 24,222 | | | 1.13 | % | | $ | 2,148,127 | | | 8,822 | | | 0.41 | % | | $ | 2,336,217 | | | 2,343 | | | 0.10 | % |
| Interest-bearing demand deposits | 2,574,810 | | | 27,394 | | | 1.06 | % | | 2,556,281 | | | 11,606 | | | 0.45 | % | | 2,810,889 | | | 1,517 | | | 0.05 | % |
| Money market deposit accounts | 1,966,732 | | | 34,564 | | | 1.76 | % | | 2,183,583 | | | 24,734 | | | 1.13 | % | | 2,613,422 | | | 3,377 | | | 0.13 | % |
| Time deposits | 2,758,157 | | | 119,312 | | | 4.33 | % | | 1,913,372 | | | 60,181 | | | 3.15 | % | | 1,161,432 | | | 6,883 | | | 0.59 | % |
| Borrowed funds (7) | 308,540 | | | 13,882 | | | 4.50 | % | | 691,636 | | | 32,903 | | | 4.76 | % | | 212,026 | | | 4,531 | | | 2.14 | % |
| Subordinated debt | 114,355 | | | 4,592 | | | 4.02 | % | | 114,002 | | | 4,592 | | | 4.03 | % | | 117,625 | | | 4,750 | | | 4.04 | % |
| Junior subordinated debentures | 129,695 | | | 9,652 | | | 7.32 | % | | 129,434 | | | 9,401 | | | 7.14 | % | | 129,175 | | | 4,716 | | | 3.60 | % |
| Total interest-bearing liabilities | 9,995,141 | | | 233,618 | | | 2.34 | % | | 9,736,435 | | | 152,239 | | | 1.56 | % | | 9,380,786 | | | 28,117 | | | 0.30 | % |
| Noninterest-bearing demand deposits (8) | 2,582,540 | | | | | | | 2,785,279 | | | | | | | 3,070,892 | | | | | |
| Noninterest-bearing liabilities | 244,036 | | | | | | | 237,810 | | | | | | | 207,316 | | | | | |
| Total liabilities | 12,821,717 | | | | | | | 12,759,524 | | | | | | | 12,658,994 | | | | | |
| Shareholders’ equity | 1,563,454 | | | | | | | 1,510,285 | | | | | | | 1,518,704 | | | | | |
| Total liabilities and shareholders’ equity | $ | 14,385,171 | | | | | | | $ | 14,269,809 | | | | | | | $ | 14,177,698 | | | | | |
| Net interest income | | | 439,082 | | | | | | | 438,864 | | | | | | | 423,469 | | | |
| Net interest rate spread (9) | | | | | 2.66 | % | | | | | | 2.86 | % | | | | | | 3.11 | % |
| Net interest-earning assets/net interest margin (10) | $ | 3,467,382 | | | | | 3.26 | % | | $ | 3,638,959 | | | | | 3.28 | % | | $ | 3,872,832 | | | | | 3.20 | % |
| Tax equivalent adjustment | | | 3,504 | | | | | | | 3,181 | | | | | | | 2,788 | | | |
| Net interest income, GAAP basis | | | 435,578 | | | | | | | 435,683 | | | | | | | 420,681 | | | |
| Ratio of average interest-earning assets to average interest-bearing liabilities | 1.35X | | | | | | 1.37X | | | | | | 1.41X | | | | |
(1) Average gross loans receivable includes loans held as available-for-sale and loans placed on nonaccrual status.
(2) Interest income includes accretion/amortization of deferred loan fees/expenses, which was not material.
(3) Interest income on tax-free loans is presented on a FTE basis including adjustments, as indicated.
(4) Average balances do not include the effect of unrealized gains or losses on securities held as available-for-sale.
(5) Interest income on tax-free investment securities is presented on a FTE basis including adjustments, as indicated.
(6) Average balances include the effect of unrealized gains or losses on securities held as available-for-sale.
(7) Average balances include FHLB borrowings and collateralized borrowings.
(8) Average cost of deposits was 1.71%, 0.91% and 0.12%, respectively and average cost of interest-bearing deposits were 2.18%, 1.20%, and 0.16%, respectively.
(9) Net interest rate spread represents the difference between the average yield on interest-earning assets and the average cost of interest-bearing liabilities.
(10) Net interest margin represents net interest income as a percentage of average interest-earning assets.
(11) Shown on a FTE basis and in consideration of applicable current federal, state and local tax rates.
Rate/Volume Analysis
The following table presents, on a FTE basis, the changes in interest income and interest expense for major components of interest-earning assets and interest-bearing liabilities for the year ended December 31, 2024 compared to 2023 and for the year ended December 31, 2023 compared to 2022. For each category of interest-earning assets and interest-bearing liabilities, information is provided on changes attributable to: (1) changes in volume multiplied by the prior year rate; (2) changes in rate multiplied by the prior year volume; and (3) the total increase or decrease. Changes not solely attributable to rate or volume have been allocated proportionately to the change due to volume and the change due to rate. There were no out-of-period adjustments or other exclusions from the amounts presented in the table.
| | | | | | | | | | | | | | | | | | | | | | | | | | | | | | | | | | | |
| Years ended December 31, 2024 vs. 2023 | | Years ended December 31, 2023 vs. 2022 |
| | Increase/(decrease)
due to | | Total
increase/(decrease) | Increase/(decrease)
due to | | Total
increase/(decrease) |
| |
| | Rate | | Volume | Rate | | Volume |
| | (In thousands) |
| Interest-earning assets: | | | | | | | | | | | |
| Loans receivable | $ | 62,421 | | | 10,147 | | | 72,568 | | | 97,916 | | | 38,438 | | | 136,354 | |
| Mortgage-backed securities | 8,811 | | | (1,904) | | | 6,907 | | | 4,720 | | | (2,638) | | | 2,082 | |
| Investment securities | 939 | | | (1,426) | | | (487) | | | 67 | | | (426) | | | (359) | |
| FHLB stock, at cost | 124 | | | (1,101) | | | (977) | | | 510 | | | 1,628 | | | 2,138 | |
| Interest-earning deposits | (27) | | | 3,613 | | | 3,586 | | | 30,861 | | | (31,559) | | | (698) | |
| Total interest-earning assets | 72,268 | | | 9,329 | | | 81,597 | | | 134,074 | | | 5,443 | | | 139,517 | |
| | | | | | | | | | | |
| Interest-bearing liabilities: | | | | | | | | | | | |
| Savings deposits | 15,459 | | | (59) | | | 15,400 | | | 7,251 | | | (772) | | | 6,479 | |
| Interest-bearing demand deposits | 15,591 | | | 197 | | | 15,788 | | | 11,245 | | | (1,156) | | | 10,089 | |
| Money market deposit accounts | 13,640 | | | (3,810) | | | 9,830 | | | 26,226 | | | (4,869) | | | 21,357 | |
| Time deposits | 22,588 | | | 36,543 | | | 59,131 | | | 29,647 | | | 23,651 | | | 53,298 | |
| Borrowed funds | (1,786) | | | (17,235) | | | (19,021) | | | 5,555 | | | 22,817 | | | 28,372 | |
| Subordinated debt | (14) | | | 14 | | | — | | | (12) | | | (146) | | | (158) | |
| Junior subordinated debentures | 232 | | | 19 | | | 251 | | | 4,667 | | | 18 | | | 4,685 | |
| Total interest-bearing liabilities | 65,710 | | | 15,669 | | | 81,379 | | | 84,579 | | | 39,543 | | | 124,122 | |
| Net change in net interest income | $ | 6,558 | | | (6,340) | | | 218 | | | 49,495 | | | (34,100) | | | 15,395 | |
Provision for Credit Losses
| | | | | | | | | | | | | | | | | | | | | | | | | | | | | | | | | |
| 2020 | | 2021 | | 2022 | | 2023 | | 2024 | | | | |
| Provision for credit losses - loans (in thousands) | $ | 83,975 | | | (11,883) | | | 17,860 | | | 18,664 | | | 27,679 | | | | | |
| Provision/(benefit) for credit losses - unfunded commitments (in thousands) | 3,139 | | | (3,905) | | | 10,455 | | | 4,210 | | | (3,174) | | | | | |
| Annualized net charge-offs to average loans | 0.27 | % | | 0.20 | % | | 0.02 | % | | 0.11 | % | | 0.32 | % | | | | |
| | | | | | | | | | | | | |
| | | | | | | | | | | | | |
The provision for credit losses increased by $2 million, or 7.1%, compared to the year ended December 31, 2023. This increase included a $9 million increase in the provision for credit losses - loans, which was partly offset by a $7 million decrease in the provision for credit losses - unfunded commitments.
The changes in the provision noted above is driven by growth within our commercial lending portfolio and changes in the economic forecasts coupled with a decline in our reserves for unfunded commitments in the current period. This decline is based on the timing of origination and funding of commercial construction loans and lines of credit.
During the year ended quarter December 31, 2024 the Company took several steps to de-risk our loan portfolio and reduce our levels of nonperforming, criticized and classified loans by completing two loan pool sales and transferring certain loans within our Long Term Healthcare portfolio into held for sale as of December 31, 2024. As a result we saw an elevated level of charge-offs during the year as the loans noted above were written-down to fair market value prior to sale. Total charge-offs related to the loan sales and transfer to loans held-for-sale was a combined $15 million. After completing these steps the Company saw an increase in classified loans to $272 million, or 2.44% of total loans, at December 31, 2024 from $219 million, or 1.91% of total loans, at December 31, 2023. The primary driver of the increase over the past year is reflective of the Company’s exposure to the Long Term Healthcare segment and the challenges a few operators have experienced post Covid.
In determining the amount of the current period provision, we considered current economic conditions, including unemployment levels, bankruptcy filings, and changes in collateral values, and assessed the impact of these factors on the quality of our loan portfolio and historical loss experience. We analyze the allowance for credit losses as described in the section entitled “Allowance for Credit Losses”. The provision that is recorded is sufficient, in our judgment, to bring this reserve to a level that reflects the current expected lifetime losses in our loan portfolio relative to loan mix, a reasonable and supportable economic forecast period and historical loss experience at December 31, 2024.
Noninterest Income
| | | | | | | | | | | | | | | | | | | | | | | | | | | | | | | | | | | | | | | | | |
| Breakdown of noninterest income for the year ended December 31, |
| | Change from 2023 | | | | Change from 2023 | | |
| 2024 | | Amount | | Percent | | 2023 | | Amount | | Percent | | 2022 |
| Noninterest income: | | | | | | | | | | | | | |
| Loss on sale of investments | $ | (39,413) | | | (31,106) | | | 374 | % | | $ | (8,307) | | | (8,299) | | | NA | | $ | (8) | |
| Gain on sale of mortgage servicing rights | — | | | (8,305) | | | (100) | % | | 8,305 | | | 8,305 | | | NA | | — | |
| Gain on sale of SBA loans | 3,819 | | | 2,019 | | | 112 | % | | 1,800 | | | 1,800 | | | NA | | — | |
| Service charges and fees | 62,957 | | | 3,743 | | | 6 | % | | 59,214 | | | 4,026 | | | 7 | % | | 55,188 | |
| Trust and other financial services income | 30,102 | | | 2,818 | | | 10 | % | | 27,284 | | | (481) | | | (2) | % | | 27,765 | |
| Income from bank-owned life insurance | 6,327 | | | (2,261) | | | (26) | % | | 8,588 | | | 1,459 | | | 20 | % | | 7,129 | |
| Other operating income (1) | 23,218 | | | 6,279 | | | 37 | % | | 16,939 | | | (3,836) | | | (18) | % | | 20,775 | |
| Total noninterest (loss)/income | $ | 87,010 | | | (26,813) | | | (24) | % | | $ | 113,823 | | | 2,974 | | | 3 | % | | $ | 110,849 | |
(1) Other noninterest income includes the net gain on real estate owned, mortgage banking income, and other operating income. See the “Consolidated Statements of Income” in Item 1. Financial Statements of this report.
Noninterest income decreased by $27 million, or 24% which was driven by a loss on sale of investments of $39 million; excluding the loss on sale of securities non interest income grew by $13 million, or 11%. The increase from the prior year was driven by service charges and fees, SBA loan sales and other operating income. Other operating income increased $6 million, or 37% driven by a gain on sale of Visa B shares and a gain on a low income housing tax credit investment. Service charges and fees increased $4 million, or 6%, driven by commercial loan fees and deposit related fees based on customer activity in the current year. Gains on the sales of SBA loans increased $2 million in during the current. Partially offsetting these increases was a decrease in income from bank owned life insurance of $2 million, resulting from higher death benefits received in the prior year.
Noninterest Expense
| | | | | | | | | | | | | | | | | | | | | | | | | | | | | | | | | | | | | | | | | |
| Breakdown of noninterest expense for the year ended December 31, |
| | Change from 2023 | | | | Change from 2023 | | |
| 2024 | | Amount | | Percent | | 2023 | | Amount | | Percent | | 2022 |
| Noninterest expense: | | | | | | | | | | | | | |
| Compensation and employee benefits | $ | 214,455 | | | 18,764 | | | 10 | % | | $ | 195,691 | | | 7,332 | | | 4 | % | | $ | 188,359 | |
| Premises and occupancy | 29,469 | | | 318 | | | 1 | % | | 29,151 | | | (467) | | | (2) | % | | 29,618 | |
| Processing expense | 59,351 | | | 664 | | | 1 | % | | 58,687 | | | 6,191 | | | 12 | % | | 52,496 | |
| Professional services | 14,883 | | | (2,936) | | | (16) | % | | 17,819 | | | 3,116 | | | 21 | % | | 14,703 | |
| Other operating expense (1) | 50,379 | | | 173 | | | — | % | | 50,206 | | | 5,859 | | | 13 | % | | 44,347 | |
| Total noninterest (loss)/income | $ | 368,537 | | | 16,983 | | | 5 | % | | $ | 351,554 | | | 22,031 | | | 7 | % | | $ | 329,523 | |
(1) Other noninterest expense includes collections expense, marketing expense, FDIC insurance expense, amortization of intangible assets, real estate owned expense, merger, asset disposition and restructuring expense, and other expenses. See the “Consolidated Statements of Income” in Item 1. Financial Statements of this report.
Noninterest expense increased $17 million, or 5%, from the year ended December 31, 2023. This increase was primarily attributable to an increase in compensation and employee benefits expense of $19 million, or 10%, for the year ended December 31, 2024 driven primarily by the build out of the commercial business and related credit, risk management, and internal audit support functions over the past year coupled with an increase in contracted employees expense and an increase in employee benefits expense. Partially offsetting this increase was a decrease in non-personnel expense related to professional services. Professional services decreased $3 million, or 16% from the year ended December 31, 2023 primarily due to the use of third-party consulting and staffing support in the prior year.
Income Taxes
The provision for income taxes decreased by $11 million, or 27%, from the year ended December 31, 2023 primarily due to lower income before taxes. Our effective tax rate for the year ended December 31, 2024 was 22.6% compared to 22.9% for the year ended December 31, 2023.
Asset Quality
We actively manage asset quality through our underwriting practices and collection procedures. Our underwriting practices are focused on balancing risk and return while our collection operations focus on diligently working with delinquent borrowers in an effort to minimize losses.
Collection procedures. Our collection procedures for personal loans generally provide that at 15 days delinquent, a notice of late charges is sent and personal contact efforts are attempted by telephone to strengthen the collection process and obtain reasons for the delinquency. Also, plans to establish a payment program are developed. Personal contact efforts are continued throughout the collection process, as necessary. Generally, if a loan becomes 30 days past due, a collection letter is sent and the loan becomes subject to possible legal action if suitable arrangements for payment have not been made. In addition, the borrower is given information which provides access to consumer counseling services to the extent required by the regulations of the Department of Housing and Urban Development and other applicable authorities. When a loan continues in a delinquent status for 60 days or more, and a payment
schedule has not been developed or kept by the borrower, we may send the borrower a notice of intent to foreclose, providing for cure periods of at least 30 days. If not cured, foreclosure proceedings are initiated.
Nonperforming assets. Loans are reviewed on a regular basis and are placed on nonaccrual status when, in the opinion of management, the collection of all contractual principal and/or interest is doubtful. Loans are automatically placed on nonaccrual status when either principal or interest is 90 days or more past due. Interest accrued and unpaid at the time a loan is placed on a nonaccrual status is reversed and charged against interest income.
Real estate acquired as a result of foreclosure or by deed in lieu of foreclosure is classified as real estate owned until such time that it is sold. When real estate is acquired through foreclosure or by deed in lieu of foreclosure, it is recorded at the lower of the related loan balance or its fair value as determined by an appraisal, less estimated costs of disposal. If the value of the property is less than the principal balance, less any related specific credit loss reserve allocations, the difference is charged against the allowance for credit losses. Any subsequent write-down of real estate owned or loss at the time of disposition is charged against income.
Nonaccrual, Past Due, Restructured Loans and Nonperforming Assets. The following table sets forth information with respect to nonperforming assets. Nonaccrual loans are those loans on which the accrual of interest has ceased. Generally, when a loan becomes 90 days past due, we fully reverse all accrued interest thereon and cease to accrue interest thereafter. Exceptions are made for loans that have contractually matured, are in the process of being modified to extend the maturity date and are otherwise current as to principal and interest, and well secured loans that are in process of collection. Loans may also be placed on nonaccrual before they reach 90 days past due if conditions exist that call into question our ability to collect all contractual principal and/or interest. Other nonperforming assets represent property acquired through foreclosure or repossession. Foreclosed property is carried at the lower of its fair value less estimated costs to sell or the principal balance of the related loan.
| | | | | | | | | | | | | | | | | |
| | At December 31, |
| | 2024 | | 2023 | | | | | | |
| | (Dollars in thousands) |
| Loans 90 days or more past due: | | | | | | | | | |
| Residential mortgage loans | $ | 4,931 | | | 7,995 | | | | | | | |
| Home equity loans | 2,250 | | | 3,126 | | | | | | | |
| Vehicle loans | 3,191 | | | 3,051 | | | | | | | |
| Consumer loans | 776 | | | 927 | | | | | | | |
| Commercial real estate loans | 7,702 | | | 6,535 | | | | | | | |
| Commercial real estate loans - owner occupied | — | | | 177 | | | | | | | |
| Commercial loans | 7,335 | | | 2,780 | | | | | | | |
| Total loans 90 days or more past due | $ | 26,185 | | | 24,591 | | | | | | | |
| Total real estate owned (REO) | $ | 35 | | | 104 | | | | | | | |
| Total loans 90 days or more past due and REO | 26,220 | | | 24,695 | | | | | | | |
| Total loans 90 days or more past due to net loans receivable | 0.24 | % | | 0.22 | % | | | | | | |
| Total loans 90 days or more past due and REO to total assets | 0.18 | % | | 0.17 | % | | | | | | |
| Nonperforming assets: | | | | | | | | | |
| Nonaccrual loans - loans 90 days or more past due | $ | 25,529 | | | 21,894 | | | | | | | |
| Nonaccrual loans - loans less than 90 days past due | 35,872 | | | 72,490 | | | | | | | |
| Loans 90 days or more past due still accruing | 656 | | | 2,698 | | | | | | | |
| Total nonperforming loans | 62,057 | | | 97,082 | | | | | | | |
| Other nonperforming assets (1) | 16,102 | | | — | | | | | | | |
| Total nonperforming assets | $ | 78,194 | | | 97,186 | | | | | | | |
| | | | | | | | | |
| | | | | | | | | |
| | | | | | | | | |
(1) Other nonperforming assets includes nonaccrual loans held for sale.
Classification of Assets. Our policies, consistent with regulatory guidelines, provide for the classification of loans, or other assets including other real estate owned, considered to be of lesser quality as “substandard,” “doubtful,” or “loss” assets. An asset is considered “substandard” if it is inadequately protected by the current net worth and paying capacity of the obligor or of the collateral pledged, if any. “Substandard” assets include those characterized by the “distinct possibility” that the financial institution will sustain “some loss” if the deficiencies are not corrected. Assets classified as “doubtful” have all of the weaknesses inherent in those classified “substandard” with the added characteristic that the weaknesses present make “collection or liquidation in full,” on the basis of currently existing facts, conditions, and values, “highly questionable and improbable”. Assets classified as “loss” are those considered “uncollectible” so that their continuance as assets without the establishment of a specific loss reserve is not warranted. Assets that do not expose the savings institution to risk sufficient to warrant classification in one of the aforementioned categories, but which possess some weaknesses, are required to be designated as “special mention”. At December 31, 2024, we had 130 loans, with an aggregate principal balance of $110 million, designated as “special mention”.
We regularly review our asset portfolio to determine whether any assets require classification in accordance with applicable regulations. Our largest classified assets generally are also our largest nonperforming assets.
The following table sets forth the aggregate amount of our classified assets at the dates indicated.
| | | | | | | | | | | | | |
| | At December 31, |
| | 2024 | | 2023 | | |
| | (In thousands) |
| Substandard assets | $ | 322,025 | | | 218,571 | | | |
| Doubtful assets | — | | | — | | | |
| Loss assets | — | | | — | | | |
| Total classified assets | $ | 322,025 | | | 218,571 | | | |
Allowance for Credit Losses. Our Board of Directors has adopted an “Allowance for Credit Losses” (“ACL”) policy designed to provide management with a systematic methodology for determining and documenting the allowance for credit losses each reporting period. This methodology was developed to provide a consistent process and review procedure to ensure that the allowance for credit losses is in conformity with GAAP, our policies and procedures and other supervisory and regulatory guidelines.
On an ongoing basis, the Credit Administration department, as well as loan officers and department heads, review and monitor the loan portfolio for problem loans. This portfolio monitoring includes a review of the monthly delinquency reports as well as historical comparisons and trend analysis. Personal and small business commercial loans are classified primarily by delinquency status. In addition, a meeting is held every quarter with each vertical to monitor the performance and status of commercial loans on an internal watch list. On an on-going basis, the loan officer, in conjunction with a portfolio manager, grades or classifies problem commercial loans or potential problem commercial loans based upon their knowledge of the lending relationship and other information previously accumulated. This rating is also reviewed independently by our Loan Review department on a periodic basis. Our loan grading system for problem commercial loans is consistent with industry regulatory guidelines which classifies loans as “substandard”, “doubtful” or “loss”. Loans that do not expose us to risk sufficient to warrant classification in one of the previous categories, but which possess some weaknesses, are designated as “special mention”. A “substandard” loan is any loan that is 90 days or more contractually delinquent or is inadequately protected by the current net worth and paying capacity of the obligor or of the collateral pledged, if any. Loans classified as “doubtful” have all the weaknesses inherent in those classified as “substandard” with the added characteristic that the weaknesses present make collection or liquidation in full, on the basis of currently existing facts, conditions or values, highly questionable and improbable. Loans classified as “loss” have all the weakness inherent in those classified as “doubtful” and are considered uncollectible.
Credit relationships that have been classified as substandard or doubtful and are greater than or equal to $1.0 million are reviewed by the Credit Administration department to determine if they no longer continue to demonstrate similar risk characteristics to their loan pool. If a loan no longer demonstrates similar risk characteristics to their loan pool they are removed from the pool and an individual assessment will be performed.
If it is determined that a loan needs to be individually assessed, the Credit Administration department determines the proper measure of fair value for each loan based on one of three methods: (1) the present value of expected future cash flows discounted at the loan’s effective interest rate; (2) the loan’s observable market price; or (3) the fair value of the collateral if the loan is collateral dependent, less costs of sale or disposal. If the measurement of the fair value of the loan is more or less than the amortized cost basis of the loan, the Credit Administration department adjusts the specific allowance associated with that individual loan accordingly.
If a substandard or doubtful loan is not individually assessed, it is grouped with other loans that possess common characteristics for credit losses and analysis. For the purpose of calculating reserves, we have grouped our loans into seven segments: residential mortgage loans, home equity loans, vehicle loans, consumer loans, commercial real estate loans, commercial real estate loans - owner
occupied and commercial loans. The allowance for credit losses is measured using a combination of statistical models and qualitative assessments. We use a 24 month forecasting period and revert to historical average loss rates thereafter. Reversion to average loss rates takes place over twelve months. Historical average loss rates are calculated using historical data beginning in October 2009 through the current period.
The credit losses for individually assessed loans along with the estimated loss for each homogeneous pool are consolidated into one summary document. This summary schedule along with the support documentation used to establish this schedule is presented to management’s Allowance for Credit Losses Committee (“ACL Committee”) monthly. The ACL Committee reviews and approves the processes and ACL documentation presented. Based on this review and discussion, the appropriate amount of ACL is estimated and any adjustments to reconcile the actual ACL with this estimate are determined. The ACL Committee also considers if any changes to the methodology are needed. In addition to the ACL Committee’s review and approval, a review is performed by the Risk Management Committee of the Board of Directors on a quarterly basis and annually by internal audit.
In addition to the reviews by management’s ACL Committee and the Board of Directors’ Risk Management Committee, regulators from either the FDIC and/or the Department of Banking perform an extensive review on at least an annual basis for the adequacy of the ACL and its conformity with regulatory guidelines and pronouncements. Any recommendations or enhancements from these independent parties are considered by management and the ACL Committee and implemented accordingly.
We acknowledge that this is a dynamic process and consists of factors, many of which are external and out of our control that can change frequently, rapidly and substantially. The adequacy of the ACL is based upon estimates using all the information previously discussed as well as current and known circumstances and events. There is no assurance that actual portfolio losses will not be substantially different than those that were estimated.
We utilize a structured methodology each period when analyzing the adequacy of the allowance for credit losses and the related provision for credit losses, which the ACL Committee assesses regularly for appropriateness. As part of the analysis as of December 31, 2024, we considered the most recent economic conditions and forecasts available. In addition, we considered the overall trends in asset quality, reserves on individually assessed loans, historical loss rates and collateral valuations. The ACL decreased by $8 million, or 7%, to $117 million, or 1.04% of gross loans at December 31, 2024 from $125 million, or 1.10% of total loans, at December 31, 2023. This decrease was the result of the reduction in total loans of $226 million, coupled with the de-risking of our loan portfolio through the reduction of nonperforming, criticized and classified assets.
Quarterly, management’s Credit Committee reviews the concentration of credit by industry and customer, lending products and activity, competition and collateral values, as well as economic conditions in general and in each of our market areas. The Credit Committee also reviews and discusses delinquency trends, nonperforming asset amounts and ACL levels and ratios compared to our peer group as well as state and national statistics.
We also consider how the levels of non-accrual loans and historical charge-offs have influenced the required amount of ACL. Nonaccrual loans of $61 million, or 0.55% of total gross loans receivable at December 31, 2024, decreased by $33 million, or 35%, from $94 million, or 0.83% of total gross loans receivable, at December 31, 2023. This decrease was primarily related to current commercial real estate loans that resulted from the loan sales and loans moved to held-for-sale as of year end. As a percentage of average loans, net charge-offs increased to 0.32% for the year ended December 31, 2024 compared to 0.11% due to the loans noted above being written-down to fair value prior to the sale. Total charge-offs related to the loan sales and transfer to loans held-for-sale was a combined $15 million.
Analysis of the Allowance for Credit Losses. The following table sets forth the analysis of the allowance for credit losses for the periods indicated.
| | | | | | | | | | | | | | | | | |
| | Years ended December 31, |
| | 2024 | | 2023 | | | | | | |
| | (Dollars in thousands) |
| Loans receivable | $ | 11,180,014 | | | 11,406,041 | | | | | | | |
| Average loans outstanding | 11,285,219 | | | 11,100,118 | | | | | | | |
| | | | | | | | | |
| Allowance for credit losses | | | | | | | | | |
| Balance at beginning of period | 125,243 | | | 118,036 | | | | | | | |
| ASU 2022-02 Adoption | — | | | 426 | | | | | | | |
| | | | | | | | | |
| Provision for credit losses | 27,679 | | | 18,664 | | | | | | | |
| Charge-offs: | | | | | | | | | |
| Residential mortgage loans | (845) | | | (1,189) | | | | | | | |
| Home equity loans | (1,736) | | | (852) | | | | | | | |
| Vehicle loans | (8,809) | | | (6,468) | | | | | | | |
| Consumer loans | (5,929) | | | (5,983) | | | | | | | |
| Commercial real estate loans | (15,321) | | | (2,298) | | | | | | | |
| Commercial real estate loans - owner occupied | — | | | (68) | | | | | | | |
| Commercial loans | (14,462) | | | (4,166) | | | | | | | |
| Total charge-offs | (47,102) | | | (21,024) | | | | | | | |
| Recoveries: | | | | | | | | | |
| Residential mortgage loans | 1,472 | | | 1,636 | | | | | | | |
| Home equity loans | 1,127 | | | 709 | | | | | | | |
| Vehicle loans | 1,778 | | | 2,021 | | | | | | | |
| Consumer loans | 1,591 | | | 1,206 | | | | | | | |
| Commercial real estate loans | 3,480 | | | 2,029 | | | | | | | |
| Commercial real estate loans - owner occupied | 38 | | | 66 | | | | | | | |
| Commercial loans | 1,513 | | | 1,474 | | | | | | | |
| Total recoveries | 10,999 | | | 9,141 | | | | | | | |
| Balance at end of period | $ | 116,819 | | | 125,243 | | | | | | | |
| | | | | | | | | |
| Allowance for credit losses as a percentage of loans receivable | 1.04 | % | | 1.10 | % | | | | | | |
| Net charge-offs as a percentage of average loans outstanding: | | | | | | | | | |
| Residential mortgage loans | (0.02) | % | | (0.01) | % | | | | | | |
| Home equity loans | 0.05 | % | | 0.01 | % | | | | | | |
| Vehicle loans | 0.37 | % | | 0.22 | % | | | | | | |
| Consumer loans | 4.04 | % | | 4.11 | % | | | | | | |
| Commercial real estate loans | 0.39 | % | | 0.01 | % | | | | | | |
| Commercial real estate loans - owner occupied | — | % | | — | % | | | | | | |
| Commercial loans | 0.72 | % | | 0.20 | % | | | | | | |
| Total Average Loans Receivable | 0.32 | % | | 0.11 | % | | | | | | |
| Allowance for credit losses as a percentage of nonperforming loans | 188.24 | % | | 129.01 | % | | | | | | |
| Allowance for credit losses as a percentage of nonperforming assets | 149.40 | % | | 128.87 | % | | | | | | |
Allocation of Allowance for Credit Losses. The following tables set forth the allocation of the allowance for credit losses by loan category at the dates indicated. The allowance for credit losses allocated to each category is not necessarily indicative of future losses in any particular category.
| | | | | | | | | | | | | | | | | | | | | | | | | | | |
| | At December 31, |
| | 2024 | | 2023 | | |
| | Amount | | % of total
loans (1) | | Amount | | % of total
loans (1) | | | | |
| | (Dollars in thousands) |
| Balance at end of year applicable to: | | | | | | | | | | | |
| Residential mortgage loans | $ | 14,347 | | | 28.4 | % | | $ | 18,193 | | | 30.0 | % | | | | |
| Home equity loans | 4,845 | | | 10.3 | % | | 5,403 | | | 10.8 | % | | | | |
| Vehicle loans | 22,389 | | | 16.7 | % | | 26,911 | | | 17.6 | % | | | | |
| Consumer loans | 1,883 | | | 1.1 | % | | 1,199 | | | 1.0 | % | | | | |
| Commercial real estate loans | 44,328 | | | 22.3 | % | | 51,267 | | | 23.1 | % | | | | |
| Commercial real estate loans - owner occupied | 3,882 | | | 3.2 | % | | 3,775 | | | 3.0 | % | | | | |
| Commercial loans | 25,145 | | | 18.0 | % | | 18,495 | | | 14.5 | % | | | | |
| | | | | | | | | | | |
| | | | | | | | | | | |
| Total | $ | 116,819 | | | 100.0 | % | | $ | 125,243 | | | 100.0 | % | | | | |
(1)Represents percentage of loans in each category to total loans.
Liquidity and Capital Resources
Northwest Bank is required to maintain a sufficient level of liquid assets, as determined by management and defined by the FDIC and reviewed for adequacy during the FDIC’s regular examinations. The FDIC, however, does not prescribe by regulation a minimum amount or percentage of liquid assets. The FDIC allows us to consider any unencumbered, available-for-sale marketable security, whose sale would not impair our capital adequacy, to be eligible for liquidity. Liquidity is monitored through the use of a standard liquidity ratio of liquid assets to borrowings plus deposits. Using this formula, Northwest Bank’s liquidity ratio was 11.73% as of December 31, 2024. We adjust our liquidity level in order to meet funding needs of deposit outflows, repayment of borrowings and loan commitments. We also adjust liquidity as appropriate to meet our asset and liability management objectives. Liquidity needs can also be met by temporarily drawing upon lines-of-credit established for such reasons.
Following the first quarter of 2023 bank failures, the Federal Reserve Board established the Bank Term Funding Program (“BTFP”) as an additional source of available liquidity to support depository institutions through pledging qualifying assets as collateral. In January 2024, the Federal Reserve Board announced it will stop extending loans under the BTFP after March 11, 2024. The Bank took steps to support readiness but did not participate in the BTFP. At December 31, 2024, Northwest Bank had $3.2 billion of additional borrowing capacity available with the FHLB of Pittsburgh, including a $250 million overnight line of credit, which had no balance at December 31, 2024, as well as $555 million of borrowing capacity available with the Federal Reserve Bank and $105 million with two correspondent banks. We believe the Bank has sufficient liquidity and capital resources to meet its cash flow obligations over the next 12 months and for the foreseeable future.
In addition to deposits, our primary sources of funds are the amortization and repayment of loans and mortgage-backed securities, maturities of investment securities and other short-term investments, and earnings and funds provided from operations. While scheduled principal repayments on loans and mortgage-backed securities are a relatively predictable source of funds, deposit flows and loan prepayments are greatly influenced by general interest rate levels, economic conditions, and competition. We manage the pricing of our deposits to maintain a desired deposit balance. In addition, we invest excess funds in short-term interest earning and other assets, which provide liquidity to meet lending requirements. There were no short-term interest-earning deposits at December 31, 2024. For additional information about our cash flows from operating, financing, and investing activities, see the Consolidated Statements of Cash Flows included in the Consolidated Financial Statements.
A portion of our liquidity consists of cash and cash equivalents, which are a product of our operating, investing, and financing activities. The primary sources of cash during the current year were net income, principal repayments on loans and mortgage-backed securities and net increase in deposits.
Liquidity management is both a daily and long-term function of business management. If we require funds beyond our ability to generate them internally, borrowing agreements exist with the FHLB of Pittsburgh and the Federal Reserve Bank of Cleveland, which provide an additional source of funds. At December 31, 2024, Northwest Bank had an outstanding balance of $175 million with the FHLB of Pittsburgh. We borrow from these sources to reduce interest rate risk and to provide liquidity when necessary.
At December 31, 2024, our customers had $1.3 billion of unused lines of credit available and $190 million in loan commitments. This amount does not include the unfunded portion of loans in process. Time deposits scheduled to mature in less than one year at December 31, 2024, totaled $2.5 billion. We believe that a significant portion of such deposits will remain with us.
Deposits are our primary source of externally generated funds. The level of deposit inflows during any given period is heavily influenced by factors outside of our control, such as consumer savings tendencies, the general level of short-term and long-term market interest rates, as well as higher alternative yields that investors may obtain on competing investments such as money market mutual funds. Financial institutions, such as Northwest Bank, are also subject to deposit outflows. Our net deposits increased by $165 million for the year ended December 31, 2024, increased by $515 million for the year ended December 31, 2023, and decreased by $837 million for the year ended December 31, 2022.
Similarly, the amount of principal repayments on loans and the amount of new loan originations is heavily influenced by the general level of market interest rates, consumer confidence and consumer spending. Funds received from loan maturities and principal payments on loans for the years ended December 31, 2024, 2023 and 2022 were $3.2 billion, $3.4 billion, and $4.0 billion, respectively. Loan originations for the years ended December 31, 2024, 2023 and 2022 were $3.3 billion, $4.2 billion, and $4.9 billion, respectively. We also sell a portion of the loans we originate as part of our mortgage banking operations, and the cash flows from such sales for the years ended December 31, 2024, 2023 and 2022 were $207 million, $204 million, and $384 million, respectively.
We experience significant cash flows from our portfolio of marketable securities as principal payments are received on mortgage-backed securities and as investment securities mature or are called. Cash flows from the repayment of principal and the maturity or call of marketable securities for the years ended December 31, 2024, 2023 and 2022 were $147 million, $169 million, and $330 million, respectively.
When necessary, we utilize borrowings as a source of liquidity and as a source of funds for long-term investment when market conditions permit. The net cash flow from the receipt and repayment of borrowings was a net decrease of $199 million, a net decrease of $282 million, and a net increase of $532 million for the years ended December 31, 2024, 2023 and 2022, respectively.
Northwest Bancshares, Inc. is a separate legal entity from Northwest Bank and must provide for its own liquidity to pay dividends to shareholders, to repurchase its common stock and for other corporate purposes. Northwest Bancshares’ primary source of liquidity is the dividend payments it receives from Northwest Bank. During 2020, Northwest Bancshares, Inc. issued $125 million of subordinated debt. At December 31, 2024, Northwest Bancshares, Inc. (on an unconsolidated basis) had liquid assets of $239 million.
Other activity with respect to cash flow was the payment of cash dividends on common stock in the amount of $102 million, $102 million, and $101 million for years the ended December 31, 2024, 2023 and 2022, respectively.
At December 31, 2024, stockholders’ equity totaled $1.6 billion. During 2024, our Board of Directors declared regular quarterly cash dividends totaling $0.80 per share of common stock.
Regulatory Capital Requirements. Northwest Bancshares, Inc. and Northwest Bank are required to meet minimum capital requirements and subject to “well capitalized” standards established by the Federal Reserve Board and FDIC, respectively. See “Item 1. Business—Supervision and Regulation—Federal Bank Holding Company Regulation—Capital Requirements and Prompt Corrective Action” and “Item 1. Business—Supervision and Regulation—Federal Banking Regulation—Prompt Corrective Action. At December 31, 2024, Northwest Bancshares, Inc. and Northwest Bank exceeded all regulatory minimum capital requirements and were considered to be “well capitalized”. The following table summarizes Northwest Bancshares and Northwest Bank’s total shareholders’ equity, regulatory capital, total risk-based assets, and leverage and risk-based capital ratios at the dates indicated.
| | | | | | | | | | | | | | | | | | | | | | | |
| Northwest Bancshares, Inc. | | Northwest Bank |
| | At December 31, | | At December 31, |
| | 2024 | | 2023 | | 2024 | | 2023 |
| | (Dollars in thousands) | | (Dollars in thousands) |
| Total shareholders’equity (GAAP capital) | $ | 1,601,303 | | | 1,560,316 | | | $ | 1,595,639 | | | 1,516,850 | |
| Add: Accumulated other comprehensive loss | 110,914 | | | 149,492 | | | 110,914 | | | 149,492 | |
| Add: Other deductions | (11,617) | | | (11,645) | | | (11,617) | | | (11,645) | |
| Less: non-qualifying intangible assets | (357,799) | | | (269,982) | | | (353,706) | | | (265,889) | |
| CET 1 capital | 1,342,801 | | | 1,428,181 | | | 1,341,230 | | | 1,388,808 | |
| Additions to Tier 1 capital | 125,845 | | | 125,585 | | | — | | | — | |
| Leverage or Tier 1 capital | 1,468,646 | | | 1,553,766 | | | 1,341,230 | | | 1,388,808 | |
| Add: Tier 2 capital (1) | 240,140 | | | 246,117 | | | 125,602 | | | 131,928 | |
| Total risk-based capital | $ | 1,708,786 | | | 1,799,883 | | | $ | 1,466,832 | | | 1,520,736 | |
| Average assets for leverage ratio | $ | 14,135,644 | | | 14,332,246 | | | $ | 14,123,417 | | | 14,322,564 | |
| Net risk-weighted assets including off-balance-sheet items | $ | 10,627,925 | | | 10,743,366 | | | $ | 10,618,368 | | | 10,734,057 | |
| | | | | | | |
| CET 1 capital ratio | 12.635 | % | | 13.294 | % | | 12.631 | % | | 12.938 | % |
| Minimum requirement | 4.500 | % | | 4.500 | % | | 4.500 | % | | 4.500 | % |
| | | | | | | |
| Leverage capital ratio | 10.390 | % | | 10.841 | % | | 9.496 | % | | 9.697 | % |
| Minimum requirement | 4.000 | % | | 4.000 | % | | 4.000 | % | | 4.000 | % |
| | | | | | | |
| Total risk-based capital ratio | 16.078 | % | | 16.753 | % | | 13.814 | % | | 14.167 | % |
| Minimum requirement | 8.000 | % | | 8.000 | % | | 8.000 | % | | 8.000 | % |
(1)Tier 2 capital consists of the allowance for credit losses, which is limited to 1.25% of total risk-weighted assets as detailed under the regulations of the FDIC, and 45% of pre-tax net unrealized gains on securities available-for-sale.
Northwest Bank is also subject to capital guidelines of the Department of Banking. Although not adopted in regulation form, the Department of Banking requires 6% leverage capital and 10% total risk-based capital. See “Item 1. Business—Supervision and Regulation—Pennsylvania Savings Bank Law”.
Contractual Obligations. We are obligated to make future payments according to various contracts. The following table presents the expected future payments of the contractual obligations aggregated by obligation type at December 31, 2024.
| | | | | | | | | | | | | | | | | | | | | | | | | | | | | |
| | Payments due |
| | Less than
one year | | One year to
less than
three years | | Three years
to less than
five years | | Five years
or greater | | Total |
| | (In thousands) |
| Supplemental Executive Retirement Plan (1) | $ | — | | | — | | | — | | | 1,113 | | | 1,113 | |
| Term notes payable to the FHLB of Pittsburgh (2) | 175,000 | | | — | | | — | | | — | | | 175,000 | |
| Collateralized borrowings (2) | 22,323 | | | — | | | — | | | — | | | 22,323 | |
| Collateral received (2) | 3,008 | | | — | | | — | | | — | | | 3,008 | |
| Subordinated debentures (2) | — | | | — | | | — | | | 114,800 | | | 114,800 | |
| Junior subordinated debentures (2) | — | | | — | | | — | | | 129,834 | | | 129,834 | |
| Operating leases (3) | 5,514 | | | 10,692 | | | 9,697 | | | 42,703 | | | 68,606 | |
| Total | $ | 205,845 | | | 10,692 | | | 9,697 | | | 288,450 | | | 514,684 | |
| Commitments to extend credit | $ | 190,094 | | | — | | | — | | | — | | | 190,094 | |
(1)See Note 15 to the Consolidated Financial Statements, Employee Benefit Plans, for additional information.
(2)See Note 11 to the Consolidated Financial Statements, Borrowed Funds, for additional information.
(3)See Note 3 to the Consolidated Financial Statements, Leases, for additional information.
Impact of Inflation and Changing Prices. The Consolidated Financial Statements and notes thereto, presented elsewhere herein, have been prepared in accordance with United States generally accepted accounting principles, which require the measurement of financial position and operating results in terms of historical dollars without considering the change in the relative purchasing power of money over time and due to inflation. The impact of inflation is reflected in the increased cost of our operations. Unlike most industrial companies, nearly all of our assets and liabilities are monetary. As a result, interest rates have a greater impact on our performance than do the effects of general levels of inflation. Interest rates do not necessarily move in the same direction or to the same extent as the price of goods and services.
Off-Balance-Sheet Arrangements. As a financial services provider, we are routinely a party to various financial instruments with off-balance-sheet risks, such as commitments to extend credit and unused lines of credit. While these contractual obligations represent our future cash requirements, a significant portion of commitments to extend credit may expire without being drawn upon. Such commitments are subject to the same credit policies and approval process accorded to loans we make. In addition, we routinely enter into commitments to purchase and sell residential mortgage loans.
ITEM 7A. QUANTITATIVE AND QUALITATIVE DISCLOSURES ABOUT MARKET RISK
Market Risk Management
The matching of assets and liabilities may be analyzed by examining the extent to which such assets and liabilities are “interest rate sensitive” and by monitoring an institution’s interest rate sensitivity “gap”. An asset or liability is said to be interest rate sensitive within a specific time period if it will mature or re-price within that time period. The interest rate sensitivity gap is defined as the difference between the amount of interest-earning assets maturing or re-pricing within a specific time period and the amount of interest-bearing liabilities maturing or re-pricing within that same time period. A gap is considered positive when the amount of interest rate sensitive assets exceeds the amount of interest rate sensitive liabilities. A gap is considered negative when the amount of interest rate sensitive liabilities exceeds the amount of interest rate sensitive assets. During a period of rising interest rates, a negative gap would tend to adversely affect net interest income while a positive gap would tend to positively affect net interest income. Similarly, during a period of falling interest rates, a negative gap would tend to positively affect net interest income while a positive gap would tend to adversely affect net interest income.
Our practice is to reduce our exposure to interest rate risk generally by matching the maturities of our interest rate sensitive assets and liabilities and by increasing the interest rate sensitivity of our interest-earning assets. We purchase adjustable-rate investment securities and mortgage-backed securities, which at December 31, 2024, totaled $76 million, and originate adjustable-rate loans, which at December 31, 2024, totaled $4.3 billion or 38% of our gross loan portfolio. Of our $13.2 billion of interest-earning assets at December 31, 2024, $4.3 billion, or 33%, consisted of assets with adjustable rates of interest. When open market conditions are favorable, we also attempt to reduce interest rate risk by lengthening the maturities of our interest-bearing liabilities by using FHLB advances as a source of long-term fixed-rate funds, if necessary, and by promoting longer-term certificates of deposit. At times, the Company may also use derivatives to adjust our interest rate risk profile. As of December 31, 2024 we had $175 million of cash flow hedges.
At December 31, 2024, total interest-earning liabilities maturing or re-pricing within one year exceeded total interest-bearing assets maturing or re-pricing in the same period by $30 million, representing a one-year gap ratio of 0.21%.
The following table sets forth, on a carrying value basis, the amounts of interest-earning assets and interest-bearing liabilities outstanding at December 31, 2024, which are expected to re-price or mature, based upon certain assumptions, in each of the future time periods shown. Except as stated below, the amounts of assets and liabilities shown that re-price or mature during a particular period were determined in accordance with the earlier of the term of re-pricing or the contractual term of the asset or liability. We believe that these assumptions approximate the standards used in the financial services industry and consider them appropriate and reasonable.
| | | | | | | | | | | | | | | | | | | | | | | | | | | | | | | | | | | |
| | Amounts maturing or re-pricing |
| | Within
1 year | | Over
1-3 years | | Over
3-5 years | | Over
5-10 years | | Over 10 years | | Total |
| | (Dollars in thousands) |
| Rate-sensitive assets: | | | | | | | | | | | |
| Interest-earning deposits | $ | 184,264 | | | — | | | — | | | — | | | — | | | 184,264 | |
| Mortgage-backed securities: | | | | | | | | | | | |
| Fixed-rate | 221,194 | | | 379,645 | | | 267,350 | | | 439,545 | | | 257,745 | | | 1,565,479 | |
| Variable-rate | 49,352 | | | — | | | — | | | — | | | — | | | 49,352 | |
| Investment securities | 7,284 | | | 41,952 | | | 111,682 | | | 61,245 | | | 22,536 | | | 244,699 | |
| Mortgage loans: | | | | | | | | | | | |
| Adjustable-rate | 28,076 | | | 11,935 | | | 42,733 | | | 12,071 | | | 29 | | | 94,844 | |
| Fixed-rate | 301,506 | | | 563,189 | | | 512,980 | | | 1,039,564 | | | 659,026 | | | 3,076,265 | |
| Home equity loans: | | | | | | | | | | | |
| Adjustable-rate | 423,282 | | | — | | | — | | | — | | | — | | | 423,282 | |
| Fixed-rate | 146,859 | | | 242,853 | | | 178,705 | | | 148,734 | | | 5,009 | | | 722,160 | |
| Consumer loans | 777,908 | | | 989,699 | | | 154,749 | | | 2,744 | | | 15,256 | | | 1,940,356 | |
| Commercial real estate loans | 2,051,832 | | | 632,829 | | | 137,318 | | | 9,262 | | | 22,339 | | | 2,853,580 | |
| Commercial loans | 1,444,952 | | | 445,655 | | | 96,703 | | | 6,523 | | | 15,731 | | | 2,009,564 | |
| Total rate-sensitive assets | 5,636,509 | | | 3,307,757 | | | 1,502,220 | | | 1,719,688 | | | 997,671 | | | 13,163,845 | |
| | | | | | | | | | | |
| Rate-sensitive liabilities: | | | | | | | | | | | |
| Time deposits | 2,548,387 | | | 108,797 | | | 18,702 | | | 1,734 | | | 25 | | | 2,677,645 | |
| Money market demand accounts | 1,763,560 | | | — | | | — | | | — | | | 244,179 | | | 2,007,739 | |
| Savings deposits | 409,107 | | | 535,952 | | | 535,952 | | | 690,240 | | | — | | | 2,171,251 | |
| Interest-bearing demand deposits | 583,984 | | | 400,052 | | | 400,052 | | | 1,000,130 | | | 282,286 | | | 2,666,504 | |
| FHLB Advances | — | | | 100,000 | | | 75,000 | | | — | | | — | | | 175,000 | |
| Collateral | 34,850 | | | — | | | — | | | — | | | — | | | 34,850 | |
| Other borrowings | 22,323 | | | — | | | — | | | — | | | — | | | 22,323 | |
| Trust Preferred Securities | 129,834 | | | — | | | — | | | — | | | — | | | 129,834 | |
| Subordinated debt | 114,538 | | | — | | | — | | | — | | | — | | | 114,538 | |
| Total rate-sensitive liabilities | $ | 5,606,583 | | | 1,144,801 | | | 1,029,706 | | | 1,692,104 | | | 526,490 | | | 9,999,684 | |
| | | | | | | | | | | |
| Cumulative interest sensitivity gap | $ | 29,926 | | | 2,192,882 | | | 2,665,396 | | | 2,692,980 | | | 3,164,161 | | | 3,164,161 | |
| | | | | | | | | | | |
Cumulative interest sensitivity gap as a
percentage of total assets | 0.21 | % | | 15.18 | % | | 18.46 | % | | 18.65 | % | | 21.91 | % | | 21.91 | % |
| Cumulative interest-earning assets as a percent of cumulative interest-bearing liabilities | 100.53 | % | | 132.48 | % | | 134.25 | % | | 128.43 | % | | 131.64 | % | | 131.64 | % |
For comparison, at December 31, 2023, we had a cumulative interest sensitivity gap as a percentage of total assets of 23.09%. We have an Asset/Liability Committee, consisting of members of management, which meets monthly to review market interest rates, economic conditions, the pricing of interest earning assets and interest bearing liabilities and our balance sheet structure. On a quarterly basis, this committee also reviews our interest rate risk position and our cash flow projections.
Our Board of Directors has a Risk Management Committee, which meets quarterly, and reviews interest rate risks and trends, our interest sensitivity position, our liquidity position and the market risk inherent in our investment portfolio.
In an effort to assess interest rate risk, we use a simulation model to determine the effect of immediate incremental increases and decreases in interest rates on net interest income, net income and the market value of our equity. Certain assumptions are made regarding loan prepayments and decay rates of savings and interest-bearing demand deposit accounts. Because it is difficult to
accurately project the market reaction of depositors and borrowers, the effect of actual changes in interest rates on these assumptions may differ from simulated results. We have established the following guidelines for assessing interest rate risk:
Net Interest Income Simulation. Given a parallel shift of 100 basis points (“bps”), 200 bps, and 300 bps in interest rates, the estimated net interest income may not decrease by more than 5%, 10%, and 15%, respectively, within a one-year period.
Net Income Simulation. Given a parallel shift of 100 bps, 200 bps, and 300 bps in interest rates, the estimated net income may not decrease by more than 10%, 20%, and 30%, respectively, within a one-year period.
Market Value of Equity Simulation. The market value of our equity is the present value of our assets and liabilities. Given a parallel shift of 100 bps, 200 bps, and 300 bps in interest rates, the market value of equity may not decrease by more than 15%, 30%, and 35%, respectively, from the computed economic value at current interest rate levels.
The following table illustrates the simulated impact of a parallel 100 bps, 200 bps or 300 bps upward or 100 bps, 200 bps, or 300 bps downward movement in interest rates on net interest income, net income, return on average equity, earnings per share, and market value of equity. These analyses were prepared assuming that total interest-earning asset and interest-bearing liability levels at December 31, 2024 remain constant. The impact of the rate movements was computed by simulating the effect of an immediate and sustained shift in interest rates over a twelve-month period from December 31, 2024 levels.
| | | | | | | | | | | | | | | | | | | | | | | | | | | | | | | | | | | | | | |
| | | Increase | | Decrease |
| Parallel shift in interest rates over the next 12 months | | 100 bps | | 200 bps | | 300 bps | | 100 bps | | 200 bps | | 300 bps |
| Projected percentage increase/(decrease) in net interest income | | (1.0) | % | | (2.3) | % | | (3.7) | % | | (0.6) | % | | (4.0) | % | | (6.4) | % |
| Projected percentage increase/(decrease) in net income | | (2.4) | % | | (5.5) | % | | (8.8) | % | | (1.5) | % | | (9.7) | % | | (15.4) | % |
| Projected increase/(decrease) in return on average equity | | (2.2) | % | | (5.2) | % | | (8.9) | % | | (1.4) | % | | (9.3) | % | | (14.7) | % |
| Projected increase/(decrease) in earnings per share | | $ | (0.03) | | | $ | (0.07) | | | $ | (0.11) | | | $ | (0.02) | | | $ | (0.12) | | | $ | (0.18) | |
| Projected percentage increase/(decrease) in market value of equity | | (5.1) | % | | (10.5) | % | | (16.0) | % | | 3.4 | % | | 3.9 | % | | 5.7 | % |
The following table illustrates the simulated impact of a parallel 100 bps, 200 bps or 300 bps upward or 100 bps downward movement in interest rates on net interest income, net income, return on average equity, earnings per share, and market value of equity. These analyses were prepared assuming that total interest-earning asset and interest-bearing liability levels at December 31, 2023 remain constant. The impact of the rate movements was computed by simulating the effect of an immediate and sustained shift in interest rates over a twelve-month period from December 31, 2023 levels.
| | | | | | | | | | | | | | | | | | | | | | | | | | | | | | | | | | | | | | |
| | | Increase | | Decrease |
| Parallel shift in interest rates over the next 12 months | | 100 bps | | 200 bps | | 300 bps | | 100 bps | | 200 bps | | 300 bps |
| Projected percentage decrease in net interest income | | (1.4) | % | | (3.1) | % | | (4.9) | % | | (0.1) | % | | (5.2) | % | | (11.2) | % |
| Projected percentage decrease in net income | | (3.3) | % | | (7.4) | % | | (11.5) | % | | (0.3) | % | | (12.7) | % | | (27.0) | % |
| Projected decrease in return on average equity | | (3.1) | % | | (7.1) | % | | (11.1) | % | | (0.2) | % | | (12.2) | % | | (26.1) | % |
| Projected decrease in earnings per share | | $ | (0.04) | | | $ | (0.08) | | | $ | (0.13) | | | $ | — | | | $ | (0.14) | | | $ | (0.29) | |
| Projected percentage decrease in market value of equity | | (8.6) | % | | (17.2) | % | | (25.3) | % | | 8.6 | % | | 10.8 | % | | 9.4 | % |
The figures included in the tables above represent projections that were computed based upon certain assumptions including loan prepayment rates and deposit decay rates. These assumptions are inherently uncertain and, as a result, we cannot precisely predict the impact of changes in interest rates. Actual results may differ significantly due to timing, magnitude and frequency of interest rate changes and changes in market conditions. Compared to 2023, the simulations showed decreased interest rate sensitivity in rising rate scenarios which was driven by an increase in floating rate commercial loans. Additionally, decreased interest rate sensitivity was driven by decreased deposit beta assumptions that were revised after most current down rate environment.
When assessing our interest rate sensitivity, analysis of historical trends indicates that loans will prepay at various speeds (or annual rates) depending on the variance between the weighted average portfolio rates and the current market rates. In preparing the table above, the following assumptions were used: (i) adjustable-rate mortgage loans will prepay at an annual rate of 8% to 23%; (ii) fixed-rate mortgage loans will prepay at an annual rate of 6% to 40%, depending on the type of loan; (iii) commercial loans will prepay at an annual rate of 10% to 30%; and (iv) consumer loans held by Northwest Bank will prepay at an annual rate of 15% to 25%. In regards to our deposits, it has been assumed that (i) fixed maturity deposits will not be withdrawn prior to maturity; (ii) a significant majority of money market accounts will re-price immediately; (iii) savings accounts will gradually re-price over three years; and (iv) checking accounts will re-price either when the rates on such accounts re-price as interest rate levels change, or when deposit holders withdraw funds from such accounts and select other types of deposit accounts, such as certificate accounts, which may have higher interest rates. For purposes of this analysis, management has estimated, based on historical trends, that $584 million, or 22%, of our interest-bearing demand accounts and $409 million, or 19%, of our savings deposits are interest sensitive and may re-price in one year or less, and that the remainder may re-price over longer time periods.
The above assumptions are annual percentages based on remaining balances and should not be regarded as indicative of the actual prepayments and withdrawals that we may experience. Moreover, certain shortcomings are inherent in the analysis presented by the foregoing table. For example, although certain assets and liabilities may have similar maturities or periods to re-pricing, they may react in different degrees to changes in market interest rates. Also, interest rates on certain types of assets and liabilities may fluctuate in advance of or lag behind changes in market interest rates. Additionally, certain assets, such as some adjustable-rate loans, have features that restrict changes in interest rates on a short-term basis and over the life of the asset. Moreover, in the event of a change in interest rates, prepayment and early withdrawal levels would likely deviate significantly from those assumed in preparing the table.
In addition, we regularly measure and monitor the market value of our net assets and the changes therein. While fluctuations are expected because of changes in interest rates, we have established policy limits for various interest rate scenarios. Given interest rate shocks of +100 to +300 bps and -100 to -300 bps the market value of net assets is not expected to decrease by more than 15% to 35%.
ITEM 8. FINANCIAL STATEMENTS AND SUPPLEMENTARY DATA
Management’s Report on Internal Control Over Financial Reporting
Management is responsible for establishing and maintaining adequate internal control over financial reporting, as such term is defined in Rule 13a-15(f) under the Securities Exchange Act of 1934.
Management, including the principal executive officer and principal financial officer, has assessed the effectiveness of the Company’s internal control over financial reporting as of December 31, 2024. In making this assessment, management used the criteria set forth by the Committee of Sponsoring Organizations of the Treadway Commission in Internal Control—Integrated Framework (2013). Based on such assessment, management concluded that, as of December 31, 2024, the Company’s internal control over financial reporting is effective based upon those criteria.
KPMG LLP, an independent registered public accounting firm, has audited the Consolidated Financial Statements included in this Report and has issued a report with respect to the effectiveness of the Company’s internal control over financial reporting.
| | | | | | | | |
| /s/ Louis J. Torchio | | /s/ Douglas M. Schosser |
| Louis J. Torchio, President and Chief Executive Officer (Principal Executive Officer) | | Douglas M. Schosser, Chief Financial Officer (Principal Financial Officer) |
Report of Independent Registered Public Accounting Firm
To the Shareholders and Board of Directors
Northwest Bancshares, Inc.:
Opinion on Internal Control Over Financial Reporting
We have audited Northwest Bancshares, Inc. and subsidiaries’ (the Company) internal control over financial reporting as of December 31, 2024, based on criteria established in Internal Control — Integrated Framework (2013) issued by the Committee of Sponsoring Organizations of the Treadway Commission. In our opinion, the Company maintained, in all material respects, effective internal control over financial reporting as of December 31, 2024, based on criteria established in Internal Control — Integrated Framework (2013) issued by the Committee of Sponsoring Organizations of the Treadway Commission.
We also have audited, in accordance with the standards of the Public Company Accounting Oversight Board (United States) (PCAOB), the consolidated statements of financial condition of the Company as of December 31, 2024 and 2023, the related consolidated statements of income, comprehensive income, changes in shareholders’ equity, and cash flows for each of the years in the three-year period ended December 31, 2024, and the related notes (collectively, the consolidated financial statements), and our report dated February 25, 2025 expressed an unqualified opinion on those consolidated financial statements.
Basis for Opinion
The Company’s management is responsible for maintaining effective internal control over financial reporting and for its assessment of the effectiveness of internal control over financial reporting, included in the accompanying Management's Report on Internal Control Over Financial Reporting. Our responsibility is to express an opinion on the Company’s internal control over financial reporting based on our audit. We are a public accounting firm registered with the PCAOB and are required to be independent with respect to the Company in accordance with the U.S. federal securities laws and the applicable rules and regulations of the Securities and Exchange Commission and the PCAOB.
We conducted our audit in accordance with the standards of the PCAOB. Those standards require that we plan and perform the audit to obtain reasonable assurance about whether effective internal control over financial reporting was maintained in all material respects. Our audit of internal control over financial reporting included obtaining an understanding of internal control over financial reporting, assessing the risk that a material weakness exists, and testing and evaluating the design and operating effectiveness of internal control based on the assessed risk. Our audit also included performing such other procedures as we considered necessary in the circumstances. We believe that our audit provides a reasonable basis for our opinion.
Definition and Limitations of Internal Control Over Financial Reporting
A company’s internal control over financial reporting is a process designed to provide reasonable assurance regarding the reliability of financial reporting and the preparation of financial statements for external purposes in accordance with generally accepted accounting principles. A company’s internal control over financial reporting includes those policies and procedures that (1) pertain to the maintenance of records that, in reasonable detail, accurately and fairly reflect the transactions and dispositions of the assets of the company; (2) provide reasonable assurance that transactions are recorded as necessary to permit preparation of financial statements in accordance with generally accepted accounting principles, and that receipts and expenditures of the company are being made only in accordance with authorizations of management and directors of the company; and (3) provide reasonable assurance regarding prevention or timely detection of unauthorized acquisition, use, or disposition of the company’s assets that could have a material effect on the financial statements.
Because of its inherent limitations, internal control over financial reporting may not prevent or detect misstatements. Also, projections of any evaluation of effectiveness to future periods are subject to the risk that controls may become inadequate because of changes in conditions, or that the degree of compliance with the policies or procedures may deteriorate.
/s/ KPMG LLP
Pittsburgh, Pennsylvania
February 25, 2025
Report of Independent Registered Public Accounting Firm
To the Shareholders and Board of Directors
Northwest Bancshares, Inc.:
Opinion on the Consolidated Financial Statements
We have audited the accompanying consolidated statements of financial condition of Northwest Bancshares, Inc. and subsidiaries (the Company) as of December 31, 2024 and 2023, the related consolidated statements of income, comprehensive income, changes in shareholders' equity, and cash flows for each of the years in the three-year period ended December 31, 2024 and the related notes (collectively, the consolidated financial statements). In our opinion, the consolidated financial statements present fairly, in all material respects, the financial position of the Company as of December 31, 2024 and 2023, and the results of its operations and its cash flows for each of the years in the three-year period ended December 31, 2024, in conformity with U.S. generally accepted accounting principles.
We also have audited, in accordance with the standards of the Public Company Accounting Oversight Board (United States) (PCAOB), the Company's internal control over financial reporting as of December 31, 2024, based on criteria established in Internal Control — Integrated Framework (2013) issued by the Committee of Sponsoring Organizations of the Treadway Commission, and our report dated February 25, 2025 expressed an unqualified opinion on the effectiveness of the Company's internal control over financial reporting.
Basis for Opinion
These consolidated financial statements are the responsibility of the Company’s management. Our responsibility is to express an opinion on these consolidated financial statements based on our audits. We are a public accounting firm registered with the PCAOB and are required to be independent with respect to the Company in accordance with the U.S. federal securities laws and the applicable rules and regulations of the Securities and Exchange Commission and the PCAOB.
We conducted our audits in accordance with the standards of the PCAOB. Those standards require that we plan and perform the audit to obtain reasonable assurance about whether the consolidated financial statements are free of material misstatement, whether due to error or fraud. Our audits included performing procedures to assess the risks of material misstatement of the consolidated financial statements, whether due to error or fraud, and performing procedures that respond to those risks. Such procedures included examining, on a test basis, evidence regarding the amounts and disclosures in the consolidated financial statements. Our audits also included evaluating the accounting principles used and significant estimates made by management, as well as evaluating the overall presentation of the consolidated financial statements. We believe that our audits provide a reasonable basis for our opinion.
Critical Audit Matter
The critical audit matter communicated below is a matter arising from the current period audit of the consolidated financial statements that was communicated or required to be communicated to the audit committee and that: (1) relates to accounts or disclosures that are material to the consolidated financial statements and (2) involved our especially challenging, subjective, or complex judgments. The communication of a critical audit matter does not alter in any way our opinion on the consolidated financial statements, taken as a whole, and we are not, by communicating the critical audit matter below, providing a separate opinion on the critical audit matter or on the accounts or disclosures to which it relates.
Allowance for credit losses for loans evaluated on a collective basis
As discussed in Notes 1 and 5 to the consolidated financial statements, the Company’s allowance for credit losses for loans held for investment was $116.8 million as of December 31, 2024, a portion of which included the measurement of expected credit losses on a collective (pool) basis for all loans that share similar risk characteristics. The expected credit loss methodologies incorporate probability of default (PD) and loss given default (LGD) to determine a PD and LGD loss assumption which is applied to loan level exposures on an undiscounted basis over the contractual term of the loans, adjusted for prepayments, certain of which use a prepayment model. The Company uses a twenty-four-month reasonable and supportable forecast period, which is based on a probability-weighted multiple macroeconomic forecast approach (macroeconomic forecasts) and reverts to historical average loss rates over a twelve-month period for the remaining life of the loans. The following methodologies were developed for each significant loan portfolio segment: (1) the allowance for credit losses within the residential mortgage and home equity loan portfolios are calculated using a PD, LGD, and prepayment model adjusted for asset specific characteristics at the loan-level using projected default rates, prepayment rates, and severity rates as well as macroeconomic forecasts determined at the pool level; (2) the allowance for credit losses within the vehicle loan portfolio is calculated using a PD, LGD, and prepayment model adjusted for asset specific characteristics at the loan-level using projected default rates and prepayment rates, as well as macroeconomic forecasts determined at
the pool level; (3) the allowance for credit losses for commercial real estate small business and commercial small business loan portfolios are calculated using PD and LGD models at the borrower-level using both a regression model and a fractional logit model as well as macroeconomic indicators and expected prepayment rates at the pool level; and (4) the allowance for credit losses for the commercial real estate and commercial loan portfolios are calculated using PD and LGD models at the pool-level using projected default and severity rates as well as macroeconomic forecasts and expected prepayment rates determined at the pool level. A portion of the collective allowance for credit losses is comprised of adjustments to historical loss information for asset-specific risk characteristics to reflect the extent they do not exist in the historical loss information. These adjustments are based on qualitative factors not reflected in the quantitative models but are likely to impact the measurement of estimated credit losses.
We identified the assessment of the expected credit losses on a collective basis for all loans, except for consumer loans, (collective ACL), as a critical audit matter. A high degree of audit effort, including specialized skills and knowledge, and subjective and complex auditor judgment was involved in the assessment of the collective ACL due to significant measurement uncertainty. Specifically, the assessment encompassed the evaluation of the collective ACL methodologies, including the (1) PD, LGD, and prepayment models and their significant assumptions, including the selection and weighting of the macroeconomic forecasts, and the reasonable and supportable forecast period, (2) adjustment for asset specific risk characteristics for residential mortgage, home equity, and vehicle loans and (3) the qualitative factors. The assessment also included an evaluation of the conceptual soundness and performance of the models. In addition, auditor judgment was required to evaluate the sufficiency of audit evidence obtained.
The following are the primary procedures we performed to address this critical audit matter. We evaluated the design and tested the operating effectiveness of certain internal controls related to the Company’s collective ACL estimate, including controls over the:
•development of the collective ACL methodologies
•continued use and conceptual soundness of the PD, LGD, and prepayment models
•performance monitoring of the models
•determination and measurement of the significant assumptions used in the models
•determination of the methodology used to develop the qualitative factors
•analysis of the collective ACL results, trends, and ratios
We evaluated the Company’s process to develop the collective ACL estimate by testing certain sources of data, factors, and assumptions that the Company used, and considered the relevance and reliability of such data, factors, and assumptions. In addition, we involved credit risk professionals with specialized skills and knowledge, who assisted in:
•evaluating the Company’s collective ACL methodologies for compliance with U.S. generally accepted accounting principles
•evaluating judgments made by the Company relative to the development and performance testing of the model assumptions, inclusive of the metrics used for asset-specific risk characteristics for the mortgage, home equity, and vehicle models, by comparing them to relevant Company-specific metrics and trends and the applicable industry and regulatory practices
•assessing the conceptual soundness and performance testing of the model assumptions by inspecting the model documentation to determine whether the models are suitable for their intended use
•evaluating the selection and weighting of the macroeconomic forecasts by comparing it to the Company’s business environment and relevant industry practices
•evaluating the length of the reasonable and supportable forecast period by comparing it to specific portfolio risk characteristics and trends
•evaluating the methodology used to develop the qualitative factors
We also assessed the sufficiency of the audit evidence obtained related to the collective ACL by evaluating the cumulative results of the audit procedures, qualitative aspects of the Company’s accounting practices, and potential bias in the accounting estimate.
/s/ KPMG LLP
We have served as the Company’s auditor since 1963.
Pittsburgh, Pennsylvania
February 25, 2025
NORTHWEST BANCSHARES, INC. AND SUBSIDIARIES
CONSOLIDATED STATEMENTS OF FINANCIAL CONDITION
(in thousands, excluding share data) | | | | | | | | | | | |
| | December 31, |
| | 2024 | | 2023 |
| Assets | | | |
| Cash and cash equivalents | $ | 288,378 | | | 122,260 | |
| Marketable securities available-for-sale (amortized cost of $1,278,665 and $1,240,003, respectively) | 1,108,944 | | | 1,043,359 | |
| Marketable securities held-to-maturity (fair value of $637,948 and $699,506, respectively) | 750,586 | | | 814,839 | |
| Total cash and cash equivalents and marketable securities | 2,147,908 | | | 1,980,458 | |
| | | |
| Loans held-for-sale | 76,331 | | | 8,768 | |
| Loans held for investment | 11,180,014 | | | 11,406,041 | |
| Allowance for credit losses | (116,819) | | | (125,243) | |
| Loans receivable, net | 11,063,195 | | | 11,280,798 | |
| | | |
| FHLB stock, at cost | 21,006 | | | 30,146 | |
| Accrued interest receivable | 46,356 | | | 47,353 | |
| Real estate owned, net | 35 | | | 104 | |
| Premises and equipment, net | 124,246 | | | 138,838 | |
| Bank-owned life insurance | 253,137 | | | 251,895 | |
| Goodwill | 380,997 | | | 380,997 | |
| Other intangible assets, net | 2,837 | | | 5,290 | |
| Other assets | 292,176 | | | 294,458 | |
| Total assets | $ | 14,408,224 | | | 14,419,105 | |
| | | |
| Liabilities and shareholders’ equity | | | |
| Liabilities: | | | |
| Deposits | $ | 12,144,554 | | | 11,979,902 | |
| Borrowed funds | 200,331 | | | 398,895 | |
| Subordinated debt | 114,538 | | | 114,189 | |
| Junior subordinated debentures | 129,834 | | | 129,574 | |
| Advances by borrowers for taxes and insurance | 42,042 | | | 45,253 | |
| Accrued interest payable | 6,935 | | | 13,669 | |
| Other liabilities | 173,134 | | | 186,306 | |
| Total liabilities | 12,811,368 | | | 12,867,788 | |
| | | |
| Shareholders’ equity: | | | |
| Preferred stock, $0.01 par value: 50,000,000 authorized, no shares issued | — | | | — | |
| Common stock, $0.01 par value: 500,000,000 shares authorized, 127,508,003 and 127,110,453 shares issued and outstanding, respectively | 1,275 | | | 1,271 | |
| Additional paid-in capital | 1,033,385 | | | 1,024,852 | |
| Retained earnings | 673,110 | | | 674,686 | |
| Accumulated other comprehensive loss | (110,914) | | | (149,492) | |
| Total shareholders’ equity | 1,596,856 | | | 1,551,317 | |
| Total liabilities and shareholders’ equity | $ | 14,408,224 | | | 14,419,105 | |
See accompanying notes to Consolidated Financial Statements.
NORTHWEST BANCSHARES, INC. AND SUBSIDIARIES
CONSOLIDATED STATEMENTS OF INCOME
(in thousands, excluding share data) | | | | | | | | | | | | | | | | | |
| | Years ended December 31, |
| | 2024 | | 2023 | | 2022 |
| Interest income: | | | | | |
| Loans receivable | $ | 615,776 | | | 543,659 | | | 407,828 | |
| Mortgage-backed securities | 39,793 | | | 32,886 | | | 30,804 | |
| Taxable investment securities | 3,274 | | | 3,258 | | | 3,070 | |
| Tax-free investment securities | 1,975 | | | 2,350 | | | 2,767 | |
| FHLB stock dividends | 1,891 | | | 2,868 | | | 730 | |
| Interest-earning deposits | 6,487 | | | 2,901 | | | 3,599 | |
| Total interest income | 669,196 | | | 587,922 | | | 448,798 | |
| Interest expense: | | | | | |
| Deposits | 205,492 | | | 105,343 | | | 14,120 | |
| Borrowed funds | 28,126 | | | 46,896 | | | 13,997 | |
| Total interest expense | 233,618 | | | 152,239 | | | 28,117 | |
| Net interest income | 435,578 | | | 435,683 | | | 420,681 | |
| Provision for credit losses - loans | 27,679 | | | 18,664 | | | 17,860 | |
| Provision for credit losses - unfunded commitments | (3,174) | | | 4,210 | | | 10,455 | |
| Net interest income after provision for credit losses | 411,073 | | | 412,809 | | | 392,366 | |
| Noninterest income: | | | | | |
| | | | | |
| | | | | |
| Loss on sale of investments | (39,413) | | | (8,307) | | | (8) | |
| Gain on sale of mortgage servicing rights | — | | | 8,305 | | | — | |
| Gain on sale of SBA loans | 3,819 | | | 1,800 | | | — | |
| Gain on sale of loans | — | | | 726 | | | — | |
| Service charges and fees | 62,957 | | | 59,214 | | | 55,188 | |
| Trust and other financial services income | 30,102 | | | 27,284 | | | 27,765 | |
| | | | | |
| Gain on real estate owned, net | 887 | | | 2,006 | | | 603 | |
| Income from bank-owned life insurance | 6,327 | | | 8,588 | | | 7,129 | |
| Mortgage banking income | 2,321 | | | 2,431 | | | 4,865 | |
| | | | | |
| Other operating income | 20,010 | | | 11,776 | | | 15,307 | |
| Total noninterest income | 87,010 | | | 113,823 | | | 110,849 | |
| Noninterest expense: | | | | | |
| Compensation and employee benefits | 214,455 | | | 195,691 | | | 188,359 | |
| Premises and occupancy costs | 29,469 | | | 29,151 | | | 29,618 | |
| Office operations | 12,433 | | | 12,955 | | | 13,318 | |
| Collections expense | 2,121 | | | 1,695 | | | 1,808 | |
| Processing expenses | 59,351 | | | 58,687 | | | 52,496 | |
| Marketing expenses | 8,890 | | | 9,444 | | | 9,095 | |
| Federal deposit insurance premiums | 11,600 | | | 9,271 | | | 4,778 | |
| Professional services | 14,883 | | | 17,819 | | | 14,703 | |
| Amortization of intangible assets | 2,452 | | | 3,270 | | | 4,277 | |
| Real estate owned expense | 184 | | | 456 | | | 223 | |
| Merger, asset disposition and restructuring expense | 5,763 | | | 6,749 | | | 5,617 | |
| | | | | |
| Other expenses | 6,936 | | | 6,366 | | | 5,231 | |
| Total noninterest expense | 368,537 | | | 351,554 | | | 329,523 | |
| Income before income taxes | 129,546 | | | 175,078 | | | 173,692 | |
| Provision for income taxes: | | | | | |
| Federal | 22,337 | | | 31,332 | | | 30,910 | |
| State | 6,931 | | | 8,789 | | | 9,116 | |
| Total provision for income taxes | 29,268 | | | 40,121 | | | 40,026 | |
| Net income | $ | 100,278 | | | 134,957 | | | 133,666 | |
| Basic earnings per share | $ | 0.79 | | | 1.06 | | | 1.05 | |
| Diluted earnings per share | $ | 0.79 | | | 1.06 | | | 1.05 | |
See accompanying notes to Consolidated Financial Statements.
NORTHWEST BANCSHARES, INC. AND SUBSIDIARIES
CONSOLIDATED STATEMENTS OF COMPREHENSIVE INCOME
(in thousands) | | | | | | | | | | | | | | | | | |
| | Years ended December 31, |
| | 2024 | | 2023 | | 2022 |
| Net income | $ | 100,278 | | | 134,957 | | | 133,666 | |
| Other comprehensive income net of tax: | | | | | |
| Net unrealized holding gains/(losses) on marketable securities: | | | | | |
| Unrealized holding (losses)/gains, net of tax of $1,193, $(3,429), and $45,321, respectively | (6,378) | | | 7,875 | | | (151,888) | |
| Reclassification adjustment for losses/(gains) included in net income, net of tax of ($7,706), $(1,700), and $0, respectively | 26,789 | | | 5,672 | | | (1) | |
| Net unrealized holding gains/(losses) on marketable securities | 20,411 | | | 13,547 | | | (151,889) | |
| | | | | |
| Change in fair value of interest rate swaps, net of tax of $(448), $110, and $0, respectively | 1,533 | | | (374) | | | — | |
| | | | | |
| Defined benefit plan: | | | | | |
| Net gain, net of tax $(6,895), $(3,961), $(7,182), respectively | 18,187 | | | 10,019 | | | 18,884 | |
| Reclassification adjustments for prior period service costs and actuarial (gains)/losses included in net income, net of tax of $591, $607, and $202, respectively | (1,553) | | | (1,526) | | | (524) | |
| Net gain on defined benefit plans | 16,634 | | | 8,493 | | | 18,360 | |
| | | | | |
| Other comprehensive income/(loss) | 38,578 | | | 21,666 | | | (133,529) | |
| | | | | |
| Total comprehensive income | $ | 138,856 | | | 156,623 | | | 137 | |
See accompanying notes to Consolidated Financial Statements.
NORTHWEST BANCSHARES, INC. AND SUBSIDIARIES
CONSOLIDATED STATEMENTS OF CHANGES IN SHAREHOLDERS’ EQUITY
(in thousands, excluding per share data) | | | | | | | | | | | | | | | | | | | | | | | | | | | | | | | |
| Common
stock | | Additional paid-in
capital | | Retained
earnings | | Accumulated
other
comprehensive
income/(loss) | | | | Total
shareholders’
equity |
| Balance at December 31, 2021 | $ | 1,266 | | | 1,010,405 | | | 609,529 | | | (37,629) | | | | | 1,583,571 | |
| Comprehensive income: | | | | | | | | | | | |
| Net income | — | | | — | | | 133,666 | | | — | | | | | 133,666 | |
| Other comprehensive income, net of tax of $38,341 | — | | | — | | | — | | | (133,529) | | | | | (133,529) | |
| Total comprehensive income | — | | | — | | | 133,666 | | | (133,529) | | | | | 137 | |
| | | | | | | | | | | |
| | | | | | | | | | | |
| Exercise of stock options | 4 | | | 5,169 | | | — | | | — | | | | | 5,173 | |
| | | | | | | | | | | |
| Stock-based compensation expense | 1 | | | 4,073 | | | — | | | — | | | | | 4,074 | |
| Stock-based compensation forfeited | (1) | | | — | | | — | | | — | | | | | (1) | |
| | | | | | | | | | | |
| Dividends paid ($0.80 per share) | — | | | — | | | (101,468) | | | — | | | | | (101,468) | |
| Balance at December 31, 2022 | 1,270 | | | 1,019,647 | | | 641,727 | | | (171,158) | | | | | 1,491,486 | |
| Comprehensive income: | | | | | | | | | | | |
| Net income | — | | | — | | | 134,957 | | | — | | | | | 134,957 | |
| Other comprehensive income, net of tax of $(8,373) | — | | | — | | | — | | | 21,666 | | | | | 21,666 | |
| Total comprehensive income | — | | | — | | | 134,957 | | | 21,666 | | | | | 156,623 | |
| | | | | | | | | | | |
| Adoption of ASU No. 2022-02 | — | | | — | | | (329) | | | — | | | | | (329) | |
| Exercise of stock options | 1 | | | 629 | | | — | | | — | | | | | 630 | |
| | | | | | | | | | | |
| Stock-based compensation expense | 1 | | | 4,575 | | | — | | | — | | | | | 4,576 | |
| Stock-based compensation forfeited | (1) | | | 1 | | | — | | | — | | | | | — | |
| | | | | | | | | | | |
| Dividends paid ($0.80 per share) | — | | | — | | | (101,669) | | | — | | | | | (101,669) | |
| Balance at December 31, 2023 | 1,271 | | | 1,024,852 | | | 674,686 | | | (149,492) | | | | | 1,551,317 | |
| Comprehensive income: | | | | | | | | | | | |
| Net income | — | | | — | | | 100,278 | | | — | | | | | 100,278 | |
| Other comprehensive income, net of tax of ($13,265) | — | | | — | | | — | | | 38,578 | | | | | 38,578 | |
| Total comprehensive income | — | | | — | | | 100,278 | | | 38,578 | | | | | 138,856 | |
| | | | | | | | | | | |
| | | | | | | | | | | |
| Exercise of stock options | 2 | | | 2,453 | | | — | | | — | | | | | 2,455 | |
| | | | | | | | | | | |
| Stock-based compensation expense | 2 | | | 6,080 | | | — | | | — | | | | | 6,082 | |
| | | | | | | | | | | |
| | | | | | | | | | | |
| Dividends paid ($0.80 per share) | — | | | — | | | (101,854) | | | — | | | | | (101,854) | |
| Balance at December 31, 2024 | $ | 1,275 | | | 1,033,385 | | | 673,110 | | | (110,914) | | | | | 1,596,856 | |
See accompanying notes to Consolidated Financial Statements.
NORTHWEST BANCSHARES, INC. AND SUBSIDIARIES
CONSOLIDATED STATEMENTS OF CASH FLOWS
(in thousands) | | | | | | | | | | | | | | | | | |
| | Years ended December 31, |
| | 2024 | | 2023 | | 2022 |
| Operating activities: | | | | | |
| Net income | $ | 100,278 | | | 134,957 | | | 133,666 | |
| Adjustments to reconcile net income to net cash provided by operating activities: | | | | | |
| Provision for credit losses | 24,505 | | | 22,874 | | | 28,315 | |
| Loss on sale of investments | 39,413 | | | 8,307 | | | — | |
| Net (gain)/loss on sale of assets | (11,871) | | | 2,117 | | | 42 | |
| Mortgage banking activity | (3,210) | | | (895) | | | (3,512) | |
| Gain on sale of SBA loans | (3,614) | | | (1,754) | | | — | |
| Gain on sale of mortgage servicing rights | — | | | (8,305) | | | — | |
| Gain on sale of loans | — | | | (726) | | | — | |
| | | | | |
| Net depreciation, amortization and accretion | 21,340 | | | 24,497 | | | 6,448 | |
| Increase in other assets | (2,185) | | | (117,813) | | | (33,751) | |
| Increase in other liabilities | 8,187 | | | 21,771 | | | 19,775 | |
| Net amortization on marketable securities | 676 | | | 3,090 | | | 4,808 | |
| Noncash compensation expense related to stock benefit plans | 6,081 | | | 4,576 | | | 4,074 | |
| Noncash write-down of real estate owned | 6,697 | | | 100 | | | 54 | |
| Deferred income tax expense/(benefit) | 2,803 | | | (4,920) | | | (5,504) | |
| Origination of loans held-for-sale | (268,179) | | | (198,637) | | | (362,867) | |
| Proceeds from sale of loans held-for-sale | 206,746 | | | 203,651 | | | 383,883 | |
| Net cash provided by operating activities | 127,667 | | | 92,890 | | | 175,431 | |
| | | | | |
| Investing activities: | | | | | |
| Purchase of marketable securities held-to-maturity | — | | | — | | | (212,892) | |
| Purchase of marketable securities available-for-sale | (437,503) | | | (23,502) | | | (102,178) | |
Proceeds from maturities and principal reductions of marketable securities
held-to-maturity | 63,470 | | | 65,588 | | | 98,701 | |
Proceeds from maturities and principal reductions of marketable securities
available-for-sale | 83,950 | | | 103,424 | | | 231,728 | |
| Proceeds from sale of marketable securities available-for-sale | 275,585 | | | 101,229 | | | — | |
| Proceeds from bank-owned life insurance | 874 | | | 13,307 | | | 5,096 | |
| Proceeds from sale of mortgage servicing rights | — | | | 13,118 | | | — | |
| Loan originations | (3,015,448) | | | (3,963,743) | | | (4,585,563) | |
| Loan purchases | — | | | — | | | (371,121) | |
| Proceeds from loan maturities and principal reductions | 3,196,190 | | | 3,446,731 | | | 4,047,147 | |
| | | | | |
| Net redemptions/(proceeds) of FHLB stock | 9,140 | | | 9,997 | | | (25,959) | |
| Proceeds from sale of real estate owned | 1,024 | | | 2,735 | | | 1,633 | |
| Proceeds from sale of real estate owned for investment, net | — | | | — | | | 305 | |
| Purchases of premises and equipment, net | (2,308) | | | (8,564) | | | (4,320) | |
| | | | | |
| | | | | |
| Net cash provided by/(used in) investing activities | 174,974 | | | (239,680) | | | (917,423) | |
NORTHWEST BANCSHARES, INC.
CONSOLIDATED STATEMENTS OF CASH FLOWS
(in thousands) | | | | | | | | | | | | | | | | | |
| | Years ended December 31, |
| | 2024 | | 2023 | | 2022 |
| Financing activities: | | | | | |
| Net increase/(decrease) in deposits | $ | 164,651 | | | 515,354 | | | (836,617) | |
| | | | | |
| Repayments of long-term borrowings | — | | | — | | | (10,094) | |
| Net (decrease)/increase in short-term borrowings | (198,564) | | | (282,270) | | | 542,073 | |
| (Decrease)/increase in advances by borrowers for taxes and insurance | (3,211) | | | (2,360) | | | 3,031 | |
| | | | | |
| | | | | |
| Cash dividends paid on common stock | (101,854) | | | (101,669) | | | (101,468) | |
| Proceeds from stock options exercised | 2,455 | | | 630 | | | 5,173 | |
| | | | | |
| Net cash (used in)/provided by financing activities | (136,523) | | | 129,685 | | | (397,902) | |
| Net increase/(decrease) in cash and cash equivalents | $ | 166,118 | | | (17,105) | | | (1,139,894) | |
| | | | | |
| Cash and cash equivalents at beginning of period | $ | 122,260 | | | 139,365 | | | 1,279,259 | |
| Net increase/(decrease) in cash and cash equivalents | 166,118 | | | (17,105) | | | (1,139,894) | |
| Cash and cash equivalents at end of period | $ | 288,378 | | | 122,260 | | | 139,365 | |
| | | | | |
| | | | | |
| | | | | |
| | | | | |
| | | | | |
| | | | | |
| | | | | |
| Cash paid during the period for: | | | | | |
| Interest on deposits and borrowings (including interest credited to deposit accounts of $170,754, $86,316, and $13,399, respectively) | $ | 240,352 | | | 141,801 | | | 26,690 | |
| Income taxes | 27,790 | | | 47,996 | | | 39,365 | |
| | | | | |
| | | | | |
| | | | | |
| | | | | |
| | | | | |
| | | | | |
| | | | | |
| Noncash activities: | | | | | |
| Loan foreclosures and repossessions | $ | 4,027 | | | 4,055 | | | 4,076 | |
| Sale of real estate owned financed by the Company | — | | | 70 | | | 175 | |
See accompanying notes to Consolidated Financial Statements.
NORTHWEST BANCSHARES, INC. AND SUBSIDIARIES
NOTES TO CONSOLIDATED FINANCIAL STATEMENTS
December 31, 2024, 2023 and 2022
(1) Summary of Significant Accounting Policies
(a) Nature of Operations
Northwest Bancshares, Inc., a Maryland corporation headquartered in Columbus, Ohio, is the bank holding company for its wholly owned subsidiary, Northwest Bank. Northwest Bank, a Pennsylvania chartered savings bank, offers a complete line of business and personal banking products, as well as treasury management solutions and wealth management services through its 141 banking locations in Pennsylvania, New York, Ohio, and Indiana. We have determined that we have one reportable business segment.
(b) Principles of Consolidation
The Consolidated Financial Statements include the accounts of the Company and its wholly owned subsidiaries after elimination of all intercompany accounts and transactions.
(c) Cash and Cash Equivalents
For purposes of the statements of financial condition and cash flows, cash and cash equivalents include cash and amounts due from banks, interest-bearing deposits in other financial institutions, federal funds sold, and other short-term investments with original maturities of three months or less.
(d) Marketable Securities
We classify marketable securities at the time of purchase as held-to-maturity, available-for-sale, or trading. Securities for which management has the intent and ability to hold until maturity are classified as held-to-maturity and are carried at cost, adjusted for amortization of premiums and accretion of discounts on a level yield basis (amortized cost). If it is management’s intent at the time of purchase to hold securities for an indefinite period of time and/or to use such securities as part of its asset/liability management strategy, the securities are classified as available-for-sale and are carried at fair value, with unrealized gains and losses reported as accumulated other comprehensive income/(loss), a separate component of shareholders’ equity, net of tax. Securities classified as available-for-sale include securities that may be sold in response to changes in interest rates, resultant prepayment risk, or other market factors. Securities that are bought and held principally for the purpose of selling them in the near term are classified as trading and are reported at fair value, with changes in fair value included in earnings. The cost of securities sold is determined on a specific identification basis. We held no securities classified as trading at or during the years ended December 31, 2024 and 2023. Fair values are determined as described in Note 16. Throughout the year we validate the prices received from third parties by comparing them to prices provided by a different independent pricing service. We have reviewed the detailed valuation methodologies provided to us by our pricing services.
On a quarterly basis, we measure expected credit losses on held-to-maturity debt securities on a collective basis by major security type and all of our held-to-maturity debt securities are residential mortgage-backed securities. Accrued interest receivable on held-to-maturity debt securities totaled $3 million at both December 31, 2024 and December 31, 2023, respectively, and is excluded from estimated credit losses. All of our residential mortgage-backed securities are issued by U.S. government entities and agencies.
For available-for-sale debt securities in an unrealized loss position, on at least a quarterly basis, we review our investments for impairment. An investment security is deemed impaired if the fair value of the investment is less than its amortized cost. We consider both our intent to sell and the likelihood that we will not have to sell the investment securities before recovery of their amortized cost basis during our evaluation. If we intend to sell the investment security or if it is more likely than not that we will be required to sell the investment security, the entire impairment is recorded in earnings. For available-for-sale debt securities that do not meet this criteria, we evaluate whether the decline in fair value has resulted from credit losses or other factors. In making this assessment we consider the issuer of the securities and their creditworthiness, any changes to the rating of the security and any adverse conditions specifically related to the security, among other factors. Also, we may evaluate the business and financial outlook of the issuer, as well as broader economic performance indicators. If this assessment indicates that a credit loss exists, the present value of cash flows expected to be collected from the security is compared to the amortized cost basis of the security. If the present value of cash flows expected to be collected is less than the amortized cost basis, a credit loss exists and an allowance for credit losses is recorded for the credit loss, limited by the amount that the fair value is less than amortized cost. Any impairment that has not been recorded through an allowance for credit losses is recognized in other comprehensive income.
NORTHWEST BANCSHARES, INC. AND SUBSIDIARIES
NOTES TO CONSOLIDATED FINANCIAL STATEMENTS
December 31, 2024, 2023 and 2022
Changes in the allowance for credit losses are recorded as provision for (or reversal of) credit loss expense. Losses are charged against the allowance when we believe the uncollectibility of an available-for-sale security is confirmed or when there is an intent or requirement to sell the security.
Accrued interest receivable on available-for-sale debt securities totaled $2 million at both December 31, 2024 and December 31, 2023, respectively, and is excluded from the estimate of credit losses.
A debt security is placed on nonaccrual status at the time any principal or interest payments become 90 days past due. The receivable for interest income that is accrued but not collected is reversed against interest income when the debt security is placed on nonaccrual status. No debt securities were on nonaccrual status as of December 31, 2024 and December 31, 2023.
(e) Loans Receivable
Our portfolio segments are based on the class of financing receivable. Additionally, the class of financing receivables are based on several factors including the method for monitoring and assessing credit risk and the risk characteristics of the financing receivables. Based on evaluation of the nature of our financing receivables, along with the nature and extent of exposure to credit risk arising from these receivables, our portfolio segments were determined to be Personal Banking and Commercial Banking loans.
•Personal Banking loans consist of the following classes of financing receivables:
◦Residential mortgage loans - fixed and adjustable rate mortgage loans
◦Home equity loans - first and second mortgage loans and home equity lines of credit
◦Vehicle loans - direct and indirect automobile, motorcycle loans and recreational or power sport vehicles
◦Consumer loans - unsecured lines of credit, credit card loans, and other consumer loans
•Commercial Banking loans consist of the following classes of financing receivables:
◦Commercial real estate - multi-family commercial real estate loans secured by multi-family residences, such as rental properties and loans secured by nonresidential properties such as hotels, commercial offices, medical buildings, manufacturing facilities and retail establishments, excluding owner-occupied loans, and including small business commercial real estate loans
◦Commercial real estate - owner-occupied loans - commercial real estate loans secured by residential or non-residential properties
◦Commercial loans - other commercial loans, including small business commercial loans and equipment finance loans
Loans are reported at amortized cost. Amortized cost is the principal balance outstanding, net of any deferred purchase premiums and discounts, deferred origination fees or costs and the allowance for credit losses. Accrued interest receivable totaled $40 million and $42 million at December 31, 2024 and December 31, 2023, respectively, and was reported in accrued interest receivable on the Consolidated Statements of Financial Condition. Accrued interest receivable is excluded from the amortized cost basis of loans and from the estimate of allowance for credit losses. Interest income on loans is credited to income as earned. Interest earned on loans for which no payments were received during the month is accrued at month end.
Generally, accrued interest on loans more than 90 days delinquent is reversed and such loans are placed on nonaccrual status, except for credit card loans which are not placed in nonaccrual status based on delinquency. All loans are placed on nonaccrual status when principal or interest is 90 days or more delinquent or when there is reasonable doubt that interest or principal will not be collected in accordance with the contractual terms. Interest receipts on all nonaccrual loans are recognized as interest income when it has been determined that all principal and interest will be collected or are applied to principal when collectability of contractual principal is in doubt. Nonaccrual loans generally are restored to an accrual basis when principal and interest become current and a period of performance has been established in accordance with the contractual terms, typically six months.
Occasionally, the Company modifies loans to borrowers in financial distress by providing principal forgiveness, term extensions, an other-than-insignificant payment delay, or interest rate reduction. When principal forgiveness is provided, the amount of forgiveness is charged off against the allowance for credit losses.
Loan delinquency is measured based on the number of days since the payment due date. Past due status is measured using the loan’s contractual maturity date.
NORTHWEST BANCSHARES, INC. AND SUBSIDIARIES
NOTES TO CONSOLIDATED FINANCIAL STATEMENTS
December 31, 2024, 2023 and 2022
Personal Banking loans are charged-off or charged down when they become 180 days delinquent, unless the borrower has filed for bankruptcy. Commercial Banking loans are charged-off or charged down when, in our opinion, they are no longer collectible or when it has been determined that the collateral value no longer supports the carrying value of the loan for loans that are collateral dependent.
Loan fees and certain direct loan origination costs are deferred and the net deferred fee or cost is then recognized using the level-yield method over the contractual life of the loan as an adjustment to interest income.
We identify certain residential mortgage loans, small business administration guaranteed loans and commercial loans which will be sold prior to maturity, as loans held-for-sale. These loans are recorded at fair value less estimated cost to sell. At December 31, 2024 and 2023, there were $76 million and $9 million of loans classified as held-for-sale, respectively.
Acquired loans that are not considered purchased with credit deterioration (“PCD”) are initially measured at fair value with no carryover of the related allowance for credit losses. Determining the fair value of the loans involves estimating the amount and timing of principal and interest cash flows expected to be collected on the loans and discounting those cash flows at a market rate of interest.
Acquired loans may be classified as PCD loans upon acquisition if they have experienced more than insignificant credit deterioration since origination. An allowance for credit losses on day 1 is determined using the same methodology as other loans held for investment. The initial allowance for credit losses determined on a collective basis is allocated to individual loans. The allowance is recognized on day 1 by adding it to the fair value of the loan, which is the “Day 1 amortized cost”. There is no credit loss expense recognized on PCD loans because the initial allowance is established by grossing-up the amortized cost of the PCD loan. The difference between the initial amortized cost basis and the par value of the loan is a noncredit discount or premium, which is amortized into interest income over the life of the loan. Subsequent changes to the allowance for credit losses are recorded through provision expense.
(f) Allowance for Credit Losses and Provision for Credit Losses
The allowance for credit losses is deducted from, or added to, the loan’s amortized cost basis to present the net amount expected to be collected on our lending portfolios. We estimate the allowance balance using relevant available information, from internal and external sources, relating to past events, current conditions and reasonable and supportable forecasts. Loans are charged off against the allowance when we believe that a loan balance is confirmed to be uncollectible. Expected recoveries do not exceed the aggregate of amounts previously charged-off and expected to be charged-off.
Expected credit losses are estimated over the contractual term of the loans, adjusted for prepayments. The contractual term includes extension or renewal option included in the contract that are outside of our control and is not unconditionally cancellable by the Company.
Credit card receivables do not have stated maturities. In determining the estimated life of a credit card receivable, we first estimate the future cash flows expected to be received and then apply those expected future cash flows to the credit card balance.
The allowance for credit losses is measured on a collective (“pool”) basis when similar risk characteristics exist. For the purpose of calculating portfolio-level reserves, we have grouped our loans into seven segments: residential mortgage loans, home equity loans, vehicle loans, consumer loans, commercial real estate loans, commercial real estate owner-occupied and commercial loans. The allowance for credit losses is measured at the pool level utilizing loan-level inputs wherever possible. We use a twenty-four month forecasting period and revert to historical average loss rates thereafter. The reasonable and supportable forecast is based on a probability-weighted multiple macroeconomic forecast approach and obtained from a third party vendor. Reversion to the mean takes place over a twelve-month period. Our loss rate models utilize a linear reversion method. For our probability of default (“PD”)/loss given default (“LGD”) models we revert the PD utilizing exponential reversion, which is an accelerated method, and the LGD utilizing a linear reversion method. Historical average loss rates are calculated using historical data beginning in 2009 through the current period. As part of the analysis as of December 31, 2024, we considered the most recent macroeconomic forecasts available.
Mortgage and Home Equity Loans
The allowance for credit losses within the mortgage and home equity loan pools is calculated using a non-discounted cash flow method through a PD, LGD, and prepayment model developed by an external third-party and adjusted for asset specific characteristics. These classes are further divided into smaller pools of loans with similar risk characteristics such as: lines versus loans, fixed versus variable, senior lien position versus junior lien position, among other things.
NORTHWEST BANCSHARES, INC. AND SUBSIDIARIES
NOTES TO CONSOLIDATED FINANCIAL STATEMENTS
December 31, 2024, 2023 and 2022
For each pool, the models project default rates, prepayment rates, and severity rates. The models accept as inputs key risk drivers such as: current balance, original credit bureau score, original loan-to-value ratio, type of collateral, location of collateral, delinquency status, loan age, among other characteristics. They also utilize macroeconomic forecasts of home price indices, unemployment rates, gross domestic product, and others.
Vehicle Loans
The allowance for credit losses within the vehicle loan pool is calculated using a non-discounted cash flow model through a PD, LGD, and prepayment model developed by an external third-party and adjusted for asset specific risk characteristics. These classes are further divided into smaller pools of loans with similar risk characteristics such as: cars, trucks and powersport vehicles and recreational vehicles. Monthly probabilities of default and prepayments are estimated for each loan, along with estimates of exposure at default and loss given default. The model accepts as inputs key risk drivers such as loan, borrower, and collateral characteristics. It also uses macroeconomic forecasts of used car price indices, gross domestic product, unemployment rates and others.
Consumer Loans
The allowance for credit losses within the consumer loan portfolio is calculated at the portfolio-level using a non-discounted cash flow method through a suite of loss rate models developed internally with the assistance of an external third-party. This class of financing receivables is further divided into credit cards, unsecured lines of credit and other consumer loans.
The allowance for credit losses for credit cards and unsecured lines of credit is calculated using two transition matrix models to project portfolio-level net charge-off rates. Both models use current balance and delinquency status as key risk drivers. These models are not natively sensitive to macroeconomic forecasts. The necessary adjustments to account for current and expected macroeconomic conditions is captured via our qualitative adjustment framework.
For other consumer loans, a regression model is used to project portfolio-level net charge-off rates. This model uses borrower information and macroeconomic forecasts as key inputs.
Commercial Real Estate Loans
The commercial real estate loan class is further segmented into smaller pools of loans with similar risk characteristics, commercial real estate loans and small business commercial real estate loans.
The allowance for credit losses for the commercial real estate loan portfolio is calculated at the pool level using a non-discounted cash flow method through a PD/LGD model developed by an external third-party. This model projects default and severity rates. The model accepts as inputs key risk drivers such as: current balance, original loan-to-value-ratio, type of collateral, location of collateral, delinquency status, loan age, obligor financial statement information, and expected prepayment rates, among other characteristics. It also utilizes macroeconomic forecasts of commercial real estate price indices, unemployment rates, gross domestic product and others.
The allowance for credit losses for commercial real estate small business portfolio is calculated at a borrower-level with a PD/LGD model. Separate models were built by industry segment. Each model was built with a logistic regression model except for the U.S. Small Business Administration (SBA) and Agriculture sub-portfolios. For SBA, a portfolio-level fractional logit model was developed; the small Agriculture segment uses a simple long-run average loss rate. The LGD model is assumption-based and assigns varying LGDs by industry segment. The models’ overall key inputs are borrower and collateral characteristics and macroeconomic forecasts including real GDP, unemployment, home price appreciation, and real disposable personal income.
Commercial Loans and Commercial Real Estate - Owner Occupied Loans
The commercial loan class is further segmented into smaller pools of loans with similar risk characteristics, commercial loans and commercial small business loans, including equipment finance loans.
The allowance for credit losses for the commercial loan portfolio and the commercial real estate - owner occupied loan portfolio is calculated at the pool level using a non-discounted cash flow method through a PD/LGD model developed by an external third-party. The commercial loan portfolio and the commercial real estate owner occupied loan portfolio models project default and severity rates. The model accepts as inputs key risk drivers such as the obligor financial statement information, collateral type, the obligor’s primary
NORTHWEST BANCSHARES, INC. AND SUBSIDIARIES
NOTES TO CONSOLIDATED FINANCIAL STATEMENTS
December 31, 2024, 2023 and 2022
industry, expected prepayment rates, among other characteristics. It also utilizes macroeconomic forecasts of unemployment rates, gross domestic product, corporate bond spreads, and others.
The allowance for credit losses for commercial small business loans is calculated at a borrower-level with a PD/LGD model. Separate models were built by industry segment. Each model was built with a logistic regression model except for the U.S. Small Business Administration (SBA) and Agriculture sub-portfolios. For SBA, a portfolio-level fractional logit model was developed; the small Agriculture segment uses a simple long-run average loss rate. The LGD model is assumption-based and assigns varying LGDs by industry segment. The models’ overall key inputs are borrower and collateral characteristics and macroeconomic forecasts including real GDP, unemployment, home price appreciation, and real disposable personal income.
Loans that do not share risk characteristics are evaluated on an individual basis. Loans evaluated individually are not also included in the collective evaluation. When we determine that foreclosure is probable or when the borrower is experiencing financial difficulty at the reporting date and repayment is expected to be provided substantially through the operation or sale of the collateral, expected credit losses are based on the fair value of the collateral at the reporting date, adjusted for selling costs. If this criteria is not met, a discounted cash flow method is used to determine the allowance for credit losses. All changes in the discounted cash flow method over time are reported in the allowance for credit losses.
The allowance calculation is also supplemented with qualitative reserves that takes into consideration the current portfolio and specific risk characteristics, such as changes in underwriting standards, portfolio mix, delinquency level, or term, as well as changes in environmental conditions, among other factors, that have occurred but are not yet reflected in the quantitative model component.
The modifications to borrowers experiencing financial distress are included in their respective portfolio segment and the current loan balance and updated loan terms are run through their respective allowance models to arrive at the quantitative portion of the allowance for credit losses. Subsequent performance of the loans will be measured by delinquency status and will be captured through our models or our qualitative factor assessment, as deemed appropriate. If we no longer believe the loan demonstrates similar risks to their respective portfolio segment, an individual assessment will be performed. Upon the Company’s determination that a modified loan (or portion of a loan) has subsequently been deemed uncollectible, the loan (or a portion of the loan) is written off. Therefore, the amortized cost basis of the loan is reduced by the uncollectible amount and the allowance for credit losses is adjusted by the same amount.
For off-balance-sheet credit exposures, we estimate expected credit losses over the contractual period in which we are exposed to credit risk via a contractual obligation to extend credit, unless that obligation is unconditionally cancellable. The liability for credit losses on off-balance-sheet credit exposures is adjusted through a provision for credit loss - unfunded commitments expense on the Consolidated Statements of Income. We estimate the liability balance using relevant available information, from internal and external sources, relating to past events, current conditions and reasonable and supportable forecasts. The estimate includes a consideration of the likelihood that funding will occur and an estimate of expected credit losses on commitments expected to be funded over its estimated life. Off-balance-sheet exposures that are not unconditionally cancellable have been identified for the mortgage, home equity, commercial real estate, and commercial loan portfolios.
(g) Real Estate Owned
Real estate owned is comprised of property either acquired through foreclosure or voluntarily conveyed by borrowers. These assets are recorded on the date acquired at the lower of the loan balance or fair value of the collateral, less estimated disposition costs, with the fair value being determined by an appraisal. Any initial write-down is charged to the allowance for credit losses. Subsequently, foreclosed assets are valued at the lower of the amount recorded at acquisition date or the current fair value, less estimated disposition costs. Any subsequent write-down or gains or losses realized from the disposition of such property are credited or charged to noninterest income.
(h) Restricted Investment in FHLB Stock
Federal law requires a member institution of the FHLB system to hold stock of its district FHLB according to a predetermined formula. FHLB stock is carried at cost and evaluated for impairment based on the ultimate recoverability of the par value. FHLB stock can only be purchased, redeemed and transferred at par value. Dividends are reported in interest income in the Consolidated Statements of Income.
NORTHWEST BANCSHARES, INC. AND SUBSIDIARIES
NOTES TO CONSOLIDATED FINANCIAL STATEMENTS
December 31, 2024, 2023 and 2022
(i) Premises and Equipment
Premises and equipment are carried at cost, less accumulated depreciation and amortization. Depreciation is accumulated on a straight-line basis over the estimated useful lives of the related assets. Estimated lives range from three to 39 years. Amortization of leasehold improvements is accumulated on a straight-line basis over the terms of the related leases or the useful lives of the related assets, whichever is shorter.
(j) Goodwill
Goodwill is generated from the premium paid for an acquisition and is allocated to reporting units, which are either our reportable segments or one level below. Reporting units are identified based upon analyzing each individual operating segment. A reporting unit is defined as a distinct, separately identifiable component of an operating segment for which complete, discrete financial information is available that management regularly reviews.
Goodwill is not subject to amortization but is tested for impairment at least annually and possibly more frequently if certain events occur or changes in circumstances arise. In testing goodwill for impairment, we have the option to first assess qualitative factors to determine whether it is more likely than not that the fair value of a reporting unit is less than its carrying value. If, after assessing all events and circumstances, we determine it is not more likely than not that the fair value of a reporting unit is less than its carrying value, then performing the two-step impairment test would be unnecessary. However, if we conclude otherwise, it would then be required to perform the first step of the goodwill impairment test and continue to the second step, if necessary. Step 1 requires the fair value of each reporting unit be compared to its carrying amount, including goodwill. Determining the fair value of a reporting unit requires a high degree of subjective judgment, including developing cash flow projections, selecting appropriate discount rates, identifying relevant market comparables, incorporating general economic and market conditions and selecting an appropriate control premium. We have established June 30 of each year as the date for conducting our annual goodwill impairment assessment. Quarterly, we evaluate if there are any triggering events that would require an update to our previous assessment.
We conducted our annual impairment assessment as of June 30, 2024 by first performing a qualitative assessment of goodwill to determine if it was more likely than not that the fair value was less than the carrying value. In performing a qualitative analysis, factors considered include, but are not limited to, macroeconomic conditions, industry and market conditions and overall financial performance. The results of the qualitative assessment for 2024 indicated that it was not more likely than not that the fair value of the reporting unit was less than the carrying value. Consequently, no additional quantitative impairment test was required and no impairment was recorded in 2024. Future events could cause us to conclude that goodwill has become impaired, which would result in recording an impairment loss. There were no events or changes in circumstance in our operations that would cause us to update the assessment performed as of June 30, 2024 and 2023. Accordingly, we have determined that goodwill is not impaired as of December 31, 2024 and 2023.
(k) Core Deposit and Other Identifiable Intangibles
Through the assistance of an independent third party, we analyze and prepare a core deposit study for all bank acquisitions or other identifiable intangible asset study, such as customer lists, for all non-bank acquisitions. The core deposit study reflects the cumulative present value benefit of acquiring deposits versus an alternative source of funding. The other identifiable intangible asset study reflects the cumulative present value benefit of acquiring the income stream from an existing customer base versus developing new business relationships. Based upon analysis, the amount of the premium related to the core deposits or other identifiable intangibles of the business purchased is calculated along with the estimated life of the intangible. The intangible, which is recorded in other intangible assets, is then amortized to expense on an accelerated basis over an approximate life of typically between seven to eleven years.
(l) Bank-Owned Life Insurance
We own insurance on the lives of a certain group of current and former employees and directors. The policies were purchased to help offset the increase in the costs of various benefit plans, including healthcare, as well as the directors deferred compensation plan. The cash surrender value of these policies is included as an asset on the Consolidated Statements of Financial Condition and any increases in the cash surrender value are recorded as tax-free noninterest income on the Consolidated Statements of Income. In the event of the death of an insured individual covered by these policies, after distribution to the insured’s beneficiaries, if any, we receive a tax-free death benefit, which is recorded as noninterest income.
NORTHWEST BANCSHARES, INC. AND SUBSIDIARIES
NOTES TO CONSOLIDATED FINANCIAL STATEMENTS
December 31, 2024, 2023 and 2022
(m) Deposits
Interest on deposits is accrued and charged to expense monthly and is paid or credited in accordance with the terms of the accounts.
(n) Revenue Recognition
Revenue that is not associated with our financial assets and financial liabilities is recognized when performance obligations under the terms of a contract with our customers are satisfied. Revenue is measured as the amount of consideration we expect to receive in exchange for transferring goods or providing services. The majority of our revenue continues to be recognized at the point in time when the services are provided to our customers.
(o) Pension Plans
We maintain multiple noncontributory defined benefit pension plans (“Pension Plan”) for certain of our employees. The net periodic pension cost has been calculated using service cost, interest cost, expected returns on plan assets and net amortization. The other components of the net periodic benefit cost are included in other expense on the Consolidated Statement of Income and are reported separately from the service costs.
Pension expense and obligations depend on assumptions used in calculating such amounts. These assumptions include discount rates, anticipated salary increases, interest costs, expected return on plan assets, mortality rates, and other factors. In determining the projected benefit obligations for pension benefits at December 31, 2024 and 2023, we used a discount rate of 5.44% and 4.79%, respectively. We use the FTSE (previously Citigroup) Pension Liability Index rates matching the duration of our benefit payments as of the measurement date, December 31, to determine the discount rate.
(p) Income Taxes
We join with our wholly owned subsidiaries in filing a consolidated federal income tax return. In accordance with an intercompany tax allocation agreement, the applicable federal income tax expense or benefit is allocated to each subsidiary based upon taxable income or loss calculated on a separate company basis. Each subsidiary is responsible for payment of its own federal income tax liability or receives reimbursement of federal income tax benefit. In addition, deferred taxes are calculated and maintained on a separate company basis.
We account for income taxes under the asset and liability method. The objective of the asset and liability method is to establish deferred tax assets and liabilities for temporary differences between the financial reporting and tax basis of our assets and liabilities based on the tax rates expected to be in effect when such amounts are realized or settled. The effect on deferred tax assets and liabilities with regard to a change in tax rates is recognized in the tax provision in the period the change is enacted. If current available information raises doubt as to the realization of the deferred tax assets, a valuation allowance is established.
(q) Stock-Based Compensation
Stock-based compensation expense is recognized based on the grant-date fair value of stock-based awards that are expected to vest over the requisite service period. All awards, both those with cliff vesting and graded vesting, are expensed on a straight-line basis over the requisite service period. As compensation expense is recognized, a deferred tax asset is recorded that represents an estimate of the future tax deduction from exercise or release of restrictions. At the time awards are exercised, cancelled, expire or restrictions are released, the we recognize an adjustment to income tax expense for the difference between the previously estimated tax deduction and the actual tax deduction realized. We account for forfeitures as they occur. For additional information regarding grants of stock options and common shares, see Note 15.
(r) Derivative Financial Instruments
We recognize all derivative financial instruments as either assets or liabilities in the balance sheet and measure those instruments at fair value. The accounting for changes in the fair value of a derivative depends on the intended use of the derivative and the resulting designation. To qualify for hedge accounting rules, a hedging relationship must be highly effective in offsetting the risk designation as being hedge. The hedging relationship must be formally documented at inception and assess the hedging relationship at least on a quarterly basis to ensure the hedging instrument continues to be highly effective over the life of the hedging relationship. Those methods must be consistent with our approach to managing risk.
NORTHWEST BANCSHARES, INC. AND SUBSIDIARIES
NOTES TO CONSOLIDATED FINANCIAL STATEMENTS
December 31, 2024, 2023 and 2022
At times, we utilize interest rate swap agreements as part of the management of interest rate risk to hedge the interest rate risk on floating rate borrowings. Amounts receivable or payable are recognized as accrued under the terms of the agreements and the differential is recorded as an adjustment to interest expense. The interest rate swaps are designated as cash flow hedges, with the derivative’s unrealized gain or loss recorded as a component of other comprehensive income which is subsequently reclassified into earnings in the period that the hedged forecasted transaction affects earnings. A hedging relationship that is determined to not be highly effective no longer qualifies for hedge accounting and must be de-designated. Any gain or loss is recognized immediately in earnings.
We act as an interest rate or foreign exchange swap counterparty for certain commercial borrowers in the normal course of servicing our customers, which are accounted for at fair value. We manage our exposure to such interest rate or foreign exchange swaps by entering into corresponding and offsetting interest rate swaps with third parties that mirror the terms of the swaps we have with the commercial borrowers. These positions (referred to as “customer swaps”) directly offset each other and our exposure is the fair value of the derivatives due to changes in credit risk of our commercial borrowers and third parties. Customer swaps are recorded within other assets or other liabilities on the consolidated statement of financial condition at their estimated fair value. Changes to the fair value of assets and liabilities arising from these derivatives are included, net, in other operating income in the Consolidated Statement of Income.
We offset the fair value amounts recognized for derivative instruments and the fair value for the right to reclaim cash collateral or the obligation to return cash collateral arising from derivative instruments recognized at fair value executed with the same counterparty under a master netting arrangement.
(s) Off-Balance-Sheet Instruments
In the normal course of business, we extend credit in the form of loan commitments, undisbursed lines of credit, and standby letters of credit. These off-balance-sheet instruments involve, to various degrees, elements of credit and interest rate risk not reported in the Consolidated Statements of Financial Condition. We utilize the same underwriting standards for these instruments as other extensions of credit.
(t) Leases
At inception, the Company determines if an arrangement contains a lease and whether that lease meets the classification of a finance or operating lease. Operating lease right of use (“ROU”) assets represent our right to use an underlying asset during the lease term and operating lease liabilities represent our obligation to make lease payments arising from the lease. ROU assets and operating lease liabilities are recognized at lease commencement based on the present value of the remaining lease payments. ROU assets are further adjusted for lease incentives and initial direct costs.
The Company has operating leases for certain branch and office facilities or land with lease terms up to 35 years. These leases generally contain renewal options for periods ranging from one to ten years. These options are included in the lease term when it is reasonably certain that the options will be exercised.
Some of the Company’s lease arrangements contain lease components (e.g., minimum rent payments) and non-lease components (e.g., common area maintenance, taxes, etc.). For all leases, the Company elected the option of not separating lease and non-lease components and instead we account for them as a single lease component.
Certain lease agreements include rental payments that are adjusted periodically for an index or rate. The leases are initially measured using the projected adjustment for the index or rate in effect at the commencement date. The Company’s lease agreements do not contain any material residual value guarantees or material restrictive covenants.
Generally, the Company cannot practically determine the interest rate implicit in the lease. Therefore, the Company uses its incremental borrowing rate as the discount rate for the lease. The Company’s incremental borrowing rate for a lease is the rate of interest it would have to pay on a collateralized basis to borrow an amount equal to the lease payments under similar terms.
(u) Use of Estimates
The preparation of financial statements, in conformity with accounting principles generally accepted in the United States of America, requires management to make estimates and assumptions that affect the reported amounts of assets and liabilities, disclosure of
NORTHWEST BANCSHARES, INC. AND SUBSIDIARIES
NOTES TO CONSOLIDATED FINANCIAL STATEMENTS
December 31, 2024, 2023 and 2022
contingent assets and liabilities at the date of the financial statements, and the reported amount of revenues and expenses during the reporting period. The estimate and assumptions that we deem important to our financial statements relate to the allowance for credit losses. This estimate and assumptions are based on management’s best estimates and judgment and we evaluate them using historical experience and other factors, including the current economic environment. We adjust our estimates and assumptions when facts and circumstances dictate. As future events cannot be determined, actual results could differ significantly from our estimates.
(v) Reclassification of Prior Years’ Statements
Certain items previously reported have been reclassified to conform with the current year’s reporting format. These reclassifications had no effect on the reported results of operations.
(2) Recently Adopted Accounting Standards
In March 2023, the Financial Accounting Standards Board (“FASB”) issued Accounting Standards Update (“ASU”) No. 2023-02, “Investments—Equity Method and Joint Ventures (Topic 323): Accounting for Investments in Tax Credit Structures Using the Proportional Amortization Method.” This ASU allows reporting entities to elect to account for qualifying tax equity investments using the proportional amortization method, regardless of the program giving rise to the related income tax credits. Entities must make an accounting policy election to apply the proportional amortization method on a tax credit-program-by-tax-credit-program basis. The ASU’s amendments also remove the specialized guidance for low-income-housing tax credit (“LIHTC”) investments that are not accounted for using the proportional amortization method and instead require that those LIHTC investments be accounted for using the guidance in other accounting standards. This guidance is effective for fiscal years beginning after December 15, 2023, with early adoption permitted. This ASU is applied on a modified retrospective or retrospective basis with the amendments to remove the specialized guidance for LIHTCs also being able to be applied on a prospective basis. This guidance was adopted on January 1, 2024 and did not have a material impact to the Company’s financial statements.
In November 2023, the FASB issued ASU 2023-07, “Segment Reporting (Topic 280): Improvements to Reportable Segment Disclosures” to improve disclosure requirements, primarily through enhanced disclosures about significant segment expenses. This update requires that an entity that has a single reportable segment, such as the Company, to provide all the disclosures required by this update. The amendments in this update require annual and interim disclosures on significant segment expenses that are regularly provided to the chief operating decision maker to make operating decisions and to allocate resources. The amendments in this update are effective for fiscal years beginning after December 15, 2023, and interim periods within fiscal years beginning after December 15, 2024. A public entity should apply the amendments in this update retrospectively to all prior periods presented in the consolidated financial statements with early adoption permitted. This guidance was adopted for the year ended December 31, 2024 and did not have a material impact on the Company’s financial statements.
(3) Leases
Lease expense for these leases is recognized on a straight-line basis over the lease term, with variable lease payments recognized in the period those payments are incurred. The components of lease cost recognized within our Consolidated Statements of Income were as follows:
| | | | | | | | | | | | | | | | | | | | |
| | | For the years ended December 31, |
| | 2024 | | 2023 | | 2022 |
| Operating lease costs (office operations) | | $ | 6,902 | | | 6,529 | | 6,201 |
| Variable lease costs (office operations) | | 716 | | | 863 | | 677 |
| Total operating lease costs | | $ | 7,618 | | | 7,392 | | 6,878 |
Amounts reported in the Consolidated Statements of Financial Condition were as follows: | | | | | | | | | | | | | | |
| | For the years ended December 31, |
| | 2024 | | 2023 |
| Operating leases: | | | | |
| Operating lease ROU assets (other assets) | | $ | 46,204 | | | 61,727 |
| Operating lease liabilities (other liabilities) | | 49,973 | | | 64,723 | |
NORTHWEST BANCSHARES, INC. AND SUBSIDIARIES
NOTES TO CONSOLIDATED FINANCIAL STATEMENTS
December 31, 2024, 2023 and 2022
Other information related to leases were as follows: | | | | | | | | | | | | | | |
| | For the years ended December 31, |
| | 2024 | | 2023 |
| Supplemental cash flow information | | | | |
| Cash paid for amounts included in the measurement of lease liabilities: | | | | |
| Operating cash flow from operating leases | | $ | 6,182 | | | 5,941 |
| ROU assets obtained in exchange for lease obligations | | 1,002 | | 13,736 |
| Weighted average remaining lease term | | 12.9 years | | 16.6 years |
| Weighted average discount rate | | 4.6 | % | | 4.2 | % |
Amounts disclosed for ROU assets obtained in exchange for lease obligations include amounts added to the carrying amount of ROU assets resulting from lease modifications and reassessments.
Maturities of lease liabilities by fiscal year for our operating leases are as follows: | | | | | | | | |
| | As of December 31, 2024 |
| 2025 | | $ | 5,514 | |
| 2026 | | 5,458 | |
| 2027 | | 5,234 | |
| 2028 | | 5,143 | |
| 2029 | | 4,554 | |
| Thereafter | | 42,703 | |
| Total lease payments | | 68,606 | |
| Less amount of lease payments representing interest | | 18,633 | |
| Total present value of lease payments | | $ | 49,973 | |
Rental expense for the years ended December 31, 2024, 2023 and 2022 was $8 million, $7 million and $7 million, respectively.
NORTHWEST BANCSHARES, INC. AND SUBSIDIARIES
NOTES TO CONSOLIDATED FINANCIAL STATEMENTS
December 31, 2024, 2023 and 2022
(4) Marketable Securities
Marketable securities available-for-sale at December 31, 2024 are as follows: | | | | | | | | | | | | | | | | | | | | | | | |
| Amortized cost | | Gross unrealized
holding gains | | Gross unrealized
holding losses | | Fair value |
| Debt issued by the U.S. government and agencies: | | | | | | | |
| | | | | | | |
| Due after ten years | $ | 45,289 | | | — | | | (9,898) | | | 35,391 | |
| | | | | | | |
| Debt issued by government-sponsored enterprises: | | | | | | | |
| | | | | | | |
| Due after one year through five years | 122 | | | — | | | (4) | | | 118 | |
| | | | | | | |
| | | | | | | |
| | | | | | | |
| | | | | | | |
| | | | | | | |
| Municipal securities: | | | | | | | |
| | | | | | | |
| Due after one year through five years | 888 | | | 10 | | | (2) | | | 896 | |
| Due after five years through ten years | 16,662 | | | 4 | | | (1,756) | | | 14,910 | |
| Due after ten years | 51,257 | | | 4 | | | (8,440) | | | 42,821 | |
| | | | | | | |
| Corporate debt issues: | | | | | | | |
| Due after one year through five years | 5,485 | | | — | | | (78) | | | 5,407 | |
| Due after five years through ten years | 19,944 | | | 815 | | | (65) | | | 20,694 | |
| | | | | | | |
| Residential mortgage-backed securities: | | | | | | | |
| Fixed rate pass-through | 237,892 | | | 106 | | | (17,581) | | | 220,417 | |
| Variable rate pass-through | 3,738 | | | 54 | | | (3) | | | 3,789 | |
| | | | | | | |
| Fixed rate agency CMOs | 852,648 | | | 174 | | | (132,989) | | | 719,833 | |
| Variable rate agency CMOs | 44,740 | | | 30 | | | (102) | | | 44,668 | |
| Total residential mortgage-backed securities | 1,139,018 | | | 364 | | | (150,675) | | | 988,707 | |
| Total marketable securities available-for-sale | $ | 1,278,665 | | | 1,197 | | | (170,918) | | | 1,108,944 | |
Marketable securities held-to-maturity at December 31, 2024 are as follows: | | | | | | | | | | | | | | | | | | | | | | | |
| Amortized cost | | Gross unrealized
holding gains | | Gross unrealized
holding losses | | Fair value |
| Debt issued by government-sponsored enterprises: | | | | | | | |
| Due after one year through five years | $ | 124,462 | | | — | | | (14,464) | | | 109,998 | |
| | | | | | | |
| | | | | | | |
| Residential mortgage-backed securities: | | | | | | | |
| Fixed rate pass-through | 132,816 | | | — | | | (20,181) | | | 112,635 | |
| Variable rate pass-through | 364 | | | 1 | | | — | | | 365 | |
| Fixed rate agency CMOs | 492,415 | | | — | | | (77,989) | | | 414,426 | |
| Variable rate agency CMOs | 529 | | | — | | | (5) | | | 524 | |
| Total residential mortgage-backed securities | 626,124 | | | 1 | | | (98,175) | | | 527,950 | |
| Total marketable securities held-to-maturity | $ | 750,586 | | | 1 | | | (112,639) | | | 637,948 | |
NORTHWEST BANCSHARES, INC. AND SUBSIDIARIES
NOTES TO CONSOLIDATED FINANCIAL STATEMENTS
December 31, 2024, 2023 and 2022
Marketable securities available-for-sale at December 31, 2023 are as follows: | | | | | | | | | | | | | | | | | | | | | | | | | | | | | |
| Amortized cost | | Gross unrealized
holding gains | | Gross unrealized
holding losses | | Fair value | | |
| Debt issued by the U.S. government and agencies: | | | | | | | | | |
| Due after one year through five years | $ | 20,000 | | | — | | | (1,135) | | | 18,865 | | | |
| Due after ten years | 49,383 | | | — | | | (9,934) | | | 39,449 | | | |
| | | | | | | | | |
| Debt issued by government-sponsored enterprises: | | | | | | | | | |
| | | | | | | | | |
| Due after one year through five years | 45,986 | | | — | | | (5,763) | | | 40,223 | | | |
| Due after five years through ten years | 386 | | | — | | | (12) | | | 374 | | | |
| | | | | | | | | |
| | | | | | | | | |
| | | | | | | | | |
| | | | | | | | | |
| Municipal securities: | | | | | | | | | |
| | | | | | | | | |
| Due after one year through five years | 4,279 | | | 22 | | | (427) | | | 3,874 | | | |
| Due after five years through ten years | 20,725 | | | — | | | (1,437) | | | 19,288 | | | |
| Due after ten years | 60,762 | | | 125 | | | (8,580) | | | 52,307 | | | |
| | | | | | | | | |
| Corporate debt issues: | | | | | | | | | |
| Due after five years through ten years | 8,466 | | | — | | | (778) | | | 7,688 | | | |
| | | | | | | | | |
| Residential mortgage-backed securities: | | | | | | | | | |
| Fixed rate pass-through | 209,069 | | | 27 | | | (25,222) | | | 183,874 | | | |
| Variable rate pass-through | 7,140 | | | 11 | | | (71) | | | 7,080 | | | |
| | | | | | | | | |
| Fixed rate agency CMOs | 789,842 | | | — | | | (143,055) | | | 646,787 | | | |
| Variable rate agency CMOs | 23,965 | | | 38 | | | (453) | | | 23,550 | | | |
| Total residential mortgage-backed securities | 1,030,016 | | | 76 | | | (168,801) | | | 861,291 | | | |
| Total marketable securities available-for-sale | $ | 1,240,003 | | | 223 | | | (196,867) | | | 1,043,359 | | | |
Marketable securities held-to-maturity at December 31, 2023 are as follows: | | | | | | | | | | | | | | | | | | | | | | | |
| Amortized cost | | Gross unrealized
holding gains | | Gross unrealized
holding losses | | Fair value |
| Debt issued by the U.S. government and agencies: | | | | | | | |
| Due after one year through five years | $ | 69,471 | | | — | | | (8,100) | | | 61,371 | |
| Due after five years through ten years | 54,987 | | | — | | | (8,700) | | | 46,287 | |
| | | | | | | |
| Residential mortgage-backed securities: | | | | | | | |
| Fixed rate pass-through | 147,874 | | | — | | | (20,834) | | | 127,040 | |
| Variable rate pass-through | 449 | | | 1 | | | — | | | 450 | |
| Fixed rate agency CMOs | 541,529 | | | — | | | (77,694) | | | 463,835 | |
| Variable rate agency CMOs | 529 | | | — | | | (6) | | | 523 | |
| Total residential mortgage-backed securities | 690,381 | | | 1 | | | (98,534) | | | 591,848 | |
| Total marketable securities held-to-maturity | $ | 814,839 | | | 1 | | | (115,334) | | | 699,506 | |
The following table shows the contractual maturity of our residential mortgage-backed securities available-for-sale at December 31, 2024:
| | | | | | | | | | | |
| Amortized cost | | Fair value |
| Residential mortgage-backed securities: | | | |
| Due within one year | $ | 88 | | | 89 | |
| Due after one year through five years | 10,495 | | | 10,419 | |
| Due after five years through ten years | 8,508 | | | 7,591 | |
| Due after ten years | 1,119,927 | | | 970,608 | |
| Total residential mortgage-backed securities | $ | 1,139,018 | | | 988,707 | |
NORTHWEST BANCSHARES, INC. AND SUBSIDIARIES
NOTES TO CONSOLIDATED FINANCIAL STATEMENTS
December 31, 2024, 2023 and 2022
The following table shows the contractual maturity of our residential mortgage-backed securities held-to-maturity at December 31, 2024:
| | | | | | | | | | | |
| Amortized cost | | Fair value |
| Residential mortgage-backed securities: | | | |
| Due within one year | $ | 24 | | | 24 | |
| Due after one year through five years | 19,957 | | | 18,020 | |
| Due after five years through ten years | 20,184 | | | 16,510 | |
| Due after ten years | 585,959 | | | 493,396 | |
| Total residential mortgage-backed securities | $ | 626,124 | | | 527,950 | |
The following table presents information regarding the issuers and the carrying values of our residential mortgage-backed securities at December 31, 2024 and 2023:
| | | | | | | | | | | |
| | December 31, |
| | 2024 | | 2023 |
| Residential mortgage-backed securities: | | | |
| FNMA | $ | 443,354 | | | 568,160 | |
| GNMA | 668,668 | | | 407,441 | |
| FHLMC | 502,805 | | | 576,066 | |
| | | |
| Other (including non-agency) | 4 | | | 5 | |
| Total residential mortgage-backed securities | $ | 1,614,831 | | | 1,551,672 | |
Marketable securities having a carrying value of $615 million at December 31, 2024 were pledged under collateral agreements. During the year ended December 31, 2024, we sold marketable securities classified as available-for-sale for $276 million, with gross realized losses of $39 million. During the year ended December 31, 2023, we sold marketable securities classified as available-for-sale for $101 million, with gross realized gains of $9,000 and gross realized losses of $8 million. During the year ended December 31, 2022, there were no sales of marketable securities classified as available-for-sale. During the years ended December 31, 2024, 2023, and 2022, we did not recognize an allowance for credit losses in our investment portfolio.
The following table shows the fair value and gross unrealized losses on available for sale investment securities and held to maturity investment securities, for which an allowance for credit losses has not been recorded, aggregated by investment category and length of time that the individual securities have been in a continuous unrealized loss position at December 31, 2024:
| | | | | | | | | | | | | | | | | | | | | | | | | | | | | | | | | | | |
| | Less than 12 months | | 12 months or more | | Total |
| | Fair value | | Unrealized
loss | | Fair value | | Unrealized
loss | | Fair value | | Unrealized
loss |
| U.S. government-sponsored enterprises | $ | — | | | — | | | 145,507 | | | (24,366) | | | 145,507 | | | (24,366) | |
| Corporate debt issues | — | | | — | | | 8,335 | | | (143) | | | 8,335 | | | (143) | |
| | | | | | | | | | | |
| Municipal securities | 15,407 | | | (186) | | | 39,296 | | | (10,012) | | | 54,703 | | | (10,198) | |
| Residential mortgage-backed securities - agency | 297,828 | | | (3,578) | | | 1,117,280 | | | (245,272) | | | 1,415,108 | | | (248,850) | |
| | | | | | | | | | | |
| Total temporarily impaired securities | $ | 313,235 | | | (3,764) | | | 1,310,418 | | | (279,793) | | | 1,623,653 | | | (283,557) | |
The following table shows the fair value and gross unrealized losses on available for sale investment securities and held to maturity investment securities, for which an allowance for credit losses has not been recorded, aggregated by investment category and length of time that the individual securities have been in a continuous unrealized loss position at December 31, 2023:
| | | | | | | | | | | | | | | | | | | | | | | | | | | | | | | | | | | |
| | Less than 12 months | | 12 months or more | | Total |
| | Fair value | | Unrealized
loss | | Fair value | | Unrealized
loss | | Fair value | | Unrealized
loss |
| U.S. government-sponsored enterprises | $ | — | | | — | | | 206,569 | | | (33,644) | | | 206,569 | | | (33,644) | |
| Corporate debt issues | — | | | — | | | 7,688 | | | (778) | | | 7,688 | | | (778) | |
| | | | | | | | | | | |
| Municipal securities | 2,753 | | | (81) | | | 66,046 | | | (10,363) | | | 68,799 | | | (10,444) | |
| Residential mortgage-backed securities - agency | 17,976 | | | (242) | | | 1,423,707 | | | (267,093) | | | 1,441,683 | | | (267,335) | |
| | | | | | | | | | | |
| Total temporarily impaired securities | $ | 20,729 | | | (323) | | | 1,704,010 | | | (311,878) | | | 1,724,739 | | | (312,201) | |
NORTHWEST BANCSHARES, INC. AND SUBSIDIARIES
NOTES TO CONSOLIDATED FINANCIAL STATEMENTS
December 31, 2024, 2023 and 2022
The Company does not believe that the available-for-sale debt securities that were in an unrealized loss position as of December 31, 2024, which were comprised of 288 individual securities, represents a credit loss impairment. All of these securities were issued by U.S. government agencies, U.S. government-sponsored enterprises, local municipalities, or represent corporate debt. The securities issued by the U.S. government agencies or U.S. government-sponsored enterprises are either explicitly or implicitly guaranteed by the U.S. government, are highly rated by major rating agencies and have a long history of no credit losses. The corporate debt issues and securities issued by local municipalities were all highly rated by major rating agencies and have no history of credit losses. The unrealized losses were primarily attributable to changes in the interest rate environment and not due to the credit quality of these investment securities. The Company does not have the intent to sell these investment securities and it is likely that we will not be required to sell these securities before their anticipated recovery, which may be at maturity.
All of the Company’s held-to-maturity debt securities are issued by U.S. government-sponsored agencies or U.S. government-sponsored enterprises. These securities are either explicitly or implicitly guaranteed by the U.S. government, are highly rated by major rating agencies and have a long history of no credit losses. The decline in fair value of the held-to-maturity debt securities were primarily attributable to changes in the interest rate environment and not due to the credit quality of these investment securities, therefore, the Company did not record an allowance for credit losses for these securities as of December 31, 2024.
The following table presents the credit quality for our held-to-maturity securities, based on the latest information available as of December 31, 2024 (in thousands). The credit ratings are sourced from nationally recognized rating agencies, which include Moody’s and S&P, they are presented based on asset type. All of our held-to-maturity securities were current in their payment of principal and interest as of December 31, 2024.
| | | | | | | | | | | |
| AA+ | | Total |
| Held-to-maturity securities: | | | |
| Debt issued by the U.S. government-sponsored agencies | $ | 124,462 | | | 124,462 | |
| Residential mortgage-backed securities | 626,124 | | | 626,124 | |
| Total marketable securities held-to-maturity | $ | 750,586 | | | 750,586 | |
(5) Loans Receivable
The following tables excludes loans held for sale. The following table shows a summary of our loans receivable at amortized cost basis at December 31, 2024 and December 31, 2023 (in thousands):
| | | | | | | | | | | | | | | | | | | | | | | | | | | | | | | | | | | |
| December 31, 2024 | | December 31, 2023 |
| | Originated (1) | | Acquired (2) | | Total | | Originated (1) | | Acquired (2) | | Total |
| Personal Banking: | | | | | | | | | | | |
| | | | | | | | | | | |
| Residential mortgage loans | $ | 3,157,895 | | | 20,374 | | | 3,178,269 | | | $ | 3,274,531 | | | 144,886 | | | 3,419,417 | |
| Home equity loans | 1,051,950 | | | 97,446 | | | 1,149,396 | | | 1,103,410 | | | 124,448 | | | 1,227,858 | |
| Vehicle loans | 1,823,780 | | | 47,063 | | | 1,870,843 | | | 1,943,540 | | | 65,061 | | | 2,008,601 | |
| Consumer loans | 96,906 | | | 27,336 | | | 124,242 | | | 111,446 | | | 5,980 | | | 117,426 | |
| Total Personal Banking | 6,130,531 | | | 192,219 | | | 6,322,750 | | | 6,432,927 | | | 340,375 | | | 6,773,302 | |
| | | | | | | | | | | |
| Commercial Banking: | | | | | | | | | | | |
| Commercial real estate loans | 2,311,562 | | | 184,164 | | | 2,495,726 | | | 2,389,537 | | | 238,920 | | | 2,628,457 | |
| Commercial real estate loans - owner occupied | 229,448 | | | 124,688 | | | 354,136 | | | 319,195 | | | 26,358 | | | 345,553 | |
| Commercial loans | 2,002,625 | | | 4,777 | | | 2,007,402 | | | 1,623,481 | | | 35,248 | | | 1,658,729 | |
| Total Commercial Banking | 4,543,635 | | | 313,629 | | | 4,857,264 | | | 4,332,213 | | | 300,526 | | | 4,632,739 | |
| Total loans receivable, gross | 10,674,166 | | | 505,848 | | | 11,180,014 | | | 10,765,140 | | | 640,901 | | | 11,406,041 | |
| | | | | | | | | | | |
| Allowance for credit losses | (112,427) | | | (4,392) | | | (116,819) | | | (118,079) | | | (7,164) | | | (125,243) | |
| Total loans receivable, net (3) | $ | 10,561,739 | | | 501,456 | | | 11,063,195 | | | $ | 10,647,061 | | | 633,737 | | | 11,280,798 | |
(1)Includes originated and purchased loan pools purchased in an asset acquisition.
(2)Includes loans subject to purchase accounting in a business combination.
(3)Includes $60 million and $68 million of net unearned income, unamortized premiums and discounts and deferred fees and costs at December 31, 2024 and December 31, 2023, respectively.
NORTHWEST BANCSHARES, INC. AND SUBSIDIARIES
NOTES TO CONSOLIDATED FINANCIAL STATEMENTS
December 31, 2024, 2023 and 2022
As of December 31, 2024 and 2023, we serviced loans for others approximating $244 million and $231 million, respectively. These loans serviced for others are not our assets and are not included in our financial statements.
As of December 31, 2024 and 2023, approximately 36% and 38% of our loan portfolio was secured by properties located in Pennsylvania. We do not believe we have significant concentrations of credit risk to any one group of borrowers given our underwriting and collateral requirements.
Loans receivable as of December 31, 2024 and 2023 include $4.3 billion and $4.0 billion, respectively, of adjustable rate loans and $6.9 billion and $7.3 billion, respectively, of fixed rate loans.
The following table provides information related to the allowance for credit losses by portfolio segment and by class of financing receivable for the year ended December 31, 2024 (in thousands):
| | | | | | | | | | | | | | | | | | | | | | | | | | | | | | | |
| Balance as of December 31, 2024 | | Current
period provision | | Charge-offs | | Recoveries | | | | Balance as of December 31, 2023 |
| Allowance for Credit Losses | | | | | | | | | | | |
| Personal Banking: | | | | | | | | | | | |
| Residential mortgage loans | $ | 14,347 | | | (4,473) | | | (845) | | | 1,472 | | | | | 18,193 | |
| Home equity loans | 4,845 | | | 51 | | | (1,736) | | | 1,127 | | | | | 5,403 | |
| Vehicle loans | 22,389 | | | 2,509 | | | (8,809) | | | 1,778 | | | | | 26,911 | |
| Consumer loans | 1,883 | | | 5,022 | | | (5,929) | | | 1,591 | | | | | 1,199 | |
| Total Personal Banking | 43,464 | | | 3,109 | | | (17,319) | | | 5,968 | | | | | 51,706 | |
| | | | | | | | | | | |
| Commercial Banking: | | | | | | | | | | | |
| Commercial real estate loans | 44,328 | | | 4,902 | | | (15,321) | | | 3,480 | | | | | 51,267 | |
Commercial real estate loans -
owner occupied | 3,882 | | | 69 | | | — | | | 38 | | | | | 3,775 | |
| Commercial loans | 25,145 | | | 19,599 | | | (14,462) | | | 1,513 | | | | | 18,495 | |
| Total Commercial Banking | 73,355 | | | 24,570 | | | (29,783) | | | 5,031 | | | | | 73,537 | |
| Total | $ | 116,819 | | | 27,679 | | | (47,102) | | | 10,999 | | | | | 125,243 | |
| | | | | | | | | | | |
Allowance for Credit Losses -
off-balance-sheet exposure | | | | | | | | | | | |
| Personal Banking: | | | | | | | | | | | |
| | | | | | | | | | | |
| Residential mortgage loans | $ | — | | | (2) | | | — | | | — | | | | | 2 | |
| Home equity loans | 62 | | | (3) | | | — | | | — | | | | | 65 | |
| | | | | | | | | | | |
| Total Personal Banking | 62 | | | (5) | | | — | | | — | | | | | 67 | |
| | | | | | | | | | | |
| Commercial Banking: | | | | | | | | | | | |
| Commercial real estate loans | 4,154 | | | (1,993) | | | — | | | — | | | | | 6,147 | |
Commercial real estate loans -
owner occupied | 160 | | | (13) | | | — | | | — | | | | | 173 | |
| Commercial loans | 9,573 | | | (1,163) | | | — | | | — | | | | | 10,736 | |
| Total Commercial Banking | 13,887 | | | (3,169) | | | — | | | — | | | | | 17,056 | |
| Total off-balance-sheet exposure | $ | 13,949 | | | (3,174) | | | — | | | — | | | | | 17,123 | |
During the year ended December 31, 2024, we sold $24 million of loans that were classified as held-for-investment, for a loss of $5 million, which is reported in provision for credit losses in the Consolidated Statements of Income.
NORTHWEST BANCSHARES, INC. AND SUBSIDIARIES
NOTES TO CONSOLIDATED FINANCIAL STATEMENTS
December 31, 2024, 2023 and 2022
The following table provides information related to the allowance for credit losses by portfolio segment and by class of financing receivable for the year ended December 31, 2023 (in thousands):
| | | | | | | | | | | | | | | | | | | | | | | | | | | | | | | | | | | |
| Balance as of December 31, 2023 | | Current
period provision | | Charge-offs | | Recoveries | | ASU 2022-02 Adoption | | Balance as of December 31, 2022 |
| Allowance for Credit Losses | | | | | | | | | | | |
| Personal Banking: | | | | | | | | | | | |
| Residential mortgage loans | $ | 18,193 | | | (1,515) | | | (1,189) | | | 1,636 | | | — | | | 19,261 | |
| Home equity loans | 5,403 | | | (356) | | | (852) | | | 709 | | | — | | | 5,902 | |
| Vehicle loans | 26,911 | | | 8,299 | | | (6,468) | | | 2,021 | | | — | | | 23,059 | |
| Consumer loans | 1,199 | | | 5,311 | | | (5,983) | | | 1,206 | | | — | | | 665 | |
| Total Personal Banking | 51,706 | | | 11,739 | | | (14,492) | | | 5,572 | | | — | | | 48,887 | |
| | | | | | | | | | | |
| Commercial Banking: | | | | | | | | | | | |
| Commercial real estate loans | 51,267 | | | 6,604 | | | (2,298) | | | 2,029 | | | 426 | | | 44,506 | |
| Commercial real estate loans - owner occupied | 3,775 | | | (227) | | | (68) | | | 66 | | | — | | | 4,004 | |
| Commercial loans | 18,495 | | | 548 | | | (4,166) | | | 1,474 | | | — | | | 20,639 | |
| Total Commercial Banking | 73,537 | | | 6,925 | | | (6,532) | | | 3,569 | | | 426 | | | 69,149 | |
| Total | $ | 125,243 | | | 18,664 | | | (21,024) | | | 9,141 | | | 426 | | | 118,036 | |
| | | | | | | | | | | |
Allowance for Credit Losses -
off-balance-sheet exposure | | | | | | | | | | | |
| Personal Banking: | | | | | | | | | | | |
| | | | | | | | | | | |
| Residential mortgage loans | $ | 2 | | | (2) | | | — | | | — | | | — | | | 4 | |
| Home equity loans | 65 | | | (9) | | | — | | | — | | | — | | | 74 | |
| | | | | | | | | | | |
| Total Personal Banking | 67 | | | (11) | | | — | | | — | | | — | | | 78 | |
| | | | | | | | | | | |
| Commercial Banking: | | | | | | | | | | | |
| Commercial real estate loans | 6,147 | | | 772 | | | — | | | — | | | — | | | 5,375 | |
| Commercial real estate loans - owner occupied | 173 | | | (206) | | | — | | | — | | | — | | | 379 | |
| Commercial loans | 10,736 | | | 3,655 | | | — | | | — | | | — | | | 7,081 | |
| Total Commercial Banking | 17,056 | | | 4,221 | | | — | | | — | | | — | | | 12,835 | |
| Total off-balance-sheet exposure | $ | 17,123 | | | 4,210 | | | — | | | — | | | — | | | 12,913 | |
During the year ended December 31, 2023, we sold $8.0 million of loans that were classified as held-for-investment, for a gain of $726,000, which is reported in gain on sale of loans on the Consolidated Statements of Income.
NORTHWEST BANCSHARES, INC. AND SUBSIDIARIES
NOTES TO CONSOLIDATED FINANCIAL STATEMENTS
December 31, 2024, 2023 and 2022
The following table provides information related to the allowance for credit losses by portfolio segment and by class of financing receivable for the year ended December 31, 2022 (in thousands):
| | | | | | | | | | | | | | | | | | | | | | | | | | | | | |
| | Balance as of December 31, 2022 | | Current
period provision | | Charge-offs | | Recoveries | | Balance as of December 31, 2021 |
| Allowance for Credit Losses | | | | | | | | | |
| Personal Banking: | | | | | | | | | |
| Residential mortgage loans | $ | 19,261 | | | 13,129 | | | (2,033) | | | 792 | | | 7,373 | |
| Home equity loans | 5,902 | | | 540 | | | (1,469) | | | 1,531 | | | 5,300 | |
| Vehicle loans | 23,059 | | | 8,863 | | | (3,621) | | | 2,334 | | | 15,483 | |
| Consumer loans | 665 | | | 1,013 | | | (4,785) | | | 1,553 | | | 2,884 | |
| Total Personal Banking | 48,887 | | | 23,545 | | | (11,908) | | | 6,210 | | | 31,040 | |
| | | | | | | | | |
| Commercial Banking: | | | | | | | | | |
| Commercial real estate loans | 44,506 | | | (12,633) | | | (7,366) | | | 10,364 | | | 54,141 | |
| Commercial real estate loans - owner occupied | 4,004 | | | 36 | | | — | | | 85 | | | 3,883 | |
| Commercial loans | 20,639 | | | 6,912 | | | (1,657) | | | 2,207 | | | 13,177 | |
| Total Commercial Banking | 69,149 | | | (5,685) | | | (9,023) | | | 12,656 | | | 71,201 | |
| Total | $ | 118,036 | | | 17,860 | | | (20,931) | | | 18,866 | | | 102,241 | |
| | | | | | | | | |
Allowance for Credit Losses -
off-balance-sheet exposure | | | | | | | | | |
| Personal Banking: | | | | | | | | | |
| Residential mortgage loans | $ | 4 | | | 2 | | | — | | | — | | | 2 | |
| Home equity loans | 74 | | | 35 | | | — | | | — | | | 39 | |
| | | | | | | | | |
| Total Personal Banking | 78 | | | 37 | | | — | | | — | | | 41 | |
| | | | | | | | | |
| Commercial Banking: | | | | | | | | | |
| Commercial real estate loans | 5,375 | | | 4,494 | | | — | | | — | | | 881 | |
| Commercial real estate loans - owner occupied | 379 | | | 237 | | | — | | | — | | | 142 | |
| Commercial loans | 7,081 | | | 5,687 | | | — | | | — | | | 1,394 | |
| Total Commercial Banking | 12,835 | | | 10,418 | | | — | | | — | | | 2,417 | |
| Total off-balance sheet exposure | $ | 12,913 | | | 10,455 | | | — | | | — | | | 2,458 | |
NORTHWEST BANCSHARES, INC. AND SUBSIDIARIES
NOTES TO CONSOLIDATED FINANCIAL STATEMENTS
December 31, 2024, 2023 and 2022
The following table provides information related to the loan portfolio by portfolio segment and by class of financing receivable at December 31, 2024 (in thousands):
| | | | | | | | | | | | | | | | | | | | | | | |
| | Total loans
receivable | | Allowance for
credit losses | | Nonaccrual
loans | | Loans 90 days past due and accruing |
| Personal Banking: | | | | | | | |
| Residential mortgage loans | $ | 3,178,269 | | | 14,347 | | | 6,951 | | | — | |
| Home equity loans | 1,149,396 | | | 4,845 | | | 3,332 | | | — | |
| Vehicle loans | 1,870,843 | | | 22,389 | | | 4,829 | | | — | |
| Consumer loans | 124,242 | | | 1,883 | | | 199 | | | 578 | |
| Total Personal Banking | 6,322,750 | | | 43,464 | | | 15,311 | | | 578 | |
| | | | | | | |
| Commercial Banking: | | | | | | | |
| Commercial real estate loans | 2,495,726 | | | 44,328 | | | 36,183 | | | — | |
| Commercial real estate loans - owner occupied | 354,136 | | | 3,882 | | | 784 | | | — | |
| Commercial loans | 2,007,402 | | | 25,145 | | | 9,123 | | | 78 | |
| Total Commercial Banking | 4,857,264 | | | 73,355 | | | 46,090 | | | 78 | |
| | | | | | | |
| Total | $ | 11,180,014 | | | 116,819 | | | 61,401 | | | 656 | |
The following table provides information related to the loan portfolio by portfolio segment and by class of financing receivable at December 31, 2023 (in thousands):
| | | | | | | | | | | | | | | | | | | | | | | | | | | | | |
| | Total loans
receivable | | Allowance for
credit losses | | Nonaccrual
loans | | Loans 90 days past due and accruing | | | | | | |
| Personal Banking: | | | | | | | | | | | | | |
| Residential mortgage loans | $ | 3,419,417 | | | 18,193 | | | 8,727 | | | 1,671 | | | | | | | |
| Home equity loans | 1,227,858 | | | 5,403 | | | 4,492 | | | 26 | | | | | | | |
| Vehicle loans | 2,008,601 | | | 26,911 | | | 4,816 | | | 44 | | | | | | | |
| Consumer loans | 117,426 | | | 1,199 | | | 229 | | | 722 | | | | | | | |
| Total Personal Banking | 6,773,302 | | | 51,706 | | | 18,264 | | | 2,463 | | | | | | | |
| | | | | | | | | | | | | |
| Commercial Banking: | | | | | | | | | | | | | |
| Commercial real estate loans | 2,628,457 | | | 51,267 | | | 71,297 | | | 225 | | | | | | | |
| Commercial real estate loans - owner occupied | 345,553 | | | 3,775 | | | 676 | | | — | | | | | | | |
| Commercial loans | 1,658,729 | | | 18,495 | | | 4,147 | | | 10 | | | | | | | |
| Total Commercial Banking | 4,632,739 | | | 73,537 | | | 76,120 | | | 235 | | | | | | | |
| | | | | | | | | | | | | |
| Total | $ | 11,406,041 | | | 125,243 | | | 94,384 | | | 2,698 | | | | | | | |
NORTHWEST BANCSHARES, INC. AND SUBSIDIARIES
NOTES TO CONSOLIDATED FINANCIAL STATEMENTS
December 31, 2024, 2023 and 2022
We present the amortized cost of our loans on nonaccrual status including such loans with no allowance. The following table presents the amortized cost of our loans on nonaccrual status as of the beginning and end of the year ended December 31, 2024 (in thousands):
| | | | | | | | | | | | | | | | | | | | | | | | | | | | | | | |
| Nonaccrual
loans at
January 1, 2024 | | December 31, 2024 | | |
| | | Nonaccrual loans with an allowance | | Nonaccrual
loans with
no allowance | | Total nonaccrual
loans at the end of the period | | Loans 90 days
past due
and accruing | | |
| Personal Banking: | | | | | | | | | | | |
| Residential mortgage loans | $ | 8,727 | | | 6,590 | | | 361 | | | 6,951 | | | — | | | |
| Home equity loans | 4,492 | | | 3,200 | | | 132 | | | 3,332 | | | — | | | |
| Vehicle loans | 4,816 | | | 3,958 | | | 871 | | | 4,829 | | | — | | | |
| Consumer loans | 229 | | | 198 | | | 1 | | | 199 | | | 578 | | | |
| Total Personal Banking | 18,264 | | | 13,946 | | | 1,365 | | | 15,311 | | | 578 | | | |
| | | | | | | | | | | |
| Commercial Banking: | | | | | | | | | | | |
| Commercial real estate loans | 71,297 | | | 22,813 | | | 13,370 | | | 36,183 | | | — | | | |
| Commercial real estate loans - owner occupied | 676 | | | 784 | | | — | | | 784 | | | — | | | |
| Commercial loans | 4,147 | | | 7,471 | | | 1,652 | | | 9,123 | | | 78 | | | |
| Total Commercial Banking | 76,120 | | | 31,068 | | | 15,022 | | | 46,090 | | | 78 | | | |
| | | | | | | | | | | |
| Total | $ | 94,384 | | | 45,014 | | | 16,387 | | | 61,401 | | | 656 | | | |
During the year ended December 31, 2024, we did not recognize any interest income on nonaccrual loans.
The following table presents the amortized cost of our loans on nonaccrual status as of the beginning and end of the year ended December 31, 2023, (in thousands):
| | | | | | | | | | | | | | | | | | | | | | | | | | | | | |
| Nonaccrual loans at January 1, 2023 | | December 31, 2023 |
| | | Nonaccrual loans with an allowance | | Nonaccrual loans with no allowance | | Total nonaccrual
loans at the end of the period | | Loans 90 days past and accruing |
| Personal Banking: | | | | | | | | | |
| Residential mortgage loans | $ | 7,574 | | | 8,304 | | | 423 | | | 8,727 | | | 1,671 | |
| Home equity loans | 4,145 | | | 4,084 | | | 408 | | | 4,492 | | | 26 | |
| Vehicle loans | 3,771 | | | 4,187 | | | 629 | | | 4,816 | | | 44 | |
| Consumer loans | 256 | | | 229 | | | — | | | 229 | | | 722 | |
| Total Personal Banking | 15,746 | | | 16,804 | | | 1,460 | | | 18,264 | | | 2,463 | |
| | | | | | | | | |
| Commercial Banking: | | | | | | | | | |
| Commercial real estate loans | 62,239 | | | 47,359 | | | 23,938 | | | 71,297 | | | 225 | |
| Commercial real estate loans - owner occupied | 624 | | | 676 | | | — | | | 676 | | | — | |
| Commercial loans | 2,627 | | | 3,996 | | | 151 | | | 4,147 | | | 10 | |
| Total Commercial Banking | 65,490 | | | 52,031 | | | 24,089 | | | 76,120 | | | 235 | |
| | | | | | | | | |
| Total | $ | 81,236 | | | 68,835 | | | 25,549 | | | 94,384 | | | 2,698 | |
During the year ended December 31, 2023, we did not recognized any interest income on nonaccrual loans.
NORTHWEST BANCSHARES, INC. AND SUBSIDIARIES
NOTES TO CONSOLIDATED FINANCIAL STATEMENTS
December 31, 2024, 2023 and 2022
A loan is considered to be collateral dependent when the borrower is experiencing financial difficulty and repayment is expected to be provided substantially through the sale or operation of the collateral. The following table presents the amortized cost basis of collateral-dependent loans by class of loans as of December 31, 2024 (in thousands):
| | | | | | | | | | | | | | | | | | | | | | | | | |
| | Real estate | | Equipment | | Other | | Total | | |
| | | | | | | | | |
| | | | | | | | | |
| | | | | | | | | |
| | | | | | | | | |
| | | | | | | | | |
| | | | | | | | | |
| | | | | | | | | |
| Commercial Banking: | | | | | | | | | |
| Commercial real estate loans | $ | 27,907 | | | — | | | 339 | | | 28,246 | | | |
| | | | | | | | | |
| Commercial loans | — | | | 1,651 | | | 2,204 | | | 3,855 | | | |
| Total Commercial Banking | 27,907 | | | 1,651 | | | 2,543 | | | 32,101 | | | |
| | | | | | | | | |
| Total | $ | 27,907 | | | 1,651 | | | 2,543 | | | 32,101 | | | |
The following table presents the amortized cost basis of collateral-dependent loans by class of loans as of December 31, 2023 (in thousands):
| | | | | | | | | | | | | | | |
| | Real estate | | | | | | Total |
| | | | | | | |
| | | | | | | |
| | | | | | | |
| | | | | | | |
| | | | | | | |
| | | | | | | |
| Commercial Banking: | | | | | | | |
| Commercial real estate loans | $ | 66,934 | | | | | | | 66,934 | |
| Commercial loans | 150 | | | | | | | 150 | |
| Total Commercial Banking | 67,084 | | | | | | | 67,084 | |
| | | | | | | |
| Total | $ | 67,084 | | | | | | | 67,084 | |
Occasionally, the Company modifies loans to borrowers in financial distress by providing principal forgiveness, term extensions, an other-than-insignificant payment delay, or interest rate reduction. When principal forgiveness is provided, the amount of forgiveness is charged off against the allowance for credit losses.
In some cases, the Company provides multiple types of concessions to one loan. Typically, one type of concession, such as a term extension, is granted initially. If the borrower continues to experience financial difficulty, another concession, such as principal forgiveness, may be granted. For loans included in the “combination” columns below, multiple types of modifications have been made on the same loan within the current reporting period. The combination is at least two of the following: a term extension, principal forgiveness, an other-than-insignificant payment delay, and/or an interest rate reduction.
The following table presents the amortized cost basis of loans for the periods indicated that were both experiencing financial difficulty and modified during the periods indicated, by class and by type of modification. The percentage of the amortized cost basis of loans that were modified to borrowers in financial distress as compared to the amortized cost basis of each class of financial receivable is also presented below (dollars in thousands).
NORTHWEST BANCSHARES, INC. AND SUBSIDIARIES
NOTES TO CONSOLIDATED FINANCIAL STATEMENTS
December 31, 2024, 2023 and 2022
| | | | | | | | | | | | | | | | | | | | | | | | | | | | | | | | | | | | | | | | | | | | | | | | | | | | | | | | | |
| | | For the year ended December 31, |
| | | 2024 | | 2023 |
| | | Payment delay | | Term extension | | Interest rate reduction | | | | Combination term extension and interest rate reduction | | Total
class of financing receivable | | Payment delay | | Term extension | | Combination term extension and interest rate reduction | | Total
class of financing receivable |
| Personal Banking: | | | | | | | | | | | | | | | | | | | | | |
| Residential mortgage loans | | | $ | 191 | | | 967 | | | — | | | | | — | | | 0.04 | % | | $ | 363 | | | 499 | | | — | | | 0.03 | % |
| Home equity loans | | | — | | | 541 | | | — | | | | | 142 | | | 0.06 | % | | — | | | 403 | | | 84 | | | 0.04 | % |
| | | | | | | | | | | | | | | | | | | | | |
| Consumer loans | | | — | | | — | | | — | | | | | 12 | | | 0.01 | % | | — | | | | | 3 | | | — | % |
| Total Personal Banking | | | 191 | | | 1,508 | | | — | | | | | 154 | | | 0.03 | % | | 363 | | | 902 | | | 87 | | | 0.02 | % |
| | | | | | | | | | | | | | | | | | | | | |
| Commercial Banking: | | | | | | | | | | | | | | | | | | | | | |
| Commercial real estate loans | | | 268 | | | 191 | | | — | | | | | — | | | 0.02 | % | | — | | | 71 | | | — | | | — | % |
| Commercial real estate loans - owner occupied | | | — | | | — | | | 664 | | | | | — | | | 0.19 | % | | — | | | | | | | — | % |
| Commercial loans | | | — | | | 34 | | | — | | | | | 8 | | | — | % | | — | | | 11 | | | — | | | — | % |
| Total Commercial Banking | | | 268 | | | 225 | | | 664 | | | | | 8 | | | 0.02 | % | | — | | | 82 | | | — | | | — | % |
| | | | | | | | | | | | | | | | | | | | | |
| Total | | | $ | 459 | | | 1,733 | | | 664 | | | | | 162 | | | 0.03 | % | | $ | 363 | | | 984 | | | 87 | | | 0.01 | % |
The following table presents the effect of the loan modifications presented above to borrowers experiencing financial difficulty for the periods indicated:
| | | | | | | | | | | | | | | | | | | | | | | | | | | | | | | | | | | | | |
| | | For the year ended December 31, |
| | | 2024 | | 2023 |
| | | | Weighted-average interest rate reduction | | Weighted-average term extension
in months | | Payment deferral (months) | | Weighted-average interest rate reduction | | Weighted-average term extension
in months | | Payment deferral (months) |
| Personal Banking: | | | | | | | | | | | | | |
| Residential mortgage loans | | | — | | | 151 | | 9 | | — | % | | 142 | | 6 |
| Home equity loans | | | 2 | % | | 97 | | 0 | | 5 | % | | 92 | | 0 |
| | | | | | | | | | | | | |
| Consumer loans | | | 6 | % | | 66 | | 0 | | 12 | % | | 356 | | 0 |
| Total Personal Banking | | | 3 | % | | 128 | | 9 | | 17 | % | | 118 | | 0 |
| | | | | | | | | | | | | |
| Commercial Banking: | | | | | | | | | | | | | |
| Commercial real estate loans | | | — | % | | 117 | | 5 | | — | % | | 57 | | 0 |
| Commercial real estate loans - owner occupied | | | 2 | % | | 0 | | 0 | | — | % | | 0 | | 0 |
| Commercial loans | | | 4 | % | | 31 | | 0 | | — | % | | 23 | | 0 |
| Total Commercial Banking | | | 2 | % | | 101 | | 5 | | — | % | | 52 | | 0 |
| Total loans | | | 2 | % | | 125 | | 7 | | 17 | % | | 113 | | 6 |
The Company closely monitors the performance of loans that are modified to borrowers experiencing financial difficulty to understand the effectiveness of its modification efforts. The following table presents the performance of loans that such loans have been modified within the previous twelve months of December 31, 2024 (in thousands):
NORTHWEST BANCSHARES, INC. AND SUBSIDIARIES
NOTES TO CONSOLIDATED FINANCIAL STATEMENTS
December 31, 2024, 2023 and 2022
| | | | | | | | | | | | | | | | | | | | | | | | | | | |
| | | | | | Current | | 30-59 days
delinquent | | 60-89 days
delinquent | | 90 days or
greater delinquent |
| Personal Banking: | | | | | | | | | | | |
| Residential mortgage loans | | | | | $ | 490 | | | — | | | 9 | | | 191 | |
| Home equity loans | | | | | 152 | | | 120 | | | — | | | 16 | |
| | | | | | | | | | | |
| Consumer loans | | | | | 10 | | | — | | | — | | | — | |
| Total Personal Banking | | | | | 652 | | | 120 | | | 9 | | | 207 | |
| | | | | | | | | | | |
| Commercial Banking: | | | | | | | | | | | |
| Commercial real estate loans | | | | | 153 | | | — | | | — | | | 268 | |
| Commercial real estate loans - owner occupied | | | | | 664 | | | — | | | — | | | — | |
| Commercial loans | | | | | 43 | | | — | | | — | | | — | |
| Total Commercial Banking | | | | | 860 | | | — | | | — | | | 268 | |
| Total loans | | | | | $ | 1,512 | | | 120 | | | 9 | | | 475 | |
The Company closely monitors the performance of loans that are modified to borrowers experiencing financial difficulty to understand the effectiveness of its modification efforts. The following table presents the performance of loans that such loans have been modified since the adoption of ASU 2022-02 (in thousands):
| | | | | | | | | | | | | | | | | | | | | | | | | | | |
| | | | | | Current | | 30-59 days
delinquent | | 60-89 days
delinquent | | 90 days or
greater delinquent |
| Personal Banking: | | | | | | | | | | | |
| Residential mortgage loans | | | | | $ | 148 | | | 342 | | | 8 | | | 363 | |
| Home equity loans | | | | | 465 | | | 23 | | | — | | | — | |
| | | | | | | | | | | |
| Consumer loans | | | | | 3 | | | — | | | — | | | — | |
| Total Personal Banking | | | | | 616 | | 365 | | 8 | | 363 |
| | | | | | | | | | | |
| Commercial Banking: | | | | | | | | | | | |
| Commercial real estate loans | | | | | 71 | | | — | | | — | | | — | |
| | | | | | | | | | | |
| Commercial loans | | | | | 11 | | | — | | | — | | | — | |
| Total Commercial Banking | | | | | 82 | | | — | | | — | | | — | |
| Total loans | | | | | $ | 698 | | | 365 | | 8 | | 363 |
A modification is considered to be in default when the loan is 90 days or more past due. The following table provides the amortized cost basis of financing receivables that had a payment default during the periods indicated and were modified within the previous twelve months to borrowers experiencing financial difficulty (in thousands):
| | | | | | | | | | | | | | | | | | | | | | | | | | | |
| | | | | For the year ended December 31, |
| | | | | 2024 | | 2023 |
| | | | | Term extension | | | | | | Combination term extension and interest rate reduction | | Payment delay |
| Personal Banking: | | | | | | | | | | | | | |
| Residential mortgage loans | | | | | $ | — | | | | | | | 191 | | | 363 | |
| Home equity loans | | | | | 16 | | | | | | | — | | | — | |
| | | | | | | | | | | | | |
| | | | | | | | | | | | | |
| Total Personal Banking | | | | | 16 | | | | | | | 191 | | | 363 | |
| | | | | | | | | | | | | |
| Commercial Banking: | | | | | | | | | | | | | |
| Commercial real estate loans | | | | | — | | | | | | | 268 | | — | |
| | | | | | | | | | | | | |
| | | | | | | | | | | | | |
| Total Commercial Banking | | | | | — | | | | | | | 268 | | | — | |
| | | | | | | | | | | | | |
| Total | | | | | $ | 16 | | | | | | | 459 | | | 363 | |
NORTHWEST BANCSHARES, INC. AND SUBSIDIARIES
NOTES TO CONSOLIDATED FINANCIAL STATEMENTS
December 31, 2024, 2023 and 2022
The modifications to borrowers experiencing financial distress are included in their respective portfolio segment and the current loan balance and updated loan terms are run through their respective allowance for credit losses (ACL) models to arrive at the quantitative portion of the ACL. Subsequent performance of the loans will be measured by delinquency status and will be captured through our ACL models or our qualitative factor assessment, as deemed appropriate. If we no longer believe the loan demonstrates similar risks to their respective portfolio segment an individual assessment will be performed. Upon the Company’s determination that a modified loan (or portion of a loan) has subsequently been deemed uncollectible, the loan (or a portion of the loan) is written off. Therefore, the amortized cost basis of the loan is reduced by the uncollectible amount and the allowance for credit losses is adjusted by the same amount.
The following table provides information related to the amortized cost basis of loan payment delinquencies at December 31, 2024 (in thousands): | | | | | | | | | | | | | | | | | | | | | | | | | | | | | | | | | | | | | | | | | |
| | 30-59 days
delinquent | | 60-89 days
delinquent | | 90 days or
greater
delinquent | | Total
delinquency | | Current | | Total loans
receivable | | 90 days or
greater
delinquent
and accruing |
| | | | | | | | | | | | | |
| Personal Banking: | | | | | | | | | | | | | |
| Residential mortgage loans | $ | 28,690 | | | 10,112 | | | 4,931 | | | 43,733 | | | 3,134,536 | | | 3,178,269 | | | — | |
| Home equity loans | 5,365 | | | 1,434 | | | 2,250 | | | 9,049 | | | 1,140,347 | | | 1,149,396 | | | — | |
| Vehicle loans | 10,242 | | | 3,257 | | | 3,191 | | | 16,690 | | | 1,854,153 | | | 1,870,843 | | | — | |
| Consumer loans | 860 | | | 383 | | | 776 | | | 2,019 | | | 122,223 | | | 124,242 | | | 578 | |
| Total Personal Banking | 45,157 | | | 15,186 | | | 11,148 | | | 71,491 | | | 6,251,259 | | | 6,322,750 | | | 578 | |
| | | | | | | | | | | | | |
| Commercial Banking: | | | | | | | | | | | | | |
| Commercial real estate loans | 5,100 | | | 857 | | | 7,702 | | | 13,659 | | | 2,482,067 | | | 2,495,726 | | | — | |
| Commercial real estate loans - owner occupied | 115 | | | 58 | | | — | | | 173 | | | 353,963 | | | 354,136 | | | — | |
| Commercial loans | 5,632 | | | 1,726 | | | 7,335 | | | 14,693 | | | 1,992,709 | | | 2,007,402 | | | 78 | |
| Total Commercial Banking | 10,847 | | | 2,641 | | | 15,037 | | | 28,525 | | | 4,828,739 | | | 4,857,264 | | | 78 | |
| | | | | | | | | | | | | |
| | | | | | | | | | | | | |
| | | | | | | | | | | | | |
| | | | | | | | | | | | | |
| | | | | | | | | | | | | |
| | | | | | | | | | | | | |
| | | | | | | | | | | | | |
| | | | | | | | | | | | | |
| | | | | | | | | | | | | |
| | | | | | | | | | | | | |
| | | | | | | | | | | | | |
| | | | | | | | | | | | | |
| | | | | | | | | | | | | |
| | | | | | | | | | | | | |
| | | | | | | | | | | | | |
| Total loans | $ | 56,004 | | | 17,827 | | | 26,185 | | | 100,016 | | | 11,079,998 | | | 11,180,014 | | | 656 | |
The following table provides information related to the amortized cost basis loan payment delinquencies at December 31, 2023 (in thousands): | | | | | | | | | | | | | | | | | | | | | | | | | | | | | | | | | | | | | | | | | |
| | 30-59 days
delinquent | | 60-89 days
delinquent | | 90 days or
greater
delinquent | | Total
delinquency | | Current | | Total loans
receivable | | 90 days or
greater
delinquent
and accruing |
| Personal Banking: | | | | | | | | | | | | | |
| Residential mortgage loans | $ | 30,041 | | | 7,796 | | | 7,995 | | | 45,832 | | | 3,373,585 | | | 3,419,417 | | | 1,671 | |
| Home equity loans | 5,761 | | | 982 | | | 3,126 | | | 9,869 | | | 1,217,989 | | | 1,227,858 | | | 26 | |
| Vehicle loans | 10,382 | | | 3,326 | | | 3,051 | | | 16,759 | | | 1,991,842 | | | 2,008,601 | | | 44 | |
| Consumer loans | 829 | | | 428 | | | 927 | | | 2,184 | | | 115,242 | | | 117,426 | | | 722 | |
| Total Personal Banking | 47,013 | | | 12,532 | | | 15,099 | | | 74,644 | | | 6,698,658 | | | 6,773,302 | | | 2,463 | |
| | | | | | | | | | | | | |
| Commercial Banking: | | | | | | | | | | | | | |
| Commercial real estate loans | 2,010 | | | 1,031 | | | 6,535 | | | 9,576 | | | 2,618,881 | | | 2,628,457 | | | 225 | |
| Commercial real estate loans - owner occupied | 1,194 | | | — | | | 177 | | | 1,371 | | | 344,182 | | | 345,553 | | | — | |
| Commercial loans | 4,196 | | | 703 | | | 2,780 | | | 7,679 | | | 1,651,050 | | | 1,658,729 | | | 10 | |
| Total Commercial Banking | 7,400 | | | 1,734 | | | 9,492 | | | 18,626 | | | 4,614,113 | | | 4,632,739 | | | 235 | |
| Total loans | $ | 54,413 | | | 14,266 | | | 24,591 | | | 93,270 | | | 11,312,771 | | | 11,406,041 | | | 2,698 | |
NORTHWEST BANCSHARES, INC. AND SUBSIDIARIES
NOTES TO CONSOLIDATED FINANCIAL STATEMENTS
December 31, 2024, 2023 and 2022
Credit Quality Indicators: For Commercial Banking loans we categorize loans into risk categories based on relevant information about the ability of borrowers to service their debt such as: current financial information, historical payment experience, credit documentation, public information, and current economic trends, among other factors. We analyze loans individually by classifying the loans by credit risk. Credit relationships greater than or equal to $1.0 million classified as special mention or substandard are reviewed quarterly for deterioration or improvement to determine if the loan is appropriately classified. We use the following definitions for risk ratings other than pass:
Special Mention — Loans designated as special mention have specific, well-defined risk issues, which create a high level of uncertainty regarding the long-term viability of the business. Loans in this class are considered to have high-risk characteristics. A special mention loan exhibits material negative financial trends due to company-specific or systemic conditions. If these potential weaknesses are not mitigated, they threaten the borrower’s capacity to meet its debt obligations. Special mention loans still demonstrate sufficient financial flexibility to react to and positively address the root cause of the adverse financial trends without significant deviations from their current business strategy. Their potential weaknesses deserve our close attention and warrant enhanced monitoring.
Substandard — Loans classified as substandard are inadequately protected by the current net worth and payment capacity of the obligor or of the collateral pledged, if any. Loans so classified have a well-defined weakness or weaknesses that jeopardize the liquidation of the debt. They are characterized by the distinct possibility that we will sustain some loss if the deficiencies are not corrected.
Doubtful — Loans classified as doubtful have all the weaknesses inherent in those classified as substandard. In addition, those weaknesses make collection or liquidation in full highly questionable and improbable. A loan classified as doubtful exhibits discernible loss potential, but a complete loss seems very unlikely. The possibility of a loss on a doubtful loan is high, but because of certain important and reasonably specific pending factors that may strengthen the loan, its classification as an estimated loss is deferred until a more exact status can be determined.
Loss — Loans classified as loss are considered uncollectible and of such value that the continuance as a loan is not warranted. A loss classification does not mean that the loan has no recovery or salvage value; instead, it means that it is not practical or desirable to defer writing off all or a portion of a basically worthless loan even though partial recovery may be possible in the future.
For Personal Banking loans a pass risk rating is maintained until they are greater than 90 days past due, and risk rating reclassification is based primarily on past due status of the loan. The risk rating categories can generally be described by the following groupings:
Pass — Loans classified as pass are homogeneous loans that are less than 90 days past due from the required payment date at month-end.
Substandard — Loans classified as substandard are homogeneous loans that are greater than 90 days past due from the required payment date at month-end or homogenous retail loans that are greater than 180 days past due from the requirement payment date at month-end that has been written down to the value of underlying collateral, less costs to sell.
Doubtful — Loans classified as doubtful are homogeneous loans that are greater than 180 days past due from the required payment date at month-end and not written down to the value of underlying collateral. These loans are generally charged-off in the month in which the 180 day period elapses.
NORTHWEST BANCSHARES, INC. AND SUBSIDIARIES
NOTES TO CONSOLIDATED FINANCIAL STATEMENTS
December 31, 2024, 2023 and 2022
The following table presents the amortized cost basis of our loan portfolio by year of origination and credit quality indicator and the current period charge-offs by year of origination for each portfolio segment as of December 31, 2024 (in thousands):
| | | | | | | | | | | | | | | | | | | | | | | | | | | | | | | | | | | | | | | | | | | | | | | | | | | | | | |
| 2024 | | 2023 | | 2022 | | 2021 | | 2020 | | Prior | | Revolving loans | | Revolving loans converted to term loans | | Total loans
receivable | |
| Personal Banking: | | | | | | | | | | | | | | | | | | |
| Residential mortgage loans | | | | | | | | | | | | | | | | | | |
| Pass | $ | 28,841 | | | 194,267 | | | 628,285 | | | 745,949 | | | 466,888 | | | 1,103,217 | | | — | | | — | | | 3,167,447 | | |
| Substandard | — | | | 51 | | | 1,107 | | | 464 | | | 321 | | | 8,879 | | | — | | | — | | | 10,822 | | |
| Total residential mortgage loans | 28,841 | | | 194,318 | | | 629,392 | | | 746,413 | | | 467,209 | | | 1,112,096 | | | — | | | — | | | 3,178,269 | | |
| Residential mortgage current period charge-offs | — | | | — | | | (387) | | | — | | | (114) | | | (344) | | | — | | | — | | | (845) | | |
| Home equity loans | | | | | | | | | | | | | | | | | | |
| Pass | 33,534 | | | 58,234 | | | 85,308 | | | 88,226 | | | 124,046 | | | 234,918 | | | 476,013 | | | 45,577 | | | 1,145,856 | | |
| Substandard | — | | | — | | | 174 | | | 91 | | | 52 | | | 1,352 | | | 1,080 | | | 791 | | | 3,540 | | |
| Total home equity loans | 33,534 | | | 58,234 | | | 85,482 | | | 88,317 | | | 124,098 | | | 236,270 | | | 477,093 | | | 46,368 | | | 1,149,396 | | |
| Home equity current period charge-offs | — | | | — | | | (40) | | | (2) | | | (197) | | | (558) | | | (608) | | | (331) | | | (1,736) | | |
| Vehicle loans | | | | | | | | | | | | | | | | | | |
| Pass | 616,515 | | | 452,912 | | | 443,997 | | | 228,309 | | | 64,332 | | | 59,950 | | | — | | | — | | | 1,866,015 | | |
| Substandard | 272 | | | 1,472 | | | 1,342 | | | 1,129 | | | 223 | | | 390 | | | — | | | — | | | 4,828 | | |
| Total vehicle loans | 616,787 | | | 454,384 | | | 445,339 | | | 229,438 | | | 64,555 | | | 60,340 | | | — | | | — | | | 1,870,843 | | |
| Vehicle current period charge-offs | (454) | | | (2,197) | | | (2,626) | | | (2,087) | | | (414) | | | (1,031) | | | — | | | — | | | (8,809) | | |
| Consumer loans | | | | | | | | | | | | | | | | | | |
| Pass | 27,363 | | | 14,779 | | | 6,330 | | | 2,707 | | | 735 | | | 5,914 | | | 65,055 | | | 581 | | | 123,464 | | |
| Substandard | 36 | | | 59 | | | 24 | | | — | | | 7 | | | 1 | | | 578 | | | 73 | | | 778 | | |
| Total consumer loans | 27,399 | | | 14,838 | | | 6,354 | | | 2,707 | | | 742 | | | 5,915 | | | 65,633 | | | 654 | | | 124,242 | | |
| Consumer loan current period charge-offs | (1,106) | | | (2,015) | | | (678) | | | (285) | | | (116) | | | (1,044) | | | (651) | | | (34) | | | (5,929) | | |
| Total Personal Banking | 706,561 | | | 721,774 | | | 1,166,567 | | | 1,066,875 | | | 656,604 | | | 1,414,621 | | | 542,726 | | | 47,022 | | | 6,322,750 | | |
| Commercial Banking: | | | | | | | | | | | | | | | | | | |
| Commercial real estate loans | | | | | | | | | | | | | | | | | | |
| Pass | 189,670 | | | 252,202 | | | 430,653 | | | 258,681 | | | 286,457 | | | 803,111 | | | 26,690 | | | 23,578 | | | 2,271,042 | | |
| Special Mention | — | | | 4,877 | | | 19,030 | | | 18,533 | | | 14,383 | | | 5,654 | | | 237 | | | — | | | 62,714 | | |
| Substandard | — | | | 2,273 | | | 11,137 | | | 48,539 | | | 19,356 | | | 80,417 | | | 175 | | | 73 | | | 161,970 | | |
| | | | | | | | | | | | | | | | | | |
| | | | | | | | | | | | | | | | | | |
| Total commercial real estate loans | 189,670 | | | 259,352 | | | 460,820 | | | 325,753 | | | 320,196 | | | 889,182 | | | 27,102 | | | 23,651 | | | 2,495,726 | | |
Commercial real estate current period
charge-offs | (102) | | | (686) | | | (2,522) | | | (360) | | | (619) | | | (11,032) | | | — | | | — | | | (15,321) | | |
Commercial real estate loans -
owner occupied | | | | | | | | | | | | | | | | | | |
| Pass | 53,831 | | | 14,252 | | | 32,095 | | | 46,911 | | | 11,933 | | | 141,211 | | | 640 | | | — | | | 300,873 | | |
| Special Mention | — | | | 1,166 | | | 2,231 | | | 93 | | | — | | | 5,165 | | | 1,232 | | | — | | | 9,887 | | |
| Substandard | — | | | 12,572 | | | 5,733 | | | — | | | 2,956 | | | 18,695 | | | 751 | | | 2,669 | | | 43,376 | | |
| | | | | | | | | | | | | | | | | | |
| | | | | | | | | | | | | | | | | | |
Total commercial real estate loans -
owner occupied | 53,831 | | | 27,990 | | | 40,059 | | | 47,004 | | | 14,889 | | | 165,071 | | | 2,623 | | | 2,669 | | | 354,136 | | |
| Commercial real estate - owner occupied current period charge-offs | — | | | — | | | — | | | — | | | — | | | — | | | — | | | — | | | — | | |
| Commercial loans | | | | | | | | | | | | | | | | | | |
| Pass | 729,863 | | | 353,568 | | | 262,498 | | | 29,806 | | | 12,633 | | | 56,300 | | | 475,333 | | | 3,381 | | | 1,923,382 | | |
| Special Mention | — | | | 3,914 | | | 3,898 | | | 627 | | | 479 | | | 7 | | | 28,127 | | | 11 | | | 37,063 | | |
| Substandard | 7,133 | | | 21,606 | | | 4,669 | | | 1,063 | | | 89 | | | 1,761 | | | 8,847 | | | 1,789 | | | 46,957 | | |
| | | | | | | | | | | | | | | | | | |
| | | | | | | | | | | | | | | | | | |
| Total commercial loans | 736,996 | | | 379,088 | | | 271,065 | | | 31,496 | | | 13,201 | | | 58,068 | | | 512,307 | | | 5,181 | | | 2,007,402 | | |
Commercial loans current period
charge-offs | (1,456) | | | (6,752) | | | (4,301) | | | (235) | | | (522) | | | (916) | | | (212) | | | (68) | | | (14,462) | | |
| Total Commercial Banking | 980,497 | | | 666,430 | | | 771,944 | | | 404,253 | | | 348,286 | | | 1,112,321 | | | 542,032 | | | 31,501 | | | 4,857,264 | | |
| | | | | | | | | | | | | | | | | | |
| Total loans | $ | 1,687,058 | | | 1,388,204 | | | 1,938,511 | | | 1,471,128 | | | 1,004,890 | | | 2,526,942 | | | 1,084,758 | | | 78,523 | | | 11,180,014 | | |
For the year ended December 31, 2024, $16 million of revolving loans were converted to term loans.
NORTHWEST BANCSHARES, INC. AND SUBSIDIARIES
NOTES TO CONSOLIDATED FINANCIAL STATEMENTS
December 31, 2024, 2023 and 2022
The following table summarizes amortized cost basis loan balances by year of origination, class of loans, and risk category as of December 31, 2023 (in thousands):
| | | | | | | | | | | | | | | | | | | | | | | | | | | | | | | | | | | | | | | | | | | | | | | | | | | | | |
| | 2023 | | 2022 | | 2021 | | 2020 | | 2019 | | Prior | | Revolving loans | | Revolving loans converted to term loans | | Total loans receivable |
| Personal Banking: | | | | | | | | | | | | | | | | | |
| Residential mortgage loans | | | | | | | | | | | | | | | | | |
| Pass | $ | 177,313 | | | 665,379 | | | 792,488 | | | 506,068 | | | 244,678 | | | 1,019,152 | | | — | | | — | | | 3,405,078 | |
| Substandard | — | | | 1,581 | | | — | | | 1,252 | | | 311 | | | 11,195 | | | — | | | — | | | 14,339 | |
| Total residential mortgage loans | 177,313 | | | 666,960 | | | 792,488 | | | 507,320 | | | 244,989 | | | 1,030,347 | | | — | | | — | | | 3,419,417 | |
| Residential mortgage current period charge-offs | — | | | (9) | | | (5) | | | (130) | | | (23) | | | (1,022) | | | — | | | — | | | (1,189) | |
| Home equity loans | | | | | | | | | | | | | | | | | |
| Pass | 71,497 | | | 100,639 | | | 106,043 | | | 146,121 | | | 94,144 | | | 197,259 | | | 463,868 | | | 43,526 | | | 1,223,097 | |
| Substandard | — | | | 236 | | | 54 | | | 197 | | 35 | | | 1,733 | | 1,447 | | 1,059 | | 4,761 | |
| Total home equity loans | 71,497 | | | 100,875 | | | 106,097 | | | 146,318 | | | 94,179 | | | 198,992 | | | 465,315 | | | 44,585 | | | 1,227,858 | |
| Home equity current period charge-offs | — | | | (53) | | | (46) | | | — | | | (48) | | | (352) | | | (144) | | | (209) | | | (852) | |
| Vehicle loans | | | | | | | | | | | | | | | | | |
| Pass | 664,876 | | | 682,275 | | | 397,809 | | | 132,775 | | | 67,853 | | | 58,153 | | | — | | | — | | | 2,003,741 | |
| Substandard | 646 | | | 1,418 | | | 1,453 | | | 299 | | | 556 | | | 488 | | | — | | | — | | | 4,860 | |
| Total vehicle loans | 665,522 | | | 683,693 | | | 399,262 | | | 133,074 | | | 68,409 | | | 58,641 | | | — | | | — | | | 2,008,601 | |
| Vehicle current period charge-offs | (678) | | | (1,844) | | | (1,967) | | | (475) | | | (652) | | | (852) | | | — | | | — | | | (6,468) | |
| Consumer loans | | | | | | | | | | | | | | | | | |
| Pass | 24,277 | | 11,582 | | 5,552 | | | 2,072 | | 1,355 | | | 6,603 | | 64,214 | | 820 | | 116,475 | |
| Substandard | 55 | | 43 | | 19 | | | 6 | | 6 | | | 46 | | 726 | | 50 | | 951 | |
| Total consumer loans | 24,332 | | | 11,625 | | | 5,571 | | | 2,078 | | | 1,361 | | | 6,649 | | | 64,940 | | | 870 | | | 117,426 | |
| Consumer loan current period charge-offs | (3,412) | | | (511) | | | (390) | | | (157) | | | (177) | | | (981) | | | (317) | | | (38) | | | (5,983) | |
| Total Personal Banking | 938,664 | | | 1,463,153 | | | 1,303,418 | | | 788,790 | | | 408,938 | | | 1,294,629 | | | 530,255 | | | 45,455 | | | 6,773,302 | |
| Commercial Banking: | | | | | | | | | | | | | | | | | |
| Commercial real estate loans | | | | | | | | | | | | | | | | | |
| Pass | 223,335 | | | 470,762 | | | 303,873 | | | 332,620 | | | 228,382 | | | 745,244 | | | 27,583 | | | 24,804 | | | 2,356,603 | |
| Special Mention | 2,819 | | | 24,735 | | | 27,871 | | | 5,365 | | | 4,053 | | | 38,665 | | | 711 | | | — | | | 104,219 | |
| Substandard | 1,920 | | | 750 | | | 26,850 | | | 18,167 | | | 37,044 | | | 82,717 | | | 79 | | | 108 | | | 167,635 | |
| Total commercial real estate loans | 228,074 | | | 496,247 | | | 358,594 | | | 356,152 | | | 269,479 | | | 866,626 | | | 28,373 | | | 24,912 | | | 2,628,457 | |
| Commercial real estate current period charge-offs | (14) | | | — | | | (492) | | | — | | | (51) | | | (1,741) | | | — | | | — | | | (2,298) | |
| Commercial real estate loans - owner occupied | | | | | | | | | | | | | | | | | |
| Pass | 24,725 | | | 51,986 | | | 47,655 | | | 15,984 | | | 28,614 | | | 140,175 | | | 2,378 | | | 2,390 | | | 313,907 | |
| Special Mention | 1,221 | | | 120 | | | 1,218 | | | — | | | 14,386 | | | 2,952 | | | — | | | — | | | 19,897 | |
| Substandard | — | | | — | | | 118 | | | 1,666 | | | 4,646 | | | 4,641 | | | — | | | 678 | | | 11,749 | |
| Total commercial real estate loans - owner occupied | 25,946 | | | 52,106 | | | 48,991 | | | 17,650 | | | 47,646 | | | 147,768 | | | 2,378 | | | 3,068 | | | 345,553 | |
| Commercial real estate - owner occupied current period charge-offs | — | | | — | | | — | | | — | | | — | | | (68) | | | — | | | — | | | (68) | |
| Commercial loans | | | | | | | | | | | | | | | | | |
| Pass | 482,605 | | | 430,378 | | | 73,469 | | | 26,868 | | | 34,090 | | | 54,617 | | | 531,742 | | | 4,110 | | | 1,637,879 | |
| Special Mention | 508 | | | 3,671 | | | 52 | | | 299 | | | 240 | | | 26 | | | 1,882 | | | — | | | 6,678 | |
| Substandard | — | | | 3,015 | | | 872 | | | 356 | | | 2,361 | | | 840 | | | 4,729 | | | 1,999 | | | 14,172 | |
| Total commercial loans | 483,113 | | | 437,064 | | | 74,393 | | | 27,523 | | | 36,691 | | | 55,483 | | | 538,353 | | | 6,109 | | | 1,658,729 | |
Commercial loans current period
charge-offs | (35) | | | (2,072) | | | (517) | | | (430) | | | (205) | | | (845) | | | (60) | | | (2) | | | (4,166) | |
| Total Commercial Banking | 737,133 | | | 985,417 | | | 481,978 | | | 401,325 | | | 353,816 | | | 1,069,877 | | | 569,104 | | | 34,089 | | | 4,632,739 | |
| | | | | | | | | | | | | | | | | |
| Total loans | $ | 1,675,797 | | | 2,448,570 | | | 1,785,396 | | | 1,190,115 | | | 762,754 | | | 2,364,506 | | | 1,099,359 | | | 79,544 | | | 11,406,041 | |
For the year ended December 31, 2023, $18.9 million of revolving loans were converted to term loans.
NORTHWEST BANCSHARES, INC. AND SUBSIDIARIES
NOTES TO CONSOLIDATED FINANCIAL STATEMENTS
December 31, 2024, 2023 and 2022
Our exposure to credit loss in the event of nonperformance by the other party to off-balance-sheet financial instruments is represented by the contract amount of the financial instrument. We use the same credit policies in making commitments for off- balance-sheet financial instruments as we do for on-balance-sheet instruments. Financial instruments with off-balance-sheet risk as of December 31, 2024 and 2023 are presented in the following table (in thousands):
| | | | | | | | | | | | | | |
| | Years ended December 31, |
| | 2024 | | 2023 |
| Loans commitments | | $ | 190,094 | | | 198,166 | |
| Undisbursed lines of credit | | 1,258,492 | | | 1,185,709 | |
| Standby letters of credit | | 57,923 | | | 46,900 | |
| Total | | $ | 1,506,509 | | | 1,430,775 | |
Commitments to extend credit are agreements to lend to a customer as long as there is no violation of any condition established in the contract. Commitments generally have fixed expiration dates or other termination clauses and may require payment of a fee. We evaluate each customer’s creditworthiness on a case-by-case basis. The amount of collateral we obtain upon extension of credit is based on management’s credit evaluation of the counterparty. Collateral held varies but generally may include cash, marketable securities, real estate and other property.
Outstanding loan commitments at December 31, 2024 for fixed rate loans were $52 million. The interest rates on these commitments approximate market rates at December 31, 2024. Outstanding loan commitments at December 31, 2024 for adjustable rate loans were $139 million. The fair values of these commitments are affected by fluctuations in market rates of interest.
We issue standby letters of credit in the normal course of business. Standby letters of credit are conditional commitments issued to guarantee the performance of a customer to a third party. Standby letters of credit generally are contingent upon the failure of the customer to perform according to the terms of the underlying contract with the third party. We are required to perform under a standby letter of credit when drawn upon by the guaranteed third party in the case of nonperformance by our customer. The credit risk associated with standby letters of credit is essentially the same as that involved in extending loans to customers and is subject to normal credit policies. Collateral may be obtained based on management’s credit assessment of the customer. As of December 31, 2024, the maximum potential amount of future payments we could be required to make under these standby letters of credit is $58 million, of which $42 million is fully collateralized. A liability (which represents deferred income) of $1 million and $1 million has been recognized for the obligations as of December 31, 2024 and 2023, respectively, and there are no recourse provisions that would enable us to recover any amounts from third parties.
In addition, we maintain a $20 million credit limit with a correspondent bank for private label credit card facilities for certain existing commercial clients of the Bank, of which $11 million of the credit limit was allocated to credit cards that have been issued. These issued credit cards had an outstanding balance of $2 million at December 31, 2024. The clients of the Bank are responsible for repaying any balances due on these credit cards directly to the correspondent bank; however, if the customer fails to repay their balance, the Bank could be required to satisfy the obligation to the correspondent bank and initiate collection from our customer as part of the existing credit facility of that customer.
Mortgage servicing assets are recognized as separate assets when servicing rights are created through loan originations and the underlying loan is sold. Upon sale, the mortgage servicing right (“MSR”) is established, which represents the then-fair value of future net cash flows expected to be realized for performing the servicing activities. The fair value of the MSRs are estimated by calculating the present value of estimated future net servicing cash flows, taking into consideration actual and expected mortgage loan prepayment rates, discount rates, servicing costs and other economic factors, which are determined based on current market conditions. In determining the fair value of the MSRs, stochastic modeling is performed using variables such as the forward yield curve, prepayment rates, annual service cost, average life expectancy and option adjusted spreads. MSRs are amortized against mortgage banking income in proportion to, and over the period of, the estimated future net servicing income of the underlying mortgage loans. MSRs are recorded in other assets on the Consolidated Statements of Financial Condition.
Capitalized MSRs are evaluated quarterly for impairment based on the estimated fair value of those rights. The MSRs are stratified by certain risk characteristics, primarily loan term and note rate. If impairment exists within a risk stratification tranche, a valuation allowance is established through a charge to income equal to the amount by which the carrying value exceeds the fair value. If it is later determined all or a portion of the temporary impairment no longer exists for a particular tranche, the valuation allowance is reduced or eliminated. We do not directly hedge against realized or potential future impairment losses on our MSRs.
NORTHWEST BANCSHARES, INC. AND SUBSIDIARIES
NOTES TO CONSOLIDATED FINANCIAL STATEMENTS
December 31, 2024, 2023 and 2022
The following table shows changes in MSRs as of and for the years ended December 31, 2024 and 2023:
| | | | | | | | | | | | | | | | | | | | |
| | Servicing rights | | Valuation allowance | | Net carrying
value and fair value |
| Balance at December 31, 2022 | | $ | 7,802 | | | (7) | | | 7,795 | |
| Additions | | 788 | | | (1) | | | 787 | |
| MSR sale | | (5,930) | | | — | | | (5,930) | |
| Amortization | | (1,551) | | | — | | | (1,551) | |
| Balance at December 31, 2023 | | 1,109 | | | (8) | | | 1,101 | |
| Additions | | 558 | | | 6 | | | 564 | |
| | | | | | |
| Amortization | | (433) | | | — | | | (433) | |
| Balance at December 31, 2024 | | $ | 1,234 | | | (2) | | | 1,232 | |
(6) Accrued Interest Receivable
Accrued interest receivable as of December 31, 2024 and 2023 is presented in the following table: | | | | | | | | | | | |
| | December 31, |
| | 2024 | | 2023 |
| Investment securities | $ | 1,796 | | | 1,795 | |
| FHLB dividends | 392 | | | 637 | |
| Mortgage-backed securities | 3,741 | | | 2,743 | |
| Loans receivable | 40,427 | | | 42,178 | |
| Total | $ | 46,356 | | | 47,353 | |
(7) FHLB Stock
Northwest Bank is a member of the FHLB of Pittsburgh and a former member of the FHLB of Indianapolis. As a member of the FHLB of Pittsburgh, we are required to maintain a minimum investment in capital stock of the FHLB of Pittsburgh based upon membership, level of borrowings, collateral balances or participation in other programs. As a former member of the FHLB of Indianapolis, we are required to maintain a minimum investment in the capital stock of the FHLB of Indianapolis based upon participation in certain past programs.
Our investment in the capital stock of the FHLB of Pittsburgh at December 31, 2024 and December 31, 2023 was $18 million and $27 million, respectively. In addition, our investment in the capital stock of the FHLB of Indianapolis at December 31, 2024 and December 31, 2023 was $3 million. We received dividends on capital stock during the years ended December 31, 2024 and 2023 of $2 million and $3 million, respectively.
(8) Premises and Equipment
Premises and equipment at December 31, 2024 and 2023 are summarized by major classification in the following table:
| | | | | | | | | | | |
| | December 31, |
| | 2024 | | 2023 |
| Land and land improvements | $ | 22,072 | | | 23,905 | |
| Office buildings and improvements | 124,797 | | | 140,443 | |
| Furniture, fixtures and equipment | 137,404 | | | 133,513 | |
| Leasehold improvements | 26,984 | | | 23,547 | |
| Total, at cost | 311,257 | | | 321,408 | |
| Less accumulated depreciation and amortization | (187,011) | | | (182,570) | |
| Premises and equipment, net | $ | 124,246 | | | 138,838 | |
Depreciation and amortization expense for the years ended December 31, 2024, 2023, and 2022 was $11 million, $12 million, and $12 million, respectively.
NORTHWEST BANCSHARES, INC. AND SUBSIDIARIES
NOTES TO CONSOLIDATED FINANCIAL STATEMENTS
December 31, 2024, 2023 and 2022
(9) Goodwill and Other Intangible Assets
The following table provides information for intangible assets subject to amortization for the years ended December 31, 2024 and 2023: | | | | | | | | | | | |
| | December 31, |
| | 2024 | | 2023 |
| Amortizable intangible assets: | | | |
| Core deposit intangibles - gross | $ | 74,899 | | | 74,899 | |
| | | |
| Less: accumulated amortization | (72,062) | | | (69,609) | |
| Core deposit intangibles - net | $ | 2,837 | | | 5,290 | |
| | | |
| | | |
| | | |
| | | |
| | | |
| Total intangible assets - net | $ | 2,837 | | | 5,290 | |
The following information shows the actual aggregate amortization expense for the years ended December 31, 2024, 2023 and 2022 as well as the estimated aggregate amortization expense, based upon current levels of intangible assets, for each of the five succeeding fiscal years:
| | | | | |
| For the year ended December 31, 2022 | $ | 4,277 | |
| For the year ended December 31, 2023 | 3,270 | |
| For the year ended December 31, 2024 | 2,452 | |
| For the year ending December 31, 2025 | 1,662 | |
| For the year ending December 31, 2026 | 871 | |
| For the year ending December 31, 2027 | 304 | |
| |
| |
The following table provides information for the changes in the carrying amount of goodwill: | | | | | | | | | | | |
| | | | | Total |
| | | | | |
| | | | | |
| | | | | |
| Balance at December 31, 2023 | | | | | $ | 380,997 | |
| | | | | |
| | | | | |
| Balance at December 31, 2024 | | | | | $ | 380,997 | |
We performed our annual goodwill impairment test as of June 30, 2024, 2023, and 2022 in accordance with ASC 350, Intangibles— Goodwill and Other, and concluded that goodwill was not impaired. As of December 31, 2024, 2023 and 2022, there were no events or changes in circumstances that would cause us to update that year’s goodwill impairment test and we concluded there was no impairment of goodwill as of such dates.
(10) Deposits
Deposit balances at December 31, 2024 and 2023 are shown in the table below:
| | | | | | | | | | | |
| | December 31, |
| | 2024 | | 2023 |
| Noninterest-bearing demand deposits | $ | 2,621,415 | | | 2,669,023 | |
| Interest-bearing demand deposits | 2,666,504 | | | 2,634,546 | |
| Money market deposit accounts | 2,007,739 | | | 1,968,218 | |
| Savings deposits | 2,171,251 | | | 2,105,234 | |
| Time deposits (1) | 2,677,645 | | | 2,602,881 | |
| Total deposits | $ | 12,144,554 | | | 11,979,902 | |
(1)Includes $201 million and $484 million of brokered deposits at December 31, 2024 and 2023.
The aggregate amount of time deposits with a minimum denomination of $100,000 at December 31, 2024 and 2023 was $1.1 billion and $950 million, respectively.
Generally, deposits in excess of $250,000 are not federally insured. At December 31, 2024 and 2023, we had $1.9 billion and $1.8 billion of deposits in accounts exceeding $250,000, respectively.
NORTHWEST BANCSHARES, INC. AND SUBSIDIARIES
NOTES TO CONSOLIDATED FINANCIAL STATEMENTS
December 31, 2024, 2023 and 2022
The following table summarizes the contractual maturity of time deposits at December 31, 2024 and 2023: | | | | | | | | | | | |
| | December 31, |
| | 2024 | | 2023 |
| Due within 12 months | $ | 2,547,129 | | | 2,464,022 | |
| Due between 12 and 24 months | 86,594 | | | 70,679 | |
| Due between 24 and 36 months | 23,133 | | | 27,550 | |
| Due between 36 and 48 months | 11,592 | | | 23,590 | |
| Due between 48 and 60 months | 7,395 | | | 13,997 | |
| After 60 months | 1,802 | | | 3,043 | |
| Total time deposits | $ | 2,677,645 | | | 2,602,881 | |
The following table summarizes the interest expense incurred on the respective deposits for the years ended December 31, 2024, 2023 and 2022: | | | | | | | | | | | | | | | | | |
| | Years ended December 31, |
| | 2024 | | 2023 | | 2022 |
| Interest-bearing demand deposits | $ | 27,394 | | | 11,606 | | | 1,517 | |
| Money market deposit accounts | 34,563 | | | 24,734 | | | 3,381 | |
| Savings deposits | 24,222 | | | 8,822 | | | 2,339 | |
| Time deposits (1) | 119,313 | | | 60,181 | | | 6,883 | |
| Total interest expense on deposits | $ | 205,492 | | | 105,343 | | | 14,120 | |
(1)Includes $18 million, $8 million, and $0 of interest expense on brokered deposits at December 31, 2024, 2023, and 2022.
(11) Borrowed Funds
(a) Borrowings
Borrowed funds at December 31, 2024 and 2023 are presented in the following table:
| | | | | | | | | | | | | | | | | | | | | | | |
| | At December 31, |
| | 2024 | | 2023 |
| | Amount | | Average rate | | Amount | | Average rate |
| | | | | | | |
| | | | | | | |
| | | | | | | |
| Term notes payable to the FHLB of Pittsburgh, due within one year | $ | 175,000 | | | 4.64 | % | | $ | 175,000 | | | 5.71 | % |
| Notes payable to the FHLB of Pittsburgh, due within one year | — | | | — | % | | 163,500 | | | 5.70 | % |
| Collateralized borrowings, due within one year | 22,323 | | | 1.73 | % | | 35,495 | | | 1.72 | % |
| Collateral received, due within one year | 3,008 | | | 4.65 | % | | 24,900 | | | 5.26 | % |
| Total borrowed funds | $ | 200,331 | | | | | $ | 398,895 | | | |
Borrowings from the Federal Home Loan Banks (“FHLB”) of Pittsburgh, if any, are secured by our residential first mortgage and other qualifying loans. At December 31, 2024, the carrying value of these loans was $5.7 billion. Certain of these borrowings are subject to restrictions or penalties in the event of prepayment.
The revolving line of credit with the FHLB of Pittsburgh carries a commitment of $250 million. The rate is adjusted daily by the FHLB of Pittsburgh, and any borrowings on this line may be repaid at any time without penalty. At December 31, 2024 and December 31, 2023, the balance of the revolving line of credit was $0 million and $164 million, respectively.
At December 31, 2024 and December 31, 2023, collateralized borrowings due within one year were $22 million and $35 million, respectively. These borrowings are collateralized by cash or various securities held in safekeeping by the FHLB. At December 31, 2024, the carrying value of the cash and securities used as collateral was $36 million.
At December 31, 2024 and December 31, 2023, collateral received was $3 million and $25 million, respectively. This represents collateral posted to us from our derivative counterparties.
At December 31, 2024 and December 31, 2023, term notes payable to the FHLB of Pittsburgh due within one year were $175 million. The December 31, 2024 total is made up of seven advance each for $25 million.
NORTHWEST BANCSHARES, INC. AND SUBSIDIARIES
NOTES TO CONSOLIDATED FINANCIAL STATEMENTS
December 31, 2024, 2023 and 2022
On September 9, 2020, the Company issued $125 million of 4.00% fixed-to-floating rate subordinated notes with a maturity date of September 15, 2030. The subordinated notes, which qualify as Tier 2 capital, bear interest at an annual rate of 4.00%, payable semi-annually in arrears commencing on March 15, 2021, and a floating rate of interest equivalent to the 3-month Secured Overnight Financing Rate (“SOFR”) plus 3.89% payable quarterly in arrears commencing on December 15, 2025. During the year ended December 31, 2022, the Company repurchased $10 million of subordinated notes leaving $115 million of subordinated notes outstanding as of December 31, 2024. The subordinated debt issuance costs of approximately $2 million are being amortized over five years on a straight-line basis into interest expense. At December 31, 2024 and December 31, 2023, subordinated debentures, net of issuance costs, were $115 million and $114 million, respectively. For each of the years ended December 31, 2024, December 31, 2023, and December 31, 2022, total interest expense paid on the subordinate notes was $5 million.
(b) Trust Preferred Securities
The Company has seven statutory business trusts: Northwest Bancorp Capital Trust III, a Delaware statutory business trust, Northwest Bancorp Statutory Trust IV, a Connecticut statutory business trust, LNB Trust II, a Delaware statutory business trust, Union National Capital Trust I (“UNCT I”), a Delaware statutory business trust, Union National Capital Trust II (“UNCT II”), a Delaware statutory business trust, MFBC Statutory Trust I, a Delaware statutory trust, and Universal Preferred Trust, a Delaware statutory trust (the “Trusts”). The Trusts exist solely to issue preferred securities to third parties for cash, issue common securities to the Company in exchange for capitalization of the Trusts, invest the proceeds from the sale of trust securities in an equivalent amount of debentures of the Company, and engage in other activities that are incidental to those previously listed.
The Trusts have invested the proceeds of the offerings in junior subordinated deferrable interest debentures issued by the Company. The structure of these debentures mirrors the structure of the trust-preferred securities. These subordinated debentures are the sole assets of the Trusts. As the shareholders of the trust preferred securities are the primary beneficiaries of the Trusts, the Trusts are not consolidated in our financial statements.
The following table sets forth a summary of the cumulative trust preferred securities and the junior subordinated debt held by the Trust as of December 31, 2024 and 2023. | | | | | | | | | | | | | | | | | | | | | | | | | | | | | | | | | | |
| Maturity date | | Interest rate | | | | Capital debt
securities | | December 31, |
| | | | | 2024 | | 2023 |
| Northwest Bancorp Capital Trust III | | December 30, 2035 | | 3-month SOFR plus 1.38% | | | | $ | 50,000 | | | 51,547 | | | 51,547 | |
| Northwest Bancorp Statutory Trust IV | | December 15, 2035 | | 3-month SOFR plus 1.38% | | | | 50,000 | | | 51,547 | | | 51,547 | |
| LNB Trust II | | June 15, 2037 | | 3-month SOFR plus 1.48% | | | | 7,875 | | | 8,119 | | | 8,119 | |
| Union National Capital Trust I (1) | | January 23, 2034 | | 3-month SOFR plus 2.85% | | | | 8,000 | | | 8,024 | | | 7,999 | |
| Union National Capital Trust II (1) | | November 23, 2034 | | 3-month SOFR plus 2.00% | | | | 3,000 | | | 2,823 | | | 2,796 | |
| MFBC Statutory Trust I (1) | | September 15, 2035 | | 3-month SOFR plus 1.70% | | | | 5,000 | | | 3,891 | | | 3,788 | |
| Universal Preferred Trust (1) | | October 7, 2035 | | 3-month SOFR plus 1.69% | | | | 5,000 | | | 3,883 | | | 3,778 | |
| | | | | | | | $ | 128,875 | | | 129,834 | | | 129,574 | |
(1) Net of discounts due to the fair value adjustment made at the time of acquisition.
Cash distributions on the trust securities are made on a quarterly basis to the extent interest on the debentures is received by the Trusts. We have the right to defer payment of interest on the subordinated debentures at any time, or from time-to-time, for periods not exceeding five years. If interest payments on the subordinated debentures are deferred, the distributions on the trust securities also are deferred. To date there have been no interest deferrals. Interest on the subordinated debentures and distributions on the trust securities is cumulative. Our obligation constitutes a full, irrevocable, and unconditional guarantee on a subordinated basis of the obligations of the trust under the preferred securities. For the years ended December 31, 2024, December 31, 2023, and December 31, 2022, total interest expense paid on the trust preferred securities was $10 million, $9 million, and $5 million respectively.
The Trusts must redeem the preferred securities when the debentures are paid at maturity or upon an earlier redemption of the debentures to the extent the debentures are redeemed. All or part of the debentures may be redeemed at any time. Also, the debentures may be redeemed at any time if existing laws or regulations, or the interpretation or application of these laws or regulations, change causing:
•the interest on the debentures to no longer be deductible by the Company for federal income tax purposes;
•the trust to become subject to federal income tax or to certain other taxes or governmental charges;
•the trust to register as an investment company; or
•the preferred securities do not qualify as Tier I capital.
NORTHWEST BANCSHARES, INC. AND SUBSIDIARIES
NOTES TO CONSOLIDATED FINANCIAL STATEMENTS
December 31, 2024, 2023 and 2022
We may, at any time, dissolve any of the Trusts and distribute the debentures to the trust security holders, subject to receipt of any required regulatory approvals.
(12) Income Taxes
Total income tax was allocated for the years ended December 31, 2024, 2023 and 2022 as follows:
| | | | | | | | | | | | | | | | | |
| | Years ended December 31, |
| | 2024 | | 2023 | | 2022 |
| Income tax expense | $ | 29,268 | | | 40,121 | | | 40,026 | |
| Shareholders’ equity for unrealized gain/(loss) on securities available-for-sale | 6,513 | | | 3,429 | | | (45,321) | |
| | | | | |
| Shareholders’ equity for pension adjustment | 6,304 | | | 3,354 | | | 6,980 | |
| Shareholders’ equity for swap fair value adjustment | 448 | | | (110) | | | — | |
| | | | | |
| Unallocated income tax | $ | 42,533 | | | 46,794 | | | 1,685 | |
Income tax expense applicable to income before taxes consists of:
| | | | | | | | | | | | | | | | | |
| | Years ended December 31, |
| | 2024 | | 2023 | | 2022 |
| Current tax provision/(benefit): | | | | | |
| Federal | $ | 20,022 | | | 36,599 | | | 36,235 | |
| State | 6,443 | | | 8,442 | | | 9,295 | |
| Total current tax provision/(benefit) | 26,465 | | | 45,041 | | | 45,530 | |
| Deferred tax provision/(benefit): | | | | | |
| Federal | 2,315 | | | (5,267) | | | (5,325) | |
| State | 488 | | | 347 | | | (179) | |
| Total deferred tax provision/(benefit) | 2,803 | | | (4,920) | | | (5,504) | |
| Total income tax expense | $ | 29,268 | | | 40,121 | | | 40,026 | |
A reconciliation of the expected federal statutory income tax rate to the effective rate, expressed as a percentage of pretax income for the years ended December 31, 2024, 2023 and 2022, is as follows:
| | | | | | | | | | | | | | | | | |
| | Years ended December 31, |
| | 2024 | | 2023 | | 2022 |
| Expected tax rate | 21.0 | % | | 21.0 | % | | 21.0 | % |
| Tax-exempt interest income | (1.8) | % | | (1.2) | % | | (1.1) | % |
| State income tax, net of federal benefit | 4.3 | % | | 4.0 | % | | 4.0 | % |
| Bank-owned life insurance | (1.0) | % | | (1.0) | % | | (0.9) | % |
| Stock-based compensation | — | % | | — | % | | 0.1 | % |
| Dividends on stock plans | (0.5) | % | | (0.4) | % | | (0.5) | % |
| Low income housing and historic tax credits | — | % | | — | % | | (0.2) | % |
| | | | | |
| | | | | |
| | | | | |
| Other | 0.6 | % | | 0.5 | % | | 0.6 | % |
| Effective tax rate | 22.6 | % | | 22.9 | % | | 23.0 | % |
NORTHWEST BANCSHARES, INC. AND SUBSIDIARIES
NOTES TO CONSOLIDATED FINANCIAL STATEMENTS
December 31, 2024, 2023 and 2022
The tax effects of temporary differences that give rise to significant portions of the deferred tax assets and deferred tax liabilities at December 31, 2024 and 2023 are presented below:
| | | | | | | | | | | |
| | December 31, |
| 2024 | | 2023 |
| Deferred tax assets: | | | |
| | | |
| Deferred compensation expense | $ | 3,761 | | | 5,001 | |
| | | |
| Bad debts | 26,497 | | | 28,483 | |
| Other reserves | 3,909 | | | 4,511 | |
| Accrued post-retirement benefit cost | 576 | | | 477 | |
| Stock benefit plans | 1,950 | | | 1,134 | |
| | | |
| | | |
| | | |
| | | |
| | | |
| Unrealized loss on the fair value of securities available-for-sale | 39,473 | | | 45,985 | |
| | | |
| | | |
| Deferred income | 579 | | | 35 | |
| Lease liability | 11,253 | | | 14,593 | |
| Purchase accounting | 816 | | | 698 | |
| Net operating loss | 534 | | | 1,058 | |
| Other | 1,470 | | | 2,431 | |
| Total deferred tax assets | 90,818 | | | 104,406 | |
| Deferred tax liabilities: | | | |
| Pension expense | 7,243 | | | 6,543 | |
| | | |
| | | |
| Intangible assets | 18,858 | | | 18,041 | |
| | | |
| Mortgage servicing rights | 465 | | | 242 | |
| Fixed assets | 3,891 | | | 5,567 | |
| Net deferred loan costs | 2,213 | | | 2,412 | |
| Right of use asset | 10,404 | | | 13,917 | |
| Pension and post-retirement benefits | 6,890 | | | 587 | |
| Interest rate derivatives | 396 | | | 134 | |
| Other | 1,950 | | | 2,388 | |
| Total deferred tax liabilities | 52,310 | | | 49,831 | |
| Net deferred tax asset | $ | 38,508 | | | 54,575 | |
We have $0.2 million of federal net operating loss carryovers subject to the annual limitation under Internal Revenue Code Section 382 at December 31, 2024. The carryovers begin to expire in 2031 and are expected to be fully realized. We have $20 million of Indiana net operating loss carryovers subject to annual limitation as Indiana conforms to the Internal Revenue Code Section 382 at December 31, 2024. The carryovers begin to expire in 2025. Due to limitation, we do not currently expect to realize $8 million of the Indiana net operating loss carryover. This is netted against the net operating loss deferred tax asset in the preceding table.
The holding company has net operating loss carryforwards with the state of Pennsylvania of $102 million as of December 31, 2024 and $85 million as of December 31, 2023. The company has recorded a full valuation allowance against these carryforward attributes of Northwest Bancshares Inc. as it is not expected to realize these losses given the profitability of Northwest Bancshares for Pennsylvania tax purposes. The valuation allowance is netted against the net operating loss in the preceding table.
We recorded $0.2 million a valuation allowance against state deferred tax assets of a Northwest subsidiary since the subsidiary is not expected to utilize its deferred tax assets in the foreseeable future. This valuation allowance is netted against the net operating loss in the preceding table.
Other than stated above, we have determined that no valuation allowance is necessary for the deferred tax assets because it is more likely than not that these assets will be realized through future reversals of existing temporary differences and through future taxable income. We will continue to review the criteria related to the recognition of deferred tax assets on a regular basis.
We utilize a comprehensive approach to recognize, measure, present and disclose in our financial statements uncertain tax positions that the company has taken or expects to take on a tax return. We recognize interest accrued and penalties (if any) related to unrecognized tax benefits in income tax expense. The accrual for interest and penalties was not material for all years presented.
NORTHWEST BANCSHARES, INC. AND SUBSIDIARIES
NOTES TO CONSOLIDATED FINANCIAL STATEMENTS
December 31, 2024, 2023 and 2022
The following table presents changes in unrecognized tax benefits at December 31, 2024, 2023 and 2022: | | | | | | | | | | | | | | | | | |
| Year ended December 31, |
| 2024 | | 2023 | | 2022 |
| Unrecognized tax benefits: | | | | | |
| Balance, beginning of year | $ | 1,080 | | | 473 | | | 241 | |
| Increases related to prior year tax positions | 104 | | | 623 | | | 252 | |
| Decreases related to prior year tax positions | (92) | | | (74) | | | (28) | |
| Increases related to current year tax positions | 32 | | | 58 | | | 8 | |
| | | | | |
| | | | | |
| Balance, end of year | $ | 1,124 | | | 1,080 | | | 473 | |
It is reasonably possible that over the next twelve months the amount of unrecognized tax benefits may change from the reevaluation of uncertain tax positions arising in examinations, in appeals, or in the courts, or from the closure of tax statutes. We do not expect any significant changes in unrecognized tax benefits during the next twelve months.
We are subject to routine audits of our tax returns by the Internal Revenue Service as well as all states in which we conduct business. We are subject to audit by the Internal Revenue Service for the tax periods ended after December 31, 2020 and generally subject to audit by any state in which we conduct business for the tax periods ended after December 31, 2020.
(13) Shareholders’ Equity
Retained earnings are partially restricted in connection with regulations related to the insurance of deposit accounts, which requires Northwest to maintain certain statutory reserves. Northwest may not pay dividends on or repurchase any of its common stock if the effect thereof would reduce retained earnings below the level of adequate capitalization as defined by federal and state regulators.
In tax years prior to fiscal 1997, Northwest was permitted, under the Internal Revenue Code (“IRC”), to deduct an annual addition to a reserve for bad debts in determining taxable income, subject to certain limitations. Bad debt deductions for income tax purposes are included in taxable income of later years only if the bad debt reserve is used subsequently for purposes other than to absorb bad debt losses. There was no required recapture of the pre-1988 reserves. The pre-1988 reserves would only be subject to recapture and income if there is a distribution in excess of earnings and profits or liquidation. Retained earnings at December 31, 2024 and 2023 include approximately $39 million representing such bad debt deductions for which no deferred income taxes have been provided.
(14) Earnings Per Share
Basic earnings per common share (“EPS”) is computed by dividing net income available to common shareholders by the weighted average number of common shares outstanding for the period, without considering any dilutive items. Diluted EPS is calculated using both the two-class and the treasury stock methods with the more dilutive method used to determine diluted EPS. The two-class method was used to determine basic EPS and the treasury stock method was used to determine diluted earnings per share for the year ended December 31, 2024. The two-class method was used to determine basic and diluted EPS for the years ended December 31, 2023 and 2022. The following table sets forth the computation of basic and diluted earnings per share for the years ended December 31, 2024, 2023 and 2022.
NORTHWEST BANCSHARES, INC. AND SUBSIDIARIES
NOTES TO CONSOLIDATED FINANCIAL STATEMENTS
December 31, 2024, 2023 and 2022
| | | | | | | | | | | | | | | | | |
| Years ended December 31, |
| | 2024 | | 2023 | | 2022 |
| Numerator for earnings per share - Basic and Diluted: | | | | | |
| Net income - treasury stock method - Basic and Diluted | $ | 100,278 | | | 134,957 | | | 133,666 | |
| Less: Dividends and undistributed earnings allocated to participating securities | 125 | | | 339 | | | 585 | |
| Net income available to common shareholders - two class method - Basic and Diluted | $ | 100,153 | | | 134,618 | | | 133,081 | |
| | | | | |
| Denominator for earnings per share - treasury stock method - Basic and Diluted | | | | | |
| Weighted average common shares outstanding - Basic | 127,085,446 | | | 126,668,671 | | | 126,167,892 | |
| Add: Potentially dilutive shares | 614,055 | | | 421,670 | | | 274,509 | |
| Denominator for treasury stock method - Diluted | 127,699,501 | | | 127,090,341 | | | 126,442,401 | |
| | | | | |
| Denominator for earnings per share - two class method - Basic and Diluted: | | | | | |
| Weighted average common shares outstanding - Basic | 127,085,446 | | | 126,668,671 | | | 126,167,892 | |
| Add: Average participating shares outstanding | 158,719 | | | 319,501 | | | 556,201 | |
| Denominator for two class method - Diluted | 127,244,165 | | | 126,988,172 | | | 126,724,093 | |
| | | | | |
| Basic earnings per share | $ | 0.79 | | | 1.06 | | | 1.05 | |
| | | | | |
| Diluted earnings per share | $ | 0.79 | | | 1.06 | | | 1.05 | |
| | | | | |
| Anti-dilutive awards (1) | 2,128 | | | 2,814 | | | 1,951 | |
(1) Reflects the total number of shares related to outstanding options that have been excluded from the computation of diluted earnings per share because the impact would have been anti-dilutive.
(15) Employee Benefit Plans
(a) Pension Plans
We maintain noncontributory defined benefit pension plans covering certain employees and members of our board of directors. Retirement benefits are based on certain compensation levels, age, and length of service. Contributions are based on an actuarially determined amount to fund not only benefits attributed to service to date but also for those expected to be earned in the future. In addition, we have an unfunded Supplemental Executive Retirement Plan (“SERP”) to compensate those executive participants eligible for the defined benefit pension plan whose benefits are limited by Section 415 of the IRC.
We also sponsor a retirement savings plan in which substantially all employees participate. We provide a matching contribution of 100% of each employee’s contribution to a maximum of 4% of the employee’s compensation.
Effective August 1, 2020, the Pension Plan was amended to include a soft freeze. The soft freeze will allow those employees in an eligible position that were hired, rehired, or acquired on or before July 31, 2020, to continue to vest and accrue additional benefits for each year they are credited with 1,000 hours or more. Employees that are hired, rehired, acquired, or transfer to an eligible job classification on or after August 1, 2020 are not eligible to participate in the Pension Plan.
Total expense for the defined contribution retirement savings plan was $2 million, $4 million, and $4 million for the years ended December 31, 2024, 2023 and 2022, and net periodic pension expense for the defined benefit pension plan was a benefit of $3 million and $1 million for the years ended December 31, 2024 and 2023, respectively and a total cost of and $0.9 million for the year ended 2022.
NORTHWEST BANCSHARES, INC. AND SUBSIDIARIES
NOTES TO CONSOLIDATED FINANCIAL STATEMENTS
December 31, 2024, 2023 and 2022
Components of net periodic pension cost and other amounts recognized in other comprehensive income:
The following table sets forth components of net periodic pension cost and other amounts recognized in other comprehensive income for the years ended December 31, 2024, 2023 and 2022.
| | | | | | | | | | | | | | | | | |
| | Years ended December 31, |
| 2024 | | 2023 | | 2022 |
| Defined benefit pension plan: | | | | | |
| Service cost | $ | 5,701 | | | 6,241 | | | 10,396 | |
| Interest cost | 8,821 | | | 9,009 | | | 6,683 | |
| Expected return on plan assets | (15,102) | | | (13,915) | | | (15,454) | |
| Amortization of prior service cost | (2,254) | | | (2,254) | | | (2,257) | |
| Amortization of the net loss | 71 | | | (219) | | | 1,525 | |
| Net periodic pension cost, defined benefit pension plans | (2,763) | | | (1,138) | | | 893 | |
| | | | | |
| Other changes in defined benefit pension plan recognized in other comprehensive income: | | | | | |
| Net gain | (25,118) | | | (14,066) | | | (28,222) | |
| | | | | |
| Amortization of prior service cost | 2,254 | | | 2,254 | | | 2,257 | |
| Total recognized in other comprehensive income | (22,864) | | | (11,812) | | | (25,965) | |
| Total recognized in net periodic pension cost and other comprehensive income | $ | (25,627) | | | (12,950) | | | (25,072) | |
The estimated net gain and prior service credit for the defined benefit pension plan that will be amortized from accumulated other comprehensive income into net periodic cost ending December 31, 2025 is $149,000 and $812,000, respectively.
The following table sets forth information for the defined benefit pension plans’ funded status at December 31, 2024 and 2023: | | | | | | | | | | | |
| | December 31, |
| | 2024 | | 2023 |
| Change in benefit obligation: | | | |
| Benefit obligation at beginning of year | $ | 185,196 | | | 184,759 | |
| Service cost | 5,701 | | | 6,241 | |
| Interest cost | 8,821 | | | 9,009 | |
| | | |
| Actuarial gain | (19,318) | | | 935 | |
| Benefits paid | (18,207) | | | (15,748) | |
| Benefit obligation at end of year | 162,193 | | | 185,196 | |
| | | |
| Change in plan assets: | | | |
| Fair value of plan assets at beginning of year | 216,596 | | | 202,791 | |
| Actual return on plan assets | 20,832 | | | 29,135 | |
| Employer contributions | 383 | | | 418 | |
| | | |
| Benefits paid | (18,207) | | | (15,748) | |
| Fair value of plan assets at end of period | 219,604 | | | 216,596 | |
| Funded status at end of year | $ | 57,411 | | | 31,400 | |
The following table sets forth the assumptions used to develop the net periodic pension cost: | | | | | | | | | | | | | | | | | |
| | Years ended December 31, |
| | 2024 | | 2023 | | 2022 |
| Discount rate | 4.79 | % | | 4.99 | % | | 2.75 | % |
| Expected long-term rate of return on assets | 7.00 | % | | 7.00 | % | | 6.50 | % |
| Rate of increase in compensation levels | 3.00 | % | | 3.00 | % | | 3.00 | % |
NORTHWEST BANCSHARES, INC. AND SUBSIDIARIES
NOTES TO CONSOLIDATED FINANCIAL STATEMENTS
December 31, 2024, 2023 and 2022
The following table sets forth the assumptions used to determine benefit obligations at the end of each period:
| | | | | | | | | | | | | | | | | |
| | Years ended December 31, |
| | 2024 | | 2023 | | 2022 |
| Discount rate | 5.44 | % | | 4.79 | % | | 4.99 | % |
| Expected long-term rate of return on assets | 5.50 | % | | 7.00 | % | | 6.50 | % |
| Rate of increase in compensation levels | 3.00 | % | | 3.00 | % | | 3.00 | % |
The expected long-term rate of return on assets is based on the expected return of each of the asset categories, weighted based on the median of the target allocation for each category. We use the FTSE (previously Citigroup) Pension Liability Index rates matching the duration of our benefit payments as of the measurement date to determine the discount rate.
The accumulated benefit obligation for the funded defined benefit pension plan was $160 million, $183 million, and $182 million at December 31, 2024, 2023 and 2022, respectively. The accumulated benefit obligation for all unfunded defined benefit plans was $2 million, $2 million, and $3 million at December 31, 2024, 2023 and 2022, respectively.
The following table sets forth certain information related to our pension plans:
| | | | | | | | | | | |
| | December 31, |
| | 2024 | | 2023 |
| Projected benefit obligation | $ | 162,193 | | | 185,196 | |
| Accumulated benefit obligation | 162,193 | | | 185,196 | |
| Fair value of plan assets | 219,604 | | | 216,596 | |
Because of the current funding status, we do not anticipate a funding requirement during the year ending December 31, 2025.
The investment policy as established by the Plan Administrative Committee, to be followed by the Trustee, is to invest assets based on the target allocations shown in the table below. To meet target allocation ranges set forth by the Plan Administrative Committee, periodically, the assets are reallocated by the Trustee. The investment policy is reviewed periodically to determine if the policy should be changed. Pension assets are conservatively invested with the goal of providing market or better returns with below market risks. Assets are invested in a balanced portfolio composed primarily of equities, fixed income, and cash or cash equivalent investments. The Trustee tries to maintain an approximate asset mix position of 50% to 80% bonds and 20% to 35% equities.
A maximum of 10% may be invested in any one stock, including the stock of Northwest Bancshares, Inc. The objective of holding equity securities is to provide capital appreciation consistent with the ownership of the common stocks of medium to large companies. Acceptable bond investments are direct or agency obligations of the U.S. Government or investment grade corporate bonds. The average maturity of the bond portfolio shall not exceed ten years.
The following table sets forth the weighted average asset allocation of defined benefit plans:
| | | | | | | | | | | | | | | | | |
| | | | December 31, |
| | Target allocation | | 2024 | | 2023 |
| Equity securities | 20 – 35% | | 30 | % | | 69 | % |
| Debt securities | 50 – 80% | | 64 | % | | 25 | % |
| Other | 0 – 10% | | 6 | % | | 6 | % |
| Total | | | 100 | % | | 100 | % |
NORTHWEST BANCSHARES, INC. AND SUBSIDIARIES
NOTES TO CONSOLIDATED FINANCIAL STATEMENTS
December 31, 2024, 2023 and 2022
All of the assets held by the defined benefit pension plan are measured and recorded at estimated fair value on our balance sheet on a recurring basis as Level 1 assets, as defined by the fair value hierarchy defined in Note 16. The following table sets forth the pension plan assets as of December 31, 2024 and 2023.
| | | | | | | | | | | | | | | |
| | December 31, |
| | 2024 | | 2023 | | | | |
| Defined benefit pension assets: | | | | | | | |
| Common stock | $ | 17,320 | | | 71,192 | | | | | |
| Mutual funds | 190,249 | | | 131,921 | | | | | |
| Money market funds | 2,873 | | | 2,150 | | | | | |
| Other | 9,162 | | | 11,333 | | | | | |
| Total defined benefit pension plan assets (1) | $ | 219,604 | | | 216,596 | | | | | |
(1) The defined benefit pension plan statement of net assets also includes accrued interest and dividends resulting in net assets available for benefits of $220.0 million and $217 million, respectfully.
The benefits expected to be paid in each year from 2025 to 2029 are $11.2 million, $11.4 million, $11.8 million, $12.4 million and $13.4 million, respectively. The aggregate benefits expected to be paid in the five years from 2030 to 2034 are $70.2 million. The expected benefits to be paid are based on the same assumptions used to measure our benefit obligations at December 31, 2024 and include estimated future employee service.
(b) Stock-based Compensation
Stock-based awards are eligible for issuance under the our Incentive Compensation Plans to executives, directors and key employees of the Northwest Bancshares and its subsidiaries. On May 18, 2022, shareholders approved the Northwest Bancshares, Inc. 2022 Equity Incentive Plan with up to 3,500,000 shares authorized for award. This plan provides for the granting of stock options, restricted stock awards (“RSAs”), restricted stock units (“RSUs”) and performance awards. At December 31,2024 1,079,102 shares were available for future grants.
We issue shares to fulfill stock-based award vesting from available authorized common shares. At December 31,2024, we believe there are adequate authorized common shares to satisfy anticipated stock-based vesting for all grants outstanding.
Stock-based compensation expense was $6 million, $4 million and $3 million and was included in compensation and employee benefits expense on the Consolidated Statements of Income during the years ended December 31, 2024, 2023 and 2022, respectively. The effect on net income for the years ended December 31, 2024, 2023 and 2022 was a reduction of $4 million, $3 million and $2 million, respectively.
Restricted Stock Awards, Restricted Stock Units and Performance Share Units
Restricted stock awards, Restricted Stock Units and Performance Share Units (“PSUs”) are all issued subject to service restrictions. PSUs are payable contingent on the achievement of certain predefined performance objectives over a three-year measurement period with the actual number of shares issuable ranging between 0% and 150% of the number of PSUs granted. RSAs accumulate dividends that are paid upon vesting.
NORTHWEST BANCSHARES, INC. AND SUBSIDIARIES
NOTES TO CONSOLIDATED FINANCIAL STATEMENTS
December 31, 2024, 2023 and 2022
During the years ended December 31, 2022, December 31, 2023 and December 31, 2024, we granted the following awards (amounts in this table are not in thousands):
| | | | | | | | | | | | | | | | | | | | | | | | | | | | | | | | | | | | | | | | | | | | |
| Year-ended | | Grant date | | Award to | | Shares | | Grant type | | Weighted average grant date fair value | | Total
market value ($) | | Vesting period (years) |
| December 31, 2022 | | | | | | | | | | | | | | |
| | 5/18/2022 | | Employees | | 150,027 | | | RSU | | $ | 11.00 | | | 1.7 million | | 3 |
| | 5/18/2022 | | Employees | | 150,027 | | | PSU | | 10.26 | | 1.5 million | | 3 |
| | 5/18/2022 | | Directors | | 41,206 | | | RSA | | 12.55 | | 517,000 | | 1 |
| | Various | | Employees | | 13,115 | | | RSU | | 12.69 | | 166,000 | | 3 |
| | | | | | | | | | | | | | |
| December 31, 2023 | | | | | | | | | | | | | | |
| | 3/15/2023 | | Employees | | 176,623 | | | RSU | | 11.28 | | 2.0 million | | 3 |
| | 3/15/2023 | | Employees | | 176,623 | | | PSU | | 10.54 | | | 1.9 million | | 3 |
| | 3/15/2023 | | Directors | | 33,048 | | | RSA | | 12.80 | | 423,000 | | 1 |
| | 3/27/2023 | | Employees | | 80,980 | | | RSU | | 11.20 | | | 907,000 | | 2 |
| | Various | | Employees | | 128,148 | | | RSU | | 10.30 | | | 1.3 million | | 3 |
| | | | | | | | | | | | | | |
| December 31, 2024 | | | | | | | | | | | | | | |
| | 3/20/2024 | | Employees | | 307,775 | | | RSU | | 9.79 | | | 3.0 million | | 3 |
| | 3/20/2024 | | Employees | | 324,124 | | | PSU | | 9.07 | | | 2.9 million | | 3 |
| | 3/20/2024 | | Directors | | 41,560 | | | RSA | | 11.31 | | | 470,000 | | 1 |
| | Various | | Employees | | 266,106 | | | RSU | | 10.86 | | | 2.9 million | | 3 to 4 |
| | | | | | | | | | | | | | |
Total shares forfeited from the 2022 plan were 210,214 of which 139,141 shares were forfeited during the year ended December 31, 2024. At December 31, 2024, there was compensation expense of $4.2 million to be recognized for awarded but unvested RSUs and $2.4 million to be recognized for awarded but unvested PSUs, with an expense recognition period remaining of 2.5 years. At December 31, 2024, there was compensation expense of $918,215 to be recognized for awarded but unvested RSAs, with an expense recognition period remaining of one year.
(c) Stock Option Plans
There were no stock options granted during the years ended December 31, 2024, December 31, 2023 or December 31, 2022. Previously granted options were valued using the Black-Scholes option pricing model.
The following table summarizes the activity in our option plans during the years ended December 31, 2024, December 31, 2023 and December 31, 2022 (amounts in this table are not in thousands):
| | | | | | | | | | | | | | | | | | | | | | | | | | | | | | | | | | | |
| | Years ended December 31, |
| | 2024 | | 2023 | | 2022 |
| | Number | | Weighted average
exercise price | | Number | | Weighted average
exercise price | | Number | | Weighted average
exercise price |
| Balance at beginning of year | 3,209,005 | | | $ | 14.36 | | | 3,657,580 | | | $ | 14.25 | | | 4,380,310 | | | $ | 14.05 | |
| | | | | | | | | | | |
| Exercised (1) | (199,058) | | | 12.29 | | | (63,315) | | | 11.46 | | | (465,920) | | | 12.14 | |
| Forfeited/expired | (404,080) | | | 13.73 | | | (385,260) | | | 13.80 | | | (256,810) | | | 14.64 | |
| Balance at end of year | 2,605,867 | | | 15.28 | | | 3,209,005 | | | 14.36 | | | 3,657,580 | | | 14.25 | |
| Exercisable at end of year | 2,355,318 | | | 16.17 | | | 2,601,367 | | | 14.52 | | | 2,556,235 | | | 14.43 | |
(1)The total intrinsic value of options exercised was $390,000, $115,000 and $839,000, respectively.
NORTHWEST BANCSHARES, INC. AND SUBSIDIARIES
NOTES TO CONSOLIDATED FINANCIAL STATEMENTS
December 31, 2024, 2023 and 2022
The aggregate intrinsic value of all options expected to vest and fully vested options at December 31, 2024 is ($193,000) and ($5.3) million, respectively. The following table summarizes the number of options outstanding, number of options exercisable, and weighted average remaining life of all option grants as of December 31, 2024 (amounts in this table are not in thousands):
| | | | | | | | | | | | | | | | | | | | | | | |
| Exercise price | | Exercise price | | Exercise price | | Exercise price |
| | $9.71 | | $12.37 | | $13.68 | | $14.15 |
| Options outstanding: | | | | | | | |
| Number of options | 325,075 | | | 151,948 | | | 470,042 | | | 297,819 | |
| Weighted average remaining contract life (years) | 5.4 | | 0.4 | | 6.4 | | 1.4 |
| Options exercisable: | | | | | | | |
| Number of options | 247,401 | | | 151,948 | | | 394,884 | | | 278,402 | |
| Weighted average remaining term - vested (years) | 4.6 | | 9.6 | | 3.6 | | 8.6 |
| | | | | | | | | | | | | | | | | | | | | | | | | |
| Exercise price | | Exercise price | | Exercise price | | Exercise price | | |
| | $15.57 | | $16.59 | | $17.27 | | $14.25 | | |
| Options outstanding: | | | | | | | | | |
| Number of options | 419,582 | | | 543,519 | | | 395,942 | | | 2,605,867 | | | |
| Weighted average remaining contract life (years) | 2.4 | | 3.4 | | 4.4 | | 3.8 | | |
| Options exercisable: | | | | | | | | | |
| Number of options | 373,022 | | | 543,519 | | | 364,202 | | | 2,355,318 | | | |
| Weighted average remaining term - vested (years) | 7.6 | | 6.6 | | 5.6 | | 2.6 | | |
(16) Disclosures About Fair Value of Financial Instruments
We are required to disclose fair value information about financial instruments whether or not recognized in the Consolidated Statement of Financial Condition. Fair value information of certain financial instruments and all nonfinancial instruments is not required to be disclosed. Accordingly, the aggregate fair value amounts presented do not represent the underlying value of the Company.
Financial assets and liabilities recognized or disclosed at fair value on a recurring basis and certain financial assets and liabilities on a non-recurring basis are accounted for using a three-level hierarchy of valuation techniques based on whether the inputs to those valuation techniques are observable or unobservable. This hierarchy gives the highest priority to quoted prices with readily available independent data in active markets for identical assets or liabilities (Level 1) and the lowest priority to unobservable market inputs (Level 3). When various inputs for measurement fall within different levels of the fair value hierarchy, the lowest level input that has a significant impact on fair value measurement is used.
Financial assets and liabilities are categorized based upon the following characteristics or inputs to the valuation techniques:
•Level 1 — Financial assets and liabilities for which inputs are observable and are obtained from reliable quoted prices for identical assets or liabilities in actively traded markets. This is the most reliable fair value measurement and includes, for example, active exchange-traded equity securities.
•Level 2 — Financial assets and liabilities for which values are based on quoted prices in markets that are not active or for which values are based on similar assets or liabilities that are actively traded. Level 2 also includes pricing models in which the inputs are corroborated by market data, for example, matrix pricing.
•Level 3 — Financial assets and liabilities for which values are based on prices or valuation techniques that require inputs that are both unobservable and significant to the overall fair value measurement. Level 3 inputs include the following:
◦Quotes from brokers or other external sources that are not considered binding;
◦Quotes from brokers or other external sources where it cannot be determined that market participants would in fact transact for the asset or liability at the quoted price; and
◦Quotes and other information from brokers or other external sources where the inputs are not deemed observable.
NORTHWEST BANCSHARES, INC. AND SUBSIDIARIES
NOTES TO CONSOLIDATED FINANCIAL STATEMENTS
December 31, 2024, 2023 and 2022
We are responsible for the valuation process and as part of this process may use data from outside sources in establishing fair value. We perform due diligence to understand the inputs used or how the data was calculated or derived. We also corroborate the reasonableness of external inputs in the valuation process.
The carrying amounts reported in the Consolidated Statement of Financial Condition approximate fair value for the following financial instruments: cash and cash equivalents, marketable securities available-for-sale, loans held-for-sale, accrued interest receivable, interest rate lock commitments, forward commitments, interest rate swaps, savings and checking deposits, foreign exchange swaps, risk participation agreements, and accrued interest payable.
Marketable Securities
Where available, market values are based on quoted market prices, dealer quotes, and prices obtained from independent pricing services.
Debt Securities — available-for-sale - Generally, debt securities are valued using pricing for similar securities, recently executed transactions and other pricing models utilizing observable inputs. The valuation for most debt securities is classified as Level 2. Securities within Level 2 include corporate bonds, municipal bonds, mortgage-backed securities and U.S. government obligations.
Debt Securities — held-to-maturity - The fair value of debt securities held-to-maturity is determined in the same manner as debt securities available-for-sale.
Loans Receivable
Loans with comparable characteristics including collateral and re-pricing structures are segregated for valuation purposes. Each loan pool is separately valued utilizing a discounted cash flow analysis. Projected monthly cash flows are discounted to present value using a market rate for comparable loans, which is not considered an exit price. Characteristics of comparable loans include remaining term, coupon interest, and estimated prepayment speeds. Delinquent loans are separately evaluated given the impact delinquency has on the projected future cash flow of the loan including the approximate discount or market rate, which is not considered an exit price.
Loans Held-for-Sale
The estimated fair value of loans held-for-sale is based on market bids obtained from potential buyers.
FHLB Stock
Due to the restrictions placed on transferability of FHLB stock, it is not practical to determine the fair value. FHLB stock is recorded at cost.
Deposit Liabilities
The estimated fair value of deposits with no stated maturity, which includes demand deposits, money market, and other savings accounts, is the amount payable on demand. Although market premiums paid for depository institutions reflect an additional value for these low-cost deposits, adjusting fair value for any value expected to be derived from retaining those deposits for a future period of time or from the benefit that results from the ability to fund interest-earning assets with these deposit liabilities is prohibited. The fair value estimates of deposit liabilities do not include the benefit that results from the low-cost funding provided by these deposits compared to the cost of borrowing funds in the market. Fair values for time deposits are estimated using a discounted cash flow calculation that applies contractual cost currently being offered in the existing portfolio to current market rates being offered locally for deposits of similar remaining maturities. The valuation adjustment for the portfolio consists of the present value of the difference of these two cash flows, discounted at the assumed market rate of the corresponding maturity.
Borrowed Funds
Fixed rate advances are valued by comparing their contractual cost to the prevailing market cost. The carrying amount of repurchase agreements approximates their fair value.
NORTHWEST BANCSHARES, INC. AND SUBSIDIARIES
NOTES TO CONSOLIDATED FINANCIAL STATEMENTS
December 31, 2024, 2023 and 2022
Subordinated Debentures
The fair value of our subordinated debentures is calculated using the discounted cash flows at rates observable for other similarly traded liabilities.
Junior Subordinated Debentures
The fair value of junior subordinated debentures is calculated using the discounted cash flows at the prevailing rate of interest.
Interest Rate Lock Commitments and Forward Commitments
The fair value of interest rate lock commitments is based on the value of underlying loans held-for-sale which is based on quoted prices for similar loans in the secondary market. This value is then adjusted based on the probability of the loan closing (i.e., the “pull-through” amount, a significant unobservable input). The fair value of forward sale commitments is based on quoted prices from the secondary market based on the settlement date of the contracts.
Cash Flow Hedges, Interest Rate and Foreign Exchange Swap Agreements and Risk Participation Agreements
The fair value of interest rate swaps is based upon the present value of the expected future cash flows using the SOFR discount curve, the basis for the underlying interest rate. To price interest rate swaps, cash flows are first projected for each payment date using the fixed rate for the fixed side of the swap and the forward rates for the floating side of the swap. These swap cash flows are then discounted to time zero using SOFR zero-coupon interest rates. The sum of the present value of both legs is the fair market value of the interest rate swap. These valuations have been derived from our third party vendor’s proprietary models rather than actual market quotations. The proprietary models are based upon financial principles and assumptions that we believe to be reasonable. The fair value of the foreign exchange swap is derived from proprietary models rather than actual market quotations. The proprietary models are based upon financial principles and assumptions that we believe to be reasonable. Risk participation agreements are entered into when Northwest purchases a portion of a commercial loan that has an interest rate swap. Northwest assumes credit risk on its portion of the interest rate swap should the borrower fail to pay as agreed. The value of risk participation agreements is determined based on the value of the swap after considering the credit quality, probability of default, and loss given default of the borrower.
Off-Balance Sheet Financial Instruments
These financial instruments generally are not sold or traded, and estimated fair values are not readily available. However, the fair value of commitments to extend credit and standby letters of credit is estimated using the fees currently charged to enter into similar agreements. Commitments to extend credit are generally short-term in nature and, if drawn upon, are issued under current market terms. At December 31, 2024 and 2023, there was no significant unrealized appreciation or depreciation on these financial instruments.
NORTHWEST BANCSHARES, INC. AND SUBSIDIARIES
NOTES TO CONSOLIDATED FINANCIAL STATEMENTS
December 31, 2024, 2023 and 2022
The following table sets forth the carrying amount and estimated fair value of our financial instruments included in the Consolidated Statement of Financial Condition at December 31, 2024 and 2023:
| | | | | | | | | | | | | | | | | | | | | | | | | | | | | | | | | | | |
| | December 31, 2024 |
| | Carrying amount | | Estimated fair value | | Level 1 | | Level 2 | | Level 3 | | Netting Adjustments (1) |
| Financial assets: | | | | | | | | | | | |
| Cash and cash equivalents | $ | 288,378 | | | 288,378 | | | 288,378 | | | — | | | — | | | — | |
| Securities available-for-sale | 1,108,944 | | | 1,108,944 | | | — | | | 1,108,944 | | | — | | | — | |
| Securities held-to-maturity | 750,586 | | | 637,948 | | | — | | | 637,948 | | | — | | | — | |
| Loans receivable, net | 11,063,195 | | | 10,431,355 | | | — | | | — | | | 10,431,355 | | | — | |
| Loans held-for-sale | 76,331 | | | 76,331 | | | — | | | 68,620 | | | 7,711 | | | — | |
| Accrued interest receivable | 46,356 | | | 46,356 | | | 46,356 | | | — | | | — | | | — | |
| Interest rate lock commitments | 342 | | | 342 | | | — | | | — | | | 342 | | | — | |
| Forward commitments | 34 | | | 34 | | | — | | | 34 | | | — | | | — | |
| Foreign exchange swaps | 199 | | | 199 | | | — | | | 199 | | | — | | | — | |
| Interest rate swaps designated as hedging instruments | 1,497 | | | 1,497 | | | — | | | 1,529 | | | — | | | (32) | |
| Interest rate swaps not designated as hedging instruments | 3,493 | | | 3,493 | | | — | | | 37,697 | | | — | | | (34,204) | |
| FHLB stock | 21,006 | | | 21,006 | | | — | | | — | | | — | | | — | |
| | | | | | | | | | | |
| Total financial assets | $ | 13,360,361 | | | 12,615,883 | | | 334,734 | | | 1,854,971 | | | 10,439,408 | | | (34,236) | |
| | | | | | | | | | | |
| Financial liabilities: | | | | | | | | | | | |
| Savings and checking deposits | $ | 9,466,909 | | | 9,466,909 | | | 9,466,909 | | | — | | | — | | | — | |
| Time deposits | 2,677,645 | | | 2,677,070 | | | — | | | — | | | 2,677,070 | | | — | |
| Borrowed funds | 200,331 | | | 196,277 | | | 228,119 | | | — | | | — | | | (31,842) | |
| Subordinated debt | 114,538 | | | 115,982 | | | — | | | 115,982 | | | — | | | — | |
| Junior subordinated debentures | 129,834 | | | 128,122 | | | — | | | — | | | 128,122 | | | — | |
| Foreign exchange swaps | 4 | | | 4 | | | — | | | 4 | | | — | | | — | |
| Interest rate swaps designated as hedging instruments | — | | | — | | | — | | | 32 | | | — | | | (32) | |
| Interest rate swaps not designated as hedging instruments | 35,405 | | | 35,405 | | | — | | | 37,767 | | | — | | | (2,362) | |
| Risk participation agreements | 16 | | | 16 | | | — | | | 16 | | | — | | | — | |
| Accrued interest payable | 6,935 | | | 6,935 | | | 6,935 | | | — | | | — | | | — | |
| Total financial liabilities | $ | 12,631,617 | | | 12,626,720 | | | 9,701,963 | | | 153,801 | | | 2,805,192 | | | (34,236) | |
(1) Amounts represent the impact of legally enforceable master netting agreements that allow the Company to settle positive and negative positions and cash collateral held or placed with the same counterparties.
NORTHWEST BANCSHARES, INC. AND SUBSIDIARIES
NOTES TO CONSOLIDATED FINANCIAL STATEMENTS
December 31, 2024, 2023 and 2022
| | | | | | | | | | | | | | | | | | | | | | | | | | | | | |
| | December 31, 2023 |
| | Carrying amount | | Estimated fair value | | Level 1 | | Level 2 | | Level 3 |
| Financial assets: | | | | | | | | | |
| Cash and cash equivalents | $ | 122,260 | | | 122,260 | | | 122,260 | | | — | | | — | |
| Securities available-for-sale | 1,043,359 | | | 1,043,359 | | | — | | | 1,043,359 | | | — | |
| Securities held-to-maturity | 814,839 | | | 699,506 | | | — | | | 699,506 | | | — | |
| Loans receivable, net | 11,280,798 | | | 10,274,593 | | | — | | | — | | | 10,274,593 | |
| Loans held-for-sale | 8,768 | | | 8,768 | | | — | | | — | | | 8,768 | |
| Accrued interest receivable | 47,353 | | | 47,353 | | | 47,353 | | | — | | | — | |
| Interest rate lock commitments | 641 | | 641 | | — | | | — | | | 641 |
| Forward commitments | 12 | | 12 | | — | | | 12 | | — | |
| Interest rate swaps designated as hedging instruments | 713 | | | 713 | | | — | | | 713 | | | — | |
| Interest rate swaps not designated as hedging instruments | 41,406 | | | 41,406 | | | — | | | 41,406 | | | — | |
| FHLB stock | 30,146 | | | 30,146 | | | — | | | — | | | — | |
| | | | | | | | | |
| Total financial assets | $ | 13,390,295 | | | 12,268,757 | | | 169,613 | | | 1,784,996 | | | 10,284,002 | |
| | | | | | | | | |
| Financial liabilities: | | | | | | | | | |
| Savings and checking accounts | $ | 9,377,021 | | | 9,377,021 | | | 9,377,021 | | | — | | | — | |
| Time deposits | 2,602,881 | | | 2,113,177 | | | — | | | — | | | 2,113,177 | |
| Borrowed funds | 398,895 | | | 386,446 | | | 386,446 | | | — | | | — | |
| Subordinated debt | 114,189 | | | 109,471 | | | — | | | 109,471 | | | — | |
| Junior subordinated debentures | 129,574 | | | 112,159 | | | — | | | — | | | 112,159 | |
| Foreign exchange swaps | 291 | | | 291 | | | — | | | 291 | | | — | |
| Interest rate swaps designated as hedging instruments | 1,198 | | | 1,198 | | | — | | | 1,198 | | | — | |
| Interest rate swaps not designated as hedging instruments | 41,437 | | | 41,437 | | | — | | | 41,437 | | | — | |
| Risk participation agreements | 14 | | | 14 | | | — | | | 14 | | | — | |
| Accrued interest payable | 13,669 | | | 13,669 | | | 13,669 | | | — | | | — | |
| Total financial liabilities | $ | 12,679,169 | | | 12,154,883 | | | 9,777,136 | | | 152,411 | | | 2,225,336 | |
Fair value estimates are made at a point-in-time, based on relevant market data and information about the instrument. The preceding methods and assumptions were used in estimating the fair value of financial instruments at December 31, 2024 and 2023.
NORTHWEST BANCSHARES, INC. AND SUBSIDIARIES
NOTES TO CONSOLIDATED FINANCIAL STATEMENTS
December 31, 2024, 2023 and 2022
The following table represents assets and liabilities measured at fair value on a recurring basis as of December 31, 2024:
| | | | | | | | | | | | | | | | | | | | | | | | | | | | | |
| Level 1 | | Level 2 | | Level 3 | | Netting Adjustments (1) | | Total at
fair value |
| | | | | | | | | |
| | | | | | | | | |
| Debt securities: | | | | | | | | | |
| U.S. government and agencies | $ | — | | | 35,391 | | | — | | | — | | | 35,391 | |
| Government sponsored enterprises | — | | | 118 | | | — | | | — | | | 118 | |
| States and political subdivisions | — | | | 58,627 | | | — | | | — | | | 58,627 | |
| Corporate | — | | | 26,101 | | | — | | | — | | | 26,101 | |
| Total debt securities | — | | | 120,237 | | | — | | | — | | | 120,237 | |
| | | | | | | | | |
| Residential mortgage-backed securities: | | | | | | | | | |
| GNMA | — | | | 50,149 | | | — | | | — | | | 50,149 | |
| FNMA | — | | | 84,212 | | | — | | | — | | | 84,212 | |
| FHLMC | — | | | 89,840 | | | — | | | — | | | 89,840 | |
| Non-agency | — | | | 5 | | | — | | | — | | | 5 | |
| Collateralized mortgage obligations: | | | | | | | | | |
| GNMA | — | | | 562,948 | | | — | | | — | | | 562,948 | |
| FNMA | — | | | 74,395 | | | — | | | — | | | 74,395 | |
| FHLMC | — | | | 127,158 | | | — | | | — | | | 127,158 | |
| | | | | | | | | |
| | | | | | | | | |
| Total mortgage-backed securities | — | | | 988,707 | | | — | | | — | | | 988,707 | |
| | | | | | | | | |
| Interest rate lock commitments | — | | | — | | | 342 | | | — | | | 342 | |
| Forward commitments | — | | | 34 | | | — | | | — | | | 34 | |
| Foreign exchange swaps | — | | | 199 | | | — | | | — | | | 199 | |
| Interest rate swaps designated as hedging instruments | — | | | 1,529 | | | — | | | (32) | | | 1,497 | |
| Interest rate swaps not designated as hedging instruments | — | | | 37,697 | | | — | | | (34,204) | | | 3,493 | |
| Total assets | $ | — | | | 1,148,403 | | | 342 | | | (34,236) | | | 1,114,509 | |
| | | | | | | | | |
| | | | | | | | | |
| Foreign exchange swaps | $ | — | | | 4 | | | — | | | — | | | 4 | |
| Interest rate swaps designated as hedging instruments | — | | | 32 | | | — | | | (32) | | | — | |
| Interest rate swaps not designated as hedging instruments | — | | | 37,767 | | | — | | | (2,362) | | | 35,405 | |
| Risk participation agreements | — | | | 16 | | | — | | | — | | | 16 | |
| Total liabilities | $ | — | | | 37,819 | | | — | | | (2,362) | | | 35,425 | |
(1) Amounts represent the impact of legally enforceable master netting agreements that allow the Company to settle positive and negative positions and cash collateral held or placed with the same counterparties.
NORTHWEST BANCSHARES, INC. AND SUBSIDIARIES
NOTES TO CONSOLIDATED FINANCIAL STATEMENTS
December 31, 2024, 2023 and 2022
The following table represents assets and liabilities measured at fair value on a recurring basis as of December 31, 2023: | | | | | | | | | | | | | | | | | | | | | | | |
| Level 1 | | Level 2 | | Level 3 | | Total at
fair value |
| | | | | | | |
| | | | | | | |
| Debt securities: | | | | | | | |
| U.S. government and agencies | $ | — | | | 58,314 | | | — | | | 58,314 | |
| Government sponsored enterprises | — | | | 40,597 | | | — | | | 40,597 | |
| States and political subdivisions | — | | | 75,469 | | | — | | | 75,469 | |
| Corporate | — | | | 7,688 | | | — | | | 7,688 | |
| Total debt securities | — | | | 182,068 | | | — | | | 182,068 | |
| | | | | | | |
| Residential mortgage-backed securities: | | | | | | | |
| GNMA | — | | | 17,441 | | | — | | | 17,441 | |
| FNMA | — | | | 102,678 | | | — | | | 102,678 | |
| FHLMC | — | | | 70,830 | | | — | | | 70,830 | |
| Non-agency | — | | | 5 | | | — | | | 5 | |
| Collateralized mortgage obligations: | | | | | | | |
| GNMA | — | | | 331,784 | | | — | | | 331,784 | |
| FNMA | — | | | 148,892 | | | — | | | 148,892 | |
| FHLMC | — | | | 189,661 | | | — | | | 189,661 | |
| | | | | | | |
| | | | | | | |
| Total mortgage-backed securities | — | | | 861,291 | | | — | | | 861,291 | |
| | | | | | | |
| Interest rate lock commitments | — | | | — | | | 641 | | | 641 | |
| Forward commitments | — | | | 12 | | | — | | | 12 | |
| | | | | | | |
| Interest rate swaps designated as hedging instruments | — | | | 713 | | | — | | | 713 | |
| Interest rate swaps not designated as hedging instruments | — | | | 41,406 | | | — | | | 41,406 | |
| Total assets | $ | — | | | 1,085,490 | | | 641 | | | 1,086,131 | |
| | | | | | | |
| | | | | | | |
| Foreign exchange swaps | $ | — | | | 291 | | | — | | | 291 | |
| Interest rate swaps designated as hedging instruments | — | | | 1,198 | | | — | | | 1,198 | |
| Interest rate swaps not designated as hedging instruments | — | | | 41,437 | | | — | | | 41,437 | |
| Risk participation agreements | — | | | 14 | | | — | | | 14 | |
| Total liabilities | $ | — | | | 42,940 | | | — | | | 42,940 | |
The following table presents the changes in Level 3 assets and liabilities measured at fair value on a recurring basis for the year ended December 31, 2024 and 2023: | | | | | | | | | | | | | | | |
| | | | Years ended December 31, |
| | | | 2024 | | | | 2023 |
| Beginning balance January 1, | | | $ | 641 | | | | | 559 | |
| | | | | | | |
| | | | | | | |
| | | | | | | |
| | | | | | | |
| | | | | | | |
| Net activity | | | (299) | | | | | 82 | |
| | | | | | | |
| Transfers from Level 3 | | | — | | | | | — | |
| Transfers into of Level 3 | | | — | | | | | — | |
| | | | | | | |
| Ending balance December 31, | | | $ | 342 | | | | | 641 | |
Certain assets and liabilities are measured at fair value on a nonrecurring basis after initial recognition such as loans individually assessed, real estate owned, and MSRs.
NORTHWEST BANCSHARES, INC. AND SUBSIDIARIES
NOTES TO CONSOLIDATED FINANCIAL STATEMENTS
December 31, 2024, 2023 and 2022
The following table represents the fair market measurement for only those nonrecurring assets that had a fair market value below the carrying amount as of December 31, 2024:
| | | | | | | | | | | | | | | | | | | | | | | |
| Level 1 | | Level 2 | | Level 3 | | Total assets
at fair value |
| Loans individually assessed | $ | — | | | — | | | 9,801 | | | 9,801 | |
| Mortgage servicing rights | — | | | — | | | 20 | | | 20 | |
| Real estate owned, net | — | | | — | | | 35 | | | 35 | |
| | | | | | | |
| Total assets | $ | — | | | — | | | 9,856 | | | 9,856 | |
The following table represents the fair market measurement for only those nonrecurring assets that had a fair market value below the carrying amount as of December 31, 2023:
| | | | | | | | | | | | | | | | | | | | | | | |
| Level 1 | | Level 2 | | Level 3 | | Total assets
at fair value |
| Loans individually assessed | $ | — | | | — | | | 36,747 | | | 36,747 | |
| Mortgage servicing rights | — | | | — | | | 133 | | | 133 | |
| Real estate owned, net | — | | | — | | | 104 | | | 104 | |
| | | | | | | |
| Total assets | $ | — | | | — | | | 36,984 | | | 36,984 | |
Individually Assessed Loans — A loan is considered to be individually assessed as described in Note 1(f). We classify loans individually assessed as nonrecurring Level 3.
Mortgage Servicing Rights — Mortgage servicing rights represent the value of servicing residential mortgage loans, when the mortgage loans have been sold into the secondary market and the associated servicing has been retained. The value is determined through a discounted cash flow analysis, which uses interest rates, prepayment speeds and delinquency rate assumptions as inputs. All of these assumptions require a significant degree of management judgment. Servicing rights and the related mortgage loans are segregated into categories or homogeneous pools based upon common characteristics. Adjustments are only made when the estimated discounted future cash flows are less than the carrying value, as determined by individual pool. As such, mortgage servicing rights are classified as nonrecurring Level 3.
Real Estate Owned — Real estate owned is comprised of property acquired through foreclosure or voluntarily conveyed by borrowers. These assets are recorded on the date acquired at the lower of the related loan balance or fair value, less estimated disposition costs, with the fair value being determined by appraisal. Subsequently, foreclosed assets are valued at the lower of the amount recorded at acquisition date or fair value, less estimated disposition costs. We classify real estate owned as nonrecurring Level 3.
The following table presents additional quantitative information about assets measured at fair value on a recurring and nonrecurring basis and for which we have utilized Level 3 inputs to determine fair value at December 31, 2024:
| | | | | | | | | | | | | | | | | | | | | | | |
| | Fair value ($) | | Valuation
techniques | | Significant
unobservable inputs | | Range
(weighted average) |
| Loans individually assessed | 9,801 | | | Appraisal value (1) | | Estimated cost to sell | | 10% |
| | | | | | | |
| Mortgage servicing rights | 20 | | | Discounted cash flow | | Annual service cost | | $88 |
| | | | | Prepayment rate | | 6.5% to 19.8% (11.3%) |
| | | | | Expected life (months) | | 48.9 to 101.3 (69.7) |
| | | | | Option adjusted spread | | 724 basis points |
| | | | | Forward yield curve | | 4.65% to 4.49% |
| | | | | | | |
| Real estate owned, net | 35 | | | Appraisal value (1) | | Estimated cost to sell | | 10% |
| | | | | | | |
| Loans held for sale | 7,711 | | | Quoted prices for similar loans in active markets adjusted by an expected pull-through rate | | Estimated pull-through rate | | 100% |
(1) Fair value is generally determined through independent appraisals of the underlying collateral, which may include Level 3 inputs that are not identifiable, or by using the discounted cash flow method if the loan is not collateral dependent.
NORTHWEST BANCSHARES, INC. AND SUBSIDIARIES
NOTES TO CONSOLIDATED FINANCIAL STATEMENTS
December 31, 2024, 2023 and 2022
(17) Regulatory Capital Requirements
Financial institutions and their holding companies are subject to various regulatory capital requirements. Failure to meet minimum capital requirements can initiate certain mandatory and possibly additional discretionary actions by the regulators that, if undertaken, could have a direct, material effect on a company’s financial statements. Under capital adequacy guidelines and the regulatory framework for prompt corrective action, financial institutions must meet specific capital guidelines that involve quantitative measures of its assets, liabilities and certain off-balance sheet items as calculated under regulatory accounting guidelines. Capital amounts and classifications are also subject to qualitative judgments made by the regulators about components, risk-weighting and other factors.
Applicable rules limit an organization’s capital distributions and certain discretionary bonus payments if the organization does not hold a “capital conservation buffer” consisting of 2.5% of Total, Tier 1 and Common Equity Tier 1 (“CET1”) capital to risk-weighted assets in addition to the amount necessary to meet its minimum risk-based capital requirements.
Quantitative measures established by regulation to ensure capital adequacy, require financial institutions to maintain minimum amounts and ratios (set forth in the table below) of Total, CET1 and Tier 1 capital (as defined in the regulations) to risk-weighted assets (as defined), and of Tier 1 capital to average assets (as defined). As of December 31, 2024 and 2023, we and our banking subsidiary exceeded all capital adequacy requirements to which we were subject and our regulatory capital ratios were above the minimum levels required to be considered “well capitalized” for regulatory purposes. To be considered as “well capitalized,” we and our banking subsidiary must maintain regulatory capital ratios as set forth in the table.
We have elected to phase the estimated impact of CECL into regulatory capital in accordance with the interim final rule of the Federal Reserve Board and other U.S. banking agencies that became effective on March 31, 2020. As a result, we delayed recognizing the estimated impact of CECL on regulatory capital until after a two-year deferral period, which for us extended through December 31, 2021. Beginning on January 1, 2022, we were required to phase in 75% of the previously deferred estimated capital impact of CECL, with 50% to be phased in at the beginning of 2023, and 25% at the beginning of 2024, until fully phased in by the first quarter of 2025. Under the interim final rule, the estimated impact of CECL on regulatory capital that we will defer and later phase in is calculated as the entire day-one impact at adoption plus 25% of the subsequent change in allowance during the two-year deferral period.
The actual, required, and well capitalized levels as of December 31, 2024 and 2023 were as follows: | | | | | | | | | | | | | | | | | | | | | | | | | | | | | | | | | | | |
| | At December 31, 2024 |
| | Actual | | Minimum capital
requirements (1) | | Well capitalized (2)
requirements |
| | Amount | | Ratio | | Amount | | Ratio | | Amount | | Ratio |
| Total capital (to risk weighted assets) | | | | | | | | | | | |
| Northwest Bancshares, Inc. | $ | 1,708,786 | | | 16.078 | % | | $ | 1,115,932 | | | 10.500 | % | | $ | 1,062,793 | | | 10.000 | % |
| Northwest Bank | 1,466,832 | | | 13.814 | % | | 1,114,929 | | | 10.500 | % | | 1,061,837 | | | 10.000 | % |
| | | | | | | | | | | |
| Tier 1 capital (to risk weighted assets) | | | | | | | | | | | |
| Northwest Bancshares, Inc. | 1,468,646 | | | 13.819 | % | | 903,374 | | | 8.500 | % | | 637,676 | | | 6.000 | % |
| Northwest Bank | 1,341,230 | | | 12.631 | % | | 902,561 | | | 8.500 | % | | 849,469 | | | 8.000 | % |
| | | | | | | | | | | |
| CET 1 capital (to risk weighted assets) | | | | | | | | | | | |
| Northwest Bancshares, Inc. | 1,342,801 | | | 12.635 | % | | 743,955 | | | 7.000 | % | | N/A | | N/A |
| Northwest Bank | 1,341,230 | | | 12.631 | % | | 743,286 | | | 7.000 | % | | 690,194 | | | 6.500 | % |
| | | | | | | | | | | |
| Tier 1 capital (leverage to average assets) | | | | | | | | | | | |
| Northwest Bancshares, Inc. | 1,468,646 | | | 10.390 | % | | 565,426 | | | 4.000 | % | | N/A | | N/A |
| Northwest Bank | 1,341,230 | | | 9.496 | % | | 564,937 | | | 4.000 | % | | 706,171 | | | 5.000 | % |
(1) The capital conservation buffer of 2.5% does not apply to Tier 1 capital to average assets (leverage ratio). For further information related to the capital conservation buffer, see “Item 1. Business—Supervision and Regulation”.
(2) Reflects the well-capitalized standard applicable to Northwest Bank and the well-capitalized standard applicable to the Company under the Federal Reserve Board’s Regulation Y.
NORTHWEST BANCSHARES, INC. AND SUBSIDIARIES
NOTES TO CONSOLIDATED FINANCIAL STATEMENTS
December 31, 2024, 2023 and 2022
| | | | | | | | | | | | | | | | | | | | | | | | | | | | | | | | | | | |
| | At December 31, 2023 |
| | Actual | | Minimum capital
requirements (1) | | Well capitalized (2)
requirements |
| | Amount | | Ratio | | Amount | | Ratio | | Amount | | Ratio |
| Total capital (to risk weighted assets) | | | | | | | | | | | |
| Northwest Bancshares, Inc. | $ | 1,799,883 | | | 16.753 | % | | $ | 1,128,054 | | | 10.500 | % | | $ | 1,074,337 | | | 10.000 | % |
| Northwest Bank | 1,520,736 | | | 14.167 | % | | 1,127,076 | | | 10.500 | % | | 1,073,406 | | | 10.000 | % |
| | | | | | | | | | | |
| Tier 1 capital (to risk weighted assets) | | | | | | | | | | | |
| Northwest Bancshares, Inc. | 1,553,766 | | | 14.463 | % | | 913,186 | | | 8.500 | % | | 644,602 | | | 6.000 | % |
| Northwest Bank | 1,388,808 | | | 12.938 | % | | 912,395 | | | 8.500 | % | | 858,725 | | | 8.000 | % |
| | | | | | | | | | | |
| CET 1 capital (to risk weighted assets) | | | | | | | | | | | |
| Northwest Bancshares, Inc. | 1,428,181 | | | 13.294 | % | | 752,036 | | | 7.000 | % | | N/A | | N/A |
| Northwest Bank | 1,388,808 | | | 12.938 | % | | 751,384 | | | 7.000 | % | | 697,714 | | | 6.500 | % |
| | | | | | | | | | | |
| Tier 1 capital (leverage to average assets) | | | | | | | | | | | |
| Northwest Bancshares, Inc. | 1,428,181 | | | 10.841 | % | | 573,290 | | | 4.000 | % | | N/A | | N/A |
| Northwest Bank | 1,388,808 | | | 9.697 | % | | 572,903 | | | 4.000 | % | | 716,128 | | | 5.000 | % |
(1) The 2023 capital conservation buffer of 2.5% does not apply to Tier 1 capital to average assets (leverage ratio). For further information related to the capital conservation buffer, see “Item 1. Business—Supervision and Regulation”.
(2) Reflects the well-capitalized standard applicable to Northwest Bank and the well-capitalized standard applicable to the Company under the Federal Reserve Board’s Regulation Y.
(18) Contingent Liabilities
We and our subsidiaries are subject to a number of asserted and unasserted claims encountered in the normal course of business. Management believes that the aggregate liability, if any, that may result from such potential litigation will not have a material adverse effect on our financial statements. However, we cannot presently determine whether or not any claims against us will have a material adverse effect on our results of operations in any future reporting period.
(19) Legal Proceedings
We establish accruals for legal proceedings when information related to the loss contingencies represented by those matters indicates both that a loss is probable and that the amount of loss can be reasonably estimated. As of December 31, 2024, we do not anticipate that the aggregate ultimate liability arising out of any pending or threatened legal proceedings will be material to our Consolidated Financial Statements. Any such accruals are adjusted thereafter as appropriate to reflect changes in circumstances. Due to the inherent subjectivity of assessments and unpredictability of outcomes of legal proceedings, any amounts accrued may not represent the ultimate loss to us from legal proceedings.
(20) Components of Accumulated Other Comprehensive Income
The following table sets forth the components of accumulated other comprehensive loss as of December 31, 2024 and 2023:
| | | | | | | | | | | |
| | December 31, |
| | 2024 | | 2023 |
| Unrealized loss on marketable securities available-for-sale | $ | (130,248) | | | (150,659) | |
| Fair value of interest rate swaps | 1,159 | | | (374) | |
| Defined benefit pension plans | 18,175 | | | 1,541 | |
| Accumulated other comprehensive loss | $ | (110,914) | | | (149,492) | |
NORTHWEST BANCSHARES, INC. AND SUBSIDIARIES
NOTES TO CONSOLIDATED FINANCIAL STATEMENTS
December 31, 2024, 2023 and 2022
The following table shows the changes in accumulated other comprehensive loss by component for the year ended December 31, 2024: | | | | | | | | | | | | | | | | | | | | | | | |
| | Unrealized gains and losses on securities
available-for-sale | | Change in fair value of interest rate swaps | | Change in defined
benefit pension plans | | Total |
| Balance as of January 1, | $ | (150,659) | | | (374) | | | 1,541 | | | (149,492) | |
| | | | | | | |
| Other comprehensive income/(loss) before reclassification adjustments (1) (2) (3) | (6,378) | | | 1,533 | | | 18,187 | | | 13,342 | |
| Amounts reclassified from accumulated other comprehensive income (4) (5) | 26,789 | | | — | | | (1,553) | | | 25,236 | |
| Net other comprehensive income/(loss) | 20,411 | | | 1,533 | | | 16,634 | | | 38,578 | |
| Balance as of December 31, | $ | (130,248) | | | 1,159 | | | 18,175 | | | (110,914) | |
(1)Consists of unrealized holding gains, net of tax of $1,193.
(2)Change in fair value of interest rate swaps, net of tax of $(448).
(3)Consists of unrealized gains, net of tax of $(6,895).
(4)Consists of realized losses, net of tax of $(7,706).
(5)Consists of realized gains, net of tax of $591.
The following table shows the changes in accumulated other comprehensive loss by component for the year ended December 31, 2023: | | | | | | | | | | | | | | | | | | | | | | | |
| | Unrealized gains and losses on securities available-for-sale | | Change in fair value of interest rate swaps | | Change in
defined benefit pension plans | | Total |
| Balance as of January 1, | $ | (164,206) | | | — | | | (6,952) | | | (171,158) | |
| | | | | | | |
| Other comprehensive (loss)/income before reclassification adjustments (1) (2) (3) | 7,875 | | | (374) | | | 10,019 | | | 17,520 | |
| Amounts reclassified from accumulated other comprehensive income (4) (5) | 5,672 | | | — | | | (1,526) | | | 4,146 | |
| Net other comprehensive (loss)/income | 13,547 | | | (374) | | | 8,493 | | | 21,666 | |
| Balance as of December 31, | $ | (150,659) | | | (374) | | | 1,541 | | | (149,492) | |
(1)Consists of unrealized holding gains, net of tax of $(3,429).
(2)Change in fair value of interest rate swaps, net of tax of $110.
(3)Consists of unrealized gains, net of tax of $(3,961).
(4)Consists of realized losses, net of tax of $(1,700).
(5)Consists of realized gains, net of tax of $607.
The following table shows the changes in accumulated other comprehensive loss by component for the year ended December 31, 2022: | | | | | | | | | | | | | | | | | | | |
| | Unrealized gains and losses on securities
available-for-sale | | | | Change in
defined benefit pension plans | | Total |
| Balance as of January 1, | $ | (12,317) | | | | | (25,312) | | | (37,629) | |
| | | | | | | |
| Other comprehensive (loss)/income before reclassification adjustments (1) (2) | (151,888) | | | | | 18,884 | | | (133,004) | |
| Amounts reclassified from accumulated other comprehensive income (3) (4) | (1) | | | | | (524) | | | (525) | |
| Net other comprehensive (loss)/income | (151,889) | | | | | 18,360 | | | (133,529) | |
| Balance as of December 31, | $ | (164,206) | | | | | (6,952) | | | (171,158) | |
(1)Consists of unrealized holding losses, net of tax of $45,321.
(2)Consists of unrealized gains, net of tax of $(7,182).
(3)Consists of realized gains, net of tax of $0.
(4)Consists of realized gains, net of tax of $202.
(21) Segment Information
The Company’s reportable segment is determined by the Chief Executive Officer, who is the designated chief operating decision maker, based upon information provided about the Company’s products and services offered, primarily banking operations. Our one operating segment, Banking, is also distinguished by the level of information provided to the chief operating decision maker, who uses such information to review performance of the various components of the business such as branches and lending, which are then aggregated because operating performance, products/services and customers are similar. The chief operating decision maker will evaluate the financial performance of the Company’s business components such as by evaluating revenue streams, significant
NORTHWEST BANCSHARES, INC. AND SUBSIDIARIES
NOTES TO CONSOLIDATED FINANCIAL STATEMENTS
December 31, 2024, 2023 and 2022
expenses and budget to actual results in assessing the Company’s segment and in the determination of allocating resources. The information reviewed is on a consolidated basis and discrete financial information is not available. The chief operating decision maker uses revenue streams to evaluate product pricing and significant expenses to assess performance and evaluate return on assets. The chief operating decision maker uses consolidated net income through return on average assets and return on average equity and the efficiency ratio, as well as loan growth to benchmark the Company against its competitors. The benchmarking analysis coupled with monitoring of budget to actual results are used in assessment performance and in establishing compensation. Loans, investments, and deposits provide the revenues in the banking operation. Interest expense, provisions for credits losses and payroll provide the significant expenses in the banking operating. All operations are domestic.
Accounting policies for segment are the same as those described in Note 1. Segment performance is evaluated using consolidated net income. Information reported internally for performance assessment by the chief operating decision maker follows, inclusive of reconciliations of significant segment totals to the financial statements:
| | | | | | | | | | | | | | | | | |
| Banking Segment |
| | Years ended December 31, |
| | 2024 | | 2023 | | 2022 |
| | | | | |
| Interest income | $ | 669,196 | | | 587,922 | | | 448,798 | |
| Reconciliation of revenue | | | | | |
| Service charges and fees | 62,957 | | | 59,214 | | | 55,188 | |
| Trust and other financial services income | 30,102 | | | 27,284 | | | 27,765 | |
| Loss on sale of investments | (39,413) | | | (8,307) | | | (8) | |
Other revenue (1) | 33,364 | | | 35,632 | | | 27,904 | |
| Consolidated revenues | $ | 756,206 | | | 701,745 | | | 559,647 | |
| | | | | |
| Less: | | | | | |
| Interest expense | 233,618 | | | 152,239 | | | 28,117 | |
| Segment net interest income and noninterest income | $ | 522,588 | | | 549,506 | | | 531,530 | |
| Less: | | | | | |
| Provision for credit losses | 24,505 | | | 22,874 | | | 28,315 | |
| Compensation and employee benefits | 214,455 | | | 195,691 | | | 188,359 | |
| Processing expenses | 59,351 | | | 58,687 | | | 52,496 | |
| Premises and occupancy costs | 29,469 | | | 29,151 | | | 29,618 | |
| Professional services | 14,883 | | | 17,819 | | | 14,703 | |
| Office operations | 12,433 | | | 12,955 | | | 13,318 | |
| Federal deposit insurance premiums | 11,600 | | | 9,271 | | | 4,778 | |
| Other segment items (2) | 26,346 | | | 27,980 | | | 26,251 | |
| Income tax expense | 29,268 | | | 40,121 | | | 40,026 | |
| Segment net income/consolidated net income | $ | 100,278 | | | 134,957 | | | 133,666 | |
(1) Other revenues include loan sales, gain on real estate owned, income from bank owned life insurance and other operating income.
(2) Other segment items include expenses for collections, marketing, amortization of intangibles, real estate owned, merger, asset disposition and restructuring and other operating expense.
| | | | | | | | | | | | | | | | | |
| Banking Segment |
| | Years ended December 31, |
| | 2024 | | 2023 | | 2022 |
| | | | | |
| Other segment disclosures | | | | | |
| Interest income | $ | 669,196 | | | 587,922 | | | 448,798 | |
| Interest expense | 233,618 | | | 152,239 | | | 28,117 | |
| Depreciation | 11,259 | | | 11,492 | | | 11,602 | |
| Amortization | 2,452 | | | 3,270 | | | 4,277 | |
| Other significant noncash items: | | | | | |
| Provision for credit losses | 24,505 | | | 22,874 | | | 28,315 | |
| Segment assets | 14,408,224 | | | 14,419,105 | | | 14,113,324 | |
| Expenditures for segment assets | 4,618 | | | 2,275 | | | 5,863 | |
NORTHWEST BANCSHARES, INC. AND SUBSIDIARIES
NOTES TO CONSOLIDATED FINANCIAL STATEMENTS
December 31, 2024, 2023 and 2022
(22) Parent Company Only Financial Statements - Condensed
Statements of Financial Condition | | | | | | | | | | | |
| | December 31, |
| | 2024 | | 2023 |
| Assets | | | |
| Cash and cash equivalents | $ | 238,966 | | | 276,026 | |
| | | |
| Investment in bank subsidiary | 1,627,392 | | | 1,588,711 | |
| Other assets | 9,397 | | | 9,405 | |
| Total assets | $ | 1,875,755 | | | 1,874,142 | |
| | | |
| Liabilities and shareholders’ equity | | | |
| Liabilities: | | | |
| Debentures payable | $ | 244,372 | | | 243,763 | |
| Other liabilities | 2,427 | | | 2,302 | |
| Total liabilities | 246,799 | | | 246,065 | |
| Shareholders’ equity | 1,628,956 | | | 1,628,077 | |
| Total liabilities and shareholders’ equity | $ | 1,875,755 | | | 1,874,142 | |
Statements of Income | | | | | | | | | | | | | | | | | |
| | Years ended December 31, |
| | 2024 | | 2023 | | 2022 |
| Income: | | | | | |
| Interest income | $ | 185 | | | 187 | | | 140 | |
| Other income | 737 | | | 729 | | | 805 | |
| Dividends from bank subsidiary | 75,000 | | | 215,000 | | | 161,000 | |
| Undistributed earnings from equity investment in bank subsidiary | 38,694 | | | (67,106) | | | (18,187) | |
| Total income | 114,616 | | | 148,810 | | | 143,758 | |
| Expense: | | | | | |
| Compensation and employee benefits | 1,972 | | | 1,906 | | | 1,656 | |
| Other expenses | 1,339 | | | 1,044 | | | 1,042 | |
| Interest expense | 14,593 | | | 14,342 | | | 9,825 | |
| Total expense | 17,904 | | | 17,292 | | | 12,523 | |
| Income before income taxes | 96,712 | | | 131,518 | | | 131,235 | |
| Income tax benefit | (3,566) | | | (3,439) | | | (2,431) | |
| Net income | $ | 100,278 | | | 134,957 | | | 133,666 | |
NORTHWEST BANCSHARES, INC. AND SUBSIDIARIES
NOTES TO CONSOLIDATED FINANCIAL STATEMENTS
December 31, 2024, 2023 and 2022
Statements of Cash Flows | | | | | | | | | | | | | | | | | |
| | Years ended December 31, |
| | 2024 | | 2023 | | 2022 |
| Operating activities: | | | | | |
| Net income | $ | 100,278 | | | 134,957 | | | 133,666 | |
| Adjustments to reconcile net income to net cash provided by operating activities: | | | | | |
| Undistributed earnings of subsidiary | (38,694) | | | 67,106 | | | 18,187 | |
| | | | | |
| | | | | |
| Net change in other assets and liabilities | 757 | | | 900 | | | (9,457) | |
| Net cash provided by operating activities | 62,341 | | | 202,963 | | | 142,396 | |
| | | | | |
| Investing activities: | | | | | |
| | | | | |
| | | | | |
| Net cash used in investing activities | — | | | — | | | — | |
| | | | | |
| Financing activities: | | | | | |
| Cash dividends paid on common stock | (101,854) | | | (101,669) | | | (101,468) | |
| Repurchase of Northwest stock | — | | | — | | | — | |
| | | | | |
| | | | | |
| | | | | |
| Proceeds from stock options exercised | 2,453 | | | 630 | | | 5,173 | |
| Net cash used in financing activities | (99,401) | | | (101,039) | | | (96,295) | |
| Net (decrease)/increase in cash and cash equivalents | $ | (37,060) | | | 101,924 | | | 46,101 | |
| | | | | |
| Cash and cash equivalents at beginning of period | $ | 276,026 | | | 174,102 | | | 128,001 | |
| Net (decrease)/increase in cash and cash equivalents | (37,060) | | | 101,924 | | | 46,101 | |
| Cash and cash equivalents at end of period | $ | 238,966 | | | 276,026 | | | 174,102 | |
NORTHWEST BANCSHARES, INC. AND SUBSIDIARIES
NOTES TO CONSOLIDATED FINANCIAL STATEMENTS
December 31, 2024, 2023 and 2022
(23) Derivative Financial Instruments
We are a party to derivative financial instruments in the normal course of business to manage our own exposure to fluctuations in interest rates and to meet the needs of our customers. The primary derivatives that we use are interest rate swaps and caps and foreign exchange contracts, which are entered into with counterparties that meet established credit standards. We believe that the credit risk inherent in all of our derivative contracts is minimal based on our credit standards and the netting and collateral provisions of the interest rate swap agreements.
Derivatives Designated as Hedging Instruments
As of December 31, 2024, the Company had entered into seven separate pay-fixed interest rate swaps in order to synthetically convert short-term three month FHLB advances to fixed-rate term funding with an aggregate value of $175 million with maturities ranging from three to five years. Our risk management objective and strategy for these interest rate swaps at such time was to reduce our exposure to variability in interest-related cash outflows attributable to changes in the USD-SOFR swap rate, the designated benchmark interest rate being hedged. Based upon our contemporaneous quantitative analysis at the inception of each interest rate swap, we have determined these interest rate swaps qualify for hedge accounting in accordance with ASC 815, Derivatives and Hedging. Our cash flow hedges are recorded within other assets on the Consolidated Statement of Financial Condition at their estimated fair value.
As long as the hedge remains highly effective, the changes in the fair value of derivatives designated, and that qualify, as cash flow hedges are recorded in accumulated other comprehensive income and are subsequently reclassified into earnings in the period that the hedged forecasted transaction affects earnings. A hedging relationship that is determined to not be highly effective no longer qualifies for hedge accounting and any gain or loss is recognized immediately into earnings. Amounts reclassified into earnings are included in interest expense in the Consolidated Statement of Income.
Derivatives Not Designated as Hedging Instruments
We act as an interest rate or foreign exchange swap counterparty for certain commercial borrowers in the normal course of servicing our customers, which are accounted for at fair value. We manage our exposure to such interest rate or foreign exchange swaps by entering into corresponding and offsetting interest rate swaps with third parties that mirror the terms of the swaps we have with the commercial borrowers. These positions (referred to as “customer swaps”) directly offset each other and our exposure is the fair value of the derivatives due to changes in credit risk of our commercial borrowers and third parties. Customer swaps are recorded within other assets or other liabilities on the Consolidated Statement of Financial Condition at their estimated fair value. Changes to the fair value of assets and liabilities arising from these derivatives are included, net, in other operating income in the Consolidated Statement of Income.
We enter into interest rate lock commitments for residential mortgage loans which commit us to lend funds to a potential borrower at a specific interest rate within a specified period of time. Interest rate lock commitments that relate to the origination of mortgage loans that will be held-for-sale are considered derivative financial instruments under applicable accounting guidance. Interest rate lock commitments on loans held-for-sale are carried at fair value in other assets on the Consolidated Statement of Financial Condition. Northwest sells loans to the secondary market on a mandatory or best efforts basis. The loans sold on a mandatory basis commit us to deliver a specific principal amount of mortgage loans to an investor at a specified price, by a specified date, or the commitment must be paired off. These forward commitments entered into on a mandatory delivery basis meet the definition of a derivative financial instrument. All closed loans to be sold on a mandatory delivery basis are classified as held-for-sale on the Consolidated Statement of Financial Condition. Changes to the fair value of the interest rate lock commitments and the forward commitments are recorded in mortgage banking income in the Consolidated Statements of Income.
We enter into risk participation agreements with financial institution counterparties for interest rate swaps related to loans in which we are a participant. The risk participation agreements provide credit protection to the financial institution should the borrower fail to perform on its interest rate derivative contract with the financial institution. These risk participation agreements are recorded within other liabilities on the Consolidated Statement of Financial Condition at their estimated fair value. Changes to the fair value of the risk participation agreements are included in other operating income in the Consolidated Statement of Income.
NORTHWEST BANCSHARES, INC. AND SUBSIDIARIES
NOTES TO CONSOLIDATED FINANCIAL STATEMENTS
December 31, 2024, 2023 and 2022
The following table presents information regarding our derivative financial instruments at the dates indicated. Amounts in the table below are presented gross without the impact of any net collateral agreements (in thousands):
| | | | | | | | | | | | | | | | | | | | | | | | | | |
| | | Asset derivatives | | Liability derivatives |
| | Notional amount | | Fair value | | Notional amount | | Fair value |
| At December 31, 2024 | | | | | | | | |
| Derivatives designated as hedging instruments: | | | | | | | | |
| Interest rate swap agreements | | $ | 125,000 | | | 1,529 | | | 50,000 | | | 32 | |
| Derivatives not designated as hedging instruments: | | | | | | | | |
| Interest rate swap agreements | | 780,177 | | | 37,697 | | | 780,177 | | | 37,767 | |
| Foreign exchange swap agreements | | 5,724 | | | 199 | | | 2,690 | | | 4 | |
| Interest rate lock commitments | | 17,426 | | | 342 | | | — | | | — | |
| Forward commitments | | 1,509 | | | 34 | | | — | | | — | |
| Risk participation agreements | | — | | | — | | | 129,439 | | | 16 | |
| Total derivatives | | $ | 929,836 | | | 39,801 | | | 962,306 | | | 37,819 | |
| | | | | | | | |
| At December 31, 2023 | | | | | | | | |
| Derivatives designated as hedging instruments: | | | | | | | | |
| Interest rate swap agreements | | $ | 75,000 | | | 713 | | | 100,000 | | | 1,198 | |
| Derivatives not designated as hedging instruments: | | | | | | | | |
| Interest rate swap agreements | | 725,139 | | | 41,406 | | | 725,139 | | | 41,437 | |
| Foreign exchange swap agreements | | — | | | — | | | 12,278 | | | 291 | |
| Interest rate lock commitments | | 21,857 | | | 641 | | | — | | | — | |
| Forward commitments | | 281 | | 12 | | | — | | | — | |
| Risk participation agreements | | — | | | — | | | 101,727 | | | 14 | |
| Total derivatives | | $ | 822,277 | | | 42,772 | | | 939,144 | | | 42,940 | |
The following table presents income or expenses recognized on derivatives for the periods indicated (in thousands):
| | | | | | | | | | | | | | | | | | | | |
| | For the years ended December 31, |
| | 2024 | | 2023 | | 2022 |
| Hedging derivatives: | | | | | | |
| Decrease in interest expense | | $ | 2,659 | | | 1,573 | | | — | |
| | | | | | |
| Non-hedging swap derivatives: | | | | | | |
| Increase/(decrease) in other income | | 444 | | | (613) | | | (83) | |
| (Decrease)/increase in mortgage banking income | | (277) | | | (34) | | | 1,368 | |
| | | | | | |
The following table presents information regarding our derivative financial instruments designated as hedging for the year ended December 31, 2024 (dollars in thousands):
| | | | | | | | | | | | | | | | | | | | | | | | | | | | | |
| Notional amount | | Effective rate | | Estimated decrease to interest expense
in the next
twelve months | | Maturity date | | Remaining term
(in months) |
| Interest rate products: | | | | | | | | | |
| Issued May 11, 2023 | $ | 25,000 | | | 3.46 | % | | $ | (334) | | | 5/11/2027 | | 28 |
| Issued May 12, 2023 | 25,000 | | | 3.50 | % | | (322) | | | 5/12/2028 | | 40 |
| Issued May 19, 2023 | 25,000 | | | 3.78 | % | | (248) | | | 11/19/2027 | | 35 |
| Issued May 31, 2023 | 25,000 | | | 4.04 | % | | (194) | | | 11/30/2026 | | 23 |
| Issued July 26, 2023 | 25,000 | | | 4.18 | % | | (150) | | | 7/26/2028 | | 43 |
| Issued July 31, 2023 | 25,000 | | | 4.29 | % | | (128) | | | 1/31/2028 | | 37 |
| Issued August 9, 2023 | 25,000 | | | 4.27 | % | | (133) | | | 8/9/2027 | | 31 |
| Total | $ | 175,000 | | | | | $ | (1,509) | | | | | |
NORTHWEST BANCSHARES, INC. AND SUBSIDIARIES
NOTES TO CONSOLIDATED FINANCIAL STATEMENTS
December 31, 2024, 2023 and 2022
Our derivatives are presented on a net basis taking into consideration the effects of legally enforceable master netting agreements. Additionally, collateral exchanged with counterparties is also netted against the applicable derivative fair values. We enter into derivative transactions with two primary groups, banks and our customers. Different methods are utilized for managing counterparty credit exposure and credit risk for each of these groups.
The following tables present the gross amounts of these assets and liabilities with any offsets to arrive at the net amounts recognized in the Consolidated Statements of Financial Condition as of December 31, 2024 (1) (dollars in thousands).
| | | | | | | | | | | | | | | | | | | | |
| Derivative assets | | Gross amounts of
recognized assets | | Gross amounts offset in
the consolidated statement
of financial condition | | Net amounts of
assets presented in the consolidated of condition |
| Interest rate swaps - hedging | | $ | 1,529 | | | (32) | | | 1,497 | |
| Interest rate swaps - not hedging | | 37,697 | | | (34,204) | | | 3,493 | |
| | | | | | |
| Derivative liabilities | | Gross amounts of
recognized liabilities | | Gross amounts offset in
the consolidated statement
of financial condition | | Net amounts of
liabilities presented in
the consolidated of condition |
| Interest rate swaps - hedging | | $ | 32 | | | (32) | | | — | |
| Interest rate swaps - not hedging | | 37,767 | | | (2,362) | | | 35,405 | |
| | | | | | |
(1) Amounts were not meaningful in 2023.
ITEM 9. CHANGES IN AND DISAGREEMENTS WITH ACCOUNTANTS ON ACCOUNTING AND FINANCIAL DISCLOSURE
Not applicable.
ITEM 9A. CONTROLS AND PROCEDURES
Under the supervision and with the participation of our management, including our principal executive officer and principal financial officer, we evaluated the effectiveness of the design and operation of our disclosure controls and procedures (as defined in Rule 13a-15(e) and 15d-15(e) under the Exchange Act) as of the end of the period covered by this report. Based upon that evaluation, the principal executive officer and principal financial officer concluded that, as of the end of the period covered by this report, our disclosure controls and procedures were effective.
There were no changes made in our internal controls during the quarter ended December 31, 2024 that have materially affected, or are reasonably likely to materially affect, the Company’s internal control over financial reporting.
See Management’s Report On Internal Control Over Financial Reporting - filed herewith under Part II, Item 8. “Financial Statements and Supplementary Data”.
ITEM 9B. OTHER INFORMATION
During the three months ended December 31, 2024, no directors or officers of the Company, as defined in Section 16 of the Exchange Act, adopted. modified or terminated any “Rule 10b5-1 trading arrangements” or “non-Rule 10b5-1 trading arrangements,” as each term is defined in Item 408(a) of Regulation S-K of the Exchange Act.
ITEM 9C. DISCLOSURE REGARDING FOREIGN JURISDICTIONS THAT PREVENT INSPECTIONS
Not applicable.
PART III
ITEM 10. DIRECTORS, EXECUTIVE OFFICERS AND CORPORATE GOVERNANCE
A copy of the Code of Ethics is available to shareholders on the “Governance Documents” portion of the Investor Relations’ section on the Company’s website at www.northwest.com. Information contained on our website is not deemed part of or incorporated by reference into this annual report on Form 10-K or any other report filed with the SEC.
The Company maintains insider trading policies and procedures governing the purchase, sale, and/or other dispositions of the Company’s securities by directors, officers, and employees that the Company believes are reasonably designed to promote compliance with insider trading laws, rules, and regulations, as well as Nasdaq listing standards. In addition, it is the Company’s policy to comply with applicable securities and state laws, including insider trading laws, when engaging in transactions in the Company’s securities. A copy of our insider trading policy is filed as Exhibit 19 to this annual report on Form 10-K.
Except for the information relating to our Code of Ethics and insider trading policies and procedures set forth in the two preceding paragraphs, we incorporate by reference the information responsive to this Item appearing in our definitive proxy statement for our 2025 Annual Meeting of Stockholders (the “2025 Proxy Statement”), which will be filed no later than 120 days after December 31, 2024.
ITEM 11. EXECUTIVE COMPENSATION
We incorporate by reference the information responsive to this Item appearing in our 2025 Proxy Statement, which will be filed no later than 120 days after December 31, 2024.
ITEM 12. SECURITY OWNERSHIP OF CERTAIN BENEFICIAL OWNERS AND MANAGEMENT AND RELATED STOCKHOLDER MATTERS
We incorporate by reference the additional information responsive to this Item appearing in our 2025 Proxy Statement, which will be filed no later than 120 days after December 31, 2024.
The Company does not have any equity compensation program that was not approved by stockholders.
Set forth below is certain information as of December 31, 2024 regarding equity compensation plans that have been approved by stockholders. | | | | | | | | | | | | | | | | | | | | |
| Equity compensation plans approved by stockholders | | Number of securities to be issued upon exercise of outstanding options,
warrants and rights | | Weighted average exercise price of outstanding options, warrants and right (1) | | Number of securities
remaining available for
issuance under plan |
| | | | | | |
| | | | | | |
| | | | | | |
| Northwest Bancshares, Inc. 2011 Equity Incentive Plan | | 871,289 | | | 14.52 | | | — | |
| Northwest Bancshares, Inc. 2018 Equity Incentive Plan | | 1,734,578 | | | 14.67 | | | — | |
| Northwest Bancshares, Inc. 2022 Equity Incentive Plan | | — | | | — | | | 1,079,102 | |
| Total | | 2,605,867 | | | 15.28 | | | 1,079,102 | |
(1)Reflects exercise price of options only.
ITEM 13. CERTAIN RELATIONSHIPS AND RELATED TRANSACTIONS, AND DIRECTOR INDEPENDENCE
We incorporate by reference the additional information responsive to this Item appearing in our 2025 Proxy Statement, which will be filed no later than 120 days after December 31, 2024.
ITEM 14. PRINCIPAL ACCOUNTANT FEES AND SERVICES
Our independent registered public accounting firm is KPMG LLP, Pittsburgh, PA, Auditor Firm ID: 185.
We incorporate by reference the additional information responsive to this Item appearing in our 2025 Proxy Statement, which will be filed no later than 120 days after December 31, 2024.
PART IV
ITEM 15. EXHIBITS AND FINANCIAL STATEMENT SCHEDULES
(a)(1) Financial Statements
The following documents are filed as part of this Form 10-K.
(A)Management’s Report on Internal Control Over Financial Reporting
(B)Report of Independent Registered Public Accounting Firm on Internal Control Over Financial Reporting
(C)Report of Independent Registered Public Accounting Firm
(D)Consolidated Statements of Financial Condition at December 31, 2024 and 2023
(E)Consolidated Statements of Income for the Years ended December 31, 2024, 2023 and 2022
(F)Consolidated Statements of Comprehensive Income for the Years ended December 31, 2024, 2023 and 2022
(G)Consolidated Statements of Changes in Shareholders’ Equity for the Years ended December 31, 2024, 2023 and 2022
(H)Consolidated Statements of Cash Flows for the Years ended December 31, 2024, 2023 and 2022
(I)Notes to the Consolidated Financial Statements
(a)(2) Financial Statement Schedules
None.
(a)(3) Exhibits
| | | | | | | | | | | | | | |
Regulation S-K
exhibit number | | Document | | Reference to prior filing
or exhibit number attached hereto |
| | | | |
| | Agreement and Plan of Merger by and between Northwest Bancshares, Inc. and Penns Woods Bancorp, Inc. dated December 16, 2024. * | | Incorporated by reference to the Current Report on
Form 8-K (File No. 001-34582), filed with the SEC on December 20, 2024. |
| | | | | |
| | Articles of Incorporation. | | Incorporated by reference to the Company’s Registration Statement on Form S-1 (File No. 333-161805), filed with the SEC on September 9, 2009. |
| | | | |
| | Articles of Amendment to Articles of Incorporation. | | Incorporated by reference to the Company’s Registration Statement on Form S-1 (File No. 333-161805), filed with the SEC on September 9, 2009. |
| | | | | |
| | Amended and Restated Bylaws of Northwest
Bancshares, Inc. | | Filed herewith as Exhibit 3.3. |
| | | | |
| | Form of Common Stock Certificate. | | Incorporated by reference to the Company’s Registration Statement on Form S-1 (File No. 333-161805), filed with the SEC on September 9, 2009. |
| | | | | |
| | Description of Registrant’s Securities.
Certain instruments defining the rights of holders of long-term obligation of the Registrant (the total amount of securities authorized under each of which does not exceed ten percent of the total assets of the registrant and its subsidiaries on a consolidated basis) are omitted pursuant to Item 601(b)(4)(iii)(A) of Regulation S-K. We agree to furnish copies of any such instruments to the Securities and Exchange Commission upon request. | | Filed herewith as Exhibit 4.2. |
| | | | |
| | Amendment and Restatement of Deferred Compensation Plan for Outside Directors Of Northwest Savings Bank and Eligible Affiliates. | | Incorporated by reference to the Company’s Annual Report on Form 10-K (File No. 000-23817), filed with the SEC on March 4, 2009. |
| | | | | |
| | Retirement Plan for Outside Directors of Northwest Savings Bank and Eligible Affiliates. | | Incorporated by reference to the Company’s Annual Report on Form 10-K (File No. 000-23817), filed with the SEC on March 4, 2009. |
| | | | | |
| | Amended and Restated Northwest Savings Bank Nonqualified Supplemental Retirement Plan. | | Incorporated by reference to the Company’s Annual Report on Form 10-K (File No. 000-23817), filed with the SEC on March 4, 2009. |
| | | | | |
| | Northwest Bank Annual Performance Award Plan. | | Incorporated by reference to the Current Report on Form 8-K (File No. 001-34582), filed with the SEC on April 22, 2022. |
| | | | | |
| | Amended and Restated Northwest Savings Bank and Affiliates Upper Managers Bonus Deferred Compensation Plan. | | Incorporated by reference to the Company’s Annual Report on Form 10-K (File No. 000-23817), filed with the SEC on March 4, 2009. |
| | | | | |
| | Employment Agreement for John J. Golding. | | Incorporated by reference to the Current Report on Form 8-K (File No. 001-34582), filed with the SEC on April 10, 2020. |
| | | | | | | | | | | | | | |
| | | | | |
| | Northwest Bancshares, Inc. 2011 Equity Incentive Plan. | | Incorporated by reference to the Appendix A to the Definitive Proxy Statement for the 2011 Annual Meeting of Shareholders (File no. 001-34582), filed with the SEC on March 1, 2011. |
| | | | | | | | | | | | | | |
| | Northwest Bancshares, Inc. 2018 Equity Incentive Plan. | | Incorporated by reference to Appendix A to the Definitive Proxy Statement for the 2018 Annual Meeting of Shareholders (File no. 001-34582), filed with the SEC on March 7, 2018. |
| | | | |
| | Northwest Bancshares, Inc. 2022 Equity Incentive Plan. | | Incorporated by reference to Appendix A to the Definitive Proxy Statement for the 2022 Annual Meeting of Shareholders (File no. 001-34582), filed with the SEC on March 10, 2022. |
| | | | |
| | Form of Non-Qualified Stock Option Award Agreement under the 2018 Equity Incentive Plan. | | Incorporated by reference to the Company’s Annual Report on Form 10-K (File No. 001-34582), filed with the SEC on March 01, 2019. |
| | | | |
| | Form of Incentive Stock Option Award Agreement under the 2018 Equity Incentive Plan. | | Incorporated by reference to the Company’s Annual Report on Form 10-K (File No. 001-34582), filed with the SEC on March 01, 2019. |
| | | | |
| | Form of Restricted Stock Award Agreement under the
2018 Equity Incentive Plan. | | Incorporated by reference to the Company’s Annual Report on Form 10-K (File No. 001-34582), filed with the SEC on March 01, 2019. |
| | | | |
| | Form of Restricted Stock Unit Award Agreement under the 2022 Equity Incentive Plan. | | Incorporated by reference to the Company’s Registration Statement on Form S-8 (File No. 333-265056), filed with the SEC on May 18, 2022. |
| | | | |
| | Form of Performance Stock Unit Award Agreement under the 2022 Equity Incentive Plan. | | Incorporated by reference to the Company’s Registration Statement on Form S-8 (File No. 333-265056), filed with the SEC on May 18, 2022. |
| | | | |
| | Form of Restricted Stock Award Agreement under the 2022 Equity Incentive Plan. | | Incorporated by reference to the Company’s Registration Statement on Form S-8 (File No. 333-265056), filed with the SEC on May 18, 2022. |
| | | | |
| | Amended and Restated Employment Agreement by and between Northwest Bank, Northwest Bancshares, Inc. and Louis J. Torchio. | | Filed herewith as Exhibit 10.16. |
| | | | |
| | Employment Agreement by and between Northwest Bank, Northwest Bancshares, Inc. and William W. Harvey Jr. | | Incorporated by reference to the Current Report on Form 8-K (File No. 001-34582), filed with the SEC on August 18, 2022. |
| | | | | |
| | Northwest Bank and Northwest Bancshares, Inc.
Change in Control Agreement for Scott J. Watson. | | Incorporated by reference to the Company’s Annual Report on Form 10-K (File No. 001-34582), filed with the SEC on February 23, 2024. |
| | | | |
| | Northwest Bank and Northwest Bancshares, Inc.
Change in Control Agreement for Greg J. Betchkal. | | Incorporated by reference to the Company’s Annual Report on Form 10-K (File No. 001-34582), filed with the SEC on February 23, 2024. |
| | | | |
| | Northwest Bank and Northwest Bancshares, Inc.
Change in Control Agreement for John J. Golding. | | Incorporated by reference to the Company’s Annual Report on Form 10-K (File No. 001-34582), filed with the SEC on March 2, 2020. |
| | | | |
| | Northwest Bank and Northwest Bancshares, Inc.
Change in Control Agreement for Jacques M. DesMarteau. | | Filed herewith as Exhibit 10.21. |
| | | | |
| | | | | | | | | | | | | | |
| | Retirement Agreement by and between
William W. Harvey, Jr., Northwest Bancshares, Inc.
and Northwest Bank. | | Incorporated by reference to the Current Report on Form 8-K (File No. 001-34582), filed with the SEC on September 21, 2023. |
| | | | |
| | Independent Contractor Consulting Agreement by
and between William W. Harvey, Jr., Northwest Bancshares, Inc. and Northwest Bank. | | Incorporated by reference to the Current Report on Form 8-K (File No. 001-34582), filed with the SEC on September 21, 2023. |
| | | | |
| | Amended and Restated Employment Agreement by
and between Northwest Bank, Northwest Bancshares, Inc. and Douglas M. Schosser. | | Filed herewith as Exhibit 10.24. |
| | | | |
| | Restricted Stock Unit Award Agreement under the
2022 Equity Incentive Plan for Louis J. Torchio. | | Filed herewith as Exhibit 10.25. |
| | | | |
| | Insider Trading Policy. | | Filed herewith as Exhibit 19. |
| | | | | |
| | Subsidiaries of Registrant. | | Filed herewith as Exhibit 21. |
| | | | | |
| | Consent of KPMG LLP. | | Filed herewith as Exhibit 23. |
| | | | | |
| 24 | | Power of Attorney. | | Not required. |
| | | | | |
| | Certification pursuant to Rule 13a-14 of the Securities Exchange Act of 1934, as Amended, as adopted pursuant to Section 302 of the Sarbanes-Oxley Act of 2002. | | Filed herewith as Exhibit 31.1. |
| | | | | |
| | Certification pursuant to Rule 13a-14 of the Securities Exchange Act of 1934, as Amended, as adopted pursuant to Section 302 of the Sarbanes-Oxley Act of 2002. | | Filed herewith as Exhibit 31.2. |
| | | | | |
| | Certification pursuant to 18 U.S.C. Section 1350, as adopted pursuant to Section 906 of the Sarbanes-Oxley Act of 2002. ** | | Furnished herewith as Exhibit 32. |
| | | | |
| | Policy Relating to Recovery of Extraneously Awarded Compensation. | | Filed herewith as Exhibit 97. |
| | | | |
| 101 | | Interactive Data File (XBRL). | | Filed herewith as Exhibit 101. |
| | | | |
| 104 | | Cover Page Interactive Data File (XBRL). | | Filed herewith as Exhibit 104. |
* Schedules have been omitted pursuant to Item 601(b)(2) of Regulation S-K but Northwest Bancshares, Inc. will provide them to the Securities and Exchange Commission upon request.
** Indicates a document being furnished with this annual report on Form 10-K. Information in this annual report on Form 10-K furnished herewith shall not be deemed to be “filed” for the purposes of Section 18 of the Exchange Act or otherwise subject to the liabilities of that Section. Such exhibit shall not be deemed incorporated by reference into any filing under the Securities Act or the Exchange Act.
ITEM 16. FORM 10-K SUMMARY
Not applicable.
SIGNATURES
Pursuant to the requirements of Section 13 or 15(d) of the Securities Exchange Act of 1934, the Registrant has duly caused this report to be signed on its behalf by the undersigned, thereunto duly authorized.
NORTHWEST BANCSHARES, INC.
| | | | | | | | | | | |
| Date: February 25, 2025 | | By: | /s/ Louis J. Torchio |
| | | | Louis J. Torchio, President and Chief Executive Officer |
| | | | (Principal Executive Officer) |
Pursuant to the requirements of the Securities Exchange of 1934, this report has been signed below by the following persons on behalf of the Registrant and in the capacities and on the dates indicated.
| | | | | | | | | | | |
| Date: February 25, 2025 | | By: | /s/ Louis J. Torchio |
| | | | Louis J. Torchio, President and Chief Executive Officer |
| | | | (Principal Executive Officer) |
| | | | |
| Date: February 25, 2025 | | By: | /s/ Douglas M. Schosser |
| | | | Douglas M. Schosser, Chief Financial Officer
(Principal Financial Officer) |
| | | |
| Date: February 25, 2025 | | By: | /s/ Joseph D. Canfield Jr. |
| | | Joseph D. Canfield Jr., Chief Accounting Officer
(Principal Accounting Officer) |
| | | |
| Date: February 25, 2025 | | By: | /s/ Timothy B. Fannin |
| | | Timothy B. Fannin, Chairman and Director |
| | | |
| Date: February 25, 2025 | | By: | /s/ Robert M. Campana |
| | | | Robert M. Campana, Director |
| | | | |
| Date: February 25, 2025 | | By: | /s/ Deborah J. Chadsey |
| | | Deborah J. Chadsey, Director |
| | | |
| Date: February 25, 2025 | | By: | /s/ Wilbur R. Davis |
| | | | Wilbur R. Davis, Director |
| | | |
| Date: February 25, 2025 | | By: | /s/ Timothy M. Hunter |
| | | Timothy M. Hunter, Director |
| | | | |
| Date: February 25, 2025 | | By: | /s/ John P. Meegan |
| | | | John P. Meegan, Director |
| | | |
| Date: February 25, 2025 | | By: | /s/ Mark A. Paup |
| | | Mark A. Paup, Director |
| | | | |
| Date: February 25, 2025 | | By: | /s/ David M. Tullio |
| | | David M. Tullio, Director |
| | | | |
| Date: February 25, 2025 | | By: | /s/ Pablo A. Vegas |
| | | | Pablo A. Vegas, Director |
| | | |
| Date: February 25, 2025 | | By: | /s/ Amber L. Williams |
| | | Amber L. Williams, Director |