UNITED STATES
SECURITIES AND EXCHANGE COMMISSION
FORM N-CSR
CERTIFIED SHAREHOLDER REPORT OF REGISTERED MANAGEMENT INVESTMENT COMPANIES
Investment Company Act file number811-22328
Columbia Seligman Premium Technology Growth Fund, Inc.
(Exact name of registrant as specified in charter)
290 Congress Street, Boston, MA 02210
(Address of principal executive offices) (Zip code)
Daniel J. Beckman
c/o Columbia Management Investment Advisers, LLC
290 Congress Street
Boston, MA 02210
Ryan C. Larrenaga, Esq.
c/o Columbia Management Investment Advisers, LLC
290 Congress Street
Boston, MA 02210
(Name and address of agent for service)
Registrant's telephone number, including area code: (800) 345-6611
Date of fiscal year end: December 31
Date of reporting period: December 31, 2021
Form N-CSR is to be used by management investment companies to file reports with the Commission not later than 10 days after the transmission to stockholders of any report that is required to be transmitted to stockholders under Rule 30e-1 under the Investment Company Act of 1940 (17 CFR 270.30e-1). The Commission may use the information provided on Form N-CSR in its regulatory, disclosure review, inspection, and policymaking roles.
A registrant is required to disclose the information specified by Form N-CSR, and the Commission will make this information public. A registrant is not required to respond to the collection of information contained in Form N-CSR unless the Form displays a currently valid Office of Management and Budget ("OMB") control number. Please direct comments concerning the accuracy of the information collection burden estimate and any suggestions for reducing the burden to Secretary, Securities and Exchange Commission, 100 F Street, NE, Washington, DC 20549. The OMB has reviewed this collection of information under the clearance requirements of 44 U.S.C. § 3507.
Item 1. Reports to Stockholders.

December 31, 2021


| 3 | |
| 5 | |
| 7 | |
| 16 | |
| 18 | |
| 22 | |
| 23 | |
| 24 | |
| 25 | |
| 26 | |
| 41 | |
| 42 | |
| 42 |
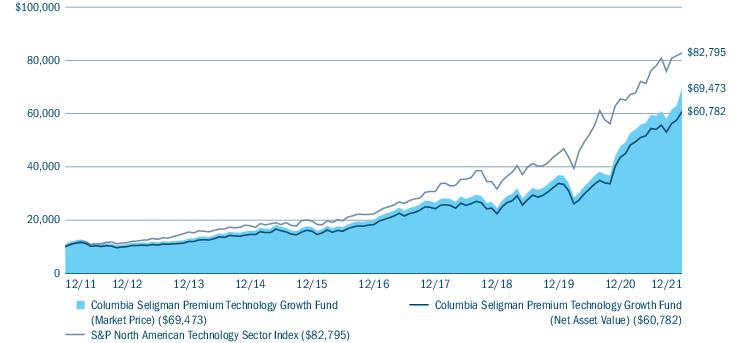
| Average annual total returns (%) (for the period ended December 31, 2021) | |||||
| Inception | 1 Year | 5 Years | 10 Years | ||
| Market Price | 11/24/09 | 48.96 | 26.97 | 21.39 | |
| Net Asset Value | 11/30/09 | 39.38 | 27.19 | 19.78 | |
| S&P North American Technology Sector Index | 26.40 | 29.99 | 23.54 | ||
| Price Per Share | ||||
| December 31, 2021 | September 30, 2021 | June 30, 2021 | March 31, 2021 | |
| Market Price ($) | 37.01 | 32.97 | 35.51 | 31.24 |
| Net Asset Value ($) | 35.42 | 32.43 | 33.74 | 31.12 |
| Distributions Paid Per Common Share | |
| Payable Date | Per Share Amount ($) |
| February 23, 2021 | 0.4625 |
| May 25, 2021 | 0.4625 |
| August 24, 2021 | 0.4625 |
| November 23, 2021 | 0.4625 |
| January 18, 2022 | 1.2869(a) |
| Columbia Seligman Premium Technology Growth Fund, Inc. | Annual Report 2021 | 3 |
| Portfolio breakdown (%) (at December 31, 2021) | |
| Common Stocks | 97.9 |
| Money Market Funds | 2.1 |
| Total | 100.0 |
| Equity sector breakdown (%) (at December 31, 2021) | |
| Communication Services | 9.4 |
| Consumer Discretionary | 2.3 |
| Health Care | 0.1 |
| Industrials | 2.1 |
| Information Technology | 86.1 |
| Total | 100.0 |
| Equity sub-industry breakdown (%) (at December 31, 2021) | |
| Information Technology | |
| Application Software | 9.0 |
| Communications Equipment | 6.1 |
| Data Processing & Outsourced Services | 4.0 |
| Electronic Equipment & Instruments | 1.4 |
| Internet Services & Infrastructure | 1.6 |
| IT Consulting & Other Services | 0.8 |
| Semiconductor Equipment | 15.1 |
| Semiconductors | 23.5 |
| Systems Software | 12.3 |
| Technology Hardware, Storage & Peripherals | 12.3 |
| Total | 86.1 |
| 4 | Columbia Seligman Premium Technology Growth Fund, Inc. | Annual Report 2021 |
| • | The Fund’s significant outperformance of the benchmark during the period was driven by strong stock selection, most notably within the semiconductors & semiconductor equipment and software industries. |
| • | Top individual contributors included: |
| ○ | Internet of Things (IoT) chip company Synaptics, Inc. was a top contributor after executing a turnaround over the past two years under the guidance of CEO Michael Hurlston. The company once known for touchpads and other interface components for PCs and mobile phones jettisoned its smartphone centric fingerprint sensor and LCD touch / display drive IC (integrated circuit) businesses while making strategic acquisitions in video and wireless connectivity and PC docking station technology which significantly boosted margins and profit growth. In 2021, the company consistently beat earnings expectations and the stock responded in kind. |
| ○ | Top holdings in semi-cap equipment companies Lam Research Corp. and Applied Materials, Inc. contributed meaningfully to returns during the period. The global semiconductor shortage highlights the fact that the industry needs to add capacity to inevitably boost supply. Our investments in semiconductor capital equipment companies have benefited from this pressing need. |
| ○ | Within software, cybersecurity holdings Fortinet, Inc. and Palo Alto Networks, Inc. benefited from strong demand for protection against hackers and ransomware. |
| • | Allocation decisions were also positive. The Fund’s sizable overweight to the semiconductor & semiconductor equipment industry, the strongest performing area of the benchmark, boosted relative results. An overweight to communications equipment was also additive, as was the Fund’s underweight to the poor-performing IT services industry and the consumer discretionary sector. |
| Columbia Seligman Premium Technology Growth Fund, Inc. | Annual Report 2021 | 5 |
| • | The largest area of detraction for the Fund during the period came from the industrials sector. Overall, the sector was one of the bottom performing areas of the benchmark and the Fund’s overweight weighed on relative performance. |
| • | The electronic equipment instruments and components industry was another area of underperformance for the Fund, both on an absolute and relative basis. |
| • | Microsoft Corp. continued to perform well due to high demand for its cloud-based offering Azure and strength in the company’s Office360 suite of products. Microsoft represents a large weighting in the benchmark and the portfolio’s relative underweight detracted from relative returns. |
| • | In the industrials sector, an out-of-benchmark holding in Bloom Energy Corp. underperformed, along with other Alternative Energy stocks, despite having signed a multi-year, $4.5 billion contract to supply SK Group of Korea with fuel cells. |
| • | Software holding Cerence Inc. detracted during the period. The company has seen a lull in its business due to the supply shortage induced problems in the auto industry. |
| • | Not owning semiconductor company NVIDIA Corp. on valuation concerns hurt relative performance as the stock rallied on strong results from the company’s gaming business as customers upgraded to its latest graphics cards. |
| • | Although there were strong results for technology stocks, especially in November 2021, and relatively constant volatility for both technology and technology-related stocks, the Fund’s call option writing strategy added to returns. |
| 6 | Columbia Seligman Premium Technology Growth Fund, Inc. | Annual Report 2021 |
| When the VXN Index is: | Aggregate Notional Amount of Written Call Options as a Percentage of the Fund’s Holdings in Common Stocks |
| 17 or less | 25% |
| Greater than 17, but less than 18 | Increase up to 50% |
| At least 18, but less than 33 | 50% |
| At least 33, but less than 34 | Increase up to 90% |
| At least 34, but less than 55 | 90% |
| At 55 or greater | 0% to 90% |
| Columbia Seligman Premium Technology Growth Fund, Inc. | Annual Report 2021 | 7 |
| • | Purchase or sell commodities or commodity contracts, except to the extent permissible under applicable law and interpretations, as they may be amended from time to time, and except this shall not prevent the Fund from buying or selling options, futures contracts and foreign currency or from entering into forward currency contracts or from investing in securities or other instruments backed by, or whose value is derived from, physical commodities; |
| • | Issue senior securities or borrow money, except as permitted by the Investment Company Act or any rule thereunder, any SEC or SEC staff interpretations thereof or any exemptions therefrom which may be granted by the SEC; |
| • | Make loans, except as permitted by the Investment Company Act or any rule thereunder, any SEC or SEC staff interpretations thereof or any exemptions therefrom which may be granted by the SEC; |
| • | Underwrite the securities of other issuers, except insofar as the Fund may be deemed an underwriter under the Securities Act of 1933 in disposing of a portfolio security or in connection with investments in other investment companies; |
| • | Buy or sell real estate, unless acquired as a result of ownership of securities or other instruments, except this shall not prevent the Fund from investing in securities or other instruments backed by real estate or securities of companies engaged in the real estate business or real estate investment trusts; and |
| • | Invest 25% or more of its Managed Assets (as defined below), at market value, in the securities of issuers in any particular industry, except that the Fund will invest at least 25% of the value of its Managed Assets in technology and technology-related stocks (in which the Fund intends to concentrate) and may invest without limit in securities issued or guaranteed by the U.S. Government, its agencies or instrumentalities, or government-sponsored enterprises. |
| 8 | Columbia Seligman Premium Technology Growth Fund, Inc. | Annual Report 2021 |
| Columbia Seligman Premium Technology Growth Fund, Inc. | Annual Report 2021 | 9 |
| 10 | Columbia Seligman Premium Technology Growth Fund, Inc. | Annual Report 2021 |
| Columbia Seligman Premium Technology Growth Fund, Inc. | Annual Report 2021 | 11 |
| 12 | Columbia Seligman Premium Technology Growth Fund, Inc. | Annual Report 2021 |
| Columbia Seligman Premium Technology Growth Fund, Inc. | Annual Report 2021 | 13 |
| 14 | Columbia Seligman Premium Technology Growth Fund, Inc. | Annual Report 2021 |
| Columbia Seligman Premium Technology Growth Fund, Inc. | Annual Report 2021 | 15 |
| Stockholder Transaction Expenses | |
| Dividend investment plan | None(a) |
| Annual Expenses (as a percentage of net asset attributable to common shares) | |
| Management fees(b) | 1.06% |
| Other expenses | 0.07% |
| Acquired fund fees and expenses | 0.00% |
| Total Annual Expenses(c) | 1.13% |
| (a) | There are no service or brokerage charges to participants in the dividend investment plan; however, the Fund reserves the right to amend the plan to include a service charge payable to the Fund by the participants. The Fund reserves the right to amend the plan to provide for payment of brokerage fees by the plan participants in the event the plan is changed to provide for open market purchases of Fund Common Stock on behalf of plan participants. |
| (b) | The Fund’s management fee is 1.06% of the Fund’s average daily Managed Assets (which means the net asset value of Fund’s outstanding common stock plus the liquidation preference of any issued and outstanding preferred stock of the Fund and the principal amount of any borrowing used for leverage). The management fee rate noted in the table reflects the rate paid by Common Stockholders as a percentage of the Fund’s net assets attributable to Common Stock. |
| (c) | “Total Annual Expenses" include acquired fund fees and expenses (expenses the Fund incurs indirectly through its investments in other investment companies) and may be higher than “Total gross expenses” shown in the Financial Highlights section of this report because “Total gross expenses” does not include acquired fund fees and expenses. |
| • | you invest $1,000 in the Fund for the periods indicated, |
| • | your investment has a 5% return each year, and |
| • | the Fund’s total annual operating expenses remain the same as shown in the Annual Fund Operating Expenses table above. |
| 1 year | 3 years | 5 years | 10 years | |
| Columbia Seligman Premium Technology Growth Fund, Inc. Common Stock | $115 | $359 | $622 | $1,375 |
| 16 | Columbia Seligman Premium Technology Growth Fund, Inc. | Annual Report 2021 |
| Market Price ($) | Corresponding NAV ($) | Corresponding (Discount)/Premium to NAV (%) | ||||
| High | Low | High | Low | High | Low | |
| 2020 | ||||||
| 1st Quarter | 25.25 | 14.44 | 24.69 | 15.42 | 2.27 | (6.36) |
| 2nd Quarter | 23.37 | 16.18 | 21.01 | 17.28 | 11.23 | (6.37) |
| 3rd Quarter | 23.33 | 21.09 | 22.31 | 21.35 | 4.57 | (1.22) |
| 4th Quarter | 27.63 | 21.33 | 27.41 | 21.91 | 0.80 | (2.65) |
| 2021 | ||||||
| 1st Quarter | 31.45 | 26.67 | 31.75 | 28.10 | (0.94) | (5.09) |
| 2nd Quarter | 35.94 | 31.05 | 33.83 | 29.82 | 6.24 | 4.12 |
| 3rd Quarter | 35.33 | 32.60 | 33.69 | 32.17 | 4.87 | 1.34 |
| 4th Quarter | 39.07 | 32.10 | 35.81 | 31.86 | 9.10 | 0.75 |
| Columbia Seligman Premium Technology Growth Fund, Inc. | Annual Report 2021 | 17 |
December 31, 2021
| Common Stocks 102.1% | ||
| Issuer | Shares | Value ($) |
| Communication Services 9.6% | ||
| Broadcasting 1.8% | ||
| Discovery, Inc., Class C(a) | 147,632 | 3,380,773 |
| Fox Corp., Class A | 183,200 | 6,760,080 |
| Total Broadcasting | 10,140,853 | |
| Cable & Satellite 0.4% | ||
| Comcast Corp., Class A | 48,825 | 2,457,362 |
| Total Cable & Satellite | 2,457,362 | |
| Interactive Home Entertainment 0.9% | ||
| Activision Blizzard, Inc. | 74,682 | 4,968,593 |
| Total Interactive Home Entertainment | 4,968,593 | |
| Interactive Media & Services 6.4% | ||
| Alphabet, Inc., Class A(a) | 7,341 | 21,267,171 |
| Alphabet, Inc., Class C(a) | 4,785 | 13,845,828 |
| Twitter, Inc.(a) | 22,500 | 972,450 |
| Total Interactive Media & Services | 36,085,449 | |
| Wireless Telecommunication Services 0.1% | ||
| T-Mobile USA, Inc.(a) | 3,500 | 405,930 |
| Total Wireless Telecommunication Services | 405,930 | |
| Total Communication Services | 54,058,187 | |
| Consumer Discretionary 2.4% | ||
| Education Services 0.1% | ||
| Udemy, Inc.(a) | 19,061 | 372,452 |
| Total Education Services | 372,452 | |
| Internet & Direct Marketing Retail 2.3% | ||
| eBay, Inc. | 195,829 | 13,022,628 |
| Total Internet & Direct Marketing Retail | 13,022,628 | |
| Total Consumer Discretionary | 13,395,080 | |
| Health Care 0.1% | ||
| Biotechnology 0.1% | ||
| Eiger BioPharmaceuticals, Inc.(a) | 112,861 | 585,749 |
| Total Biotechnology | 585,749 | |
| Total Health Care | 585,749 | |
| Industrials 2.1% | ||
| Heavy Electrical Equipment 1.9% | ||
| Bloom Energy Corp., Class A(a) | 484,201 | 10,618,528 |
| Total Heavy Electrical Equipment | 10,618,528 | |
| Common Stocks (continued) | ||
| Issuer | Shares | Value ($) |
| Human Resource & Employment Services 0.2% | ||
| HireRight Holdings Corp.(a) | 76,595 | 1,225,520 |
| Total Human Resource & Employment Services | 1,225,520 | |
| Total Industrials | 11,844,048 | |
| Information Technology 87.9% | ||
| Application Software 9.2% | ||
| Cerence, Inc.(a) | 70,392 | 5,394,843 |
| Cognyte Software Ltd.(a) | 31,024 | 486,146 |
| Dropbox, Inc., Class A(a) | 443,135 | 10,874,533 |
| Enfusion, Inc., Class A(a) | 29,471 | 617,123 |
| Intapp, Inc.(a) | 20,763 | 522,397 |
| Salesforce.com, Inc.(a) | 19,200 | 4,879,296 |
| Samsara, Inc., Class A(a) | 182,826 | 5,139,239 |
| Splunk, Inc.(a) | 7,100 | 821,612 |
| Synopsys, Inc.(a) | 53,902 | 19,862,887 |
| Verint Systems, Inc.(a) | 25,368 | 1,332,073 |
| Zendesk, Inc.(a) | 20,100 | 2,096,229 |
| Total Application Software | 52,026,378 | |
| Communications Equipment 6.2% | ||
| Arista Networks, Inc.(a) | 26,644 | 3,830,075 |
| Cisco Systems, Inc. | 54,500 | 3,453,665 |
| F5, Inc.(a) | 37,800 | 9,250,038 |
| Lumentum Holdings, Inc.(a) | 78,650 | 8,318,811 |
| Plantronics, Inc.(a) | 213,242 | 6,256,520 |
| Telefonaktiebolaget LM Ericsson, ADR | 352,600 | 3,832,762 |
| Total Communications Equipment | 34,941,871 | |
| Data Processing & Outsourced Services 4.1% | ||
| Fidelity National Information Services, Inc. | 39,300 | 4,289,595 |
| Fiserv, Inc.(a) | 47,476 | 4,927,534 |
| Pagseguro Digital Ltd., Class A(a) | 63,241 | 1,658,179 |
| Visa, Inc., Class A | 57,625 | 12,487,914 |
| Total Data Processing & Outsourced Services | 23,363,222 | |
| Electronic Equipment & Instruments 1.4% | ||
| Advanced Energy Industries, Inc. | 86,025 | 7,833,437 |
| Total Electronic Equipment & Instruments | 7,833,437 | |
| 18 | Columbia Seligman Premium Technology Growth Fund, Inc. | Annual Report 2021 |
December 31, 2021
| Common Stocks (continued) | ||
| Issuer | Shares | Value ($) |
| Internet Services & Infrastructure 1.6% | ||
| GoDaddy, Inc., Class A(a) | 107,785 | 9,146,635 |
| Total Internet Services & Infrastructure | 9,146,635 | |
| IT Consulting & Other Services 0.8% | ||
| DXC Technology Co.(a) | 66,600 | 2,143,854 |
| Thoughtworks Holding, Inc.(a) | 93,803 | 2,514,858 |
| Total IT Consulting & Other Services | 4,658,712 | |
| Semiconductor Equipment 15.4% | ||
| Applied Materials, Inc. | 131,586 | 20,706,373 |
| Lam Research Corp.(b) | 55,172 | 39,676,944 |
| Teradyne, Inc.(b) | 162,707 | 26,607,476 |
| Total Semiconductor Equipment | 86,990,793 | |
| Semiconductors 24.0% | ||
| Analog Devices, Inc. | 76,494 | 13,445,350 |
| Broadcom, Inc.(b) | 32,325 | 21,509,378 |
| GlobalFoundries, Inc.(a) | 77,115 | 5,010,162 |
| Intel Corp. | 81,416 | 4,192,924 |
| Marvell Technology, Inc. | 187,522 | 16,406,300 |
| Microchip Technology, Inc. | 63,800 | 5,554,428 |
| Micron Technology, Inc. | 143,560 | 13,372,614 |
| NXP Semiconductors NV | 33,800 | 7,698,964 |
| Qorvo, Inc.(a) | 54,875 | 8,581,901 |
| Rambus, Inc.(a) | 107,100 | 3,147,669 |
| Renesas Electronics Corp.(a) | 433,200 | 5,380,649 |
| SMART Global Holdings, Inc.(a) | 63,945 | 4,539,456 |
| Synaptics, Inc.(a) | 92,345 | 26,734,801 |
| Total Semiconductors | 135,574,596 | |
| Systems Software 12.6% | ||
| Fortinet, Inc.(a) | 29,844 | 10,725,934 |
| McAfee Corp., Class A | 47,675 | 1,229,538 |
| Microsoft Corp. | 60,200 | 20,246,464 |
| NortonLifeLock, Inc. | 363,848 | 9,452,771 |
| Common Stocks (continued) | ||
| Issuer | Shares | Value ($) |
| Oracle Corp. | 56,100 | 4,892,481 |
| Palo Alto Networks, Inc.(a) | 19,061 | 10,612,402 |
| SailPoint Technologies Holdings, Inc.(a) | 36,319 | 1,755,661 |
| Tenable Holdings, Inc.(a) | 29,200 | 1,608,044 |
| VMware, Inc., Class A | 33,573 | 3,890,439 |
| Xperi Holding Corp. | 345,888 | 6,540,742 |
| Total Systems Software | 70,954,476 | |
| Technology Hardware, Storage & Peripherals 12.6% | ||
| Apple, Inc.(b) | 172,000 | 30,542,040 |
| Dell Technologies, Inc.(a) | 89,479 | 5,026,036 |
| HP, Inc. | 272,757 | 10,274,756 |
| NetApp, Inc. | 110,659 | 10,179,521 |
| Western Digital Corp.(a) | 226,949 | 14,799,344 |
| Total Technology Hardware, Storage & Peripherals | 70,821,697 | |
| Total Information Technology | 496,311,817 | |
| Total Common Stocks (Cost: $254,517,700) | 576,194,881 | |
| Money Market Funds 2.2% | ||
| Shares | Value ($) | |
| Columbia Short-Term Cash Fund, 0.085%(c),(d) | 12,270,595 | 12,268,140 |
| Total Money Market Funds (Cost: $12,268,648) | 12,268,140 | |
| Total Investments in Securities (Cost $266,786,348) | 588,463,021 | |
| Other Assets & Liabilities, Net | (24,242,941) | |
| Net Assets | $564,220,080 | |
| Call option contracts written | ||||||||
| Description | Counterparty | Trading currency | Notional amount | Number of contracts | Exercise price/Rate | Expiration date | Premium received ($) | Value ($) |
| NASDAQ 100 Index | Morgan Stanley | USD | (288,865,416) | (177) | 16,450.00 | 1/21/2022 | (1,958,646) | (3,473,625) |
| Columbia Seligman Premium Technology Growth Fund, Inc. | Annual Report 2021 | 19 |
December 31, 2021
| (a) | Non-income producing investment. |
| (b) | This security or a portion of this security has been pledged as collateral in connection with derivative contracts. |
| (c) | The rate shown is the seven-day current annualized yield at December 31, 2021. |
| (d) | As defined in the Investment Company Act of 1940, as amended, an affiliated company is one in which the Fund owns 5% or more of the company’s outstanding voting securities, or a company which is under common ownership or control with the Fund. The value of the holdings and transactions in these affiliated companies during the year ended December 31, 2021 are as follows: |
| Affiliated issuers | Beginning of period($) | Purchases($) | Sales($) | Net change in unrealized appreciation (depreciation)($) | End of period($) | Realized gain (loss)($) | Dividends($) | End of period shares |
| Columbia Short-Term Cash Fund, 0.085% | ||||||||
| 9,894,909 | 103,477,001 | (101,103,262) | (508) | 12,268,140 | (659) | 5,626 | 12,270,595 | |
| ADR | American Depositary Receipt |
| USD | US Dollar |
| ■ | Level 1 — Valuations based on quoted prices for investments in active markets that the Fund has the ability to access at the measurement date. Valuation adjustments are not applied to Level 1 investments. |
| ■ | Level 2 — Valuations based on other significant observable inputs (including quoted prices for similar securities, interest rates, prepayment speeds, credit risks, etc.). |
| ■ | Level 3 — Valuations based on significant unobservable inputs (including the Fund’s own assumptions and judgment in determining the fair value of investments). |
| 20 | Columbia Seligman Premium Technology Growth Fund, Inc. | Annual Report 2021 |
December 31, 2021
The following table is a summary of the inputs used to value the Fund’s investments at December 31, 2021:
| Level 1 ($) | Level 2 ($) | Level 3 ($) | Total ($) | |
| Investments in Securities | ||||
| Common Stocks | ||||
| Communication Services | 54,058,187 | — | — | 54,058,187 |
| Consumer Discretionary | 13,395,080 | — | — | 13,395,080 |
| Health Care | 585,749 | — | — | 585,749 |
| Industrials | 11,844,048 | — | — | 11,844,048 |
| Information Technology | 490,931,168 | 5,380,649 | — | 496,311,817 |
| Total Common Stocks | 570,814,232 | 5,380,649 | — | 576,194,881 |
| Money Market Funds | 12,268,140 | — | — | 12,268,140 |
| Total Investments in Securities | 583,082,372 | 5,380,649 | — | 588,463,021 |
| Investments in Derivatives | ||||
| Liability | ||||
| Options Contracts Written | (3,473,625) | — | — | (3,473,625) |
| Total | 579,608,747 | 5,380,649 | — | 584,989,396 |
| Columbia Seligman Premium Technology Growth Fund, Inc. | Annual Report 2021 | 21 |
December 31, 2021
| Assets | |
| Investments in securities, at value | |
| Unaffiliated issuers (cost $254,517,700) | $576,194,881 |
| Affiliated issuers (cost $12,268,648) | 12,268,140 |
| Cash | 102,500 |
| Receivable for: | |
| Investments sold | 359,141 |
| Dividends | 182,669 |
| Foreign tax reclaims | 13,301 |
| Prepaid expenses | 38,816 |
| Total assets | 589,159,448 |
| Liabilities | |
| Option contracts written, at value (premiums received $1,958,646) | 3,473,625 |
| Payable for: | |
| Investments purchased | 755,526 |
| Distributions to shareholders | 20,499,735 |
| Management services fees | 16,403 |
| Stockholder servicing and transfer agent fees | 528 |
| Compensation of board members | 148,413 |
| Stockholders’ meeting fees | 1,183 |
| Compensation of chief compliance officer | 98 |
| Other expenses | 43,857 |
| Total liabilities | 24,939,368 |
| Net assets applicable to outstanding Common Stock | $564,220,080 |
| Represented by | |
| Paid in capital | 218,876,827 |
| Total distributable earnings (loss) | 345,343,253 |
| Total - representing net assets applicable to outstanding Common Stock | $564,220,080 |
| Shares outstanding applicable to Common Stock | 15,929,548 |
| Net asset value per share of outstanding Common Stock | $35.42 |
| Market price per share of Common Stock | $37.01 |
| 22 | Columbia Seligman Premium Technology Growth Fund, Inc. | Annual Report 2021 |
Year Ended December 31, 2021
| Net investment income | |
| Income: | |
| Dividends — unaffiliated issuers | $4,949,593 |
| Dividends — affiliated issuers | 5,626 |
| Foreign taxes withheld | (23,339) |
| Total income | 4,931,880 |
| Expenses: | |
| Management services fees | 5,496,087 |
| Stockholder servicing and transfer agent fees | 17,376 |
| Compensation of board members | 55,524 |
| Custodian fees | 18,681 |
| Printing and postage fees | 63,778 |
| Stockholders’ meeting fees | 40,393 |
| Audit fees | 50,280 |
| Legal fees | 5,727 |
| Compensation of chief compliance officer | 105 |
| Other | 114,091 |
| Total expenses | 5,862,042 |
| Net investment loss | (930,162) |
| Realized and unrealized gain (loss) — net | |
| Net realized gain (loss) on: | |
| Investments — unaffiliated issuers | 71,903,687 |
| Investments — affiliated issuers | (659) |
| Foreign currency translations | (1,055) |
| Options purchased | 131,960 |
| Options contracts written | 2,241,928 |
| Net realized gain | 74,275,861 |
| Net change in unrealized appreciation (depreciation) on: | |
| Investments — unaffiliated issuers | 98,720,322 |
| Investments — affiliated issuers | (508) |
| Foreign currency translations | (548) |
| Options purchased | (9,434) |
| Options contracts written | (1,757,650) |
| Net change in unrealized appreciation (depreciation) | 96,952,182 |
| Net realized and unrealized gain | 171,228,043 |
| Net increase in net assets resulting from operations | $170,297,881 |
| Columbia Seligman Premium Technology Growth Fund, Inc. | Annual Report 2021 | 23 |
| Year Ended December 31, 2021 | Year Ended December 31, 2020 | |
| Operations | ||
| Net investment income (loss) | $(930,162) | $1,736,081 |
| Net realized gain | 74,275,861 | 23,224,709 |
| Net change in unrealized appreciation (depreciation) | 96,952,182 | 74,868,847 |
| Net increase in net assets resulting from operations | 170,297,881 | 99,829,637 |
| Distributions to stockholders | ||
| Net investment income and net realized gains | (49,943,197) | (29,394,307) |
| Total distributions to stockholders | (49,943,197) | (29,394,307) |
| Increase in net assets from capital stock activity | 751,802 | 615,471 |
| Total increase in net assets | 121,106,486 | 71,050,801 |
| Net assets at beginning of year | 443,113,594 | 372,062,793 |
| Net assets at end of year | $564,220,080 | $443,113,594 |
| Year Ended | Year Ended | |||
| December 31, 2021 | December 31, 2020 | |||
| Shares | Dollars ($) | Shares | Dollars ($) | |
| Capital stock activity | ||||
| Common Stock issued at market price in distributions | 22,951 | 751,802 | 30,215 | 669,829 |
| Common Stock purchased in the open market | — | — | (2,629) | (54,358) |
| Total net increase | 22,951 | 751,802 | 27,586 | 615,471 |
| 24 | Columbia Seligman Premium Technology Growth Fund, Inc. | Annual Report 2021 |
| Year ended December 31, | |||||
| 2021 | 2020 | 2019 | 2018 | 2017 | |
| Per share data | |||||
| Net asset value, beginning of period | $27.86 | $23.43 | $16.96 | $20.83 | $17.78 |
| Income from investment operations: | |||||
| Net investment income (loss) | (0.06) | 0.11 | (0.02) | (0.01) | (0.06) |
| Net realized and unrealized gain (loss) | 10.76 | 6.17 | 8.34 | (1.36) | 5.74 |
| Total from investment operations | 10.70 | 6.28 | 8.32 | (1.37) | 5.68 |
| Less distributions to Stockholders from: | |||||
| Net investment income | — | (0.11) | — | — | — |
| Net realized gains | (3.14) | (1.74) | (1.85) | (2.50) | (2.63) |
| Total distributions to Stockholders | (3.14) | (1.85) | (1.85) | (2.50) | (2.63) |
| Net asset value, end of period | $35.42 | $27.86 | $23.43 | $16.96 | $20.83 |
| Market price, end of period | $37.01 | $27.24 | $23.55 | $16.81 | $22.25 |
| Total return | |||||
| Based upon net asset value | 39.38% | 29.17% | 51.04% | (7.77%) | 32.72% |
| Based upon market price | 48.96% | 25.65% | 53.17% | (14.42%) | 34.51% |
| Ratios to average net assets | |||||
| Total gross expenses(a) | 1.13% | 1.15% | 1.15% | 1.15% | 1.16% |
| Net investment income (loss) | (0.18%) | 0.50% | (0.08%) | (0.05%) | (0.28%) |
| Supplemental data | |||||
| Net assets, end of period (in thousands) | $564,220 | $443,114 | $372,063 | $265,315 | $320,472 |
| Portfolio turnover | 27% | 32% | 43% | 34% | 47% |
| Notes to Financial Highlights | |
| (a) | In addition to the fees and expenses that the Fund bears directly, the Fund indirectly bears a pro rata share of the fees and expenses of any other funds in which it invests. Such indirect expenses are not included in the Fund’s reported expense ratios. |
| Columbia Seligman Premium Technology Growth Fund, Inc. | Annual Report 2021 | 25 |
December 31, 2021
| 26 | Columbia Seligman Premium Technology Growth Fund, Inc. | Annual Report 2021 |
December 31, 2021
| Columbia Seligman Premium Technology Growth Fund, Inc. | Annual Report 2021 | 27 |
December 31, 2021
| 28 | Columbia Seligman Premium Technology Growth Fund, Inc. | Annual Report 2021 |
December 31, 2021
| Liability derivatives | ||
| Risk exposure category | Statement of assets and liabilities location | Fair value ($) |
| Equity risk | Options contracts written, at value | 3,473,625 |
| Amount of realized gain (loss) on derivatives recognized in income | |||
| Risk exposure category | Options contracts written ($) | Options contracts purchased ($) | Total ($) |
| Equity risk | 2,241,928 | 131,960 | 2,373,888 |
| Change in unrealized appreciation (depreciation) on derivatives recognized in income | |||
| Risk exposure category | Options contracts written ($) | Options contracts purchased ($) | Total ($) |
| Equity risk | (1,757,650) | (9,434) | (1,767,084) |
| Columbia Seligman Premium Technology Growth Fund, Inc. | Annual Report 2021 | 29 |
December 31, 2021
| Derivative instrument | Average value ($) |
| Options contracts — purchased | 6,219* |
| Options contracts — written | (1,406,855)** |
| * | Based on the ending daily outstanding amounts for the year ended December 31, 2021. |
| ** | Based on the ending quarterly outstanding amounts for the year ended December 31, 2021. |
| Morgan Stanley ($) | |
| Liabilities | |
| Options contracts written | 3,473,625 |
| Total financial and derivative net assets | (3,473,625) |
| Total collateral received (pledged) (a) | (3,473,625) |
| Net amount (b) | - |
| (a) | In some instances, the actual collateral received and/or pledged may be more than the amount shown due to overcollateralization. |
| (b) | Represents the net amount due from/(to) counterparties in the event of default. |
| 30 | Columbia Seligman Premium Technology Growth Fund, Inc. | Annual Report 2021 |
December 31, 2021
| Columbia Seligman Premium Technology Growth Fund, Inc. | Annual Report 2021 | 31 |
December 31, 2021
| Excess of distributions over net investment income ($) | Accumulated net realized gain ($) | Paid in capital ($) |
| 907,637 | (907,637) | — |
| 32 | Columbia Seligman Premium Technology Growth Fund, Inc. | Annual Report 2021 |
December 31, 2021
| Year Ended December 31, 2021 | Year Ended December 31, 2020 | ||||
| Ordinary income ($) | Long-term capital gains ($) | Total ($) | Ordinary income ($) | Long-term capital gains ($) | Total ($) |
| 12,363,181 | 37,580,016 | 49,943,197 | 2,129,850 | 27,264,457 | 29,394,307 |
| Undistributed ordinary income ($) | Undistributed long-term capital gains ($) | Capital loss carryforwards ($) | Net unrealized appreciation ($) |
| — | 26,189,459 | — | 320,603,575 |
| Federal tax cost ($) | Gross unrealized appreciation ($) | Gross unrealized (depreciation) ($) | Net unrealized appreciation ($) |
| 264,385,821 | 327,831,337 | (7,227,762) | 320,603,575 |
| Late year ordinary losses ($) | Post-October capital losses ($) |
| — | 1,311,470 |
| Columbia Seligman Premium Technology Growth Fund, Inc. | Annual Report 2021 | 33 |
December 31, 2021
| 34 | Columbia Seligman Premium Technology Growth Fund, Inc. | Annual Report 2021 |
December 31, 2021
| Columbia Seligman Premium Technology Growth Fund, Inc. | Annual Report 2021 | 35 |
December 31, 2021
| 36 | Columbia Seligman Premium Technology Growth Fund, Inc. | Annual Report 2021 |
December 31, 2021
| Columbia Seligman Premium Technology Growth Fund, Inc. | Annual Report 2021 | 37 |
December 31, 2021
| 38 | Columbia Seligman Premium Technology Growth Fund, Inc. | Annual Report 2021 |
December 31, 2021
| Columbia Seligman Premium Technology Growth Fund, Inc. | Annual Report 2021 | 39 |
December 31, 2021
| 40 | Columbia Seligman Premium Technology Growth Fund, Inc. | Annual Report 2021 |
| Columbia Seligman Premium Technology Growth Fund, Inc. | Annual Report 2021 | 41 |
| Qualified dividend income | Dividends received deduction | Capital gain dividend |
| 39.82% | 38.68% | $63,890,207 |
| Name, Address, Year of Birth | Position Held With the Fund and Length of Service | Principal Occupation(s) During the Past Five Years and Other Relevant Professional Experience | Number of Funds in the Columbia Funds Complex Overseen | Other Directorships Held by Director During the Past Five Years |
| George S. Batejan c/o Columbia Management Investment Advisers LLC 290 Congress Street Boston, MA 02210 1953 | Director since January 2018 | Executive Vice President, Global Head of Technology and Operations, Janus Capital Group, Inc., 2010-2016 | 176 | Former Chairman of the Board, NICSA (National Investment Company Services Association) (Executive Committee, Nominating Committee and Governance Committee), 2014-2016; former Director, Intech Investment Management, 2011-2016; former Board Member, Metro Denver Chamber of Commerce, 2015-2016; former Advisory Board Member, University of Colorado Business School, 2015-2018 |
| 42 | Columbia Seligman Premium Technology Growth Fund, Inc. | Annual Report 2021 |
Independent directors (continued)
| Name, Address, Year of Birth | Position Held With the Fund and Length of Service | Principal Occupation(s) During the Past Five Years and Other Relevant Professional Experience | Number of Funds in the Columbia Funds Complex Overseen | Other Directorships Held by Director During the Past Five Years |
| Kathleen Blatz c/o Columbia Management Investment Advisers LLC 290 Congress Street Boston, MA 02210 1954 | Director since October 2009 | Attorney, specializing in arbitration and mediation; Chief Justice, Minnesota Supreme Court, 1998-2006; Associate Justice, Minnesota Supreme Court, 1996-1998; Fourth Judicial District Court Judge, Hennepin County, 1994-1996; Attorney in private practice and public service, 1984-1993; State Representative, Minnesota House of Representatives, 1979-1993, which included service on the Tax and Financial Institutions and Insurance Committees; Member and Interim Chair, Minnesota Sports Facilities Authority, January-July 2017; Interim President and Chief Executive Officer, Blue Cross Blue Shield of Minneota (health care insurance), February-July 2018, April-October 2021 | 176 | Former Trustee, Blue Cross Blue Shield of Minnesota, 2009-2021 (Chair of the Business Development Committee, 2014-2017; Chair of the Governance Committee, 2017-2019); former Member and Chair of the Board, Minnesota Sports Facilities Authority, January-July 2017; former Director, Robina Foundation, 2009-2020 (Chair, 2014-2020); Director, Schulze Family Foundation, since 2021 |
| Pamela G. Carlton c/o Columbia Management Investment Advisers LLC 290 Congress Street Boston, MA 02210 1954 | Director since October 2009 | President, Springboard — Partners in Cross Cultural Leadership (consulting company) since 2003; Managing Director of US Equity Research, JP Morgan Chase, 1999-2003; Director of US Equity Research, Chase Asset Management, 1996-1999; Co-Director Latin America Research, 1993-1996, COO Global Research, 1992-1996, Co-Director of US Research, 1991-1992, Investment Banker, 1982-1991, Morgan Stanley; Attorney, Cleary Gottlieb Steen & Hamilton LLP, 1980-1982 | 176 | Trustee, New York Presbyterian Hospital Board (Executive Committee and Chair of People Committee) since 1996; Director, DR Bank (Audit Committee) since 2017; Director, Evercore Inc. (Audit Committee); Director, Apollo Commercial Real Estate Finance, Inc. since 2021; the Governing Council of the Independent Directors Council (IDC), since 2021 |
| Patricia M. Flynn c/o Columbia Management Investment Advisers LLC 290 Congress Street Boston, MA 02210 1950 | Director since October 2009 | Trustee Professor of Economics and Management, Bentley University since 1976 (also teaches and conducts research on corporate governance); Dean, McCallum Graduate School of Business, Bentley University, 1992-2002 | 176 | Trustee, MA Taxpayers Foundation since 1997; Board of Governors, Innovation Institute, MA Technology Collaborative, 2010-2020; former Board of Directors, The MA Business Roundtable, 2003-2019 |
| Brian J. Gallagher c/o Columbia Management Investment Advisers LLC 290 Congress Street Boston, MA 02210 1954 | Director since January 2020 | Retired; Partner with Deloitte & Touche LLP and its predecessors, 1977 - 2016 | 176 | Trustee, Catholic Schools Foundation since 2004 |
| Columbia Seligman Premium Technology Growth Fund, Inc. | Annual Report 2021 | 43 |
Independent directors (continued)
| Name, Address, Year of Birth | Position Held With the Fund and Length of Service | Principal Occupation(s) During the Past Five Years and Other Relevant Professional Experience | Number of Funds in the Columbia Funds Complex Overseen | Other Directorships Held by Director During the Past Five Years |
| Douglas A. Hacker c/o Columbia Management Investment Advisers, LLC 290 Congress Street Boston, MA 02210 1955 | Director since January 2022 | Independent business executive since May 2006; Executive Vice President – Strategy of United Airlines, December 2002-May 2006; President of UAL Loyalty Services (airline marketing company), September 2001-December 2002; Executive Vice President and Chief Financial Officer of United Airlines, July 1999-September 2001 | 176 | Director, Spartan Nash Company (food distributor); Director, Aircastle Limited (Chair of Audit Committee) (aircraft leasing); former Director, Nash Finch Company (food distributor), 2005-2013; former Director, SeaCube Container Leasing Ltd. (container leasing), 2010-2013; and former Director, Travelport Worldwide Limited (travel information technology), 2014-2019 |
| Catherine James Paglia c/o Columbia Management Investment Advisers LLC 290 Congress Street Boston, MA 02210 1952 | Director since October 2009; Chair of the Board since January 2020 | Director, Enterprise Asset Management, Inc. (private real estate and asset management company) since September 1998; Managing Director and Partner, Interlaken Capital, Inc., 1989-1997; Vice President, 1982-1985, Principal, 1985-1987, Managing Director, 1987-1989, Morgan Stanley; Vice President, Investment Banking, 1980-1982, Associate, Investment Banking, 1976-1980, Dean Witter Reynolds, Inc. | 176 | Director, Valmont Industries, Inc. irrigation systems manufacturer) since 2012; Trustee, Carleton College (on the Investment Committee); Trustee, Carnegie Endowment for International Peace (on the Investment Committee) |
| Minor M. Shaw c/o Columbia Management Investment Advisers LLC 290 Congress Street Boston, MA 02210 1947 | Director since April 2016 | President, Micco LLC (private investments) since 2011; President, Micco Corp. (family investment business), 1998-2011 | 176 | Director, Blue Cross Blue Shield of South Carolina (Chair of Compensation Committee) since April 2008; Trustee, Hollingsworth Funds (on the Investment Committee) since 2016 (previously Board Chair from 2016-2019); Former Advisory Board member, Duke Energy Corp., 2016-2020; Chair of the Duke Endowment; Chair of Greenville – Spartanburg Airport Commission; former Trustee, BofA Funds Series Trust (11 funds), 2003-2011; former Director, Piedmont Natural Gas, 2004-2016; former Director, National Association of Corporate Directors, Carolinas Chapter, 2013-2018; Chair, Daniel-Mickel Foundation since 1998 |
| Sandra Yeager c/o Columbia Management Investment Advisers, LLC 290 Congress Street Boston, MA 02210 1964 | Director since June 2020 | Retired; President and founder, Hanoverian Capital, LLC (SEC registered investment advisor firm), 2008-2016; Managing Director, DuPont Capital, 2006-2008; Managing Director, Morgan Stanley Investment Management, 2004-2006; Senior Vice President, Alliance Bernstein, 1990-2004 | 176 | Former Director, NAPE Education Foundation, October 2016-October 2020 |
| 44 | Columbia Seligman Premium Technology Growth Fund, Inc. | Annual Report 2021 |
Interested director affiliated with Investment Manager*
| Name, Address, Year of Birth | Position Held With the Fund and Length of Service | Principal Occupation(s) During the Past Five Years and Other Relevant Professional Experience | Number of Funds in the Columbia Funds Complex Overseen | Other Directorships Held by Director During the Past Five Years |
| Daniel J. Beckman c/o Columbia Management Investment Advisers, LLC 290 Congress Street Boston, MA 02210 1962 | Director since November 2021(a) | Vice President – Head of North America Product, Columbia Management Investment Advisers, LLC (since April 2015); officer of Columbia Funds and affiliated funds since 2020 | 176 | Director, Ameriprise Trust Company, since October 2016; Director, Columbia Management Investment Distributors, Inc. since November 2018; Board of Governors, Columbia Wanger Asset Management, LLC since January 2022 |
| * | Interested person (as defined under the 1940 Act) by reason of being an officer, director, security holder and/or employee of the Investment Manager or Ameriprise Financial. |
| (a) | Mr. Beckman serves as the President and Principal Executive Officer of the Columbia Funds (since 2021). |
| Name, address and year of birth | Position and year first appointed to position for any Fund in the Columbia Funds complex or a predecessor thereof | Principal occupation(s) during past five years |
| Michael G. Clarke 290 Congress Street Boston, MA 02210 1969 | Chief Financial Officer and Principal Financial Officer (2009) and Senior Vice President (2019) | Vice President and Head of Global Operations & Investor Services, Columbia Management Investment Advisers, LLC, since March 2022 (previously Vice President, Head of North American Operations, and Co-Head of Global Operations, June 2019 to February 2022 and Vice President – Accounting and Tax, May 2010 - May 2019); senior officer of Columbia Funds and affiliated funds since 2002. |
| Joseph Beranek 5890 Ameriprise Financial Center Minneapolis, MN 55474 1965 | Treasurer and Chief Accounting Officer (Principal Accounting Officer) (2019) and Principal Financial Officer (2020) | Vice President — Mutual Fund Accounting and Financial Reporting, Columbia Management Investment Advisers, LLC, since December 2018 and March 2017, respectively (previously, Vice President — Pricing and Corporate Actions, May 2010-March 2017). |
| William F. Truscott 290 Congress Street Boston, MA 02210 1960 | Senior Vice President (2001) | Formerly, Trustee/Director of Columbia Funds Complex or legacy funds, November 2001-January 1, 2021; Chief Executive Officer, Global Asset Management, Ameriprise Financial, Inc. since September 2012; Chairman of the Board and President, Columbia Management Investment Advisers, LLC since July 2004 and February 2012, respectively; Chairman of the Board and Chief Executive Officer, Columbia Management Investment Distributors, Inc. since November 2008 and February 2012, respectively; Chairman of the Board and Director, Threadneedle Asset Management Holdings, Sàrl since March 2013 and December 2008, respectively; senior executive of various entities affiliated with Columbia Threadneedle. |
| Christopher O. Petersen 5228 Ameriprise Financial Center Minneapolis, MN 55474 1970 | Senior Vice President and Assistant Secretary (2021) | Formerly, Trustee/Director of funds within the Columbia Funds Complex, July 1, 2020 - November 22, 2021; Senior Vice President and Assistant General Counsel, Ameriprise Financial, Inc. since September 2021 (previously Vice President and Lead Chief Counsel, January 2015 - September 2021); President and Principal Executive Officer of the Columbia Funds 2015 - 2021; officer of Columbia Funds and affiliated funds since 2007. |
| Columbia Seligman Premium Technology Growth Fund, Inc. | Annual Report 2021 | 45 |
Fund officers (continued)
| Name, address and year of birth | Position and year first appointed to position for any Fund in the Columbia Funds complex or a predecessor thereof | Principal occupation(s) during past five years |
| Thomas P. McGuire 290 Congress Street Boston, MA 02210 1972 | Senior Vice President and Chief Compliance Officer (2012) | Vice President – Asset Management Compliance, Ameriprise Financial, Inc., since May 2010; Chief Compliance Officer, Columbia Acorn/Wanger Funds since December 2015; Chief Compliance Officer, Ameriprise Certificate Company, September 2010 – September 2020. |
| Ryan C. Larrenaga 290 Congress Street Boston, MA 02210 1970 | Senior Vice President (2017), Chief Legal Officer (2017), and Secretary (2015) | Vice President and Chief Counsel, Ameriprise Financial, Inc. since August 2018 (previously, Vice President and Group Counsel, August 2011 – August 2018); Chief Legal Officer, Columbia Acorn/Wanger Funds, since September 2020; officer of Columbia Funds and affiliated funds since 2005. |
| Michael E. DeFao 290 Congress Street Boston, MA 02210 1968 | Vice President (2011) and Assistant Secretary (2010) | Vice President and Chief Counsel, Ameriprise Financial, Inc. since May 2010; Vice President, Chief Legal Officer and Assistant Secretary, Columbia Management Investment Advisers, LLC since October 2021 (previously Vice President and Assistant Secretary, May 2010 – September 2021). |
| Lyn Kephart-Strong 5228 Ameriprise Financial Center Minneapolis, MN 55474 1960 | Vice President (2015) | President, Columbia Management Investment Services Corp. since October 2014; Vice President & Resolution Officer, Ameriprise Trust Company since August 2009. |
| 46 | Columbia Seligman Premium Technology Growth Fund, Inc. | Annual Report 2021 |
Item 2. Code of Ethics.
(a)The registrant has adopted a code of ethics that applies to the registrant's principal executive officer, principal financial officer, principal accounting officer or controller, or persons performing similar functions, regardless of whether these individuals are employed by the registrant or a third party.
(b)During the period covered by this report, there were not any amendments to a provision of the code of ethics that applies to the registrant's principal executive officer, principal financial officer, principal accounting officer or controller, or persons performing similar functions, regardless of whether these individuals are employed by the registrant or a third party, and that relates to any element of the code of ethics definition enumerated in paragraph (b) of this Item.
(c)During the period covered by this report, there were no waivers, including any implicit waivers, from a provision of the code of ethics to the registrant's principal executive officer, principal financial officer, principal accounting officer or controller, or persons performing similar functions, regardless of whether these individuals are employed by the registrant or a third party that relates to one or more of the items set forth in paragraph (b) of this Item.
Item 3. Audit Committee Financial Expert.
The registrant's Board of Trustees has determined that Brian J. Gallagher and Sandra L. Yeager, each of whom are members of the registrant's Board of Trustees and Audit Committee, each qualify as an audit committee financial expert. Mr. Gallagher and Ms. Yeager are each independent trustees, as defined in paragraph (a)(2) of this item's instructions.
Item 4. Principal Accountant Fees and Services.
Fee information below is disclosed for the one series of the registrant whose report to stockholders is included in this annual filing.
(a)Audit Fees. Aggregate Audit Fees billed by the principal accountant for professional services rendered during the fiscal years ended December 31, 2021 and December 31,
2020 are approximately as follows:
20212020
$49,500 $49,500
Audit Fees include amounts related to the audit of the registrant's annual financial statements or services that are normally provided by the accountant in connection with statutory and regulatory filings or engagements for those fiscal years.
(b)Audit-Related Fees. Aggregate Audit-Related Fees billed to the registrant by the principal accountant for professional services rendered during the fiscal years ended December 31, 2021 and December 31, 2020 are approximately as follows:
2021 | 2020 |
$0 | $0 |
Audit-Related, if any, Fees include amounts for assurance and related services by the principal accountant that are reasonably related to the performance of the audit of the registrant's financial statements and are not reported in Audit Fees above.
During the fiscal years ended December 31, 2021 and December 31, 2020, there were no Audit-Related Fees billed by the registrant's principal accountant to the registrant's investment adviser (not including any sub-adviser whose role is primarily portfolio management and is subcontracted with or overseen by another investment adviser) and any entity controlling, controlled by, or under common control with the adviser that provides ongoing services to the registrant for an engagement that related directly to the operations and financial reporting of the registrant.
(c)Tax Fees. Aggregate Tax Fees billed by the principal accountant to the registrant for professional services rendered during the fiscal years ended December 31, 2021 and December 31, 2020 are approximately as follows:
2021 | 2020 |
$0 | $0 |
Tax Fees, if any, include amounts for the review of annual tax returns, the review of required shareholder distribution calculations and typically include amounts for professional services by the principal accountant for tax compliance, tax advice and tax planning.
During the fiscal years ended December 31, 2021 and December 31, 2020, there were no Tax Fees billed by the registrant's principal accountant to the registrant's investment adviser (not including any sub-adviser whose role is primarily portfolio management and is subcontracted with or overseen by another investment adviser) and any entity controlling, controlled by, or under common control with the adviser that provides ongoing services to the registrant for an engagement that related directly to the operations and financial reporting of the registrant.
(d)All Other Fees. Aggregate All Other Fees billed by the principal accountant to the registrant for professional services rendered during the fiscal years ended December 31,
2021 and December 31, 2020 are approximately as follows:
2021 | 2020 |
$0 | $0 |
All Other Fees, if any, include amounts for products and services provided by the principal accountant, other than the services reported in paragraphs (a) through (c) above.
Aggregate All Other Fees billed by the registrant's principal accountant to the registrant's investment adviser (not including any sub-adviser whose role is primarily portfolio management and is subcontracted with or overseen by another investment adviser) and any entity controlling, controlled by, or under common control with the adviser that provides ongoing services to the registrant for an engagement that related directly to the operations and financial reporting of the registrant during the fiscal years ended December 31, 2021 and December 31, 2020 are approximately as follows:
20212020
$520,000 $520,000
In both fiscal years 2021 and 2020, All Other Fees primarily consist of fees billed for internal control examinations of the registrant's transfer agent and investment advisor.
(e)(1) Audit Committee Pre-Approval Policies and Procedures
The registrant's Audit Committee is required to pre-approve the engagement of the registrant's independent auditors to provide audit and non-audit services to the registrant and non-audit services to its investment adviser (excluding any sub-adviser whose role is primarily portfolio management and is sub-contracted or overseen by another investment adviser (the "Adviser") or any entity controlling, controlled by or under common control with the Adviser that provides ongoing services to the Fund (a "Control Affiliate") if the engagement relates directly to the operations and financial reporting of the registrant.
The Audit Committee has adopted a Policy for Engagement of Independent Auditors for Audit and Non-Audit Services (the "Policy"). The Policy sets forth the understanding of the Audit Committee regarding the engagement of the registrant's independent accountants to provide (i) audit and permissible audit-related, tax and other services to the registrant ("Fund Services"); (ii) non-audit services to the registrant's Adviser and any Control Affiliates, that relates directly to the operations and financial reporting of a Fund ("Fund-related Adviser Services"); and (iii) certain other audit and non-audit services to the registrant's Adviser and its Control Affiliates. A service will require specific pre-approval by the Audit Committee if it is to be provided by the Fund's independent auditor; provided, however, that pre-approval of non-audit services to the Fund, the Adviser or Control Affiliates may be waived if certain de minimis requirements set forth in the SEC's rules are met.
Under the Policy, the Audit Committee may delegate pre-approval authority to any pre- designated member or members who are independent board members. The member(s) to whom such authority is delegated must report, for informational purposes only, any pre- approval decisions to the Audit Committee at its next regular meeting. The Audit Committee's responsibilities with respect to the pre-approval of services performed by the independent auditor may not be delegated to management.
On an annual basis, at a regularly scheduled Audit Committee meeting, the Fund's Treasurer or other Fund officer shall submit to the Audit Committee a schedule of the types of Fund Services and Fund-related Adviser Services that are subject to specific pre- approval. This schedule will provide a description of each type of service that is subject to specific pre-approval, along with total projected fees for each service. The pre- approval will generally cover a one-year period. The Audit Committee will review and approve the types of services and the projected fees for the next one-year period and may add to, or subtract from, the list of pre-approved services from time to time, based on subsequent determinations. This specific approval acknowledges that the Audit Committee is in agreement with the specific types of services that the independent auditor will be permitted to perform and the projected fees for each service.
The Fund's Treasurer or other Fund officer shall report to the Audit Committee at each of its regular meetings regarding all Fund Services or Fund-related Adviser Services provided since the last such report was rendered, including a description of the services, by category, with forecasted fees for the annual reporting period, proposed changes requiring specific pre-approval and a description of services provided by the independent auditor, by category, with actual fees during the current reporting period.
*****
(e)(2) None, or 0%, of the Audit-Related Fees, Tax Fees and All Other Fees paid by the Fund or affiliated entities relating directly to the operations and financial reporting of the Registrant disclosed above were approved by the audit committee pursuant to paragraphs (c)(7)(i)(C) of Rule 2-01 of Regulation S-X (which permits audit committee approval after the start of the engagement with respect to services other than audit, review or attest services, if certain conditions are satisfied).
(f)Not applicable.
(g)The aggregate non-audit fees billed by the registrant's accountant for services rendered to the registrant, and rendered to the registrant's investment adviser (not including any sub-adviser whose role is primarily portfolio management and is subcontracted with or overseen by another investment adviser), and any entity controlling, controlled by, or under common control with the adviser that provides ongoing services to the registrant for the fiscal year ended December 31, 2021 and December 31, 2020 are approximately as follows:
20212020
$520,000 $520,000
(h)The registrant's Audit Committee of the Board of Directors has considered whether the provision of non-audit services that were rendered to the registrant's adviser (not including any sub-adviser whose role is primarily portfolio management and is subcontracted with or overseen by another investment adviser), and any entity controlling, controlled by, or under common control with the investment adviser that provides ongoing services to the registrant that were not pre-approved pursuant to
paragraph (c)(7)(ii) of Rule 2-01 of Regulation S-X, is compatible with maintaining the principal accountant's independence.
Item 5. Audit Committee of Listed Registrants.
(a)The registrant has a separately-designated standing audit committee established in accordance with Section 3(a)58)(A) of the Exchange Act (15 U.S.C. 78c(a)(58)(A). Brian J. Gallagher and Sandra L. Yeager are each independent trustees and collectively constitute the entire Audit Committee.
(b)Not applicable.
Item 6. Investments
(a)The registrant's "Schedule I – Investments in securities of unaffiliated issuers" (as set forth in 17 CFR 210.12-12) is included in Item 1 of this Form N-CSR.
(b)Not applicable.
Item 7. Disclosure of Proxy Voting Policies and Procedures for Closed-End Management Investment Companies.
Proxy Voting Policies and Procedures
General. The Funds have delegated to the Investment Manager the responsibility to vote proxies relating to portfolio securities held by the Funds, including Funds managed by subadvisers. In deciding to delegate this responsibility to the Investment Manager, the Board reviewed the policies adopted by the Investment Manager. These included the procedures that the Investment Manager follows when a vote presents a conflict between the interests of the Funds and their shareholders and the Investment Manager and its affiliates.
The Investment Manager's policy is to vote all proxies for Fund securities in a manner considered by the Investment Manager to be in the best economic interests of its clients, including the Funds, without regard to any benefit or detriment to the Investment Manager, its employees or its affiliates. The best economic interests of clients is defined for this purpose as the interest of enhancing or protecting the value of client accounts, considered as a group rather than individually, as the Investment Manager determines in its discretion. The Investment Manager endeavors to vote all proxies of which it becomes aware prior to the vote deadline; provided, however, that in certain circumstances the Investment Manager may refrain from voting securities. For instance, the Investment Manager may refrain from voting foreign securities if it determines that the costs of voting outweigh the expected benefits of voting and typically will not vote securities if voting would impose trading restrictions.
The Board may, in its discretion, vote proxies for the Funds. For instance, the Board may determine to vote on matters that may present a material conflict of interest to the Investment Manager.
Oversight. The operation of the Investment Manager's proxy voting policy and procedures is overseen by a committee (the Proxy Voting Committee) composed of representatives of the Investment Manager's equity investments, equity research, responsible investment, compliance, legal and operations functions. The Proxy Voting Committee has the responsibility to review, at least annually, the Investment Manager's proxy voting policies to ensure consistency with internal policies, regulatory requirements, conflicts of interest and client disclosures. The Board reviews on an annual basis, or more frequently as determined appropriate, the Investment Manager's administration of the proxy voting process.
Corporate Governance and Proxy Voting Principles (the Principles). The Investment Manager has adopted the Principles, which set out the Investment Manager's views on key issues and the broad principles shaping its approach, as well as the types of related voting action the Investment Manager may take. The Principles also provide indicative examples of key guidelines used in any given region, which illustrate the standards against which voting decisions are considered. The Investment Manager has developed voting stances that align with the Principles and will generally vote in accordance with such voting stances. The Proxy Voting Committee or investment professionals may determine to vote differently from the voting stances on particular proposals in the event it determines that doing so is in the clients' best economic interests. The Investment Manager may also consider the voting recommendations of analysts, portfolio managers, subadvisers and information obtained from outside resources, including one or more third party research providers. When proposals are not covered by the voting stances or a voting determination must be made on a case-by-case basis, a portfolio manager, subadviser or analyst will make the voting determination based on his or her determination of the clients' best economic interests. In addition, the Proxy Voting Committee may determine proxy votes when proposals require special consideration.
Addressing Conflicts of Interest. The Investment Manager seeks to address potential material conflicts of interest by voting in accordance with predetermined voting stances. In addition, if the Investment Manager determines that a material conflict of interest exists, the Investment Manager will invoke one or more of the following conflict management practices: (i) causing the proxies to be voted in accordance with the recommendations of an independent third party (which may be the Investment Manager's proxy voting administrator or research provider); (ii) causing the proxies to be delegated to an independent third party (which may be the Investment Manager's proxy voting administrator or research provider); and (iii) in infrequent cases, forwarding the proxies to an Independent Director authorized to vote the proxies for the Funds. A member of the Proxy Voting Committee is prohibited from voting on any proposal for which he or she has a conflict of interest by reason of a direct relationship with the issuer or other party affected by a given proposal. Persons making recommendations to the Proxy Voting Committee or its members are required to disclose to the committee any relationship with a party making a proposal or other matter known to the person that would create a potential conflict of interest.
Voting Proxies of Affiliated Underlying Funds. Certain Funds may invest in shares of other Columbia Funds (referred to in this context as "underlying funds") and may own substantial portions of these underlying funds. If such Funds are in a master-feeder structure, the feeder fund will either seek instructions from its shareholders with regard to the voting of proxies with respect to the master fund's shares and vote such proxies in accordance with such instructions or vote the shares held by it in the same proportion as the vote of all other master fund shareholders. With respect to Funds that hold shares of underlying funds other than in a master-feeder structure, the holding Funds will typically vote proxies of the underlying funds in the same proportion as the vote of all other holders of the underlying fund's shares, unless the Board otherwise instructs.
Proxy Voting Agents. The Investment Manager has retained Institutional Shareholder Services Inc., a third-party vendor, as its proxy voting administrator to implement its proxy voting process and to provide recordkeeping and vote disclosure services. Typically, Institutional Shareholder Services Inc. populates ballots for issuers deemed to present potential material conflicts of interest in accordance with predetermined voting stances, as described above under Addressing Conflicts of Interest. The Investment Manager has retained both Institutional Shareholder Services Inc. and Glass Lewis & Company, LLC to provide proxy research services.
Additional Information. Information regarding how the Columbia Funds (except certain Columbia Funds that do not invest in voting securities) voted proxies relating to portfolio securities during the most recent twelve month period ended June 30 will be available by August 31 of this year free of charge: (i) through the Columbia Funds' website at columbiathreadneedleus.com and/or (ii) on the SEC's website at www.sec.gov. For a copy of the Investment Manager's Principles in effect on the date of this SAI, see Appendix B to this SAI.
Item 8. Portfolio Managers of Closed-End Management Investment Companies.
Portfolio Managers
|
|
| Managed the |
Portfolio Manager | Title | Role with the Corporation | Corporation Since |
Paul Wick | Portfolio Manager | Lead Portfolio Manager | 2009 |
Braj Agrawal | Portfolio Manager | Co-Portfolio Manager | 2010 |
Jeetil Patel | Portfolio Manager | Technology Team Member | 2015 |
Christopher Boova | Portfolio Manager | Co-Portfolio Manager | 2016 |
Vimal Patel | Portfolio Manager | Technology Team Member | 2018 |
Shekhar Pramanick | Portfolio Manager | Technology Team Member | 2018 |
Mr. Wick joined one of the Columbia Management legacy firms or acquired business lines in 1987. Mr. Wick is Team Leader and Portfolio Manager for the Columbia Seligman Technology strategies. Mr. Wick began his investment career in 1987 and earned a B.A. from Duke and an M.B.A. from Duke's Fuqua School of Business.

Mr. Agrawal joined the Investment Manager in 2010 as a Managing Trader responsible for derivatives. Mr. Agrawal has been a member of the investment community since 2001 and earned a B.A. in Economics from the University of Illinois at Urbana-Champaign and an M.B.A. from University of Minnesota's Carlson School.
Mr. Jeetil Patel joined the Investment Manager in 2012. Mr. Patel began his investment career in 1998 and earned a B.A. from University of California, Los Angeles.
Mr. Boova joined one of the Columbia Management legacy firms or acquired business lines in 2000. Mr. Boova began his investment career in 1995 and earned two B.S. degrees from Worcester Polytechnic Institute, an M.A. from Georgetown University and an M.B.A. from the Wharton School at the University of Pennsylvania.
Dr. Pramanick joined the Investment Manager in 2012. Dr. Pramanick began his investment career in 1993 and earned a B.S. from the National Institute of Technology, an M.S. from the University of Oregon and a Ph.D. from North Carolina State University.
Mr. Vimal Patel joined the Investment Manager in 2014. Mr. Patel began his investment career in 2001 and earned a B.S. from North Carolina State University, an M.S. from the University of Colorado, Boulder, and an M.B.A. from the Anderson School of Management at the University of California, Los Angeles.
Other Accounts Managed by the Portfolio Managers:
|
| Other Accounts Managed (Excluding the Fund) | Ownership | ||
Fund | Portfolio | Number | Approximate | Performance- | of Fund |
| Manager | and Type | Total Net | Based | Shares |
|
| of Account* | Assets | Accounts** |
|
Columbia | Paul Wick | 3 RICs | $14.50 billion | 2 PIVs - | None |
Seligman |
| 3 PIVs | $2.14 billion | $1.38 billion |
|
Premium |
| 6 other accounts | $669.77 million | 1 other account |
|
Technology |
|
|
| - $143.92 |
|
Growth |
|
|
| million |
|
Fund, Inc. | Braj Agrawal | 17 other accounts | $8.03 million | None | None |
| Shekhar | 3 RICs | $14.50 billion | None | None |
| Pramanick | 6 other accounts | $8.33 million |
|
|
| Jeetil Patel | 1 RIC | $12.05 billion | None | None |
|
| 8 other accounts | $3.37 million |
|
|
| Christopher | 2 RICs | $2.45 billion | None | None |
| Boova | 7 other accounts | $8.06 million |
|
|
| Vimal Patel | 3 RICs | $14.50 billion | None | None |
|
| 8 other accounts | $6.70 million |
|
|
*RIC refers to a Registered Investment Company; PIV refers to a Pooled Investment Vehicle.
**Number and type of accounts for which the advisory fee paid is based in part or wholly on performance and the aggregate net assets in those accounts.
Potential Conflicts of Interest:
Columbia Management: Like other investment professionals with multiple clients, a Fund's portfolio manager(s) may face certain potential conflicts of interest in connection with managing both the Fund and other accounts at the same time. The Investment Manager and the Funds have adopted compliance policies and procedures that attempt to address certain of the potential conflicts that portfolio managers face in this regard. Certain of these conflicts of interest are summarized below.
The management of accounts with different advisory fee rates and/or fee structures, including accounts that pay advisory fees based on account performance (performance fee accounts), may raise potential conflicts of interest for a portfolio manager by creating an incentive to favor higher fee accounts.
Potential conflicts of interest also may arise when a portfolio manager has personal investments in other accounts that may create an incentive to favor those accounts. As a general matter and subject to the Investment Manager's Code of Ethics and certain limited exceptions, the Investment Manager's investment professionals do not have the opportunity to invest in client accounts, other than the funds.
A portfolio manager who is responsible for managing multiple funds and/or accounts may devote unequal time and attention to the management of those Funds and/or accounts. The effects of this potential conflict may be more pronounced where Funds and/or accounts managed by a particular portfolio manager have different investment strategies.
A portfolio manager may be able to select or influence the selection of the broker/dealers that are used to execute securities transactions for the Funds. A portfolio manager's decision as to the selection of broker/dealers could produce disproportionate costs and benefits among the Funds and the other accounts the portfolio manager manages.
A potential conflict of interest may arise when a portfolio manager buys or sells the same
securities for a Fund and other accounts. On occasions when a portfolio manager considers the purchase or sale of a security to be in the best interests of a Fund as well as other accounts, the Investment Manager's trading desk may, to the extent consistent with applicable laws and regulations, aggregate the securities to be sold or bought in order to obtain the best execution and lower brokerage commissions, if any. Aggregation of trades may create the potential for unfairness to a Fund or another account if a portfolio manager favors one account over another in allocating the securities bought or sold. The Investment Manager and its Participating Affiliates may coordinate their trading operations for certain types of securities and transactions pursuant to personnel-sharing agreements or similar intercompany arrangements. However, typically the Investment Manager does not coordinate trading activities with a Participating Affiliate with respect to accounts of that Participating Affiliate unless such Participating Affiliate is also providing trading services for accounts managed by the Investment Manager. Similarly, a Participating Affiliate typically does not coordinate trading activities with the Investment Manager with respect to accounts of the Investment Manager unless the Investment Manager is also providing trading services for accounts managed by such Participating Affiliate. As a result, it is possible that the Investment Manager and its Participating Affiliates may trade in the same instruments at the same time, in the same or opposite direction or in different sequence, which could negatively impact the prices paid by the Fund on such instruments. Additionally, in circumstances where trading services are being provided on a coordinated basis for the Investment Manager's accounts (including the Funds) and the accounts of one or more Participating Affiliates in accordance with applicable law, it is possible that the allocation opportunities available to the Funds may be decreased, especially for less actively traded securities, or orders may take longer to execute, which may negatively impact Fund performance.
"Cross trades," in which a portfolio manager sells a particular security held by a Fund to another account (potentially saving transaction costs for both accounts), could involve a potential conflict of interest if, for example, a portfolio manager is permitted to sell a security from one account to another account at a higher price than an independent third party would pay. The Investment Manager and the Funds have adopted compliance procedures that provide that any transactions between a Fund and another account managed by the Investment Manager are to be made at a current market price, consistent with applicable laws and regulations.
Another potential conflict of interest may arise based on the different investment objectives and strategies of a Fund and other accounts managed by its portfolio manager(s). Depending on another account's objectives and other factors, a portfolio manager may give advice to and make decisions for a Fund that may differ from advice given, or the timing or nature of decisions made, with respect to another account. A portfolio manager's investment decisions are the product of many factors in addition to basic suitability for the particular account involved. Thus, a portfolio manager may buy or sell a particular security for certain accounts, and not for a Fund, even though it could have been bought or sold for the Fund at the same time. A portfolio manager also may buy a particular security for one or more accounts when one or more other accounts are selling the security (including short sales). There may be circumstances when a portfolio manager's purchases or sales of portfolio securities for one or more accounts may have an adverse effect on other accounts, including the Funds.
To the extent a Fund invests in underlying funds, a portfolio manager will be subject to additional potential conflicts of interest. Because of the structure of funds-of-funds, the potential conflicts of interest for the portfolio managers may be different than the potential conflicts of interest for portfolio managers who manage other Funds. The Investment Manager and its affiliates may receive higher compensation as a result of allocations to underlying funds with higher fees.
A Fund's portfolio manager(s) also may have other potential conflicts of interest in managing the Fund, and the description above is not a complete description of every conflict that could exist in managing the Fund and other accounts. Many of the potential conflicts of interest to which the Investment Manager's portfolio managers are subject are essentially the same or similar to the potential conflicts of interest related to the investment management activities of the Investment Manager and its affiliates.
Structure of Compensation:
Portfolio manager compensation is typically comprised of (i) a base salary and (ii) an annual cash bonus. The annual cash bonus, and in most instances the base salary, are paid from a team compensation pool that is based on fees and performance of the accounts managed by the portfolio management team, which might include mutual funds, wrap accounts, institutional portfolios and hedge funds.
The percentage of management fees on mutual funds that fund the bonus pool is based on the short term (typically one-year) and long-term (typically three-year and five-year) performance of those accounts in relation to the relevant peer group universe.
The pool is also funded by a percentage of the management fees on long-only institutional separate accounts, that percentage being based on the source of the account in question, and by a fixed percentage of management fees on hedge funds and separately managed accounts that follow a hedge fund mandate.
The percentage of performance fees on hedge funds and separately managed accounts that follow a hedge fund mandate that fund the bonus pool is based on the absolute level of each hedge fund's current year investment return.
For all employees the benefit programs generally are the same and are competitive within the financial services industry. Employees participate in a wide variety of plans, including options in Medical, Dental, Vision, Health Care and Dependent Spending Accounts, Life Insurance, Long Term Disability Insurance, 401(k), and a cash balance pension plan.
Item 9. Purchases of Equity Securities by Closed-End Management Investment Company and Affiliated Purchasers.
The Fund has a share repurchase plan approved by the Fund's Board of Directors, which authorizes repurchases of the Fund's common stock in the open market at times when shares are trading at a discount from NAV and in an amount approximately sufficient to offset the growth in the number of common shares attributable to the reinvestment of the
portion of its distributions to common stockholders attributable to distributions received from portfolio investments less Fund expenses. For the year ended December 31, 2021, the Fund didn't purchase any shares of its Common Stock in the open market.
Item 10. Submission of Matters to a Vote of Security Holders.
There were no material changes to the procedures by which shareholders may recommend nominees to the registrant's board of directors.
Item 11. Controls and Procedures.
(a)The registrant's principal executive officer and principal financial officer, based on their evaluation of the registrant's disclosure controls and procedures as of a date within 90 days of the filing of this report, have concluded that such controls and procedures are adequately designed to ensure that information required to be disclosed by the registrant in Form N-CSR is accumulated and communicated to the registrant's management, including the principal executive officer and principal financial officer, or persons performing similar functions, as appropriate to allow timely decisions regarding required disclosure.
(b)There was no change in the registrant's internal control over financial reporting that occurred during the period covered by this report that has materially affected, or is reasonably likely to materially affect, the registrant's internal control over financial reporting.
Item 12. Disclosure of Securities Lending Activities for Closed-End Management Investment Companies
Not applicable.
Item 13. Exhibits.
(a)(3) None.
SIGNATURES
Pursuant to the requirements of the Securities Exchange Act of 1934 and the Investment Company Act of 1940, the registrant has duly caused this report to be signed on its behalf by the undersigned, thereunto duly
authorized. |
| ||
(registrant) |
| Columbia Seligman Premium Technology Growth Fund, Inc | |
By (Signature and Title) | /s/ Daniel J. Beckman | ||
|
|
| Daniel J. Beckman, President and Principal Executive Officer |
Date |
| February 22, 2022 | |
Pursuant to the requirements of the Securities Exchange Act of 1934 and the Investment Company Act of 1940, this report has been signed below by the following persons on behalf of the registrant and in the capacities and on the dates indicated.
By (Signature and Title) | /s/ Daniel J. Beckman | |
|
| Daniel J. Beckman, President and Principal Executive Officer |
Date |
| February 22, 2022 |
By (Signature and Title) | /s/ Michael G. Clarke | |
|
| Michael G. Clarke, Chief Financial Officer, Principal Financial Officer |
|
| and Senior Vice President |
Date |
| February 22, 2022 |
By (Signature and Title) | /s/ Joseph Beranek | |
|
| Joseph Beranek, Treasurer, Chief Accounting Officer and Principal |
|
| Financial Officer |
Date |
| February 22, 2022 |