UNITED STATES
SECURITIES AND EXCHANGE COMMISSION
Washington, D.C. 20549
FORMN-CSR
CERTIFIED SHAREHOLDER REPORT OF REGISTERED
MANAGEMENT INVESTMENT COMPANIES
Investment Company Act file number811-22334
Western Asset Global Corporate Defined Opportunity Fund Inc.
(Exact name of registrant as specified in charter)
620 Eighth Avenue, 49th Floor, New York, NY 10018
(Address of principal executive offices) (Zip code)
Robert I. Frenkel, Esq.
Legg Mason & Co., LLC
100 First Stamford Place
Stamford, CT 06902
(Name and address of agent for service)
Registrant’s telephone number, including area code: (888)777-0102
Date of fiscal year end: October 31
Date of reporting period: April 30, 2019
ITEM 1. REPORT TO STOCKHOLDERS.
TheSemi-Annual Report to Stockholders is filed herewith.

| | |
| Semi-Annual Report | | April 30, 2019 |
WESTERN ASSET
GLOBAL CORPORATE DEFINED OPPORTUNITY FUND INC. (GDO)
Beginning in April 2021, as permitted by regulations adopted by the Securities and Exchange Commission, the Fund intends to no longer mail paper copies of the Fund’s shareholder reports like this one, unless you specifically request paper copies of the reports from the Fund or from your Service Agent or financial intermediary (such as a broker-dealer or bank). Instead, the reports will be made available on a website, and you will be notified by mail each time a report is posted and provided with a website link to access the report.
If you invest through a financial intermediary and you already elected to receive shareholder reports electronically(“e-delivery”), you will not be affected by this change and you need not take any action. If you have not already electede-delivery, you may elect to receive shareholder reports and other communications from the Fund electronically by contacting your financial intermediary.
You may elect to receive all future reports in paper free of charge. If you invest through a financial intermediary, you can contact your financial intermediary to request that you continue to receive paper copies of your shareholder reports. That election will apply to all Legg Mason funds held in your account at that financial intermediary. If you are a direct shareholder with the Fund, you can call the Fund at 1-888-888-0151, or write to the Fund by regular mail at P.O. Box 505000, Louisville, KY 40233 or by overnight delivery to Computershare, 462 South 4th Street, Suite 1600, Louisville, KY 40202 to let the Fund know you wish to continue receiving paper copies of your shareholder reports. That election will apply to all Legg Mason Funds held in your account held directly with the fund complex.

|
| INVESTMENT PRODUCTS: NOT FDIC INSURED • NO BANK GUARANTEE • MAY LOSE VALUE |
Fund objectives
The Fund’s primary investment objective is to provide current income and then to liquidate and distribute substantially all of the Fund’s net assets to stockholders on or about December 2, 2024. As a secondary investment objective, the Fund will seek capital appreciation. There can be no assurance the Fund will achieve its investment objectives.
The Fund seeks to achieve its investment objectives by investing, under normal market conditions, at least 80% of its managed assets in a portfolio of U.S. and foreign corporate fixed-income securities of varying maturities.
Letter from the chairman

Dear Shareholder,
We are pleased to provide the semi-annual report of Western Asset Global Corporate Defined Opportunity Fund Inc. for thesix-month reporting period ended April 30, 2019. Please read on for Fund performance information and a detailed look at prevailing economic and market conditions during the Fund’s reporting period.
As always, we remain committed to providing you with excellent service and a full spectrum of investment choices. We also remain committed to supplementing the support you receive from your financial advisor. One way we accomplish this is through our website, www.lmcef.com. Here you can gain immediate access to market and investment information, including:
| • | | Fund prices and performance, |
| • | | Market insights and commentaries from our portfolio managers, and |
| • | | A host of educational resources. |
We look forward to helping you meet your financial goals.
Sincerely,

Jane Trust, CFA
Chairman, President and Chief Executive Officer
May 31, 2019
| | |
| II | | Western Asset Global Corporate Defined Opportunity Fund Inc. |
Investment commentary
Economic review
Economic activity in the U.S. was mixed during the six months ended April 30, 2019 (the “reporting period”). Looking back, the U.S. Department of Commerce reported that third quarter 2018 U.S. gross domestic product (“GDP”)i growth was 3.4%. Fourth quarter 2018 GDP growth then moderated to 2.2%. Finally, the U.S. Department of Commerce’s second reading for first quarter 2019 GDP growth, released after the reporting period ended, was 3.1%. The acceleration in GDP growth during the first quarter of 2019 was attributed to an upturn in state and local government spending, increases in private inventory investment and exports, and a smaller decrease in residential investment. These movements were partly offset by decelerations in personal consumption expenditures and nonresidential fixed investment, along with a downturn in federal government spending. Imports also turned down.
Job growth in the U.S. was solid overall and was a tailwind for the economy during the reporting period. As reported by the U.S. Department of Labor, when the reporting period ended on April 30, 2019, the unemployment rate was 3.6%, versus 3.7% when the period began. April 2019’s reading was the lowest reading since December 1969. However, the percentage of longer-term unemployed moved higher during the reporting period. In April 2019, 21.1% of Americans looking for a job had been out of work for more than six months, versus 20.8% when the period began.
Turning to the global economy, in its April 2019World Economic Outlook Update, the International Monetary Fund (“IMF”)ii said, “After strong growth in 2017 and early 2018, global economic activity slowed notably in the second half of last year, reflecting a confluence of factors affecting major economies. China’s growth declined following a combination of needed regulatory tightening to rein in shadow banking and an increase in trade tensions with the United States. The euro area economy lost more momentum than expected as consumer and business confidence weakened and car production in Germany was disrupted by the introduction of new emission standards; investment dropped in Italy as sovereign spreads widened; and external demand, especially from emerging Asia, softened. Elsewhere, natural disasters hurt activity in Japan. Trade tensions increasingly took a toll on business confidence and, so, financial market sentiment worsened, with financial conditions tightening for vulnerable emerging markets in the spring of 2018 and then in advanced economies later in the year, weighing on global demand. Conditions have eased in 2019 as the US Federal Reserve signaled a more accommodative monetary policy stance and markets became more optimistic about a US — China trade deal, but they remain slightly more restrictive than in the fall [of 2018].” From a regional perspective, the IMF projects 2019 growth in the Eurozone will be 1.3%, versus 1.8% in 2018. Japan’s economy is expected to expand 1.0% in 2019, compared to 0.8% in 2018. Elsewhere, the IMF projects that overall growth in emerging market countries will decelerate to 4.4% in 2019, versus 4.5% in 2018.
| | |
| Western Asset Global Corporate Defined Opportunity Fund Inc. | | III |
Investment commentary (cont’d)
Market review
Q. How did the Federal Reserve Board (the “Fed”)iii respond to the economic environment?
A. The Fed continued tightening its monetary policy, as it raised interest rates once during the reporting period and further reduced its balance sheet. As widely expected, the Fed raised the federal funds rateiv at its meeting that ended on December 19, 2018, to a range between 2.25% and 2.50%. This represented the Fed’s fourth rate hike in 2018. However, at its meeting that concluded on January 30, 2019, the Fed kept interest rates on hold and said, “In light of global economic and financial developments and muted inflation pressures, the Committee will be patient as it determines what future adjustments to the target range for the federal funds rate may be appropriate ….” Finally, at its meeting that concluded on March 20, 2019, most Federal Open Market Committee (“FOMC”)v members indicated that they did not feel additional rate hikes would be needed in 2019.
Q. What actions did international central banks take during the reporting period?
A. Central banks outside the U.S. generally pursued accommodative monetary policies during the reporting period. Looking back, in December 2018, the European Central Bank (“ECB”)vi ended its bond buying program and said that it did not anticipate raising interest rates “at least through the summer of 2019”. However, in March 2019, the ECB said it didn’t expect to raise rates “at least through the end of 2019.” In other developed countries, the Bank of Englandvii kept rates on hold at 0.75% throughout the reporting period. After holding rates steady at 0.10% for more than five years, in January 2016, the Bank of Japanviii announced that it cut the rate on current accounts that commercial banks hold with it to-0.10% and kept rates on hold during the reporting period. Elsewhere, the People’s Bank of Chinaix kept rates steady at 4.35% during the reporting period.
Q. Did Treasury yields trend higher or lower during the reporting period?
A. Both short-term and longer-term U.S. Treasury yields declined during thesix-month reporting period ended April 30, 2019. The yield for thetwo-year Treasury note began the reporting period at 2.87% and ended the period at 2.27%. The low for the period of 2.22% took place on March 27, 2019, and the peak for the period of 2.98% occurred on November 8, 2018. The yield for theten-year Treasury began the reporting period at 3.15% and ended the period at 2.51%. The low for the period of 2.39% took place on March 27, 2019, and the high for the period of 3.24% took place on November 8, 2018.
Q. What factors impacted the spread sectors(non-Treasuries) during the reporting period?
A.The spread sectors posted positive absolute returns during the reporting period. Performance fluctuated given changing expectations for global growth, central bank monetary policy adjustments, concerns over the trade conflict between the U.S. and China, and periods of investor risk aversion. All told, the broad U.S. bond market, as measured by the Bloomberg Barclays U.S. Aggregate Indexx, returned 5.49% during thesix-month reporting period ended April 30, 2019.
| | |
| IV | | Western Asset Global Corporate Defined Opportunity Fund Inc. |
Q. How did the high-yield bond market perform over the reporting period?
A.The U.S. high-yield bond market, as measured by the Bloomberg Barclays U.S. Corporate High Yield — 2% Issuer Cap Indexxi, returned 5.54% for the six months ended April 30, 2019. The high-yield market posted weak results over the first two months of the reporting period as investor risk aversion was elevated and there were concerns that Fed rate hikes might negatively impact the economic expansion. However, the high-yield market then rallied over the last four months of the period. This turnaround was driven by corporate earnings that were strong overall, the Fed’s intention to not raise interest rates in 2019 and robust investor demand.
Q. How did the emerging market debt asset class perform over the reporting period?
A. The JPMorgan Emerging Markets Bond Index Global (“EMBI Global”)xii returned 7.86% during the six months ended April 30, 2019. The asset class modestly declined during the first month of the reporting period, due to rising U.S. interest rates and investor risk aversion. The asset class rallied sharply over the last five months of the period. Investor sentiment for the asset class improved as the Fed announced an end to rate hikes in 2019, the U.S. dollar weakened at times and U.S. interest rates declined.
Performance review
For the six months ended April 30, 2019, Western Asset Global Corporate Defined Opportunity Fund Inc. returned 7.05% based on its net asset value (“NAV”)xiii and 15.30% based on its New York Stock Exchange (“NYSE”) market price per share. The Fund’s unmanaged benchmark, the Bloomberg Barclays Global Aggregate Corporate Indexxiv, returned 5.53% for the same period. The Lipper Global IncomeClosed-End Funds Category Averagexv returned 5.63% over the same time frame. Please note that Lipper performance returns are based on each fund’s NAV.
During thissix-month period, the Fund made distributions to shareholders totaling $0.61 per share. As of April 30, 2019, the Fund estimates that 82% of the distributions were sourced from net investment income and 18% constituted a return of capital.* The performance table shows the Fund’ssix-month total return based on its NAV and market price as of April 30, 2019.Past performance is no guarantee of future results.
| | | | |
Performance Snapshotas of April 30, 2019
(unaudited) | |
| Price Per Share | | 6-Month
Total Return** | |
| $17.98 (NAV) | | | 7.05 | %† |
| $16.88 (Market Price) | | | 15.30 | %‡ |
All figures represent past performance and are not a guarantee of future results. Performance figures for periods shorter than one year represent cumulative figures and are not annualized.
| * | These estimates are not for tax purposes. The Fund will issue a Form 1099 with final composition of the distributions for tax purposes afteryear-end. A return of capital is not taxable and results in a reduction in the tax basis of a shareholder’s investment. For more information about a distribution’s composition, please refer to the Fund’s distribution press release or, if applicable, the Section 19 notice located in the press release section of our website, www.lmcef.com (click on the name of the Fund). |
| | |
| Western Asset Global Corporate Defined Opportunity Fund Inc. | | V |
Investment commentary (cont’d)
** Total returns are based on changes in NAV or market price, respectively. Returns reflect the deduction of all Fund expenses, including management fees, operating expenses, and other Fund expenses. Returns do not reflect the deduction of brokerage commissions or taxes that investors may pay on distributions or the sale of shares.
† Total return assumes the reinvestment of all distributions, including returns of capital, if any, at NAV.
‡ Total return assumes the reinvestment of all distributions, including returns of capital, if any, in additional shares in accordance with the Fund’s Dividend Reinvestment Plan.
Looking for additional information?
The Fund is traded under the symbol “GDO” and its closing market price is available in most newspapers under the NYSE listings. The daily NAV is availableon-line under the symbol “XGDOX” on most financial websites.Barron’s and the Wall Street Journal’sMonday edition both carryclosed-end fund tables that provide additional information. In addition, the Fund issues a quarterly press release that can be found on most major financial websites as well as www.lmcef.com (click on the name of the Fund).
In a continuing effort to provide information concerning the Fund, shareholders may call1-888-777-0102 (toll free), Monday through Friday from 8:00 a.m. to 5:30 p.m. Eastern time, for the Fund’s current NAV, market price and other information.
Thank you for your investment in Western Asset Global Corporate Defined Opportunity Fund Inc. As always, we appreciate that you have chosen us to manage your assets and we remain focused on achieving the Fund’s investment goals.
Sincerely,
Jane Trust, CFA
Chairman, President and Chief Executive Officer
May 31, 2019
RISKS: The Fund is anon-diversified,closed-end management investment company designed primarily as a long-term investment and not as a trading vehicle. The Fund is not intended to be a complete investment program and, due to the uncertainty inherent in all investments, there can be no assurance that the Fund will achieve its investment objective. The Fund’s common stock is traded on the New York Stock Exchange. Similar to stocks, the Fund’s share price will fluctuate with market conditions and, at the time of sale, may be worth more or less than the original investment. Shares ofclosed-end funds often trade at a discount to their net asset value. Because the Fund isnon-diversified, it may be more susceptible to economic, political or regulatory events than a diversified fund. The Fund’s investments are subject to a number of risks, such as credit risk, inflation risk, call risk and interest rate risk. As interest rates rise, bond prices fall, reducing the value of the Fund’s holdings. The Fund may invest in lower-rated high-yield bonds, known as “junk bonds,” which are subject to greater credit risk (risk of default) than higher-rated obligations. The Fund’s investments in foreign securities involve risks, including the possibility of losses due to changes in currency exchange rates and negative developments in the political, social, economic or regulatory structure of specific countries or regions. These risks are magnified in emerging markets. The Fund may make significant investments in derivative
| | |
| VI | | Western Asset Global Corporate Defined Opportunity Fund Inc. |
instruments. Derivative instruments can be illiquid, may disproportionately increase losses, and have a potentially large impact on Fund performance. Leverage may result in greater volatility of NAV and the market price of common shares and increases a shareholder’s risk of loss.
All investments are subject to risk including the possible loss of principal. Past performance is no guarantee of future results. All index performance reflects no deduction for fees, expenses or taxes. Please note that an investor cannot invest directly in an index.
The information provided is not intended to be a forecast of future events, a guarantee of future results or investment advice. Views expressed may differ from those of the firm as a whole. Forecasts and predictions are inherently limited and should not be relied upon as an indication of actual or future performance.
| i | Gross domestic product (“GDP”) is the market value of all final goods and services produced within a country in a given period of time. |
| ii | The International Monetary Fund (“IMF”) is an organization of 189 countries, working to foster global monetary cooperation, secure financial stability, facilitate international trade, promote high employment and sustainable economic growth, and reduce poverty around the world. |
| iii | The Federal Reserve Board (the “Fed”) is responsible for the formulation of U.S. policies designed to promote economic growth, full employment, stable prices and a sustainable pattern of international trade and payments. |
| iv | The federal funds rate is the rate charged by one depository institution on an overnight sale of immediately available funds (balances at the Federal Reserve) to another depository institution; the rate may vary from depository institution to depository institution and from day to day. |
| v | The Federal Open Market Committee (“FOMC”) is a policy-making body of the Federal Reserve System responsible for the formulation of a policy designed to promote economic growth, full employment, stable prices and a sustainable pattern of international trade and payments. |
| vi | The European Central Bank (“ECB”) is responsible for the monetary system of the European Union and the euro currency. |
| vii | The Bank of England (“BoE”), formally the Governor and Company of the BoE, is the central bank of the United Kingdom. The BoE’s purpose is to maintain monetary and financial stability. |
| viii | The Bank of Japan is the central bank of Japan. The bank is responsible for issuing and handling currency and treasury securities, implementing monetary policy, maintaining the stability of the Japanese financial system and the yen currency. |
| ix | The People’s Bank of China is the central bank of the People’s Republic of China with the power to carry out monetary policy and regulate financial institutions in mainland China. |
| x | The Bloomberg Barclays U.S. Aggregate Index is a broad-based bond index comprised of government, corporate, mortgage- and asset-backed issues, rated investment grade or higher, and having at least one year to maturity. |
| xi | The Bloomberg Barclays U.S. Corporate High Yield — 2% Issuer Cap Index is an index of the 2% Issuer Cap component of the Bloomberg Barclays U.S. Corporate High Yield Index, which covers the U.S. dollar-denominated,non-investment grade, fixed-rate, taxable corporate bond market. |
| xii | The JPMorgan Emerging Markets Bond Index Global (“EMBI Global”) tracks total returns for U.S. dollar-denominated debt instruments issued by emerging market sovereign and quasi-sovereign entities: Brady bonds, loans, Eurobonds and local market instruments. |
| xiii | Net asset value (“NAV”) is calculated by subtracting total liabilities, including liabilities associated with financial leverage (if any) from the closing value of all securities held by the Fund (plus all other assets) and dividing the result (total net assets) by the total number of the common shares outstanding. The NAV fluctuates with changes in the market prices of securities in which the Fund has invested. However, the price at which an investor may buy or sell shares of the Fund is the Fund’s market price as determined by supply of and demand for the Fund’s shares. |
| xiv | The Bloomberg Barclays Global Aggregate Corporate Index is the corporate component of the Bloomberg Barclays Global Aggregate Index, which is comprised of several other Bloomberg Barclays indices that measure fixed-income performance of regions around the world. |
| xv | Lipper, Inc., a wholly-owned subsidiary of Reuters, provides independent insight on global collective investments. Returns are based on thesix-month period ended April 30, 2019, including the reinvestment of all distributions, including returns of capital, if any, calculated among the 15 funds in the Fund’s Lipper category. |
| | |
| Western Asset Global Corporate Defined Opportunity Fund Inc. | | VII |
Fund at a glance†(unaudited)
Investment breakdown(%) as a percent of total investments
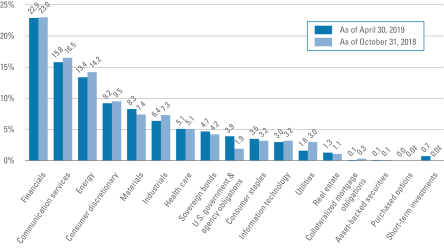
| † | The bar graph above represents the composition of the Fund’s investments as of April 30, 2019 and October 31, 2018 and does not include derivatives, such as futures, written options and forward foreign currency contracts. The Fund is actively managed. As a result, the composition of the Fund’s investments is subject to change at any time. |
| ‡ | Represents less than 0.1%. |
| | |
| Western Asset Global Corporate Defined Opportunity Fund Inc. 2019 Semi-Annual Report | | 1 |
Spread duration(unaudited)
Economic exposure — April 30, 2019
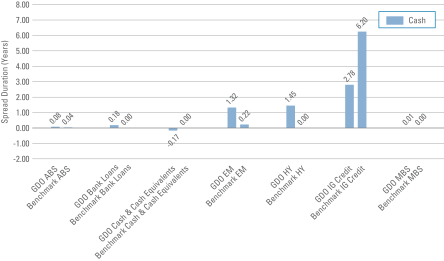
| | |
| Total Spread Duration |
| |
| GDO | | — 5.65 years |
| |
| Benchmark | | — 6.46 years |
Spread duration measures the sensitivity to changes in spreads. The spread over Treasuries is the annual risk-premium demanded by investors to holdnon-Treasury securities. Spread duration is quantified as the % change in price resulting from a 100 basis points change in spreads. For a security with positive spread duration, an increase in spreads would result in a price decline and a decline in spreads would result in a price increase. This chart highlights the market sector exposure of the Fund’s sectors relative to the selected benchmark sectors as of the end of the reporting period.
| | |
| |
| ABS | | — Asset-Backed Securities |
| |
| Benchmark | | — Bloomberg Barclays Global Aggregate Corporate Index |
| |
| EM | | — Emerging Markets |
| |
| GDO | | — Western Asset Global Corporate Defined Opportunity Fund Inc. |
| |
| HY | | — High Yield |
| |
| IG Credit | | — Investment Grade Credit |
| |
| MBS | | — Mortgage-Backed Securities |
| | |
| 2 | | Western Asset Global Corporate Defined Opportunity Fund Inc. 2019 Semi-Annual Report |
Effective duration(unaudited)
Interest rate exposure— April 30, 2019
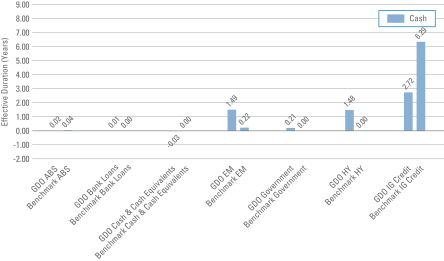
| | |
| Total Effective Duration |
| |
| GDO | | — 5.90 years |
| |
| Benchmark | | — 6.55 years |
Effective duration measures the sensitivity to changes in relevant interest rates. Effective duration is quantified as the % change in price resulting from a 100 basis points change in interest rates. For a security with positive effective duration, an increase in interest rates would result in a price decline and a decline in interest rates would result in a price increase. This chart highlights the interest rate exposure of the Fund’s sectors relative to the selected benchmark sectors as of the end of the reporting period.
| | |
| |
| ABS | | — Asset-Backed Securities |
| |
| Benchmark | | — Bloomberg Barclays Global Aggregate Corporate Index |
| |
| EM | | — Emerging Markets |
| |
| GDO | | — Western Asset Global Corporate Defined Opportunity Fund Inc. |
| |
| HY | | — High Yield |
| |
| IG Credit | | — Investment Grade Credit |
| | |
| Western Asset Global Corporate Defined Opportunity Fund Inc. 2019 Semi-Annual Report | | 3 |
Schedule of investments(unaudited)
April 30, 2019
Western Asset Global Corporate Defined Opportunity Fund Inc.
| | | | | | | | | | | | | | | | |
| Security‡ | | Rate | | | Maturity
Date | | | Face
Amount† | | | Value | |
| Corporate Bonds & Notes — 112.0% | |
| Communication Services — 18.8% | |
Diversified Telecommunication Services — 4.6% | |
Cogent Communications Group Inc., Senior Secured Notes | | | 5.375 | % | | | 3/1/22 | | | | 565,000 | | | $ | 586,188 | (a) |
Ooredoo International Finance Ltd., Senior Notes | | | 4.750 | % | | | 2/16/21 | | | | 650,000 | | | | 669,432 | (a) |
Qwest Corp., Senior Notes | | | 6.750 | % | | | 12/1/21 | | | | 2,500,000 | | | | 2,670,587 | |
Telecom Italia Capital SA, Senior Notes | | | 6.000 | % | | | 9/30/34 | | | | 420,000 | | | | 390,600 | |
Telecom Italia SpA, Senior Notes | | | 5.303 | % | | | 5/30/24 | | | | 400,000 | | | | 400,000 | (a) |
Telefonica Emisiones SAU, Senior Notes | | | 5.134 | % | | | 4/27/20 | | | | 2,000,000 | | | | 2,044,125 | |
Telefonica Emisiones SAU, Senior Notes | | | 7.045 | % | | | 6/20/36 | | | | 2,000,000 | | | | 2,483,172 | |
UPCB Finance IV Ltd., Senior Secured Notes | | | 5.375 | % | | | 1/15/25 | | | | 600,000 | | | | 614,820 | (a) |
Verizon Communications Inc., Senior Notes | | | 5.150 | % | | | 9/15/23 | | | | 1,200,000 | | | | 1,313,953 | |
Windstream Services LLC/Windstream Finance Corp., Secured Notes | | | 10.500 | % | | | 6/30/24 | | | | 1,570,000 | | | | 1,099,000 | *(a)(b) |
Total Diversified Telecommunication Services | | | | | | | | | | | | | | | 12,271,877 | |
Entertainment — 0.5% | | | | | | | | | | | | | | | | |
Netflix Inc., Senior Notes | | | 5.875 | % | | | 11/15/28 | | | | 670,000 | | | | 708,525 | |
Netflix Inc., Senior Notes | | | 6.375 | % | | | 5/15/29 | | | | 510,000 | | | | 558,450 | (a) |
Total Entertainment | | | | | | | | | | | | | | | 1,266,975 | |
Media — 10.1% | | | | | | | | | | | | | | | | |
Altice France SA, Senior Secured Notes | | | 7.375 | % | | | 5/1/26 | | | | 2,310,000 | | | | 2,346,094 | (a) |
Altice France SA, Senior Secured Notes | | | 8.125 | % | | | 2/1/27 | | | | 1,323,000 | | | | 1,385,842 | (a) |
Altice Luxembourg SA, Senior Notes | | | 7.750 | % | | | 5/15/22 | | | | 2,820,000 | | | | 2,879,925 | (a) |
CCO Holdings LLC/CCO Holdings Capital Corp., Senior Notes | | | 5.125 | % | | | 5/1/27 | | | | 100,000 | | | | 101,750 | (a) |
CCO Holdings LLC/CCO Holdings Capital Corp., Senior Notes | | | 5.000 | % | | | 2/1/28 | | | | 1,720,000 | | | | 1,722,150 | (a) |
Charter Communications Operating LLC/ Charter Communications Operating Capital Corp., Senior Secured Notes | | | 6.384 | % | | | 10/23/35 | | | | 720,000 | | | | 814,709 | |
Charter Communications Operating LLC/ Charter Communications Operating Capital Corp., Senior Secured Notes | | | 6.484 | % | | | 10/23/45 | | | | 2,660,000 | | | | 3,017,672 | |
Comcast Corp., Senior Notes | | | 5.700 | % | | | 7/1/19 | | | | 1,800,000 | | | | 1,808,883 | |
Comcast Corp., Senior Notes | | | 3.700 | % | | | 4/15/24 | | | | 2,000,000 | | | | 2,071,122 | |
DISH DBS Corp., Senior Notes | | | 5.875 | % | | | 11/15/24 | | | | 960,000 | | | | 831,600 | |
DISH DBS Corp., Senior Notes | | | 7.750 | % | | | 7/1/26 | | | | 2,810,000 | | | | 2,521,975 | |
Entercom Media Corp., Secured Notes | | | 6.500 | % | | | 5/1/27 | | | | 810,000 | | | | 828,225 | (a) |
Grupo Televisa SAB, Senior Notes | | | 6.625 | % | | | 1/15/40 | | | | 1,730,000 | | | | 2,020,607 | |
UBM PLC, Senior Notes | | | 5.750 | % | | | 11/3/20 | | | | 1,500,000 | | | | 1,549,608 | (a) |
UPC Holding BV, Senior Secured Notes | | | 5.500 | % | | | 1/15/28 | | | | 850,000 | | | | 860,625 | (a) |
Virgin Media Finance PLC, Senior Notes | | | 6.000 | % | | | 10/15/24 | | | | 520,000 | | | | 540,150 | (a) |
See Notes to Financial Statements.
| | |
| 4 | | Western Asset Global Corporate Defined Opportunity Fund Inc. 2019 Semi-Annual Report |
Western Asset Global Corporate Defined Opportunity Fund Inc.
| | | | | | | | | | | | | | | | |
| Security‡ | | Rate | | | Maturity
Date | | | Face
Amount† | | | Value | |
Media — continued | | | | | | | | | | | | | | | | |
Virgin Media Secured Finance PLC, Senior Secured Notes | | | 5.250 | % | | | 1/15/26 | | | | 840,000 | | | $ | 857,606 | (a) |
Virgin Media Secured Finance PLC, Senior Secured Notes | | | 5.500 | % | | | 8/15/26 | | | | 1,020,000 | | | | 1,048,081 | (a) |
Total Media | | | | | | | | | | | | | | | 27,206,624 | |
Wireless Telecommunication Services — 3.6% | | | | | | | | | | | | | | | | |
America Movil SAB de CV, Senior Notes | | | 6.125 | % | | | 3/30/40 | | | | 650,000 | | | | 812,063 | |
CSC Holdings LLC, Senior Notes | | | 6.625 | % | | | 10/15/25 | | | | 760,000 | | | | 809,400 | (a) |
CSC Holdings LLC, Senior Notes | | | 10.875 | % | | | 10/15/25 | | | | 1,143,000 | | | | 1,317,308 | (a) |
CSC Holdings LLC, Senior Notes | | | 6.500 | % | | | 2/1/29 | | | | 790,000 | | | | 849,744 | (a) |
Sprint Capital Corp., Senior Notes | | | 8.750 | % | | | 3/15/32 | | | | 90,000 | | | | 94,725 | |
Sprint Communications Inc., Senior Notes | | | 11.500 | % | | | 11/15/21 | | | | 1,000,000 | | | | 1,155,000 | |
Sprint Corp., Senior Notes | | | 7.875 | % | | | 9/15/23 | | | | 3,410,000 | | | | 3,560,722 | |
Vodafone Group PLC, Senior Notes | | | 4.375 | % | | | 5/30/28 | | | | 1,000,000 | | | | 1,030,649 | |
Total Wireless Telecommunication Services | | | | | | | | | | | | | | | 9,629,611 | |
Total Communication Services | | | | | | | | | | | | | | | 50,375,087 | |
| Consumer Discretionary — 8.6% | |
Auto Components — 1.3% | | | | | | | | | | | | | | | | |
Adient Global Holdings Ltd., Senior Notes | | | 4.875 | % | | | 8/15/26 | | | | 1,050,000 | | | | 858,375 | (a) |
Adient US LLC, Senior Secured Notes | | | 7.000 | % | | | 5/15/26 | | | | 530,000 | | | | 543,913 | (a)(c) |
American Axle & Manufacturing Inc., Senior Notes | | | 6.250 | % | | | 4/1/25 | | | | 129,000 | | | | 130,143 | |
American Axle & Manufacturing Inc., Senior Notes | | | 6.250 | % | | | 3/15/26 | | | | 150,000 | | | | 150,750 | |
American Axle & Manufacturing Inc., Senior Notes | | | 6.500 | % | | | 4/1/27 | | | | 621,000 | | | | 627,868 | |
JB Poindexter & Co. Inc., Senior Notes | | | 7.125 | % | | | 4/15/26 | | | | 1,300,000 | | | | 1,332,500 | (a) |
Total Auto Components | | | | | | | | | | | | | | | 3,643,549 | |
Automobiles — 0.3% | | | | | | | | | | | | | | | | |
General Motors Co., Senior Notes | | | 6.600 | % | | | 4/1/36 | | | | 720,000 | | | | 789,544 | |
Diversified Consumer Services — 1.2% | | | | | | | | | | | | | | | | |
Carriage Services Inc., Senior Notes | | | 6.625 | % | | | 6/1/26 | | | | 1,170,000 | | | | 1,210,950 | (a) |
Co-operative Group Holdings 2011 Ltd., Senior Notes | | | 6.875 | % | | | 7/8/20 | | | | 100,000 | GBP | | | 137,213 | (d) |
Prime Security Services Borrower LLC/Prime Finance Inc., Senior Secured Notes | | | 5.250 | % | | | 4/15/24 | | | | 340,000 | | | | 341,700 | (a) |
Prime Security Services Borrower LLC/Prime Finance Inc., Senior Secured Notes | | | 5.750 | % | | | 4/15/26 | | | | 1,110,000 | | | | 1,124,097 | (a) |
Weight Watchers International Inc., Senior Notes | | | 8.625 | % | | | 12/1/25 | | | | 340,000 | | | | 297,500 | (a) |
Total Diversified Consumer Services | | | | | | | | | | | | | | | 3,111,460 | |
Hotels, Restaurants & Leisure — 3.0% | |
1011778 BC ULC/New Red Finance Inc., Senior Secured Notes | | | 4.250 | % | | | 5/15/24 | | | | 1,210,000 | | | | 1,194,875 | (a) |
Hilton Domestic Operating Co. Inc., Senior Notes | | | 5.125 | % | | | 5/1/26 | | | | 370,000 | | | | 379,713 | (a) |
Marston’s Issuer PLC, Secured Notes (5.641% to 7/15/19 then 3 mo. GBP LIBOR + 2.550%) | | | 5.641 | % | | | 7/15/35 | | | | 1,768,000 | GBP | | | 1,891,640 | (d)(e) |
See Notes to Financial Statements.
| | |
| Western Asset Global Corporate Defined Opportunity Fund Inc. 2019 Semi-Annual Report | | 5 |
Schedule of investments(unaudited) (cont’d)
April 30, 2019
Western Asset Global Corporate Defined Opportunity Fund Inc.
| | | | | | | | | | | | | | | | |
| Security‡ | | Rate | | | Maturity
Date | | | Face
Amount† | | | Value | |
Hotels, Restaurants & Leisure — continued | |
Mitchells & Butlers Finance PLC, Secured Notes | | | 5.965 | % | | | 12/15/23 | | | | 225,905 | GBP | | $ | 316,089 | (d) |
Saga PLC, Senior Notes | | | 3.375 | % | | | 5/12/24 | | | | 1,630,000 | GBP | | | 1,894,127 | (d) |
Silversea Cruise Finance Ltd., Senior Secured Notes | | | 7.250 | % | | | 2/1/25 | | | | 423,000 | | | | 457,369 | (a) |
Viking Cruises Ltd., Senior Notes | | | 6.250 | % | | | 5/15/25 | | | | 400,000 | | | | 416,000 | (a) |
Viking Cruises Ltd., Senior Notes | | | 5.875 | % | | | 9/15/27 | | | | 100,000 | | | | 99,750 | (a) |
VOC Escrow Ltd., Senior Secured Notes | | | 5.000 | % | | | 2/15/28 | | | | 1,540,000 | | | | 1,536,150 | (a) |
Total Hotels, Restaurants & Leisure | | | | | | | | | | | | | | | 8,185,713 | |
Household Durables — 0.3% | | | | | | | | | | | | | | | | |
Lennar Corp., Senior Notes | | | 5.000 | % | | | 6/15/27 | | | | 738,000 | | | | 754,374 | |
Specialty Retail — 2.0% | | | | | | | | | | | | | | | | |
Hertz Corp., Senior Notes | | | 5.875 | % | | | 10/15/20 | | | | 760,000 | | | | 760,950 | |
Maxeda DIY Holding BV, Senior Secured Notes | | | 6.125 | % | | | 7/15/22 | | | | 500,000 | EUR | | | 560,523 | (d) |
Party City Holdings Inc., Senior Notes | | | 6.625 | % | | | 8/1/26 | | | | 900,000 | | | | 894,393 | (a) |
PetSmart Inc., Senior Secured Notes | | | 5.875 | % | | | 6/1/25 | | | | 2,970,000 | | | | 2,706,413 | (a) |
Sally Holdings LLC/Sally Capital Inc., Senior Notes | | | 5.625 | % | | | 12/1/25 | | | | 440,000 | | | | 440,000 | |
Total Specialty Retail | | | | | | | | | | | | | | | 5,362,279 | |
Textiles, Apparel & Luxury Goods — 0.5% | |
CBR Fashion Finance BV, Senior Secured Notes | | | 5.125 | % | | | 10/1/22 | | | | 450,000 | EUR | | | 489,183 | (d) |
Hanesbrands Inc., Senior Notes | | | 4.875 | % | | | 5/15/26 | | | | 880,000 | | | | 885,500 | (a) |
Total Textiles, Apparel & Luxury Goods | | | | | | | | | | | | | | | 1,374,683 | |
Total Consumer Discretionary | | | | | | | | | | | | | | | 23,221,602 | |
| Consumer Staples — 4.8% | | | | | | | | | | | | | | | | |
Beverages — 1.4% | | | | | | | | | | | | | | | | |
Anheuser-Busch Cos LLC/Anheuser-Busch InBev Worldwide Inc., Senior Notes | | | 4.700 | % | | | 2/1/36 | | | | 940,000 | | | | 956,653 | (a) |
Anheuser-Busch InBev Worldwide Inc., Senior Notes | | | 4.150 | % | | | 1/23/25 | | | | 1,000,000 | | | | 1,044,977 | |
Anheuser-Busch InBev Worldwide Inc., Senior Notes | | | 4.000 | % | | | 4/13/28 | | | | 1,690,000 | | | | 1,725,138 | |
Anheuser-Busch InBev Worldwide Inc., Senior Notes | | | 4.750 | % | | | 1/23/29 | | | | 60,000 | | | | 64,294 | |
Total Beverages | | | | | | | | | | | | | | | 3,791,062 | |
Food & Staples Retailing — 0.7% | | | | | | | | | | | | | | | | |
Tesco PLC, Senior Notes | | | 6.125 | % | | | 2/24/22 | | | | 1,200,000 | GBP | | | 1,749,587 | |
Food Products — 1.0% | | | | | | | | | | | | | | | | |
Kraft Heinz Foods Co., Senior Notes | | | 3.950 | % | | | 7/15/25 | | | | 740,000 | | | | 747,372 | |
Pilgrim’s Pride Corp., Senior Notes | | | 5.750 | % | | | 3/15/25 | | | | 100,000 | | | | 102,000 | (a) |
Pilgrim’s Pride Corp., Senior Notes | | | 5.875 | % | | | 9/30/27 | | | | 1,790,000 | | | | 1,852,650 | (a) |
Total Food Products | | | | | | | | | | | | | | | 2,702,022 | |
See Notes to Financial Statements.
| | |
| 6 | | Western Asset Global Corporate Defined Opportunity Fund Inc. 2019 Semi-Annual Report |
Western Asset Global Corporate Defined Opportunity Fund Inc.
| | | | | | | | | | | | | | | | |
| Security‡ | | Rate | | | Maturity
Date | | | Face
Amount† | | | Value | |
Tobacco — 1.7% | | | | | | | | | | | | | | | | |
BAT International Finance PLC, Senior Notes | | | 4.875 | % | | | 2/24/21 | | | | 1,450,000 | EUR | | $ | 1,770,344 | (d) |
Reynolds American Inc., Senior Notes | | | 8.125 | % | | | 6/23/19 | | | | 2,305,000 | | | | 2,322,111 | |
Reynolds American Inc., Senior Notes | | | 5.850 | % | | | 8/15/45 | | | | 540,000 | | | | 559,548 | |
Total Tobacco | | | | | | | | | | | | | | | 4,652,003 | |
Total Consumer Staples | | | | | | | | | | | | | | | 12,894,674 | |
| Energy — 18.2% | | | | | | | | | | | | | | | | |
Oil, Gas & Consumable Fuels — 18.2% | | | | | | | | | | | | | | | | |
Anadarko Petroleum Corp., Senior Notes | | | 6.450 | % | | | 9/15/36 | | | | 870,000 | | | | 1,087,576 | |
Andeavor Logistics LP/Tesoro Logistics Finance Corp., Senior Notes | | | 6.375 | % | | | 5/1/24 | | | | 340,000 | | | | 358,488 | |
Blue Racer Midstream LLC/Blue Racer Finance Corp., Senior Notes | | | 6.625 | % | | | 7/15/26 | | | | 490,000 | | | | 502,863 | (a) |
Chesapeake Energy Corp., Senior Notes | | | 6.875 | % | | | 11/15/20 | | | | 470,000 | | | | 489,533 | |
Chesapeake Energy Corp., Senior Notes | | | 5.375 | % | | | 6/15/21 | | | | 560,000 | | | | 557,200 | |
Chesapeake Energy Corp., Senior Notes | | | 8.000 | % | | | 6/15/27 | | | | 1,200,000 | | | | 1,179,333 | |
Continental Resources Inc., Senior Notes | | | 4.500 | % | | | 4/15/23 | | | | 1,500,000 | | | | 1,551,472 | |
Continental Resources Inc., Senior Notes | | | 3.800 | % | | | 6/1/24 | | | | 500,000 | | | | 505,126 | |
Dolphin Energy Ltd. LLC, Senior Secured Notes | | | 5.888 | % | | | 6/15/19 | | | | 187,480 | | | | 188,517 | (d) |
Ecopetrol SA, Senior Notes | | | 4.125 | % | | | 1/16/25 | | | | 500,000 | | | | 505,000 | |
Ecopetrol SA, Senior Notes | | | 5.875 | % | | | 5/28/45 | | | | 3,000,000 | | | | 3,105,150 | |
Genesis Energy LP/Genesis Energy Finance Corp., Senior Notes | | | 6.250 | % | | | 5/15/26 | | | | 990,000 | | | | 985,050 | |
KazMunayGas National Co. JSC, Senior Notes | | | 4.750 | % | | | 4/19/27 | | | | 2,130,000 | | | | 2,209,560 | (a) |
Lukoil International Finance BV, Senior Notes | | | 6.656 | % | | | 6/7/22 | | | | 1,110,000 | | | | 1,205,752 | (d) |
Lukoil International Finance BV, Senior Notes | | | 4.750 | % | | | 11/2/26 | | | | 1,970,000 | | | | 2,039,328 | (a) |
MEG Energy Corp., Secured Notes | | | 6.500 | % | | | 1/15/25 | | | | 650,000 | | | | 655,687 | (a) |
MEG Energy Corp., Senior Notes | | | 7.000 | % | | | 3/31/24 | | | | 1,250,000 | | | | 1,190,237 | (a) |
NGPL PipeCo LLC, Senior Notes | | | 7.768 | % | | | 12/15/37 | | | | 800,000 | | | | 986,000 | (a) |
Oasis Petroleum Inc., Senior Notes | | | 6.500 | % | | | 11/1/21 | | | | 910,000 | | | | 903,175 | |
Oasis Petroleum Inc., Senior Notes | | | 6.875 | % | | | 1/15/23 | | | | 150,000 | | | | 150,375 | |
Occidental Petroleum Corp., Senior Notes | | | 4.625 | % | | | 6/15/45 | | | | 700,000 | | | | 717,291 | |
Petrobras Global Finance BV, Senior Notes | | | 5.999 | % | | | 1/27/28 | | | | 3,240,000 | | | | 3,325,050 | |
Petrobras Global Finance BV, Senior Notes | | | 5.750 | % | | | 2/1/29 | | | | 2,800,000 | | | | 2,814,000 | |
Petrobras Global Finance BV, Senior Notes | | | 6.750 | % | | | 1/27/41 | | | | 160,000 | | | | 163,382 | |
Petronas Capital Ltd., Senior Notes | | | 5.250 | % | | | 8/12/19 | | | | 410,000 | | | | 413,227 | (a) |
Petronas Capital Ltd., Senior Notes | | | 5.250 | % | | | 8/12/19 | | | | 930,000 | | | | 937,320 | (d) |
Range Resources Corp., Senior Notes | | | 5.000 | % | | | 3/15/23 | | | | 440,000 | | | | 429,717 | |
Range Resources Corp., Senior Notes | | | 4.875 | % | | | 5/15/25 | | | | 1,465,000 | | | | 1,355,125 | |
Ras Laffan Liquefied Natural Gas Co. Ltd. 3, Senior Secured Notes | | | 6.750 | % | | | 9/30/19 | | | | 2,280,000 | | | | 2,304,649 | (d) |
See Notes to Financial Statements.
| | |
| Western Asset Global Corporate Defined Opportunity Fund Inc. 2019 Semi-Annual Report | | 7 |
Schedule of investments(unaudited) (cont’d)
April 30, 2019
Western Asset Global Corporate Defined Opportunity Fund Inc.
| | | | | | | | | | | | | | | | |
| Security‡ | | Rate | | | Maturity
Date | | | Face
Amount† | | | Value | |
Oil, Gas & Consumable Fuels — continued | | | | | | | | | | | | | | | | |
Rockies Express Pipeline LLC, Senior Notes | | | 7.500 | % | | | 7/15/38 | | | | 330,000 | | | $ | 371,648 | (a) |
Sabine Pass Liquefaction LLC, Senior Secured Notes | | | 5.750 | % | | | 5/15/24 | | | | 540,000 | | | | 592,925 | |
Sabine Pass Liquefaction LLC, Senior Secured Notes | | | 5.000 | % | | | 3/15/27 | | | | 1,940,000 | | | | 2,067,659 | |
Shelf Drilling Holdings Ltd., Senior Notes | | | 8.250 | % | | | 2/15/25 | | | | 30,000 | | | | 29,550 | (a) |
Targa Resources Partners LP/Targa Resources Partners Finance Corp., Senior Notes | | | 6.500 | % | | | 7/15/27 | | | | 430,000 | | | | 461,713 | (a) |
Targa Resources Partners LP/Targa Resources Partners Finance Corp., Senior Notes | | | 5.000 | % | | | 1/15/28 | | | | 730,000 | | | | 719,021 | |
Targa Resources Partners LP/Targa Resources Partners Finance Corp., Senior Notes | | | 6.875 | % | | | 1/15/29 | | | | 540,000 | | | | 584,550 | (a) |
Transcontinental Gas Pipe Line Co. LLC, Senior Notes | | | 7.850 | % | | | 2/1/26 | | | | 1,000,000 | | | | 1,251,658 | |
Transportadora de Gas del Peru SA, Senior Notes | | | 4.250 | % | | | 4/30/28 | | | | 3,750,000 | | | | 3,839,062 | (a) |
Transportadora de Gas del Sur SA, Senior Notes | | | 6.750 | % | | | 5/2/25 | | | | 2,290,000 | | | | 2,083,900 | (a) |
Whiting Petroleum Corp., Senior Notes | | | 6.250 | % | | | 4/1/23 | | | | 300,000 | | | | 307,875 | |
Whiting Petroleum Corp., Senior Notes | | | 6.625 | % | | | 1/15/26 | | | | 420,000 | | | | 420,399 | |
Williams Cos. Inc., Senior Notes | | | 5.250 | % | | | 3/15/20 | | | | 610,000 | | | | 621,887 | |
Williams Cos. Inc., Senior Notes | | | 3.700 | % | | | 1/15/23 | | | | 650,000 | | | | 661,301 | |
Williams Cos. Inc., Senior Notes | | | 4.550 | % | | | 6/24/24 | | | | 540,000 | | | | 569,469 | |
Williams Cos. Inc., Senior Notes | | | 7.500 | % | | | 1/15/31 | | | | 340,000 | | | | 428,918 | |
Williams Cos. Inc., Senior Notes | | | 5.750 | % | | | 6/24/44 | | | | 450,000 | | | | 490,712 | |
WPX Energy Inc., Senior Notes | | | 8.250 | % | | | 8/1/23 | | | | 400,000 | | | | 458,500 | |
YPF SA, Senior Notes | | | 6.950 | % | | | 7/21/27 | | | | 120,000 | | | | 102,474 | (a) |
Total Energy | | | | | | | | | | | | | | | 48,878,404 | |
| Financials — 30.7% | | | | | | | | | | | | | | | | |
Banks — 22.6% | | | | | | | | | | | | | | | | |
Australia & New Zeland Banking Group Ltd., Subordinated Notes | | | 7.625 | % | | | 5/6/19 | | | | 1,250,000 | | | | 1,251,323 | (d) |
Australia & New Zeland Banking Group Ltd., Subordinated Notes | | | 5.125 | % | | | 9/10/19 | | | | 1,250,000 | EUR | | | 1,427,542 | (d) |
Banco del Estado de Chile, Senior Notes | | | 4.125 | % | | | 10/7/20 | | | | 1,540,000 | | | | 1,566,036 | (a) |
Bank of America Corp., Junior Subordinated Notes (5.875% to 3/15/28 then 3 mo. USD LIBOR + 2.931%) | | | 5.875 | % | | | 3/15/28 | | | | 550,000 | | | | 568,818 | (e)(f) |
Bank of America Corp., Junior Subordinated Notes (6.500% to 10/23/24 then 3 mo. USD LIBOR + 4.174%) | | | 6.500 | % | | | 10/23/24 | | | | 170,000 | | | | 186,803 | (e)(f) |
Bank of America Corp., Subordinated Notes | | | 4.250 | % | | | 10/22/26 | | | | 2,000,000 | | | | 2,066,872 | |
Barclays Bank PLC, Subordinated Notes | | | 7.625 | % | | | 11/21/22 | | | | 4,180,000 | | | | 4,564,100 | |
Barclays PLC, Junior Subordinated Notes (8.000% to 6/15/24 then 5 year Treasury Constant Maturity Rate + 5.672%) | | | 8.000 | % | | | 6/15/24 | | | | 890,000 | | | | 938,950 | (e)(f) |
Barclays PLC, Subordinated Notes | | | 5.200 | % | | | 5/12/26 | | | | 1,500,000 | | | | 1,556,848 | |
See Notes to Financial Statements.
| | |
| 8 | | Western Asset Global Corporate Defined Opportunity Fund Inc. 2019 Semi-Annual Report |
Western Asset Global Corporate Defined Opportunity Fund Inc.
| | | | | | | | | | | | | | | | |
| Security‡ | | Rate | | | Maturity
Date | | | Face
Amount† | | | Value | |
Banks — continued | | | | | | | | | | | | | | | | |
BBVA Bancomer SA, Subordinated Notes (5.125% to 1/18/28 then 5 year Treasury Constant Maturity Rate + 2.650%) | | | 5.125 | % | | | 1/18/33 | | | | 1,600,000 | | | $ | 1,522,000 | (a)(e) |
BNP Paribas SA, Junior Subordinated Notes (7.375% to 8/19/25 then USD 5 year ICE Swap Rate + 5.150%) | | | 7.375 | % | | | 8/19/25 | | | | 360,000 | | | | 389,565 | (a)(e)(f) |
CIT Group Inc., Senior Notes | | | 5.000 | % | | | 8/15/22 | | | | 110,000 | | | | 114,675 | |
CIT Group Inc., Senior Notes | | | 5.000 | % | | | 8/1/23 | | | | 370,000 | | | | 387,020 | |
CIT Group Inc., Senior Notes | | | 5.250 | % | | | 3/7/25 | | | | 500,000 | | | | 533,125 | |
Citigroup Inc., Junior Subordinated Notes (5.950% to 5/15/25 then 3 mo. USD LIBOR + 3.905%) | | | 5.950 | % | | | 5/15/25 | | | | 1,100,000 | | | | 1,153,213 | (e)(f) |
Citigroup Inc., Junior Subordinated Notes (6.300% to 5/15/24 then 3 mo. USD LIBOR + 3.423%) | | | 6.300 | % | | | 5/15/24 | | | | 500,000 | | | | 520,320 | (e)(f) |
Citigroup Inc., Senior Notes | | | 7.375 | % | | | 9/4/19 | | | | 1,300,000 | EUR | | | 1,495,942 | |
Citigroup Inc., Subordinated Notes | | | 4.125 | % | | | 7/25/28 | | | | 3,000,000 | | | | 3,049,430 | |
Commonwealth Bank of Australia, Subordinated Notes | | | 5.500 | % | | | 8/6/19 | | | | 1,200,000 | EUR | | | 1,365,159 | |
Credit Agricole SA, Junior Subordinated Notes (7.875% to 10/26/19 then 3 mo. EURIBOR + 6.424%) | | | 7.875 | % | | | 10/26/19 | | | | 400,000 | EUR | | | 465,874 | (d)(e)(f) |
Credit Agricole SA, Junior Subordinated Notes (8.375% to 10/13/19 then 3 mo. USD LIBOR + 6.982%) | | | 8.375 | % | | | 10/13/19 | | | | 710,000 | | | | 729,525 | (a)(e)(f) |
Credit Agricole SA, Junior Subordinated Notes (8.125% to 12/23/25 then USD 5 year ICE Swap Rate + 6.185%) | | | 8.125 | % | | | 12/23/25 | | | | 560,000 | | | | 639,061 | (a)(e)(f) |
HSBC Holdings PLC, Junior Subordinated Notes (6.375% to 3/30/25 then USD 5 year ICE Swap Rate + 4.368%) | | | 6.375 | % | | | 3/30/25 | | | | 2,070,000 | | | | 2,159,786 | (e)(f) |
HSBC Holdings PLC, Junior Subordinated Notes (6.500% to 3/23/28 then USD 5 year ICE Swap Rate + 3.606%) | | | 6.500 | % | | | 3/23/28 | | | | 3,620,000 | | | | 3,686,572 | (e)(f) |
Intesa Sanpaolo SpA, Junior Subordinated Notes (8.375% to 10/14/19 then 3 mo. EURIBOR + 6.871%) | | | 8.375 | % | | | 10/14/19 | | | | 450,000 | EUR | | | 522,514 | (d)(e)(f) |
Intesa Sanpaolo SpA, Subordinated Notes | | | 5.017 | % | | | 6/26/24 | | | | 2,180,000 | | | | 2,105,157 | (a) |
Intesa Sanpaolo SpA, Subordinated Notes | | | 5.710 | % | | | 1/15/26 | | | | 3,550,000 | | | | 3,470,621 | (a) |
JPMorgan Chase & Co., Junior Subordinated Notes (6.000% to 8/1/23 then 3 mo. USD LIBOR + 3.300%) | | | 6.000 | % | | | 8/1/23 | | | | 4,890,000 | | | | 5,137,630 | (e)(f) |
JPMorgan Chase & Co., Junior Subordinated Notes (6.100% to 10/1/24 then 3 mo. USD LIBOR + 3.330%) | | | 6.100 | % | | | 10/1/24 | | | | 250,000 | | | | 265,685 | (e)(f) |
Lloyds Banking Group PLC, Subordinated Notes | | | 4.650 | % | | | 3/24/26 | | | | 1,200,000 | | | | 1,228,420 | |
Royal Bank of Canada | | | 2.333 | % | | | 12/5/23 | | | | 1,800,000 | CAD | | | 1,348,636 | |
Royal Bank of Scotland Group PLC, Junior Subordinated Notes (8.625% to 8/15/21 then USD 5 year ICE Swap Rate + 7.598%) | | | 8.625 | % | | | 8/15/21 | | | | 510,000 | | | | 549,525 | (e)(f) |
Royal Bank of Scotland Group PLC, Subordinated Notes | | | 6.000 | % | | | 12/19/23 | | | | 1,000,000 | | | | 1,075,274 | |
Santander UK Group Holdings PLC, Junior Subordinated Notes (7.375% to 6/24/22 then GBP 5 year Swap Rate + 5.543%) | | | 7.375 | % | | | 6/24/22 | | | | 650,000 | GBP | | | 903,002 | (d)(e)(f) |
Santander UK PLC, Subordinated Notes | | | 5.000 | % | | | 11/7/23 | | | | 1,120,000 | | | | 1,166,760 | (a) |
Toronto-Dominion Bank | | | 3.226 | % | | | 7/24/24 | | | | 900,000 | CAD | | | 703,971 | |
See Notes to Financial Statements.
| | |
| Western Asset Global Corporate Defined Opportunity Fund Inc. 2019 Semi-Annual Report | | 9 |
Schedule of investments(unaudited) (cont’d)
April 30, 2019
Western Asset Global Corporate Defined Opportunity Fund Inc.
| | | | | | | | | | | | | | | | |
| Security‡ | | Rate | | | Maturity
Date | | | Face
Amount† | | | Value | |
Banks — continued | | | | | | | | | | | | | | | | |
UBS Group Funding Switzerland AG, Senior Notes | | | 4.253 | % | | | 3/23/28 | | | | 1,830,000 | | | $ | 1,907,075 | (a) |
UniCredit SpA, Subordinated Notes (7.296% to 4/2/29 then USD 5 year ICE Swap Rate + 4.914%) | | | 7.296 | % | | | 4/2/34 | | | | 1,190,000 | | | | 1,214,110 | (a)(e) |
Wachovia Capital Trust III Ltd., Junior Subordinated Bonds (the greater of 3 mo. USD LIBOR + 0.930% or 5.570%) | | | 5.570 | % | | | 5/31/19 | | | | 3,660,000 | | | | 3,644,573 | (e)(f) |
Wells Fargo & Co., Junior Subordinated Notes (5.875% to 6/15/25 then 3 mo. USD LIBOR + 3.990%) | | | 5.875 | % | | | 6/15/25 | | | | 110,000 | | | | 118,896 | (e)(f) |
Wells Fargo & Co., Junior Subordinated Notes (5.900% to 6/15/24 then 3 mo. USD LIBOR + 3.110%) | | | 5.900 | % | | | 6/15/24 | | | | 2,910,000 | | | | 3,025,352 | (e)(f) |
Total Banks | | | | | | | | | | | | | | | 60,725,760 | |
Capital Markets — 4.0% | | | | | | | | | | | | | | | | |
Credit Suisse Group AG, Junior Subordinated Notes (7.250% to 9/12/25 then USD 5 year ICE Swap Rate + 4.332%) | | | 7.250 | % | | | 9/12/25 | | | | 1,840,000 | | | | 1,914,290 | (a)(e)(f) |
Credit Suisse Group Funding Guernsey Ltd., Senior Notes | | | 4.875 | % | | | 5/15/45 | | | | 470,000 | | | | 513,186 | |
Goldman Sachs Group Inc., Senior Notes | | | 3.500 | % | | | 11/16/26 | | | | 2,750,000 | | | | 2,713,666 | |
Goldman Sachs Group Inc., Subordinated Notes | | | 4.750 | % | | | 10/12/21 | | | | 2,700,000 | EUR | | | 3,340,724 | |
Goldman Sachs Group Inc., Subordinated Notes | | | 5.500 | % | | | 10/12/21 | | | | 600,000 | GBP | | | 852,112 | |
UBS Group Funding Switzerland AG, Senior Notes (7.000% to 1/31/24 then USD 5 year ICE Swap Rate + 4.344%) | | | 7.000 | % | | | 1/31/24 | | | | 1,400,000 | | | | 1,460,354 | (a)(e)(f) |
Total Capital Markets | | | | | | | | | | | | | | | 10,794,332 | |
Consumer Finance — 0.4% | | | | | | | | | | | | | | | | |
Navient Corp., Senior Notes | | | 8.000 | % | | | 3/25/20 | | | | 930,000 | | | | 966,037 | |
Diversified Financial Services — 2.0% | | | | | | | | | | | | | | | | |
AerCap Ireland Capital DAC/AerCap Global Aviation Trust, Senior Notes | | | 4.625 | % | | | 7/1/22 | | | | 380,000 | | | | 394,806 | |
GE Capital International Funding Co. Unlimited Co., Senior Notes | | | 3.373 | % | | | 11/15/25 | | | | 1,250,000 | | | | 1,230,083 | |
International Lease Finance Corp., Senior Notes | | | 6.250 | % | | | 5/15/19 | | | | 1,260,000 | | | | 1,261,455 | |
International Lease Finance Corp., Senior Notes | | | 5.875 | % | | | 8/15/22 | | | | 330,000 | | | | 355,660 | |
Nationwide Building Society, Junior Subordinated Notes (6.875% to 6/20/19 then GBP 5 year Swap Rate + 4.880%) | | | 6.875 | % | | | 6/20/19 | | | | 580,000 | GBP | | | 762,697 | (d)(e)(f) |
Park Aerospace Holdings Ltd., Senior Notes | | | 5.500 | % | | | 2/15/24 | | | | 600,000 | | | | 633,210 | (a) |
Travelport Corporate Finance PLC, Senior Secured Notes | | | 6.000 | % | | | 3/15/26 | | | | 690,000 | | | | 743,475 | (a) |
Total Diversified Financial Services | | | | | | | | | | | | | | | 5,381,386 | |
Insurance — 1.7% | | | | | | | | | | | | | | | | |
BUPA Finance PLC, Subordinated Bonds | | | 5.000 | % | | | 4/25/23 | | | | 910,000 | GBP | | | 1,290,425 | (d) |
Farmers Insurance Exchange, Subordinated Notes | | | 8.625 | % | | | 5/1/24 | | | | 1,295,000 | | | | 1,538,064 | (a) |
MetLife Capital Trust IV, Junior Subordinated Notes | | | 7.875 | % | | | 12/15/37 | | | | 300,000 | | | | 374,007 | (a) |
Scottish Widows Ltd., Subordinated Notes | | | 5.500 | % | | | 6/16/23 | | | | 910,000 | GBP | | | 1,313,471 | (d) |
Total Insurance | | | | | | | | | | | | | | | 4,515,967 | |
Total Financials | | | | | | | | | | | | | | | 82,383,482 | |
See Notes to Financial Statements.
| | |
| 10 | | Western Asset Global Corporate Defined Opportunity Fund Inc. 2019 Semi-Annual Report |
Western Asset Global Corporate Defined Opportunity Fund Inc.
| | | | | | | | | | | | | | | | |
| Security‡ | | Rate | | | Maturity
Date | | | Face
Amount† | | | Value | |
| Health Care — 6.6% | | | | | | | | | | | | | | | | |
Biotechnology — 1.1% | | | | | | | | | | | | | | | | |
AbbVie Inc., Senior Notes | | | 3.200 | % | | | 5/14/26 | | | | 1,000,000 | | | $ | 971,095 | |
Celgene Corp., Senior Notes | | | 3.900 | % | | | 2/20/28 | | | | 2,000,000 | | | | 2,045,990 | |
Total Biotechnology | | | | | | | | | | | | | | | 3,017,085 | |
Health Care Equipment & Supplies — 0.4% | | | | | | | | | | | | | | | | |
Becton Dickinson and Co., Senior Notes | | | 3.700 | % | | | 6/6/27 | | | | 1,000,000 | | | | 996,654 | |
Health Care Providers & Services — 2.8% | | | | | | | | | | | | | | | | |
Centene Corp., Senior Notes | | | 5.625 | % | | | 2/15/21 | | | | 480,000 | | | | 488,400 | |
Centene Corp., Senior Notes | | | 6.125 | % | | | 2/15/24 | | | | 370,000 | | | | 388,038 | |
Centene Corp., Senior Notes | | | 4.750 | % | | | 1/15/25 | | | | 1,140,000 | | | | 1,159,380 | |
CVS Health Corp., Senior Notes | | | 4.100 | % | | | 3/25/25 | | | | 1,000,000 | | | | 1,019,250 | |
DaVita Inc., Senior Notes | | | 5.125 | % | | | 7/15/24 | | | | 120,000 | | | | 120,300 | |
DaVita Inc., Senior Notes | | | 5.000 | % | | | 5/1/25 | | | | 170,000 | | | | 166,972 | |
HCA Inc., Senior Notes | | | 5.625 | % | | | 9/1/28 | | | | 140,000 | | | | 149,450 | |
HCA Inc., Senior Secured Notes | | | 5.250 | % | | | 6/15/26 | | | | 470,000 | | | | 502,685 | |
HCA Inc., Senior Secured Notes | | | 4.500 | % | | | 2/15/27 | | | | 1,000,000 | | | | 1,027,999 | |
Magellan Health Inc., Senior Notes | | | 4.900 | % | | | 9/22/24 | | | | 1,690,000 | | | | 1,651,975 | |
UnitedHealth Group Inc., Senior Notes | | | 3.750 | % | | | 7/15/25 | | | | 750,000 | | | | 781,308 | |
Total Health Care Providers & Services | | | | | | | | | | | | | | | 7,455,757 | |
Pharmaceuticals — 2.3% | | | | | | | | | | | | | | | | |
Bausch Health Americas Inc., Senior Notes | | | 8.500 | % | | | 1/31/27 | | | | 150,000 | | | | 163,781 | (a) |
Bausch Health Cos. Inc., Senior Notes | | | 5.875 | % | | | 5/15/23 | | | | 210,000 | | | | 212,405 | (a) |
Bausch Health Cos. Inc., Senior Notes | | | 6.125 | % | | | 4/15/25 | | | | 1,390,000 | | | | 1,409,113 | (a) |
Teva Pharmaceutical Finance Co. BV, Senior Notes | | | 2.950 | % | | | 12/18/22 | | | | 1,330,000 | | | | 1,244,564 | |
Teva Pharmaceutical Finance IV BV, Senior Notes | | | 3.650 | % | | | 11/10/21 | | | | 500,000 | | | | 491,472 | |
Teva Pharmaceutical Finance Netherlands III BV, Senior Notes | | | 2.200 | % | | | 7/21/21 | | | | 2,040,000 | | | | 1,960,767 | |
Teva Pharmaceutical Finance Netherlands III BV, Senior Notes | | | 2.800 | % | | | 7/21/23 | | | | 880,000 | | | | 801,049 | |
Total Pharmaceuticals | | | | | | | | | | | | | | | 6,283,151 | |
Total Health Care | | | | | | | | | | | | | | | 17,752,647 | |
| Industrials — 6.8% | | | | | | | | | | | | | | | | |
Aerospace & Defense — 0.4% | | | | | | | | | | | | | | | | |
Boeing Co., Senior Notes | | | 3.200 | % | | | 3/1/29 | | | | 930,000 | | | | 926,108 | |
Airlines — 0.5% | | | | | | | | | | | | | | | | |
Manchester Airport Group Funding PLC, Senior Secured Notes | | | 4.125 | % | | | 4/2/24 | | | | 860,000 | GBP | | | 1,238,939 | (d) |
Building Products — 1.9% | | | | | | | | | | | | | | | | |
GTL Trade Finance Inc., Senior Notes | | | 7.250 | % | | | 4/16/44 | | | | 1,220,000 | | | | 1,390,800 | (a) |
Standard Industries Inc., Senior Notes | | | 5.000 | % | | | 2/15/27 | | | | 2,775,000 | | | | 2,733,375 | (a) |
Standard Industries Inc., Senior Notes | | | 4.750 | % | | | 1/15/28 | | | | 1,025,000 | | | | 985,281 | (a) |
Total Building Products | | | | | | | | | | | | | | | 5,109,456 | |
See Notes to Financial Statements.
| | |
| Western Asset Global Corporate Defined Opportunity Fund Inc. 2019 Semi-Annual Report | | 11 |
Schedule of investments(unaudited) (cont’d)
April 30, 2019
Western Asset Global Corporate Defined Opportunity Fund Inc.
| | | | | | | | | | | | | | | | |
| Security‡ | | Rate | | | Maturity
Date | | | Face
Amount† | | | Value | |
Commercial Services & Supplies — 1.5% | | | | | | | | | | | | | | | | |
Republic Services Inc., Senior Notes | | | 5.250 | % | | | 11/15/21 | | | | 1,450,000 | | | $ | 1,536,610 | |
United Rentals North America Inc., Senior Notes | | | 5.500 | % | | | 7/15/25 | | | | 310,000 | | | | 321,780 | |
United Rentals North America Inc., Senior Notes | | | 6.500 | % | | | 12/15/26 | | | | 1,550,000 | | | | 1,662,375 | |
United Rentals North America Inc., Senior Notes | | | 5.500 | % | | | 5/15/27 | | | | 205,000 | | | | 211,662 | |
United Rentals North America Inc., Senior Notes | | | 4.875 | % | | | 1/15/28 | | | | 140,000 | | | | 139,300 | |
Total Commercial Services & Supplies | | | | | | | | | | | | | | | 3,871,727 | |
Industrial Conglomerates — 0.1% | | | | | | | | | | | | | | | | |
General Electric Co., Junior Subordinated Notes (5.000% to 1/21/21 then 3 mo. USD LIBOR + 3.330%) | | | 5.000 | % | | | 1/21/21 | | | �� | 350,000 | | | | 331,900 | (e)(f) |
Machinery — 0.4% | | | | | | | | | | | | | | | | |
Allison Transmission Inc., Senior Notes | | | 5.000 | % | | | 10/1/24 | | | | 200,000 | | | | 203,034 | (a) |
Allison Transmission Inc., Senior Notes | | | 4.750 | % | | | 10/1/27 | | | | 980,000 | | | | 965,114 | (a) |
Total Machinery | | | | | | | | | | | | | | | 1,168,148 | |
Road & Rail — 0.4% | | | | | | | | | | | | | | | | |
Eversholt Funding PLC, Senior Secured Notes | | | 6.359 | % | | | 12/2/25 | | | | 740,000 | GBP | | | 1,174,086 | (d) |
Trading Companies & Distributors — 1.6% | | | | | | | | | | | | | | | | |
Ashtead Capital Inc., Secured Notes | | | 4.125 | % | | | 8/15/25 | | | | 2,895,000 | | | | 2,887,763 | (a) |
Beacon Roofing Supply Inc., Senior Notes | | | 4.875 | % | | | 11/1/25 | | | | 1,555,000 | | | | 1,502,052 | (a) |
Total Trading Companies & Distributors | | | | | | | | | | | | | | | 4,389,815 | |
Total Industrials | | | | | | | | | | | | | | | 18,210,179 | |
| Information Technology — 3.3% | | | | | | | | | | | | | | | | |
Semiconductors & Semiconductor Equipment — 0.7% | | | | | | | | | | | | | | | | |
Amkor Technology Inc., Senior Notes | | | 6.625 | % | | | 9/15/27 | | | | 970,000 | | | | 990,310 | (a) |
Broadcom Corp./Broadcom Cayman Finance Ltd., Senior Notes | | | 3.125 | % | | | 1/15/25 | | | | 1,000,000 | | | | 953,499 | |
Total Semiconductors & Semiconductor Equipment | | | | | | | | | | | | | | | 1,943,809 | |
Software — 0.3% | | | | | | | | | | | | | | | | |
CDK Global Inc., Senior Notes | | | 5.875 | % | | | 6/15/26 | | | | 340,000 | | | | 359,550 | |
j2 Cloud Services LLC/j2 GlobalCo-Obligor Inc., Senior Notes | | | 6.000 | % | | | 7/15/25 | | | | 330,000 | | | | 345,262 | (a) |
Total Software | | | | | | | | | | | | | | | 704,812 | |
Technology Hardware, Storage & Peripherals — 2.3% | | | | | | | | | | | | | | | | |
HP Inc., Senior Notes | | | 4.650 | % | | | 12/9/21 | | | | 2,000,000 | | | | 2,085,013 | |
Seagate HDD Cayman, Senior Notes | | | 4.750 | % | | | 1/1/25 | | | | 2,330,000 | | | | 2,279,397 | |
Seagate HDD Cayman, Senior Notes | | | 4.875 | % | | | 6/1/27 | | | | 520,000 | | | | 500,693 | |
Western Digital Corp., Senior Notes | | | 4.750 | % | | | 2/15/26 | | | | 1,400,000 | | | | 1,354,500 | |
Total Technology Hardware, Storage & Peripherals | | | | | | | | | | | | | | | 6,219,603 | |
Total Information Technology | | | | | | | | | | | | | | | 8,868,224 | |
See Notes to Financial Statements.
| | |
| 12 | | Western Asset Global Corporate Defined Opportunity Fund Inc. 2019 Semi-Annual Report |
Western Asset Global Corporate Defined Opportunity Fund Inc.
| | | | | | | | | | | | | | | | |
| Security‡ | | Rate | | | Maturity
Date | | | Face
Amount† | | | Value | |
| Materials — 10.4% | | | | | | | | | | | | | | | | |
Chemicals — 1.1% | | | | | | | | | | | | | | | | |
Braskem Netherlands Finance BV, Senior Notes | | | 3.500 | % | | | 1/10/23 | | | | 820,000 | | | $ | 813,653 | (d) |
Braskem Netherlands Finance BV, Senior Notes | | | 4.500 | % | | | 1/10/28 | | | | 500,000 | | | | 491,875 | (a) |
OCP SA, Senior Notes | | | 5.625 | % | | | 4/25/24 | | | | 800,000 | | | | 843,565 | (a) |
Valvoline Inc., Senior Notes | | | 4.375 | % | | | 8/15/25 | | | | 700,000 | | | | 682,500 | |
Total Chemicals | | | | | | | | | | | | | | | 2,831,593 | |
Construction Materials — 0.3% | | | | | | | | | | | | | | | | |
HeidelbergCement Finance Luxembourg SA, Senior Notes | | | 8.500 | % | | | 10/31/19 | | | | 610,000 | EUR | | | 713,294 | (d) |
Containers & Packaging — 2.0% | | | | | | | | | | | | | | | | |
ARD Securities Finance SARL, Senior Secured Notes (8.750% PIK) | | | 8.750 | % | | | 1/31/23 | | | | 1,767,091 | | | | 1,751,629 | (a)(g) |
Ardagh Packaging Finance PLC/Ardagh Holdings USA Inc., Senior Notes | | | 6.000 | % | | | 2/15/25 | | | | 1,460,000 | | | | 1,474,600 | (a) |
Greif Inc., Senior Notes | | | 6.500 | % | | | 3/1/27 | | | | 1,200,000 | | | | 1,239,000 | (a) |
Suzano Trading Ltd., Senior Notes | | | 5.875 | % | | | 1/23/21 | | | | 970,000 | | | | 1,015,115 | (a) |
Total Containers & Packaging | | | | | | | | | | | | | | | 5,480,344 | |
Metals & Mining — 5.6% | | | | | | | | | | | | | | | | |
Alcoa Nederland Holding BV, Senior Notes | | | 6.750 | % | | | 9/30/24 | | | | 380,000 | | | | 403,750 | (a) |
Alcoa Nederland Holding BV, Senior Notes | | | 7.000 | % | | | 9/30/26 | | | | 910,000 | | | | 985,075 | (a) |
Alcoa Nederland Holding BV, Senior Notes | | | 6.125 | % | | | 5/15/28 | | | | 1,120,000 | | | | 1,167,600 | (a) |
ArcelorMittal, Senior Notes | | | 7.000 | % | | | 10/15/39 | | | | 750,000 | | | | 862,262 | |
BHP Billiton Finance USA Ltd., Senior Notes (6.750% to 10/19/25 then USD 5 year ICE Swap Rate + 5.093% to 10/19/45 then USD 5 year ICE Swap Rate + 5.843%) | | | 6.750 | % | | | 10/19/75 | | | | 750,000 | | | | 845,036 | (a)(e) |
First Quantum Minerals Ltd., Senior Notes | | | 7.000 | % | | | 2/15/21 | | | | 248,000 | | | | 252,960 | (a) |
Freeport-McMoRan Inc., Senior Notes | | | 6.875 | % | | | 2/15/23 | | | | 1,790,000 | | | | 1,895,163 | |
Freeport-McMoRan Inc., Senior Notes | | | 4.550 | % | | | 11/14/24 | | | | 400,000 | | | | 398,500 | |
Freeport-McMoRan Inc., Senior Notes | | | 5.400 | % | | | 11/14/34 | | | | 120,000 | | | | 113,250 | |
Freeport-McMoRan Inc., Senior Notes | | | 5.450 | % | | | 3/15/43 | | | | 930,000 | | | | 843,975 | |
Southern Copper Corp., Senior Notes | | | 5.250 | % | | | 11/8/42 | | | | 1,850,000 | | | | 1,944,349 | |
Teck Resources Ltd., Senior Notes | | | 8.500 | % | | | 6/1/24 | | | | 580,000 | | | | 620,624 | (a) |
Teck Resources Ltd., Senior Notes | | | 6.250 | % | | | 7/15/41 | | | | 600,000 | | | | 648,859 | |
Vale Overseas Ltd., Senior Notes | | | 4.375 | % | | | 1/11/22 | | | | 2,816,000 | | | | 2,879,360 | |
Vale Overseas Ltd., Senior Notes | | | 6.875 | % | | | 11/21/36 | | | | 340,000 | | | | 396,270 | |
Vale Overseas Ltd., Senior Notes | | | 6.875 | % | | | 11/10/39 | | | | 750,000 | | | | 874,688 | |
Total Metals & Mining | | | | | | | | | | | | | | | 15,131,721 | |
Paper & Forest Products — 1.4% | | | | | | | | | | | | | | | | |
Celulosa Arauco y Constitucion SA, Senior Notes | | | 7.250 | % | | | 7/29/19 | | | | 1,220,000 | | | | 1,232,395 | |
Fibria Overseas Finance Ltd., Senior Notes | | | 5.250 | % | | | 5/12/24 | | | | 260,000 | | | | 274,950 | |
See Notes to Financial Statements.
| | |
| Western Asset Global Corporate Defined Opportunity Fund Inc. 2019 Semi-Annual Report | | 13 |
Schedule of investments(unaudited) (cont’d)
April 30, 2019
Western Asset Global Corporate Defined Opportunity Fund Inc.
| | | | | | | | | | | | | | | | |
| Security‡ | | Rate | | | Maturity
Date | | | Face
Amount† | | | Value | |
Paper & Forest Products — continued | | | | | | | | | | | | | | | | |
Mercer International Inc., Senior Notes | | | 7.375 | % | | | 1/15/25 | | | | 1,650,000 | | | $ | 1,745,906 | (a) |
Suzano Austria GmbH, Senior Notes | | | 5.750 | % | | | 7/14/26 | | | | 400,000 | | | | 427,000 | (a) |
Total Paper & Forest Products | | | | | | | | | | | | | | | 3,680,251 | |
Total Materials | | | | | | | | | | | | | | | 27,837,203 | |
| Real Estate — 1.7% | | | | | | | | | | | | | | | | |
Equity Real Estate Investment Trusts (REITs) — 1.6% | |
CoreCivic Inc., Senior Notes | | | 4.625 | % | | | 5/1/23 | | | | 217,000 | | | | 211,640 | |
CoreCivic Inc., Senior Notes | | | 4.750 | % | | | 10/15/27 | | | | 1,220,000 | | | | 1,056,825 | |
MPT Operating Partnership LP/MPT Finance Corp., Senior Notes | | | 6.375 | % | | | 3/1/24 | | | | 440,000 | | | | 463,870 | |
MPT Operating Partnership LP/MPT Finance Corp., Senior Notes | | | 5.000 | % | | | 10/15/27 | | | | 2,510,000 | | | | 2,522,550 | |
Total Equity Real Estate Investment Trusts (REITs) | | | | | | | | | | | | | | | 4,254,885 | |
Real Estate Management & Development — 0.1% | |
WeWork Cos. Inc., Senior Notes | | | 7.875 | % | | | 5/1/25 | | | | 300,000 | | | | 298,125 | (a) |
Total Real Estate | | | | | | | | | | | | | | | 4,553,010 | |
| Utilities — 2.1% | | | | | | | | | | | | | | | | |
Electric Utilities — 1.3% | | | | | | | | | | | | | | | | |
FirstEnergy Corp., Senior Notes | | | 7.375 | % | | | 11/15/31 | | | | 1,930,000 | | | | 2,553,465 | |
Pampa Energia SA, Senior Notes | | | 7.375 | % | | | 7/21/23 | | | | 1,140,000 | | | | 1,028,850 | (d) |
Total Electric Utilities | | | | | | | | | | | | | | | 3,582,315 | |
Gas Utilities — 0.3% | | | | | | | | | | | | | | | | |
Suburban Propane Partners LP/Suburban Energy Finance Corp., Senior Notes | | | 5.875 | % | | | 3/1/27 | | | | 860,000 | | | | 840,650 | |
Independent Power and Renewable Electricity Producers — 0.5% | |
Minejesa Capital BV, Senior Secured Notes | | | 4.625 | % | | | 8/10/30 | | | | 1,350,000 | | | | 1,312,420 | (a) |
Total Utilities | | | | | | | | | | | | | | | 5,735,385 | |
Total Corporate Bonds & Notes (Cost — $284,731,140) | | | | | | | | | | | | | | | 300,709,897 | |
| Senior Loans — 9.4% | | | | | | | | | | | | | | | | |
| Communication Services — 1.8% | | | | | | | | | | | | | | | | |
Media — 1.8% | | | | | | | | | | | | | | | | |
Charter Communications Operating LLC, Term Loan B (1 mo. USD LIBOR + 2.000%) | | | 4.490 | % | | | 4/30/25 | | | | 2,374,920 | | | | 2,383,819 | (e)(h)(i) |
iHeartCommunications Inc., Term Loan | | | — | | | | 5/1/26 | | | | 130,000 | | | | 130,704 | (j) |
Lamar Media Corp., Term Loan B (1 mo. USD LIBOR + 1.750%) | | | 4.250 | % | | | 3/14/25 | | | | 2,187,900 | | | | 2,194,724 | (e)(h)(i) |
Total Communication Services | | | | | | | | | | | | | | | 4,709,247 | |
See Notes to Financial Statements.
| | |
| 14 | | Western Asset Global Corporate Defined Opportunity Fund Inc. 2019 Semi-Annual Report |
Western Asset Global Corporate Defined Opportunity Fund Inc.
| | | | | | | | | | | | | | | | |
| Security‡ | | Rate | | | Maturity
Date | | | Face
Amount† | | | Value | |
| Consumer Discretionary — 3.9% | | | | | | | | | | | | | | | | |
Diversified Consumer Services — 0.1% | | | | | | | | | | | | | | | | |
Prime Security Services Borrower LLC, Term Loan B1 | | | — | | | | 5/2/22 | | | | 320,000 | | | $ | 320,899 | (j) |
Hotels, Restaurants & Leisure — 3.5% | | | | | | | | | | | | | | | | |
Aramark Services Inc., USD Term Loan B3 (1 mo. USD LIBOR + 1.750%) | | | 4.233 | % | | | 3/11/25 | | | | 3,487,313 | | | | 3,488,768 | (e)(h)(i) |
Hilton Worldwide Finance LLC, Term Loan B2 (1 mo. USD LIBOR + 1.750%) | | | 4.227 | % | | | 10/25/23 | | | | 4,037,239 | | | | 4,056,585 | (e)(h)(i) |
Wyndham Hotels & Resorts Inc., Term Loan B (1 mo. USD LIBOR + 1.750%) | | | 4.233 | % | | | 5/30/25 | | | | 1,651,700 | | | | 1,651,995 | (e)(h)(i) |
Total Hotels, Restaurants & Leisure | | | | | | | | | | | | | | | 9,197,348 | |
Specialty Retail — 0.3% | | | | | | | | | | | | | | | | |
PetSmart Inc., Term Loan B2 (1 mo. USD LIBOR + 4.250%) | | | 6.730 | % | | | 3/11/22 | | | | 885,809 | | | | 856,356 | (e)(h)(i) |
Total Consumer Discretionary | | | | | | | | | | | | | | | 10,374,603 | |
| Health Care — 0.3% | | | | | | | | | | | | | | | | |
Health Care Providers & Services — 0.3% | | | | | | | | | | | | | | | | |
DaVita Healthcare Partner, Term Loan B (1 mo. USD LIBOR + 2.750%) | | | 5.233 | % | | | 6/24/21 | | | | 736,469 | | | | 739,231 | (e)(h)(i) |
| Industrials — 1.8% | | | | | | | | | | | | | | | | |
Air Freight & Logistics — 0.5% | | | | | | | | | | | | | | | | |
Avolon TLB Borrower 1 (US) LLC, Term Loan B3 (1 mo. USD LIBOR + 2.000%) | | | 4.487 | % | | | 1/15/25 | | | | 1,418,953 | | | | 1,420,611 | (e)(h)(i) |
Airlines — 0.6% | | | | | | | | | | | | | | | | |
United Airlines Inc., Refinanced Term Loan (1 mo. USD LIBOR + 1.750%) | | | 4.233 | % | | | 4/1/24 | | | | 1,477,387 | | | | 1,476,156 | (e)(h)(i) |
Trading Companies & Distributors — 0.7% | | | | | | | | | | | | | | | | |
Delos Finance Sarl, 2018 Term Loan (3 mo. USD LIBOR + 1.750%) | | | 4.351 | % | | | 10/6/23 | | | | 2,000,000 | | | | 2,005,782 | (e)(h)(i) |
Total Industrials | | | | | | | | | | | | | | | 4,902,549 | |
| Information Technology — 0.7% | | | | | | | | | | | | | | | | |
Software — 0.7% | | | | | | | | | | | | | | | | |
Dell International LLC, Refinancing Term Loan A2 (1 mo. USD LIBOR + 1.750%) | | | 4.240 | % | | | 9/7/21 | | | | 2,014,775 | | | | 2,014,271 | (e)(h)(i) |
| Materials — 0.9% | | | | | | | | | | | | | | | | |
Containers & Packaging — 0.9% | | | | | | | | | | | | | | | | |
Berry Global Inc., Term Loan Q (1 mo. USD LIBOR + 2.000%) | | | 4.481 | % | | | 10/3/22 | | | | 1,408,800 | | | | 1,408,463 | (e)(h)(i) |
Reynolds Group Holdings Inc., Incremental Term Loan (1 mo. USD LIBOR + 2.750%) | | | 5.233 | % | | | 2/6/23 | | | | 987,374 | | | | 991,236 | (e)(h)(i) |
Total Materials | | | | | | | | | | | | | | | 2,399,699 | |
Total Senior Loans (Cost — $25,028,919) | | | | | | | | | | | | | | | 25,139,600 | |
See Notes to Financial Statements.
| | |
| Western Asset Global Corporate Defined Opportunity Fund Inc. 2019 Semi-Annual Report | | 15 |
Schedule of investments(unaudited) (cont’d)
April 30, 2019
Western Asset Global Corporate Defined Opportunity Fund Inc.
| | | | | | | | | | | | | | | | |
| Security‡ | | Rate | | | Maturity
Date | | | Face
Amount† | | | Value | |
| Sovereign Bonds — 6.3% | | | | | | | | | | | | | | | | |
Argentina — 0.6% | | | | | | | | | | | | | | | | |
Argentina POM Politica Monetaria, Bonds (Argentina Central Bank 7 Day Repo Reference Rate) | | | 70.354 | % | | | 6/21/20 | | | | 13,290,000 | ARS | | $ | 298,032 | (e) |
Argentine Republic Government International Bond, Senior Notes | | | 6.875 | % | | | 4/22/21 | | | | 630,000 | | | | 530,466 | |
Argentine Republic Government International Bond, Senior Notes | | | 5.625 | % | | | 1/26/22 | | | | 1,080,000 | | | | 842,951 | |
Total Argentina | | | | | | | | | | | | | | | 1,671,449 | |
Brazil — 0.7% | | | | | | | | | | | | | | | | |
Brazil Notas do Tesouro Nacional Serie F, Notes | | | 10.000 | % | | | 1/1/21 | | | | 1,400,000 | BRL | | | 371,845 | |
Brazil Notas do Tesouro Nacional Serie F, Notes | | | 10.000 | % | | | 1/1/23 | | | | 6,200,000 | BRL | | | 1,667,660 | |
Total Brazil | | | | | | | | | | | | | | | 2,039,505 | |
Indonesia — 2.7% | | | | | | | | | | | | | | | | |
Indonesia Government International Bond, Senior Notes | | | 4.125 | % | | | 1/15/25 | | | | 600,000 | | | | 619,830 | (a) |
Indonesia Government International Bond, Senior Notes | | | 3.850 | % | | | 7/18/27 | | | | 1,400,000 | | | | 1,410,644 | (a) |
Indonesia Government International Bond, Senior Notes | | | 3.500 | % | | | 1/11/28 | | | | 3,960,000 | | | | 3,896,696 | |
Indonesia Treasury Bond, Senior Notes | | | 7.000 | % | | | 5/15/22 | | | | 18,215,000,000 | IDR | | | 1,278,885 | |
Total Indonesia | | | | | | | | | | | | | | | 7,206,055 | |
Mexico — 0.5% | | | | | | | | | | | | | | | | |
Mexican Bonos, Bonds | | | 6.500 | % | | | 6/9/22 | | | | 13,100,000 | MXN | | | 663,778 | |
Mexico Government International Bond, Senior Notes | | | 3.750 | % | | | 1/11/28 | | | | 600,000 | | | | 590,070 | |
Total Mexico | | | | | | | | | | | | | | | 1,253,848 | |
Poland — 1.0% | | | | | | | | | | | | | | | | |
Republic of Poland Government Bond | | | 2.500 | % | | | 7/25/27 | | | | 10,160,000 | PLN | | | 2,593,007 | |
Russia — 0.6% | | | | | | | | | | | | | | | | |
Russian Federal Bond — OFZ | | | 7.750 | % | | | 9/16/26 | | | | 103,070,000 | RUB | | | 1,585,339 | |
Uruguay — 0.2% | | | | | | | | | | | | | | | | |
Uruguay Government International Bond, Senior Notes | | | 8.500 | % | | | 3/15/28 | | | | 23,840,000 | UYU | | | 588,872 | (d) |
Total Sovereign Bonds (Cost — $17,032,280) | | | | | | | | | | | | | | | 16,938,075 | |
| U.S. Government & Agency Obligations — 5.3% | | | | | | | | | | | | | | | | |
U.S. Government Obligations — 5.3% | | | | | | | | | | | | | | | | |
U.S. Treasury Notes | | | 1.875 | % | | | 1/31/22 | | | | 1,700,000 | | | | 1,683,199 | |
U.S. Treasury Notes | | | 1.750 | % | | | 3/31/22 | | | | 2,000,000 | | | | 1,972,734 | |
U.S. Treasury Notes | | | 2.500 | % | | | 3/31/23 | | | | 1,500,000 | | | | 1,513,535 | (k) |
U.S. Treasury Notes | | | 2.750 | % | | | 8/31/23 | | | | 2,500,000 | | | | 2,549,024 | (k) |
U.S. Treasury Notes | | | 2.875 | % | | | 9/30/23 | | | | 1,300,000 | | | | 1,332,576 | (k) |
U.S. Treasury Notes | | | 2.125 | % | | | 11/30/23 | | | | 1,600,000 | | | | 1,589,594 | (k) |
U.S. Treasury Notes | | | 2.125 | % | | | 2/29/24 | | | | 1,250,000 | | | | 1,240,918 | |
U.S. Treasury Notes | | | 2.125 | % | | | 3/31/24 | | | | 2,500,000 | | | | 2,481,738 | (k) |
Total U.S. Government & Agency Obligations (Cost — $14,082,234) | | | | | | | | 14,363,318 | |
See Notes to Financial Statements.
| | |
| 16 | | Western Asset Global Corporate Defined Opportunity Fund Inc. 2019 Semi-Annual Report |
Western Asset Global Corporate Defined Opportunity Fund Inc.
| | | | | | | | | | | | | | | | |
| Security‡ | | Rate | | | Maturity
Date | | | Face
Amount† | | | Value | |
| Convertible Bonds & Notes — 0.8% | | | | | | | | | | | | | | | | |
| Communication Services — 0.8% | | | | | | | | | | | | | | | | |
Interactive Media & Services — 0.1% | | | | | | | | | | | | | | | | |
Twitter Inc., Senior Notes | | | 1.000 | % | | | 9/15/21 | | | | 380,000 | | | $ | 367,701 | |
Media — 0.7% | | | | | | | | | | | | | | | | |
DISH Network Corp., Senior Notes | | | 2.375 | % | | | 3/15/24 | | | | 2,190,000 | | | | 1,911,780 | |
Total Convertible Bonds & Notes (Cost — $2,261,358) | | | | | | | | 2,279,481 | |
| | | | |
| | | | | | | | | Shares | | | | |
| Preferred Stocks — 0.4% | | | | | | | | | | | | | | | | |
| Financials — 0.4% | | | | | | | | | | | | | | | | |
Capital Markets — 0.4% | | | | | | | | | | | | | | | | |
State Street Corp. (5.900% to 3/15/24 then 3 mo. USD LIBOR + 3.108%) (Cost — $937,278) | | | 5.900 | % | | | | | | | 37,454 | | | | 985,789 | (e) |
| | | | |
| | | | | | | | | Face
Amount† | | | | |
| Collateralized Mortgage Obligations(l)—0.1% | | | | | | | | | | | | | | | | |
HarborView Mortgage Loan Trust,2004-10 4A | | | 4.396 | % | | | 1/19/35 | | | | 84,392 | | | | 83,901 | (e) |
JPMorgan Mortgage Trust,2005-A5 1A2 | | | 4.243 | % | | | 8/25/35 | | | | 292,375 | | | | 298,185 | (e) |
Total Collateralized Mortgage Obligations (Cost — $347,886) | | | | | | | | 382,086 | |
| Asset-Backed Securities — 0.1% | | | | | | | | | | | | | | | | |
Home Equity Asset Trust,2004-8 M1 (1 mo. USD LIBOR + 0.870%) (Cost — $235,477) | | | 3.347 | % | | | 3/25/35 | | | | 254,018 | | | | 255,363 | (e) |
Total Investments before Short-Term Investments (Cost — $344,656,572) | | | | | | | | 361,053,609 | |
| | | | |
| | | | | | | | | Shares | | | | |
| Short-Term Investments — 1.0% | | | | | | | | | | | | | | | | |
Dreyfus Government Cash Management, Institutional Shares (Cost — $2,691,707) | | | 2.452 | % | | | | | | | 2,691,707 | | | | 2,691,707 | |
Total Investments — 135.4% (Cost — $347,348,279) | | | | | | | | | | | | | | | 363,745,316 | |
Liabilities in Excess of Other Assets — (35.4)% | | | | | | | | | | | | | | | (95,165,103 | ) |
Total Net Assets — 100.0% | | | | | | | | | | | | | | $ | 268,580,213 | |
| † | Face amount denominated in U.S. dollars, unless otherwise noted. |
| ‡ | Securities held by the Fund are subject to a lien, granted to the lender, to the extent of the borrowing outstanding and any additional expenses. |
| * | Non-income producing security. |
| (a) | Security is exempt from registration under Rule 144A of the Securities Act of 1933. This security may be resold in transactions that are exempt from registration, normally to qualified institutional buyers. This security has been deemed liquid pursuant to guidelines approved by the Board of Directors. |
| (b) | The coupon payment on these securities is currently in default as of April 30, 2019. |
See Notes to Financial Statements.
| | |
| Western Asset Global Corporate Defined Opportunity Fund Inc. 2019 Semi-Annual Report | | 17 |
Schedule of investments(unaudited) (cont’d)
April 30, 2019
Western Asset Global Corporate Defined Opportunity Fund Inc.
| (c) | Securities traded on a when-issued or delayed delivery basis. |
| (d) | Security is exempt from registration under Regulation S of the Securities Act of 1933. Regulation S applies to securities offerings that are made outside of the United States and do not involve direct selling efforts in the United States. This security has been deemed liquid pursuant to guidelines approved by the Board of Directors. |
| (e) | Variable rate security. Interest rate disclosed is as of the most recent information available. Certain variable rate securities are not based on a published reference rate and spread but are determined by the issuer or agent and are based on current market conditions. These securities do not indicate a reference rate and spread in their description above. |
| (f) | Security has no maturity date. The date shown represents the next call date. |
| (g) | Payment-in-kind security for which the issuer has the option at each interest payment date of making interest payments in cash or additional debt securities. |
| (h) | Interest rates disclosed represent the effective rates on senior loans. Ranges in interest rates are attributable to multiple contracts under the same loan. |
| (i) | Senior loans may be considered restricted in that the Fund ordinarily is contractually obligated to receive approval from the agent bank and/or borrower prior to the disposition of a senior loan. |
| (j) | All or a portion of this loan is unfunded as of April 30, 2019. The interest rate for fully unfunded term loans is to be determined. |
| (k) | All or a portion of this security is held by the counterparty as collateral for open reverse repurchase agreements. |
| (l) | Collateralized mortgage obligations are secured by an underlying pool of mortgages or mortgage pass-through certificates that are structured to direct payments on underlying collateral to different series or classes of the obligations. The interest rate may change positively or inversely in relation to one or more interest rates, financial indices or other financial indicators and may be subject to an upper and/or lower limit. |
| | |
Abbreviations used in this schedule: |
| |
| ARS | | — Argentine Peso |
| |
| BRL | | — Brazilian Real |
| |
| CAD | | — Canadian Dollar |
| |
| EUR | | — Euro |
| |
| EURIBOR | | — Euro Interbank Offered Rate |
| |
| GBP | | — British Pound |
| |
| ICE | | — Intercontinental Exchange |
| |
| IDR | | — Indonesian Rupiah |
| |
| JSC | | — Joint Stock Company |
| |
| LIBOR | | — London Interbank Offered Rate |
| |
| MXN | | — Mexican Peso |
| |
| PIK | | —Payment-In-Kind |
| |
| PLN | | — Polish Zloty |
| |
| RUB | | — Russian Ruble |
| |
| USD | | — United States Dollar |
| |
| UYU | | — Uruguayan Peso |
See Notes to Financial Statements.
| | |
| 18 | | Western Asset Global Corporate Defined Opportunity Fund Inc. 2019 Semi-Annual Report |
Western Asset Global Corporate Defined Opportunity Fund Inc.
| | | | |
| Summary of Investments by Country(unaudited)** | | | |
| United States | | | 53.5 | % |
| United Kingdom | | | 11.6 | |
| Brazil | | | 4.7 | |
| Indonesia | | | 2.3 | |
| Canada | | | 2.2 | |
| Italy | | | 2.2 | |
| France | | | 1.6 | |
| Ireland | | | 1.6 | |
| Switzerland | | | 1.6 | |
| Peru | | | 1.6 | |
| Mexico | | | 1.5 | |
| Luxembourg | | | 1.5 | |
| Argentina | | | 1.4 | |
| Russia | | | 1.3 | |
| Spain | | | 1.3 | |
| Israel | | | 1.2 | |
| Belgium | | | 1.1 | |
| Australia | | | 1.0 | |
| Colombia | | | 1.0 | |
| Qatar | | | 0.8 | |
| Chile | | | 0.8 | |
| Poland | | | 0.7 | |
| Kazakhstan | | | 0.6 | |
| Netherlands | | | 0.6 | |
| United Arab Emirates | | | 0.4 | |
| Malaysia | | | 0.4 | |
| Germany | | | 0.3 | |
| Morocco | | | 0.2 | |
| Uruguay | | | 0.2 | |
| Zambia | | | 0.1 | |
| Short-Term Investments | | | 0.7 | |
| | | | 100.0 | % |
| ** | As a percentage of total investments. Please note that the Fund holdings are as of April 30, 2019 and are subject to change. |
See Notes to Financial Statements.
| | |
| Western Asset Global Corporate Defined Opportunity Fund Inc. 2019 Semi-Annual Report | | 19 |
Schedule of investments(unaudited) (cont’d)
April 30, 2019
Western Asset Global Corporate Defined Opportunity Fund Inc.
At April 30, 2019, the Fund had the following open reverse repurchase agreements:
| | | | | | | | | | | | | | | | | | | | | | |
| Counterparty | | Rate | | | Effective
Date | | | Maturity
Date | | Face Amount
of Reverse
Repurchase
Agreements | | | Asset Class of Collateral* | | | Collateral
Value | |
| Deutsche Bank | | | 2.600 | % | | | 4/11/2019 | | | 7/10/2019 | | $ | 8,266,375 | | | | U.S. Government & Agency Obligations | | | $ | 8,457,443 | |
| | | | | | | | | | | | | $ | 8,266,375 | | | | | | | $ | 8,457,443 | |
| * | Refer to the Schedule of Investments for positions held at the counterparty as collateral for reverse repurchase agreements. |
At April 30, 2019, the Fund had the following open futures contracts:
| | | | | | | | | | | | | | | | | | | | |
| | | Number of
Contracts | | | Expiration
Date | | | Notional
Amount | | | Market
Value | | | Unrealized
Depreciation | |
| Contracts to Buy: | | | | | | | | | | | | | | | | | | | | |
| Canadian Dollar | | | 53 | | | | 6/19 | | | $ | 3,969,582 | | | $ | 3,962,015 | | | $ | (7,567) | |
| Euro | | | 56 | | | | 6/19 | | | | 7,934,617 | | | | 7,886,550 | | | | (48,067) | |
| Net unrealized depreciation on open futures contracts | | | $ | (55,634) | |
At April 30, 2019, the Fund had the following open forward foreign currency contracts:
| | | | | | | | | | | | | | | | | | | | |
Currency
Purchased | | | Currency
Sold | | | Counterparty | | Settlement
Date | | | Unrealized
Appreciation
(Depreciation) | |
| BRL | | | 2,685,000 | | | USD | | | 679,541 | | | Barclays Bank PLC | | | 7/17/19 | | | $ | 949 | |
| EUR | | | 5,560,000 | | | USD | | | 6,307,584 | | | Barclays Bank PLC | | | 7/17/19 | | | | (28,880) | |
| GBP | | | 2,000,000 | | | USD | | | 2,592,554 | | | Barclays Bank PLC | | | 7/17/19 | | | | 26,065 | |
| USD | | | 680,591 | | | BRL | | | 2,685,000 | | | Barclays Bank PLC | | | 7/17/19 | | | | 102 | |
| USD | | | 64,431 | | | CAD | | | 85,573 | | | Barclays Bank PLC | | | 7/17/19 | | | | 431 | |
| USD | | | 131,690 | | | GBP | | | 100,000 | | | Barclays Bank PLC | | | 7/17/19 | | | | 759 | |
| USD | | | 1,407,880 | | | GBP | | | 1,070,932 | | | Barclays Bank PLC | | | 7/17/19 | | | | 5,698 | |
| EUR | | | 1,300,000 | | | USD | | | 1,472,394 | | | Goldman Sachs Group Inc. | | | 7/17/19 | | | | (4,352) | |
| Total | | | | | | | | | | | | | | | | | | $ | 772 | |
| | |
Abbreviations used in this table: |
| |
| BRL | | — Brazilian Real |
| |
| CAD | | — Canadian Dollar |
| |
| EUR | | — Euro |
| |
| GBP | | — British Pound |
| |
| USD | | — United States Dollar |
See Notes to Financial Statements.
| | |
| 20 | | Western Asset Global Corporate Defined Opportunity Fund Inc. 2019 Semi-Annual Report |
Statement of assets and liabilities(unaudited)
April 30, 2019
| | | | |
| |
| Assets: | | | | |
Investments, at value (Cost — $347,348,279) | | $ | 363,745,316 | |
Foreign currency, at value (Cost — $285,085) | | | 283,368 | |
Interest receivable | | | 4,921,114 | |
Receivable for securities sold | | | 1,312,232 | |
Deposits with brokers for open futures contracts | | | 193,884 | |
Receivable from broker — variation margin on open futures contracts | | | 42,415 | |
Unrealized appreciation on forward foreign currency contracts | | | 34,004 | |
Prepaid expenses | | | 11,936 | |
Total Assets | | | 370,544,269 | |
| |
| Liabilities: | | | | |
Loan payable (Note 5) | | | 88,000,000 | |
Payable for open reverse repurchase agreements (Note 3) | | | 8,266,375 | |
Payable for securities purchased | | | 3,844,130 | |
Distributions payable | | | 1,508,995 | |
Investment management fee payable | | | 239,450 | |
Unrealized depreciation on forward foreign currency contracts | | | 33,232 | |
Interest payable | | | 19,599 | |
Directors’ fees payable | | | 5,578 | |
Accrued expenses | | | 46,697 | |
Total Liabilities | | | 101,964,056 | |
| Total Net Assets | | $ | 268,580,213 | |
| |
| Net Assets: | | | | |
Par value ($0.001 par value; 14,940,540 shares issued and outstanding; 100,000,000 shares authorized) | | $ | 14,941 | |
Paid-in capital in excess of par value | | | 283,531,816 | |
Total distributable earnings (loss) | | | (14,966,544) | |
| Total Net Assets | | $ | 268,580,213 | |
| |
| Shares Outstanding | | | 14,940,540 | |
| |
| Net Asset Value | | | $17.98 | |
See Notes to Financial Statements.
| | |
| Western Asset Global Corporate Defined Opportunity Fund Inc. 2019 Semi-Annual Report | | 21 |
Statement of operations(unaudited)
For the Six Months Ended April 30, 2019
| | | | |
| |
| Investment Income: | | | | |
Interest | | $ | 10,456,558 | |
Dividends | | | 27,619 | |
Less: Foreign taxes withheld | | | (15,866) | |
Total Investment Income | | | 10,468,311 | |
| |
| Expenses: | | | | |
Interest expense (Notes 3 and 5) | | | 1,467,597 | |
Investment management fee (Note 2) | | | 1,413,988 | |
Directors’ fees | | | 33,033 | |
Audit and tax fees | | | 29,515 | |
Legal fees | | | 23,096 | |
Transfer agent fees | | | 18,915 | |
Fund accounting fees | | | 17,150 | |
Shareholder reports | | | 11,554 | |
Stock exchange listing fees | | | 6,199 | |
Custody fees | | | 4,563 | |
Insurance | | | 2,248 | |
Commitment fees (Note 5) | | | 2,011 | |
Miscellaneous expenses | | | 8,855 | |
Total Expenses | | | 3,038,724 | |
| Net Investment Income | | | 7,429,587 | |
| |
Realized and Unrealized Gain (Loss) on Investments, Futures Contracts,
Written Options, Forward Foreign Currency Contracts and Foreign Currency Transactions (Notes 1, 3 and 4): | | | | |
Net Realized Gain (Loss) From: | | | | |
Investment transactions | | | (3,828,497) | |
Futures contracts | | | (387,785) | |
Written options | | | 47,829 | |
Forward foreign currency contracts | | | (229,534) | |
Foreign currency transactions | | | 3,954 | |
Net Realized Loss | | | (4,394,033) | |
Change in Net Unrealized Appreciation (Depreciation) From: | | | | |
Investments | | | 14,606,033 | |
Futures contracts | | | 81,390 | |
Written options | | | 23,850 | |
Forward foreign currency contracts | | | 98,473 | |
Foreign currencies | | | 4,346 | |
Change in Net Unrealized Appreciation (Depreciation) | | | 14,814,092 | |
| Net Gain on Investments, Futures Contracts, Written Options, Forward Foreign Currency Contracts and Foreign Currency Transactions | | | 10,420,059 | |
| Increase in Net Assets From Operations | | $ | 17,849,646 | |
See Notes to Financial Statements.
| | |
| 22 | | Western Asset Global Corporate Defined Opportunity Fund Inc. 2019 Semi-Annual Report |
Statements of changes in net assets
| | | | | | | | |
For the Six Months Ended April 30, 2019 (unaudited)
and the Year Ended October 31, 2018 | | 2019 | | | 2018 | |
| | |
| Operations: | | | | | | | | |
Net investment income | | $ | 7,429,587 | | | $ | 14,855,152 | |
Net realized loss | | | (4,394,033) | | | | (7,932,208) | |
Change in net unrealized appreciation (depreciation) | | | 14,814,092 | | | | (14,766,186) | |
Increase (Decrease) in Net Assets From Operations | | | 17,849,646 | | | | (7,843,242) | |
| | |
| Distributions to Shareholders From (Note 1): | | | | | | | | |
Total distributable earnings(a) | | | (9,053,967) | | | | (18,800,185) | |
Return of capital | | | — | | | | (390,939) | |
Decrease in Net Assets From Distributions to Shareholders | | | (9,053,967) | | | | (19,191,124) | |
Increase (Decrease) in Net Assets | | | 8,795,679 | | | | (27,034,366) | |
| | |
| Net Assets: | | | | | | | | |
Beginning of period | | | 259,784,534 | | | | 286,818,900 | |
End of period(b) | | $ | 268,580,213 | | | $ | 259,784,534 | |
| (a) | Distributions from net investment income and from realized gains are no longer required to be separately disclosed (Note 9). For the year ended October 31, 2018, distributions from net investment income were $18,800,185. |
| (b) | Parenthetical disclosure of undistributed net investment income is no longer required (Note 9). For the year ended October 31, 2018, end of year net assets included overdistributed net investment income of $(1,570,335). |
See Notes to Financial Statements.
| | |
| Western Asset Global Corporate Defined Opportunity Fund Inc. 2019 Semi-Annual Report | | 23 |
Statement of cash flows(unaudited)
For the Six Months Ended April 30, 2019
| | | | |
| |
| Increase (Decrease) in Cash: | | | | |
| Cash Provided (Used) by Operating Activities: | | | | |
Net increase in net assets resulting from operations | | $ | 17,849,646 | |
Adjustments to reconcile net increase in net assets resulting from operations to net cash provided (used) by operating activities: | | | | |
Purchases of portfolio securities | | | (109,116,675) | |
Sales of portfolio securities | | | 107,593,343 | |
Net purchases, sales and maturities of short-term investments | | | (2,602,673) | |
Payment-in-kind | | | (40,536) | |
Net amortization of premium (accretion of discount) | | | (623,616) | |
Decrease in receivable for securities sold | | | 3,181,314 | |
Increase in interest receivable | | | (184,842) | |
Increase in prepaid expenses | | | (4,052) | |
Increase in receivable from broker — variation margin on open futures contracts | | | (42,415) | |
Decrease in payable for securities purchased | | | (1,512,987) | |
Increase in investment management fee payable | | | 1,234 | |
Decrease in Directors’ fees payable | | | (1,387) | |
Decrease in interest payable | | | (3,692) | |
Decrease in accrued expenses | | | (71,475) | |
Decrease in premiums received from written options | | | (31,450) | |
Decrease in payable to broker — variation margin on open futures contracts | | | (21,810) | |
Net realized loss on investments | | | 3,828,497 | |
Change in net unrealized appreciation (depreciation) of investments, written options and forward foreign currency contracts | | | (14,728,356) | |
Net Cash Provided by Operating Activities* | | | 3,468,068 | |
| |
| Cash Flows From Financing Activities: | | | | |
Distributions paid on common stock | | | (9,053,967) | |
Increase in payable for reverse repurchase agreements | | | 5,373,250 | |
Net Cash Used in Financing Activities | | | (3,680,717) | |
| Net Decrease in Cash and Restricted Cash | | | (212,649) | |
Cash and restricted cash at beginning of period | | | 689,901 | |
Cash and restricted cash at end of period | | $ | 477,252 | |
| * | Included in operating expenses is cash of $1,475,942 paid for interest and commitment fees on borrowings. |
| | The following table provides a reconciliation of cash and restricted cash reported with the Statement of Assets and Liabilities that sums to the total of the such amounts shown on the Statement of Cash Flows. |
| | | | |
| | | April 30, 2019 | |
| Cash | | $ | 283,368 | |
| Restricted cash | | | 193,884 | |
| Total cash and restricted cash shown in the Statement of Cash Flows | | $ | 477,252 | |
| | Restricted cash consists of cash that has been segregated to cover the Fund’s collateral or margin obligations under derivative contracts. It is separately reported on the Statement of Assets and Liabilities as Deposits with brokers. |
See Notes to Financial Statements.
| | |
| 24 | | Western Asset Global Corporate Defined Opportunity Fund Inc. 2019 Semi-Annual Report |
Financial highlights
| | | | | | | | | | | | | | | | | | | | | | | | |
For a share of capital stock outstanding throughout each year ended October 31,
unless otherwise noted: | |
| | | 20191,2 | | | 20181 | | | 20171 | | | 20161 | | | 20151 | | | 20141 | |
| | | | | | |
| Net asset value, beginning of period | | | $17.39 | | | | $19.20 | | | | $18.94 | | | | $18.81 | | | | $20.20 | | | | $20.36 | |
| | | | | | |
| Income (loss) from operations: | | | | | | | | | | | | | | | | | | | | | | | | |
Net investment income | | | 0.50 | | | | 0.99 | | | | 1.07 | | | | 1.20 | | | | 1.23 | | | | 1.30 | |
Net realized and unrealized gain (loss) | | | 0.70 | | | | (1.52) | | | | 0.55 | | | | 0.29 | | | | (1.30) | | | | (0.09) | |
Total income (loss) from operations | | | 1.20 | | | | (0.53) | | | | 1.62 | | | | 1.49 | | | | (0.07) | | | | 1.21 | |
| | | | | | |
| Less distributions from: | | | | | | | | | | | | | | | | | | | | | | | | |
Net investment income | | | (0.61) | 3 | | | (1.26) | | | | (1.36) | | | | (1.36) | | | | (1.36) | | | | (1.39) | |
Return of capital | | | — | | | | (0.02) | | | | — | | | | — | | | | — | | | | — | |
Total distributions | | | (0.61) | | | | (1.28) | | | | (1.36) | | | | (1.36) | | | | (1.36) | | | | (1.39) | |
Anti-dilutive impact of repurchase plan | | | — | | | | — | | | | — | | | | 0.00 | 4,5 | | | 0.04 | 5 | | | 0.02 | 5 |
| | | | | | |
| Net asset value, end of period | | | $17.98 | | | | $17.39 | | | | $19.20 | | | | $18.94 | | | | $18.81 | | | | $20.20 | |
| | | | | | |
| Market price, end of period | | | $16.88 | | | | $15.20 | | | | $18.10 | | | | $17.39 | | | | $17.17 | | | | $18.22 | |
Total return, based on NAV6,7 | | | 7.05 | % | | | (2.86) | % | | | 8.92 | % | | | 8.44 | % | | | (0.17) | % | | | 6.18 | % |
Total return, based on Market Price8 | | | 15.30 | % | | | (9.38) | % | | | 12.37 | % | | | 9.82 | % | | | 1.88 | % | | | 8.67 | % |
| | | | | | |
| Net assets, end of period (millions) | | | $269 | | | | $260 | | | | $287 | | | | $283 | | | | $281 | | | | $308 | |
| | | | | | |
| Ratios to average net assets: | | | | | | | | | | | | | | | | | | | | | | | | |
Gross expenses | | | 2.35 | %9 | | | 2.00 | % | | | 1.79 | % | | | 1.64 | % | | | 1.55 | % | | | 1.28 | % |
Net expenses | | | 2.35 | 9 | | | 2.00 | | | | 1.79 | | | | 1.64 | | | | 1.55 | | | | 1.28 | |
Net investment income | | | 5.74 | 9 | | | 5.42 | | | | 5.66 | | | | 6.53 | | | | 6.25 | | | | 6.36 | |
| | | | | | |
| Portfolio turnover rate | | | 31 | % | | | 85 | % | | | 69 | % | | | 51 | % | | | 33 | % | | | 22 | % |
| | | | | | |
| Supplemental data: | | | | | | | | | | | | | | | | | | | | | | | | |
Loan Outstanding, End of Period (000s) | | | $88,000 | | | | $88,000 | | | | $83,000 | | | | $83,000 | | | | $83,000 | | | | — | |
Asset Coverage Ratio for Loan Outstanding10 | | | 405 | % | | | 395 | % | | | 446 | % | | | 441 | % | | | 439 | % | | | — | |
Asset Coverage, per $1,000 Principal Amount of Loan Outstanding10 | | | $4,052 | | | | $3,952 | | | | $4,456 | | | | $4,409 | | | | $4,388 | | | | — | |
Weighted Average Loan (000s) | | | $88,000 | | | | $84,625 | | | | $83,000 | | | | $83,000 | | | | $83,000 | 11 | | | — | |
Weighted Average Interest Rate on Loan | | | 3.14 | % | | | 2.50 | % | | | 1.63 | % | | | 1.20 | % | | | 0.91 | %11 | | | — | |
See Notes to Financial Statements.
| | |
| Western Asset Global Corporate Defined Opportunity Fund Inc. 2019 Semi-Annual Report | | 25 |
Financial highlights (cont’d)
| 1 | Per share amounts have been calculated using the average shares method. |
| 2 | For the six months ended April 30, 2019 (unaudited). |
| 3 | The actual source of the Fund’s current fiscal year distributions may be from net investment income, return of capital or a combination of both. Shareholders will be informed of the tax characteristics of the distributions after the close of the fiscal year. |
| 4 | Amount represents less than $0.005 per share. |
| 5 | The repurchase plan was completed at an average repurchase price of $15.25 for 14,001 shares and $213,465 for the year ended October 31, 2016, $16.92 for 276,119 shares and $4,671,232 for the year ended October 31, 2015 and $18.11 for 116,116 shares and $2,103,258 for the year ended October 31, 2014. |
| 6 | Performance figures may reflect compensating balance arrangements, fee waivers and/or expense reimbursements. In the absence of compensating balance arrangements, fee waivers and/or expense reimbursements, the total return would have been lower. Past performance is no guarantee of future results. Total returns for periods of less than one year are not annualized. |
| 7 | The total return calculation assumes that distributions are reinvested at NAV. Prior to January 1, 2012, the total return calculation assumed the reinvestment of all distributions in accordance with the Fund’s dividend reinvestment plan. Past performance is no guarantee of future results. Total returns for periods of less than one year are not annualized. |
| 8 | The total return calculation assumes that distributions are reinvested in accordance with the Fund’s dividend reinvestment plan. Past performance is no guarantee of future results. Total returns for periods of less than one year are not annualized. |
| 10 | Represents value of net assets plus the loan outstanding at the end of the period divided by the loan outstanding at the end of the period. |
| 11 | Weighted average based on the number of days that the Fund had a loan outstanding. |
See Notes to Financial Statements.
| | |
| 26 | | Western Asset Global Corporate Defined Opportunity Fund Inc. 2019 Semi-Annual Report |
Notes to financial statements(unaudited)
1. Organization and significant accounting policies
Western Asset Global Corporate Defined Opportunity Fund Inc. (the “Fund”) was incorporated in Maryland on September 17, 2009 and is registered as anon-diversified, limited-term,closed-end management investment company under the Investment Company Act of 1940, as amended (the “1940 Act”). The Fund’s primary investment objective is to provide current income and then to liquidate and distribute substantially all of the Fund’s net assets to stockholders on or about December 2, 2024. As a secondary investment objective, the Fund will seek capital appreciation. The Fund seeks to achieve its investment objectives by investing, under normal market conditions, at least 80% of its managed assets in a portfolio of U.S. and foreign corporate fixed-income securities of varying maturities.
The following are significant accounting policies consistently followed by the Fund and are in conformity with U.S. generally accepted accounting principles (“GAAP”). Estimates and assumptions are required to be made regarding assets, liabilities and changes in net assets resulting from operations when financial statements are prepared. Changes in the economic environment, financial markets and any other parameters used in determining these estimates could cause actual results to differ. Subsequent events have been evaluated through the date the financial statements were issued.
(a) Investment valuation. The valuations for fixed income securities (which may include, but are not limited to, corporate, government, municipal, mortgage-backed, collateralized mortgage obligations and asset-backed securities) and certain derivative instruments are typically the prices supplied by independent third party pricing services, which may use market prices or broker/dealer quotations or a variety of valuation techniques and methodologies. The independent third party pricing services use inputs that are observable such as issuer details, interest rates, yield curves, prepayment speeds, credit risks/spreads, default rates and quoted prices for similar securities. Investments inopen-end funds are valued at the closing net asset value per share of each fund on the day of valuation. Futures contracts are valued daily at the settlement price established by the board of trade or exchange on which they are traded. Equity securities for which market quotations are available are valued at the last reported sales price or official closing price on the primary market or exchange on which they trade. When the Fund holds securities or other assets that are denominated in a foreign currency, the Fund will normally use the currency exchange rates as of 4:00 p.m. (Eastern Time). If independent third party pricing services are unable to supply prices for a portfolio investment, or if the prices supplied are deemed by the manager to be unreliable, the market price may be determined by the manager using quotations from one or more broker/dealers or at the transaction price if the security has recently been purchased and no value has yet been obtained from a pricing service or pricing broker. When reliable prices are not readily available, such as when the value of a security has been significantly affected by events after the close of the exchange or market on which the security is principally traded, but before the Fund calculates its net asset value, the Fund values these securities as determined in accordance with procedures approved by the Fund’s Board of Directors.
| | |
| Western Asset Global Corporate Defined Opportunity Fund Inc. 2019 Semi-Annual Report | | 27 |
Notes to financial statements(unaudited) (cont’d)
The Board of Directors is responsible for the valuation process and has delegated the supervision of the daily valuation process to the Legg Mason North Atlantic Fund Valuation Committee (the “Valuation Committee”). The Valuation Committee, pursuant to the policies adopted by the Board of Directors, is responsible for making fair value determinations, evaluating the effectiveness of the Fund’s pricing policies, and reporting to the Board of Directors. When determining the reliability of third party pricing information for investments owned by the Fund, the Valuation Committee, among other things, conducts due diligence reviews of pricing vendors, monitors the daily change in prices and reviews transactions among market participants.
The Valuation Committee will consider pricing methodologies it deems relevant and appropriate when making fair value determinations. Examples of possible methodologies include, but are not limited to, multiple of earnings; discount from market of a similar freely traded security; discounted cash-flow analysis; book value or a multiple thereof; risk premium/yield analysis; yield to maturity; and/or fundamental investment analysis. The Valuation Committee will also consider factors it deems relevant and appropriate in light of the facts and circumstances. Examples of possible factors include, but are not limited to, the type of security; the issuer’s financial statements; the purchase price of the security; the discount from market value of unrestricted securities of the same class at the time of purchase; analysts’ research and observations from financial institutions; information regarding any transactions or offers with respect to the security; the existence of merger proposals or tender offers affecting the security; the price and extent of public trading in similar securities of the issuer or comparable companies; and the existence of a shelf registration for restricted securities.
For each portfolio security that has been fair valued pursuant to the policies adopted by the Board of Directors, the fair value price is compared against the last available and next available market quotations. The Valuation Committee reviews the results of such back testing monthly and fair valuation occurrences are reported to the Board of Directors quarterly.
The Fund uses valuation techniques to measure fair value that are consistent with the market approach and/or income approach, depending on the type of security and the particular circumstance. The market approach uses prices and other relevant information generated by market transactions involving identical or comparable securities. The income approach uses valuation techniques to discount estimated future cash flows to present value.
GAAP establishes a disclosure hierarchy that categorizes the inputs to valuation techniques used to value assets and liabilities at measurement date. These inputs are summarized in the three broad levels listed below:
| • | | Level 1 — quoted prices in active markets for identical investments |
| • | | Level 2 — other significant observable inputs (including quoted prices for similar investments, interest rates, prepayment speeds, credit risk, etc.) |
| | |
| 28 | | Western Asset Global Corporate Defined Opportunity Fund Inc. 2019 Semi-Annual Report |
| • | | Level 3 — significant unobservable inputs (including the Fund’s own assumptions in determining the fair value of investments) |
The inputs or methodologies used to value securities are not necessarily an indication of the risk associated with investing in those securities.
The following is a summary of the inputs used in valuing the Fund’s assets and liabilities carried at fair value:
| | | | | | | | | | | | | | | | |
| ASSETS | |
| Description | | Quoted Prices (Level 1) | | | Other Significant
Observable Inputs
(Level 2) | | | Significant
Unobservable
Inputs (Level 3) | | | Total | |
| Long-term investments†: | | | | | | | | | | | | | | | | |
Corporate bonds & notes | | | — | | | $ | 300,709,897 | | | | — | | | $ | 300,709,897 | |
Senior loans | | | — | | | | 25,139,600 | | | | — | | | | 25,139,600 | |
Sovereign bonds | | | — | | | | 16,938,075 | | | | — | | | | 16,938,075 | |
U.S. government & agency obligations | | | — | | | | 14,363,318 | | | | — | | | | 14,363,318 | |
Convertible bonds & notes | | | — | | | | 2,279,481 | | | | — | | | | 2,279,481 | |
Preferred stocks | | $ | 985,789 | | | | — | | | | — | | | | 985,789 | |
Collateralized mortgage obligations | | | — | | | | 382,086 | | | | — | | | | 382,086 | |
Asset-backed securities | | | — | | | | 255,363 | | | | — | | | | 255,363 | |
| Total long-term investments | | | 985,789 | | | | 360,067,820 | | | | — | | | | 361,053,609 | |
| Short-term investments† | | | 2,691,707 | | | | — | | | | — | | | | 2,691,707 | |
| Total investments | | $ | 3,677,496 | | | $ | 360,067,820 | | | | — | | | $ | 363,745,316 | |
| Other financial instruments: | | | | | | | | | | | | | | | | |
Forward foreign currency contracts | | | — | | | $ | 34,004 | | | | — | | | $ | 34,004 | |
| Total | | $ | 3,677,496 | | | $ | 360,101,824 | | | | — | | | $ | 363,779,320 | |
|
| LIABILITIES | |
| Description | | Quoted Prices
(Level 1) | | | Other Significant
Observable Inputs
(Level 2) | | | Significant
Unobservable
Inputs
(Level 3) | | | Total | |
| Other financial instruments: | | | | | | | | | | | | | | | | |
Futures contracts | | $ | 55,634 | | | | — | | | | — | | | $ | 55,634 | |
Forward foreign currency contracts | | | — | | | $ | 33,232 | | | | — | | | | 33,232 | |
| Total | | $ | 55,634 | | | $ | 33,232 | | | | — | | | $ | 88,866 | |
| † | See Schedule of Investments for additional detailed categorizations. |
(b) Purchased options. When the Fund purchases an option, an amount equal to the premium paid by the Fund is recorded as an investment on the Statement of Assets and Liabilities, the value of which ismarked-to-market to reflect the current market value of the option purchased. If the purchased option expires, the Fund realizes a loss equal to the amount of premium paid. When an instrument is purchased or sold through the exercise of
| | |
| Western Asset Global Corporate Defined Opportunity Fund Inc. 2019 Semi-Annual Report | | 29 |
Notes to financial statements(unaudited) (cont’d)
an option, the related premium paid is added to the basis of the instrument acquired or deducted from the proceeds of the instrument sold. The risk associated with purchasing put and call options is limited to the premium paid.
(c) Written options. When the Fund writes an option, an amount equal to the premium received by the Fund is recorded as a liability, the value of which ismarked-to-market daily to reflect the current market value of the option written. If the option expires, the premium received is recorded as a realized gain. When a written call option is exercised, the difference between the premium received plus the option exercise price and the Fund’s basis in the underlying security (in the case of a covered written call option), or the cost to purchase the underlying security (in the case of an uncovered written call option), including brokerage commission, is recognized as a realized gain or loss. When a written put option is exercised, the amount of the premium received is subtracted from the cost of the security purchased by the Fund from the exercise of the written put option to form the Fund’s basis in the underlying security purchased. The writer or buyer of an option traded on an exchange can liquidate the position before the exercise of the option by entering into a closing transaction. The cost of a closing transaction is deducted from the original premium received resulting in a realized gain or loss to the Fund.
The risk in writing a covered call option is that the Fund may forego the opportunity of profit if the market price of the underlying security increases and the option is exercised. The risk in writing a put option is that the Fund may incur a loss if the market price of the underlying security decreases and the option is exercised. The risk in writing an uncovered call option is that the Fund is exposed to the risk of loss if the market price of the underlying security increases. In addition, there is the risk that the Fund may not be able to enter into a closing transaction because of an illiquid secondary market.
(d) Futures contracts. The Fund uses futures contracts generally to gain exposure to, or hedge against, changes in interest rates or gain exposure to, or hedge against, changes in certain asset classes. A futures contract represents a commitment for the future purchase or sale of an asset at a specified price on a specified date.
Upon entering into a futures contract, the Fund is required to deposit cash or securities with a broker in an amount equal to a certain percentage of the contract amount. This is known as the ‘‘initial margin’’ and subsequent payments (‘‘variation margin’’) are made or received by the Fund each day, depending on the daily fluctuation in the value of the contract. For certain futures, including foreign denominated futures, variation margin is not settled daily, but is recorded as a net variation margin payable or receivable. The daily changes in contract value are recorded as unrealized gains or losses in the Statement of Operations and the Fund recognizes a realized gain or loss when the contract is closed.
Futures contracts involve, to varying degrees, risk of loss in excess of the amounts reflected in the financial statements. In addition, there is the risk that the Fund may not be able to enter into a closing transaction because of an illiquid secondary market.
| | |
| 30 | | Western Asset Global Corporate Defined Opportunity Fund Inc. 2019 Semi-Annual Report |
(e) Forward foreign currency contracts. The Fund enters into a forward foreign currency contract to hedge against foreign currency exchange rate risk on itsnon-U.S. dollar denominated securities or to facilitate settlement of a foreign currency denominated portfolio transaction. A forward foreign currency contract is an agreement between two parties to buy and sell a currency at a set price with delivery and settlement at a future date. The contract ismarked-to-market daily and the change in value is recorded by the Fund as an unrealized gain or loss. When a forward foreign currency contract is closed, through either delivery or offset by entering into another forward foreign currency contract, the Fund recognizes a realized gain or loss equal to the difference between the value of the contract at the time it was opened and the value of the contract at the time it is closed.
Non-deliverable forward foreign currency exchange contracts are settled with the counterparty in cash without the delivery of foreign currency.
Forward foreign currency contracts involve elements of market risk in excess of the amounts reflected on the Statement of Assets and Liabilities. The Fund bears the risk of an unfavorable change in the foreign exchange rate underlying the forward foreign currency contract. Risks may also arise upon entering into these contracts from the potential inability of the counterparties to meet the terms of their contracts.
(f) Loan participations. The Fund may invest in loans arranged through private negotiation between one or more financial institutions. The Fund’s investment in any such loan may be in the form of a participation in or an assignment of the loan. In connection with purchasing participations, the Fund generally will have no right to enforce compliance by the borrower with the terms of the loan agreement related to the loan, or any rights ofoff-set against the borrower and the Fund may not benefit directly from any collateral supporting the loan in which it has purchased the participation.
The Fund assumes the credit risk of the borrower, the lender that is selling the participation and any other persons interpositioned between the Fund and the borrower. In the event of the insolvency of the lender selling the participation, the Fund may be treated as a general creditor of the lender and may not benefit from anyoff-set between the lender and the borrower.
(g) Unfunded loan commitments. The Fund may enter into certain credit agreements where all or a portion of which may be unfunded. The Fund is obligated to fund these commitments at the borrower’s discretion. The commitments are disclosed in the accompanying Schedule of Investments. At April 30, 2019, the Fund had sufficient cash and/or securities to cover these commitments.
(h) Reverse repurchase agreements. The Fund may enter into reverse repurchase agreements. Under the terms of a typical reverse repurchase agreement, a fund sells a security subject to an obligation to repurchase the security from the buyer at an agreed upon time and price. In the event the buyer of securities under a reverse repurchase agreement files for bankruptcy or becomes insolvent, the Fund’s use of the proceeds of the agreement may be restricted pending a determination by the counterparty, or its trustee or
| | |
| Western Asset Global Corporate Defined Opportunity Fund Inc. 2019 Semi-Annual Report | | 31 |
Notes to financial statements(unaudited) (cont’d)
receiver, whether to enforce the Fund’s obligation to repurchase the securities. In entering into reverse repurchase agreements, the Fund will maintain cash, U.S. government securities or other liquid debt obligations at least equal in value to its obligations with respect to reverse repurchase agreements or will take other actions permitted by law to cover its obligations. If the market value of the collateral declines during the period, the Fund may be required to post additional collateral to cover its obligation. Cash collateral that has been pledged to cover obligations of the Fund under reverse repurchase agreements, if any, will be reported separately in the Statement of Assets and Liabilities. Securities pledged as collateral are noted in the Schedule of Investments. Interest payments made on reverse repurchase agreements are recognized as a component of “Interest expense” on the Statement of Operations. In periods of increased demand for the security, the Fund may receive a fee for use of the security by the counterparty, which may result in interest income to the Fund.
(i) Securities traded on a when-issued and delayed delivery basis. The Fund may trade securities on a when-issued or delayed delivery basis. In when-issued and delayed delivery transactions, the securities are purchased or sold by the Fund with payment and delivery taking place in the future in order to secure what is considered to be an advantageous price and yield to the Fund at the time of entering into the transaction.
Purchasing such securities involves risk of loss if the value of the securities declines prior to settlement. These securities are subject to market fluctuations and their current value is determined in the same manner as for other securities.
(j) Cash flow information. The Fund invests in securities and distributes dividends from net investment income and net realized gains, which are paid in cash and may be reinvested at the discretion of shareholders. These activities are reported in the Statement of Changes in Net Assets and additional information on cash receipts and cash payments are presented in the Statement of Cash Flows.
(k) Foreign currency translation. Investment securities and other assets and liabilities denominated in foreign currencies are translated into U.S. dollar amounts based upon prevailing exchange rates on the date of valuation. Purchases and sales of investment securities and income and expense items denominated in foreign currencies are translated into U.S. dollar amounts based upon prevailing exchange rates on the respective dates of such transactions.
The Fund does not isolate that portion of the results of operations resulting from fluctuations in foreign exchange rates on investments from the fluctuations arising from changes in market prices of securities held. Such fluctuations are included with the net realized and unrealized gain or loss on investments.
Net realized foreign exchange gains or losses arise from sales of foreign currencies, including gains and losses on forward foreign currency contracts, currency gains or losses realized between the trade and settlement dates on securities transactions, and the difference between the amounts of dividends, interest, and foreign withholding taxes recorded on the
| | |
| 32 | | Western Asset Global Corporate Defined Opportunity Fund Inc. 2019 Semi-Annual Report |
Fund’s books and the U.S. dollar equivalent of the amounts actually received or paid. Net unrealized foreign exchange gains and losses arise from changes in the values of assets and liabilities, other than investments in securities, on the date of valuation, resulting from changes in exchange rates.
Foreign security and currency transactions may involve certain considerations and risks not typically associated with those of U.S. dollar denominated transactions as a result of, among other factors, the possibility of lower levels of governmental supervision and regulation of foreign securities markets and the possibility of political or economic instability.
(l) Credit and market risk. The Fund invests in high-yield and emerging market instruments that are subject to certain credit and market risks. The yields of high-yield and emerging market debt obligations reflect, among other things, perceived credit and market risks. The Fund’s investments in securities rated below investment grade typically involve risks not associated with higher rated securities including, among others, greater risk related to timely and ultimate payment of interest and principal, greater market price volatility and less liquid secondary market trading. The consequences of political, social, economic or diplomatic changes may have disruptive effects on the market prices of investments held by the Fund. The Fund’s investments innon-U.S. dollar denominated secu- rities may also result in foreign currency losses caused by devaluations and exchange rate fluctuations.
Investments in securities that are collateralized by real estate mortgages are subject to certain credit and liquidity risks. When market conditions result in an increase in default rates of the underlying mortgages and the foreclosure values of underlying real estate prop- erties are materially below the outstanding amount of these underlying mortgages, collec- tion of the full amount of accrued interest and principal on these investments may be doubtful. Such market conditions may significantly impair the value and liquidity of these investments and may result in a lack of correlation between their credit ratings and values.
(m) Foreign investment risks. The Fund’s investments in foreign securities may involve risks not present in domestic investments. Since securities may be denominated in foreign currencies, may require settlement in foreign currencies or pay interest or dividends in for- eign currencies, changes in the relationship of these foreign currencies to the U.S. dollar can significantly affect the value of the investments and earnings of the Fund. Foreign investments may also subject the Fund to foreign government exchange restrictions, expropriation, taxation or other political, social or economic developments, all of which affect the market and/or credit risk of the investments.
(n) Counterparty risk and credit-risk-related contingent features of derivative instruments. The Fund may invest in certain securities or engage in other transactions, where the Fund is exposed to counterparty credit risk in addition to broader market risks. The Fund may invest in securities of issuers, which may also be considered counterparties as trading partners in other transactions. This may increase the risk of loss in the event of default or bankruptcy by the counterparty or if the counterparty otherwise fails to meet its
| | |
| Western Asset Global Corporate Defined Opportunity Fund Inc. 2019 Semi-Annual Report | | 33 |
Notes to financial statements(unaudited) (cont’d)
contractual obligations. The Fund’s subadviser attempts to mitigate counterparty risk by (i) periodically assessing the creditworthiness of its trading partners, (ii) monitoring and/or limiting the amount of its net exposure to each individual counterparty based on its assessment and (iii) requiring collateral from the counterparty for certain transactions. Market events and changes in overall economic conditions may impact the assessment of such counterparty risk by the subadviser. In addition, declines in the values of underlying collateral received may expose the Fund to increased risk of loss.
With exchange traded and centrally cleared derivatives, there is less counterparty risk to the Fund since the exchange or clearinghouse, as counterparty to such instruments, guaran- tees against a possible default. The clearinghouse stands between the buyer and the seller of the contract; therefore, the credit risk is limited to failure of the clearinghouse. While offset rights may exist under applicable law, the Fund does not have a contractual right of offset against a clearing broker or clearinghouse in the event of a default of the clearing broker or clearinghouse.
The Fund has entered into master agreements, such as an International Swaps and Deriva- tives Association, Inc. Master Agreement (“ISDA Master Agreement”) or similar agreement, with certain of its derivative counterparties that governover-the-counter derivatives and provide for general obligations, representations, agreements, collateral posting terms,net- ting provisions in the event of default or termination and credit related contingent features. The credit related contingent features include, but are not limited to, a percentage decrease in the Fund’s net assets or NAV over a specified period of time. If these credit relatedcon- tingent features were triggered, the derivatives counterparty could terminate the positions and demand payment or require additional collateral.
Under an ISDA Master Agreement, the Fund may, under certain circumstances, offset with the counterparty certain derivative financial instruments’ payables and/or receivables with collateral held and/or posted and create one single net payment. However, absent an event of default by the counterparty or a termination of the agreement, the terms of the ISDA Master Agreements do not result in an offset of reported amounts of financial assets and financial liabilities in the Statement of Assets and Liabilities across transactions between the Fund and the applicable counterparty. The enforceability of the right to offset may vary by jurisdiction.
Collateral requirements differ by type of derivative. Collateral or margin requirements are set by the broker or exchange clearinghouse for exchange traded derivatives while collat- eral terms are contract specific forover-the-counter traded derivatives. Cash collateral that has been pledged to cover obligations of the Fund under derivative contracts, if any, will be reported separately in the Statement of Assets and Liabilities. Securities pledged as collat- eral, if any, for the same purpose are noted in the Schedule of Investments.
As of April 30, 2019, the Fund held forward foreign currency contracts with credit related contingent features which had a liability position of $33,232. If a contingent feature in the master agreements would have been triggered, the Fund would have been required to pay this amount to its derivatives counterparties.
| | |
| 34 | | Western Asset Global Corporate Defined Opportunity Fund Inc. 2019 Semi-Annual Report |
At April 30, 2019, the Fund heldnon-cash collateral from Barclays Bank PLC in the amount of $10,839. This amount could be used to reduce the Fund’s exposure to the counterparty in the event of default.
(o) Security transactions and investment income. Security transactions are accounted for on a trade date basis. Interest income (including interest income frompayment-in-kind securities), adjusted for amortization of premium and accretion of discount, is recorded on the accrual basis. Paydown gains and losses on mortgage- and asset-backed securities are recorded as adjustments to interest income. Dividend income is recorded on theex-dividend date for dividends received in cash and/or securities. Foreign dividend income is recorded on theex-dividend date or as soon as practicable after the Fund determines the existence of a dividend declaration after exercising reasonable due diligence. The cost of investments sold is determined by use of the specific identification method. To the extent any issuer defaults or a credit event occurs that impacts the issuer, the Fund may halt any additional interest income accruals and consider the realizability of interest accrued up to the date of default or credit event.
(p) Distributions to shareholders. Distributions from net investment income of the Fund, if any, are declared quarterly and paid on a monthly basis. The actual source of the Fund’s monthly distributions may be from net investment income, return of capital or a combination of both. Shareholders will be informed of the tax characteristics of the distributions after the close of the fiscal year. Distributions of net realized gains, if any, are taxable and are declared at least annually. Distributions to shareholders of the Fund are recorded on theex-dividend date and are determined in accordance with income tax regulations, which may differ from GAAP.
(q) Compensating balance arrangements. The Fund has an arrangement with its custodian bank whereby a portion of the custodian’s fees is paid indirectly by credits earned on the Fund’s cash on deposit with the bank.
(r) Federal and other taxes. It is the Fund’s policy to comply with the federal income and excise tax requirements of the Internal Revenue Code of 1986 (the “Code”), as amended, applicable to regulated investment companies. Accordingly, the Fund intends to distribute its taxable income and net realized gains, if any, to shareholders in accordance with timing requirements imposed by the Code. Therefore, no federal or state income tax provision is required in the Fund’s financial statements.
Management has analyzed the Fund’s tax positions taken on income tax returns for all open tax years and has concluded that as of October 31, 2018, no provision for income tax is required in the Fund’s financial statements. The Fund’s federal and state income and federal excise tax returns for tax years for which the applicable statutes of limitations have not expired are subject to examination by the Internal Revenue Service and state departments of revenue.
Under the applicable foreign tax laws, a withholding tax may be imposed on interest, divi- dends and capital gains at various rates.
| | |
| Western Asset Global Corporate Defined Opportunity Fund Inc. 2019 Semi-Annual Report | | 35 |
Notes to financial statements(unaudited) (cont’d)
(s) Reclassification. GAAP requires that certain components of net assets be reclassified to reflect permanent differences between financial and tax reporting. These reclassifications have no effect on net assets or net asset value per share.
2. Investment management agreement and other transactions with affiliates
Legg Mason Partners Fund Advisor, LLC (“LMPFA”) is the Fund’s investment manager. Western Asset Management Company, LLC (“Western Asset”), Western Asset Management Company Pte. Ltd. (“Western Asset Singapore”), Western Asset Management Company Ltd (“Western Asset Japan”) and Western Asset Management Company Limited (“Western Asset Limited”) are the Fund’s subadvisers. LMPFA, Western Asset, Western Asset Singapore, Western Asset Japan and Western Asset Limited are wholly-owned subsidiaries of Legg Mason, Inc. (“Legg Mason”).
LMPFA provides administrative and certain oversight services to the Fund. The Fund pays LMPFA an investment management fee, calculated daily and paid monthly, at an annual rate of 0.80% of the Fund’s average daily net assets plus the amount of any borrowings and assets attributable to any preferred stock that may be outstanding.
LMPFA delegates to Western Asset theday-to-day portfolio management of the Fund. Western Asset Singapore, Western Asset Japan and Western Asset Limited provide certain subadvisory services to the Fund relating to currency transactions and investments innon-U.S. dollar denominated debt securities. For its services, LMPFA pays Western Asset monthly 70% of the net management fee it receives from the Fund. Western Asset Singapore, Western Asset Japan and Western Asset Limited do not receive any compensation from the Fund. Western Asset pays Western Asset Singapore, Western Asset Japan and Western Asset Limited a monthly subadvisory fee in an amount equal to 100% of the management fee paid to Western Asset on the assets that Western Asset allocates to each suchnon-U.S. subadviser to manage.
During periods in which the Fund utilizes financial leverage, the fees paid to LMPFA will be higher than if the Fund did not utilize leverage because the fees are calculated as a percentage of the Fund’s assets, including those investments purchased with leverage.
All officers and one Director of the Fund are employees of Legg Mason or its affiliates and do not receive compensation from the Fund.
3. Investments
During the six months ended April 30, 2019, the aggregate cost of purchases and proceeds from sales of investments (excluding short-term investments) and U.S. Government & Agency Obligations were as follows:
| | | | | | | | |
| | | Investments | | | U.S. Government &
Agency Obligations | |
| Purchases | | $ | 99,824,725 | | | $ | 9,291,950 | |
| Sales | | | 105,903,034 | | | | 1,690,309 | |
| | |
| 36 | | Western Asset Global Corporate Defined Opportunity Fund Inc. 2019 Semi-Annual Report |
At April 30, 2019, the aggregate cost of investments and the aggregate gross unrealized appreciation and depreciation of investments for federal income tax purposes were substantially as follows:
| | | | | | | | | | | | | | | | |
| | | Cost | | | Gross
Unrealized
Appreciation | | | Gross
Unrealized
Depreciation | | | Net
Unrealized
Appreciation
(Depreciation) | |
| Securities | | $ | 347,348,279 | | | $ | 21,421,462 | | | $ | (5,024,425) | | | $ | 16,397,037 | |
| Futures contracts | | | — | | | | — | | | | (55,634) | | | | (55,634) | |
| Forward foreign currency contracts | | | — | | | | 34,004 | | | | (33,232) | | | | 772 | |
Transactions in reverse repurchase agreements for the Fund during the six months ended April 30, 2019 were as follows:
| | | | |
Average Daily
Balance* | | Weighted Average
Interest Rate* | | Maximum Amount
Outstanding |
| $7,340,519 | | 2.68% | | $8,266,375 |
| * | Averages based on the number of days that the Fund had reverse repurchase agreements outstanding. |
Interest rates on reverse repurchase agreements ranged from2.45%-2.72% during the six months ended April 30, 2019. Interest expense incurred on reverse repurchase agreements totaled $97,391.
4. Derivative instruments and hedging activities
Below is a table, grouped by derivative type, that provides information about the fair value and the location of derivatives within the Statement of Assets and Liabilities at April 30, 2019.
| | | | |
| ASSET DERIVATIVES1 | | | |
| | | Foreign
Exchange Risk | |
| Forward foreign currency contracts | | $ | 34,004 | |
| | | | |
| LIABILITY DERIVATIVES1 | | | |
| | | Foreign
Exchange Risk | |
| Futures contracts2 | | $ | 55,634 | |
| Forward foreign currency contracts | | | 33,232 | |
| Total | | $ | 88,866 | |
| 1 | Generally, the balance sheet location for asset derivatives is receivables/net unrealized appreciation (depreciation) and for liability derivatives is payables/net unrealized appreciation (depreciation). |
| 2 | Includes cumulative appreciation (depreciation) of futures contracts as reported in the Schedule of Investments. Only variation margin is reported within the receivables and/or payables on the Statement of Assets and Liabilities. |
The following tables provide information about the effect of derivatives and hedging activities on the Fund’s Statement of Operations for the six months ended April 30, 2019. The first table provides additional detail about the amounts and sources of gains (losses) realized on derivatives during the period. The second table provides additional information
| | |
| Western Asset Global Corporate Defined Opportunity Fund Inc. 2019 Semi-Annual Report | | 37 |
Notes to financial statements(unaudited) (cont’d)
about the change in unrealized appreciation (depreciation) resulting from the Fund’s derivatives and hedging activities during the period.
| | | | | | | | | | | | |
| AMOUNT OF REALIZED GAIN (LOSS) ON DERIVATIVES RECOGNIZED | |
| | | Interest
Rate Risk | | | Foreign
Exchange Risk | | | Total | |
| Purchased options1 | | | — | | | $ | (62,723) | | | $ | (62,723) | |
| Written options | | | — | | | | 47,829 | | | | 47,829 | |
| Futures contracts | | $ | (609) | | | | (387,176) | | | | (387,785) | |
| Forward foreign currency contracts | | | — | | | | (229,534) | | | | (229,534) | |
| Total | | $ | (609) | | | $ | (631,604) | | | $ | (632,213) | |
| 1 | Net realized gain (loss) from purchased options is reported in net realized gain (loss) from investment transactions in the Statement of Operations. |
| | | | |
| CHANGE IN UNREALIZED APPRECIATION (DEPRECIATION) ON DERIVATIVES RECOGNIZED | |
| | | Foreign
Exchange Risk | |
| Purchased options1 | | $ | 36,100 | |
| Written options | | | 23,850 | |
| Futures contracts | | | 81,390 | |
| Forward foreign currency contracts | | | 98,473 | |
| Total | | $ | 239,813 | |
| 1 | The change in unrealized appreciation (depreciation) from purchased options is reported in the change in net unrealized appreciation (depreciation) from investments in the Statement of Operations. |
During the six months ended April 30, 2019, the volume of derivative activity for the Fund was as follows:
| | | | |
| | | Average Market Value | |
| Purchased options† | | $ | 7,329 | |
| Written options† | | | 15,558 | |
| Futures contracts (to buy) | | | 10,819,238 | |
| Forward foreign currency contracts (to buy) | | | 7,977,247 | |
| Forward foreign currency contracts (to sell) | | | 3,790,568 | |
| † | At April 30, 2019, there were no open positions held in this derivative. |
The following table presents the Fund’s OTC derivative assets and liabilities by counterparty net of amounts available for offset under an ISDA Master Agreement and net of the related collateral pledged (received) by the Fund as of April 30, 2019.
| | | | | | | | | | | | | | | | | | | | |
| Counterparty | | Gross Assets
Subject to
Master
Agreements1 | | | Gross
Liabilities
Subject to
Master
Agreements1 | | | Net Assets
(Liabilities)
Subject to
Master
Agreements | | | Collateral
Pledged
(Received)2, 3 | | | Net
Amount4, 5 | |
| Barclays Bank PLC | | $ | 34,004 | | | $ | (28,880) | | | $ | 5,124 | | | $ | (10,839) | | | $ | (5,715) | |
| Goldman Sachs Group Inc. | | | — | | | | (4,352) | | | | (4,352) | | | | — | | | | (4,352) | |
| Total | | $ | 34,004 | | | $ | (33,232) | | | $ | 772 | | | $ | (10,839) | | | $ | (10,067) | |
| 1 | Absent an event of default or early termination, derivative assets and liabilities are presented gross and not offset in the Statement of Assets and Liabilities. |
| | |
| 38 | | Western Asset Global Corporate Defined Opportunity Fund Inc. 2019 Semi-Annual Report |
| 2 | Gross amounts are not offset in the Statement of Assets and Liabilities. |
| 3 | In some instances, the actual collateral received and/or pledged may be more than the amount shown here due to overcollateralization. |
| 4 | Net amount may also include forward foreign currency exchange contracts that are not required to be collateralized. |
| 5 | Represents the net amount receivable (payable) from (to) the counterparty in the event of default. |
5. Loan
Effective June 2, 2015, the Fund has a revolving credit agreement with National Australia Bank Limited that allows the Fund to borrow up to an aggregate amount of $90,000,000. This credit agreement renews daily for a six month term unless notice to the contrary is given to the Fund. The final scheduled termination date of the credit agreement is June 2, 2020. The Fund pays a commitment fee at an annual rate of 0.20% on the unutilized portion of the loan commitment amount. The interest on the loan is calculated at a variable rate based on the LIBOR plus any applicable margin. Securities held by the Fund are subject to a lien granted to National Australia Bank Limited, to the extent of the borrowing outstanding and any additional expenses. The Fund’s credit agreement contains customary covenants that, among other things, may limit the Fund’s ability to pay distributions in certain circumstances, incur additional debt, change its fundamental investment policies and engage in certain transactions, including mergers and consolidations, and require asset coverage ratios in addition to those required by the 1940 Act. In addition, the credit agreement may be subject to early termination under certain conditions and may contain other provisions that could limit the Fund’s ability to utilize borrowing under the agreement. Interest expense related to the loan for the six months ended April 30, 2019 was $1,369,806. For the six months ended April 30, 2019, the Fund incurred a commitment fee in the amount of $2,011. For the six months ended April 30, 2019, the Fund had an average daily loan balance outstanding of $88,000,000 and the weighted average interest rate was 3.14%. At April 30, 2019, the Fund had $88,000,000 of borrowings outstanding per this credit agreement.
6. Distributions subsequent to April 30, 2019
The following distributions have been declared by the Fund’s Board of Directors and are payable subsequent to the period end of this report:
| | | | | | | | |
| Record Date | | Payable Date | | | Amount | |
| 4/18/2019 | | | 5/1/2019 | | | $ | 0.1010 | |
| 5/24/2019 | | | 6/3/2019 | | | $ | 0.1010 | |
| 6/21/2019 | | | 7/1/2019 | | | $ | 0.1010 | |
| 7/19/2019 | | | 8/1/2019 | | | $ | 0.1010 | |
| 8/23/2019 | | | 9/3/2019 | | | $ | 0.1010 | |
7. Stock repurchase program
On March 10, 2014, the Fund announced that the Fund’s Board of Directors (the “Board”) had authorized the Fund to repurchase in the open market up to 1,600,000 shares of the Fund’s outstanding common stock when the Fund’s shares are trading at a discount to the net asset value. The Board directed management of the Fund to repurchase shares of common stock at such times and in such amounts as management reasonably believes may
| | |
| Western Asset Global Corporate Defined Opportunity Fund Inc. 2019 Semi-Annual Report | | 39 |
Notes to financial statements(unaudited) (cont’d)
enhance stockholder value. The Fund is under no obligation to purchase shares at any specific discount levels or in any specific amounts. During the six months ended April 30, 2019, the Fund did not repurchase any shares.
Since the Fund’s commencement of the stock repurchase program through April 30, 2019, the Fund repurchased 406,236 shares or 2.65% of its common shares outstanding for the total amount of $6,987,955. The anti-dilutive impact of these share repurchases is included on the Financial Highlights.
8. Deferred capital losses
As of October 31, 2018, the Fund had deferred capital losses of $20,713,068, which have no expiration date, that will be available to offset future taxable capital gains.
9. Recent accounting pronouncements
In August 2018, the Securities and Exchange Commission released its Final Rule on Disclosure Update and Simplification (the “Final Rule”) which is intended to simplify an issuer’s disclosure compliance efforts by removing redundant or outdated disclosure requirements without significantly altering the mix of information provided to investors. Effective with the current reporting period, the Fund adopted the Final Rule with the most notable impacts being that the Fund is no longer required to present the components of distributable earnings on the Statement of Assets and Liabilities or the sources of distributions to shareholders and the amount of undistributed net investment income on the Statements of Changes in Net Assets. The tax components of distributable earnings and distributions to shareholders continue to be disclosed within the Notes to Financial Statements.
The Fund has adopted the disclosure provisions of the Financial Accounting Standards Board Accounting Standards UpdateNo. 2018-13,Fair Value Measurement (Topic 820)—Disclosure Framework—Changes to the Disclosure Requirements for Fair Value Measurement(“ASU2018-13”) which introduces new fair value disclosure requirements as well as eliminates and modifies certain existing fair value disclosure requirements. ASU2018-13 would be effective for fiscal years beginning after December 15, 2019, and interim periods within those fiscal years; however, management has elected to early adopt ASU2018-13. The impact of the Fund’s adoption was limited to changes in the Fund’s financial statement disclosures regarding fair value, primarily those disclosures related to transfers between levels of the fair value hierarchy.
| | |
| 40 | | Western Asset Global Corporate Defined Opportunity Fund Inc. 2019 Semi-Annual Report |
Board approval of management and subadvisory agreements(unaudited)
Background
The Investment Company Act of 1940, as amended (the “1940 Act”), requires that the Board of Directors (the “Board”) of Western Asset Global Corporate Defined Opportunity Fund Inc. (the “Fund”), including a majority of its members who are not considered to be “interested persons” under the 1940 Act (the “Independent Directors”) voting separately, approve on an annual basis the continuation of the investment management contract (the “Management Agreement”) with the Fund’s manager, Legg Mason Partners Fund Advisor, LLC (the “Manager”), and thesub-advisory agreements (individually, a“Sub-Advisory Agreement,” and collectively, the“Sub-Advisory Agreements”) with the Manager’s affiliates, Western Asset Management Company, LLC (“Western Asset”), Western Asset Management Company Pte. Ltd. in Singapore (“Western Asset Singapore”), Western Asset Management Company Ltd in Japan (“Western Asset Japan”), and Western Asset Management Company Limited in London (“Western Asset London”). Western Asset, Western Asset Singapore, Western Asset Japan, and Western Asset London together are hereinafter referred to as the“Sub-Advisers,” and Western Asset Singapore, Western Asset Japan, and Western Asset London together are hereinafter referred to as the“Non-U.S.Sub-Advisers.” At a meeting (the “Contract Renewal Meeting”) heldin-person on November 7 and 8, 2018, the Board, including the Independent Directors, considered and approved the continuation of each of the Management Agreement and theSub-Advisory Agreements for an additionalone-year term. To assist in its consideration of the renewals of the Management Agreement and theSub-Advisory Agreements, the Board received and considered a variety of information (together with the information provided at the Contract Renewal Meeting, the “Contract Renewal Information”) about the Manager and theSub-Advisers, as well as the management andsub-advisory arrangements for the Fund and the otherclosed-end funds in the same complex under the Board’s supervision (the “Legg MasonClosed-end Funds”), certain portions of which are discussed below. A presentation made by the Manager and Western Asset to the Board at the Contract Renewal Meeting in connection with its evaluations of the Management Agreement and theSub-Advisory Agreements encompassed the Fund and other Legg MasonClosed-end Funds. In addition to the Contract Renewal Information, the Board received performance and other information throughout the year related to the respective services rendered by the Manager and theSub-Advisers to the Fund. The Board’s evaluation took into account the information received throughout the year and also reflected the knowledge and familiarity gained as members of the Boards of the Fund and other Legg MasonClosed-end Funds with respect to the services provided to the Fund by the Manager and theSub-Advisers.
At a meeting held by conference call on October 31, 2018, the Independent Directors in preparation for the Contract Renewal Meeting met in a private session with their independent counsel to review Contract Renewal Information in respect of the Legg MasonClosed-end Funds, including the Fund, received to date. No representatives of the Manager or Western Asset participated in this meeting. The discussion below reflects all of these reviews.
| | |
| Western Asset Global Corporate Defined Opportunity Fund Inc. | | 41 |
Board approval of management and subadvisory agreements(unaudited) (cont’d)
The Manager provides the Fund with investment advisory and administrative services pursuant to the Management Agreement and theSub-Advisers together provide, or in the case of theNon-U.S.Sub-advisers help to provide, the Fund with certain investmentsub-advisory services pursuant to theSub-Advisory Agreements. The discussion below covers both the advisory and administrative functions being rendered by the Manager, each such function being encompassed by the Management Agreement, and the investmentsub-advisory functions being rendered by theSub-Advisers.
Board approval of management agreement andsub-advisory agreements
In its deliberations regarding renewal of the Management Agreement and theSub-Advisory Agreements, the Board, including the Independent Directors, considered the factors below.
Nature, extent and quality of the services under the management agreement andsub-advisory agreements
The Board received and considered Contract Renewal Information regarding the nature, extent, and quality of services provided to the Fund by the Manager and theSub-Advisers under the Management Agreement and theSub-Advisory Agreements, respectively, during the past year. The Board also reviewed Contract Renewal Information regarding the Fund’s compliance policies and procedures established pursuant to the 1940 Act.
The Board reviewed the qualifications, backgrounds, and responsibilities of the Fund’s senior personnel and the portfolio management team primarily responsible for theday-to-day portfolio management of the Fund. The Board also considered, based on its knowledge of the Manager and its affiliates, the Contract Renewal Information and the Board’s discussions with the Manager and Western Asset at the Contract Renewal Meeting, the general reputation and investment performance records of the Manager, Western Asset and their affiliates and the financial resources available to the corporate parent of the Manager and theSub-Advisers, Legg Mason, Inc. (“Legg Mason”), to support their activities in respect of the Fund and the other Legg MasonClosed-end Funds.
The Board reviewed the responsibilities of the Manager and theSub-Advisers under the Management Agreement and theSub-Advisory Agreements, respectively, including the Manager’s coordination and oversight of the services provided to the Fund by theSub-Advisers and others and Western Asset’s coordination and oversight of the services provided to the Fund by theNon-U.S.Sub-Advisers. The Management Agreement permits the Manager to delegate certain of its responsibilities, including its investment advisory duties thereunder, provided that the Manager, in each case, will supervise the activities of the delegee. Pursuant to this provision of the Management Agreement, the Manager does not provideday-to-day portfolio management services to the Fund. Rather, portfolio management services for the Fund are provided by Western Asset pursuant to theSub-Advisory Agreement (the “Western AssetSub-Advisory Agreement”) between the Manager and Western Asset. The Western AssetSub-Advisory Agreement permits Western Asset to delegate certain of its responsibilities, including its investmentsub-advisory
| | |
| 42 | | Western Asset Global Corporate Defined Opportunity Fund Inc. |
duties thereunder, provided that Western Asset, in each case, will supervise the activities of the delegee. Pursuant to this provision of the Western AssetSub-Advisory Agreement, eachNon-U.S.Sub-Adviser helps to provide portfolio management services to the Fund pursuant to a separateSub-Advisory Agreement with Western Asset.
In reaching its determinations regarding continuation of the Management Agreement and theSub-Advisory Agreements, the Board took into account that Fund shareholders, in pursuing their investment goals and objectives, likely purchased their shares based upon the reputation and the investment style, philosophy and strategy of the Manager and Western Asset, as well as the resources available to the Manager and theSub-Advisers.
The Board concluded that, overall, the nature, extent, and quality of the management and other services provided to the Fund under the Management Agreement and theSub-Advisory Agreements have been satisfactory under the circumstances.
Fund performance
The Board received and considered information regarding Fund performance, including information and analyses (the “Broadridge Performance Information”) for the Fund, as well as for a group of funds (the “Performance Universe”) selected by Broadridge Financial Solutions, Inc. (“Broadridge”), an independent provider of investment company data. The Board was provided with a description of the methodology Broadridge used to determine the similarity of the Fund with the funds included in the Performance Universe. The Performance Universe included the Fund and all leveraged global incomeclosed-end funds, as classified by Broadridge, regardless of asset size. The Performance Universe consisted of thirteen funds, including the Fund, for the1- year period ended June 30, 2018 and twelve funds, including the Fund, for each of the3- and the5-year periods ended such date. The Board noted that it had received and discussed with the Manager and Western Asset information throughout the year at periodic intervals comparing the Fund’s performance against its benchmark and its peer funds as selected by Broadridge.
The Broadridge Performance Information comparing the Fund’s performance to that of the Performance Universe based on net asset value per share showed, among other things, that the Fund’s performance was ranked ninth among the funds in the Performance Universe for the1- year period ended June 30, 2018 (first being best in these performance rankings); seventh among the funds in Performance Universe for the3- year period ended such date; and fifth among the funds in the Performance Universe for the5-year period ended such date. The Fund’s performance for each of the1- and3- year periods was worse than the median performance for the Performance Universe for such period but was better than the Performance Universe median for the5- year period. The Board noted that the small number of funds in the Performance Universe made meaningful performance comparisons difficult. In addition to the Fund’s performance relative to the Performance Universe, the Board considered the Fund’s performance in absolute terms and the Fund’s performance relative to its benchmark for each of the1-,3- and5-year periods ended June 30, 2018. On a net asset
| | |
| Western Asset Global Corporate Defined Opportunity Fund Inc. | | 43 |
Board approval of management and subadvisory agreements(unaudited) (cont’d)
value basis, the Fund underperformed its benchmark for the1-year period but outperformed its benchmark for each of the3- and5-year periods.
Based on the reviews and discussions of Fund performance and considering other relevant factors, including those noted above, the Board concluded, under the circumstances, that continuation of the Management Agreement and theSub-Advisory Agreements for an additionalone-year period would be consistent with the interests of the Fund and its shareholders.
Management fees and expense ratios
The Board reviewed and considered the management fee (the “Management Fee”) payable by the Fund to the Manager under the Management Agreement and thesub-advisory fees (the“Sub-Advisory Fees”) payable to theSub-Advisers under theSub-Advisory Agreements in light of the nature, extent and overall quality of the management, investment advisory and other services provided by the Manager and theSub-Advisers. The Board noted that theSub-Advisory Fee payable to Western Asset under the Western AssetSub-Advisory Agreement is paid by the Manager, not the Fund, and, accordingly, that the retention of Western Asset does not increase the fees or expenses otherwise incurred by the Fund’s shareholders. Similarly, the Board noted that theSub-Advisory Fee payable to each of theNon-U.S.Sub-Advisers under itsSub-Advisory Agreement with Western Asset is paid by Western Asset, not the Fund, and, accordingly, that the retention of suchNon-U.S.Sub-Adviser does not increase the fees or expenses otherwise incurred by the Fund’s shareholders.
Additionally, the Board received and considered information and analyses prepared by Broadridge (the “Broadridge Expense Information”) comparing the Management Fee and the Fund’s overall expenses with those of funds in an expense group (the “Expense Group”) selected and provided by Broadridge. The comparison was based upon the constituent funds’ latest fiscal years. The Expense Group consisted of the Fund and five other leveraged global incomeclosed-end funds, as classified by Broadridge. The six funds in the Expense Group had average net common share assets ranging from $79.7 million to $329.5 million. One of the other Expense Group funds was larger than the Fund and four were smaller.
The Broadridge Expense Information, comparing the Management Fee as well as the Fund’s actual total expenses to the Fund’s Expense Group, showed, among other things, that the Management Fee on a contractual basis was ranked third among the funds in the Expense Group (first being lowest and, therefore, best in these expense component rankings). The Fund’s actual Management Fee (i.e., giving effect to any voluntary fee waivers implemented by the Manager with respect to the Fund and by the managers of the other Expense Universe funds) was ranked second among the funds in the Expense Group compared on the basis of common share assets only and was ranked fourth among the funds in the Expense Group on the basis of common share and leveraged assets. The Fund’s actual total expenses ranked second among the funds in the Expense Group compared on the basis of common share assets only and ranked third among the funds in the Expense Group compared on the basis of common share and leveraged assets. The Fund’s actual Management Fee compared on the basis
| | |
| 44 | | Western Asset Global Corporate Defined Opportunity Fund Inc. |
of common share and leveraged assets was worse (i.e., higher) than the expense group median for that expense component but each of the Fund’s other expense components was better (i.e., lower) than the Expense Group median for that expense component. The Manager noted that the small number of funds in the Expense Group made meaningful expense comparisons difficult.
The Board also reviewed Contract Renewal Information regarding fees charged by the Manager to other U.S. clients investing primarily in an asset class similar to that of the Fund, including, where applicable, institutional and separate accounts. The Board was advised that the fees paid by such institutional, separate account and other clients (collectively, “institutional clients”) generally are lower, and may be significantly lower, than the Management Fee. The Contract Renewal Information discussed the significant differences in scope of services provided to the Fund and to institutional clients. Among other things, institutional clients have fewer compliance, administration and other needs than the Fund and the Fund is subject not only to heightened regulatory requirements relative to institutional clients but also to requirements for listing on the New York Stock Exchange. The Contract Renewal Information noted further that the Fund is provided with administrative services, office facilities, Fund officers (including the Fund’s chief executive, chief financial and chief compliance officers), and that the Manager coordinates and oversees the provision of services to the Fund by other fund service providers. The Contract Renewal Information included information regarding management fees paid byopen-end mutual funds in the same complex (the “Legg MasonOpen-end Funds”) and such information indicated that the management fees paid by the Legg MasonClosed-end Funds generally were higher than those paid by the Legg MasonOpen-end Funds. The Manager, in response to an inquiry from the Board as to the reasons for the fee differential, provided information as to differences between the services provided to the Fund and the other Legg MasonClosed-end Funds and the services provided to the Legg MasonOpen-end Funds. The Board considered the fee comparisons in light of the different services provided in managing these other types of clients and funds.
Taking all of the above into consideration, the Board determined that the Management Fee and theSub-Advisory Fees were reasonable in light of the nature, extent and overall quality of the management, investment advisory and other services provided to the Fund under the Management Agreement and theSub-Advisory Agreements.
Manager profitability
The Board, as part of the Contract Renewal Information, received an analysis of the profitability to the Manager and its affiliates in providing services to the Fund for the Manager’s fiscal years ended March 31, 2018 and March 31, 2017. The Board also received profitability information with respect to the Legg Mason fund complex as a whole. In addition, the Board received Contract Renewal Information with respect to the Manager’s revenue and cost allocation methodologies used in preparing such profitability data. The profitability to each of theSub-Advisers was not considered to be a material factor in the Board’s considerations
| | |
| Western Asset Global Corporate Defined Opportunity Fund Inc. | | 45 |
Board approval of management and subadvisory agreements(unaudited) (cont’d)
since Western Asset’sSub-Advisory Fee is paid by the Manager, not the Fund, and theSub-Advisory Fees for theNon-U.S.Sub-Advisers are paid by Western Asset, not the Fund. The profitability analysis presented to the Board as part of the Contract Renewal Information indicated that profitability to the Manager had declined by 1 percent during the period covered by the analysis and remained at a level that the Board did not consider to be excessive in light of judicial guidance and the nature, extent and overall quality of the investment advisory and other services provided to the Fund.
Economies of scale
The Board received and discussed Contract Renewal Information concerning whether the Manager realizes economies of scale if the Fund’s assets grow. The Board noted that because the Fund is aclosed-end fund with no current plans to seek additional assets beyond maintaining its dividend reinvestment plan, any significant growth in its assets generally will occur through appreciation in the value of the Fund’s investment portfolio, rather than sales of additional shares in the Fund. The Board determined that the Management Fee structure, which incorporates no breakpoints reducing the Management Fee at specified increased asset levels, was appropriate under present circumstances.
Other benefits to the manager and thesub-advisers
The Board considered other benefits received by the Manager, theSub-Advisers and their affiliates as a result of their relationship with the Fund and did not regard such benefits as excessive.
* * * * * *
In light of all of the foregoing and other relevant factors, the Board determined, under the circumstances, that continuation of the Management Agreement and theSub-Advisory Agreements would be consistent with the interests of the Fund and its shareholders and unanimously voted to continue each Agreement for a period of one additional year. No single factor reviewed by the Board was identified by the Board as the principal factor in determining whether to approve continuation of the Management Agreement and theSub-Advisory Agreements, and each Board member may have attributed different weights to the various factors. The Independent Directors were advised by separate independent legal counsel throughout the process. Prior to the Contract Renewal Meeting, the Board received a memorandum prepared by the Manager discussing its responsibilities in connection with the proposed continuation of the Management Agreement and theSub-Advisory Agreements as part of the Contract Renewal Information and the Independent Directors separately received a memorandum discussing such responsibilities from their independent counsel. Prior to voting, the Independent Directors also discussed the proposed continuation of the Management Agreement and theSub-Advisory Agreements in private sessions with their independent legal counsel at which no representatives of the Manager or anySub-Adviser were present.
| | |
| 46 | | Western Asset Global Corporate Defined Opportunity Fund Inc. |
Additional shareholder information(unaudited)
Results of annual meeting of shareholders
The Annual Meeting of Shareholders of Western Asset Global Corporate Defined Opportunity Fund Inc. was held on February 22, 2019, for the purpose of considering and voting upon the election of Directors. The following table provides information concerning the matter voted upon at the Meeting:
Election of directors
| | | | | | | | |
| Nominees | | Votes For | | | Votes
Withheld | |
| Robert D. Agdern | | | 12,703,168 | | | | 1,305,642 | |
| Eileen A. Kamerick | | | 12,628,768 | | | | 1,380,042 | |
| Nisha Kumar | | | 13,651,529 | | | | 357,281 | |
At April 30, 2019, in addition to Robert D. Agdern, Eileen A. Kamerick and Nisha Kumar, the other Directors of the Fund were as follows:
Carol L. Colman
Daniel P. Cronin
Paolo M. Cucchi
William R. Hutchinson
Jane Trust
| | |
| Western Asset Global Corporate Defined Opportunity Fund Inc. | | 47 |
Dividend reinvestment plan(unaudited)
Unless you elect to receive distributions in cash (i.e.,opt-out), all dividends, including any capital gain dividends and return of capital distributions, on your Common Stock will be automatically reinvested by Computershare Trust Company, N.A., as agent for the stockholders (the “Plan Agent”), in additional shares of Common Stock under the Fund’s Dividend Reinvestment Plan (the “Plan”). You may elect not to participate in the Plan by contacting the Plan Agent. If you do not participate, you will receive all cash distributions paid by check mailed directly to you by Computershare Trust Company, N.A., as dividend paying agent.
If you participate in the Plan, the number of shares of Common Stock you will receive will be determined as follows:
(1) If the market price of the Common Stock (plus $0.03 per share commission) on the payment date (or, if the payment date is not a NYSE trading day, the immediately preceding trading day) is equal to or exceeds the net asset value per share of the Common Stock at the close of trading on the NYSE on the payment date, the Fund will issue new Common Stock at a price equal to the greater of (a) the net asset value per share at the close of trading on the NYSE on the payment date or (b) 95% of the market price per share of the Common Stock on the payment date.
(2) If the net asset value per share of the Common Stock exceeds the market price of the Common Stock (plus $0.03 per share commission) at the close of trading on the NYSE on the payment date, the Plan Agent will receive the dividend or distribution in cash and will buy Common Stock in the open market, on the NYSE or elsewhere, for your account as soon as practicable commencing on the trading day following the payment date and terminating no later than the earlier of (a) 30 days after the dividend or distribution payment date, or (b) the payment date for the next succeeding dividend or distribution to be made to the stockholders; except when necessary to comply with applicable provisions of the federal securities laws. If during this period: (i) the market price (plus $0.03 per share commission) rises so that it equals or exceeds the net asset value per share of the Common Stock at the close of trading on the NYSE on the payment date before the Plan Agent has completed the open market purchases or (ii) if the Plan Agent is unable to invest the full amount eligible to be reinvested in open market purchases, the Plan Agent will cease purchasing Common Stock in the open market and the Fund shall issue the remaining Common Stock at a price per share equal to the greater of (a) the net asset value per share at the close of trading on the NYSE on the day prior to the issuance of shares for reinvestment or (b) 95% of the then current market price per share.
Common Stock in your account will be held by the Plan Agent innon-certificated form. Any proxy you receive will include all shares of Common Stock you have received under the Plan. You may withdraw from the Plan (i.e.,opt-out) by notifying the Plan Agent in writing at 462 South 4th Street, Suite 1600, Louisville, KY 40202 or by calling the Plan Agent at1-888-888-0151. Such withdrawal will be effective immediately if notice is received by the
| | |
| 48 | | Western Asset Global Corporate Defined Opportunity Fund Inc. |
Plan Agent not less than ten business days prior to any dividend or distribution record date; otherwise such withdrawal will be effective as soon as practicable after the Plan Agent’s investment of the most recently declared dividend or distribution on the Common Stock.
Plan participants who sell their shares will be charged a service charge (currently $5.00 per transaction) and the Plan Agent is authorized to deduct brokerage charges actually incurred from the proceeds (currently $0.05 per share commission). There is no service charge for reinvestment of your dividends or distributions in Common Stock. However, all participants will pay a pro rata share of brokerage commissions incurred by the Plan Agent when it makes open market purchases. Because all dividends and distributions will be automatically reinvested in additional shares of Common Stock, this allows you to add to your investment through dollar cost averaging, which may lower the average cost of your Common Stock over time. Dollar cost averaging is a technique for lowering the average cost per share over time if the Fund’s net asset value declines. While dollar cost averaging has definite advantages, it cannot assure profit or protect against loss in declining markets.
Automatically reinvesting dividends and distributions does not mean that you do not have to pay income taxes due upon receiving dividends and distributions. Investors will be subject to income tax on amounts reinvested under the Plan.
The Fund reserves the right to amend or terminate the Plan if, in the judgment of the Board of Directors, the change is warranted. The Plan may be terminated, amended or supplemented by the Fund upon notice in writing mailed to stockholders at least 30 days prior to the record date for the payment of any dividend or distribution by the Fund for which the termination or amendment is to be effective. Upon any termination, you will be sent cash for any fractional share of Common Stock in your account. You may elect to notify the Plan Agent in advance of such termination to have the Plan Agent sell part or all of your Common Stock on your behalf. Additional information about the Plan and your account may be obtained from the Plan Agent at 462 South 4th Street, Suite 1600, Louisville, KY 40202 or by calling the Plan Agent at1-888-888-0151.
| | |
| Western Asset Global Corporate Defined Opportunity Fund Inc. | | 49 |
Western Asset
Global Corporate Defined Opportunity Fund Inc.
Directors
Robert D. Agdern
Carol L. Colman
Daniel P. Cronin
Paolo M. Cucchi
William R. Hutchinson
Eileen A. Kamerick
Nisha Kumar*
Jane Trust
Chairman
Officers
Jane Trust
President and Chief Executive Officer
Richard F. Sennett
Principal Financial Officer
Todd F. Kuehl
Chief Compliance Officer
Jenna Bailey
Identity Theft Prevention Officer
Robert I. Frenkel
Secretary and Chief Legal Officer
Thomas C. Mandia
Assistant Secretary
Jennifer S. Berg
Treasurer
Jeanne M. Kelly
Senior Vice President
| * | Effective January 1, 2019, Ms. Kumar became a Director. |
Western Asset Global Corporate Defined Opportunity Fund Inc.
620 Eighth Avenue
49th Floor
New York, NY 10018
Investment manager
Legg Mason Partners Fund Advisor, LLC
Subadvisers
Western Asset Management Company, LLC
Western Asset Management Company Limited
Western Asset Management Company Ltd
Western Asset Management Company Pte. Ltd.
Custodian
The Bank of New York Mellon
Transfer agent
Computershare Inc.
462 South 4th Street, Suite 1600
Louisville, KY 40202
Independent registered public accounting firm
PricewaterhouseCoopers LLP
Baltimore, MD
Legal counsel
Simpson Thacher & Bartlett LLP
425 Lexington Avenue
New York, NY 10017
New York Stock Exchange Symbol
GDO
Legg Mason Funds Privacy and Security Notice
Your Privacy and the Security of Your Personal Information is Very Important to the Legg Mason Funds
This Privacy and Security Notice (the “Privacy Notice”) addresses the Legg Mason Funds’ privacy and data protection practices with respect to nonpublic personal information the Funds receive. The Legg Mason Funds include any funds sold by the Funds’ distributor, Legg Mason Investor Services, LLC, as well as Legg Mason-sponsoredclosed-end funds. The provisions of this Privacy Notice apply to your information both while you are a shareholder and after you are no longer invested with the Funds.
The Type of Nonpublic Personal Information the Funds Collect About You
The Funds collect and maintain nonpublic personal information about you in connection with your shareholder account. Such information may include, but is not limited to:
| • | | Personal information included on applications or other forms; |
| • | | Account balances, transactions, and mutual fund holdings and positions; |
| • | | Bank account information, legal documents, and identity verification documentation; |
| • | | Online account access user IDs, passwords, security challenge question responses; and |
| • | | Information received from consumer reporting agencies regarding credit history and creditworthiness (such as the amount of an individual’s total debt, payment history, etc.). |
How the Funds Use Nonpublic Personal Information About You
The Funds do not sell or share your nonpublic personal information with third parties or with affiliates for their marketing purposes, or with other financial institutions or affiliates for joint marketing purposes, unless you have authorized the Funds to do so. The Funds do not disclose any nonpublic personal information about you except as may be required to perform transactions or services you have authorized or as permitted or required by law. The Funds may disclose information about you to:
| • | | Employees, agents, and affiliates on a “need to know” basis to enable the Funds to conduct ordinary business or to comply with obligations to government regulators; |
| • | | Service providers, including the Funds’ affiliates, who assist the Funds as part of the ordinary course of business (such as printing, mailing services, or processing or servicing your account with us) or otherwise perform services on the Funds’ behalf, including companies that may perform statistical analysis, market research and marketing services solely for the Funds; |
| • | | Permit access to transfer, whether in the United States or countries outside of the United States to such Funds’ employees, agents and affiliates and service providers as required to enable the Funds to conduct ordinary business, or to comply with obligations to government regulators; |
|
| NOT PART OF THE SEMI-ANNUAL REPORT |
Legg Mason Funds Privacy and Security Notice (cont’d)
| • | | The Funds’ representatives such as legal counsel, accountants and auditors to enable the Funds to conduct ordinary business, or to comply with obligations to government regulators; |
| • | | Fiduciaries or representatives acting on your behalf, such as an IRA custodian or trustee of a grantor trust. |
Except as otherwise permitted by applicable law, companies acting on the Funds’ behalf, including those outside the United States, are contractually obligated to keep nonpublic personal information the Funds provide to them confidential and to use the information the Funds share only to provide the services the Funds ask them to perform.
The Funds may disclose nonpublic personal information about you when necessary to enforce their rights or protect against fraud, or as permitted or required by applicable law, such as in connection with a law enforcement or regulatory request, subpoena, or similar legal process. In the event of a corporate action or in the event a Fund service provider changes, the Funds may be required to disclose your nonpublic personal information to third parties. While it is the Funds’ practice to obtain protections for disclosed information in these types of transactions, the Funds cannot guarantee their privacy policy will remain unchanged.
Keeping You Informed of the Funds’ Privacy and Security Practices
The Funds will notify you annually of their privacy policy as required by federal law. While the Funds reserve the right to modify this policy at any time they will notify you promptly if this privacy policy changes.
The Funds’ Security Practices
The Funds maintain appropriate physical, electronic and procedural safeguards designed to guard your nonpublic personal information. The Funds’ internal data security policies restrict access to your nonpublic personal information to authorized employees, who may use your nonpublic personal information for Fund business purposes only.
Although the Funds strive to protect your nonpublic personal information, they cannot ensure or warrant the security of any information you provide or transmit to them, and you do so at your own risk. In the event of a breach of the confidentiality or security of your nonpublic personal information, the Funds will attempt to notify you as necessary so you can take appropriate protective steps. If you have consented to the Funds using electronic communications or electronic delivery of statements, they may notify you under such circumstances using the most current email address you have on record with them.
In order for the Funds to provide effective service to you, keeping your account information accurate is very important. If you believe that your account information is incomplete, not accurate or not current, if you have questions about the Funds’ privacy practices, or our use of your nonpublic personal information, write the Funds using the contact information on your account statements, email the Funds by clicking on the Contact Us section of the Funds’ website at www.leggmason.com, or contact the Funds at1-888-777-0102.
Revised April 2018
|
| NOT PART OF THE SEMI-ANNUAL REPORT |
Western Asset Global Corporate Defined Opportunity Fund Inc.
Western Asset Global Corporate Defined Opportunity Fund Inc.
620 Eighth Avenue
49th Floor
New York, NY 10018
Notice is hereby given in accordance with Section 23(c) of the Investment Company Act of 1940, as amended, that from time to time the Fund may purchase, at market prices, shares of its stock.
The Fund files its complete schedule of portfolio holdings with the Securities and Exchange Commission (“SEC”) for the first and third quarters of each fiscal year as an exhibit to its reports on FormN-PORT. Previously, the Fund filed a complete schedule of portfolio holdings with the SEC for the first and third quarters of each fiscal year on FormN-Q. The Fund’s FormsN-PORT andN-Q are available on the SEC’s website at www.sec.gov. To obtain information on FormsN-PORT andN-Q, shareholders can call the Fund at1-888-777-0102.
Information on how the Fund voted proxies relating to portfolio securities during the prior12-month period ended June 30th of each year and a description of the policies and procedures that the Fund uses to determine how to vote proxies related to portfolio transactions are available (1) without charge, upon request, by calling1-888-777-0102, (2) at www.lmcef.com and (3) on the SEC’s website at www.sec.gov.
This report is transmitted to the shareholders of Western Asset Global Corporate Defined Opportunity Fund Inc. for their information. This is not a prospectus, circular or representation intended for use in the purchase of shares of the Fund or any securities mentioned in this report.
Computershare Inc.
462 South 4th Street, Suite 1600
Louisville, KY 40202
WASX012645 6/19 SR19-3640
Not applicable.
| ITEM 3. | AUDIT COMMITTEE FINANCIAL EXPERT. |
Not applicable.
| ITEM 4. | PRINCIPAL ACCOUNTANT FEES AND SERVICES. |
Not applicable.
| ITEM 5. | AUDIT COMMITTEE OF LISTED REGISTRANTS. |
Not applicable.
| ITEM 6. | SCHEDULE OF INVESTMENTS. |
Included herein under Item 1.
| ITEM 7. | DISCLOSURE OF PROXY VOTING POLICIES AND PROCEDURES FORCLOSED-END MANAGEMENT INVESTMENT COMPANIES. |
Not applicable.
| ITEM 8. | INVESTMENT PROFESSIONALS OFCLOSED-END MANAGEMENT INVESTMENT COMPANIES. |
Not applicable.
| ITEM 9. | PURCHASES OF EQUITY SECURITIES BYCLOSED-END MANAGEMENT INVESTMENT COMPANY AND AFFILIATED PURCHASERS. |
Not applicable.
| ITEM 10. | SUBMISSION OF MATTERS TO A VOTE OF SECURITY HOLDERS. |
Not applicable.
| ITEM 11. | CONTROLS AND PROCEDURES. |
| | (a) | The registrant’s principal executive officer and principal financial officer have concluded that the registrant’s disclosure controls and procedures (as defined in Rule30a- 3(c) under the Investment Company Act of 1940, as amended (the “1940 Act”)) are effective as of a date within 90 days of the filing date of this report that includes the disclosure required by this paragraph, based on their evaluation of the disclosure controls and procedures required by Rule30a-3(b) under the 1940 Act and15d-15(b) under the Securities Exchange Act of 1934. |
| | (b) | There were no changes in the registrant’s internal control over financial reporting (as defined in Rule30a-3(d) under the 1940 Act) that occurred during the second fiscal quarter of the period covered by this report that have materially affected, or are likely to materially affect the registrant’s internal control over financial reporting. |
| ITEM 12. | DISCLOSURE OF SECURITIES LENDING ACTIVITIES FORCLOSED-END MANAGEMENT INVESTMENT COMPANIES. |
Not applicable.
(a) (1) Not applicable.
Exhibit 99.CODE ETH
(a) (2) Certifications pursuant to section 302 of the Sarbanes-Oxley Act of 2002 attached hereto.
Exhibit 99.CERT
(b) Certifications pursuant to Section 906 of the Sarbanes-Oxley Act of 2002 attached hereto.
Exhibit 99.906CERT
SIGNATURES
Pursuant to the requirements of the Securities Exchange Act of 1934 and the Investment Company Act of 1940, the registrant has duly caused this Report to be signed on its behalf by the undersigned, there unto duly authorized.
Western Asset Global Corporate Defined Opportunity Fund Inc.
| | |
| By: | | /s/ Jane Trust |
| | Jane Trust |
| | Chief Executive Officer |
| |
| Date: | | June 26, 2019 |
Pursuant to the requirements of the Securities Exchange Act of 1934 and the Investment Company Act of 1940, this report has been signed below by the following persons on behalf of the registrant and in the capacities and on the dates indicated.
| | |
| By: | | /s/ Jane Trust |
| | Jane Trust |
| | Chief Executive Officer |
| |
| Date: | | June 26, 2019 |
| |
| By: | | /s/ Richard F. Sennett |
| | Richard F. Sennett |
| | Principal Financial Officer |
| |
| Date: | | June 26, 2019 |