
Exhibit 99.2 Third Quarter 2019 Results Conference Call November 5, 2019

Forward-Looking Statements and Non-GAAP Financial Measures This presentation includes information that may constitute “forward-looking statements,” made pursuant to the safe harbor provisions of the Private Securities Litigation Reform Act of 1995. Forward-looking statements relate to future, not past, events and often address our expected future growth, plans and performance or forecasts. These forward-looking statements are often identified by the use of words such as “anticipate,” “believe,” “designed,” “estimate,” “expect,” “forecast,” “intend,” “may,” “plan,” “predict,” “project,” “target,” “will,” or “would,” and similar expressions or variations, although not all forward-looking statements contain these identifying words. Such forward-looking statements are based on management’s current expectations about future events as of the date hereof and involve many risks and uncertainties that could cause our actual results to differ materially from those expressed or implied in our forward-looking statements. Subsequent events and developments, including actual results or changes in our assumptions, may cause our views to change. We do not undertake to update our forward- looking statements except to the extent required by applicable law. Readers are cautioned not to place undue reliance on such forward-looking statements. All forward-looking statements included herein are expressly qualified in their entirety by these cautionary statements. Our actual results and outcomes could differ materially from those included in these forward-looking statements as a result of various factors, including but not limited to, our ability to integrate the Intermedix business as planned and to realize the expected benefits from the acquisition, our ability to successfully deliver on our commitments to our customers, our ability to deploy new business as planned, our ability to successfully implement new technologies, fluctuations in our results of operations and cash flows, and the factors discussed under the heading “Risk Factors” in our most recent Annual Report on Form 10-K and any other periodic reports that the Company files with the Securities and Exchange Commission. This presentation includes the following non-GAAP financial measures: Adjusted EBITDA and net debt. Please refer to the Appendix located at the end of this presentation for a reconciliation of the non-GAAP financial measures to the most directly comparable GAAP financial measure. 2
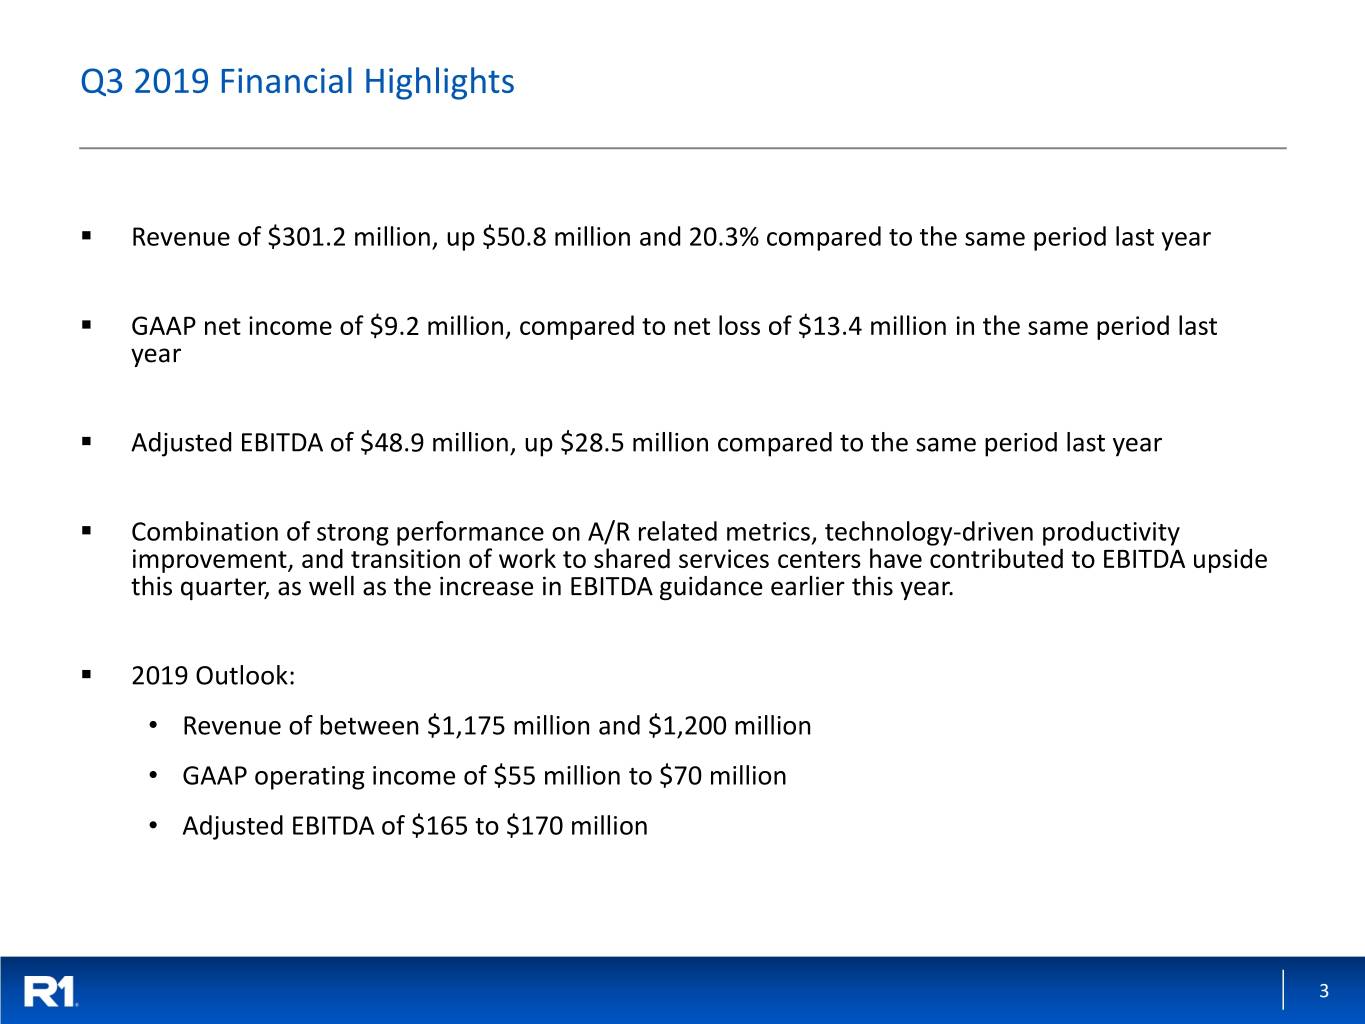
Q3 2019 Financial Highlights ▪ Revenue of $301.2 million, up $50.8 million and 20.3% compared to the same period last year ▪ GAAP net income of $9.2 million, compared to net loss of $13.4 million in the same period last year ▪ Adjusted EBITDA of $48.9 million, up $28.5 million compared to the same period last year ▪ Combination of strong performance on A/R related metrics, technology-driven productivity improvement, and transition of work to shared services centers have contributed to EBITDA upside this quarter, as well as the increase in EBITDA guidance earlier this year. ▪ 2019 Outlook: • Revenue of between $1,175 million and $1,200 million • GAAP operating income of $55 million to $70 million • Adjusted EBITDA of $165 to $170 million 3
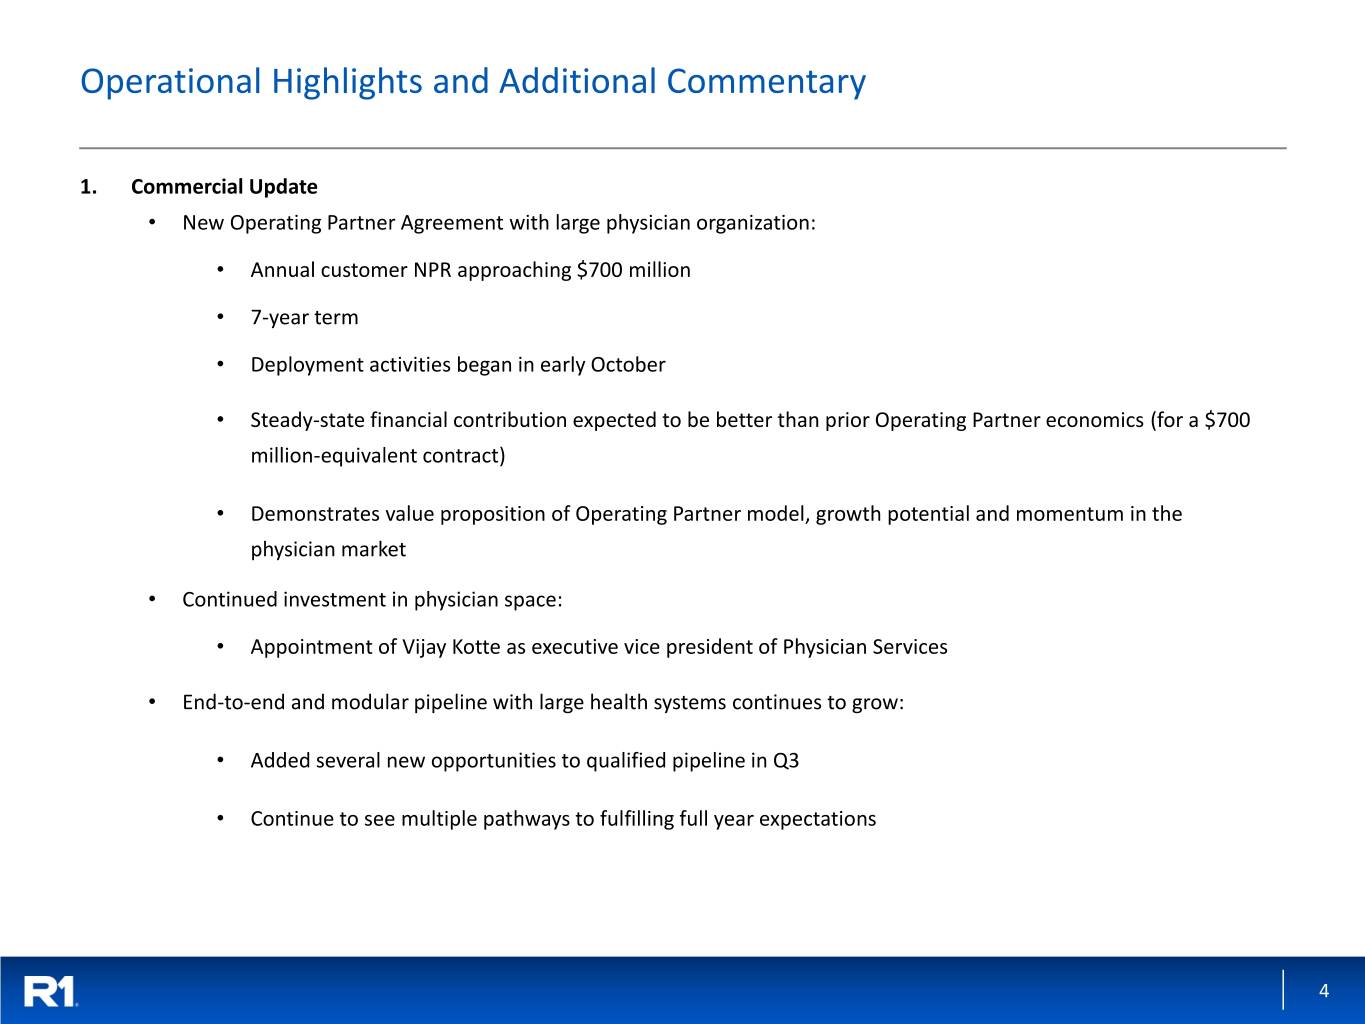
Operational Highlights and Additional Commentary 1. Commercial Update • New Operating Partner Agreement with large physician organization: • Annual customer NPR approaching $700 million • 7-year term • Deployment activities began in early October • Steady-state financial contribution expected to be better than prior Operating Partner economics (for a $700 million-equivalent contract) • Demonstrates value proposition of Operating Partner model, growth potential and momentum in the physician market • Continued investment in physician space: • Appointment of Vijay Kotte as executive vice president of Physician Services • End-to-end and modular pipeline with large health systems continues to grow: • Added several new opportunities to qualified pipeline in Q3 • Continue to see multiple pathways to fulfilling full year expectations 4
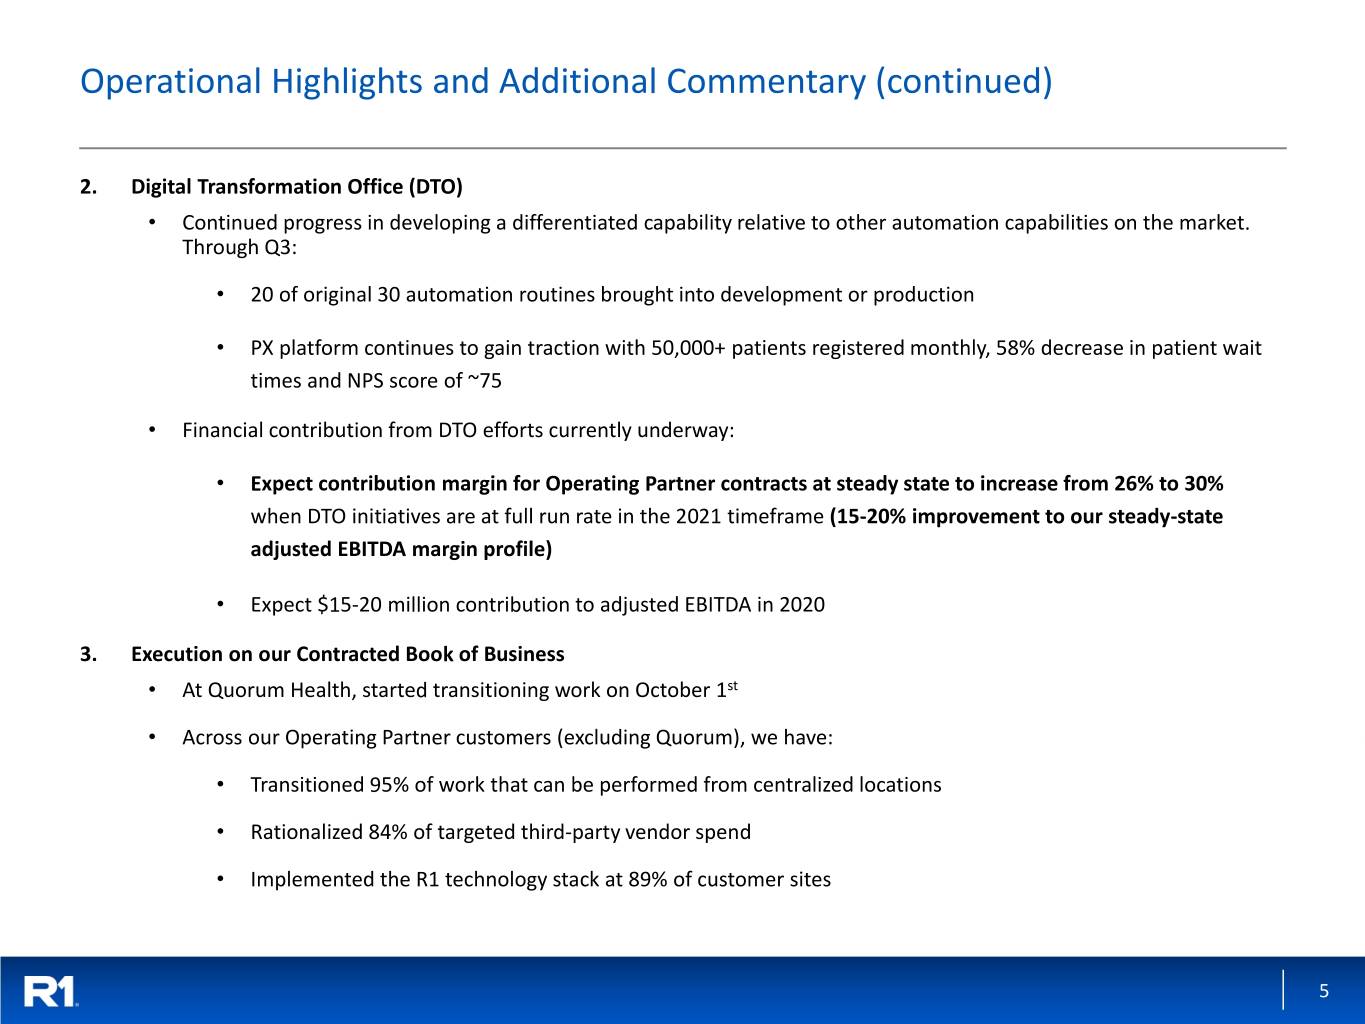
Operational Highlights and Additional Commentary (continued) 2. Digital Transformation Office (DTO) • Continued progress in developing a differentiated capability relative to other automation capabilities on the market. Through Q3: • 20 of original 30 automation routines brought into development or production • PX platform continues to gain traction with 50,000+ patients registered monthly, 58% decrease in patient wait times and NPS score of ~75 • Financial contribution from DTO efforts currently underway: • Expect contribution margin for Operating Partner contracts at steady state to increase from 26% to 30% when DTO initiatives are at full run rate in the 2021 timeframe (15-20% improvement to our steady-state adjusted EBITDA margin profile) • Expect $15-20 million contribution to adjusted EBITDA in 2020 3. Execution on our Contracted Book of Business • At Quorum Health, started transitioning work on October 1st • Across our Operating Partner customers (excluding Quorum), we have: • Transitioned 95% of work that can be performed from centralized locations • Rationalized 84% of targeted third-party vendor spend • Implemented the R1 technology stack at 89% of customer sites 5
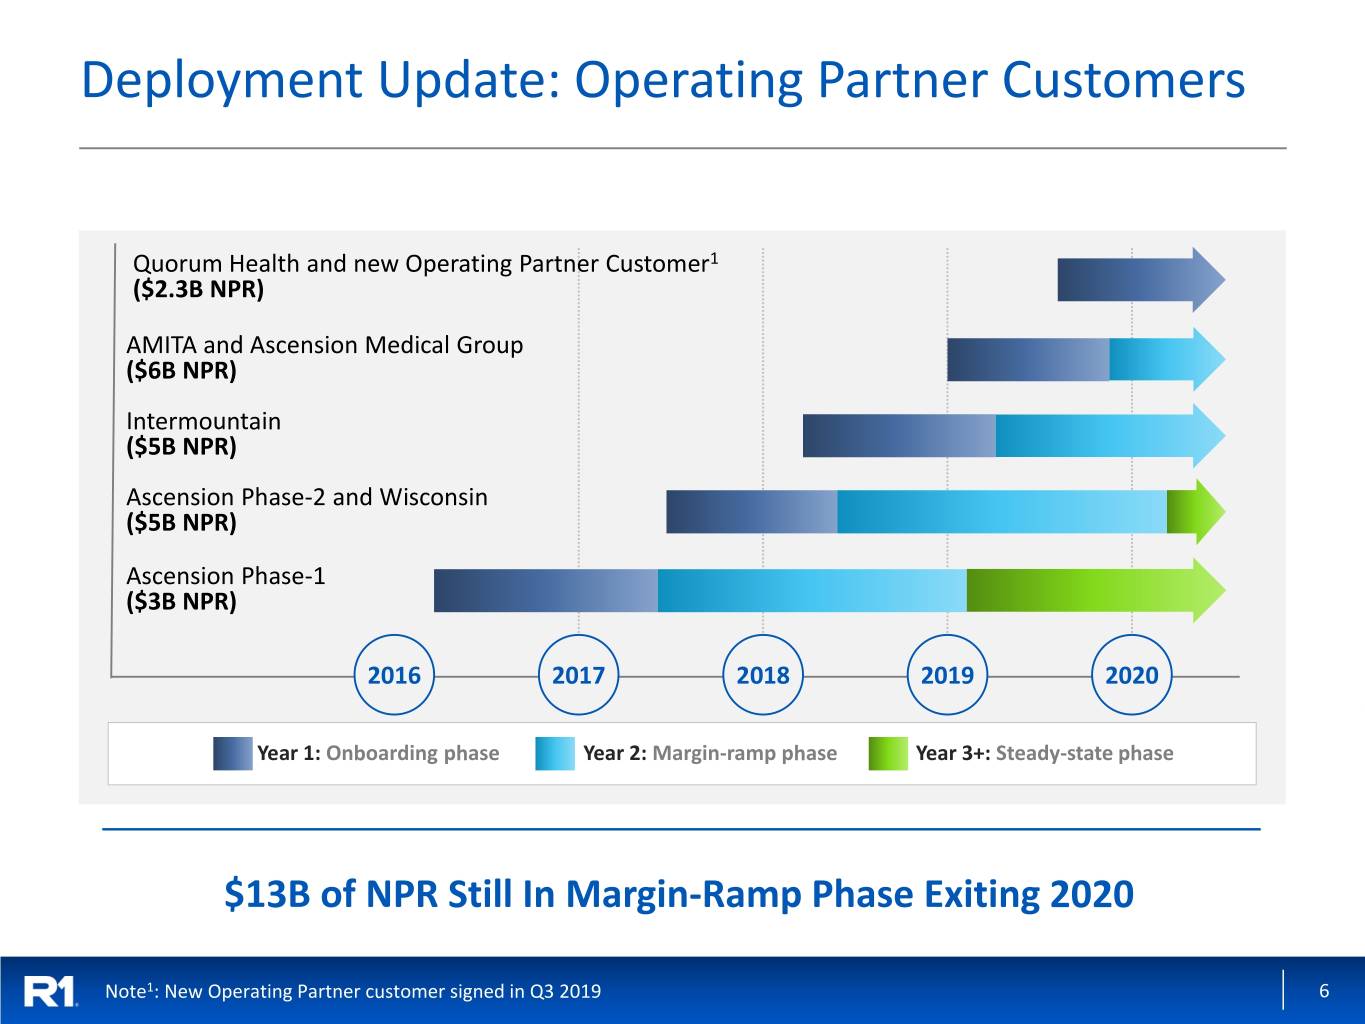
Deployment Update: Operating Partner Customers Quorum Health and new Operating Partner Customer1 ($2.3B NPR) AMITA and Ascension Medical Group ($6B NPR) Intermountain ($5B NPR) Ascension Phase-2 and Wisconsin ($5B NPR) Ascension Phase-1 ($3B NPR) 2016 2017 2018 2019 2020 Year 1: Onboarding phase Year 2: Margin-ramp phase Year 3+: Steady-state phase $13B of NPR Still In Margin-Ramp Phase Exiting 2020 Note1: New Operating Partner customer signed in Q3 2019 6

3Q’19 non-GAAP Results – Q/Q and Y/Y Comparison ($ in millions) 3Q’19 2Q’19 3Q’18 Key change driver(s) • Q/Q: Organic growth across customer base Revenue $301.2 $295.0 $250.4 • Y/Y: New customers and organic growth at customers • Q/Q: Productivity improvement in service delivery Adjusted Cost of Services $227.7 $232.5 $206.5 • Y/Y: New customer onboarding costs, partially offset by productivity improvement • Q/Q: Investments in corporate IT and HR infrastructure Adjusted SG&A expense $24.6 $21.9 $23.4 • Y/Y: Growth in Sales & Marketing, corporate IT and HR infrastructure • Q/Q and Y/Y: Continued progression of operating partner customers Adjusted EBITDA $48.9 $40.6 $20.4 along the profitability curve, offset partly by onboarding costs for new customers 7
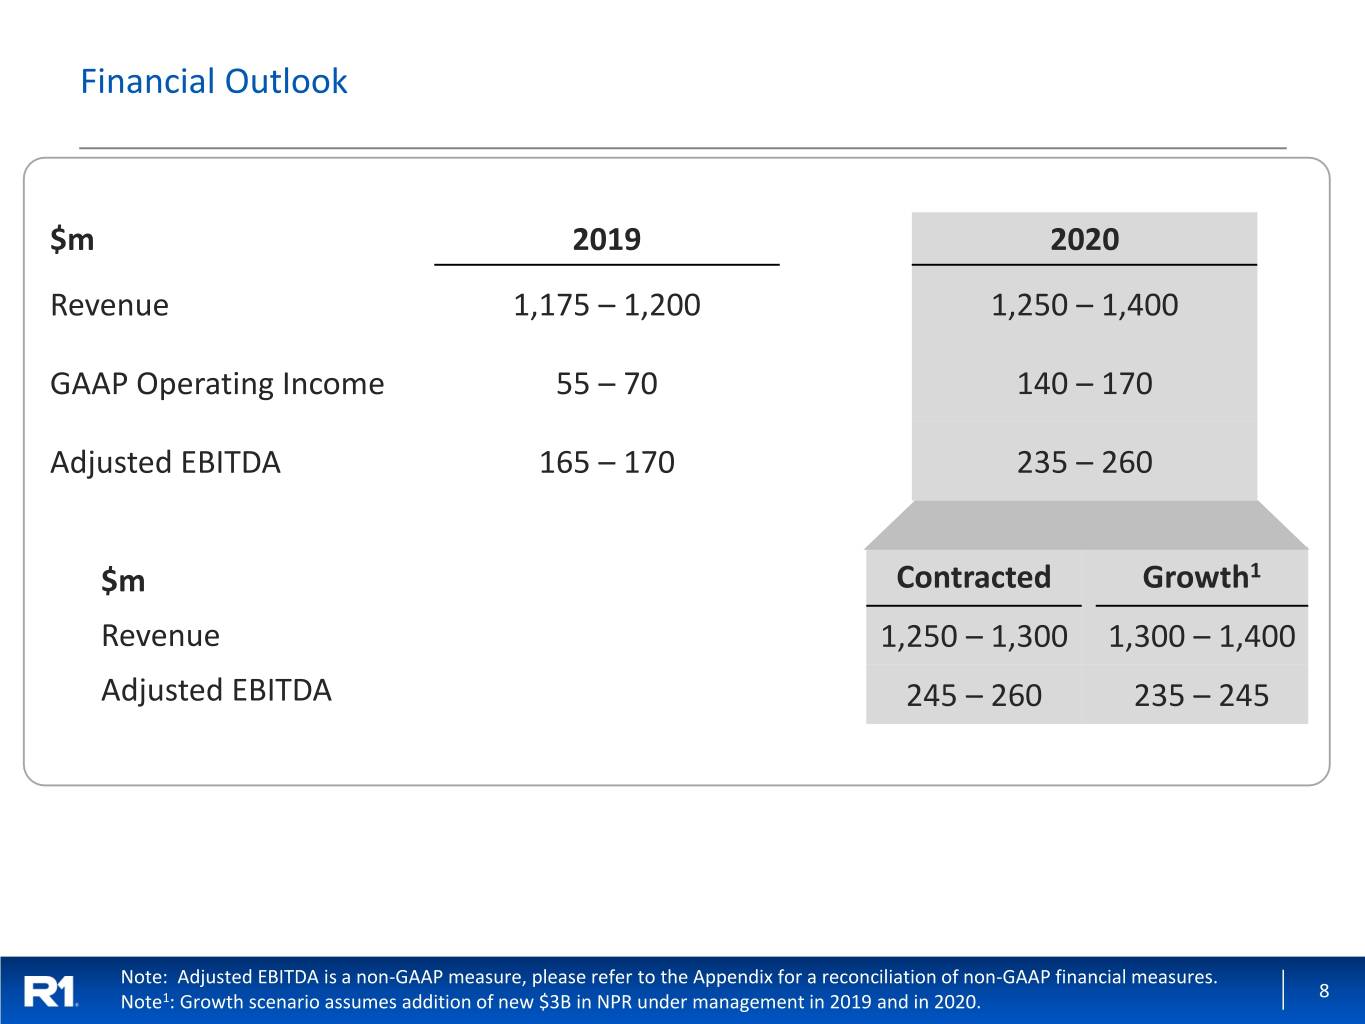
Financial Outlook $m 2019 2020 Revenue 1,175 – 1,200 1,250 – 1,400 GAAP Operating Income 55 – 70 140 – 170 Adjusted EBITDA 165 – 170 235 – 260 $m Contracted Growth1 Revenue 1,250 – 1,300 1,300 – 1,400 Adjusted EBITDA 245 – 260 235 – 245 Note: Adjusted EBITDA is a non-GAAP measure, please refer to the Appendix for a reconciliation of non-GAAP financial measures. 8 Note1: Growth scenario assumes addition of new $3B in NPR under management in 2019 and in 2020.

Appendix 9
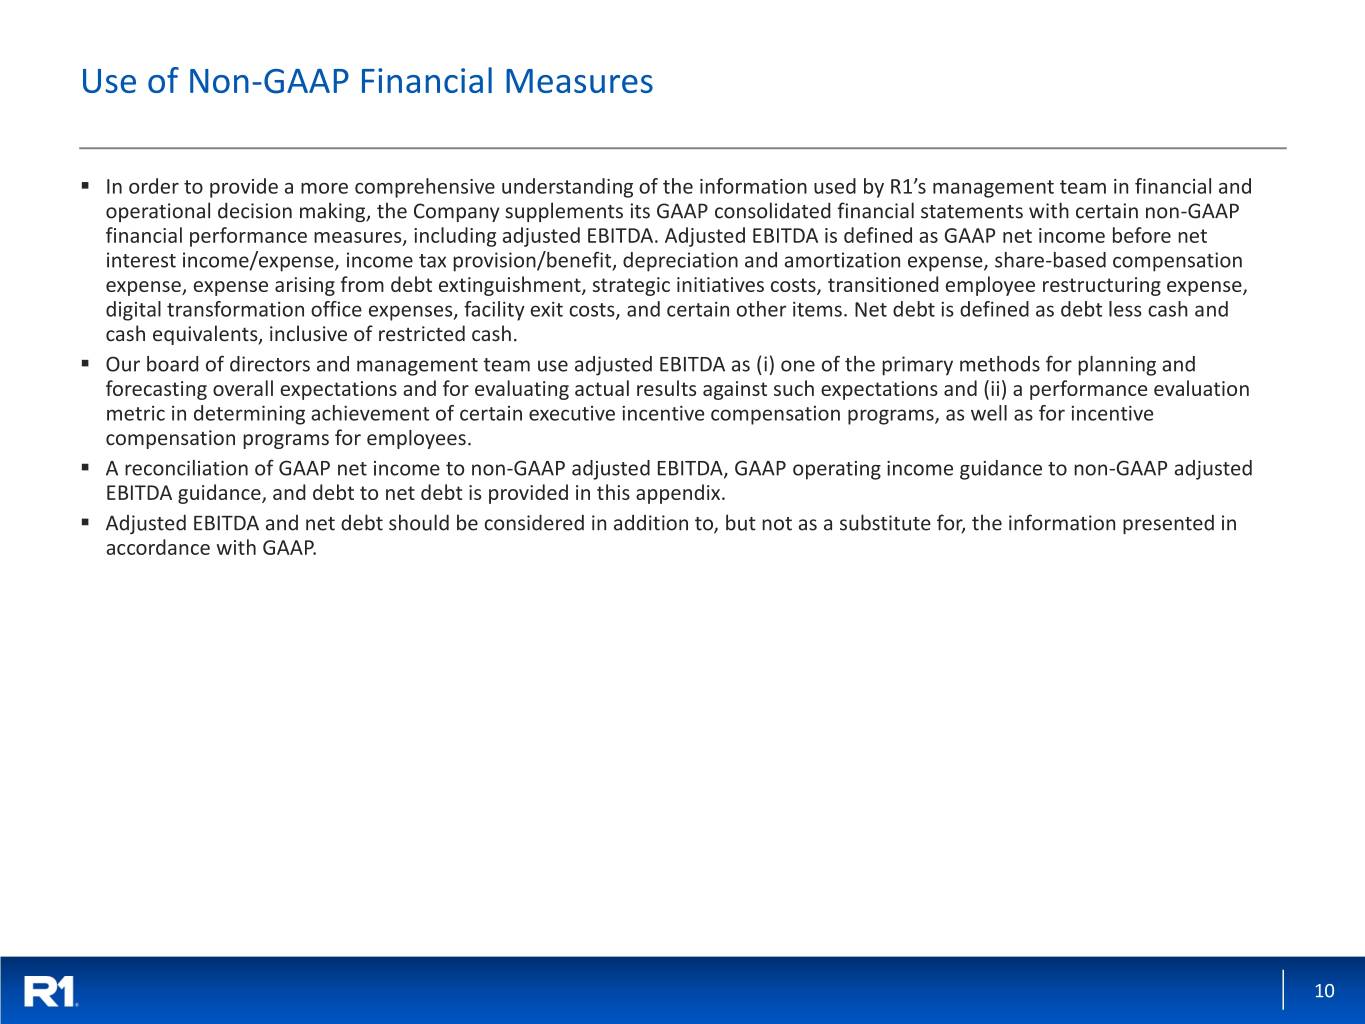
Use of Non-GAAP Financial Measures ▪ In order to provide a more comprehensive understanding of the information used by R1’s management team in financial and operational decision making, the Company supplements its GAAP consolidated financial statements with certain non-GAAP financial performance measures, including adjusted EBITDA. Adjusted EBITDA is defined as GAAP net income before net interest income/expense, income tax provision/benefit, depreciation and amortization expense, share-based compensation expense, expense arising from debt extinguishment, strategic initiatives costs, transitioned employee restructuring expense, digital transformation office expenses, facility exit costs, and certain other items. Net debt is defined as debt less cash and cash equivalents, inclusive of restricted cash. ▪ Our board of directors and management team use adjusted EBITDA as (i) one of the primary methods for planning and forecasting overall expectations and for evaluating actual results against such expectations and (ii) a performance evaluation metric in determining achievement of certain executive incentive compensation programs, as well as for incentive compensation programs for employees. ▪ A reconciliation of GAAP net income to non-GAAP adjusted EBITDA, GAAP operating income guidance to non-GAAP adjusted EBITDA guidance, and debt to net debt is provided in this appendix. ▪ Adjusted EBITDA and net debt should be considered in addition to, but not as a substitute for, the information presented in accordance with GAAP. 10
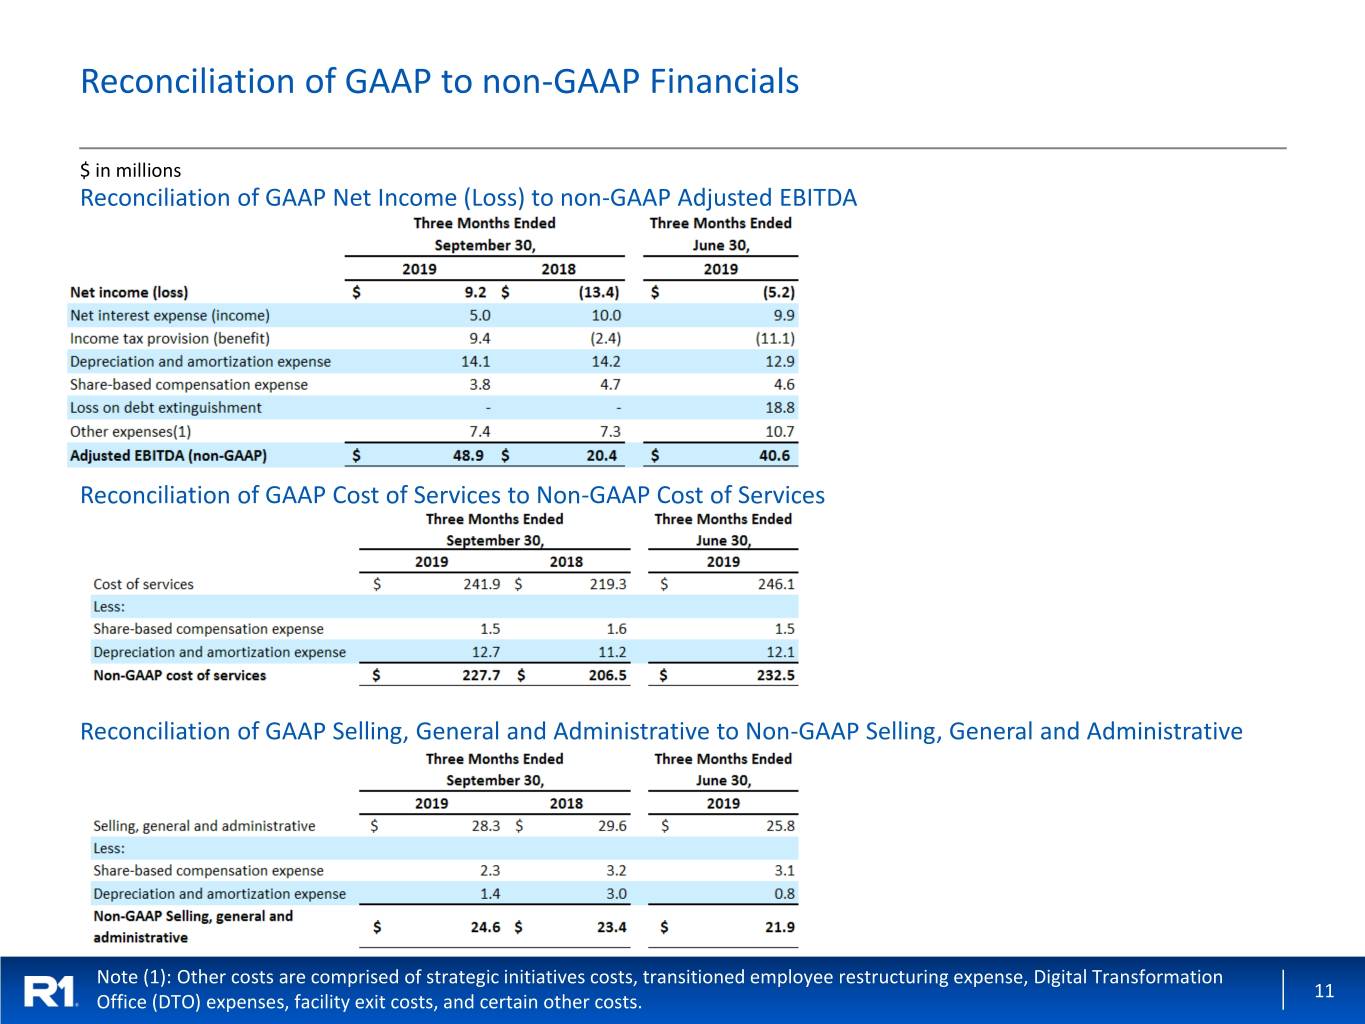
Reconciliation of GAAP to non-GAAP Financials $ in millions Reconciliation of GAAP Net Income (Loss) to non-GAAP Adjusted EBITDA Reconciliation of GAAP Cost of Services to Non-GAAP Cost of Services Reconciliation of GAAP Selling, General and Administrative to Non-GAAP Selling, General and Administrative Note (1): Other costs are comprised of strategic initiatives costs, transitioned employee restructuring expense, Digital Transformation 11 Office (DTO) expenses, facility exit costs, and certain other costs.
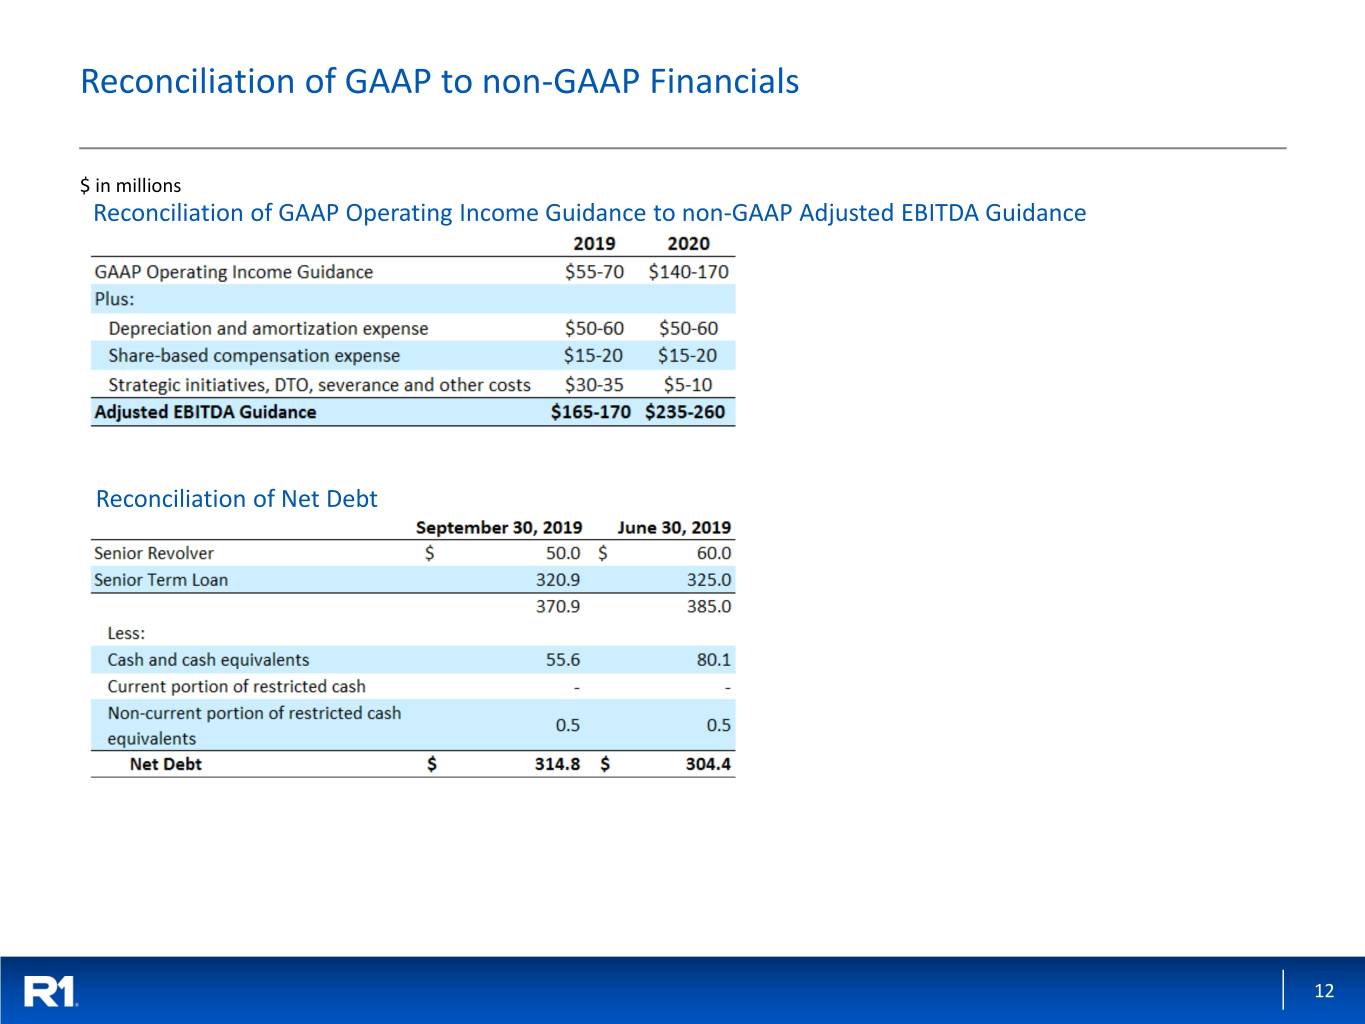
Reconciliation of GAAP to non-GAAP Financials $ in millions Reconciliation of GAAP Operating Income Guidance to non-GAAP Adjusted EBITDA Guidance Reconciliation of Net Debt 12


