
Fourth Quarter and Full Year 2020 Results Conference Call February 18, 2021 Exhibit 99.2
2 Forward-Looking Statements and Non-GAAP Financial Measures This presentation includes information that may constitute “forward-looking statements,” made pursuant to the safe harbor provisions of the Private Securities Litigation Reform Act of 1995. Forward-looking statements relate to future, not past, events and often address our expected future growth, plans and performance or forecasts. These forward-looking statements are often identified by the use of words such as “anticipate,” “believe,” “designed,” “estimate,” “expect,” “forecast,” “intend,” “may,” “plan,” “predict,” “project,” “target,” “will,” or “would,” and similar expressions or variations, although not all forward-looking statements contain these identifying words. These forward-looking statements include, among other things, statements about the potential impacts of the COVID-19 pandemic, our strategic initiatives, our capital plans, our costs, our ability to successfully deliver on our commitments to our customers, our ability to deploy new business as planned, our ability to successfully implement new technologies, our future financial performance and our liquidity. Such forward-looking statements are based on management’s current expectations about future events as of the date hereof and involve many risks and uncertainties that could cause our actual results to differ materially from those expressed or implied in our forward-looking statements. Subsequent events and developments, including actual results or changes in our assumptions, may cause our views to change. We do not undertake to update our forward-looking statements except to the extent required by applicable law. Readers are cautioned not to place undue reliance on such forward-looking statements. All forward-looking statements included herein are expressly qualified in their entirety by these cautionary statements. Our actual results and outcomes could differ materially from those included in these forward-looking statements as a result of various factors, including, but not limited to, the severity, magnitude and duration of the COVID-19 pandemic; responses to the pandemic by the government and healthcare providers and the direct and indirect impacts of the pandemic on our customers and personnel; the disruption of national, state and local economies as a result of the pandemic; the impact of the pandemic on our financial results, including possible lost revenue and increased expenses; and the factors discussed under the heading “Risk Factors” in our annual report on Form 10-K for the year ended December 31, 2019, our quarterly reports on Form 10-Q and any other periodic reports that the Company files with the Securities and Exchange Commission. This presentation includes the following non-GAAP financial measures: adjusted EBITDA, non-GAAP cost of services, non-GAAP SG&A expense and net debt. Please refer to the Appendix located at the end of this presentation for a reconciliation of the non-GAAP financial measures to the most directly comparable GAAP financial measures.
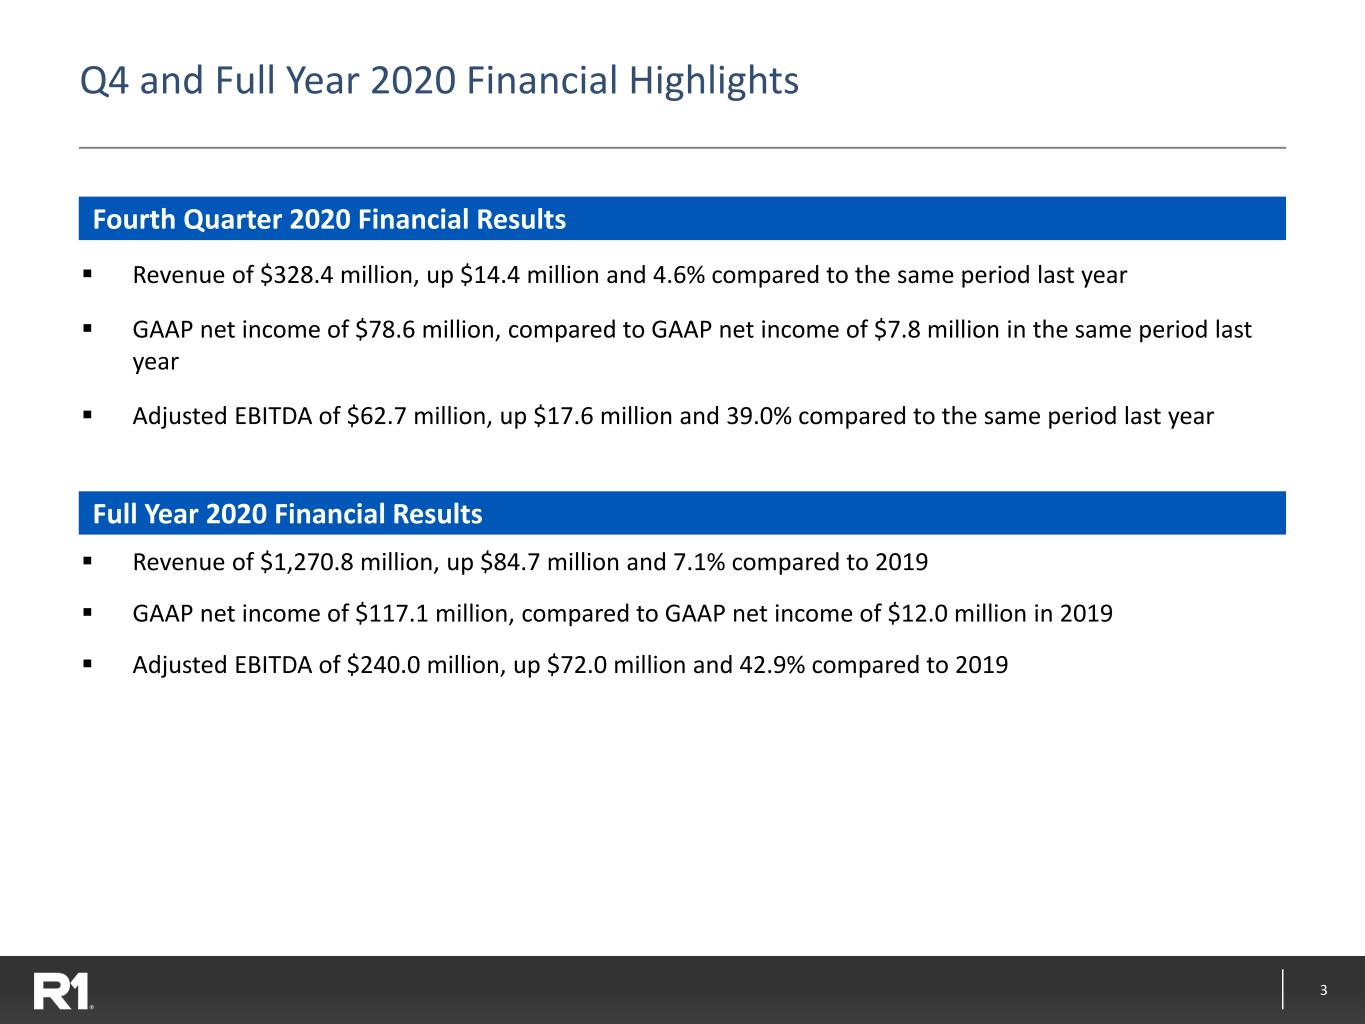
3 Q4 and Full Year 2020 Financial Highlights ▪ Revenue of $328.4 million, up $14.4 million and 4.6% compared to the same period last year ▪ GAAP net income of $78.6 million, compared to GAAP net income of $7.8 million in the same period last year ▪ Adjusted EBITDA of $62.7 million, up $17.6 million and 39.0% compared to the same period last year ▪ Revenue of $1,270.8 million, up $84.7 million and 7.1% compared to 2019 ▪ GAAP net income of $117.1 million, compared to GAAP net income of $12.0 million in 2019 ▪ Adjusted EBITDA of $240.0 million, up $72.0 million and 42.9% compared to 2019 Fourth Quarter 2020 Financial Results Full Year 2020 Financial Results
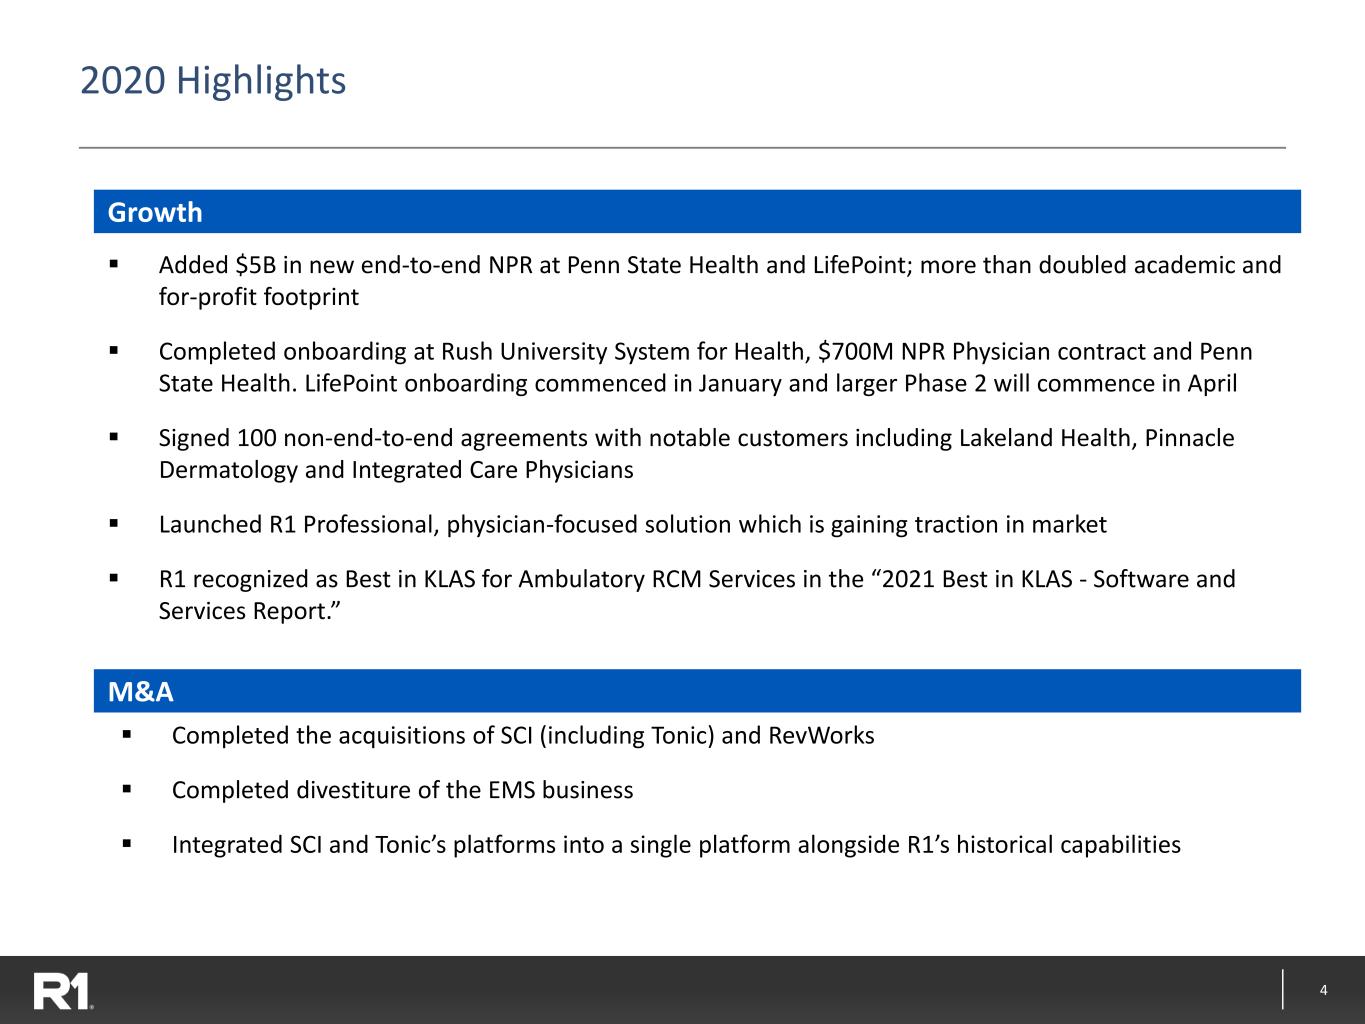
4 2020 Highlights Growth ▪ Added $5B in new end-to-end NPR at Penn State Health and LifePoint; more than doubled academic and for-profit footprint ▪ Completed onboarding at Rush University System for Health, $700M NPR Physician contract and Penn State Health. LifePoint onboarding commenced in January and larger Phase 2 will commence in April ▪ Signed 100 non-end-to-end agreements with notable customers including Lakeland Health, Pinnacle Dermatology and Integrated Care Physicians ▪ Launched R1 Professional, physician-focused solution which is gaining traction in market ▪ R1 recognized as Best in KLAS for Ambulatory RCM Services in the “2021 Best in KLAS - Software and Services Report.” M&A ▪ Completed the acquisitions of SCI (including Tonic) and RevWorks ▪ Completed divestiture of the EMS business ▪ Integrated SCI and Tonic’s platforms into a single platform alongside R1’s historical capabilities

5 2020 Highlights (continued) ▪ Deployed initial routines across customer base, and delivered cost savings at high end of $15-20M target ▪ Developed new routines beyond the original set; on track to automate 30 million tasks annually Automation Corporate Cost Savings Initiative ▪ Accelerated a corporate cost savings initiative originally planned for late 2020-early 2021 into mid-2020 ▪ Streamlined corporate functions and rationalized real estate footprint. Closed 12 office locations representing 250,000 square feet, or 25% of US portfolio. Plan to potentially rationalize another 200,000 square feet over the next several quarters ▪ Most employees continue to work from home during the pandemic; Post-Covid intend to refresh real estate footprint with employee resource centers designed to foster innovation and collaboration Capital Structure ▪ Made significant progress in the simplification of our capital structure (completed the conversion of preferred shares into common shares in January 2021) ▪ We believe this simplification and alignment of our capital structure is highly beneficial for R1 and our shareholders as it affords us enhanced flexibility to pursue growth through many available avenues
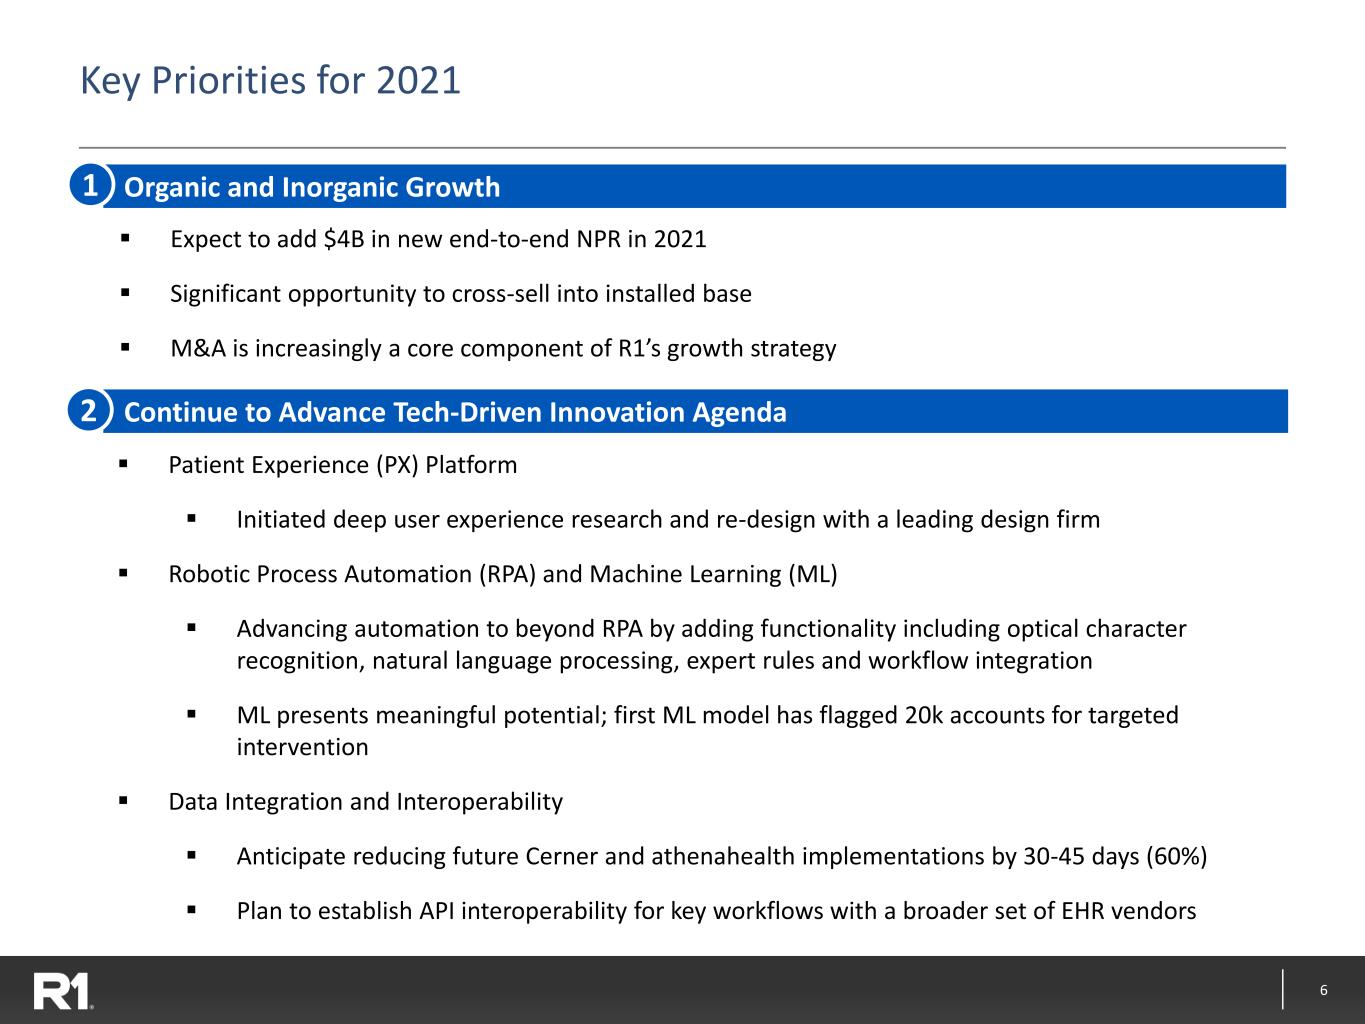
6 Key Priorities for 2021 ▪ Expect to add $4B in new end-to-end NPR in 2021 ▪ Significant opportunity to cross-sell into installed base ▪ M&A is increasingly a core component of R1’s growth strategy Organic and Inorganic Growth Continue to Advance Tech-Driven Innovation Agenda ▪ Patient Experience (PX) Platform ▪ Initiated deep user experience research and re-design with a leading design firm ▪ Robotic Process Automation (RPA) and Machine Learning (ML) ▪ Advancing automation to beyond RPA by adding functionality including optical character recognition, natural language processing, expert rules and workflow integration ▪ ML presents meaningful potential; first ML model has flagged 20k accounts for targeted intervention ▪ Data Integration and Interoperability ▪ Anticipate reducing future Cerner and athenahealth implementations by 30-45 days (60%) ▪ Plan to establish API interoperability for key workflows with a broader set of EHR vendors 1 2
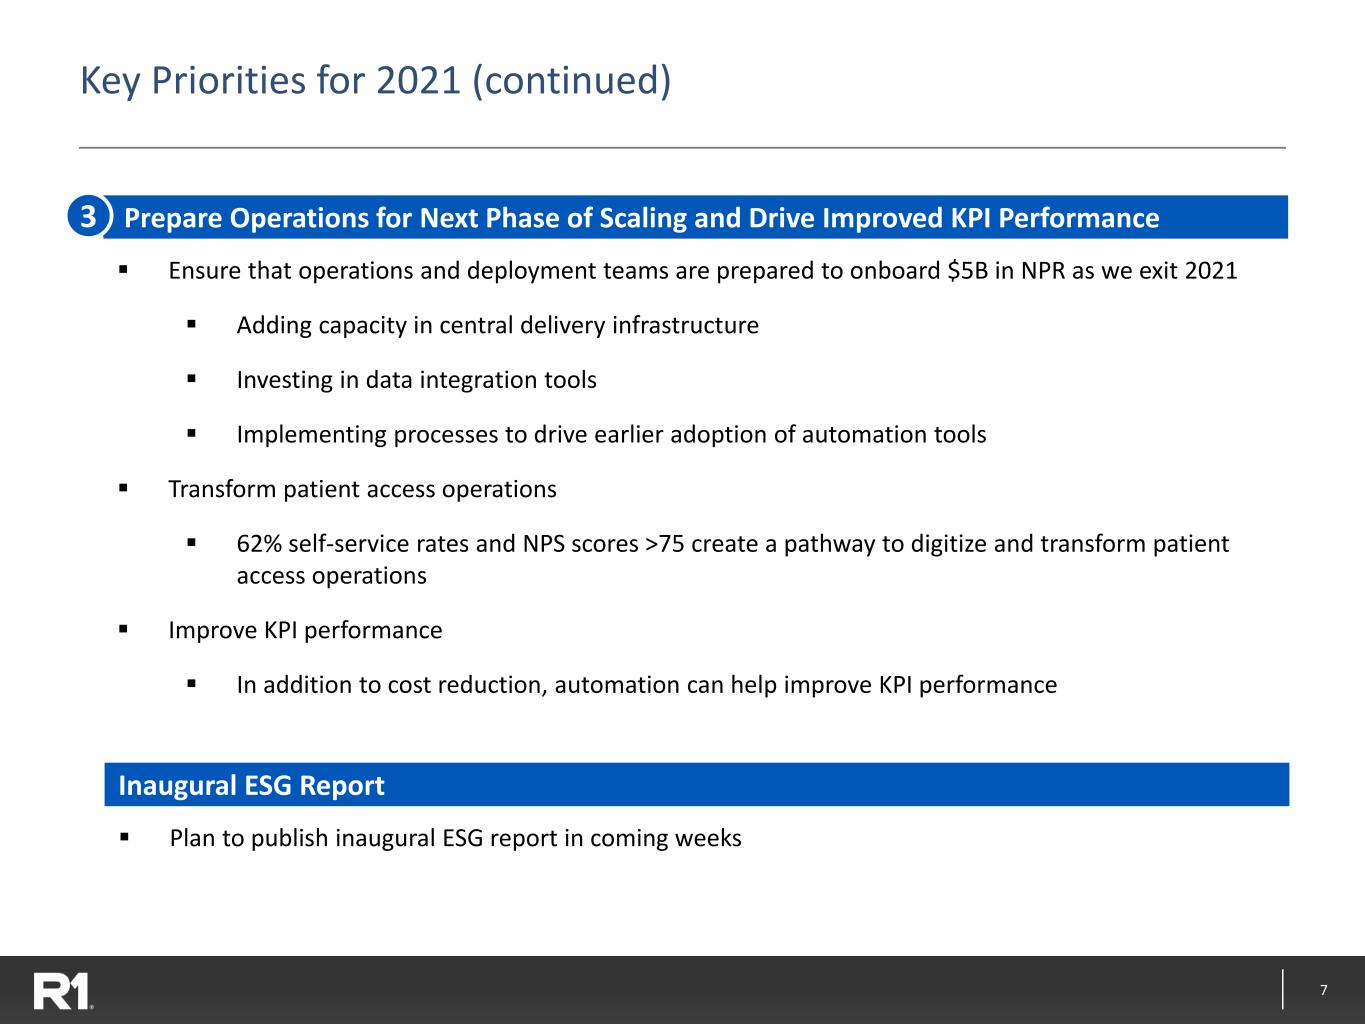
7 Key Priorities for 2021 (continued) Prepare Operations for Next Phase of Scaling and Drive Improved KPI Performance ▪ Ensure that operations and deployment teams are prepared to onboard $5B in NPR as we exit 2021 ▪ Adding capacity in central delivery infrastructure ▪ Investing in data integration tools ▪ Implementing processes to drive earlier adoption of automation tools ▪ Transform patient access operations ▪ 62% self-service rates and NPS scores >75 create a pathway to digitize and transform patient access operations ▪ Improve KPI performance ▪ In addition to cost reduction, automation can help improve KPI performance 3 Inaugural ESG Report ▪ Plan to publish inaugural ESG report in coming weeks
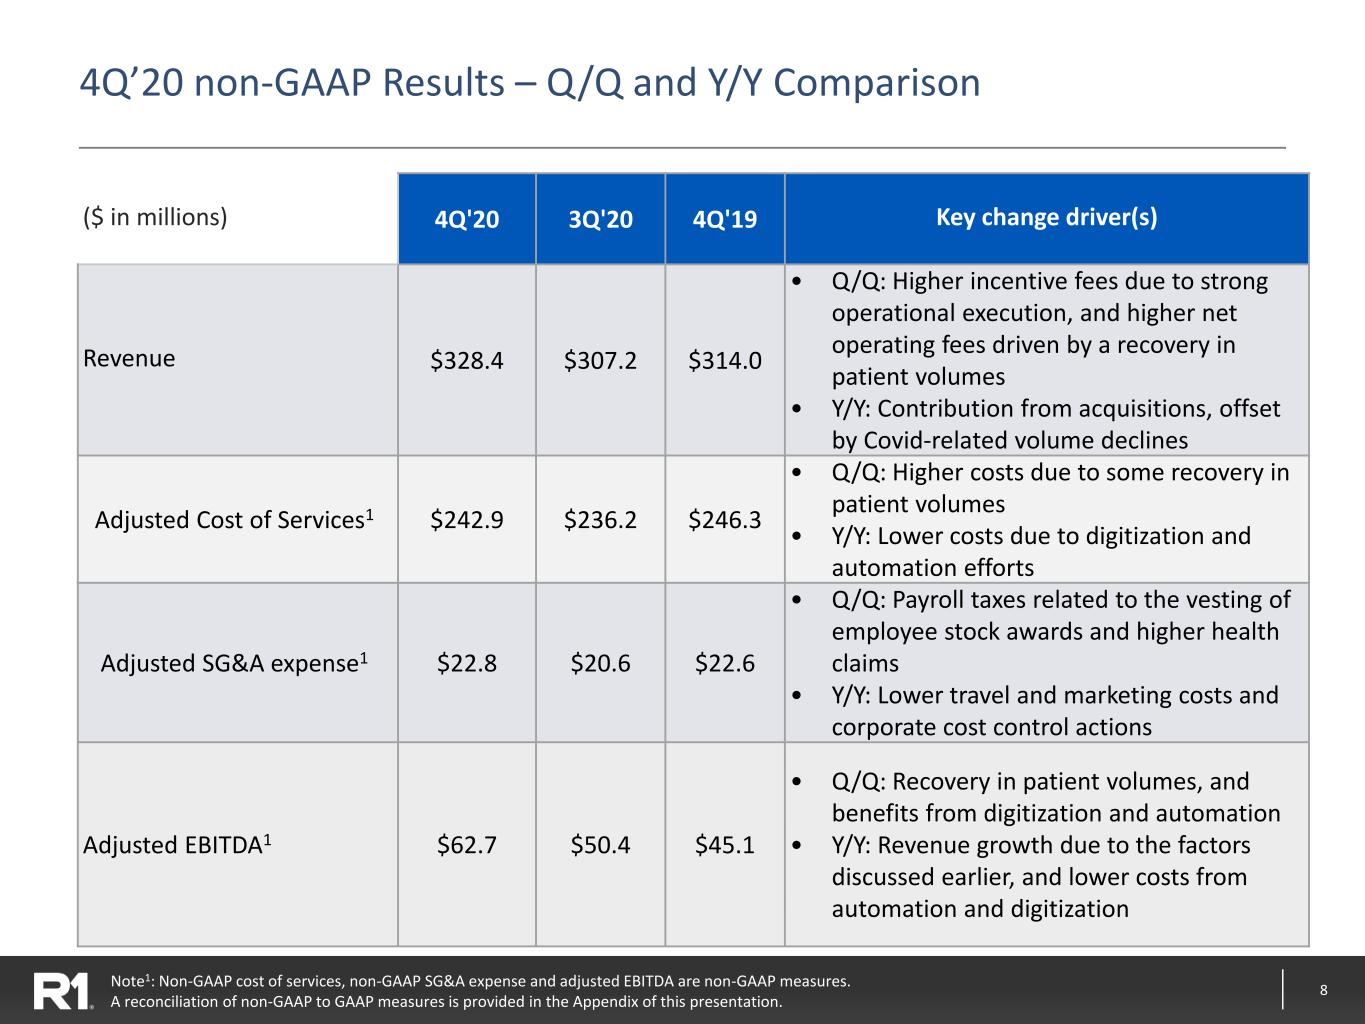
8 4Q’20 non-GAAP Results – Q/Q and Y/Y Comparison Note1: Non-GAAP cost of services, non-GAAP SG&A expense and adjusted EBITDA are non-GAAP measures. A reconciliation of non-GAAP to GAAP measures is provided in the Appendix of this presentation. ($ in millions) 4Q'20 3Q'20 4Q'19 Key change driver(s) Revenue $328.4 $307.2 $314.0 • Q/Q: Higher incentive fees due to strong operational execution, and higher net operating fees driven by a recovery in patient volumes • Y/Y: Contribution from acquisitions, offset by Covid-related volume declines Adjusted Cost of Services1 $242.9 $236.2 $246.3 • Q/Q: Higher costs due to some recovery in patient volumes • Y/Y: Lower costs due to digitization and automation efforts Adjusted SG&A expense1 $22.8 $20.6 $22.6 • Q/Q: Payroll taxes related to the vesting of employee stock awards and higher health claims • Y/Y: Lower travel and marketing costs and corporate cost control actions Adjusted EBITDA1 $62.7 $50.4 $45.1 • Q/Q: Recovery in patient volumes, and benefits from digitization and automation • Y/Y: Revenue growth due to the factors discussed earlier, and lower costs from automation and digitization
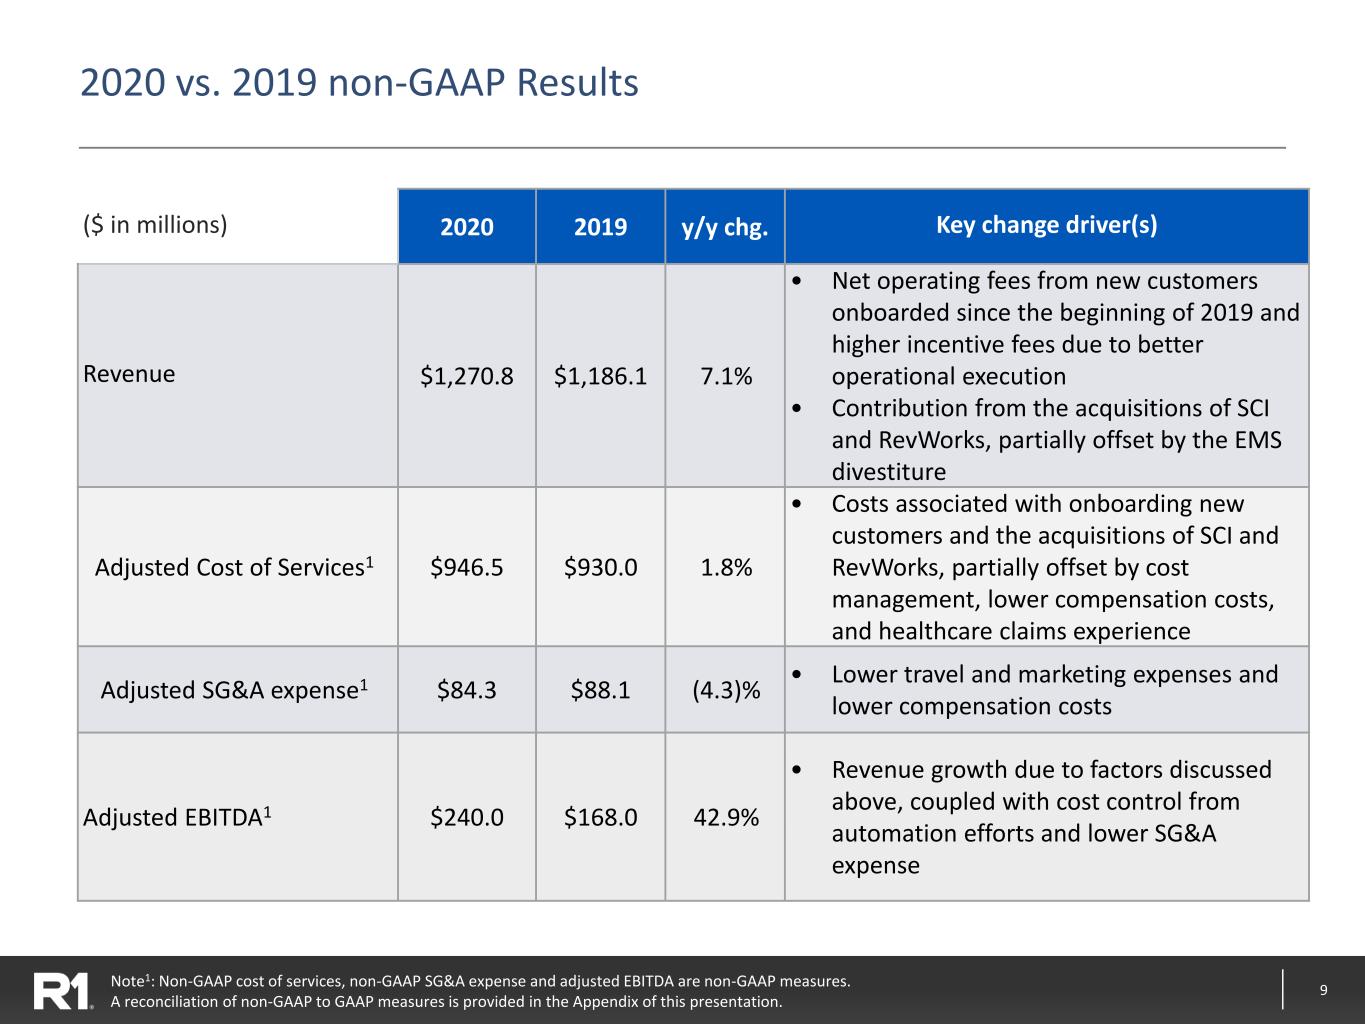
9 2020 vs. 2019 non-GAAP Results Note1: Non-GAAP cost of services, non-GAAP SG&A expense and adjusted EBITDA are non-GAAP measures. A reconciliation of non-GAAP to GAAP measures is provided in the Appendix of this presentation. ($ in millions) 2020 2019 y/y chg. Key change driver(s) Revenue $1,270.8 $1,186.1 7.1% • Net operating fees from new customers onboarded since the beginning of 2019 and higher incentive fees due to better operational execution • Contribution from the acquisitions of SCI and RevWorks, partially offset by the EMS divestiture Adjusted Cost of Services1 $946.5 $930.0 1.8% • Costs associated with onboarding new customers and the acquisitions of SCI and RevWorks, partially offset by cost management, lower compensation costs, and healthcare claims experience Adjusted SG&A expense1 $84.3 $88.1 (4.3)% • Lower travel and marketing expenses and lower compensation costs Adjusted EBITDA1 $240.0 $168.0 42.9% • Revenue growth due to factors discussed above, coupled with cost control from automation efforts and lower SG&A expense
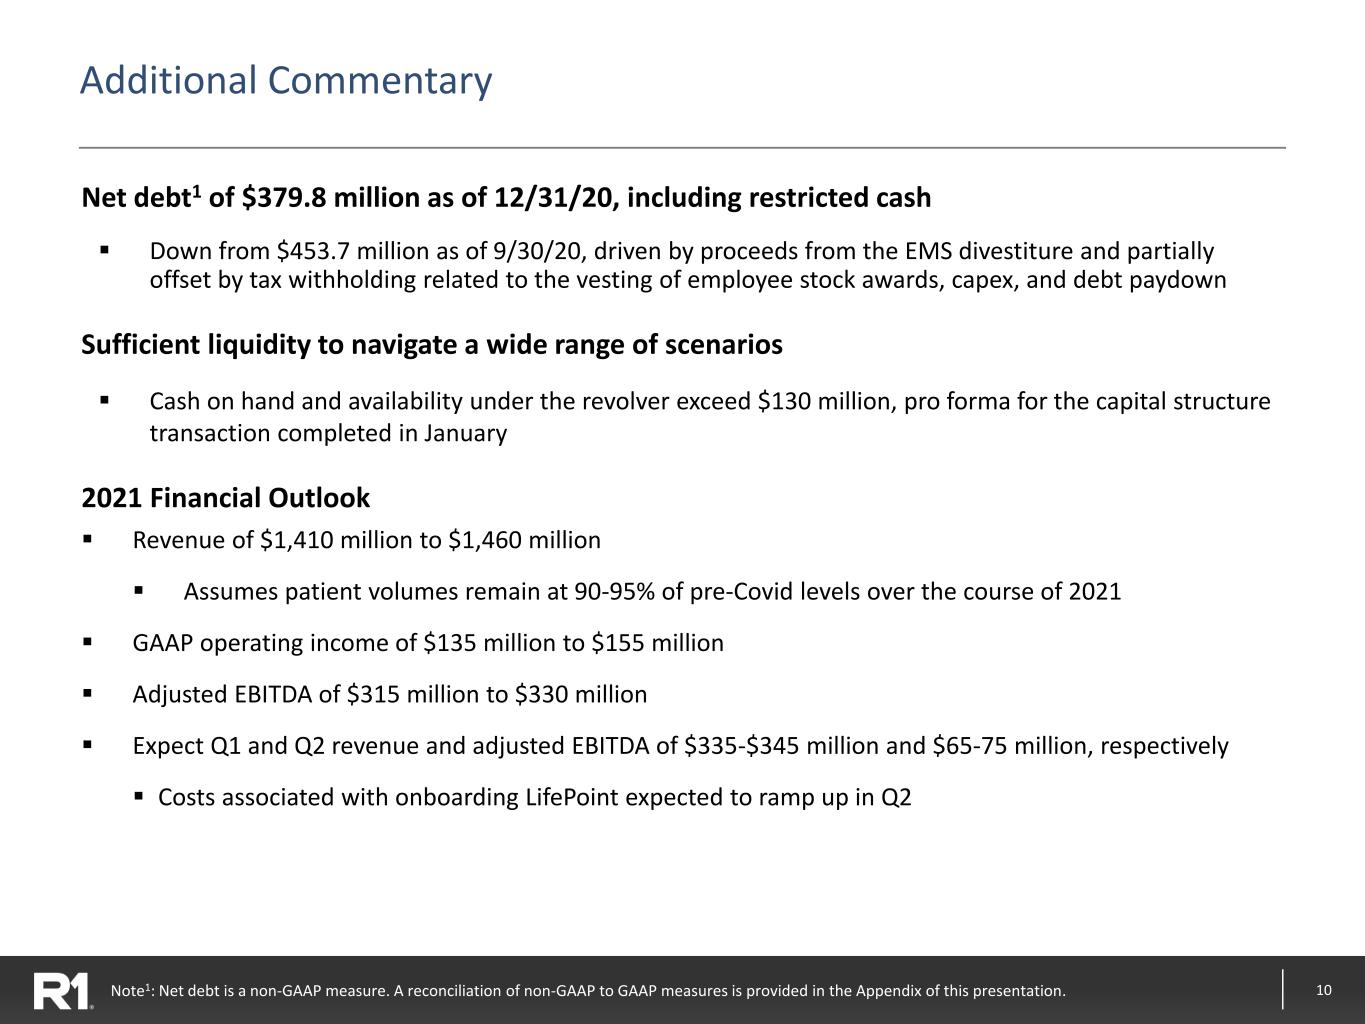
10 Additional Commentary Net debt1 of $379.8 million as of 12/31/20, including restricted cash ▪ Down from $453.7 million as of 9/30/20, driven by proceeds from the EMS divestiture and partially offset by tax withholding related to the vesting of employee stock awards, capex, and debt paydown Sufficient liquidity to navigate a wide range of scenarios ▪ Cash on hand and availability under the revolver exceed $130 million, pro forma for the capital structure transaction completed in January 2021 Financial Outlook ▪ Revenue of $1,410 million to $1,460 million ▪ Assumes patient volumes remain at 90-95% of pre-Covid levels over the course of 2021 ▪ GAAP operating income of $135 million to $155 million ▪ Adjusted EBITDA of $315 million to $330 million ▪ Expect Q1 and Q2 revenue and adjusted EBITDA of $335-$345 million and $65-75 million, respectively ▪ Costs associated with onboarding LifePoint expected to ramp up in Q2 Note1: Net debt is a non-GAAP measure. A reconciliation of non-GAAP to GAAP measures is provided in the Appendix of this presentation.

11 Appendix
12 Use of Non-GAAP Financial Measures ▪ In order to provide a more comprehensive understanding of the information used by R1’s management team in financial and operational decision making, the Company supplements its GAAP consolidated financial statements with certain non-GAAP financial performance measures, including adjusted EBITDA, adjusted cost of services, adjusted SG&A expense and net debt. Adjusted EBITDA is defined as GAAP net income before net interest income/expense, income tax provision/benefit, depreciation and amortization expense, share-based compensation expense, expense arising from debt extinguishment, severance and related employee benefits, strategic initiatives costs, transitioned employee restructuring expense, certain COVID-19 related expenses, and certain other items. Adjusted cost of services is defined as GAAP cost of services before share-based compensation expense and depreciation and amortization expense. Adjusted SG&A expense is defined as GAAP SG&A expense before share-based compensation expense and depreciation and amortization expense. Net debt is defined as total debt less cash and cash equivalents, and restricted cash. ▪ Our board of directors and management team use adjusted EBITDA as (i) one of the primary methods for planning and forecasting overall expectations and for evaluating actual results against such expectations and (ii) a performance evaluation metric in determining achievement of certain executive incentive compensation programs, as well as for incentive compensation programs for employees. ▪ A reconciliation of GAAP net income to non-GAAP adjusted EBITDA, GAAP cost of services to non-GAAP cost of services, GAAP SG&A expense to non- GAAP SG&A expense and total debt to net debt is provided on the following slides. Adjusted EBITDA, adjusted cost of services, adjusted SG&A expense and net debt should be considered in addition to, but not as a substitute for, the information presented in accordance with GAAP.
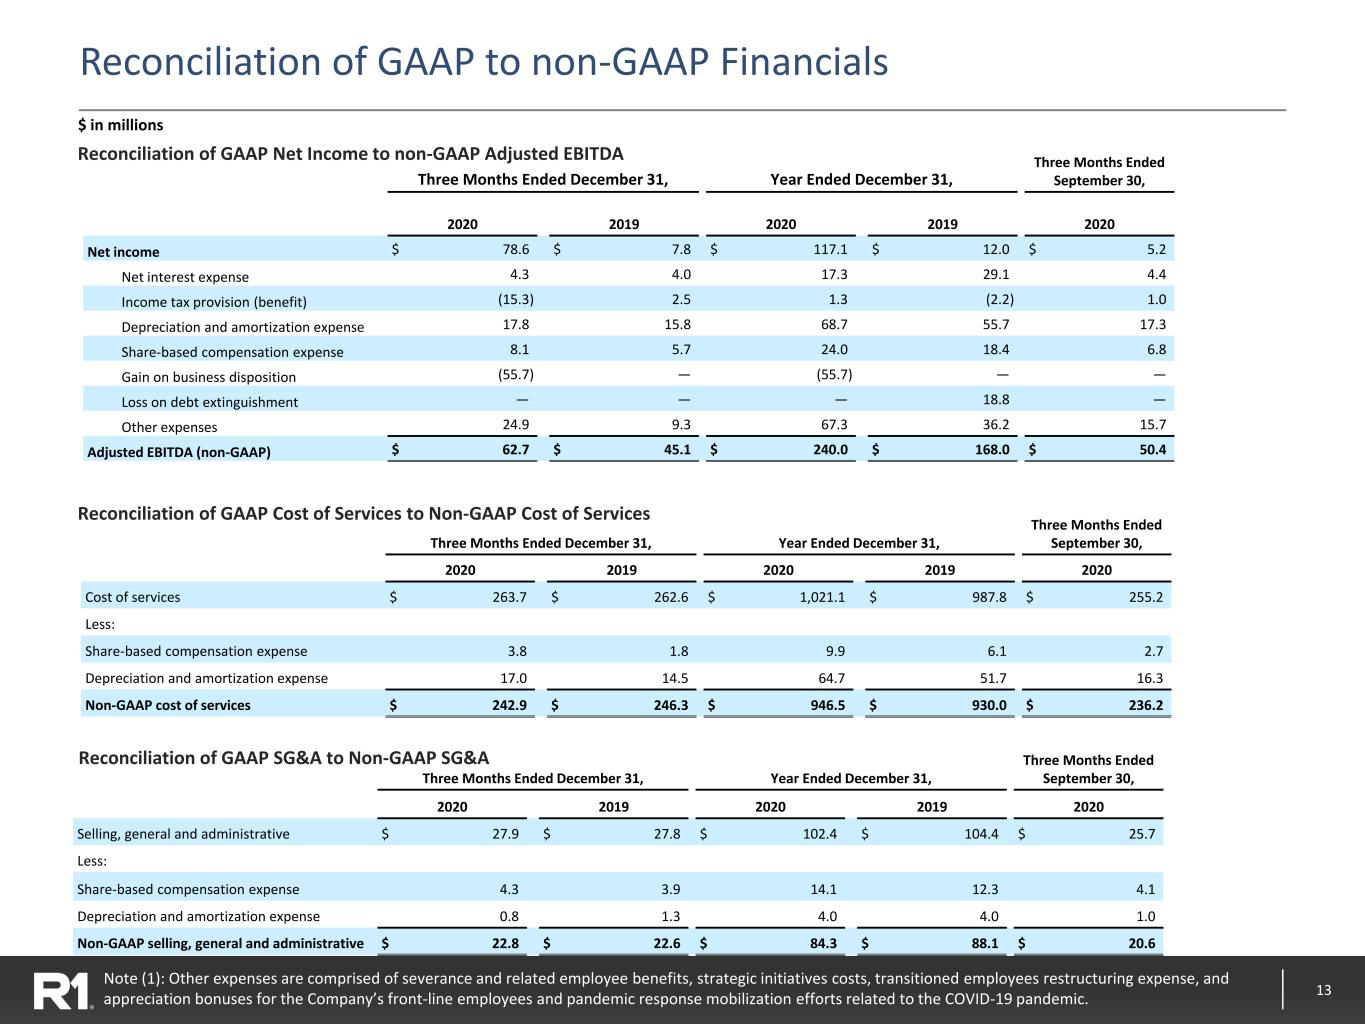
13 Reconciliation of GAAP to non-GAAP Financials Reconciliation of GAAP SG&A to Non-GAAP SG&A Reconciliation of GAAP Cost of Services to Non-GAAP Cost of Services Reconciliation of GAAP Net Income to non-GAAP Adjusted EBITDA $ in millions Note (1): Other expenses are comprised of severance and related employee benefits, strategic initiatives costs, transitioned employees restructuring expense, and appreciation bonuses for the Company’s front-line employees and pandemic response mobilization efforts related to the COVID-19 pandemic. Three Months Ended December 31, Year Ended December 31, Three Months Ended September 30, 2020 2019 2020 2019 2020 Net income $ 78.6 $ 7.8 $ 117.1 $ 12.0 $ 5.2 Net interest expense 4.3 4.0 17.3 29.1 4.4 Income tax provision (benefit) (15.3) 2.5 1.3 (2.2) 1.0 Depreciation and amortization expense 17.8 15.8 68.7 55.7 17.3 Share-based compensation expense 8.1 5.7 24.0 18.4 6.8 Gain on business disposition (55.7) — (55.7) — — Loss on debt extinguishment — — — 18.8 — Other expenses 24.9 9.3 67.3 36.2 15.7 Adjusted EBITDA (non-GAAP) $ 62.7 $ 45.1 $ 240.0 $ 168.0 $ 50.4 Three Months Ended December 31, Year Ended December 31, Three Months Ended September 30, 2020 2019 2020 2019 2020 Cost of services $ 263.7 $ 262.6 $ 1,021.1 $ 987.8 $ 255.2 Less: Share-based compensation expense 3.8 1.8 9.9 6.1 2.7 Depreciation and amortization expense 17.0 14.5 64.7 51.7 16.3 Non-GAAP cost of services $ 242.9 $ 246.3 $ 946.5 $ 930.0 $ 236.2 Three Months Ended December 31, Year Ended December 31, Three Months Ended September 30, 2020 2019 2020 2019 2020 Selling, general and administrative $ 27.9 $ 27.8 $ 102.4 $ 104.4 $ 25.7 Less: Share-based compensation expense 4.3 3.9 14.1 12.3 4.1 Depreciation and amortization expense 0.8 1.3 4.0 4.0 1.0 Non-GAAP selling, general and administrative $ 22.8 $ 22.6 $ 84.3 $ 88.1 $ 20.6
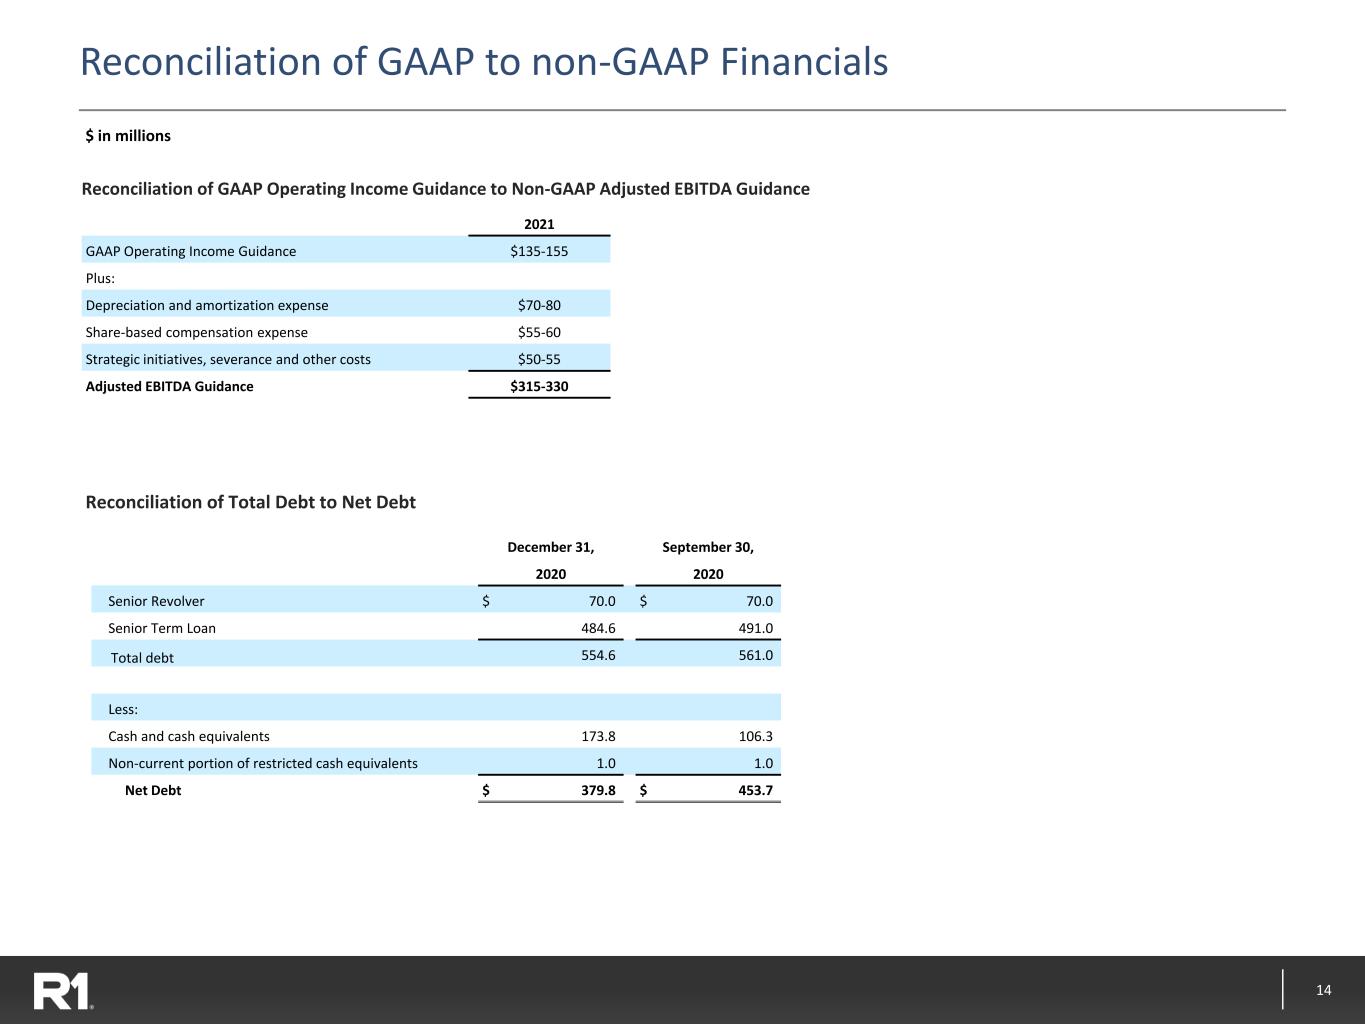
14 Reconciliation of GAAP to non-GAAP Financials $ in millions Reconciliation of Total Debt to Net Debt Reconciliation of GAAP Operating Income Guidance to Non-GAAP Adjusted EBITDA Guidance December 31, September 30, 2020 2020 Senior Revolver $ 70.0 $ 70.0 Senior Term Loan 484.6 491.0 Total debt 554.6 561.0 Less: Cash and cash equivalents 173.8 106.3 Non-current portion of restricted cash equivalents 1.0 1.0 Net Debt $ 379.8 $ 453.7 2021 GAAP Operating Income Guidance $135-155 Plus: Depreciation and amortization expense $70-80 Share-based compensation expense $55-60 Strategic initiatives, severance and other costs $50-55 Adjusted EBITDA Guidance $315-330


