Evermore Global Value Fund
Annual Report • December 31, 2019
Beginning on January 1, 2021, as permitted by regulations adopted by the Securities and Exchange Commission, paper copies of the Evermore Global Value Fund’s shareholder reports like this one will no longer be sent by mail, unless you specifically request paper copies of the reports from the Fund or from your financial intermediary, such as a broker-dealer or bank. Instead, the reports will be made available on the Fund’s website: www.EVERMOREGLOBAL.com, and you will be notified by mail each time a report is posted and provided with a website link to access the report.
If you already elected to receive shareholder reports electronically, you will not be affected by this change and you need not take any action. You may elect to receive shareholder reports and other communications from the Evermore Global Value Fund electronically at any time by contacting your financial intermediary (such as a broker dealer or bank) or, if your account is held directly with Evermore Global Value Fund, by calling the Fund at 866-EVERMORE (866-383-7667).
You may elect to receive all future reports in paper free of charge. If you invest through a financial intermediary, please contact your financial intermediary to continue receiving paper copies of your shareholder reports. If you invest directly with Evermore Global Value Fund, you can inform the Fund that you wish to continue receiving paper copies of your shareholder reports by calling the Evermore Global Value Fund at 866-EVERMORE (866-383-7667). Your election to receive reports in paper will apply to all funds held in your account with your financial intermediary. You must provide separate instructions to each of your financial intermediaries.
Table of Contents
| Shareholder Letter & Management Discussion of Fund Performance (Unaudited) | | | 1 |
| | | | |
| Performance Information (Unaudited) | | | 11 |
| | | | |
| Sector Allocation (Unaudited) | | | 12 |
| | | | |
| Expense Example (Unaudited) | | | 13 |
| | | | |
| Schedule of Investments | | | 14 |
| | | | |
| Statement of Assets and Liabilities | | | 18 |
| | | | |
| Statement of Operations | | | 19 |
| | | | |
| Statements of Changes in Net Assets | | | 20 |
| | | | |
| Financial Highlights | | | 21 |
| | | | |
| Notes to Financial Statements | | | 23 |
| | | | |
| Report of Independent Registered Public Accounting Firm | | | 34 |
| | | | |
| Approval of Investment Advisory Agreement (Unaudited) | | | 35 |
| | | | |
| Trustees and Executive Officers (Unaudited) | | | 36 |
| | | | |
| Additional Information (Unaudited) | | | 38 |
| | | | |
| Privacy Notice (Unaudited) | | | 39 |
Evermore Global Value Fund
Elements of Our Investment Approach
At Evermore Global Advisors, we seek to leverage our deep operating and investing experience, and extensive global relationships to identify and invest in special situations – companies around the world that have compelling valuations and are undergoing strategic changes which we believe will unlock value.
Seeking to Generate Value . . .
| • | Catalyst-Driven Investing. We do more than simply pick undervalued stocks and hope for their prices to rise. We invest in companies where we have determined a series of catalysts exist to unlock value. The catalysts we look for are not broadly recognized, but they are likely to have a significant impact on a stock’s performance over time. Catalysts may include management changes, shareholder activism, and operational and financial restructurings (e.g., cost-cutting, asset sales, breakups, spinoffs, mergers, acquisitions, liquidations, share buybacks, recapitalizations, etc.). |
Supporting Our Active Value Orientation . . .
| • | Original Fact-Based Research. We conduct our own, original fact-based research to validate management’s stated objectives and identify catalysts to unlock value. We also perform detailed business segment analysis on each company we research. |
| • | Business Operating Experience. Our senior team has hands-on business operating experience; including starting and managing businesses, sitting on company boards, and assisting management of multi-national corporations restructure their businesses. We rely on this experience to better evaluate investment opportunities. |
| • | A Global Network of Strategic Relationships. Over the past 25+ years, members of our investment team have developed extensive global networks of strategic relationships, including individuals and families that control businesses, corporate board members, corporate management, regional brokerage firms, press contacts, etc. We leverage these relationships to help generate ideas and better evaluate investment opportunities. |
| • | We Invest Like Owners. When we are interested in an investment opportunity, we get to know the management team of the company, study the company’s business model, evaluate the competitive and regulatory environment, and test and crosscheck everything the management team tells us against our own experience. We ask ourselves if we would want to own the entire company. If the answer is No, we will not invest in the company. |
| • | Not Activists, Often Collaborators. We almost always take the approach of collaborative engagement with management, rather than taking an aggressive activist stance. On limited occasions, when we are not satisfied with the efforts of the incumbent company leadership, we may work with other shareholders to help facilitate change. |
Executing Our Approach . . .
| • | Concentration Maintains Focus. Focused and disciplined investing means knowing our businesses intimately and staying patient as the process of value creation unfolds. We maintain focus by typically investing in 30 to 40 names with a high percentage of investments in our top 10 holdings. |
| • | Investing Across the Capital Structure. We evaluate all components of a company’s capital structure to determine where the best risk-adjusted return potential exists. At times, we may invest in multiple parts of a company’s capital structure (e.g., investing in both a company’s debt and equity). |
| • | Targeting Complex Investment Opportunities. We often research family-controlled holding companies or conglomerates that are often under-researched and/or misunderstood, which can create gaps between price and value. |
| • | Merger Arbitrage and Distressed Companies. We may take advantage of announced merger and acquisition deals where an attractive spread (difference) exists between the market price and the announced deal price for the target company. We also look for opportunities in distressed companies that have filed or may file for bankruptcy, distressed companies involved in reorganizations or financial restructurings, and distressed companies that emerged from bankruptcy or reorganization. |
| • | Tactically Managing Cash Levels. We are not afraid to hold significant cash positions when it makes sense for the Fund. |
Evermore Global Value Fund
A Letter from the Portfolio Manager
David Marcus
Portfolio Manager
"The single greatest edge an investor can have is a long-term orientation." – Seth Klarman
"Twenty years from now you will be more disappointed by the things you didn’t do than by the ones you did do. So, throw off the bowlines. Sail away from the safe harbor. Catch the trade winds in your sails. Explore. Dream. Discover." – Mark Twain
Dear Shareholder:
What a difference a year makes! After coming off a very tough 2018 fourth quarter, and despite continued concerns about tariffs, trade wars, a China slowdown, a global economic slowdown, etc., the Evermore Global Value Fund (the "Fund") rebounded nicely in 2019 with Institutional Class shares returning 25.41% to Fund shareholders.
Many of the stocks that caused the most pain in 2018 were ones that created the most value in 2019. One sector in particular– the marine transport sector – contributed the most to the Fund’s performance in 2019, as Scorpio Tankers, Frontline Ltd., Hapag-Lloyd AG, Star Bulk Carriers, Genco Shipping & Trading, and Scorpio Bulkers all generated significant gains. Atlantic Sapphire, the land-based Salmon farming group, which was a top performer for the Fund in 2018 was once again a top contributor to performance in 2019 as the company continued to achieve its milestones and moves towards initial production of Atlantic Salmon from its Homestead, Florida megaplex sometime around August 2020.
The Fund’s performance in 2019 directly benefitted from taking advantage of the extreme weakness in stock prices in the fourth quarter of 2018 and adding opportunistically to a substantial number of the Fund’s portfolio names. I have always been a strong believer in buying stress, panic, fear, and especially when investors think "this time is different". This is true when there is stress in the overall stock market or when there is stress in a specific company. In the long run, we believe stressful periods of time may create compelling investment opportunities.
As mentioned above, one of the Fund’s big winners in 2019 was Hapag-Lloyd AG, the global container shipping and logistics company. Our investment in Hapag-Lloyd provides a great example of what we like to do at Evermore – take advantage of a stressful, misunderstood special situation. Hapag-Lloyd was one of our first major investments in the maritime sector. In 2015, investment bankers in Europe reached out to us and told us that a 25% shareholder (travel company TUI AG) in Hapag-Lloyd, which at the time was a privately-controlled business, was electing its option to force the initial public offering ("IPO") of the company as a means to exit their position. New management at TUI AG quickly saw there were zero synergies between a travel and tourism service operator and a containership and logistics business. Moving people around, they concluded, was not the same as moving goods around. At the time, the whole maritime sector, including containerships, dry bulk carriers, and tankers, was going through a very stressed downturn.
The bankers were initially contemplating an IPO price in the low €50s1 per share, which we quickly concluded was of no interest to us. We had the opportunity to meet the CEO, Rolf Habben Jansen, who we thought was solid and had an excellent grasp of the company, as well as the entire containership industry and its players. Over the next few months, we continued to meet with management whenever they were doing a roadshow or conference to learn as much as we could about how the industry worked. Even with these regular meetings with institutional investors, the company was unable to get the IPO done at the initial target price range. We told them that if they ever did the deal at around €20 per share we would be interested. Slowly, but surely, the offering was pulled and then re-offered in the market. Eventually months later, the IPO was announced at a revised offering price of €20 per share. Around the same time of the offering, the company was consolidating a previously announced merger with the largest containership group in Chile called CSAV. We initiated our position in Hapag-Lloyd at this offering price. In fact, AP Moller-Maersk, the largest container operator and logistics company, issued a profit warning on the day when Hapag-Lloyd’s IPO launched in the market. The Hapag-Lloyd offering was what we like to call a "cold"IPO.
With a very aggressive operational and financial restructuring ahead of them, we would challenge the management whenever we saw them at conferences or analyst events. Impressively, the company kept hitting their announced milestones. They cut hundreds of millions of euros in operating costs, refinanced their debt at lower interest rates, and then announced a merger with one of the largest players in Saudi Arabia, called UASC. While the stock sold off and was eventually down about 30% from the €20 IPO price, we continued to add to the position. We had concluded that Rolf Habben Jansen and the CFO, Nicol‡s Burr, were excellent managers and very under-rated by the market. Over the next three years they transformed the company. We stayed with the investment, added to it as it traded lower, as we believed there was a real accretion of value at the company. Our view was that the underlying business was becoming more valuable, yet the stock price either lingered or went lower. As investors and the markets finally realized what was happening at the company, the stock went through a major revaluation.
The company improved cash flows substantially and worked aggressively to drive down the total debt and interest cost. In spite of no material fundamental improvement in the industry, the stock moved from one where we had a significant loss out of the gate, to one where we had a substantial long-term gain for our investors at our exit during the third quarter of 2019.
Opportunities like Hapag-Lloyd are what the Evermore investment team and I continually look for on our many trips to Europe, attendance at conferences, meetings with management teams, or by voraciously poring through news articles, research reports and company financials.
___________________
1 | At a U.S. Dollar to Euro exchange rate of 0.8915 on December 31, 2019, low €50s would translate to mid-high $50s and a price of €20 would translate to $22.43. |
Year-End Portfolio Highlights
The Fund ended the year with $595 million in net assets, 42 issuer positions and the following region, market capitalization and country exposures (as a % of Fund net assets):
| Region Exposure | | Market Cap Exposure |
| | | |
| | | |
 | |  |
| | | |
Country Exposure
Throughout the course of 2019, the Fund initiated 8 new positions and exited 13 portfolio positions. Below is a discussion of several of the Fund’s investments we initiated in 2019.
Modern Times Group (MTGB SS)
The Fund initiated a position Modern Times Group ("MTG") in the first quarter of 2019. Shortly after our purchase of MTG, the company initiated a spin-off of its Esports and gaming assets (and kept the parent company name, MTG), while the legacy broadcasting and Pay TV businesses became Nordic Entertainment Group ("NENT Group"). They started trading as independent standalone companies in April 2019. Interestingly, NENT Group traded up about 50% post the spinoff, and MTG traded down precipitously, only to then recover to only be slightly down for the year.
The CEO of NENT Group, Anders Jensen has done an excellent job in building and growing the group. He has built an excellent management team and has taken advantage of the rapidly changing Nordic media landscape. In late October 2019, NENT Group announced that it would combine its Viasat Pay TV unit with Telenor’s Canal Digital group with each company owning 50% of the new company. NENT Group will manage the merged group. It is expected that the deal will close sometime in 2020. In our opinion, this deal is a game changer as it brings
together two rival businesses and allows for dramatic synergies. This deal was over 15 years in the making as previous management was just not able to make it happen, which is a testament to the leadership of CEO Anders Jensen. With the media sector changing so rapidly, we believe combinations, acquisitions and spin-offs of all kinds are now on the table for NENT Group.
In the case of MTG, the company announced in October 2019 a strategic review of its gaming segment to find the best way to crystalize value for shareholders. We continue to believe that MTG, with its growing Esports and gaming businesses, as well as its net cash of over 30% of its market cap, continues to be misunderstood. We would like to see the company list its shares in the U.S. where a significant percentage of its current business and potential growth lies.
The Walt Disney Company (DIS US)
We initiated our position in The Walt Disney Company ("Disney") in the second quarter of 2019. Disney is an interesting situation (and a bit of an outlier for us as we do not routinely find opportunities among U.S. mega caps), as there were a number of catalysts underway at the company. Following the company’s acquisition of assets from 21st Century Fox in 2018, Disney is today embarking on a major corporate transformation as they go all-in on building out their direct-to-consumer services, including their flagship streaming business, Disney+. After being initially slow to embrace video streaming, the company has changed course and is today being extremely aggressive (Disney’s takeover of Hulu is a good example). We believe the company now understands they can control their own destiny, and in the entertainment industry, no one else has the scale of anything close to that of Disney.
The goal of Disney+ is to be the new core for Disney, enabling the company (for the first time ever) to know exactly who interacts with its content, how frequently, in what categories, and through which characters. In our opinion, the streaming business should increase consumption of Disney’s content, drive additional sales of its other products and experiences, disintermediate its traditional channel partners (like travel agencies, movie ticket sellers, and other retailers) and improve margins across their businesses.
Disney has always been an intellectual property ecosystem play. It’s Theme Parks division, for example, does nearly 100% more revenue than its Studio group, but the latter drives the former. Everything flows together, starting from theatrical releases. Disney’s catalog and character libraries are enormous. In addition to all the Disney and Pixar characters, they own the Marvel Comics universe, they bought Lucasfilm and Star Wars, and so their stable of characters has expanded into the thousands. We envision many opportunities ahead even if Disney uses but a fraction of this character base.
Beyond Disney+, they also have a whole host of other potential new businesses that we are not counting in our valuation, such as co-branded credit cards launched in theme parks, etc. We also expect the company to spinoff assets as they continue to digest and integrate the pieces acquired from 21st Century Fox.
Excluding the approximately $3 billion in fiscal year 2020 costs that Disney will incur in building out Disney+, we acquired our first shares when the stock was trading at less than 15x next year’s expected earnings per share, hardly a rich valuation for perhaps the most dominant name in entertainment. Given the addition of a more subscription-based business model, we believe Disney could follow the same path as others who have gone down a similar road, such as Microsoft and Adobe.
Gamesys Group PLC (GYS LN)
The Fund initiated its position in Gamesys Group PLC in the third quarter of 2019. Gamesys is a $1.0 billion market capitalization UK-based operator of real-money online bingo and casino games worldwide. The Fund initiated its position in July 2019 via an accelerated book build process, in which a bank placed a large block of stock overnight at a sizable discount to that day’s closing price. Prior to its late-September 2019 name change, Gamesys was formerly known as JPJ Group PLC ("JPJ"), and had actually been a subsidiary of privately held Gamesys Limited ("GL") until GL sold the JPJ business in 2015. However, in a deal announced in June 2019 (which closed in September 2019), JPJ acquired its former parent, reuniting the customer-facing components of the business historically performed by JPJ (customer acquisition, retention, and service) with the technology platform (game development and backend information technology) that had been retained by GL. The combination will allow for better data sharing, which is expected to lead to stronger revenue growth as well as margin expansion over time. Through the deal, Gamesys kept the CEO of GL, Lee Fenton, to lead the combined company. Given his rich history in the online gaming space, we believe this represents an upgrade in leadership.
Despite the game-changing acquisition, pessimism rules the day as Gamesys operates in dynamic regulatory and tax environments that have posed some significant challenges in key markets like the U.K. While adding cost and operational complexity to Gamesys and other larger established players, we believe that these industry-wide burdens are already proving to be insurmountable for subscale players in the sector and is leading to a "thinning out"of the competitive landscape. This should ultimately serve to benefit scaled operations like Gamesys, which enjoys high customer loyalty and, in what is a highly scrutinized industry, abides by the highest commitment to responsible gambling standards.
Shares were purchased in the Fund at just 5 times our estimate of next year’s Free Cash Flow ("FCF"), levels we believe are compelling, given this is a growth story. As far as catalysts go, as mentioned, the company just closed on the transformational GL acquisition. Given that the purchase price was partially paid in newly issued shares, the company’s now larger market capitalization is expected to make shares eligible for inclusion in the FTSE 250 index, creating natural demand for shares. Further, the company is expected to rapidly de-lever through a mix of FCF generation and earnings before interest, taxes, depreciation and amortization ("EBITDA") growth. Once financial leverage is brought
down, Gamesys will consider stock buybacks if shares remain materially undervalued. While we never base an investment thesis on the prospect of industry consolidation, we do note that merger and acquisition activity in the sector has been heating up. For instance, on October 2, 2019, Flutter Entertainment announced the acquisition of The Stars Group in a deal worth more than $6 billion.
IAC/Interactive Corp. (IAC US)
IAC/InterActive Corp. ("IAC") is the majority owner of both Match Group ("MTCH") (78% ownership) and ANGI Homeservices ("ANGI") (84% ownership), and the owner-operator of several other internet-based businesses. The company was formed in 1995, when Barry Diller took a controlling stake in Silver King Communications, an owner of 12 UHF television stations. Since then, the entity has followed a tried-and-true playbook for its portfolio companies: buy, build, scale, and ultimately spinoff. Along with ANGI and MTCH, several other notable companies have emerged from IAC including Expedia (EXPE US), TripAdvisor (TRIP US), Home Shopping Network (today Qurate Retail – ticker: QRTEA US), and TicketMaster (today Live Nation – ticker: LYV US).
In the fourth quarter of 2019, we initiated a long position in the IAC "stub"– that is, a long position in IAC and short positions in both MTCH and ANGI (commensurate to IAC’s ownership in those two stocks). While we are not at all looking to express a negative investment thesis on either MTCH or ANGI, we believe the value of the "stub"assets is clearly not recognized by the market and have structured the trade accordingly. Below are highlights of several businesses represented in the "stub":
| | – | Vimeo – With over 1.2 million paying subscribers, Vimeo is the leading professional video platform for editors and small/medium sized businesses to upload, share, and manage their content across the internet. Through both internal initiatives and M&A this business has undergone a major transformation over the last several years, and growth has accelerated. We expect more than $200 million in sales in fiscal year ("FY") 2020. |
| | – | Dotdash – With more than 90 million visitors per month, Dotdash is comprised of a host of content-based websites such as Verywell, Lifewire, Investopedia, and Brides. This business has seen growth accelerate meaningfully in recent years under new leadership and generated approximately $40 million in EBITDA in fiscal year 2019. |
| | – | Mosaic Group – The key growth driver of IAC’s Applications segment, Mosaic, operates more than 40 mobile apps, including Apalon products, Daily Burn fitness collective, leading translation app iTranslate and top spam-blocking app RoboKiller. Mosaic has almost 4 million paying subscribers and generated approximately $200 million in sales in fiscal year 2019. |
| | – | Turo – IAC purchased a minority stake in this business for $250 million in 2019. Turo is a car sharing marketplace where travelers can rent cars from a community of local car owners. Along with IAC (who is the company’s largest shareholder), investors include Daimler and BMW iVentures. |
| | – | Care.com (CRCM US) – IAC announced its intentions to purchase CRCM in December 2019 for an enterprise value of about $500 million. CRCM is the world’s largest online marketplace for finding and managing family care. Consensus estimates are calling for CRCM sales to grow at a double-digit compound annual growth rate ("CAGR") through 2022. |
We believe this investment is timely given that IAC will fully separate its remaining stake in MTCH with a spinoff slated for the second quarter of 2020. After adjusting for the moving parts of the transaction (namely a debt transfer from IAC to MTCH and a probable $1.5 billion secondary sale of MTCH shares by IAC prior to separation), we estimate MTCH represents about 70% of IAC’s market cap. With that, we expect that this spinoff will help highlight the value that remains at IAC.
As for ANGI, management has chosen to keep this business inside of the IAC complex for the time being. Nonetheless, IAC management has indicated time and again their aim is not to build empires, and in the reasonable future we expect ANGI to fully separate from IAC.
At year-end, we estimate that the "stub"assets are trading at a negative $6 per IAC share after accounting for net cash. Conservatively, we derive a $40 per share value for these assets. With a pending catalyst in the upcoming separation of MTCH, we believe IAC shares will begin to reflect this hidden value in the coming quarters. Moreover, at this time, we expect to remain IAC shareholders for years to come, as management has a demonstrated history of long and successful capital allocation, business development, and corporate restructuring. We believe post MTCH separation, IAC will be left with an enormous net cash position; when all is said and done, we estimate IAC will have about $4 billion of cash and virtually no debt at June 30, 2020. While we fully expect management to continue executing M&A deals, we would also expect substantial share buybacks when IAC’s share price is materially undervalued.
Although this investment was initially established as an arbitrage trade, we believe it will evolve into a long-term opportunity that will compound attractively given Barry Diller’s history of creating significant value for shareholders.
The Case for Focusing on Europe
While we are a global value investor, the fact is that we have had a very high focus on Europe since the inception of the firm. And in spite of Europe being a tomorrow story for so many years (some would say decades), our special situations focus has helped us find and invest in an extremely broad range of investment cases in the region since the inception of the Fund.
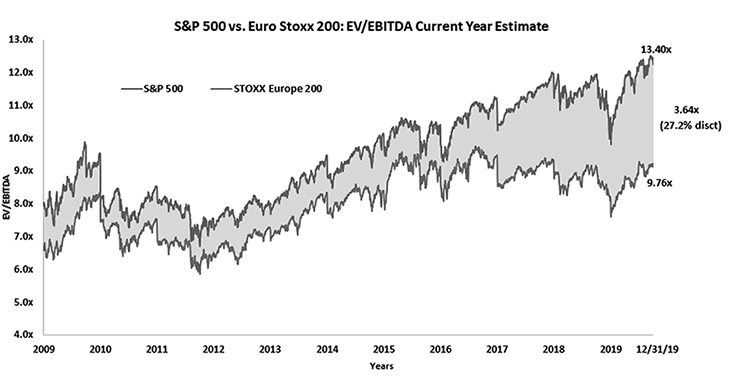
The punchline is that while we have been talking about "Why Now?"for Europe for years, it was always based on various break-ups, spin-offs, various restructurings at an ever-accelerating pace across the region. We believe the stars are lining up for European special situations like never before based on the confluence of the following factors:
| | • | Valuation gap – European equities are trading at a huge discount to their global counterparts, but especially to U.S. equities (see chart below) |
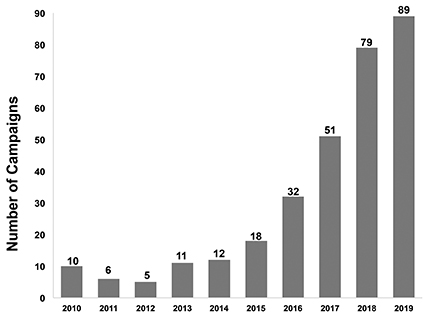
| | • | Shareholder activism – was previously largely hit or miss in terms of effectiveness, but now is accelerating and actually seeing results as activist investors have finally realized that Europe is different from the U.S.; activists are working their way onto boards and nomination committees to help effect change from the board level; it is still early days, but the steadily increasing number of campaigns over the last few years and the early signs of results are encouraging (see chart below) |
| | • | Private equity – Record levels of capital raised by private equity specifically for investments in Europe (see chart below) |
| | • | Low/negative interest rates – companies have been continuously refinancing balance sheets at lower and lower rates; the reality is that companies going through strategic change generally are not debt financed at the lowest rates; however, as their financials improve, they keep coming back to restructure their debt, which transforms their cash generation |
| | • | Strategic buyers are gobbling up competitors or buying companies to bolster existing product lines or service offerings – in what has been a low/no growth environment, companies are buying growth |
|
 |
|
| |
| Source: Bloomberg |
| Total Number of Activist Campaigns in Europe | | Private Equity Activity in Europe |
| | | |
| | | |
 | |  |
| | | |
| | | |
| Source: Bloomberg | | Source: Pitchbook – 2019 Annual PE Breakdown |
Bottom Line
We believe the Fund is well positioned heading into 2020. At year-end, 67.4% of the Fund’s portfolio was invested in European special situations and we think that several tailwinds exist to help drive performance next year. First, and most important, our portfolio positions continue to trade at significant discounts to our estimates of their intrinsic values and have catalysts at work that we believe can create meaningful value for shareholders in the coming quarters and years. Second, as discussed above, with European stocks trading at historically low valuations relative to the S&P 500, we believe that an improving economic environment and a continuing trend of positive central bank moves will make European companies more attractive to investors and therefore begin to help narrow the aforementioned valuation gap, which should accrue to the benefit of our European positions. Finally, a significant portion of the Fund’s portfolio remains invested in European shipping stocks. As the new International Maritime Organization ("IMO") 2020 sulfur emission regulations for shipping transportation companies went into effect on January 1, 2020, we believe that our shipping stocks are poised to perform extremely well in this new regulatory environment, especially when accompanied by rising commodity prices.
Year-end 2019 marked the 10-year anniversary since we started the Fund and almost 11 years since the idea for Evermore Global Advisors was hatched by Eric LeGoff and me over a lunch in Summit, New Jersey during the depths of the financial crisis. We have come a long way, yet we are a young firm and believe that we are barely in the early innings of the opportunity for us to continue to build and grow the firm on the simple foundation of creating value for our investors.
Thank you for your continued support and confidence.
Wishing you a healthy, happy and prosperous New Year!
David E. Marcus
Portfolio Manager
Management’s Discussion of Fund Performance
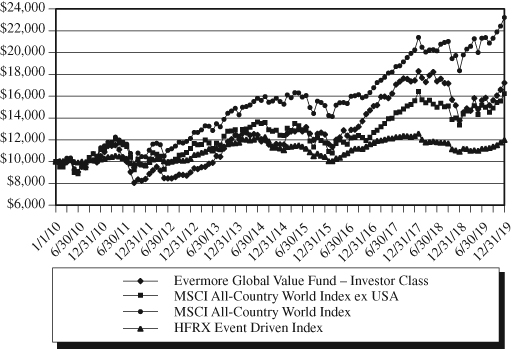
After a very tough fourth quarter of 2018, and despite continued investor concerns regarding trade wars, tariffs and a China/global economic slowdown, the Fund posted strong performance in 2019, as some of the stocks that were the largest detractors to Fund performance in 2018 became the biggest contributors to Fund performance in 2019. This was certainly the case with many of our maritime sector positions. For the year ended December 31, 2019, Institutional Class shares of the Evermore Global Value Fund (the "Fund") were up 25.41%, the MSCI All Country World Index ex USA ("MSCI ACWI ex USA") was up 21.51%, the MSCI All Country World Index ("MSCI ACWI") was up 26.60% and the HFRX Event Driven Index ("HFRX ED") was up 9.96%.
Four of the top five contributors to Fund performance in 2019 were European companies (two of which were Norwegian); one was an Asian position. All five of the top five detractors to Fund performance were European companies (four of which were Norwegian). The Fund’s foreign currency forward contract positions contributed to Fund performance in 2019. The largest contributors (aside from forward contract positions) and detractors to Fund performance for the year were:
Top Contributors to Fund Performance | Top Detractors From Fund Performance |
| Scorpio Tankers Inc. (Monaco) | Codere SA (Spain) |
| Atlantic Sapphire AS (Norway) | Ice Group ASA (Norway) |
| Frontline Ltd. (Norway) | Northern Drilling Ltd. (Norway) |
| MagnaChip Semiconductor Corp. (South Korea) | Magseis Fairfield ASA (Norway) |
| Constellium SE (France) | Borr Drilling Ltd. (Norway) |
Please find a discussion below about the two largest contributors and two largest detractors to Fund performance in 2019.
Scorpio Tankers Inc. (STNG US)
Scorpio Tankers Inc. was the largest contributor to the Fund’s investment performance in 2019. With a market cap of $2.3 billion, Scorpio Tankers is one of the largest product tanker operators in the world and has one of the youngest fleets entirely comprised of product tanker assets (over 100 vessels).
Throughout the year, incremental oil demand continued to be strong in the U.S., which was a net exporter of seaborne crude. There was also a confluence of events (i.e. drone attacks on the Saudi oil installments, sanctions on China’s state-owned shipping group COSCO and Iran) that occurred in the late third quarter/early fourth quarter of 2019, which resulted in crude tanker (VLCC) spot rates to skyrocket from $30,000 per day to $300,000 per day. As a result, the product tanker market has started to see the benefit of spillover effects from the crude tanker market.
The product tanker market also improved significantly during the third and fourth quarters of 2019 as the prolonged refinery maintenance finally came to an end. In late September 2019, Scorpio Tankers increased its tanker market exposure through the acquisition of Trafigura’s 19 product tankers. The company also maintained its quarterly $0.10 dividend per share, or 1% annualized yield, and has approximately $122 million remaining in the share buyback program.
Lastly, impacts of the International Maritime Organization ("IMO") 2020 regulatory changes are now starting to be felt by the broader market including 1) widening spread between low and high sulphur fuels; 2) shortage of compliant fuels; 3) longer delays retrofitting scrubbers; and 4) historically low order book. In our view, we believe Scorpio Tankers is well positioned to be a beneficiary of one of the best long-term tanker setups that we have observed in the last 20 years.
Atlantic Sapphire (ASAME NO)
Atlantic Sapphire ("Sapphire") was the second largest contributor to Fund performance in 2019, with its shares appreciating approximately 87%. Shares have performed well as the company continues to make significant progress at its Homestead, Florida "Bluehouse"facility. Once fully online (the first harvest is slated for August 2020) the company will be the only scale player in the fledgling land-based salmon farming industry.
It appears the world is fast approaching its natural limits of Atlantic salmon farming volumes under traditional net pen systems. Nevertheless, demand growth continues unabated, with markets such as the United States and China leading the demand creation. A tight supply situation, along with increasing costs to fight sea lice and disease at traditional farms, have pushed salmon prices higher. As a result, the rationale for land-based is extremely robust. Once Homestead comes online, we believe it will be able to sell its fish at a heathy premium to peers. Not only will its product be free of antibiotics and microplastics but given Sapphire’s proximity to its US-based customers, its fish will also be 5-7 days fresher, on average, than competing products in the marketplace. In addition to a higher selling price, we expect the company should have real cost advantages once ramped. For one, it will get to capture the inherent transportation costs embedded in landed salmon prices from Norway and Chile. Furthermore, Sapphire should not see the same direct and indirect costs competitors must expend to fight unfavorable biological developments (sea lice, disease, algae blooms, etc.).
The year was quite eventful for Sapphire. Notable developments included: (1) continued strong biological performance across the fish placed into its Homestead facility; (2) uninterrupted progress on the next stages of facility construction; (3) an equity raise of approximately $90 million to accelerate further stages of capacity growth at Homestead; (4) the establishment of a joint venture to help capture value from salmon byproducts; (5) the signing of a long term feed supply contract; (6) the demonstration of stable biological key performance indicators and more consistent commercial harvest levels at Sapphire’s Danish test facility; and (7) the appointment of Runar Vatne, a well-regarded Norwegian businessman, to Sapphire’s board of directors. Ultimately, despite shares having appreciated considerably since the Fund’s first purchases, we continue to believe they do not reflect the significant levels of free cash flow the company should be able to generate in coming years.
Codere SA (CDR SM)
Codere SA was the largest detractor to the Fund’s investment performance in 2019. The Fund owns the restricted shares of the company, which are subject to a shareholders’ agreement and, as a result, infrequently trade amongst other shareholders that are also subject to said agreement.
Codere is a $326 million market cap gaming company headquartered in Spain with operations in Europe and Latin America. Founded in 1980, the company primarily operates gaming machines, bingo halls, casinos, racetracks and sports betting locations in Spain, Italy and Latin America.
In October 2019, the company announced that it discovered accounting inconsistencies relating to its subsidiaries in Panama, Mexico and Colombia. An independent specialized consultant, Alvarez & Marsal, was retained to further assess the situation. In November 2019, the forensic investigation concluded the impact was isolated to the first half of 2019 resulting in a total negative impact of €16.5 ($18.5) million. No other geographies or periods were affected. The employees that were involved with the accounting inconsistencies are no longer with the company. The internal controls were enhanced, and additional layers of protection were immediately implemented. As a result of this issue, the company’s year-end EBITDA guidance was revised downward to €250 – €255 ($280.4 – $286.0) million for 2019.
Despite the underperformance in Codere listed shares and Codere restricted shares, there were some notable positive developments throughout 2019. The company started to report its nascent Online segment on a standalone basis in the first quarter of 2019, as the full commercial launch for Mexico started in the first quarter of 2019 and for Colombia started in the second quarter of 2019. In addition, the Company continued to successfully implement its business plan, which included the acquisition of slot route operations in Spain and the recent renewal of its partnership with football club Real Madrid through 2022 with an extension option for an additional two years.
Ice Group ASA (ICE NO)
Ice Group ASA was the Fund’s second largest detractor from performance in 2019, with its shares declining 60% during the period. Ice Group is the third largest telecom operator in Norway, operating from a low-cost "challenger"position. Despite the weak stock market performance, operationally, the company has performed reasonably well against its business plan, having recently reached more than a 10% market share in Norway. With high customer satisfaction rates, low-prices, and an extremely supportive regulator that wants to foster competition, we believe in management’s ability to drive the company to its stated 20% market share target over time.
Unfortunately, though certainly as expected, the company is not yet in a self-financing position and has debt on its balance sheet. We believe the depressed stock price has more to do with shares being less liquid in combination with the expectation of future capital raises, rather than the company’s intrinsic value. While we are frustrated with the share price development, we remain steadfast in our belief in the long-term value of a number 3 player within the Norwegian wireless landscape.
As of December 31, 2019, the Fund’s ten largest issuer positions were as follows:
| Security | Country | Sector | Weight | |
| Atlantic Sapphire ASA | Norway | Consumer Staples | 6.37% | |
| Scorpio Tankers Inc. | Monaco | Industrials | 5.72% | |
| MagnaChip Semiconductor Corp. | South Korea | Information Technology | 4.11% | |
| Nordic Entertainment Group | Sweden | Communication Services | 4.04% | |
| Modern Times Group – B Shares | Sweden | Communication Services | 4.01% | |
| Frontline Ltd. | Norway | Industrials | 3.97% | |
| Fagron | Belgium | Health Care | 3.92% | |
| Constellium SE – Class A | France | Materials | 3.87% | |
| Vivendi SA | France | Communication Services | 3.39% | |
| S&T AG | Austria | Information Technology | 3.31% | |
At year-end 2019, the Fund’s cash position stood at approximately 0.3%.
Opinions expressed are those of Evermore Global Advisors and are subject to change, are not guaranteed and should not be considered investment advice.
Past performance does not guarantee future results.
Earnings growth is not representative of the Fund’s future performance.
Cash Flow – the total amount of money being transferred into an out of a business, especially as affecting liquidity.
Return on Equity – A measure of the profitability of a business in relation to the equity.
While the Fund is no load, management fees and other expenses still apply. Please refer to the prospectus for further details.
Mutual fund investing involves risk. Principal loss is possible. Investments in foreign securities involve greater volatility and political, economic and currency risks and differences in accounting methods. Investing in smaller companies involves additional risks such as limited liquidity and greater volatility. The Fund may make short sales of securities, which involve the risk that losses may exceed the original amount invested in the securities. Investments in debt securities typically decrease in value when interest rates rise. This risk is usually greater for longer-term debt securities. Investment in lower-rated, non-rated and distressed securities presents a greater risk of loss to principal and interest than higher-rated securities. Due to the focused portfolio, the fund may have more volatility and more risk than a fund that invests in a greater number of securities. Additional special risks relevant to the fund involve derivatives and hedging. Please refer to the prospectus for further details. This report is not authorized for distribution to prospective investors unless accompanied or proceeded by a current Evermore Global Value Fund summary prospectus or prospectus which contains more complete information about the Fund’s investment objectives, risks, fees and expenses.
Please refer to the Schedules of Investments for complete holdings information. Fund holdings and sector allocations are subject to change at any time and are not recommendations to buy or sell any security.
The MSCI All-Country World ex-US Index (MSCI AWCI ex USA) is a free float-adjusted market capitalization index that is designed to measure equity market performance in the global developed and emerging markets, excluding the US. The Index consists of 45 developed and emerging market countries. The Index is net of foreign withholding taxes on dividends.
The MSCI All-Country World Index (MSCI AWCI) is an unmanaged index comprised of 48 country indices, including 23 developed and 25 emerging market country indices, and is calculated with dividends reinvested after deduction of holding tax. The index is a trademark of Morgan Stanley Capital International and is not available for direct investment.
Hedge Fund Research, Inc. (HFR) utilizes a UCITSIII compliant methodology to construct the HFRX Hedge Fund Indices. The methodology is based on defined and predetermined rules and objective criteria to select and rebalance components to maximize representation of the Hedge Fund Universe. The HFR Event-Driven (Total) Index is being used under license from Hedge Fund Research, Inc. which does not approve or endorse Fund.
The FTSE 250 Index is a capitalization-weighted index consisting of the 101st to the 350th largest companies listed on the London Stock Exchange. Promotions and demotions to and from the index occur quarterly in March, June, September, and December. The Index is calculated in real-time and published every minute. The index is a trademark of the Financial Times and Stock Exchange.
Morningstar World Stock Category – an international fund having more than 20% of stocks invested in the United States.
It is not possible to invest directly in an index.
Past performance does not guarantee future results.
"EBITDA" is the acronym for earnings before interest, taxes, depreciation and amortization. "Market Cap"is the market price of an entire company, calculated by multiplying the number of shares outstanding by the price per share. "Free cash flow"is earnings before depreciation, amortization, and non-cash charges minus maintenance capital expenditures.
Must be preceded or accompanied by a prospectus.
From its inception through December 31, 2019, the Evermore Global Value Fund was distributed by Quasar Distributors, LLC. Quasar Distributors, LLC is affiliated with U.S. Bancorp Fund Services, LLC and U.S. Bank N.A. Effective January 1, 2020, the Evermore Global Value Fund is being distributed by Compass Distributors, LLC. Compass Distributors, LLC is an affiliate of Foreside Financial Group, LLC.
Evermore Global Value Fund
| PERFORMANCE INFORMATION (Unaudited) |
Value of $10,000 vs. MSCI All-Country World Index ex USA,
MSCI All-Country World Index & HFRX Event Driven Index
Average Annual Total Returns For the Periods Ended December 31, 2019:
| | | | | Since | Value of |
| | | | | Inception | $10,000 |
| | 1 Year | 3 Year | 5 Year | (1/1/2010) | (12/31/2019) |
| Investor Class | 25.05% | 5.43% | 8.27% | 5.58% | $17,216 |
| Institutional Class | 25.41% | 5.68% | 8.53% | 5.84% | $17,638 |
| MSCI All-Country World Index ex USA | 21.51% | 9.87% | 5.51% | 4.97% | $16,236 |
| MSCI All-Country World Index | 26.60% | 12.44% | 8.41% | 8.79% | $23,217 |
| HFRX Event Driven Index | 9.96% | 1.13% | 1.34% | 1.84% | $12,002 |
This chart illustrates the performance of a hypothetical $10,000 investment made in the Investor Class shares on January 1, 2010, and is not intended to imply any future performance. The returns shown do not reflect the deduction of taxes that a shareholder would pay on fund distributions or the redemption of fund shares. The chart assumes reinvestment of capital gains and dividends for a fund and dividends for an index. Index returns do not reflect the effects of fees and expenses. It is not possible to invest directly in an index.
Evermore Global Value Fund
| SECTOR ALLOCATION* as a Percentage of Total Portfolio at December 31, 2019 (Unaudited) |
| * | Data is expressed as a percentage of total portfolio. Data expressed excludes collateral on loaned securities, written options, short securities and forward foreign currency contracts. Please refer to the Schedule of Investments, Schedule of Securities Sold Short and Schedule of Forward Foreign Currency Contracts for more details on the Fund’s individual holdings. |
Evermore Global Value Fund
| EXPENSE EXAMPLE for the Six Months Ended December 31, 2019 (Unaudited) |
As a shareholder of the Evermore Global Value Fund (the "Fund"), you incur two types of costs: (1) transaction costs, and (2) ongoing costs, including investment advisory fees, distribution fees, and other Fund expenses. This example is intended to help you understand your ongoing costs (in dollars) of investing in the Fund and to compare these costs with the ongoing costs of investing in other mutual funds. The example is based on an investment of $1,000 invested at the beginning of the period and held for the entire period (7/1/19 – 12/31/19).
Actual Expenses
The first line of the table below provides information about actual account values based on actual returns and actual expenses. You will be assessed fees for outgoing wire transfers, returned checks and stop payment orders at prevailing rates charged by U.S. Bancorp Fund Services, LLC, doing business as U.S. Bank Global Fund Services, the Fund’s transfer agent. If you request a redemption be made by wire transfer, currently a $15.00 fee is charged by the Fund’s transfer agent. You will be charged a redemption fee equal to 2% of the net amount of the redemption if you redeem shares less than 90 calendar days after you purchase them. An Individual Retirement Account ("IRA") will be charged a $15.00 annual maintenance fee. To the extent the Fund invests in shares of other investment companies as part of its investment strategy, you will indirectly bear your proportionate share of any fees and expenses charged by the underlying funds in which the Fund invests in addition to the expenses of the Fund. Actual expenses of the underlying funds may vary. These expenses are not included in the example below. The example below includes, but is not limited to, investment advisory fees, shareholder servicing fees, fund accounting fees, custody fees and transfer agent fees. However, the example below does not include portfolio trading commissions and related expenses, and other extraordinary expenses as determined under generally accepted accounting principles. You may use the information in this line, together with the amount you invested, to estimate the expenses that you paid over the period. Simply divide your account value by $1,000 (for example, an $8,600 account value divided by $1,000 = 8.6), then multiply the result by the number in the first line under the heading entitled "Expenses Paid During the Period"to estimate the expenses you paid on your account during this period.
Hypothetical Example for Comparison Purposes
The second line of the table below provides information about hypothetical account values and hypothetical expenses based on the Fund’s actual expense ratios and an assumed rate of return of 5% per year before expenses, which is not the Fund’s actual return. The hypothetical account value and expenses may not be used to estimate the actual ending account balance or expenses you paid for the period. You may use this information to compare the ongoing costs of investing in the Fund and other funds. To do so, compare this 5% hypothetical example with the 5% hypothetical examples that appear in the shareholder reports of the other funds. Please note that the expenses shown in the table are meant to highlight your ongoing costs only and do not reflect any transactional costs, such as sales charges (loads), redemption fees or exchange fees. Therefore, the second line of the table is useful in comparing ongoing costs only and will not help you determine the relative total costs of owning different funds. In addition, if these transactional costs were included, your costs would have been higher.
| | Beginning | Ending | Expenses Paid |
| | Account Value | Account Value | During the Period |
| | 7/1/19 | 12/31/19 | 7/1/19 – 12/31/19* |
| Investor Class Actual* | $1,000 | $1,102.60 | $7.79 |
| Investor Class Hypothetical (5% annual return before expenses) | $1,000 | $1,017.80 | $7.48 |
| | | | |
| Institutional Class Actual* | $1,000 | $1,104.00 | $6.47 |
| Institutional Class Hypothetical (5% annual return before expenses) | $1,000 | $1,019.06 | $6.21 |
| * | Expenses are equal to the Fund’s annualized expense ratios for the most recent six-month period of 1.47% for Investor Class shares and 1.22% for Institutional Class shares multiplied by the average account value over the period multiplied by 184/365 (to reflect the one-half year period). |
Evermore Global Value Fund
| SCHEDULE OF INVESTMENTS at December 31, 2019 |
| Shares | | | | Value | |
| COMMON STOCKS – 97.1% | |
| | |
| Aerospace & Defense – 2.4% | |
| | 9,464,953 | | Bombardier, Inc. – Class B (Canada)(1) | | $ | 14,067,506 | |
| | | | | | | | |
| Capital Markets – 5.3% | |
| | 290,314 | | AURELIUS Equity | | | | |
| | | | Opportunities SE & Co. KGaA (Germany)(2) | | | 12,700,220 | |
| | 353,600 | | KKR & Co., Inc. – Class A (United States) | | | 10,314,512 | |
| | 341,270 | | Tikehau Capital SCA (France) | | | 8,421,694 | |
| | | | | | | 31,436,426 | |
| Chemicals – 6.4% | |
| | 676,856 | | Kraton Corp. (United States)(1)(4) | | | 17,137,994 | |
| | 143,433 | | DuPont de Nemours, Inc. (United States) | | | 9,208,399 | |
| | 136,999 | | Dow, Inc. (United States) | | | 7,497,955 | |
| | 143,433 | | Corteva, Inc. (United States) | | | 4,239,879 | |
| | | | | | | 38,084,227 | |
| Consumer Finance – 0.6% | |
| | 16,710,000 | | Emergent Capital, Inc. (United States)(1)(5)(8) | | | 3,325,791 | |
| | | | | | | | |
| Diversified Telecommunication Services – 1.3% | |
| | 2,812,289 | | ICE Group AS (Norway)(1) | | | 6,278,503 | |
| | 7,087,431 | | Net1 International Holdings AS (Norway(1)(3)(8)(10) | | | 1,210,933 | |
| | | | | | | 7,489,436 | |
| Energy Equipment & Services – 2.1% | |
| | 833,470 | | Borr Drilling Ltd. (Norway)(1)(2) | | | 7,306,743 | |
| | 6,631,815 | | Magseis Fairfield ASA (Norway)(1) | | | 4,381,275 | |
| | 448,862 | | Northern Drilling, Ltd. (Norway)(1) | | | 1,055,779 | |
| | | | | | | 12,743,797 | |
| Food Products – 8.7% | |
| | 2,580,616 | | Atlantic Sapphire AS (Norway)(1) | | | 37,918,679 | |
| | 1,836,917 | | Salmones Camanchaca SA (Chile) | | | 14,102,287 | |
| | | | | | | 52,020,966 | |
| Hotel, Restaurants & Leisure – 5.1% | |
| | 1,411,906 | | Gamesys Group Plc (United Kingdom)(1) | | | 13,222,475 | |
| | 294,373 | | Universal Entertainment Corp. (Japan) | | | 10,064,845 | |
| | 2,561,942 | | Codere SA Restricted (Spain) | | | | |
| | | | (Acquired 08/03/2016 through | | | | |
| | | | 12/03/2019, cost $19,315,625)(1)(3)(8)(9)(10) | | | 7,057,913 | |
| | | | | | | 30,345,233 | |
| Industrial Conglomerates – 7.8% | |
| | 241,960 | | EXOR NV (Netherlands) | | | 18,748,846 | |
| | 3,477,413 | | Bollore SA (France) | | | 15,173,457 | |
| | 209,252 | | Lifco AB – B Shares (Sweden) | | | 12,778,953 | |
| | | | | | | 46,701,256 | |
| Life Sciences Tools & Services – 1.4% | |
| | 3,165,125 | | Enzo Biochem, Inc. (United States)(1)(5) | | | 8,324,279 | |
| | | | | | | | |
| Marine – 19.4% | |
| | 865,369 | | Scorpio Tankers, Inc. (Monaco) | | | 34,043,610 | |
| | 1,837,476 | | Frontline, Ltd. (Norway)(2)(4) | | | 23,629,941 | |
| | 2,851,002 | | Scorpio Bulkers, Inc. (Monaco) | | | 18,160,883 | |
| | 1,186,661 | | Genco Shipping & Trading, Ltd. (United States) | | | 12,602,340 | |
| | 898,200 | | Star Bulk Carriers Corp. (Greece)(2) | | | 10,607,742 | |
| | 478,597 | | Navios Maritime Partners LP (Greece) | | | 8,911,476 | |
| | 3,630,223 | | Navios Maritime Containers LP (Greece)(1)(5) | | | 7,804,979 | |
| | | | | | | 115,760,971 | |
| Media – 14.4% | |
| | 743,480 | | Nordic Entertainment Group AB – | | | | |
| | | | Class B (Sweden) | | | 24,035,590 | |
| | 2,002,021 | | Modern Times Group MTG AB – | | | | |
| | | | B Shares (Sweden) | | | 23,864,755 | |
| | 696,783 | | Vivendi SA (France)(4) | | | 20,180,524 | |
| | 92,700 | | Walt Disney Co. (United States) | | | 13,407,201 | |
| | 18,600 | | IAC InterActive Corp. (United States)(1) | | | 4,633,446 | |
| | | | | | | 86,121,516 | |
| Metals & Mining – 3.9% | |
| | 1,719,936 | | Constellium SE (France)(1) | | | 23,047,142 | |
| | | | | | | | |
| Oil, Gas & Consumable Fuels – 2.7% | |
| | 681,650 | | Par Pacific Holdings, Inc. (United States)(1) | | | 15,841,546 | |
| | | | | | | | |
| Pharmaceuticals – 3.9% | |
| | 1,074,392 | | Fagron NV (Belgium)(1) | | | 23,295,566 | |
| | | | | | | | |
| Professional Services – 2.9% | |
| | 743,343 | | AF POYRY AB (Sweden) | | | 17,348,784 | |
| | | | | | | | |
| Semiconductors & | |
| Semiconductor Equipment – 5.5% | |
| | 2,107,539 | | MagnaChip Semiconductor Corp. | | | | |
| | | | (South Korea)(1)(5) | | | 24,468,527 | |
| | 437,353 | | Xperi Corp. (United States)(4) | | | 8,091,030 | |
| | | | | | | 32,559,557 | |
| Technology Hardware, | |
| Storage & Peripherals – 3.3% | |
| | 824,910 | | S&T AG (Austria)(2) | | | 19,690,505 | |
| | | | | | | | |
| TOTAL COMMON STOCKS | |
| (Cost $491,962,554) | | | 578,204,504 | |
| | | | | | | | |
| Principal | | | | | | |
| Amount | | | | | | |
| CORPORATE OBLIGATIONS – 2.1% | |
| | |
| Consumer Finance – 2.1% | |
| $ | 12,916,710 | | Emergent Capital, Inc. | | | | |
| | | | 8.500%, 7/15/2021 (United States)(8)(12) | | | 12,550,693 | |
| TOTAL CORPORATE OBLIGATIONS | |
| (Cost $12,542,759) | | | 12,550,693 | |
| | | | | | | | |
Shares
| | | | | | |
| WARRANTS – 0.1% | |
| | |
| Consumer Finance – 0.1% | |
| | 4,344,786 | | Emergent Capital, Inc., | | | | |
| | | | Expiration: July, 2025, | | | | |
| | | | Exercise Price $0.20 | | | | |
| | | | (United States)(1)(3)(8)(10) | | | 441,939 | |
| TOTAL WARRANTS | |
| (Cost $0) | | | 441,939 | |
The accompanying notes are an integral part of these financial statements.
Evermore Global Value Fund
| SCHEDULE OF INVESTMENTS at December 31, 2019, Continued |
| | | | Notional | | | | |
Contracts(6) | | | Value | | | Value | |
| CALL OPTIONS PURCHASED – 0.3% | |
| | 3,650 | | Frontline Ltd., | | | | | |
| | | | Expiration: February, 2020, | | | | | |
| | | | Strike Price $12.00 | | | | | |
| | | | (United States) | $ | 4,693,900 | | | $ | 520,125 | |
| | 1,100 | | KKR & Co., Inc., | | | | | | | |
| | | | Expiration: January, 2021, | | | | | | | |
| | | | Strike Price $27.00 | | | | | | | |
| | | | (United States) | | 3,208,700 | | | | 500,500 | |
| | 435 | | Walt Disney Co., | | | | | | | |
| | | | Expiration: March, 2020, | | | | | | | |
| | | | Strike Price $140.00 | | | | | | | |
| | | | (United States) | | 6,291,405 | | | | 379,538 | |
| | 1,000 | | Scorpio Tankers, Inc., | | | | | | | |
| | | | Expiration: January, 2020, | | | | | | | |
| | | | Strike Price $40.00 | | | | | | | |
| | | | (United States) | | 3,934,000 | | | | 157,500 | |
| | 500 | | Scorpio Tankers, Inc., | | | | | | | |
| | | | Expiration: January, 2020, | | | | | | | |
| | | | Strike Price $39.00 | | | | | | | |
| | | | (United States) | | 1,967,000 | | | | 106,250 | |
| | 900 | | CBOE VIX Futures Index, | | | | | | | |
| | | | Expiration: January, 2020, | | | | | | | |
| | | | Strike Price $16.00 | | | | | | | |
| | | | (United States) | | 1,240,200 | | | | 92,250 | |
| | 435 | | DuPont de Nemours, Inc., | | | | | | | |
| | | | Expiration: April, 2020, | | | | | | | |
| | | | Strike Price $70.00 | | | | | | | |
| | | | (United States) | | 2,792,700 | | | | 68,295 | |
| | 675 | | Walt Disney Co., | | | | | | | |
| | | | Expiration: January, 2020, | | | | | | | |
| | | | Strike Price $150.00 | | | | | | | |
| | | | (United States) | | 9,762,525 | | | | 39,150 | |
| | |
| TOTAL CALL OPTIONS PURCHASED | |
| (Cost $2,320,136) | | | | 1,863,608 | |
| | | | | | | | | | | |
PUT OPTIONS PURCHASED – 0.0%(11) | |
| | 2,500 | | iShares MSCI Emerging Markets ETF, | | | | | | | |
| | | | Expiration: January, 2020, | | | | | | | |
| | | | Strike Price $39.73 | | | | | | | |
| | | | (United States) | | 11,217,500 | | | | 5,000 | |
| | | | | | | | | | | |
| TOTAL PUT OPTIONS PURCHASED | |
| (Cost $155,575) | | | | 5,000 | |
| Shares | | Value | |
| SHORT-TERM INVESTMENT – 0.5% | |
| | |
| Money Market Fund – 0.5% | |
| | 2,883,809 | | First American Treasury Obligations Fund – | | | |
| | | | Class X, 1.53%(7) | | | 2,883,809 | |
| | | | | | | | |
| TOTAL SHORT-TERM INVESTMENT | |
| (Cost $2,883,809) | | | 2,883,809 | |
| | | | | | | | |
| SECURITIES HELD AS COLLATERAL ON | |
| LOANED SECURITIES – 7.6% | |
| | |
| Money Market Funds – 7.6% | |
| | 23,874,883 | | First American Government Obligations Fund – | | | | |
| | | | Class Y, 1.20%(7) | | | 23,874,883 | |
| | 21,207,691 | | Dreyfus Government Cash Management – | | | | |
| | | | Investor Class, 1.51%(7) | | | 21,207,691 | |
| | | | | | | | |
| TOTAL SECURITIES HELD AS COLLATERAL ON | |
| LOANED SECURITIES | |
| (Cost $45,082,574) | | | 45,082,574 | |
| | | | | | | | |
| TOTAL INVESTMENTS IN SECURITIES – 107.7% | |
| (Cost $554,947,407) | | | 641,032,127 | |
| Liabilities in Excess of Other Assets – (7.7)% | | | (46,005,288 | ) |
| TOTAL NET ASSETS – 100.0% | | $ | 595,026,839 | |
Percentages are stated as a percent of net assets.
| | (1) | Non-income producing security. |
| | (2) | All or a portion of this security is on loan. At December 31, 2019 the total value of securities on loan was $43,663,544, which represents 7.3% of total net assets. The remaining contractual maturity of all of the securities lending transactions is overnight and continuous. |
| | (3) | These securities were fair valued in good faith by the Adviser’s Valuation Committee. The aggregate value of these securities at December 31, 2019 were $8,710,785, which represents 1.5% of net assets. |
| | (4) | All or a portion of this security was segregated as collateral for written options. Written options are collateralized with fully paid securities and cash with a value of $14,191,197 and $2,962,614 respectively at December 31, 2019. |
| | (5) | Affiliated company as defined by the Investment Company Act of 1940. Please refer to Note 6 for further disclosures related to these affiliated securities. |
| | (6) | 100 shares per contract. |
| | (7) | Seven-day yield as of December 31, 2019. |
| | (8) | The Advisor has deemed a portion of these securities as illiquid. These securities have a value of $24,587,270, which represents 4.1% of total net assets at December 31, 2019. |
| | (9) | This security is restricted. This security has a value of $7,057,913, which represents 1.2% of total net assets at December 31, 2019. |
| | (10) | Value determined using significant unobservable inputs. |
| | (11) | Less than 0.1%. |
| | (12) | The coupon rate represents the rate as of December 31, 2019. The security accrued in-kind interest of $1,058,678 at a rate of 11.5% from January 1, through September 15, 2019. The in-kind interest is included in the Statement of Operations within interest, unaffiliated securities. |
The Global Industry Classification Standard (GICS¨) was developed by and/or is the exclusive property of MSCI, Inc. and Standard & Poor Financial Services LLC ("S&P"). GICS¨ is a service mark of MSCI, Inc. and S&P and has been licensed for use by the Fund’s Administrator, U.S. Bancorp Fund Services, LLC, doing business as U.S. Bank Global Fund Services ("Fund Services").
The accompanying notes are an integral part of these financial statements.
Evermore Global Value Fund
| SCHEDULE OF INVESTMENTS at December 31, 2019, Continued |
| COUNTRY ALLOCATION for Investments in Securities at December 31, 2019 |
| Country | Long Exposure |
| United States^ | 29.8% |
| Norway | 13.7% |
| Sweden | 13.1% |
| France | 11.3% |
| Monaco | 8.8% |
| Greece | 4.6% |
| South Korea | 4.1% |
| Belgium | 3.9% |
| Austria | 3.3% |
| Netherlands | 3.1% |
| Chile | 2.4% |
| Canada | 2.4% |
| United Kingdom | 2.2% |
| Germany | 2.1% |
| Japan | 1.7% |
| Spain | 1.2% |
| Total | 107.7% |
Percentages are stated as a percent of net assets.
| ^ | United States allocation includes Short-Term Investment-Money Market Fund of 0.5% and Securities Held as Collateral on Loaned Securities of 7.6% |
| SCHEDULE OF SECURITIES SOLD SHORT as of December 31, 2019 |
The amount of $3,578,559 in cash was segregated with Interactive Brokers, LLC to cover the following securities sold short at December 31, 2019 and is disclosed as a portion of "Due from Broker"on the Fund’s Statement of Assets and Liabilities. Interactive Brokers, LLC is the counterparty to the below securities sold short.
| Shares | | | | Value | |
| Common Stock – (0.7)% | |
| Media – (0.7%) | |
| | 90,210 | | ANGI Homeservices, Inc. – | | | |
| | | | Class A (United States)(1) | | $ | (764,079 | ) |
| | 39,990 | | Match Group, Inc. (United States)(1) | | | (3,283,579 | ) |
| | |
| TOTAL SECURITIES SOLD SHORT | |
| (Proceeds $3,578,567) | | $ | (4,047,658 | ) |
(1)
| Non-income producing security. |
The accompanying notes are an integral part of these financial statements.
Evermore Global Value Fund
| SCHEDULE OF INVESTMENTS at December 31, 2019, Continued |
| SCHEDULE OF FORWARD FOREIGN CURRENCY CONTRACTS at December 31, 2019 |
As of December 31, 2019, the Fund had the following forward currency contracts outstanding:
| | | Currency to be Received | | | Currency to be Delivered | | | | |
| | | | | | | USD Value at | | | | | | | USD Value at | | | Net Unrealized | |
| | | | | | | December 31, | | | | | | | December 31, | | | Appreciation | |
| Settlement Date | | Amount | | Currency | | 2019 | | | Amount | | Currency | | 2019 | | | (Depreciation) | |
| 3/13/20 | | | 12,019,818 | | USD | | $ | 12,019,818 | | | | 1,297,900,000 | | JPY | | $ | 11,994,995 | | | $ | 24,823 | (a) |
| 3/13/20 | | | 200,000,000 | | JPY | | | 1,848,370 | | | | 1,845,614 | | USD | | | 1,845,614 | | | | 2,756 | (a) |
| 3/13/20 | | | 12,815,542 | | USD | | | 12,815,542 | | | | 9,715,000 | | GBP | | | 12,894,463 | | | | (78,921 | )(a) |
| 3/13/20 | | | 14,164,777 | | USD | | | 14,164,777 | | | | 18,740,000 | | CAD | | | 14,435,235 | | | | (270,458 | (a) |
| 3/13/20 | | | 72,848,935 | | USD | | | 72,848,935 | | | | 690,994,000 | | SEK | | | 74,034,482 | | | | (1,185,547 | )(a) |
| 3/13/20 | | | 28,582,087 | | USD | | | 28,582,087 | | | | 261,306,000 | | NOK | | | 29,770,472 | | | | (1,188,385 | )(a) |
| 3/13/20 | | | 126,083,538 | | USD | | | 126,083,538 | | | | 113,305,000 | | EUR | | | 127,677,940 | | | | (1,594,402 | (a) |
| | | | | | | | $ | 268,363,067 | | | | | | | | $ | 272,653,201 | | | $ | (4,290,134 | ) |
| CAD | Canadian Dollar |
| EUR | Euro |
| GBP | British Pound |
| JPY | Japanese Yen |
| NOK | Norwegian Krone |
| SEK | Swedish Krona |
| USD | U.S. Dollars |
(a) Counterparty: forward foreign currency contracts outstanding with Bank of New York Mellon.
The accompanying notes are an integral part of these financial statements.
Evermore Global Value Fund
| STATEMENT OF ASSETS AND LIABILITIES at December 31, 2019 |
| ASSETS | |
Investments in unaffiliated securities, at value (cost $505,432,764)(1) (Note 2) | | $ | 597,108,551 | |
| Investments in affiliated securities, at value (cost $49,514,643) (Notes 2 and 6) | | | 43,923,576 | |
| Unrealized appreciation on forward foreign currency contracts | | | 27,579 | |
| Receivables: | | | | |
| Investment securities sold | | | 186,271 | |
| Fund shares sold | | | 462,028 | |
| Dividends and interest, net of foreign withholding taxes | | | 130,468 | |
| Dividend withholding tax reclaims | | | 1,005,539 | |
| Due from broker | | | 6,539,973 | |
| Securities lending income | | | 26,834 | |
| Prepaid expenses | | | 65,904 | |
| Total assets | | | 649,476,723 | |
| | | | | |
| LIABILITIES | |
| Unrealized depreciation on forward foreign currency contracts | | | 4,317,713 | |
| Securities sold short (proceeds $3,578,567) | | | 4,047,658 | �� |
| Payables: | | | | |
| Fund shares redeemed | | | 285,435 | |
| Collateral for securities out on loan, at value | | | 45,082,574 | |
| Investment advisory fees | | | 474,782 | |
| Administration fees | | | 50,001 | |
| Custody fees | | | 13,610 | |
| Distribution fees – Investor Class | | | 13,683 | |
| Fund accounting fees | | | 1,803 | |
| Transfer agent fees | | | 27,819 | |
| Trustee fees | | | 16,741 | |
| Other accrued fees | | | 118,065 | |
| Total liabilities | | | 54,449,884 | |
| NET ASSETS | | $ | 595,026,839 | |
| | | | | |
| COMPONENTS OF NET ASSETS | |
| Paid-in capital | | $ | 510,026,935 | |
| Total distributable earnings | | | 84,999,904 | |
| Net assets | | $ | 595,026,839 | |
| | | | | |
| Investor Class: | | | | |
| Net assets | | $ | 61,295,620 | |
| Shares issued and outstanding (unlimited number of shares authorized without par value) | | | 4,298,861 | |
| Net asset value | | $ | 14.26 | |
| | | | | |
| Institutional Class: | | | | |
| Net assets | | $ | 533,731,219 | |
| Shares issued and outstanding (unlimited number of shares authorized without par value) | | | 37,201,747 | |
| Net asset value | | $ | 14.35 | |
(1)
| The market value of securities out on loan was $43,663,544 as of December 31, 2019. |
The accompanying notes are an integral part of these financial statements.
Evermore Global Value Fund
| STATEMENT OF OPERATIONS for the Year Ended December 31, 2019 |
| INVESTMENT INCOME | |
| Income | | | |
| Dividends (net of $867,897 foreign withholding taxes) | | | |
| Unaffiliated securities | | $ | 9,447,864 | |
| Interest, unaffiliated securities | | | 1,607,128 | |
| Securities lending income | | | 1,109,965 | |
| Total investment income | | | 12,164,957 | |
| | | | | |
| EXPENSES (Note 3) | |
| Investment advisory fees | | | 5,647,699 | |
| Administration fees | | | 308,308 | |
| Legal fees | | | 260,012 | |
| Transfer agent fees | | | 242,556 | |
| Distribution fees – Investor Class | | | 162,616 | |
| Custody fees | | | 88,941 | |
| Trustee fees | | | 85,539 | |
| Audit and tax fees | | | 78,292 | |
| Registration fees | | | 64,403 | |
| Chief Compliance Officer fees | | | 53,138 | |
| Shareholder reporting fees | | | 33,315 | |
| Insurance fees | | | 31,483 | |
| Miscellaneous fees | | | 30,568 | |
| Fund accounting fees | | | 10,615 | |
| Interest expense | | | 1,732 | |
| Total expenses | | | 7,099,217 | |
| Net investment income | | | 5,065,740 | |
| | | | | |
| REALIZED AND UNREALIZED GAIN (LOSS) ON INVESTMENTS, FOREIGN CURRENCIES, | |
| FORWARD FOREIGN CURRENCY CONTRACTS, SECURITIES SOLD SHORT & WRITTEN OPTIONS | |
| Net realized gain (loss) on: | | | | |
| Investments in unaffiliated securities | | | (11,633,297 | ) |
| Investments in affiliated securities | | | (6,264,344 | ) |
| Foreign currencies | | | (289,037 | ) |
| Forward foreign currency contracts | | | 18,306,893 | |
| Written options | | | 5,595,595 | |
| Change in net unrealized appreciation (depreciation) on: | | | | |
| Investments in unaffiliated securities | | | 108,367,075 | |
| Investments in affiliated securities | | | 14,671,259 | |
| Foreign currencies | | | (17,688 | ) |
| Forward foreign currency contracts | | | (5,210,023 | ) |
| Securities sold short | | | (469,091 | ) |
| Written options | | | (1,017,954 | ) |
| Net realized and unrealized gain (loss) on investments, foreign currencies, | | | | |
| forward foreign currency contracts, securities sold short & written options | | | 122,039,388 | |
| Net increase in net assets resulting from operations | | $ | 127,105,128 | |
The accompanying notes are an integral part of these financial statements.
Evermore Global Value Fund
| STATEMENTS OF CHANGES IN NET ASSETS |
| | | Year Ended | | | Year Ended | |
| | | December 31, | | | December 31, | |
| | | 2019 | | | 2018 | |
| INCREASE (DECREASE) IN NET ASSETS FROM: | |
| | |
| OPERATIONS | |
| Net investment income | | $ | 5,065,740 | | | $ | 3,728,387 | |
| Net realized gain on investments, foreign currency transactions, forward foreign | | | | | | | | |
| currency contracts, & written options | | | 5,715,810 | | | | 31,146,268 | |
| Change in unrealized appreciation (depreciation) on investments, foreign currency | | | | | | | | |
| transactions, forward foreign currency contracts, securities sold short & written options | | | 116,323,578 | | | | (180,708,140 | ) |
| Net increase (decrease) in net assets resulting from operations | | | 127,105,128 | | | | (145,833,485 | ) |
| | | | | | | | | |
| DISTRIBUTIONS TO SHAREHOLDERS (NOTE 5) | |
| Investor Class | | | (1,510,343 | ) | | | (1,213,232 | ) |
| Institutional Class | | | (14,602,798 | ) | | | (10,827,022 | ) |
| Total distributions to shareholders | | | (16,113,141 | ) | | | (12,040,254 | ) |
| | | | | | | | | |
| CAPITAL SHARE TRANSACTIONS | |
| Net increase (decrease) in net assets derived from net change in outstanding shares – | | | | | | | | |
| Investor Class | | | (15,128,035 | ) | | | 5,848,834 | |
| Net increase (decrease) in net assets derived from net change in outstanding shares – | | | | | | | | |
| Institutional Class | | | (8,325,084 | ) | | | 52,471,448 | |
| Total increase (decrease) in net assets from capital share transactions | | | (23,453,119 | ) | | | 58,320,282 | |
| Total increase (decrease) in net assets | | | 87,538,868 | | | | (99,553,457 | ) |
| | | | | | | | | |
| NET ASSETS | |
| Beginning of year | | | 507,487,971 | | | | 607,041,428 | |
| End of year | | $ | 595,026,839 | | | $ | 507,487,971 | |
| | | | | | | | | |
| | Summary of capital share transactions is as follows: | | | | | | |
| | | | | | | | |
| | | | Year Ended | | | Year Ended | |
| | | | December 31, 2019 | | | December 31, 2018 | |
| | Investor Class | | Shares | | | Value | | | Shares | | | Value | |
| | Shares sold | | | 1,040,687 | | | $ | 13,446,400 | | | | 1,927,474 | | | $ | 28,351,558 | |
| | Shares issued in reinvestment of distributions | | | 102,560 | | | | 1,411,232 | | | | 87,770 | | | | 1,130,481 | |
| | Shares redeemed1 | | | (2,280,470 | ) | | | (29,985,667 | ) | | | (1,668,783 | ) | | | (23,633,205 | ) |
| | Net increase (decrease) | | | (1,137,223 | ) | | $ | (15,128,035 | ) | | | 346,461 | | | $ | 5,848,834 | |
| | | | | | | | | | | | | | | | | | |
| | | | Year Ended | | | Year Ended | |
| | | | December 31, 2019 | | | December 31, 2018 | |
| | Institutional Class | | Shares | | | Value | | | Shares | | | Value | |
| | Shares sold | | | 8,376,165 | | | $ | 108,584,456 | | | | 11,578,120 | | | $ | 172,239,782 | |
| | Shares issued in reinvestment of distributions | | | 1,011,605 | | | | 14,000,619 | | | | 807,428 | | | | 10,464,265 | |
| | Shares redeemed2 | | | (9,900,079 | ) | | | (130,910,159 | ) | | | (9,554,844 | ) | | | (130,232,599 | ) |
| | Net increase (decrease) | | | (512,309 | ) | | $ | (8,325,084 | ) | | | 2,830,704 | | | $ | 52,471,448 | |
| | 1 | Net of redemption fees of $5,596 and $10,609, respectively. |
| | 2 | Net of redemption fees of $14,033 and $30,513, respectively. |
The accompanying notes are an integral part of these financial statements.
Evermore Global Value Fund
| FINANCIAL HIGHLIGHTS For a capital share outstanding throughout the year |
Investor Class*
| | | Year Ended December 31, | |
| | | 2019 | | | 2018 | | | 2017 | | | 2016 | | | 2015 | |
| Net asset value, beginning of year | | $ | 11.70 | | | $ | 15.08 | | | $ | 13.03 | | | $ | 11.18 | | | $ | 10.52 | |
| | | | | | | | | | | | | | | | | | | | | |
| INCOME (LOSS) FROM INVESTMENT OPERATIONS | |
| Net investment income (loss)** | | | 0.09 | | | | 0.06 | | | | (0.04 | ) | | | 0.11 | | | | 0.04 | |
| Net realized and unrealized gain (loss) on investments | | | 2.83 | | | | (3.16 | ) | | | 2.48 | | | | 1.86 | | | | 0.79 | |
| Total from investment operations | | | 2.92 | | | | (3.10 | ) | | | 2.44 | | | | 1.97 | | | | 0.83 | |
| | | | | | | | | | | | | | | | | | | | | |
| LESS DISTRIBUTIONS | |
| From net investment income | | | (0.10 | ) | | | (0.06 | ) | | | (0.03 | ) | | | (0.11 | ) | | | (0.11 | ) |
| Net realized gains | | | (0.26 | ) | | | (0.22 | ) | | | (0.36 | ) | | | (0.01 | ) | | | (0.06 | ) |
| Total distributions | | | (0.36 | ) | | | (0.28 | ) | | | (0.39 | ) | | | (0.12 | ) | | | (0.17 | ) |
| Paid-in capital from redemption fees | | | 0.00 | 1 | | | 0.00 | 1 | | | 0.00 | 1 | | | 0.00 | 1 | | | 0.00 | 1 |
| Net asset value, end of year | | $ | 14.26 | | | $ | 11.70 | | | $ | 15.08 | | | $ | 13.03 | | | $ | 11.18 | |
| Total return | | | 25.05 | % | | | (21.07 | )% | | | 18.72 | % | | | 17.68 | % | | | 7.88 | % |
| | | | | | | | | | | | | | | | | | | | | |
| SUPPLEMENTAL DATA | |
| Net assets, end of year (thousands) | | $ | 61,296 | | | $ | 63,584 | | | $ | 76,772 | | | $ | 60,826 | | | $ | 42,624 | |
| Portfolio turnover rate | | | 28 | % | | | 29 | % | | | 26 | % | | | 59 | % | | | 57 | % |
| | | | | | | | | | | | | | | | | | | | | |
RATIO OF EXPENSES TO AVERAGE NET ASSETS2 | |
| Before expenses absorbed or recouped, including | | | | | | | | | | | | | | | | | | | | |
| interest and dividend expense | | | 1.47 | % | | | 1.44 | % | | | 1.50 | % | | | 1.51 | % | | | 1.73 | % |
| Before expenses absorbed or recouped, excluding | | | | | | | | | | | | | | | | | | | | |
| interest and dividend expense | | | 1.47 | % | | | 1.44 | % | | | 1.46 | % | | | 1.49 | % | | | 1.55 | % |
| After expenses absorbed or recouped, including | | | | | | | | | | | | | | | | | | | | |
| interest and dividend expense | | | 1.47 | % | | | 1.44 | % | | | 1.50 | % | | | 1.51 | % | | | 1.73 | % |
| After expenses absorbed or recouped, excluding | | | | | | | | | | | | | | | | | | | | |
| interest and dividend expense | | | 1.47 | % | | | 1.44 | % | | | 1.46 | % | | | 1.49 | % | | | 1.55 | % |
| | | | | | | | | | | | | | | | | | | | |
RATIO OF NET INVESTMENT INCOME (LOSS) TO AVERAGE NET ASSETS2 | |
| Before expenses absorbed or recouped, including | | | | | | | | | | | | | | | | | | | | |
| interest and dividend expense | | | 0.69 | % | | | 0.35 | % | | | (0.29 | )% | | | 0.95 | % | | | 0.35 | % |
| After expenses absorbed or recouped, including | | | | | | | | | | | | | | | | | | | | |
| interest and dividend expense | | | 0.69 | % | | | 0.35 | % | | | (0.29 | )% | | | 0.95 | % | | | 0.35 | % |
Portfolio turnover is calculated for the Fund as a whole.
| | * | Prior to April 30, 2015, Investor Class shares were known as Class A shares. |
| | **
| Calculated using the average shares outstanding method. |
| | 1 | Amount less than $0.01. |
| | 2 | Does not include expenses of the investment companies in which the Fund invests. |
The accompanying notes are an integral part of these financial statements.
Evermore Global Value Fund
| FINANCIAL HIGHLIGHTS For a capital share outstanding throughout the year, Continued |
Institutional Class*
| | | Year Ended December 31, | |
| | | 2019 | | | 2018 | | | 2017 | | | 2016 | | | 2015 | |
| Net asset value, beginning of year | | $ | 11.77 | | | $ | 15.20 | | | $ | 13.10 | | | $ | 11.24 | | | $ | 10.57 | |
| | | | | | | | | | | | | | | | | | | | | |
| INCOME (LOSS) FROM INVESTMENT OPERATIONS | |
| Net investment income (loss)** | | | 0.12 | | | | 0.09 | | | | (0.00 | )1 | | | 0.14 | | | | 0.07 | |
| Net realized and unrealized gain (loss) on investments | | | 2.86 | | | | (3.30 | ) | | | 2.49 | | | | 1.87 | | | | 0.79 | |
| Total from investment operations | | | 2.98 | | | | (3.21 | ) | | | 2.49 | | | | 2.01 | | | | 0.86 | |
| | | | | | | | | | | | | | | | | | | | | |
| LESS DISTRIBUTIONS | |
| From net investment income (loss) | | | (0.14 | ) | | | 0.00 | 1 | | | (0.03 | ) | | | (0.14 | ) | | | (0.13 | ) |
| Net realized gains | | | (0.26 | ) | | | (0.22 | ) | | | (0.36 | ) | | | (0.01 | ) | | | (0.06 | ) |
| Total distributions | | | (0.40 | ) | | | (0.22 | ) | | | (0.39 | ) | | | (0.15 | ) | | | (0.19 | ) |
| Paid-in capital from redemption fees | | | 0.00 | 1 | | | 0.00 | 1 | | | 0.00 | 1 | | | 0.00 | 1 | | | 0.00 | 1 |
| Net asset value, end of year | | $ | 14.35 | | | $ | 11.77 | | | $ | 15.20 | | | $ | 13.10 | | | $ | 11.24 | |
| Total return | | | 25.41 | % | | | (20.92 | )% | | | 19.01 | % | | | 17.94 | % | | | 8.18 | % |
| | | | | | | | | | | | | | | | | | | | | |
| SUPPLEMENTAL DATA | |
| Net assets, end of year (thousands) | | $ | 533,731 | | | $ | 443,904 | | | $ | 530,269 | | | $ | 331,488 | | | $ | 262,927 | |
| Portfolio turnover rate | | | 28 | % | | | 29 | % | | | 26 | % | | | 59 | % | | | 57 | % |
| | | | | | | | | | | | | | | | | | | | | |
RATIO OF EXPENSES TO AVERAGE NET ASSETS2 | |
| Before expenses absorbed or recouped, including | | | | | | | | | | | | | | | | | | | | |
| interest and dividend expense | | | 1.22 | % | | | 1.19 | % | | | 1.25 | % | | | 1.26 | % | | | 1.48 | % |
| Before expenses absorbed or recouped, excluding | | | | | | | | | | | | | | | | | | | | |
| interest and dividend expense | | | 1.22 | % | | | 1.19 | % | | | 1.21 | % | | | 1.24 | % | | | 1.31 | % |
| After expenses absorbed or recouped, including | | | | | | | | | | | | | | | | | | | | |
| interest and dividend expense | | | 1.22 | % | | | 1.19 | % | | | 1.25 | % | | | 1.26 | % | | | 1.48 | % |
| After expenses absorbed or recouped, excluding | | | | | | | | | | | | | | | | | | | | |
| interest and dividend expense | | | 1.22 | % | | | 1.19 | % | | | 1.21 | % | | | 1.24 | % | | | 1.31 | % |
| | | | | | | | | | | | | | | | | | | | | |
RATIO OF NET INVESTMENT INCOME (LOSS) TO AVERAGE NET ASSETS2 | |
| Before expenses absorbed or recouped, including | | | | | | | | | | | | | | | | | | | | |
| interest and dividend expense | | | 0.91 | % | | | 0.60 | % | | | (0.02 | )% | | | 1.20 | % | | | 0.60 | % |
| After expenses absorbed or recouped, including | | | | | | | | | | | | | | | | | | | | |
| interest and dividend expense | | | 0.91 | % | | | 0.60 | % | | | (0.02 | )% | | | 1.20 | % | | | 0.60 | % |
Portfolio turnover is calculated for the Fund as a whole.
| | * | Prior to April 30, 2015, Institutional Class shares were known as Class I shares. |
| | **
| Calculated using the average shares outstanding method. |
| | 1 | Amount less than $0.01. |
| | 2 | Does not include expenses of the investment companies in which the Fund invests. |
The accompanying notes are an integral part of these financial statements.
Evermore Global Value Fund
| NOTES TO FINANCIAL STATEMENTS December 31, 2019 |
The Evermore Global Value Fund (the "Fund") is a series of shares of Evermore Funds Trust (the "Trust"), which is registered under the Investment Company Act of 1940, as amended (the "1940 Act") as an open-end diversified management investment company. The Fund commenced operations on January 1, 2010. Evermore Global Advisors, LLC (the "Adviser") serves as the investment adviser to the Fund.
The investment objective of the Fund is to seek capital appreciation by investing in securities from markets around the world, including U.S. markets.
The Fund is an investment company and accordingly follows the investment company accounting and reporting guidance of the Financial Accounting Standards Board ("FASB") Accounting Standard Codification Topic 946 "Financial Services-Investment Companies."
The Fund offers Investor Class and Institutional Class shares. Each class of shares has equal rights as to earnings and assets except that each class bears different distribution expenses. Each class of shares has exclusive voting rights with respect to matters that affect just that class. Income, expenses (other than expenses attributable to a specific class), and realized and unrealized gains or losses on investments are allocated to each class of shares based on its relative net assets. Investor Class shares have no sales charge. Institutional Class shares have no sales charge and are offered primarily for direct investment by investors such as pension and profit sharing plans, employee benefit trusts, certain financial intermediaries, endowments, foundations and corporations. For Investor Class and Institutional Class shares, the offering and redemption price per share for the Fund is equal to the Fund’s net asset value per share. The Fund charges a 2.00% redemption fee on shares (both Investor Class and Institutional Class) held less than 90 days. Prior to April 30, 2015, Investor Class shares were known as Class A and Institutional Class shares were known as Class I shares.
| NOTE 2 – SIGNIFICANT ACCOUNTING POLICIES |
The following is a summary of significant accounting policies consistently followed by the Fund. These policies are in conformity with U.S. generally accepted accounting principles ("U.S. GAAP").
| A. | Investment Valuation and Fair Value Measurement. All domestic equity securities that are traded on a national securities exchange, except those listed on the National Association of Securities Dealers Automated Quotation System ("NASDAQ") Global Market¨ are valued at the last reported sale price on the exchange on which the security is principally traded. Securities traded on NASDAQ will be valued at the NASDAQ Official Closing Price on each business day. If, on a particular day, an exchange-traded or NASDAQ security does not trade, then the mean between the most recent quoted bid and ask prices will be used, except on days when the ask price is more than 10% greater than the bid price. In such instances, the Adviser will price the security based on the fair value determined by the Adviser’s Valuation Committee. All equity securities that are not traded on a listed exchange are valued at the last sale price in the over-the-counter ("OTC") market. If a non-exchange traded security does not trade on a particular day, then the mean between the last quoted closing bid and ask price will be used, except on days when the ask price is more than 10% greater than the bid price. In such instances, the Adviser will price the security based on the fair value determined by the Adviser’s Valuation Committee. |
| | The Fund invests substantially in securities traded on foreign exchanges (see "Foreign Currency Translation"below). Investments that are primarily traded on foreign exchanges are generally valued in their local currencies as of the close of their primary exchange or market, or if there were no transactions on such day, at the mean between the bid and ask prices, except on days when the ask price is more than 10% greater than the bid price. In such instances, the Adviser will price the security based on the fair value determined by the Adviser’s Valuation Committee. The local prices are converted to U.S. dollars using the applicable currency exchange rates as of the close of the New York Stock Exchange ("NYSE"). Exchange rates are provided daily by recognized independent pricing agents. Foreign currency forward contracts are valued at the current day’s interpolated foreign exchange rate, as calculated using the current day’s exchange rate, and the relevant forward rates provided by an independent pricing service. |
| | There may be less publicly available information about a foreign company than about a U.S. company. Foreign issuers may not be subject to accounting, auditing and financial reporting standards and requirements comparable to, or as uniform as, those of U.S. issuers. The number of securities traded, and the frequency of such trading, in non-U.S. securities markets, while growing in volume, is for the most part, substantially less in U.S. markets. As a result, securities of many foreign issuers may be less liquid and their prices more volatile than securities of comparable U.S. issues. Transaction costs, the costs associated with buying and selling securities on non-U.S. securities markets may be higher than in the U.S. There is generally less government supervision and regulation of exchanges, brokers and issuers than there is in the U.S. The Fund’s foreign investments may include both voting and non-voting securities, sovereign debt and participations in foreign government deals. The Fund may have greater difficulty taking appropriate legal action with respect to foreign issuers in U.S. courts. |
| | For foreign securities traded on foreign exchanges, the Trust has selected Intercontinental Exchange’s Fair Value Information Services ("FVIS") to provide pricing data with respect to foreign security holdings held by the Fund. The use of this third-party pricing service is designed to capture events occurring after a foreign exchange closes that may affect the value of certain holdings of the Fund’s |
Evermore Global Value Fund
NOTES TO FINANCIAL STATEMENTS December 31, 2019, Continued
|
| | securities traded on those foreign exchanges. The Fund utilizes a "trigger level", which is a pre-determined percentage move in a specified index that must occur before foreign securities will be fair value priced using FVIS prices. The Fund utilizes a "confidence interval"when determining the use of the FVIS prices. The confidence interval is a measure of the historical relationship that each foreign exchange traded security has to movements in various indices and the price of the security’s corresponding American Depositary Receipt, if one exists. FVIS provides the confidence interval for each security for which it provides a price. If the FVIS provided price falls within the confidence interval, the Fund will value the particular security at that price. If the FVIS provided price does not fall within the confidence interval, the particular security will be valued at the preceding closing price on its respective foreign exchange, or if there were no transactions on such day, at the mean between the bid and asked prices. There were no foreign equities fair valued using FVIS as of December 31, 2019. |
| | |
| | Securities for which quotations are not readily available are valued at their respective fair values as determined in good faith by the Advisor’s Valuation Committee. When a security is "fair valued,"consideration is given to the facts and circumstances relevant to the particular situation, including a review of various factors set forth in the pricing procedures adopted by the Fund’s Board of Trustees ("Board"). Fair value pricing is an inherently subjective process, and no single standard exists for determining fair value. Different funds could reasonably arrive at different values for the same security. The use of fair value pricing by a fund may cause the net asset value of its shares to differ significantly from the net asset value that would be calculated without regard to such considerations. The use of fair value pricing is approved by the Board, and is in accordance with the provisions of the 1940 Act. |
| | |
| | As described above, the Fund utilizes various methods to measure the fair value of its investments on a recurring basis. U.S. GAAP establishes a hierarchy that prioritizes inputs to valuation methods. The three levels of inputs are: |
| | Level 1 — | Unadjusted quoted prices in active markets for identical assets or liabilities that the Fund has the ability to access. The types of assets generally included in this category are domestic equities listed in active markets and foreign equities listed in active markets that have not been fair valued using FVIS. |
| | | |
| | Level 2 — | Observable inputs other than quoted prices included in Level 1 that are observable for the asset or liability, either directly or indirectly. These inputs may include quoted prices for the identical instrument on an inactive market, prices for similar instruments, interest rates, credit risk, yield curves and similar data. The types of assets generally included in this category are bonds, financial instruments classified as derivatives and foreign equities fair valued using FVIS. |
| | | |
| | Level 3 — | Significant unobservable inputs that are supported by limited or no market activity. Level 3 may include financial instruments whose values are determined using indicative market quotes or required significant management judgment or estimation. These unobservable valuation inputs may include estimates for current yields, maturity/duration, prepayment speed, default rates and indicative market quotes for comparable investments along with other assumptions relating to credit quality, collateral value, complexity of the investment structure, general market conditions and liquidity. This category may also include investments where trading has been halted or there are certain restrictions on trading. While these investments are priced using unobservable inputs, the valuation of these investments reflects the best available data and management believes the prices are a reasonable representation of exit price. |
| | The availability of observable inputs can vary from security to security and is affected by a wide variety of factors, including, for example, the type of security, whether the security is new and not yet established in the marketplace, the liquidity of markets, and other characteristics particular to the security. To the extent that valuation is based on models or inputs that are less observable or unobservable in the market, the determination of fair value requires more judgment. Accordingly, the degree of judgment exercised in determining fair value is greatest for instruments categorized in Level 3. |
| | |
| | The inputs used to measure fair value may fall into different levels of the fair value hierarchy. In such cases, for disclosure purposes, the level in the fair value hierarchy within which the fair value measurement falls in its entirety, is determined based on the lowest level input that is significant to the fair value measurement in its entirety. |
Evermore Global Value Fund
NOTES TO FINANCIAL STATEMENTS December 31, 2019, Continued
|
| | The inputs or methodology used for valuing securities are not necessarily an indication of the risk associated with investing in those securities. The following is a summary of the level inputs used to value the Fund’s net assets as of December 31, 2019 (see Schedule of Investments for industry breakout): |
| | Assets | | Level 1 | | | Level 2 | | | Level 3 | | | Total | |
| | Common Stocks | | $ | 569,935,658 | | | $ | — | | | $ | 8,268,846 | | | $ | 578,204,504 | |
| | Corporate Obligations | | | ��� | | | | 12,550,693 | | | | — | | | | 12,550,693 | |
| | Warrants | | | — | | | | — | | | | 441,939 | | | | 441,939 | |
| | Call Options Purchased | | | — | | | | 1,863,608 | | | | — | | | | 1,863,608 | |
| | Put Options Purchased | | | — | | | | 5,000 | | | | — | | | | 5,000 | |
| | Short-Term Investments | | | 2,883,809 | | | | — | | | | — | | | | 2,883,809 | |
| | Securities Held as Collateral | | | | | | | | | | | | | | | | |
| | on Loaned Securities | | | 45,082,574 | | | | — | | | | — | | | | 45,082,574 | |
| | Total Investments in Securities | | | 617,902,041 | | | | 14,419,301 | | | | 8,710,785 | | | | 641,032,127 | |
| | Unrealized appreciation on | | | | | | | | | | | | | | | | |
| | Forward Foreign Currency* | | | — | | | | 27,579 | | | | — | | | | 27,579 | |
| | Total Assets | | $ | 617,902,041 | | | $ | 14,446,880 | | | $ | 8,710,785 | | | $ | 641,059,706 | |
| | | | | | | | | | | | | | | | | | |
| | Liabilities | | | | | | | | | | | | | | | | |
| | Securities Sold Short* | | $ | 4,047,658 | | | $ | — | | | $ | — | | | $ | 4,047,658 | |
| | Unrealized depreciation on | | | | | | | | | | | | | | | | |
| | Forward Foreign Currency* | | | — | | | | 4,317,713 | | | | — | | | | 4,317,713 | |
| | Total Liabilities | | $ | 4,047,658 | | | $ | 4,317,713 | | | $ | — | | | $ | 8,365,371 | |
| | * Forward foreign currency contracts are reflected at the unrealized appreciation (depreciation), while securities sold short are reflected at value. |
| | Below is a reconciliation of Level 3 assets for which significant unobservable inputs were used to determine fair value: | |
| | | | Common | | | | |
| | Description | | Stocks | | | Warrants | |
| | Balance as of January 1, 2019 | | $ | 27,379,284 | | | $ | 103,975 | |
| | Purchases | | | 3,147,737 | | | | — | |
| | Sales proceeds and paydowns | | | (29,873 | ) | | | — | |
| | Realized gain (loss) | | | (106,079 | ) | | | — | |
| | Change in unrealized appreciation (depreciation) | | | (17,054,653 | ) | | | 337,964 | |
| | Transfers into/(out of) Level 3 | | | (5,067,570 | )(a) | | | — | |
| | Balance as of December 31, 2019 | | $ | 8,268,846 | | | $ | 441,939 | |
| | Change in unrealized appreciation (depreciation) during | | | | | | | | |
| | the year for Level 3 investments held at December 31, 2019. | | $ | (11,376,369 | ) | | $ | 337,964 | |
| | (a) | One common stock transferred from Level 2 to Level 3 due to a lack of observable market data resulting from a decrease in market activity for the security. One common stock transferred from Level 3 to Level 1 due to observable market data after completion of an initial public offering, resulting in observable market data being available for this security. |
| | The Level 3 amounts disclosed in the table above consist of three securities that are fair valued in good faith, using significant unobservable inputs, by the Adviser’s Valuation Committee. The table below indicates the quantitative information about Level 3 fair value measurements for these securities: |
| | | | | | | Market Value |
| | | | Valuation | Unobservable | | Impact if Input |
| | Investment Type | Fair Value | Methodology | Input Type | Inputs | Increases |
| | Common Stock | $7,057,913 | Market Approach | Last available 10 day Volume Weighted | 2.456 EUR | Increase |
| | | | | Average Price ("VWAP") trades | | |
| | | | | | | |
| | Common Stock | 1,210,933 | Market Approach | Last available 10 day VWAP trades | 1.5 NOK | Increase |
| | | | | | | |
| | Warrant | 441,939 | Options pricing model | Illiquidity discount rate | 25.00% | Decrease |
| | | | | Default rate | 6.90% | Decrease |
| B. | Option Writing. Writing options may permit the writer to generate additional income in the form of the premium received for writing the option. The writer of an option may have no control over when the underlying reference instruments must be sold (in the case of a call option) or purchased (in the case of a put option) because the writer may be notified of exercise at any time prior to the expiration of the option (for American style options). In general, though, options are infrequently exercised prior to expiration. Whether or not |
Evermore Global Value Fund
| NOTES TO FINANCIAL STATEMENTS December 31, 2019, Continued |
| | an option expires unexercised, the writer retains the amount of the premium. Writing "covered" call options means that the writer owns the underlying reference instrument that is subject to the call option. Call options may also be written on reference instruments that the writer does not own. |
| | |
| | When a Fund writes an option, an amount equal to the premium received by the Fund is recorded as a liability and is subsequently adjusted to the current fair value of the option written. Premiums received from writing options that expire unexercised are treated by the Fund on the expiration date as realized gains from investments. The difference between the premium received and the amount paid for the closing purchase transaction, including brokerage commissions, is also treated as a realized gain, or, if the premium is less than the amount paid for the closing purchase transaction, as a realized loss. If a call option is exercised, the premium is added to the proceeds from the sale of the underlying security or currency in determining whether the Fund has realized a gain or loss. If a put option is exercised, the premium reduces the cost basis of the securities purchased by the Fund. The Fund as writer of an option bears the market risk of an unfavorable change in the price of the security underlying the written option. |
| | |
| C. | Financial Derivative Instruments. The Fund may use derivative instruments for risk management purposes and as part of its investment strategies. Generally, derivatives are financial instruments whose value depends on, or is derived from, the value of one or more underlying assets, reference rates, or indices (a "reference instrument") and may relate to stocks, bonds, interest rates, currencies, commodities or related indices. Derivative instruments allow the Fund to gain or reduce exposure to the value of a reference instrument without actually owning or selling the instrument. |
| | |
| | Derivative instruments may be used for "hedging," which means that they may be used when the Adviser seeks to protect the Fund’s investments from a decline in value resulting from changes to interest rates, market prices, currency fluctuations or other market factors. Derivative instruments may also be used for other purposes, including to seek to increase liquidity, provide efficient portfolio management, broaden investment opportunities (including taking short or negative positions), implement a tax or cash management strategy, gain exposure to a particular security or segment of the market, modify the effective duration of the Fund’s portfolio investments and/or enhance total return. However derivative instruments are used, their successful use is not assured and will depend upon, among other factors, the Adviser’s ability to gauge relevant market movements. |
| | |
| | During the year ended December 31, 2019, the Fund hedged most of its currency exposure through the use of forward foreign currency contracts. During the year, these forward foreign currency contracts have contributed positively to Fund performance. The Fund also invests a small portion of its assets in options to hedge portfolio tail risk. The Advisor views these as "disability insurance", for times when global markets experience significant volatility. These options negatively affected Fund performance during the year. |
| | |
| | Statement of Assets and Liabilities |
| | |
| | The following table shows the fair value of derivative instruments as of December 31, 2019 and their location on the Fund’s Statement of Assets and Liabilities: |
| | | Asset Derivatives | | Liability Derivatives | |
| | Derivative | Statement of Assets | | | | Statement of Assets | | | |
| | Instruments | and Liabilities Location | | Value | | and Liabilities Location | | Value | |
| | Foreign Exchange Contracts – | Unrealized appreciation on | | | | Unrealized depreciation on | | | |
| | Forward foreign currency contracts | forward foreign | | | | forward foreign | | | |
| | | currency contracts | | $ | 27,579 | | currency contracts | | $ | (4,317,713 | ) |
| | Equity Contracts – Options | Investments in unaffiliated | | | | | | | | | |
| | | securities, at value | | | 1,868,608 | | Written options, at value | | | — | |
| | Total | | | $ | 1,896,187 | | | | $ | (4,317,713 | ) |
| | Statement of Operations |
| | |
| | The following table shows the effect of derivative instruments on the Statement of Operations for the year ended December 31, 2019: |
| | | | Amount of Realized Gain (Loss) on | |
| | | | Derivatives Recognized in Income | |
| | | | Forward | | | | | | | | | | |
| | | | Foreign | | | | | | | | | | |
| | | | Currency | | | Written | | | Purchased | | | | |
| | | | Contracts | | | Options | | | Options* | | | Total | |
| | Foreign Exchange Contracts | | $ | 18,306,893 | | | $ | 14,870 | | | $ | (463,190 | ) | | $ | 17,858,573 | |
| | Equity Contracts | | | — | | | | 5,580,725 | | | | (14,188,016 | ) | | | (8,607,291 | ) |
| | Total | | $ | 18,306,893 | | | $ | 5,595,595 | | | $ | (14,651,206 | ) | | $ | 9,251,282 | |
| | * | Included in net realized gain (loss) on investments in unaffiliated securities as reported on the Statement of Operations. |
Evermore Global Value Fund
| NOTES TO FINANCIAL STATEMENTS December 31, 2019, Continued |
| | | | Change in Unrealized Appreciation | |
| | | | or (Depreciation) on | |
| | | | Derivatives Recognized in Income | |
| | | | Forward | | | | | | | | | | |
| | | | Foreign | | | | | | | | | | |
| | | | Currency | | | Written | | | Purchased | | | | |
| | | | Contracts | | | Options | | | Options* | | | Total | |
| | Foreign Exchange Contracts | | $ | (5,210,023 | ) | | $ | (9,120 | ) | | $ | 223,850 | | | $ | (4,995,293 | ) |
| | Equity Contracts | | | — | | | | (1,008,834 | ) | | | 1,439,935 | | | | 431,101 | |
| | Total | | $ | (5,210,023 | ) | | $ | (1,017,954 | ) | | $ | 1,663,785 | | | $ | (4,564,192 | ) |
| | * | Included in change in net unrealized appreciation (depreciation) on investments in unaffiliated securities as reported on the Statement of Operations. |
| | The average monthly value outstanding of purchased and written options during the year ended December 31, 2019 were as follows: |
| | Purchased Options | | $ | 2,077,355 | |
| | Written Options | | $ | (345,432 | ) |
| | The average monthly notional value outstanding of forward foreign currency contracts during the year ended December 31, 2019 was $301,741,037. |
| | |
| D. | Principal Risks from the Investments. |
| | |
| | Currency Exchange Rate Risk – Foreign securities may be issued and traded in foreign currencies. As a result, their values may be affected by changes in exchange rates between foreign currencies and the U.S. dollar, as well as between currencies of countries other than the U.S. For example, if the value of the U.S. dollar goes up compared to a foreign currency, an investment traded in that foreign currency will go down in value because it will be worth fewer U.S. dollars. The Fund may also employ strategies intended to increase exposure to certain currencies. Such currency transactions involve additional risks, and the Fund’s strategies, if unsuccessful, may decrease the value of the Fund. |
| | Derivative Investment Risk – Derivatives are subject to a number of risks, such as interest rate risk, market risk, credit risk, and foreign exchange risk. Changes in the value of the derivative may not correlate perfectly with the underlying asset, rate or index, and the Fund may lose more money than its initial investment in the derivative. A small investment in a derivative could have a relatively large positive or negative impact on the performance of the Fund, potentially resulting in losses to Fund shareholders. |
| | Emerging Market Risk – The risks of foreign investments in emerging market countries may involve risks greater than, or in addition to, the risks of investing in more developed countries. Emerging markets are generally smaller, less developed, less liquid, and more volatile than developed markets. For example, political and economic structures in these countries may be less established and may change rapidly. These countries also are more likely to experience high levels of inflation, deflation or currency devaluation, which can harm their economies and securities markets and increase volatility. In fact, short-term volatility in these markets and declines of 50% or more are not uncommon. Restrictions on currency trading that may be imposed by emerging market countries will have an adverse effect on the value of the securities of companies that trade or operate in such countries. |
| | Foreign Securities Risk – Securities of companies located outside the U.S. involve additional risks that can increase the potential for losses in the Fund to the extent that it invests in these securities. Investments in foreign securities may be affected by currency controls and exchange rates; different accounting, auditing, financial reporting, and legal standards and practices; expropriation; changes in tax policy; greater market volatility; differing securities market structures; higher transaction costs; and various administrative difficulties, such as delays in clearing and settling portfolio transactions or in receiving payment of dividends. Certain of these risks also may apply to securities of U.S. companies with significant foreign operations. These risks can increase the potential for losses in the Fund and affect its share price. To the extent that the Fund’s assets are significantly invested in a single country or geographic region, the Fund will be subject to the risks associated with that particular country or region. |
| | Industrials Sector Risk – The Fund may invest to a significant extent in the industrials sector of the economy. The value of securities issued by companies in the industrials sector may be adversely affected by supply and demand related to their specific products or services and industrials sector products in general. The products of manufacturing companies may face obsolescence due to rapid technological developments and frequent new product introduction. Government regulations, world events, economic conditions and exchange rates may adversely affect the performance of companies in the industrials sector. Companies in the industrials sector may be adversely affected by liability for environmental damage and product liability claims. The industrials sector may also be adversely affected by changes or trends in commodity prices, which may be influenced by unpredictable factors. |
| E. | Offsetting Assets and Liabilities. The Fund is subject to various Master Netting Arrangements, which govern the terms of certain transactions with select counterparties. The Master Netting Arrangements allow the Fund to close out and net its total exposure to a |
Evermore Global Value Fund
| NOTES TO FINANCIAL STATEMENTS December 31, 2019, Continued |
| | counterparty in the event of a default with respect to all the transactions governed under a single agreement with a counterparty. The Master Netting Arrangements also specify collateral posting arrangements at pre-arranged exposure levels. Under the Master Netting Arrangements, collateral is routinely transferred if the total net exposure to certain transactions (net of existing collateral already in place) governed under the relevant Master Netting Arrangement with a counterparty in a given account exceeds a specified threshold depending on the counterparty and the type of Master Netting Arrangement. |
| | The table below, as of December 31, 2019, discloses both gross information and net information about instruments and transactions eligible for offset in the Statement of Assets and Liabilities and instruments and transactions that are subject to an agreement similar to a master netting agreement, as well as amounts related to collateral held at clearing brokers and counterparties. For financial reporting purposes, the Fund does not offset derivative assets and liabilities, and any related collateral received or pledged, on the Statement of Assets and Liabilities. |
| | |
| | Assets |
| | | | | | | | | | | | | Gross Amounts not | | | | |
| | | | | | | | | | | | | offset in the Statement of | | | | |
| | | | Gross | | | Gross | | | Net | | | Assets and Liabilities | | | | |
| | | | Amounts | | | Amounts | | | Amounts | | | | | | | | | | |
| | | | Presented | | | Offset | | | Presented | | | | | | | | | | |
| | | | in | | | in the | | | in the | | | | | | | | | | |
| | | | Statement | | | Statement | | | Statement | | | | | | | | | | |
| | | | of Assets | | | of Assets | | | of Assets | | | | | | | | | | |
| | Description/ | | | & | | | and | | | and | | | Financial | | | Collateral | | | Net | |
| | Counterparty | | Liabilities | | | Liabilities | | | Liabilities | | | Instruments | | | Received | | | Amount | |
| | Securities out on loan | | | | | | | | | | | | | | | | | | | |
| | Bank of New York | | $ | 20,192,357 | | | $ | — | | | $ | 20,192,357 | | | $ | — | | | $ | (20,192,357 | )1 | | $ | — | |
| | U.S. Bank N.A. | | | 23,471,187 | | | | — | | | | 23,471,187 | | | | — | | | | (23,471,187 | )2 | | | — | |
| | Forward Foreign | | | | | | | | | | | | | | | | | | | | | | | | |
| | Currency Contracts | | | | | | | | | | | | | | | | | | | | | | | | |
| | Bank of New York | | | 27,579 | | | | — | | | | 27,579 | | | | (27,579 | ) | | | — | | | | — | |
| | | | $ | 43,691,123 | | | $ | — | | | $ | 43,691,123 | | | $ | (27,579 | ) | | $ | (43,663,544 | ) | | $ | — | |
| | | | | | | | | | | | | | | | | | | | | | | | | | |
| | Liabilities | | | | | | | | | | | | | | Gross Amounts not | | | | | |
| | | | | | | | | | | | | | | | offset in the Statement | | | | | |
| | | | Gross | | | | | | | Net | | | of Assets and Liabilities | | | | | |
| | | | Amounts | | | | | | | Amounts | | | | | | | | | | | | | |
| | | | Presented | | | | | | | Presented | | | | | | | | | | | | | |
| | | | in | | | Financial | | | in the | | | | | | | | | | | | | |
| | | | Statement | | | Instruments | | | Statement | | | | | | | | | | | | | |
| | | | of Assets | | | with | | | of | | | | | | | | | | | | | |
| | Description/ | | | & | | | Allowable | | | Assets and | | | Financial | | | Collateral | | | Net | |
| | Counterparty | | Liabilities | | | Netting | | | Liabilities | | | Instruments | | | Pledged | | | Amount | |
| | Forward Foreign | | | | | | | | | | | | | | | | | | | | | | | | |
| | Currency Contracts | | | | | | | | | | | | | | | | | | | | | | | | |
| | Bank of New York | | $ | 4,317,713 | | | $ | — | | | $ | 4,317,713 | | | $ | (27,579 | ) | | $ | — | | | $ | 4,290,134 | |
| | Securities Sold Short | | | | | | | | | | | | | | | | | | | | | | | | |
| | Interactive Brokers, LLC | | | 4,047,658 | | | | — | | | | 4,047,658 | | | | — | | | | (4,047,658 | ) | | | — | |
| | | | $ | 8,365,371 | | | $ | — | | | $ | 8,365,371 | | | $ | (27,579 | ) | | $ | (4,047,658 | ) | | $ | 4,290,134 | |
| | 1 | The Fund received cash collateral of $21,207,691, which was subsequently invested in the Dreyfus Government Cash Management – Investor Class as reported in the Schedule of Investments. |
| | 2 | The Fund received cash collateral of $23,874,883, which was subsequently invested in the First American Government Obligations Fund – Class Y as reported in the Schedule of Investments. |
| | In some instances, the collateral amounts disclosed in the tables were adjusted due to the requirement to limit the collateral amounts to avoid the effect of overcollateralization. Actual collateral received/pledged may be more than the amounts disclosed herein. |
| | |
| F. | Foreign Currency Translation – Investment securities and other assets and liabilities denominated in foreign currencies are translated into U.S. dollar amounts at the date of valuation. Purchases and sales of investment securities and income and expense items denominated in foreign currencies are translated into U.S. dollar amounts on the respective dates of such transactions. |
| | The Fund does not isolate that portion of the results of operations resulting from changes in foreign exchange rates on investments from the fluctuations arising from changes in market prices of securities held. Such fluctuations are included with the net realized and unrealized gain or loss from investments. |
Evermore Global Value Fund
| NOTES TO FINANCIAL STATEMENTS December 31, 2019, Continued |
| | The Fund reports net realized foreign exchange gains or losses that arise from sales of foreign currencies, currency gains or losses realized between the trade and settlement dates on securities transactions, and the difference between the amounts of dividends, interest, and foreign withholding taxes recorded on the Fund’s books and the U.S. dollar equivalent of the amounts actually received or paid. Net unrealized foreign exchange gains and losses arise from changes in the fair values of assets and liabilities, other than investments in securities at fiscal year end, resulting from changes in exchange rates. |
| | |
| G. | Federal Income Taxes – The Fund has elected to be taxed as a "regulated investment company"and intends to distribute substantially all taxable income to its shareholders and otherwise comply with the provisions of Subchapter M of the Internal Revenue Code applicable to regulated investment companies. Therefore, no provision for federal income taxes or excise taxes has been made. |
| | |
| | In order to avoid imposition of the excise tax applicable to regulated investment companies, the Fund intends to declare each year as dividends in each calendar year at least 98.0% of its net investment income (earned during the calendar year) and 98.2% of its net realized capital gains (earned during the twelve months ended October 31) plus undistributed amounts, if any, from prior years. |
| | |
| | A regulated investment company may elect to treat any portion of its qualified late year losses as arising on the first day of the next taxable year. Qualified late year losses are any ordinary and net capital losses incurred between November 1 and the end of the fiscal year, December 31. For the taxable year ended December 31, 2019, the Fund deferred, on a tax basis, capital losses of $1,254,498. The Fund does not intend to defer any late-year ordinary losses. |
| | |
| | As of December 31, 2019, the Fund did not have any capital loss carryforwards available for federal income tax purposes. During the tax year ended December 31, 2019, the Fund did not utilize Short Term Capital loss Carryovers or Long Term Capital Loss Carryovers. |
| | |
| | Additionally, U.S. generally accepted accounting principles require that certain components of net assets relating to permanent differences be reclassified between financial and tax reporting. These reclassifications have no effect on net assets or net asset value per share. The reclassifications were primarily a result of the correction to the prior year utilization of E&P distributed to redeeming shareholders. For the year ended December 31, 2019, the following table shows the reclassifications made: |
| Total | Paid in |
Distributable Earnings | Capital |
| $167,889 | $(167,889) |
| | The Fund recognizes the tax benefits of uncertain tax positions only where the position is "more likely than not"to be sustained assuming examination by tax authorities. The Fund recognizes interest and penalties, if any, related to unrecognized tax benefits as other expense in the Statement of Operations. Management has analyzed the Fund’s tax positions, and has concluded that no liability for unrecognized tax benefits should be recorded related to uncertain tax positions taken on returns filed for the open tax years (2016-2018), or expected to be taken in the Fund’s 2019 tax returns. The Fund identifies its major tax jurisdictions as U.S. Federal, New Jersey State, and Massachusetts State; however the Fund is not aware of any tax positions for which it is reasonably possible that the total amounts of unrecognized tax benefits will change materially in the next twelve months. Generally, tax authorities can examine all tax returns filed for the last three years. |
| | |
| H. | Forward Foreign Currency Contracts. The Fund may enter into forward foreign currency contracts as hedges against either specific transactions or fund positions. The aggregate principal amount of the contracts are not recorded because the Fund intends to settle the contracts prior to delivery. All commitments are marked-to-market daily at the applicable foreign exchange rate, and any resulting unrealized gains or losses are recorded concurrently. The Fund realizes gains or losses at the time the forward contracts are extinguished. For federal income tax purposes, the Fund elected capital treatment for all realized and unrealized transactions on forward foreign currency contracts during the year December 31, 2019. |
| | |
| | The use of forward foreign currency contracts does not eliminate fluctuations in the underlying prices of the securities, but it does establish a rate of exchange that can be achieved in the future. Although forward foreign currency contracts limit the risk of loss due to a decline in the value of the hedged currency, they also limit a potential gain that might result should the value of the currency increase. These contracts involve market risk in excess of the amount reflected in the Fund’s Statement of Assets and Liabilities. The face or contract amount in U.S. dollars reflects the total exposure the Fund has in that particular currency contract. In addition, there could be exposure to risks (limited to the amount of unrealized gains) if the counterparties to the contracts are unable to meet the terms of their contracts. |
| | |
| | The Fund attempts to manage counterparty credit risk by entering into agreements only with counterparties the Adviser believes have the financial resources to honor their obligations and by having the Adviser monitor the financial stability of counterparties. Collateral pledges are monitored and subsequently adjusted if and when the valuations fluctuate, either up or down by at least the predetermined threshold amount. |
Evermore Global Value Fund
| NOTES TO FINANCIAL STATEMENTS December 31, 2019, Continued |
| I. | Short Sales. The Fund may make short sales of securities, including "short sales against the box."In a short transaction, a fund sells a security it does not own in anticipation that the market price of that security will decline. The Fund expects to make short sales (i) as a form of hedging to offset potential declines in long positions in similar securities, (ii) in order to maintain portfolio flexibility and (iii) for profit. |
| | |
| | When the Fund makes a short sale, its broker borrows the security to be sold short and the broker-dealer maintains the proceeds of the short sale while the short position is open. The Fund must keep the proceeds account marked to market and must post additional collateral for its obligation to deliver securities to replace the securities that were borrowed and sold short. The Fund may have to pay a fee to borrow particular securities and is often obligated to pay over any payments received on such borrowed securities. |
| | |
| | A Fund’s obligation to replace borrowed securities will be secured by collateral deposited with the broker-dealer or the Fund’s custodian bank, usually cash, U.S. government securities or other high grade liquid securities similar to those borrowed. The Fund will also be required to segregate similar collateral to the extent, if any (excluding any proceeds of the short sales), necessary so that the value of both collateral deposits in the aggregate is at all times equal to at least 100% of the current market value of the security sold short. |
| | |
| | Short sales carry risks of loss if the price of the security sold short increases after the sale. In this situation, when a Fund replaces the borrowed security by buying the security in the securities market, the Fund may pay more for the security than it has received from the purchaser in the short sale. A Fund may, however, profit from a change in the value of the security sold short, if the price decreases. |
| | |
| J. | Security Transactions and Investment Income. Investment securities transactions are accounted for on the trade date. Gains and losses realized on sales of securities are determined on a high cost basis. Discounts/premiums on debt securities purchased are accreted/ amortized over the life of the respective securities using the effective interest method. Dividend income is recorded on the ex-dividend date. Interest income is recorded on an accrual basis. Payment in-kind interest income represents contractually deferred income that is generally due at maturity and is recorded on an accrual basis to the extent such amounts are expected to be collected. Payment in-kind income is not accrued if the Fund does not expect the underlying company to be able to pay all income when due. Other non-cash dividends are recognized as investment income at the fair value of the property received. Withholding taxes on foreign dividends have been provided for in accordance with the Trust’s understanding of the applicable country’s tax rules and rates. |
| | |
| K. | Distributions to Shareholders. Distributions to shareholders from net investment income and net realized gains on securities for the Fund, which are determined in accordance with income tax regulations, are normally declared and paid on an annual basis. Distributions are recorded on the ex-dividend date. The Fund may also pay a special distribution at the end of the calendar year to comply with Federal tax requirements. |
| | |
| L. | Use of Estimates. The preparation of financial statements in conformity with U.S. GAAP requires management to make estimates and assumptions that affect the reported amounts of assets and liabilities at the date of the financial statements and the reported amount of revenue and expenses during the reporting period. Actual results could differ from those estimates. |
| | |
| M. | Share Valuation. The net asset value ("NAV") per share of the Fund is calculated by dividing the sum of the value of the securities held by the Fund, plus cash or other assets, minus all liabilities (including estimated accrued expenses) by the total number of shares outstanding for the Fund, rounded to the nearest cent. The Fund’s shares will not be priced on the days on which the NYSE is closed for trading. As discussed in Note 1, certain shares are subject to a redemption fee if sold before a specified holding period. Any redemption fees are deducted from the redemption proceeds otherwise payable to the shareholder. The Fund retains the fee charged as paid-in-capital and such fees become part of the Fund’s daily NAV calculation. |
| | |
| N. | Guarantees and Indemnifications. In the normal course of business, the Fund enters into contracts with service providers that contain general indemnification clauses. The Fund’s maximum exposure under these arrangements is unknown as this would involve future claims that may be made against the Fund that have not yet occurred. However, based on experience, the Fund expects the risk of loss to be remote. |
| | |
| O. | Securities Lending. The Fund is authorized to lend securities it holds to brokers, and other financial organizations. This activity is subject to agreements where The Bank of New York Mellon and U.S. Bank N.A. act as the Fund’s agents. When loaning securities, the Fund retains the benefits of owning the securities, including the economic equivalent of dividends or interest generated by the security. Pursuant to these agreements, income earned from the securities lending program is paid to the Fund, net of any fees paid to The Bank of New York Mellon and U.S. Bank N.A. and is recognized as "Securities lending income"on the Statement of Operations. |
| | |
| | Lending of the Fund’s securities exposes the Fund to risks such as the following: (i) the borrower may fail to return the loaned securities, (ii) the borrower may not be able to provide additional collateral in instances when the value of the collateral is less than the loaned securities, (iii) the Fund may experience delays in recovery of the loaned securities or delays in access to collateral, or (iv) the Fund may experience losses related to the reinvestment of collateral. To minimize these risks, loans must be continuously secured by collateral consisting of cash or securities issued or guaranteed by the U.S. government or one of its agencies or instrumentalities, or an irrevocable standby letter of credit or any combination thereof. The collateral and the securities loaned shall be marked to market daily. |
Evermore Global Value Fund
| NOTES TO FINANCIAL STATEMENTS December 31, 2019, Continued |
| | Upon the origination of any loan, collateral required by The Bank of New York Mellon shall be equal to 102% of the market value (plus accrued interest) of the securities loaned, if the securities loaned are issued by the U.S. issuers. Such collateral requirement shall be 105% for securities of non-U.S. issuers. Upon the origination of any loan, collateral required by U.S. Bank N.A. shall be equal to 100% of the market value (plus accrued interest) of the securities loaned. The collateral must be received concurrently with delivery of the loaned securities and the collateral must be kept in an account appropriately segregated by the custodian from any assets belonging to the Fund. The value of the collateral requirement is determined based upon the closing price of a borrowed security, with the collateral balance adjusted the following business day. Although there is no specified time limit regarding how long a security may be out on loan, the Fund or the borrower may request that a security on loan be returned at any time. If the Fund requests that a specific security be returned, and the borrower fails to return such security, the Fund will be able to retain the borrower’s collateral. Assets in the collateral account will be invested by The Bank of New York Mellon and U.S. Bank N.A., as directed by the Adviser in short term U.S. government money market instruments that constitute "Eligible Securities"(as defined in Rule 2a-7 under the Investment Company Act). All of the assets that are held by the collateral account will be valued on an amortized cost basis to the extent permitted by applicable Commission or staff releases, rules, letters or orders. |
| | |
| | During the year ended December 31, 2019, the Fund had loaned securities that were collateralized by cash. The cash collateral received was invested in the Dreyfus Government Cash Management – Investor Class and the First American Government Obligations Fund – Y Class Shares and is presented in the Fund’s Schedule of Investments as "Securities Held as Collateral on Loaned Securities."The securities lending program restricts investments to several prescribed money market funds along with a collateralized separate account investment option. |
| | |
| P. | Restricted and Illiquid Securities. The Fund will not purchase nor otherwise acquire any investment if, as a result, more than 15% of its net assets (taken at current market value) would be invested in securities that are illiquid. Generally speaking, an illiquid security is any asset or investment of which the Fund cannot sell a normal trading unit in the ordinary course of business within seven days at approximately the value at which the Fund has valued the asset or investment, including securities that cannot be sold publicly due to legal or contractual restrictions. The sale of illiquid securities often requires more time and results in higher brokerage charges or dealer discounts and other selling expenses than does the sale of securities eligible for trading on national securities exchanges or in the OTC markets. Restricted securities may sell at a price lower than similar securities that are not subject to restrictions on resale. |
| | |
| | Over the past several years, strong institutional markets have developed for various types of restricted securities, including repurchase agreements, some types of commercial paper, and some corporate obligations and notes (commonly known as "Rule 144A Securities"). Securities freely salable among qualified institutional investors under special rules adopted by the SEC, or otherwise determined to be liquid, may be treated as liquid if they satisfy liquidity standards established by the Board. The continued liquidity of such securities is not as well assured as that of publicly traded securities, and accordingly, the Board will monitor their liquidity. The Board will review pertinent factors such as trading activity, reliability of price information and trading patterns of comparable securities in determining whether to treat any such security as liquid for purposes of the foregoing 15% test. To the extent the Board treats such securities as liquid, temporary impairments to trading patterns of such securities may adversely affect the Fund’s liquidity. The Fund may, from time to time, participate in private investment vehicles and/or in equity or debt instruments that do not trade publicly and may never trade publicly. These types of investments carry a number of special risks in addition to the normal risks associated with equity and debt investments. In particular, private investments are likely to be illiquid, and it may be difficult or impossible to sell these investments under many conditions. The Fund may from time to time establish one or more wholly-owned special purpose subsidiaries in order to facilitate the Fund’s investment program which may reduce certain of the costs (e.g. tax consequences) to the Fund. |
| | |
| Q. | REIT Distributions. The character of distributions received from real estate investment trusts ("REITs") held by the Fund is generally comprised of net investment income, capital gains, and return of capital. It is the policy of the Fund to estimate the character of distributions received from underlying REITs based on historical data provided by the REITs. After each calendar year end, REITs report the actual tax character of these distributions. Differences between the estimated and actual amounts reported by the REITs are reflected in the Fund’s records in the year in which they are reported by the REITs by adjusting related investment cost basis, capital gains and income, as necessary. The Fund did not hold any REITs during the year ended December 31, 2019. |
| | |
| R. | New Accounting Pronouncement. ASU No. 2018-13, "Fair Value Measurement (Topic 820), Disclosures Framework – Changes to the Disclosure Requirements for Fair Value Measurement,"was issued in August 2018 and is effective for fiscal years beginning after December 15, 2019 and for interim periods within those fiscal years, but entities are permitted to early adopt either the entire standard or only the provisions that eliminate or modify the requirements. As of December 2019, the Fund has chosen to adopt only the provisions that eliminate or modify the requirements. |
| | |
| S. | Subsequent Events. In preparing these financial statements, the Fund has evaluated events and transactions for potential recognition or disclosure through the date the financial statements were available to be issued. The Fund has determined that there were no subsequent events that would be required to be disclosed in the Fund’s financial statements, other than what is noted below. |
Evermore Global Value Fund
| NOTES TO FINANCIAL STATEMENTS December 31, 2019, Continued |
| | At a meeting of the Board held on October 31, 2019, the Board, including a majority of Trustees who are not "interested persons"of the Trust, approved a new distribution agreement between Compass Distributors, LLC ("Compass"), a wholly owned subsidiary of Foreside Distributors, LLC. Effective January 1, 2020, Compass replaced Quasar Distributors, LLC as the Fund’s distributor. |
| NOTE 3 – INVESTMENT ADVISORY FEES, SERVICING FEES, AND OTHER FEES AND EXPENSES |
The Adviser provides the Fund with investment management services under an Investment Advisory Agreement (the "Agreement"). Under the Agreement, the Adviser furnishes all investment advice, office space, certain administrative services, and provides most of the personnel needed by the Fund. As compensation for its services, the Adviser is entitled to a monthly fee at the annual rate of 0.99% based upon the average daily net assets of the Fund. As compensation for its services, for the year ended December 31, 2019, the Fund incurred $5,647,699 in advisory fees, of which $474,782 was payable to the Adviser at December 31, 2019.
U.S. Bancorp Fund Services, LLC, doing business as U.S. Bank Global Fund Services ("Fund Services"), an indirect wholly-owned subsidiary of U.S. Bank N.A., serves as the Fund’s administrator (the "Administrator") and, in that capacity, performs various administrative and accounting services for the Fund. Fund Services also serves as the Fund’s fund accountant, transfer agent, dividend disbursing agent and registrar. The Administrator prepares various federal and state regulatory filings, reports and returns for the Fund; prepares reports and materials to be supplied to the trustees; monitors the activities of the Fund’s custodian, transfer agent and accountants; coordinates the preparation and payment of Fund expenses and reviews the Fund’s expense accruals.
Quasar Distributors, LLC (the "Distributor") is the Fund’s distributor, see note 2R. U.S. Bank N.A. (the "Custodian") serves as the custodian to the Fund. Both the Distributor and Custodian are affiliates of the Administrator.
At a meeting held on August 22, 2018, the Board approved a line of credit ("LoC") with U.S. Bank N.A. to be used for temporary or emergency purposes, primarily for financing redemption payments, using the securities in the Fund portfolio as collateral. At a meeting held on August 16, 2019, the Board approved the renewal of the LoC. Borrowing under the LoC is limited to the lesser of 15% of the total market value of the Fund, 33.33% of the Fund’s unencumbered assets, or $30,000,000 for the Fund. The interest rate paid by the Fund on outstanding borrowings is equal to the prime rate which was 4.75% at December 31, 2019. Interest expense incurred for the Fund, if any, is disclosed on the Statement of Operations. For the year ended December 31, 2019, the Fund had average borrowings of $36,467 and the weighted average interest rate on the LoC borrowings was 4.75%. The Fund’s maximum amount of borrowings outstanding during the year was $4,942,000.
The Fund has adopted a Distribution Plan (the "Plan") in accordance with Rule 12b-1 under the 1940 Act with respect to Investor Class shares. The Plan provides that the Fund may pay a fee to the Distributor at an annual rate of 0.25% of the average daily net assets of Investor Class shares. No distribution or shareholder servicing fees are paid by Institutional Class shares. These fees may be used by the Distributor to provide compensation for sales support distribution activities, or shareholder servicing activities.
| NOTE 4 – PURCHASES AND SALES OF SECURITIES |
For the year ended December 31, 2019, the cost of purchases and the proceeds from the sale of securities, excluding short-term investments, were $149,695,380 and $150,049,405, respectively.
There were no purchases or sales of long-term U.S. government securities for the year ended December 31, 2019.
| NOTE 5 – DISTRIBUTIONS TO SHAREHOLDERS |
The tax character of distributions paid during the year ended December 31, 2019 and for the year ended December 31, 2018 for the Fund were as follows:
| | | December 31, 2019 | | | December 31, 2018 | |
| Distributions paid from: | | | | | | |
| Ordinary income* | | $ | 13,310,223 | | | $ | 3,538,530 | |
| Long-term capital gains** | | | 2,802,918 | | | | 8,501,724 | |
| Total distributions | | $ | 16,113,141 | | | $ | 12,040,254 | |
| | * | For federal income tax purposes, distributions of short-term capital gains are treated as ordinary income distributions. |
| | ** | The Fund designates this distribution as long-term capital gain dividends pursuant to Internal Revenue Code Section 852(b)(3)(C). |
Evermore Global Value Fund
| NOTES TO FINANCIAL STATEMENTS December 31, 2019, Continued |
As of December 31, 2019, the components of distributable earnings on a tax basis were as follows:
| | | Total Portfolio | |
| Cost of investments | | $ | 550,415,437 |
|
| Gross tax unrealized appreciation | | | 159,210,131 |
|
| Gross tax unrealized depreciation | | | (73,381,757 | ) |
| Net tax unrealized appreciation | | | 85,828,374 | |
| Undistributed ordinary income | | | 426,028 | |
| Undistributed long-term capital gain | | | — | |
| Total distributable earnings | | | 426,028 | |
| Other accumulated losses | | | (1,254,498 | ) |
| Total distributable earnings | | $ | 84,999,904 | |
The difference between cost of investments for financial reporting and cost of investments for Federal income tax purposes was due primarily to timing differences in recognizing certain gains and losses on security transactions (e.g., wash sale loss deferrals, passive foreign investment company transactions, and unrealized gains (losses) recognition of derivatives).
| NOTE 6 – INVESTMENTS IN AFFILIATES |
The Fund owned 5% or more of the voting securities of the following companies during the year ended December 31, 2019. As a result, these companies are deemed to be affiliated companies. The below table represents market value:
| | | Value | | | | | | | | | | |
| | | January 1, | | | | | | | | | Realized | |
Issuer | | 2019 | | | Purchases | | | Sales | | | Gain (Loss) | |
AXXIS Geo Solution1 | | $ | 74,537 | | | $ | — | | | $ | 115,321 | | | $ | (331,959 | )2 |
| Emergent Capital, Inc. (United States) | | | — | | | | 3,341,999 | 3 | | | — | | | | — | |
| Enzo Biochem, Inc. (United States) | | | 10,076,566 | | | | 1,203,062 | | | | 2,889,476 | | | | (3,918,018 | ) |
| MagnaChip Semiconductor Corp. (South Korea) | | | 15,130,845 | | | | 1,104,628 | | | | 2,681,977 | | | | (2,016,102 | ) |
| Navios Maritime Containers LP (Greece) | | | 10,273,533 | | | | — | | | | — | | | | — | |
| | | $ | 35,555,481 | | | $ | 5,649,689 | | | $ | 5,686,774 | | | $ | (6,266,079 | ) |
| | | | | | | | | | | | | | | | | |
| | | Change in | | | | | | | | | | | Share | |
| | | Unrealized | | | | | | | Value | | | Balance | |
| | | Appreciation | | | Dividend | | | December 31, | | | December 31, | |
Issuer | | (Depreciation) | | | Income | | | | 2019 | | | | 2019 | |
AXXIS Geo Solution1 | | $ | 372,743 | | | $ | — | | | $ | — | | | | — | |
| Emergent Capital, Inc. (United States) | | | (16,208 | ) | | | — | | | | 3,325,791 | | | | 16,710,000 | |
| Enzo Biochem, Inc. (United States) | | | 3,852,145 | | | | — | | | | 8,324,279 | | | | 3,165,125 | |
| MagnaChip Semiconductor Corp. (South Korea) | | | 12,931,133 | | | | — | | | | 24,468,527 | | | | 2,107,539 | |
| Navios Maritime Containers LP (Greece) | | | (2,468,554 | ) | | | — | | | | 7,804,979 | | | | 3,630,223 | |
| | | $ | 14,671,259 | | | $ | — | | | $ | 43,923,576 | | | | 25,612,887 | |
| | 1 | Formerly Songa Bulk ASA. Issuer was no longer an affiliate as of December 31, 2019. |
| | 2 | $1,735 of realized losses due to currency translations. |
| | 3 | Due to corporate action from a similar security of the same issuer. |
Evermore Global Value Fund
| REPORT OF INDEPENDENT REGISTERED PUBLIC ACCOUNTING FIRM |
To the Shareholders and the Board of Trustees of Evermore Global Value Fund
Opinion on the Financial Statements
We have audited the accompanying statement of assets and liabilities of Evermore Global Value Fund (the "Fund") (the sole portfolio constituting Evermore Funds Trust (the "Trust")), including the schedule of investments, as of December 31, 2019, and the related statement of operations for the year then ended, the statements of changes in net assets for each of the two years in the period then ended, the financial highlights for each of the five years in the period then ended and the related notes (collectively referred to as the "financial statements"). In our opinion, the financial statements present fairly, in all material respects, the financial position of the Fund (the sole portfolio constituting the Trust) at December 31, 2019, the results of its operations for the year then ended, the changes in its net assets for each of the two years in the period then ended and its financial highlights for each of the five years in the period then ended, in conformity with U.S. generally accepted accounting principles.
Basis for Opinion
These financial statements are the responsibility of the Trust’s management. Our responsibility is to express an opinion on the Fund’s financial statements based on our audits. We are a public accounting firm registered with the Public Company Accounting Oversight Board (United States) ("PCAOB") and are required to be independent with respect to the Trust in accordance with the U.S. federal securities laws and the applicable rules and regulations of the Securities and Exchange Commission and the PCAOB.
We conducted our audits in accordance with the standards of the PCAOB. Those standards require that we plan and perform the audit to obtain reasonable assurance about whether the financial statements are free of material misstatement, whether due to error or fraud. The Trust is not required to have, nor were we engaged to perform, an audit of the Trust’s internal control over financial reporting. As part of our audits, we are required to obtain an understanding of internal control over financial reporting but not for the purpose of expressing an opinion on the effectiveness of the Trust’s internal control over financial reporting. Accordingly, we express no such opinion.
Our audits included performing procedures to assess the risks of material misstatement of the financial statements, whether due to error or fraud, and performing procedures that respond to those risks. Such procedures included examining, on a test basis, evidence regarding the amounts and disclosures in the financial statements. Our procedures included confirmation of securities owned as of December 31, 2019, by correspondence with the custodian and brokers or by other appropriate auditing procedures where replies from brokers were not received. Our audits also included evaluating the accounting principles used and significant estimates made by management, as well as evaluating the overall presentation of the financial statements. We believe that our audits provide a reasonable basis for our opinion.
We have served as the Trust’s auditor since 2009.
Minneapolis, Minnesota
February 27, 2020
Evermore Global Value Fund
| APPROVAL OF INVESTMENT ADVISORY AGREEMENT (Unaudited) |
At a Board meeting held on October 31, 2019, the Fund’s Board of Trustees (the "Board"), including a majority of the Trustees who are not "interested persons"of the Trust (the "Independent Trustees"), approved the continuance of the Investment Advisory Agreement (the "Advisory Agreement") with Evermore Global Advisors, LLC (the "Adviser") for an additional one-year period. The Board considered whether the Advisory Agreement would be in the best interest of the Fund and its shareholders and the overall fairness of the Advisory Agreement. Among other things, the Board reviewed information concerning: (1) the nature, extent and quality of the services provided by the Adviser (2) the Fund’s investment performance; (3) the cost of the services provided and the profits realized by the Adviser from its relationship with the Fund; (4) the extent to which economies of scale, if any, are achieved for the benefit of Fund shareholders; and (5) ancillary benefits and other factors. In their deliberations, the Board did not rank the importance of any particular piece of information or factor considered, and it is presumed that each Trustee attributed different weights to the various factors. The following summary details the materials and factors that the Board considered, and the conclusions they reached, in approving the Advisory Agreement.
The Independent Trustees reviewed and discussed the relevant material regarding the proposed renewal of the Advisory Agreement, including the material prepared by Broadridge, an independent provider of investment company data. The Independent Trustees took into account the material requested in connection with the renewal, as well as material they reviewed and considered over the course of the year and during quarterly Board and committee meetings. The Independent Trustees concluded that they had confidence in the Adviser and its personnel with respect to the operation of its business and management of the Fund, its commitment to the ongoing operation of the Fund, its financial strength and use of resources in furtherance of the management of the Fund, its capabilities in terms of managing the Fund from an operational, compliance and investment standpoint, including management of service providers. The Board also took into account the Adviser’s compliance policies and procedures and that the Adviser provided non-advisory, administrative services to the Fund under the Advisory Agreement, including among other things providing office facilities, equipment and personnel to coordinate the preparation of annual and semi-annual reports to shareholders, assisting in preparing Fund tax returns, and compliance monitoring.
The Independent Trustees considered the overall nature and quality of services provided by the Adviser to the Fund, including as evidenced by the Fund’s investment performance. The Independent Trustees concluded that the performance record over time compared to relevant benchmark indices and peer funds and was consistent with the Adviser’s consistent implementation of the stated investment mandate. The Board determined that the portfolio manager and key personnel are well qualified by education, training and experience to perform the services in an efficient and professional manner.
The Independent Trustees were satisfied that the advisory fee was fair in view of the nature and quality of services provided (including the Fund’s global investment strategy and the related costs associated with implementing the same), and in relation to fees charged by peer fund advisers and that the Adviser charged to other clients for similar services. The Board noted that the Fund’s gross advisory fee and net total expense ratio was within the range of fees for funds in the peer group. The Independent Trustees appreciated the Adviser’s view that asset levels were lower than the capacity to invest client assets pursuant to the Fund’s strategy, that the firm had in previous years subsidized Fund expenses and that the appropriate time to consider whether economies of scale warranted breakpoints in the advisory fee would be when asset levels are significantly higher. However, the Independent Trustees determined that they would continue to monitor fee levels and profitability going forward, with a view toward evaluating whether economies of scale warranted breakpoints in the future. The Independent Trustees also took into account the fact that the Adviser benefits from the use of soft dollar commissions.
Based upon such information as they considered necessary to the exercise of their reasonable business judgment, the Board, including all of the Independent Trustees, concluded that it was in the best interests of the Fund to continue the Advisory Agreement with the Adviser for an additional one-year period.
Evermore Global Value Fund
| TRUSTEES AND EXECUTIVE OFFICERS (Unaudited) |
The Board is responsible for the overall management of the Trust, including general supervision and review of the investment activities of the Fund. The Board, in turn, elects the officers of the Trust, who are responsible for administering the day-to-day operations of the Trust and its separate series. The current Trustees and officers of the Trust, their years of birth and positions with the Trust, term of office with the Trust and length of time served, their principal occupations for the past five years and other directorships held are set forth in the following table. Additional information regarding the Trustees is included in the Fund’s SAI and is available without charge, upon request, by calling 866-EVERMORE or (866) 383-7667.
| | | | | Number of | |
| | | | | Portfolios | |
| | | Term of | | in Fund | |
| | Position | Office and | | Complex | |
| | with the | Length of | Principal Occupation | Overseen | |
Name, Age and Address | Trust | Time Served | During Past Five Years | by Trustees | Other Directorships Held |
| | | | | | |
Independent Trustees of the Trust |
| | | | | | |
| Eugene W. Bebout III | Trustee | Indefinite | Chief Financial | 1 | Director and Audit Committee |
| (born 1959) | and | Term since | Officer and | | Member, Summit Educational |
| 89 Summit Avenue | Audit | 2009 | Chief Operating | | Foundation (since 2012); |
| 3rd Floor | Committee | | Officer, Herbert L. | | Director and Treasurer, Summit |
| Summit, NJ 07901 | Chairman | | Jamison & Co. LLC, | | Lacrosse Club (2009 – 2015); |
| | | | an Insurance Agent | | Audit Committee Chair, |
| | | | and Broker | | Summit Area YMCA |
| | | | (since 2003) | | (2011 – 2015). |
| | | | | | |
| Nathan Gantcher | Chairman | Indefinite | Managing Member, | 1 | Director, Mack-Cali Realty |
| (born 1940) | and | Term since | EXOP Capital LLC, | | Corporation (since 1999); |
| 89 Summit Avenue | Trustee | 2011 | an investment firm | | Trustee, Albert Einstein |
| 3rd Floor | | | (since 2005); | | College of Medicine (since |
| Summit, NJ 07901 | | | Advisor, Lebenthal | | 2016); Former Director, |
| | | | Holdings, a wealth | | Cambridge Capital Acquisition |
| | | | advisory firm | | Corp. (2013 – 2015); Trustee, |
| | | | (2013 – 2016) | | Montefiore Health System and |
| | | | | | Montefiore Medical Center |
| | | | | | (since 2012). |
| | | | | | |
| Stephen J. Balog | Trustee | Indefinite | Owner, Camrig, LLC, | 1 | Director of CDx Diagnostics |
| (born 1955) | and | Term since | Camrig, LLC, a camera | | (since 2017); The Citizens |
| 89 Summit Avenue | Valuation | 2016 | accessory company | | Campaign (since 2005); |
| 3rd Floor | Committee | | (since 2013); Owner, | | Harding Township Civic |
| Summit, NJ 07901 | Chairman | | Rocky Mountain | | Association (since 2008); St. |
| | | | Western, LLC, an | | Joseph’s High School |
| | | | online Bolo tie retailer | | Foundation (since 2008). |
| | | | (since 2011), Chief | | |
| | | | Financial Officer and | | |
| | | | Partner, Growth Partner | | |
| | | | LLC (since 2018), a | | |
| | | | digital marketing agency | | |
| | | | holding company | | |
| | | | | | |
| Julie Keenan | Trustee | Indefinite | Managing Member, | 1 | Youth Development Clinic, |
| (Born 1962) | | Term since | EMB Enterprises, | | Newark, NJ (2000 – 2017); |
| 89 Summit Avenue | | 2016 | LLC, a consulting | | Summit Area Public Foundation |
| 3rd Floor | | | company (since 2006) | | (since 2000); Pratt School of |
| Summit, NJ 07901 | | | | | Engineering Board of Visitors |
| | | | | | (since 2015); Summit |
| | | | | | Educational Foundation (2010 – |
| | | | | | 2015); Conservation Resources, |
| | | | | | Inc. (2010 – 2014). |
Evermore Global Value Fund
| TRUSTEES AND EXECUTIVE OFFICERS (Unaudited), Continued |
| | | | �� | Number of | |
| | | | | Portfolios | |
| | | Term of | | in Fund | |
| | Position | Office and | | Complex | |
| | with the | Length of | Principal Occupation | Overseen | |
Name, Age and Address | Trust | Time Served | During Past Five Years | by Trustees | Other Directorships Held |
| | | | | | |
Interested Trustee |
| | | | | | |
| Eric LeGoff | Chief | Indefinite | President, COO | 1 | Former Director, FXCM Inc. |
| (born 1961) | Executive | Term since | and Director, | | (FX Trading Platform) |
| 89 Summit Ave | Officer | 2009 | Evermore Global | | (2010 – 2017); Director, |
| 3rd Floor | and | | Advisors, LLC | | Summit Area Public |
| Summit, NJ 07901 | Trustee | | (since 2009) | | Foundation (since 2015). |
| | | Term of | |
| | Position | Office and | |
| | with the | Length of | |
Name, Age and Address | Trust | Time Served | Principal Occupation During Past Five Years |
| | | | |
Officers of the Trust |
| | | | |
| Eric LeGoff | Chief | Indefinite | President, COO and Director, Evermore Global Advisors, LLC |
| (born 1961) | Executive | Term since | (since 2009) |
| 89 Summit Ave | Officer | 2009 | |
| 3rd Floor | | | |
| Summit, NJ 07901 | | | |
| | | | |
| David Marcus | President | Indefinite | CEO, Portfolio Manager and Director, |
| (born 1965) | | Term since | Evermore Global Advisors, LLC (since 2009), Director, Modern |
| 89 Summit Ave | | 2009 | Holdings Inc., (a private equity firm) (since 2002) |
| 3rd Floor | | | |
| Summit, NJ 07901 | | | |
| | | | |
| Bartholomew Tesoriero | Chief | Indefinite | CFO, Evermore Global Advisors, LLC (since 2015); Chief |
| (born 1957) | Financial | Term since | Operating Officer of Axiom International Investors, LLC |
| 89 Summit Ave | Officer; | 2015 | (2007 – 2015) |
| 3rd Floor | Treasurer | | |
| Summit, NJ 07901 | | | |
| | | | |
| Magali Simo | Secretary | Indefinite | Vice President, Investor Services, Evermore Global Advisors, LLC |
| (born 1961) | | Term since | (since 2010), Secretary, Evermore Global Advisors LLC (since 2010) |
| 89 Summit Ave | | 2009 | |
| 3rd Floor | | | |
| Summit, NJ 07901 | | | |
| | | | |
| Douglas Tyre | Chief | Indefinite | Assistant Compliance Director, Cipperman Compliance Services, LLC |
| (born 1980) | Compliance | Term since | (since 2014); Chief Compliance Officer, Evermore Global Advisors, |
| 89 Summit Ave | Officer; | 2017 | LLC (since 2017); Client services and operations specialist – Senior |
| 3rd Floor | Anti-Money | | Associate, Echo Point Investment Management, LLC (2010 – 2014) |
| Summit, NJ 07901 | Laundering | | |
| | Officer | | |
Evermore Global Value Fund
| ADDITIONAL INFORMATION (Unaudited) |
| FEDERAL TAX INFORMATION (Unaudited) |
For the fiscal year ended December 31, 2019, certain dividends paid by the Fund may be subject to a maximum tax rate of 23.8%, as provided for by the American Taxpayer Relief Act of 2012. The percentage of dividends declared from ordinary income designated as qualified dividend income was 100%.
For corporate shareholders, the percent of ordinary income distributions qualifying for the corporate dividends received deduction for the fiscal year ended December 31, 2019 was 12.99%.
The percentage of taxable ordinary income distributions that are designated as short-term capital gain distributions under Internal Revenue Section 871(k)(2)(c) for the fiscal year ended December 31, 2019 was 59.28%.
Pursuant to Section 853 of the Internal Revenue Code the Fund designated the following amounts as foreign taxes paid for the year ended December 31, 2019. Foreign taxes paid for purposes of Section 853 may be less than actual foreign taxes paid for financial statement purposes.
| Foreign Dividend Income | | $ | 8,728,233 | |
| Foreign Taxes Paid | | | 867,897 | |
| Foreign Taxes Paid per share | | | 0.020913 | |
| | | | | |
| Foreign Tax Credit/Deduction | | | 867,897 | |
| Foreign Tax Credit/Deduction per share | | | 0.02114224 | |
| | | | | |
| Fund shares Outstanding as of December 31, 2019 | | | 41,500,608 | |
| INFORMATION ABOUT PROXY VOTING (Unaudited) |
A description of the policies and procedures that the Fund used to determine how to vote proxies relating to portfolio securities is available without charge, upon request, by calling 866-EVERMORE (866) 383-7667.
Information regarding how the Fund voted proxies relating to portfolio securities during the most recent period ending June 30 is available without charge, upon request, by calling 866-EVERMORE (866) 383-7667. Furthermore, you can obtain the Form N-PX on the SEC’s website at www.sec.gov.
| INFORMATION ABOUT THE PORTFOLIO HOLDINGS (Unaudited) |
The Fund files its complete schedule of portfolio holdings for its first and third quarters with the SEC on Form N-Q or Part F of Form N-PORT (beginning with filings after March 31, 2020). The Fund’s Form N-Q or Part F of Form N-PORT is available without charge, upon request, by calling 866-EVERMORE (866) 383-7667. Furthermore, you can obtain the Form N-Q or Part F of Form N-PORT on the SEC’s website at www.sec.gov.
| INFORMATION ABOUT HOUSEHOLDING (Unaudited) |
In an effort to decrease costs, the Fund intends to reduce the number of duplicate prospectuses and Annual and Semi-Annual Reports you receive by sending only one copy of each to those addresses shared by two or more accounts and to shareholders the Transfer Agent reasonably believes are from the same family or household. Once implemented, if you would like to discontinue householding for your accounts, please call toll-free at 866-EVERMORE (866) 383-7667 to request individual copies of these documents. Once the Transfer Agent receives notice to stop householding, the Transfer Agent will begin sending individual copies thirty days after receiving your request. This policy does not apply to account statements.
Evermore Global Value Fund
| PRIVACY NOTICE (Unaudited) |
| FACTS | WHAT DOES EVERMORE FUNDS TRUST DO WITH YOUR PERSONAL INFORMATION? |
| | |
| WHY? | Financial companies choose how they share your personal information. Federal law gives consumers the right to limit some but not all sharing. Federal law also requires us to tell you how we collect, share, and protect your personal information. Please read this notice carefully to understand what we do. |
| | |
| WHAT? | The types of personal information we collect and share depend on the product or service you have with us. This information can include: |
| | • Social Security number |
| | • account balances |
| | • account transactions |
| | • transaction history |
| | • wire transfer instructions |
| | • checking account information |
| | When you are no longer our customer, we continue to share your information as described in this notice. |
| | |
| HOW? | All financial companies need to share customers’ personal information to run their everyday business. In the section below, we list the reasons financial companies can share their customers’ personal information; the reasons Evermore Funds Trust chooses to share; and whether you can limit this sharing. |
| | Does Evermore | Can you limit |
| Reasons we can share your personal information. | Funds Trust share? | this sharing? |
| For our everyday business purposes— | Yes | No |
| Such as to process your transactions, maintain your account(s), respond to court orders | | |
| and legal investigations, or report to credit bureaus | | |
| For our marketing purposes— | No | We don’t share |
| to offer our products and services to you | | |
| For joint marketing with other financial companies | No | We don’t share |
| For our affiliates’ everyday business purposes— | Yes | No |
| information about your transactions and experiences | | |
| For our affiliates’ everyday business purposes— | No | We don’t share |
| information about your creditworthiness | | |
| For affiliates to market to you | No | We don’t share |
| For non-affiliates to market to you | No | We don’t share |
| Questions? | Call 866-EVERMORE (866-383-7667) or go to www.evermoreglobal.com |
Evermore Global Value Fund
| PRIVACY NOTICE (Unaudited), Continued |
| What we do | |
| How does Evermore Funds Trust | To protect your personal information from unauthorized access and use, we use security |
| protect my personal information? | measures that comply with federal law. These measures include computer safeguards and secured files and buildings. |
| How does Evermore Funds Trust | We collect your personal information, for example, when you |
| collect my personal information? | • open an account |
| | • provide account information |
| | • give us your contact information |
| | • make a wire transfer |
| | • tell us where to send the money |
| | We also collect your information from others, such as credit bureaus, affiliates, or other companies. |
| Why can’t I limit all sharing? | Federal law gives you the right to limit only |
| | • sharing for affiliates’ everyday business purposes – information about your creditworthiness |
| • affiliates from using your information to market to you |
| | • sharing for non-affiliates to market to you |
| | State laws and individual companies may give you additional rights to limit sharing. |
| Definitions | |
| Affiliates | Companies related by common ownership or control. They can be financial and nonfinancial companies. |
| • Our affiliates include companies such as Evermore Global Advisors, LLC. |
| Non-affiliates | Companies not related by common ownership or control. They can be financial and nonfinancial companies. |
| • Evermore Funds Trust doesn’t share with non-affiliates so they can market to you. |
| Joint marketing | A formal agreement between nonaffiliated financial companies that together market financial products or services to you. |
| • Evermore Funds Trust doesn’t jointly market. |
(This Page Intentionally Left Blank.)
Investment Adviser
EVERMORE GLOBAL ADVISORS, LLC
89 Summit Avenue
Summit, NJ 07901
Distributor
COMPASS DISTRIBUTORS, LLC
Three Canal Plaza, Suite 100
Portland, ME 04101
Custodian
U.S. BANK N.A.
Custody Operations
1555 N. RiverCenter Drive, Suite 302
Milwaukee, WI 53212
Transfer Agent, Fund Accountant and Fund Administrator
U.S. BANCORP FUND SERVICES, LLC,
doing business as U.S. Bank Global Fund Services
615 East Michigan Street
Milwaukee, WI 53202
Independent Registered Public Accounting Firm
ERNST & YOUNG LLP
220 South Sixth Street
Minneapolis, MN 55402
Legal Counsel
FAEGRE DRINKER BIDDLE & REATH LLP
One Logan Square, Suite 2000
Philadelphia, PA 19103
| | Ticker | Cusip |
| Evermore Global Value Fund | | |
| Investor Class | EVGBX | 300397106 |
| Institutional Class | EVGIX | 300397122 |
www.EvermoreGlobal.com
Item 2. Code of Ethics.
The registrant has adopted a code of ethics that applies to the registrant’s principal executive officer and principal financial officer. The registrant has not made any amendments to its code of ethics during the period covered by this report. The registrant has not granted any waivers from any provisions of the code of ethics during the period covered by this report.
A copy of the registrant’s Code of Ethics is filed herewith.
Item 3. Audit Committee Financial Expert.
The registrant’s Board of Trustees has determined that there is at least one audit committee financial expert serving on its audit committee. Eugene Bebout is the “audit committee financial expert” and is considered to be “independent” as each term is defined in Item 3 of Form N‑CSR.
Item 4. Principal Accountant Fees and Services.
The registrant has engaged its principal accountant, Ernst & Young LLP, to perform audit services, audit-related services and tax services during the past fiscal years. “Audit services” refer to performing an audit of the registrant's annual financial statements or services that are normally provided by the accountant in connection with statutory and regulatory filings or engagements for those fiscal years. “Audit-related services” refer to the assurance and related services by the principal accountant that are reasonably related to the performance of the audit. “Tax services” refer to professional services rendered by the principal accountant for tax compliance, tax advice, and tax planning including review of the registrant’s tax returns, taxable income, excise calculations, and year to date estimates for book-to-tax differences. There were no “Other services” provided by the principal accountant. The following table details the aggregate fees billed or expected to be billed for the last fiscal year for audit fees, audit-related fees and tax fees.
| | FYE 12/31/2018 | FYE 12/31/2019 |
Audit Fees | $58,000 | $65,800 |
Audit-Related Fees | N/A | N/A |
Tax Fees | $10,200 | $10,600 |
All Other Fees | N/A | N/A |
The audit committee has adopted pre-approval policies and procedures that require the audit committee to pre‑approve all audit and non‑audit services of the registrant, including services provided to any entity affiliated with the registrant.
The percentage of fees billed by Ernst & Young LLP applicable to non-audit services pursuant to waiver of pre-approval requirement were as follows:
| | FYE 12/31/2018 | FYE 12/31/2019 |
Audit-Related Fees | 0% | 0% |
Tax Fees | 0% | 0% |
All Other Fees | 0% | 0% |
All of the principal accountant’s hours spent on auditing the registrant’s financial statements were attributed to work performed by full‑time permanent employees of the principal accountant.
The following table indicates the non-audit fees billed or expected to be billed by the registrant’s accountant for services to the registrant and to the registrant’s investment adviser (and any other controlling entity, etc.—not sub-adviser) for the last year. The audit committee of the Board of Trustees has considered whether the provision of non-audit services that were rendered to the registrant's investment adviser is compatible with maintaining the principal accountant's independence and has concluded that the provision of such non-audit services by the accountant has not compromised the accountant’s independence.
Non-Audit Related Fees | FYE 12/31/2018 | FYE 12/31/2019 |
Registrant | $10,200 | $10,600 |
Registrant’s Investment Adviser | $0 | $0 |
Item 5. Audit Committee of Listed Registrants.
Not applicable to registrants who are not listed issuers (as defined in Rule 10A-3 under the Securities Exchange Act of 1934).
Item 6. Investments.
Schedule of Investments is included as part of the report to shareholders filed under Item 1 of this Form.
Item 7. Disclosure of Proxy Voting Policies and Procedures for Closed-End Management Investment Companies.
Not applicable to open-end investment companies.
Item 8. Portfolio Managers of Closed-End Management Investment Companies.
Not applicable to open-end investment companies.
Item 9. Purchases of Equity Securities by Closed‑End Management Investment Company and Affiliated Purchasers.
Not applicable to open-end investment companies.
Item 10. Submission of Matters to a Vote of Security Holders.
There have been no material changes to the procedures by which shareholders may recommend nominees to the registrant’s Board of Trustees.
Item 11. Controls and Procedures.
(a) | The Registrant’s Chief Executive Officer and Chief Financial Officer have reviewed the Registrant's disclosure controls and procedures (as defined in Rule 30a-3(c) under the Investment Company Act of 1940 (the “Act”)) as of a date within 90 days of the filing of this report, as required by Rule 30a-3(b) under the Act and Rules 13a-15(b) or 15d‑15(b) under the Securities Exchange Act of 1934. Based on their review, such officers have concluded that the disclosure controls and procedures are effective in ensuring that information required to be disclosed in this report is appropriately recorded, processed, summarized and reported and made known to them by others within the Registrant and by the Registrant’s service provider. |
(b) | There were no changes in the Registrant's internal control over financial reporting (as defined in Rule 30a-3(d) under the Act) that occurred during the last fiscal quarter of the period covered by this report that has materially affected, or is reasonably likely to materially affect, the Registrant's internal control over financial reporting. |
Item 12. Disclosure of Securities Lending Activities for Closed-End Management Investment Companies.
Not applicable to open-end investment companies.
Item 13. Exhibits.
| (a) | (1) Any code of ethics or amendment thereto, that is the subject of the disclosure required by Item 2, to the extent that the registrant intends to satisfy Item 2 requirements through filing an exhibit. Filed herewith. |
(2) A separate certification for each principal executive and principal financial officer pursuant to Section 302 of the Sarbanes-Oxley Act of 2002. Filed herewith.
(3) Any written solicitation to purchase securities under Rule 23c‑1 under the Act sent or given during the period covered by the report by or on behalf of the registrant to 10 or more persons. Not applicable to open-end investment companies.
(4) Change in the registrant’s independent public accountant. There was no change in the registrant’s independent public accountant for the period covered by this report.
| (b) | Certifications pursuant to Section 906 of the Sarbanes‑Oxley Act of 2002. Furnished herewith. |
SIGNATURES
Pursuant to the requirements of the Securities Exchange Act of 1934 and the Investment Company Act of 1940, the registrant has duly caused this report to be signed on its behalf by the undersigned, thereunto duly authorized.
(Registrant) Evermore Funds Trust
By (Signature and Title)* /s/Eric LeGoff
Eric LeGoff, Chief Executive Officer
Date March 6, 2020
Pursuant to the requirements of the Securities Exchange Act of 1934 and the Investment Company Act of 1940, this report has been signed below by the following persons on behalf of the registrant and in the capacities and on the dates indicated.
By (Signature and Title)* /s/Eric LeGoff
Eric LeGoff, Chief Executive Officer
Date March 6, 2020
By (Signature and Title)* /s/Bart Tesoriero
Bart Tesoriero, Chief Financial Officer
Date March 6, 2020
* Print the name and title of each signing officer under his or her signature.