UNITED STATES
SECURITIES AND EXCHANGE COMMISSION
Washington, D.C. 20549
Form N-CSR
CERTIFIED SHAREHOLDER REPORT OF REGISTERED
MANAGEMENT INVESTMENT COMPANIES
Investment Company Act File Number: 811-22336
Stock Portfolio
(Exact Name of Registrant as Specified in Charter)
One Post Office Square, Boston, Massachusetts 02109
(Address of Principal Executive Offices)
Deidre E. Walsh
One Post Office Square, Boston, Massachusetts 02109
(Name and Address of Agent for Services)
(617) 482-8260
(Registrant’s Telephone Number)
December 31
Date of Fiscal Year End
December 31, 2024
Date of Reporting Period
Item 1. Reports to Stockholders
Annual Shareholder Report December 31, 2024
This annual shareholder report contains important information about the Stock Portfolio (the "Fund") for the period of January 1, 2024 to December 31, 2024. You can find additional information about the Fund at www.eatonvance.com/open-end-mutual-fund-documents.php and selecting Eaton Vance Stock Fund. You can also request this information by contacting us at 1-800-262-1122.
What were the Fund costs for the last year?
(based on a hypothetical $10,000 investment)
| Fund Name | Costs of a $10,000 investment | Costs paid as a percentage of a $10,000 investment |
|---|
| Stock Portfolio | $73 | 0.63% |
|---|
How did the Fund perform last year and what affected its performance?
Key contributors to (↑) and detractors from (↓) performance, relative to the S&P 500® Index (the Index):
↑ An overweight position in NVIDIA Corp., a major microchip supplier for artificial intelligence (AI) applications, helped returns as NVIDIA’s stock price soared
↑ An overweight position in Broadcom, Inc. aided relative returns as its stock price doubled on AI-driven demand for its semiconductor and software products
↑ An overweight position in global retail and grocery giant Walmart, Inc. rose in value as its core U.S. retail business gained market share during the period
↑ Among sectors, stock selections and underweight exposures to health care and consumer staples, and stock selections in information technology, helped returns
↓ An overweight position in energy exploration and production firm ConocoPhillips fell in value as global energy demand and oil prices weakened during the period
↓ An overweight position in managed care company Elevance Health, Inc. — sold during the period — hurt returns as rising Medicaid costs depressed its stock price
↓ An underweight position in electric car maker Tesla Inc. hurt relative returns as its stock rose on optimism over the potential launch of an autonomous vehicle
↓ Among sectors, stock selections in energy and real estate detracted from Fund performance relative to the Index during the period
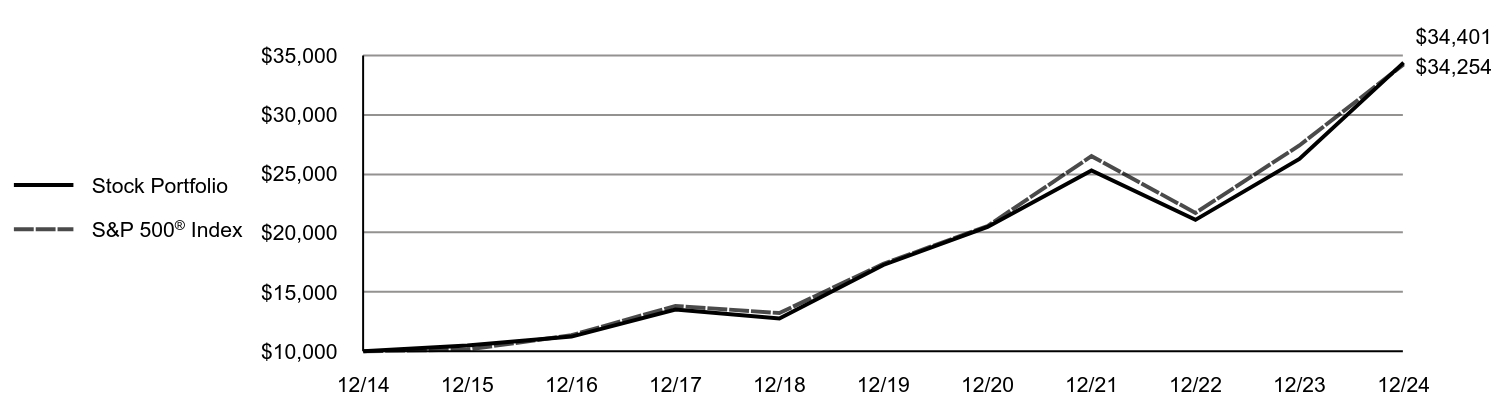
Comparison of the change in value of a $10,000 investment for the period indicated.
| Stock Portfolio | S&P 500® Index |
|---|
| 12/14 | $10,000 | $10,000 |
|---|
| 12/15 | $10,488 | $10,138 |
|---|
| 12/16 | $11,237 | $11,351 |
|---|
| 12/17 | $13,519 | $13,829 |
|---|
| 12/18 | $12,766 | $13,223 |
|---|
| 12/19 | $17,294 | $17,386 |
|---|
| 12/20 | $20,513 | $20,585 |
|---|
| 12/21 | $25,274 | $26,494 |
|---|
| 12/22 | $21,106 | $21,696 |
|---|
| 12/23 | $26,262 | $27,399 |
|---|
| 12/24 | $34,401 | $34,254 |
|---|
Average Annual Total Returns (%)
| Fund | 1 Year | 5 Years | 10 Years |
|---|
| Stock Portfolio | 30.99% | 14.75% | 13.15% |
|---|
S&P 500® Index | 25.02% | 14.51% | 13.09% |
|---|
Performance does not reflect the deduction of taxes that an investor would pay on distributions or redemptions. Performance assumes that all dividends and distributions, if any, were reinvested. For more recent performance information, visit www.eatonvance.com/performance.php.
THE FUND'S PAST PERFORMANCE IS NO GUARANTEE OF FUTURE RESULTS.
| Total Net Assets | $746,950,942 |
|---|
| # of Portfolio Holdings | 56 |
|---|
| Portfolio Turnover Rate | 44% |
|---|
| Total Advisory Fees Paid | $4,126,557 |
|---|
What did the Fund invest in?
The following tables reflect what the Fund invested in as of the report date.
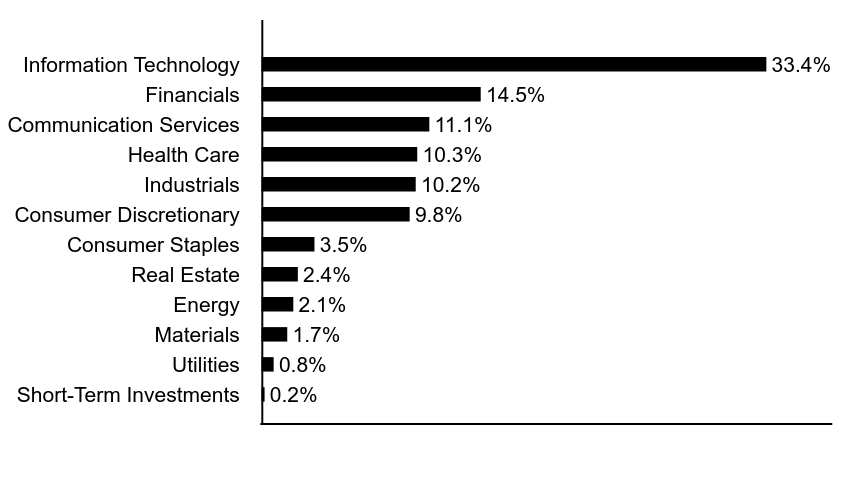
Sector Allocation (% of total investments)
| Value | Value |
|---|
| Short-Term Investments | 0.2% |
| Utilities | 0.8% |
| Materials | 1.7% |
| Energy | 2.1% |
| Real Estate | 2.4% |
| Consumer Staples | 3.5% |
| Consumer Discretionary | 9.8% |
| Industrials | 10.2% |
| Health Care | 10.3% |
| Communication Services | 11.1% |
| Financials | 14.5% |
| Information Technology | 33.4% |
Top Ten Holdings (% of total investments)Footnote Referencea
| Apple, Inc. | 7.7% |
| Microsoft Corp. | 7.6% |
| NVIDIA Corp. | 7.4% |
| Amazon.com, Inc. | 5.4% |
| Alphabet, Inc., Class C | 4.5% |
| Broadcom, Inc. | 3.6% |
| Meta Platforms, Inc., Class A | 3.1% |
| Eli Lilly & Co. | 2.3% |
| Visa, Inc., Class A | 2.2% |
| ConocoPhillips | 2.1% |
| Total | 45.9% |
| Footnote | Description |
Footnotea | Excluding cash equivalents |
If you wish to view additional information about the Fund, including the prospectus, statement of additional information, financial statements and holdings, please scan the QR code or visit www.eatonvance.com/open-end-mutual-fund-documents.php and select Eaton Vance Stock Fund. For proxy information, please visit www.eatonvance.com/proxyvoting.
The Funds may deliver a single copy of certain required shareholder documents (including prospectuses, shareholder reports, and proxy materials) to investors with the same last name and the same address. Your participation will continue indefinitely unless you instruct otherwise by calling 1-800-262-1122 or by contacting your financial intermediary. Your instruction will typically be effective within 30 days of receipt.
Not FDIC Insured | May Lose Value | No Bank Guarantee
Annual Shareholder Report December 31, 2024
Item 2. Code of Ethics
The registrant (sometimes referred to as the “Fund”) has adopted a code of ethics applicable to its Principal Executive Officer, Principal Financial Officer and Principal Accounting Officer. The registrant undertakes to provide a copy of such code of ethics to any person upon request, without charge, by calling 1-800-262-1122. The registrant has not amended the code of ethics as described in Form N-CSR during the period covered by this report. The registrant has not granted any waiver, including an implicit waiver, from a provision of the code of ethics as described in Form N-CSR during the period covered by this report.
Item 3. Audit Committee Financial Expert
The registrant’s Board of Trustees (the “Board”) has designated George J. Gorman and Scott E. Wennerholm, each an independent trustee, as audit committee financial experts. Mr. Gorman is a certified public accountant who is the Principal at George J. Gorman LLC (a consulting firm). Previously, Mr. Gorman served in various capacities at Ernst & Young LLP (a registered public accounting firm), including as Senior Partner. Mr. Gorman also has experience serving as an independent trustee and audit committee financial expert of other mutual fund complexes. Mr. Wennerholm is a private investor. Previously, Mr. Wennerholm served as a Trustee at Wheelock College (postsecondary institution), as a Consultant at GF Parish Group (executive recruiting firm), Chief Operating Officer and Executive Vice President at BNY Mellon Asset Management (investment management firm), Chief Operating Officer and Chief Financial Officer at Natixis Global Asset Management (investment management firm), and Vice President at Fidelity Investments Institutional Services (investment management firm).
Item 4. Principal Accountant Fees and Services
(a)-(d)
The following table presents the aggregate fees billed to the registrant for the registrant’s fiscal years ended December 31, 2023 and December 31, 2024 by the registrant’s principal accountant, Deloitte & Touche LLP (“D&T”), for professional services rendered for the audit of the registrant’s annual financial statements and fees billed for other services rendered by D&T during such periods.
| | | | | | | | |
Fiscal Years Ended | | 12/31/23 | | | 12/31/24 | |
Audit Fees | | $ | 35,600 | | | $ | 32,100 | |
Audit-Related Fees(1) | | $ | 0 | | | $ | 0 | |
Tax Fees(2) | | $ | 0 | | | $ | 0 | |
All Other Fees(3) | | $ | 0 | | | $ | 0 | |
| | | | | | | | |
Total | | $ | 35,600 | | | $ | 32,100 | |
| | | | | | | | |
| (1) | Audit-related fees consist of the aggregate fees billed for assurance and related services that are reasonably related to the performance of the audit of the registrant’s financial statements and are not reported under the category of audit fees. |
| (2) | Tax fees consist of the aggregate fees billed for professional services rendered by the principal accountant relating to tax compliance, tax advice, and tax planning and specifically include fees for tax return preparation and other related tax compliance/planning matters. |
| (3) | All other fees consist of the aggregate fees billed for products and services provided by the principal accountant other than audit, audit-related, and tax services. |
(e)(1) The registrant’s audit committee has adopted policies and procedures relating to the pre-approval of services provided by the registrant’s principal accountant (the “Pre-Approval Policies”). The Pre-Approval Policies establish a framework intended to assist the audit committee in the proper discharge of its pre-approval responsibilities. As a general matter, the Pre-Approval Policies (i) specify certain types of audit, audit-related, tax, and other services determined to be pre-approved by the audit committee; and (ii) delineate specific procedures governing the mechanics of the pre-approval process, including the approval and monitoring of audit and non-audit service fees. Unless a service is specifically pre-approved under the Pre-Approval Policies, it must be separately pre-approved by the audit committee.
The Pre-Approval Policies and the types of audit and non-audit services pre-approved therein must be reviewed and ratified by the registrant’s audit committee at least annually. The registrant’s audit committee maintains full responsibility for the appointment, compensation, and oversight of the work of the registrant’s principal accountant.
(e)(2) No services described in paragraphs (b)-(d) above were approved by the registrant’s audit committee pursuant to the “de minimis exception” set forth in Rule 2-01(c)(7)(i)(C) of Regulation S-X.
(f) Not applicable.
(g) The following table presents (i) the aggregate non-audit fees (i.e., fees for audit-related, tax, and other services) billed to the registrant by D&T for the registrant’s fiscal years ended December 31, 2023 and December 31, 2024; and (ii) the aggregate non-audit fees (i.e., fees for audit-related, tax, and other services) billed to the Eaton Vance organization by D&T for the same time periods.
| | | | | | | | |
Fiscal Years Ended | | 12/31/23 | | | 12/31/24 | |
Registrant | | $ | 0 | | | $ | 0 | |
Eaton Vance(1) | | $ | 0 | | | $ | 18,490 | |
| (1) | The investment adviser to the registrant, as well as any of its affiliates that provide ongoing services to the registrant, are subsidiaries of Morgan Stanley. |
(h) The registrant’s audit committee has considered whether the provision by the registrant’s principal accountant of non-audit services to the registrant’s investment adviser and any entity controlling, controlled by, or under common control with the adviser that provides ongoing services to the registrant that were not pre-approved pursuant to Rule 2-01(c)(7)(ii) of Regulation S-X is compatible with maintaining the principal accountant’s independence.
(i) Not applicable.
(j) Not applicable.
Item 5. Audit Committee of Listed Registrants
Not applicable.
Item 6. Schedule of Investments
| (a) | Please see schedule of investments contained in the Financial Statements and Financial Highlights included under Item 7 of this Form N-CSR. |
Item 7. Financial Statements and Financial Highlights for Open-End Management Investment Companies
Stock Portfolio
December 31, 2024
| Security | Shares | Value |
| Aerospace & Defense — 1.0% |
| HEICO Corp. | | 30,352 | $ 7,215,885 |
| | | | $ 7,215,885 |
| Automobiles — 0.5% |
| Tesla, Inc.(1) | | 9,359 | $ 3,779,539 |
| | | | $ 3,779,539 |
| Biotechnology — 1.7% |
| AbbVie, Inc. | | 71,817 | $ 12,761,881 |
| | | | $ 12,761,881 |
| Broadline Retail — 5.4% |
| Amazon.com, Inc.(1) | | 183,542 | $ 40,267,279 |
| | | | $ 40,267,279 |
| Building Products — 1.1% |
| Carrier Global Corp. | | 118,240 | $ 8,071,062 |
| | | | $ 8,071,062 |
| Capital Markets — 6.9% |
| Blue Owl Capital, Inc. | | 491,862 | $ 11,440,710 |
| Intercontinental Exchange, Inc. | | 63,466 | 9,457,069 |
| S&P Global, Inc. | | 21,712 | 10,813,228 |
| Stifel Financial Corp. | | 75,529 | 8,012,116 |
| Tradeweb Markets, Inc., Class A | | 91,859 | 12,026,180 |
| | | | $ 51,749,303 |
| Chemicals — 0.7% |
| Linde PLC | | 12,694 | $ 5,314,597 |
| | | | $ 5,314,597 |
| Commercial Services & Supplies — 1.1% |
| Waste Connections, Inc. | | 46,679 | $ 8,009,183 |
| | | | $ 8,009,183 |
| Communications Equipment — 0.6% |
| Arista Networks, Inc.(1) | | 38,144 | $ 4,216,056 |
| | | | $ 4,216,056 |
| Consumer Staples Distribution & Retail — 3.5% |
| BJ's Wholesale Club Holdings, Inc.(1) | | 140,026 | $ 12,511,323 |
| Security | Shares | Value |
| Consumer Staples Distribution & Retail (continued) |
| Walmart, Inc. | | 154,606 | $ 13,968,652 |
| | | | $ 26,479,975 |
| Containers & Packaging — 1.0% |
| AptarGroup, Inc. | | 45,687 | $ 7,177,428 |
| | | | $ 7,177,428 |
| Electrical Equipment — 1.5% |
| AMETEK, Inc. | | 62,095 | $ 11,193,245 |
| | | | $ 11,193,245 |
| Entertainment — 3.0% |
| Liberty Media Corp.-Liberty Formula One, Class C(1) | | 62,454 | $ 5,786,987 |
| Netflix, Inc.(1) | | 15,928 | 14,196,945 |
| Spotify Technology SA(1) | | 6,223 | 2,784,046 |
| | | | $ 22,767,978 |
| Financial Services — 4.2% |
| Mr. Cooper Group, Inc.(1) | | 48,914 | $ 4,696,233 |
| Shift4 Payments, Inc., Class A(1) | | 99,311 | 10,306,496 |
| Visa, Inc., Class A | | 51,136 | 16,161,021 |
| | | | $ 31,163,750 |
| Ground Transportation — 1.3% |
| Uber Technologies, Inc.(1) | | 160,369 | $ 9,673,458 |
| | | | $ 9,673,458 |
| Health Care Equipment & Supplies — 3.3% |
| Abbott Laboratories | | 65,340 | $ 7,390,607 |
| Edwards Lifesciences Corp.(1) | | 109,041 | 8,072,305 |
| Intuitive Surgical, Inc.(1) | | 17,537 | 9,153,613 |
| | | | $ 24,616,525 |
| Health Care Providers & Services — 1.8% |
| UnitedHealth Group, Inc. | | 26,786 | $ 13,549,966 |
| | | | $ 13,549,966 |
| Hotels, Restaurants & Leisure — 1.2% |
| Marriott International, Inc., Class A | | 32,568 | $ 9,084,518 |
| | | | $ 9,084,518 |
| Insurance — 3.3% |
| Allstate Corp. | | 78,799 | $ 15,191,659 |
| Arthur J. Gallagher & Co. | | 34,670 | 9,841,080 |
| | | | $ 25,032,739 |
13
See Notes to Financial Statements.
Stock Portfolio
December 31, 2024
Portfolio of Investments — continued
| Security | Shares | Value |
| Interactive Media & Services — 7.6% |
| Alphabet, Inc., Class C | | 176,101 | $ 33,536,674 |
| Meta Platforms, Inc., Class A | | 40,084 | 23,469,583 |
| | | | $ 57,006,257 |
| IT Services — 1.2% |
| Gartner, Inc.(1) | | 19,207 | $ 9,305,215 |
| | | | $ 9,305,215 |
| Life Sciences Tools & Services — 1.2% |
| Thermo Fisher Scientific, Inc. | | 16,954 | $ 8,819,979 |
| | | | $ 8,819,979 |
| Machinery — 0.9% |
| Parker-Hannifin Corp. | | 10,852 | $ 6,902,198 |
| | | | $ 6,902,198 |
| Media — 0.4% |
| Trade Desk, Inc., Class A(1) | | 28,793 | $ 3,384,041 |
| | | | $ 3,384,041 |
| Multi-Utilities — 0.8% |
| Sempra | | 66,143 | $ 5,802,064 |
| | | | $ 5,802,064 |
| Oil, Gas & Consumable Fuels — 2.1% |
| ConocoPhillips | | 155,432 | $ 15,414,191 |
| | | | $ 15,414,191 |
| Pharmaceuticals — 2.3% |
| Eli Lilly & Co. | | 22,594 | $ 17,442,568 |
| | | | $ 17,442,568 |
| Professional Services — 3.4% |
| Automatic Data Processing, Inc. | | 25,227 | $ 7,384,700 |
| Booz Allen Hamilton Holding Corp. | | 27,589 | 3,550,704 |
| TransUnion | | 156,526 | 14,511,525 |
| | | | $ 25,446,929 |
| Real Estate Management & Development — 2.4% |
| CoStar Group, Inc.(1) | | 103,889 | $ 7,437,414 |
| FirstService Corp. | | 58,700 | 10,625,874 |
| | | | $ 18,063,288 |
| Semiconductors & Semiconductor Equipment — 13.9% |
| Analog Devices, Inc. | | 43,602 | $ 9,263,681 |
| Security | Shares | Value |
| Semiconductors & Semiconductor Equipment (continued) |
| Broadcom, Inc. | | 117,401 | $ 27,218,248 |
| Lam Research Corp. | | 166,180 | 12,003,181 |
| NVIDIA Corp. | | 410,903 | 55,180,164 |
| | | | $103,665,274 |
| Software — 10.1% |
| Fair Isaac Corp.(1) | | 4,810 | $ 9,576,373 |
| Microsoft Corp. | | 134,763 | 56,802,605 |
| Palo Alto Networks, Inc.(1) | | 48,906 | 8,898,936 |
| | | | $ 75,277,914 |
| Specialty Retail — 2.7% |
| Burlington Stores, Inc.(1) | | 36,378 | $ 10,369,913 |
| TJX Cos., Inc. | | 78,543 | 9,488,780 |
| | | | $ 19,858,693 |
| Technology Hardware, Storage & Peripherals — 7.7% |
| Apple, Inc. | | 229,015 | $ 57,349,936 |
| | | | $ 57,349,936 |
Total Common Stocks
(identified cost $406,750,876) | | | $745,862,914 |
| Short-Term Investments — 0.2% |
| Security | Shares | Value |
| Morgan Stanley Institutional Liquidity Funds - Government Portfolio, Institutional Class, 4.43%(2) | | 1,361,413 | $ 1,361,413 |
Total Short-Term Investments
(identified cost $1,361,413) | | | $ 1,361,413 |
Total Investments — 100.0%
(identified cost $408,112,289) | | | $747,224,327 |
| Other Assets, Less Liabilities — (0.0)%(3) | | | $ (273,385) |
| Net Assets — 100.0% | | | $746,950,942 |
| The percentage shown for each investment category in the Portfolio of Investments is based on net assets. |
| (1) | Non-income producing security. |
| (2) | May be deemed to be an affiliated investment company (see Note 6). The rate shown is the annualized seven-day yield as of December 31, 2024. |
| (3) | Amount is less than (0.05)%. |
14
See Notes to Financial Statements.
Stock Portfolio
December 31, 2024
Statement of Assets and Liabilities
| | December 31, 2024 |
| Assets | |
| Unaffiliated investments, at value (identified cost $406,750,876) | $745,862,914 |
| Affiliated investments, at value (identified cost $1,361,413) | 1,361,413 |
| Dividends receivable | 269,739 |
| Dividends receivable from affiliated investments | 6,573 |
| Tax reclaims receivable | 20,182 |
| Trustees' deferred compensation plan | 67,529 |
| Total assets | $747,588,350 |
| Liabilities | |
| Payable to affiliates: | |
| Investment adviser fee | $384,054 |
| Trustees' fees | 10,961 |
| Trustees' deferred compensation plan | 67,529 |
| Payable for custodian fee | 104,486 |
| Payable for legal and accounting services | 48,311 |
| Accrued expenses | 22,067 |
| Total liabilities | $637,408 |
| Net Assets applicable to investors' interest in Portfolio | $746,950,942 |
15
See Notes to Financial Statements.
Stock Portfolio
December 31, 2024
| | Year Ended |
| | December 31, 2024 |
| Investment Income | |
| Dividend income (net of foreign taxes withheld of $29,617) | $5,907,690 |
| Dividend income from affiliated investments | 266,103 |
| Total investment income | $6,173,793 |
| Expenses | |
| Investment adviser fee | $4,134,015 |
| Trustees’ fees and expenses | 52,015 |
| Custodian fee | 169,665 |
| Legal and accounting services | 41,423 |
| Miscellaneous | 21,240 |
| Total expenses | $4,418,358 |
| Deduct: | |
| Waiver and/or reimbursement of expenses by affiliates | $7,458 |
| Total expense reductions | $7,458 |
| Net expenses | $4,410,900 |
| Net investment income | $1,762,893 |
| Realized and Unrealized Gain (Loss) | |
| Net realized gain (loss): | |
| Investment transactions | $68,213,188 |
| Foreign currency transactions | (47) |
| Net realized gain | $68,213,141 |
| Change in unrealized appreciation (depreciation): | |
| Investments | $112,518,034 |
| Foreign currency | (138) |
| Net change in unrealized appreciation (depreciation) | $112,517,896 |
| Net realized and unrealized gain | $180,731,037 |
| Net increase in net assets from operations | $182,493,930 |
16
See Notes to Financial Statements.
Stock Portfolio
December 31, 2024
Statements of Changes in Net Assets
| | Year Ended December 31, |
| | 2024 | 2023 |
| Increase (Decrease) in Net Assets | | |
| From operations: | | |
| Net investment income | $1,762,893 | $3,395,003 |
| Net realized gain | 68,213,141 | 45,840,944 |
| Net change in unrealized appreciation (depreciation) | 112,517,896 | 74,502,318 |
| Net increase in net assets from operations | $182,493,930 | $123,738,265 |
| Capital transactions: | | |
| Contributions | $33,145,342 | $11,099,572 |
| Withdrawals | (63,170,365) | (90,392,247) |
| Net decrease in net assets from capital transactions | $(30,025,023) | $(79,292,675) |
| Net increase in net assets | $152,468,907 | $44,445,590 |
| Net Assets | | |
| At beginning of year | $594,482,035 | $550,036,445 |
| At end of year | $746,950,942 | $594,482,035 |
17
See Notes to Financial Statements.
Stock Portfolio
December 31, 2024
| | Year Ended December 31, |
| Ratios/Supplemental Data | 2024 | 2023 | 2022 | 2021 | 2020 |
| Ratios (as a percentage of average daily net assets):(1) | | | | | |
| Total expenses | 0.63% | 0.64% | 0.64% | 0.63% | 0.64% |
| Net expenses | 0.63%(2) | 0.64%(2) | 0.64%(2) | 0.63% | 0.64% |
| Net investment income | 0.25% | 0.60% | 0.82% | 0.55% | 0.84% |
| Portfolio Turnover | 44% | 44% | 52% | 44% | 70% |
| Total Return | 30.99% | 24.43% | (16.49)% | 23.21% | 18.61% |
| Net assets, end of year (000’s omitted) | $746,951 | $594,482 | $550,036 | $871,310 | $804,446 |
| (1) | Total expenses do not reflect amounts reimbursed and/or waived by the adviser and certain of its affiliates, if applicable. Net expenses are net of all reductions and represent the net expenses paid by the Portfolio. |
| (2) | Includes a reduction by the investment adviser of a portion of its adviser fee due to the Portfolio’s investment in the Liquidity Fund (equal to less than 0.005% of average daily net assets for the years ended December 31, 2024, 2023 and 2022). |
18
See Notes to Financial Statements.
Stock Portfolio
December 31, 2024
Notes to Financial Statements
1 Significant Accounting Policies
Stock Portfolio (the Portfolio) is a Massachusetts business trust registered under the Investment Company Act of 1940, as amended (the 1940 Act), as a diversified, open-end management investment company. The Portfolio's investment objective is to achieve long-term capital appreciation by investing in a diversified portfolio of equity securities. The Declaration of Trust permits the Trustees to issue interests in the Portfolio. At December 31, 2024, Eaton Vance Stock Fund and Eaton Vance Balanced Fund held an interest of 13.2% and 86.8%, respectively, in the Portfolio.
The following is a summary of significant accounting policies of the Portfolio. The policies are in conformity with accounting principles generally accepted in the United States of America (U.S. GAAP). The Portfolio is an investment company and follows accounting and reporting guidance in the Financial Accounting Standards Board (FASB) Accounting Standards Codification Topic 946.
A Investment Valuation—The following methodologies are used to determine the market value or fair value of investments.
Equity Securities. Equity securities listed on a U.S. securities exchange generally are valued at the last sale or closing price on the day of valuation or, if no sales took place on such date, at the mean between the closing bid and ask prices on the exchange where such securities are principally traded. Equity securities listed on the NASDAQ National Market System are valued at the NASDAQ official closing price. Unlisted or listed securities for which closing sales prices or closing quotations are not available are valued at the mean between the latest available bid and ask prices.
Foreign Currencies. Foreign currencies are valued in U.S. dollars, based on foreign currency exchange rate quotations supplied by a third party pricing service. The pricing service uses a proprietary model to determine the exchange rate. Inputs to the model include reported trades and implied bid/ask spreads.
Other. Investments in management investment companies (including money market funds) that do not trade on an exchange are valued at the net asset value as of the close of each business day.
Fair Valuation. In connection with Rule 2a-5 of the 1940 Act, the Trustees have designated the Portfolio’s investment adviser as its valuation designee. Investments for which valuations or market quotations are not readily available or are deemed unreliable are valued by the investment adviser, as valuation designee, at fair value using methods that most fairly reflect the security’s “fair value”, which is the amount that the Portfolio might reasonably expect to receive for the security upon its current sale in the ordinary course. Each such determination is based on a consideration of relevant factors, which are likely to vary from one pricing context to another. These factors may include, but are not limited to, the type of security, the existence of any contractual restrictions on the security’s disposition, the price and extent of public trading in similar securities of the issuer or of comparable companies or entities, quotations or relevant information obtained from broker/dealers or other market participants, information obtained from the issuer, analysts, and/or the appropriate stock exchange (for exchange-traded securities), an analysis of the company’s or entity’s financial statements, and an evaluation of the forces that influence the issuer and the market(s) in which the security is purchased and sold.
B Investment Transactions—Investment transactions for financial statement purposes are accounted for on a trade date basis. Realized gains and losses on investments sold are determined on the basis of identified cost.
C Income—Dividend income is recorded on the ex-dividend date for dividends received in cash and/or securities. However, if the ex-dividend date has passed, certain dividends from foreign securities are recorded as the Portfolio is informed of the ex-dividend date. Withholding taxes on foreign dividends and capital gains have been provided for in accordance with the Portfolio’s understanding of the applicable countries’ tax rules and rates.
D Federal Taxes—The Portfolio has elected to be treated as a partnership for federal tax purposes. No provision is made by the Portfolio for federal or state taxes on any taxable income of the Portfolio because each investor in the Portfolio is ultimately responsible for the payment of any taxes on its share of taxable income. Since at least one of the Portfolio's investors is a regulated investment company that invests all or substantially all of its assets in the Portfolio, the Portfolio normally must satisfy the applicable source of income and diversification requirements (under the Internal Revenue Code) in order for its investors to satisfy them. The Portfolio will allocate, at least annually among its investors, each investor's distributive share of the Portfolio's net investment income, net realized capital gains and losses and any other items of income, gain, loss, deduction or credit.
As of December 31, 2024, the Portfolio had no uncertain tax positions that would require financial statement recognition, de-recognition, or disclosure. The Portfolio files a U.S. federal income tax return annually after its fiscal year-end, which is subject to examination by the Internal Revenue Service for a period of three years from the date of filing.
E Foreign Currency Translation—Other assets and liabilities initially expressed in foreign currencies are translated each business day into U.S. dollars based upon current exchange rates. Income and expenses denominated in foreign currencies are translated into U.S. dollars based upon currency exchange rates in effect on the respective dates of such transactions.
F Use of Estimates—The preparation of the financial statements in conformity with U.S. GAAP requires management to make estimates and assumptions that affect the reported amounts of assets and liabilities at the date of the financial statements and the reported amounts of income and expense during the reporting period. Actual results could differ from those estimates.
Stock Portfolio
December 31, 2024
Notes to Financial Statements — continued
G Indemnifications—Under the Portfolio’s organizational documents, its officers and Trustees may be indemnified against certain liabilities and expenses arising out of the performance of their duties to the Portfolio. Under Massachusetts law, if certain conditions prevail, interestholders in the Portfolio could be deemed to have personal liability for the obligations of the Portfolio. However, the Portfolio’s Declaration of Trust contains an express disclaimer of liability on the part of Portfolio interestholders. Additionally, in the normal course of business, the Portfolio enters into agreements with service providers that may contain indemnification clauses. The Portfolio’s maximum exposure under these arrangements is unknown as this would involve future claims that may be made against the Portfolio that have not yet occurred.
H Segment Reporting—During the year ended December 31, 2024, the Portfolio adopted FASB Accounting Standards Update No. 2023-07, Segment Reporting (Topic 280): Improvements to Reportable Segment Disclosures, (ASU 2023-07), which requires incremental disclosures related to a public entity’s reportable segments. The Portfolio operates as a single reportable segment, an investment company whose investment objective is included in Note 1. In connection with the adoption of ASU 2023-07, the Portfolio’s President has been designated as the Portfolio’s Chief Operating Decision Maker (CODM), who is responsible for assessing the performance of the Portfolio’s single segment and deciding how to allocate the segment’s resources. To perform this function, the CODM reviews the information in the Portfolio’s Financial Statements.
2 Investment Adviser Fee and Other Transactions with Affiliates
The investment adviser fee is earned by Boston Management and Research (BMR), an indirect, wholly-owned subsidiary of Morgan Stanley, as compensation for investment advisory services rendered to the Portfolio. The fee is computed at an annual rate as a percentage of the Portfolio’s average daily net assets as follows and is payable monthly:
| Average Daily Net Assets | Annual Fee Rate |
| Up to $500 million | 0.600% |
| $500 million but less than $1 billion | 0.575% |
| $1 billion but less than $2.5 billion | 0.550% |
| $2.5 billion but less than $5 billion | 0.530% |
| $5 billion and over | 0.515% |
For the year ended December 31, 2024, the Portfolio's investment adviser fee amounted to $4,134,015 or 0.59% of the Portfolio’s average daily net assets.
The Portfolio may invest in a money market fund, the Institutional Class of the Morgan Stanley Institutional Liquidity Funds - Government Portfolio (the “Liquidity Fund”), an open-end management investment company managed by Morgan Stanley Investment Management Inc., a wholly-owned subsidiary of Morgan Stanley. The investment adviser fee paid by the Portfolio is reduced by an amount equal to its pro rata share of the advisory and administration fees paid by the Portfolio due to its investment in the Liquidity Fund. For the year ended December 31, 2024, the investment adviser fee paid was reduced by $7,458 relating to the Portfolio's investment in the Liquidity Fund.
Trustees and officers of the Portfolio who are members of BMR’s organization receive remuneration for their services to the Portfolio out of the investment adviser fee. Trustees of the Portfolio who are not affiliated with the investment adviser may elect to defer receipt of all or a percentage of their annual fees in accordance with the terms of the Trustees Deferred Compensation Plan. Certain officers and Trustees of the Portfolio are officers of the above organization.
3 Purchases and Sales of Investments
Purchases and sales of investments, other than short-term obligations, aggregated $301,702,360 and $328,789,003, respectively, for the year ended December 31, 2024.
Stock Portfolio
December 31, 2024
Notes to Financial Statements — continued
4 Federal Income Tax Basis of Investments
The cost and unrealized appreciation (depreciation) of investments of the Portfolio at December 31, 2024, as determined on a federal income tax basis, were as follows:
| Aggregate cost | $413,064,757 |
| Gross unrealized appreciation | $338,878,697 |
| Gross unrealized depreciation | (4,719,127) |
| Net unrealized appreciation | $334,159,570 |
5 Line of Credit
The Portfolio participates with other portfolios and funds managed by BMR and its affiliates in a $650 million unsecured revolving line of credit agreement with a group of banks, which is in effect through October 21, 2025. Borrowings are made by the Portfolio solely for temporary purposes related to redemptions and other short-term cash needs. Interest is charged to the Portfolio based on its borrowings generally at an amount above either the Secured Overnight Financing Rate (SOFR) or Federal Funds rate. In addition, a fee computed at an annual rate of 0.15% on the daily unused portion of the line of credit is allocated among the participating portfolios and funds at the end of each quarter. In connection with the renewal of the agreement in October 2024, an arrangement fee of $150,000 was incurred that was allocated to the participating portfolios and funds. Because the line of credit is not available exclusively to the Portfolio, it may be unable to borrow some or all of its requested amounts at any particular time. The Portfolio did not have any significant borrowings or allocated fees during the year ended December 31, 2024.
6 Affiliated Investments
At December 31, 2024, the value of the Portfolio's investment in funds that may be deemed to be affiliated was $1,361,413, which represents 0.2% of the Portfolio's net assets. Transactions in such investments by the Portfolio for the year ended December 31, 2024 were as follows:
| Name | Value,
beginning
of period | Purchases | Sales
proceeds | Net realized
gain (loss) | Change in
unrealized
appreciation
(depreciation) | Value, end
of period | Dividend
income | Shares,
end of period |
| Short-Term Investments |
| Liquidity Fund | $2,428,547 | $115,605,406 | $(116,672,540) | $ — | $ — | $1,361,413 | $266,103 | 1,361,413 |
7 Fair Value Measurements
Under generally accepted accounting principles for fair value measurements, a three-tier hierarchy to prioritize the assumptions, referred to as inputs, is used in valuation techniques to measure fair value. The three-tier hierarchy of inputs is summarized in the three broad levels listed below.
| • | Level 1 – quoted prices in active markets for identical investments |
| • | Level 2 – other significant observable inputs (including quoted prices for similar investments, interest rates, prepayment speeds, credit risk, etc.) |
| • | Level 3 – significant unobservable inputs (including a fund's own assumptions in determining the fair value of investments) |
In cases where the inputs used to measure fair value fall in different levels of the fair value hierarchy, the level disclosed is determined based on the lowest level input that is significant to the fair value measurement in its entirety. The inputs or methodology used for valuing securities are not necessarily an indication of the risk associated with investing in those securities.
Stock Portfolio
December 31, 2024
Notes to Financial Statements — continued
At December 31, 2024, the hierarchy of inputs used in valuing the Portfolio's investments, which are carried at fair value, were as follows:
| Asset Description | Level 1 | Level 2 | Level 3 | Total |
| Common Stocks | $745,862,914* | $ — | $ — | $745,862,914 |
| Short-Term Investments | 1,361,413 | — | — | 1,361,413 |
| Total Investments | $ 747,224,327 | $ — | $ — | $747,224,327 |
| * | The level classification by major category of investments is the same as the category presentation in the Portfolio of Investments. |
Stock Portfolio
December 31, 2024
Report of Independent Registered Public Accounting Firm
To the Trustees and Investors of Stock Portfolio:
Opinion on the Financial Statements and Financial Highlights
We have audited the accompanying statement of assets and liabilities of Stock Portfolio (the “Portfolio”), including the portfolio of investments, as of December 31, 2024, the related statement of operations for the year then ended, the statements of changes in net assets for each of the two years in the period then ended, the financial highlights for each of the five years in the period then ended, and the related notes. In our opinion, the financial statements and financial highlights present fairly, in all material respects, the financial position of the Portfolio as of December 31, 2024, and the results of its operations for the year then ended, the changes in its net assets for each of the two years in the period then ended, and the financial highlights for each of the five years in the period then ended, in conformity with accounting principles generally accepted in the United States of America.
Basis for Opinion
These financial statements and financial highlights are the responsibility of the Portfolio's management. Our responsibility is to express an opinion on the Portfolio's financial statements and financial highlights based on our audits. We are a public accounting firm registered with the Public Company Accounting Oversight Board (United States) (PCAOB) and are required to be independent with respect to the Portfolio in accordance with the U.S. federal securities laws and the applicable rules and regulations of the Securities and Exchange Commission and the PCAOB.
We conducted our audits in accordance with the standards of the PCAOB. Those standards require that we plan and perform the audit to obtain reasonable assurance about whether the financial statements and financial highlights are free of material misstatement, whether due to error or fraud. The Portfolio is not required to have, nor were we engaged to perform, an audit of its internal control over financial reporting. As part of our audits, we are required to obtain an understanding of internal control over financial reporting but not for the purpose of expressing an opinion on the effectiveness of the Portfolio’s internal control over financial reporting. Accordingly, we express no such opinion.
Our audits included performing procedures to assess the risks of material misstatement of the financial statements and financial highlights, whether due to error or fraud, and performing procedures that respond to those risks. Such procedures included examining, on a test basis, evidence regarding the amounts and disclosures in the financial statements and financial highlights. Our audits also included evaluating the accounting principles used and significant estimates made by management, as well as evaluating the overall presentation of the financial statements and financial highlights. Our procedures included confirmation of securities owned as of December 31, 2024, by correspondence with the custodian and brokers; when replies were not received from brokers, we performed other auditing procedures. We believe that our audits provide a reasonable basis for our opinion.
/s/ Deloitte & Touche LLP
Boston, Massachusetts
February 21, 2025
We have served as the auditor of one or more Eaton Vance investment companies since 1959.
This Page Intentionally Left Blank
Item 8. Changes in and Disagreements with Accountants for Open-End Management Investment Companies
Not applicable.
Item 9. Proxy Disclosures for Open-End Management Investment Companies
Not applicable.
Item 10. Remuneration Paid to Directors, Officers, and Others of Open-End Management Investment Companies
The information is disclosed as part of the Financial Statements included in Item 7 of this Form N-CSR.
Item 11. Statement Regarding Basis for Approval of Investment Advisory Contract
Not applicable.
Item 12. Disclosure of Proxy Voting Policies and Procedures for Closed-End Management Investment Companies
Not applicable.
Item 13. Portfolio Managers of Closed-End Management Investment Companies
Not applicable.
Item 14. Purchases of Equity Securities by Closed-End Management Investment Company and Affiliated Purchasers
Not applicable.
Item 15. Submission of Matters to a Vote of Security Holders
There have been no material changes to the procedures by which shareholders may recommend nominee to the Portfolio’s Board of Trustees since the Portfolio last provided disclosure in response to this item.
Item 16. Controls and Procedures
| (a) | It is the conclusion of the registrant’s principal executive officer and principal financial officer that the effectiveness of the registrant’s current disclosure controls and procedures (such disclosure controls and procedures having been evaluated within 90 days of the date of this filing) provide reasonable assurance that the information required to be disclosed by the registrant has been recorded, processed, summarized and reported within the time period specified in the Commission’s rules and forms and that the information required to be disclosed by the registrant has been accumulated and communicated to the registrant’s principal executive officer and principal financial officer in order to allow timely decisions regarding required disclosure. |
| (b) | There have been no changes in the registrant’s internal control over financial reporting during the period covered by this report that has materially affected, or is reasonably likely to materially affect, the registrant’s internal control over financial reporting. |
Item 17. Disclosure of Securities Lending Activities for Closed-End Management Investment Companies
Not applicable.
Item 18. Recovery of Erroneously Awarded Compensation
Not applicable.
Item 19. Exhibits
Signatures
Pursuant to the requirements of the Securities Exchange Act of 1934 and the Investment Company Act of 1940, the registrant has duly caused this report to be signed on its behalf by the undersigned, thereunto duly authorized.
| | |
| Stock Portfolio |
| |
| By: | | /s/ R. Kelly Williams, Jr. |
| | R. Kelly Williams, Jr. |
| | Principal Executive Officer |
| |
| Date: | | February 26, 2025 |
Pursuant to the requirements of the Securities Exchange Act of 1934 and the Investment Company Act of 1940, this report has been signed below by the following persons on behalf of the registrant and in the capacities and on the dates indicated.
| | |
| |
| By: | | /s/ James F. Kirchner |
| | James F. Kirchner |
| | Principal Financial Officer |
| |
| Date: | | February 26, 2025 |
| | |
| |
| By: | | /s/ R. Kelly Williams, Jr. |
| | R. Kelly Williams, Jr. |
| | Principal Executive Officer |
| |
| Date: | | February 26, 2025 |