Exhibit 99.1
| CBTX, Inc. Investor Presentation September 21 – 23, 2020 NASDAQ: CBTX |
| 2 SAFE HARBOR STATEMENT AND NON-GAAP FINANCIAL MEASURES NON-GAAP FINANCIAL MEASURES This presentation contains certain non-GAAP (generally accepted accounting principles) financial measures, including tangible equity, tangible assets, tangible book value per share, tangible equity to tangible assets, return on tangible shareholders’ equity, return on average tangible equity, and pre-provision net revenue. The non-GAAP financial measures that CBTX, Inc.(the “Company”) discusses in this presentation should not be considered in isolation or as a substitute for the most directly comparable or other financial measures calculated in accordance with GAAP.A reconciliation of the non-GAAP financial measures used in this presentation to the most directly comparable GAAP measures is provided at the end of this presentation. FORWARD-LOOKING STATEMENTS This presentation may contain certain forward-looking statements within the meaning of the securities laws that are based on various facts and derived utilizing important assumptions, current expectations, estimates and projections about the Company and its subsidiary. Forward-looking statements include information regarding the Company’s future financial performance, business and growth strategy, projected plans and objectives, as well as projections of macroeconomic and industry trends, which are inherently unreliable due to the multiple factors that impact economic trends, and any such variations may be material. Statements preceded by, followed by or that otherwise include the words “believes,” “expects,” “anticipates,” “intends,” “projects,” “estimates,” “plans” and similar expressions or future or conditional verbs such as “will,” “should,” “would,” “may” and “could” are generally forward-looking in nature and not historical facts, although not all forward-looking statements include the foregoing. Further, certain factors that could affect our future results and cause actual results to differ materially from those expressed in the forward-looking statements include, but are not limited to: whether the Company can manage the economic risks related to the impact of COVID-19 and the sustained instability in the oil and gas industry (including risks related to its customers’ credit quality, deferrals and modifications to loans, the Company’s ability to borrow, and the impact of a resultant recession generally), and other hazards such as natural disasters and adverse weather, acts of war or terrorism, other pandemics, an outbreak of hostilities or other international or domestic calamities and the governmental or military response thereto, and other matters beyond the Company’s control; the geographic concentration of our markets in Beaumont and Houston, Texas; whether the Company can manage changes and the continued health or availability of management personnel; the amount of nonperforming and classified assets that the Company holds and the efforts to resolve the nonperforming assets; deterioration of its asset quality; interest rate risks associated with the Company’s business; business and economic conditions generally and in the financial services industry, nationally and within the Company’s primary markets; volatility and direction of oil prices, including risks related to the recent collapse in oil prices, and the strength of the energy industry, generally and within Texas; the composition of the Company’s loan portfolio, including the identity of its borrowers and the concentration of loans in specialized industries, especially the creditworthiness of energy company borrowers; changes in the value of collateral securing the loans; the Company’s ability to maintain important deposit customer relationships and the Company’s reputation; the Company’s ability to maintain effective internal control over financial reporting; the Company’s ability to pursue available remedies in the event of a loan default for loans under the Paycheck Protection Program, or PPP, and the risk of holding the PPP loans at unfavorable interest rates as compared to the loans to customers that we would have otherwise lent to; the volatility and direction of market interest rates; liquidity risks associated with the Company’s business; systems failures, interruptions or breaches involving the Company’s information technology and telecommunications systems or third-party servicers; the failure of certain third party vendors to perform; the institution and outcome of litigation and other legal proceedings against the Company or to which it may become subject; operational risks associated with the Company’s business; the costs, effects and results of regulatory examinations, investigations, including the ongoing investigation by the Financial Crimes Enforcement Network, or FinCEN, of the U.S. Department of Treasury, or reviews or the ability to obtain the required regulatory approvals; the Company’s ability to meet the requirements of its Formal Agreement with the Office of the Comptroller of the Currency, and the risk that such Formal Agreement may have a negative impact on the Company’s financial performance and results of operations; changes in the laws, rules, regulations, interpretations or policies relating to financial institution, accounting, tax, trade, monetary and fiscal matters; governmental or regulatory responses to the COVID-19 pandemic and newly enacted fiscal stimulus that impact the Company’s loan portfolio and forbearance practice; and other governmental interventions in the U.S. financial system that may impact how the Company achieves its performance goals. Additionally, many of these risks and uncertainties are currently elevated by and may or will continue to be elevated by the COVID-19 pandemic. The foregoing factors should not be construed as exhaustive and should be read together with the other cautionary statements included in the Company’s Annual Report on Form 10-K, filed with the Securities and Exchange Commission, or SEC, and other reports and statements that the Company has filed with the SEC. If one or more events related to these or other risks or uncertainties materialize, or if the Company’s underlying assumptions prove to be incorrect, actual results may differ materially from what it anticipates. Accordingly, you should not place undue reliance on any such forward- looking statements. Any forward-looking statement speaks only as of the date on which it is made, and the Company does not undertake any obligation to publicly update or review any forward- looking statement, whether as a result of new information, future developments or otherwise. New factors emerge from time to time, and it is not possible for the Company to predict which will arise. In addition, the Company cannot assess the impact of each factor on its business or the extent to which any factor, or combination of factors, may cause actual results to differ materially from those contained in any forward-looking statements. Copies of the SEC filings for the Company are available for download free of charge from www.communitybankoftx.com under the Investor Relations tab. All forward-looking statements, expressed or implied, included in this communication are expressly qualified in their entirety by this cautionary statement. This cautionary statement should also be considered in connection with any subsequent written or oral forward-looking statements that the Company or persons acting on the Company’s behalf may issue. Annualized, pro forma, projected and estimated numbers are used for illustrative purpose only, are not forecasts and may not reflect actual results. |
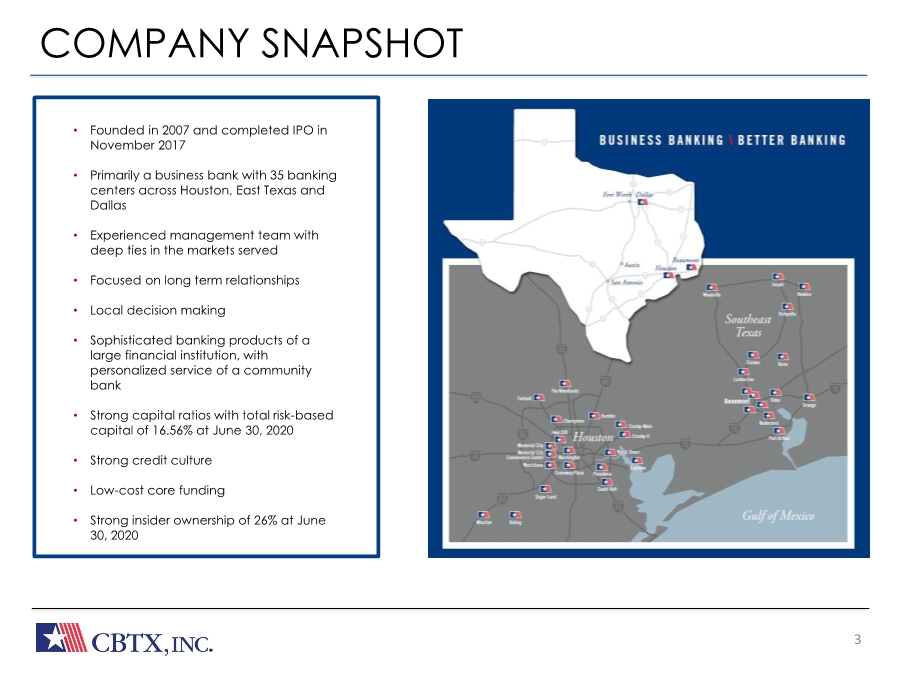
| The Bank Built or Business 3 • Gross loans increased from March by $269.4 million due to originations of $336.1 million of PPP loans during Q2 offset by paydowns/payoffs • Total commercial loans (1) were 86.7% of total loans at June 30, 2020 • At June 30, 2020, 76.4% of loans are Houston-based • Focused on lending to professionals and local small- and mid-sized businesses • At June 30, 2020, 6.1% of gross loans were related to oil and gas. See page 13. • Key emphasis on developing core relationships • Well-diversified loan portfolio • Founded in 2007 and completed IPO in November 2017 • Primarily a business bank with 35 banking centers across Houston, East Texas and Dallas • Experienced management team with deep ties in the markets served • Focused on long term relationships • Local decision making • Sophisticated banking products of a large financial institution, with personalized service of a community bank • Strong capital ratios with total risk-based capital of 16.56% at June 30, 2020 • Strong credit culture • Low-cost core funding • Strong insider ownership of 26% at June 30, 2020 COMPANY SNAPSHOT |
| 4 COVID-19 RESPONSE • Activated business continuity plan the first part of March • Implemented social distancing in our facilities allowing flexible work arrangements and restricted travel • Deployed remote working strategy to allow 63% of employees to operate remotely • Granted additional PTO • Push online banking, mobile banking and bank-by-phone • All branches that have drive-thru moved lobbies to appointment only • Participation in SBA’s Paycheck Protection Program • Offering deferrals and fee waivers and suspended foreclosures, evictions and auto repossessions |
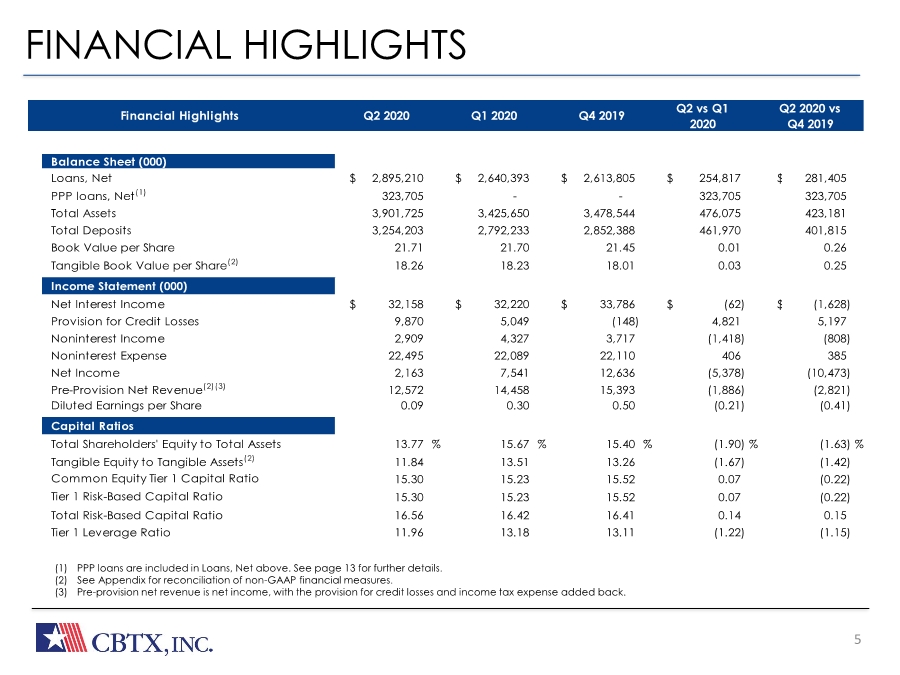
| 5 FINANCIAL HIGHLIGHTS (1) PPP loans are included in Loans, Net above. See page 13 for further details. (2) See Appendix for reconciliation of non-GAAP financial measures. (3) Pre-provision net revenue is net income, with the provision for credit losses and income tax expense added back. Financial Highlights Q2 2020 Q1 2020 Q4 2019 Q2 2020 vs Q4 2019 Q2 vs Q1 2020 Balance Sheet (000) Loans, Net $ 2,895,210 $ 2,640,393 $ 2,613,805 $ 254,817 $ 281,405 PPP loans, Net(1) 323,705 - - 323,705 323,705 Total Assets 3,901,725 3,425,650 3,478,544 476,075 423,181 Total Deposits 3,254,203 2,792,233 2,852,388 461,970 401,815 Book Value per Share 21.71 21.70 21.45 0.01 0.26 Tangible Book Value per Share(2) 18.26 18.23 18.01 0.03 0.25 Income Statement (000) Net Interest Income $ 32,158 $ 32,220 $ 33,786 $ (62) $ (1,628) Provision for Credit Losses 9,870 5,049 (148) 4,821 5,197 Noninterest Income 2,909 4,327 3,717 (1,418) (808) Noninterest Expense 22,495 22,089 22,110 406 385 Net Income 2,163 7,541 12,636 (5,378) (10,473) Pre-Provision Net Revenue(2)(3) 12,572 14,458 15,393 (1,886) (2,821) Diluted Earnings per Share 0.09 0.30 0.50 (0.21) (0.41) Capital Ratios Total Shareholders' Equity to Total Assets 13.77 % 15.67 % 15.40 %(1.90) %(1.63) % Tangible Equity to Tangible Assets(2) 11.84 13.51 13.26 (1.67) (1.42) Common Equity Tier 1 Capital Ratio 15.30 15.23 15.52 0.07 (0.22) Tier 1 Risk-Based Capital Ratio 15.30 15.23 15.52 0.07 (0.22) Total Risk-Based Capital Ratio 16.56 16.42 16.41 0.14 0.15 Tier 1 Leverage Ratio 11.96 13.18 13.11 (1.22) (1.15) |
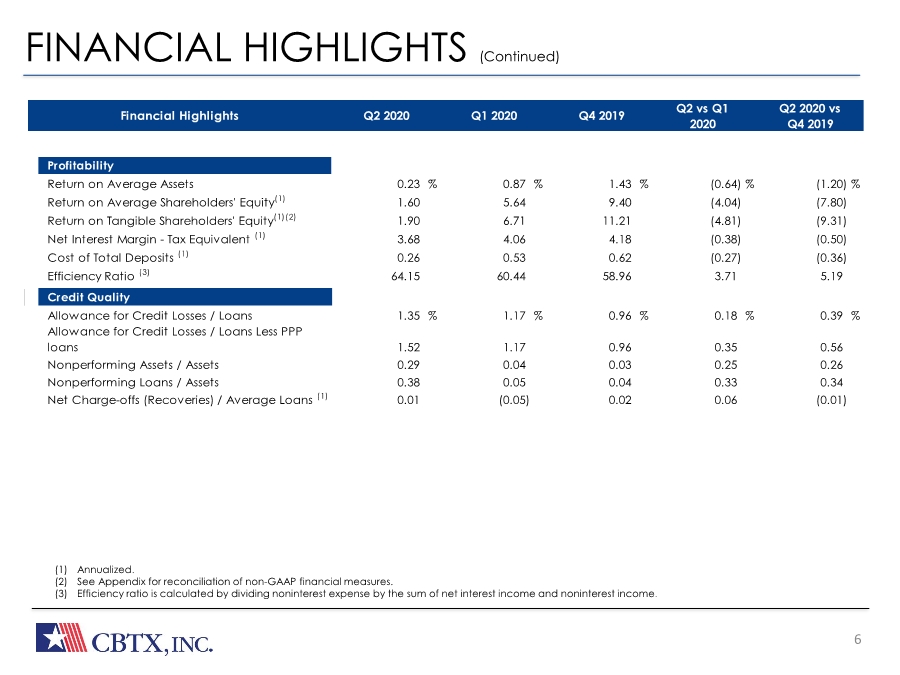
| 6 FINANCIAL HIGHLIGHTS (Continued) (1) Annualized. (2) See Appendix for reconciliation of non-GAAP financial measures. (3) Efficiency ratio is calculated by dividing noninterest expense by the sum of net interest income and noninterest income. Financial Highlights Q2 2020 Q1 2020 Q4 2019 Q2 vs Q1 2020 Q2 2020 vs Q4 2019 Profitability Return on Average Assets 0.23 % 0.87 % 1.43 %(0.64) %(1.20) % Return on Average Shareholders' Equity(1) 1.60 5.64 9.40 (4.04) (7.80) Return on Tangible Shareholders' Equity(1)(2) 1.90 6.71 11.21 (4.81) (9.31) Net Interest Margin - Tax Equivalent (1) 3.68 4.06 4.18 (0.38) (0.50) Cost of Total Deposits (1) 0.26 0.53 0.62 (0.27) (0.36) Efficiency Ratio (3) 64.15 60.44 58.96 3.71 5.19 Credit Quality Allowance for Credit Losses / Loans 1.35 % 1.17 % 0.96 % 0.18 % 0.39 % Allowance for Credit Losses / Loans Less PPP loans 1.52 1.17 0.96 0.35 0.56 Nonperforming Assets / Assets 0.29 0.04 0.03 0.25 0.26 Nonperforming Loans / Assets 0.38 0.05 0.04 0.33 0.34 Net Charge-offs (Recoveries) / Average Loans (1) 0.01 (0.05) 0.02 0.06 (0.01) |
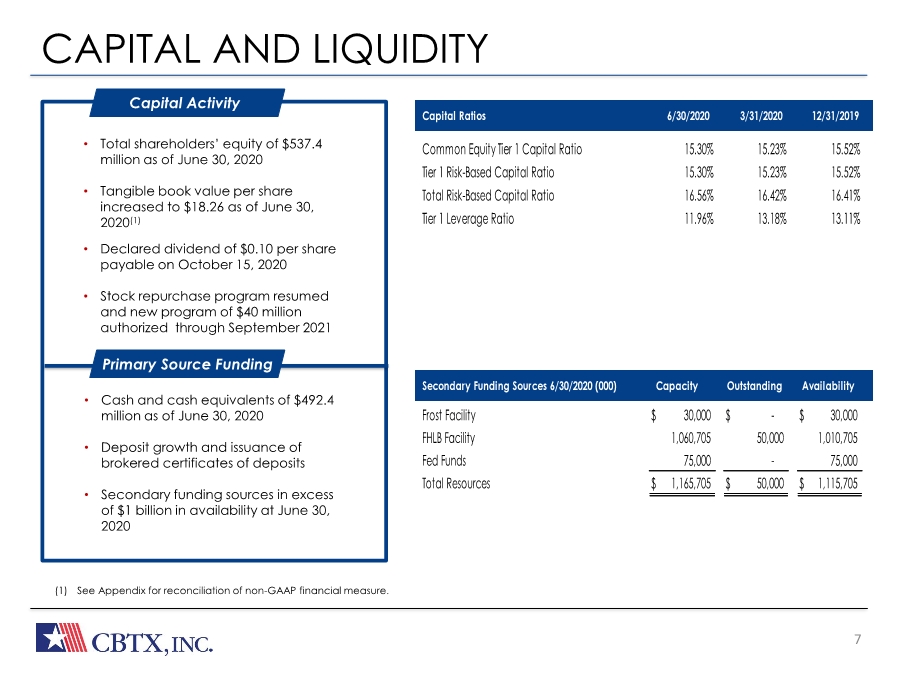
| The Bank Built or Business CAPITAL AND LIQUIDITY 7 REVENUE GROWH • Stable net interest margin (NIM) • Asset sensitive, with 54% variable rate loans as of March 31, 2020 • Increasing revenue and improving efficiency ratio (2) (1) See Appendix for reconciliation of non-GAAP financial measure. • Total shareholders’ equity of $537.4 million as of June 30, 2020 • Tangible book value per share increased to $18.26 as of June 30, 2020(1) • Declared dividend of $0.10 per share payable on October 15, 2020 • Stock repurchase program resumed and new program of $40 million authorized through September 2021 Capital Activity • Cash and cash equivalents of $492.4 million as of June 30, 2020 • Deposit growth and issuance of brokered certificates of deposits • Secondary funding sources in excess of $1 billion in availability at June 30, 2020 Primary Source Funding Secondary Funding Sources 6/30/2020 (000) Capacity Outstanding Availability Frost Facility $ 30,000 $ - $ 30,000 FHLB Facility 1,060,705 50,000 1,010,705 Fed Funds 75,000 - 75,000 Total Resources $ 1,165,705 $ 50,000 $ 1,115,705 Common Equity Tier 1 Capital Ratio 15.30% 15.23% 15.52% Tier 1 Risk-Based Capital Ratio 15.30% 15.23% 15.52% Total Risk-Based Capital Ratio 16.56% 16.42% 16.41% Tier 1 Leverage Ratio 11.96% 13.18% 13.11% Capital Ratios 6/30/2020 3/31/2020 12/31/2019 |
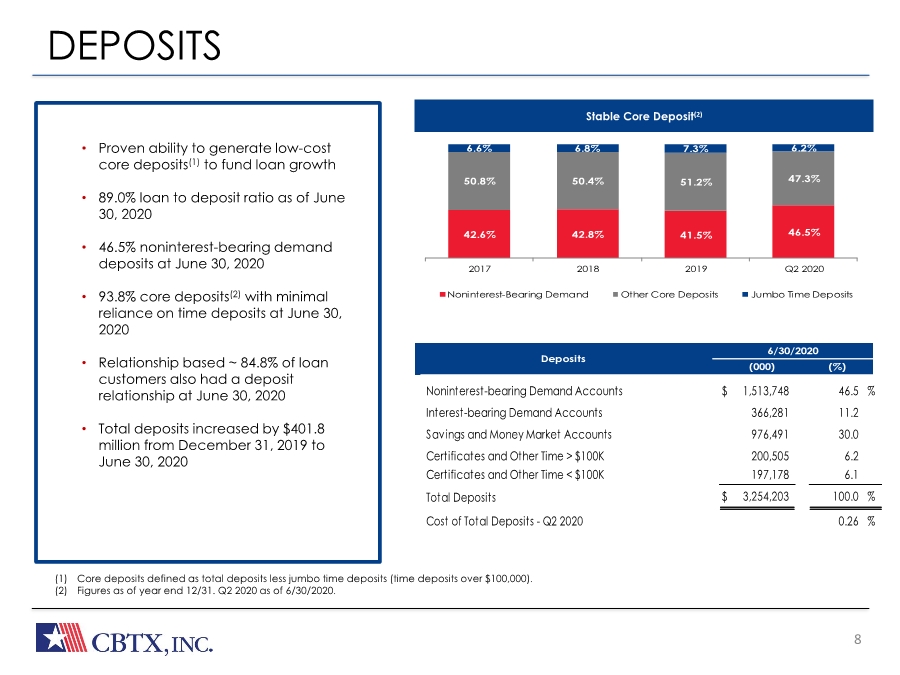
| The Bank Built or Business 8 Stable Core Deposit(2) (1) Core deposits defined as total deposits less jumbo time deposits (time deposits over $100,000). (2) Figures as of year end 12/31. Q2 2020 as of 6/30/2020. DEPOSITS • Gross loans increased from March by $269.4 million due to originations of $336.1 million of PPP loans during Q2 offset by paydowns/payoffs • Total commercial loans (1) were 86.7% of total loans at June 30, 2020 • At June 30, 2020, 76.4% of loans are Houston-based • Focused on lending to professionals and local small- and mid-sized businesses • At June 30, 2020, 6.1% of gross loans were related to oil and gas. See page 13. • Key emphasis on developing core relationships • Well-diversified loan portfolio • Proven ability to generate low-cost core deposits(1) to fund loan growth • 89.0% loan to deposit ratio as of June 30, 2020 • 46.5% noninterest-bearing demand deposits at June 30, 2020 • 93.8% core deposits(2) with minimal reliance on time deposits at June 30, 2020 • Relationship based ~ 84.8% of loan customers also had a deposit relationship at June 30, 2020 • Total deposits increased by $401.8 million from December 31, 2019 to June 30, 2020 42.6% 42.8% 41.5% 46.5% 50.8% 50.4% 51.2% 47.3% 6.6% 6.8% 7.3% 6.2% 2017 2018 2019 Q2 2020 Noninterest-Bearing Demand Other Core Deposits Jumbo Time Deposits (%) (000) Deposits 6/30/2020 Noninterest-bearing Demand Accounts $ 1,513,748 46.5 % Interest-bearing Demand Accounts 366,281 11.2 Savings and Money Market Accounts 976,491 30.0 Certificates and Other Time > $100K 200,505 6.2 Certificates and Other Time < $100K 197,178 6.1 Total Deposits $ 3,254,203 100.0 % Cost of Total Deposits - Q2 2020 0.26 % |
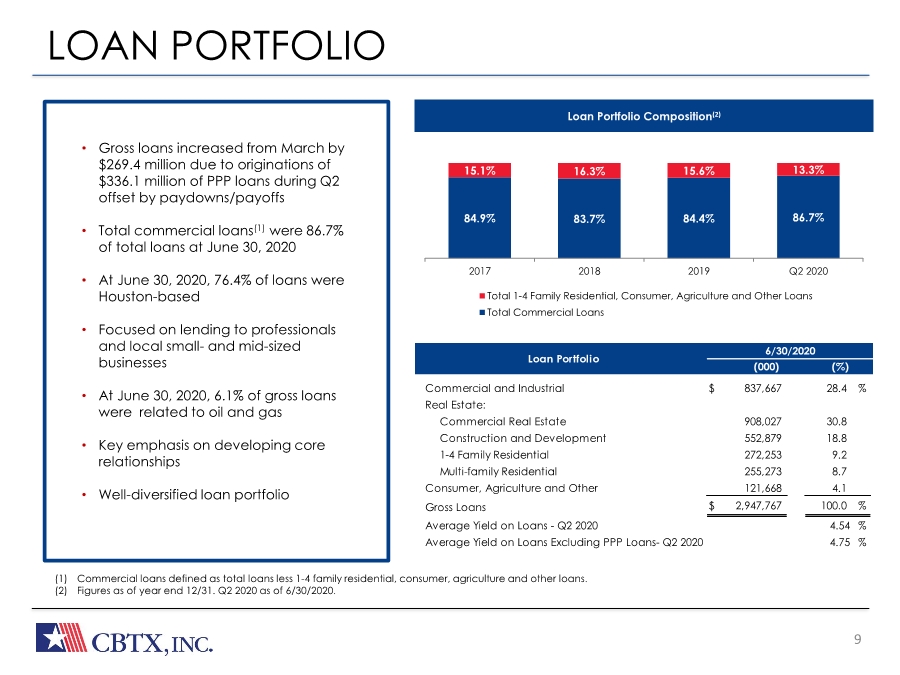
| The Bank Built or Business 9 Loan Portfolio Composition(2) (1) Commercial loans defined as total loans less 1-4 family residential, consumer, agriculture and other loans. (2) Figures as of year end 12/31. Q2 2020 as of 6/30/2020. LOAN PORTFOLIO • Gross loans increased from March by $269.4 million due to originations of $336.1 million of PPP loans during Q2 offset by paydowns/payoffs • Total commercial loans (1) were 86.7% of total loans at June 30, 2020 • At June 30, 2020, 76.4% of loans are Houston-based • Focused on lending to professionals and local small- and mid-sized businesses • At June 30, 2020, 6.1% of gross loans were related to oil and gas. See page 13. • Key emphasis on developing core relationships • Well-diversified loan portfolio • Gross loans increased from March by $269.4 million due to originations of $336.1 million of PPP loans during Q2 offset by paydowns/payoffs • Total commercial loans(1) were 86.7% of total loans at June 30, 2020 • At June 30, 2020, 76.4% of loans were Houston-based • Focused on lending to professionals and local small- and mid-sized businesses • At June 30, 2020, 6.1% of gross loans were related to oil and gas • Key emphasis on developing core relationships • Well-diversified loan portfolio 84.9% 83.7% 84.4% 86.7% 15.1% 16.3% 15.6% 13.3% 2017 2018 2019 Q2 2020 Total 1-4 Family Residential, Consumer, Agriculture and Other Loans Total Commercial Loans (%) Loan Portfolio (000) 6/30/2020 Commercial and Industrial $ 837,667 28.4 % Real Estate: Commercial Real Estate 908,027 30.8 Construction and Development 552,879 18.8 1-4 Family Residential 272,253 9.2 Multi-family Residential 255,273 8.7 Consumer, Agriculture and Other 121,668 4.1 Gross Loans $ 2,947,767 100.0 % Average Yield on Loans - Q2 2020 4.54 % Average Yield on Loans Excluding PPP Loans- Q2 2020 4.75 % |
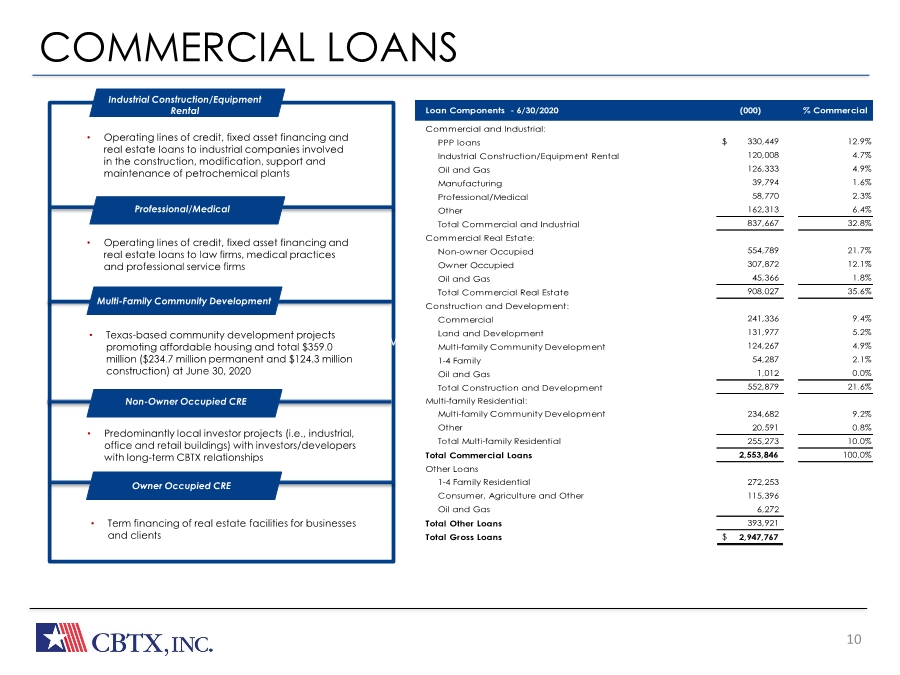
| The Bank Built or Business COMMERCIAL LOANS 10 Multi-family ($418M) • Operating lines of credit, fixed asset financing and real estate loans to industrial companies involved in the construction, modification, support and maintenance of petrochemical plants Industrial Construction/Equipment Rental Multi-Family Community Development • Operating lines of credit, fixed asset financing and real estate loans to law firms, medical practices and professional service firms • Texas-based community development projects promoting affordable housing and total $359.0 million ($234.7 million permanent and $124.3 million construction) at June 30, 2020 • Predominantly local investor projects (i.e., industrial, office and retail buildings) with investors/developers with long-term CBTX relationships • Term financing of real estate facilities for businesses and clients Loan Components - 6/30/2020 % Commercial Commercial and Industrial: PPP loans $ 330,449 12.9% Industrial Construction/Equipment Rental 120,008 4.7% Oil and Gas 126,333 4.9% Manufacturing 39,794 1.6% Professional/Medical 58,770 2.3% Other 162,313 6.4% Total Commercial and Industrial 837,667 32.8% Commercial Real Estate: Non-owner Occupied 554,789 21.7% Owner Occupied 307,872 12.1% Oil and Gas 45,366 1.8% Total Commercial Real Estate 908,027 35.6% Construction and Development: Commercial 241,336 9.4% Land and Development 131,977 5.2% Multi-family Community Development 124,267 4.9% 1-4 Family 54,287 2.1% Oil and Gas 1,012 0.0% Total Construction and Development 552,879 21.6% Multi-family Residential: Multi-family Community Development 234,682 9.2% Other 20,591 0.8% Total Multi-family Residential 255,273 10.0% Total Commercial Loans 2,553,846 100.0% Other Loans 1-4 Family Residential 272,253 Consumer, Agriculture and Other 115,396 Oil and Gas 6,272 Total Other Loans 393,921 Total Gross Loans $ 2,947,767 (000) Professional/Medical Non-Owner Occupied CRE Owner Occupied CRE |
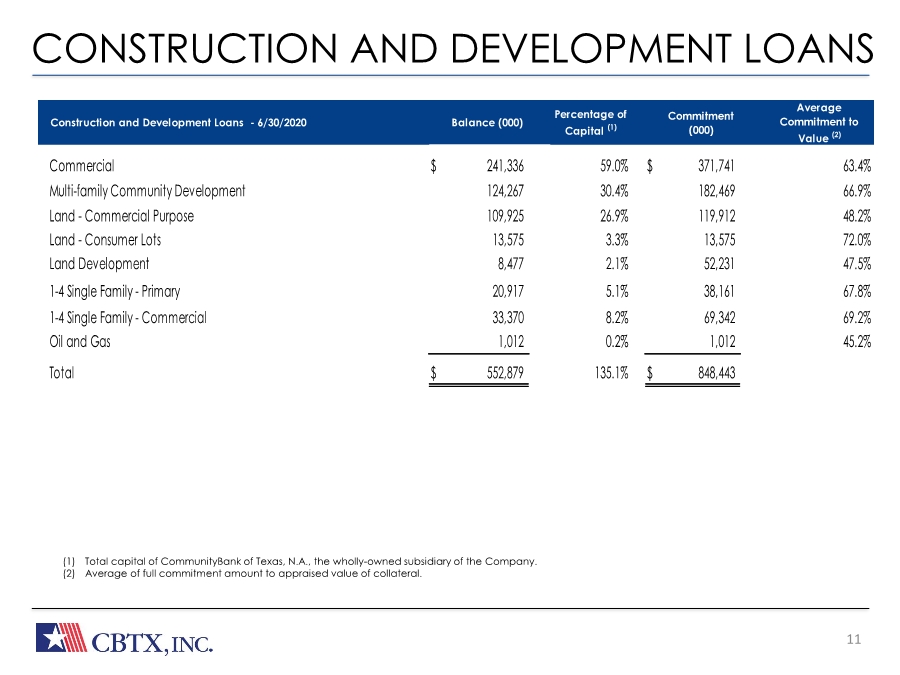
| The Bank Built or Business CONSTRUCTION AND DEVELOPMENT LOANS 11 (1) Total capital of CommunityBank of Texas, N.A., the wholly-owned subsidiary of the Company. (2) Average of full commitment amount to appraised value of collateral. Construction and Development Loans - 6/30/2020 Balance (000) Percentage of Capital (1) Commitment (000) Average Commitment to Value (2) Commercial $ 241,336 59.0% $ 371,741 63.4% Multi-family Community Development 124,267 30.4% 182,469 66.9% Land - Commercial Purpose 109,925 26.9% 119,912 48.2% Land - Consumer Lots 13,575 3.3% 13,575 72.0% Land Development 8,477 2.1% 52,231 47.5% 1-4 Single Family - Primary 20,917 5.1% 38,161 67.8% 1-4 Single Family - Commercial 33,370 8.2% 69,342 69.2% Oil and Gas 1,012 0.2% 1,012 45.2% Total $ 552,879 135.1% $ 848,443 |
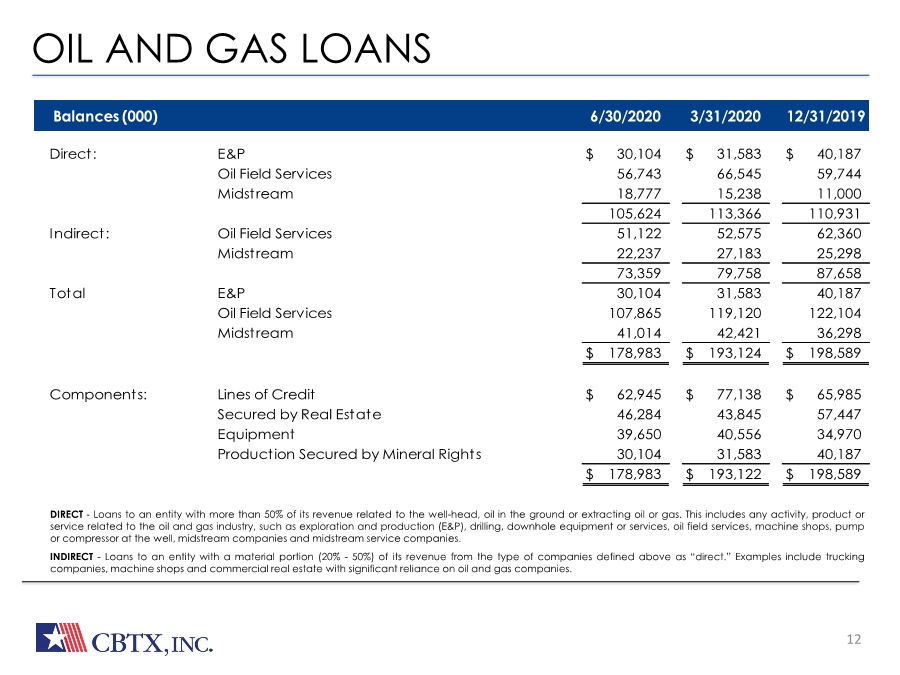
| The Bank Built or Business OIL AND GAS LOANS 12 • DIRECT - Loans to an entity with more than 50% of its revenue related to the well-head, oil in the ground or extracting oil or gas. This includes any activity, product or service related to the oil and gas industry, such as exploration and production (E&P), drilling, downhole equipment or services, oil field services, machine shops, pump or compressor at the well, midstream companies and midstream service companies. • INDIRECT - Loans to an entity with a material portion (20%- 50%) of its revenue from the type of companies defined above as “direct.” Examples include trucking companies, machine shops and commercial real estate with significant reliance on oil and gas companies. Balances (000) 6/30/2020 3/31/2020 12/31/2019 Direct: E&P $ 30,104 $ 31,583 $ 40,187 Oil Field Services 56,743 66,545 59,744 Midstream 18,777 15,238 11,000 105,624 113,366 110,931 Indirect: Oil Field Services 51,122 52,575 62,360 Midstream 22,237 27,183 25,298 73,359 79,758 87,658 Total E&P 30,104 31,583 40,187 Oil Field Services 107,865 119,120 122,104 Midstream 41,014 42,421 36,298 $ 178,983 $ 193,124 $ 198,589 Components: Lines of Credit $ 62,945 $ 77,138 $ 65,985 Secured by Real Estate 46,284 43,845 57,447 Equipment 39,650 40,556 34,970 Production Secured by Mineral Rights 30,104 31,583 40,187 $ 178,983 $ 193,122 $ 198,589 |
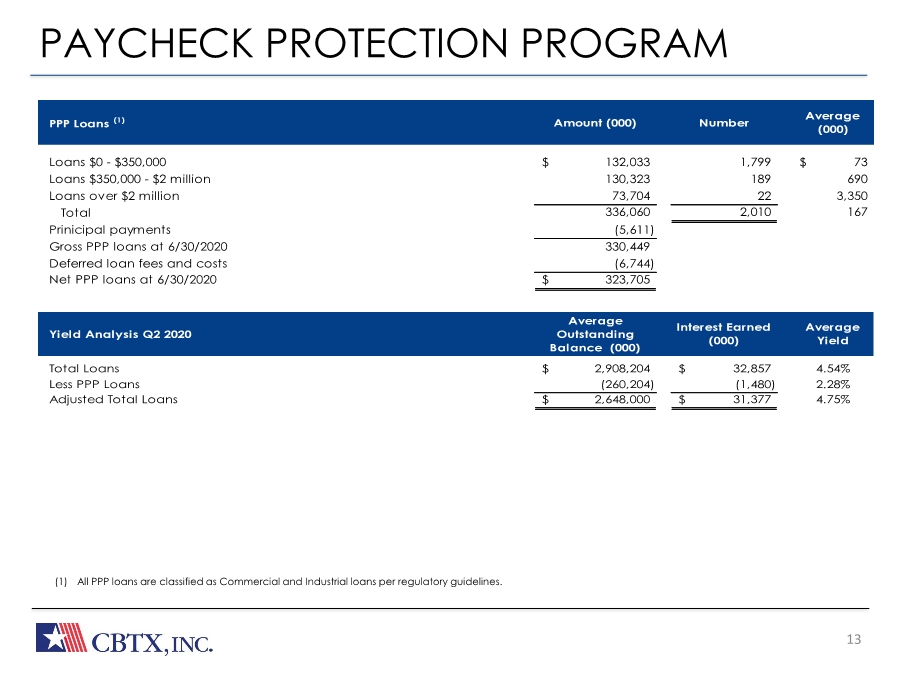
| 13 PAYCHECK PROTECTION PROGRAM (1) All PPP loans are classified as Commercial and Industrial loans per regulatory guidelines. PPP Loans (1) Amount (000) Number Average (000) Yield Analysis Q2 2020 Average Outstanding Balance (000) Interest Earned (000) Average Yield Loans $0 - $350,000 132,033 $ 1,799 73 $ Loans $350,000 - $2 million 130,323 189 690 Loans over $2 million 73,704 22 3,350 Total 336,060 2,010 167 Prinicipal payments (5,611) Gross PPP loans at 6/30/2020 330,449 Deferred loan fees and costs (6,744) Net PPP loans at 6/30/2020 323,705 $ Total Loans 2,908,204 $ 32,857 $ 4.54% Less PPP Loans (260,204) (1,480) 2.28% Adjusted Total Loans 2,648,000 $ 31,377 $ 4.75% |
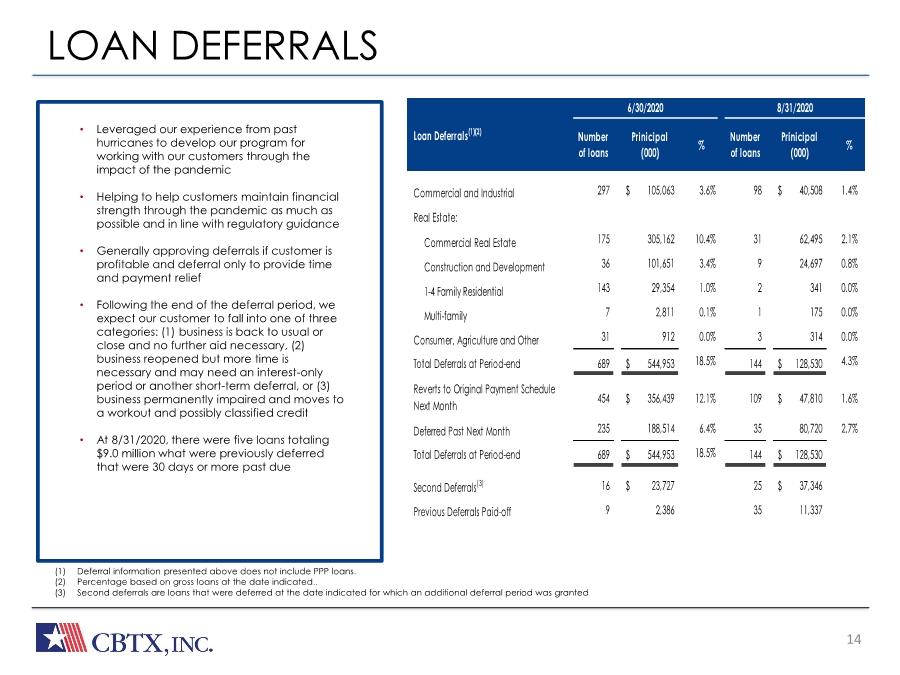
| The Bank Built or Business 14 LOAN DEFERRALS • Leveraged our experience from past hurricanes to develop our program for working with our customers through the impact of the pandemic • Helping to help customers maintain financial strength through the pandemic as much as possible and in line with regulatory guidance • Generally approving deferrals if customer is profitable and deferral only to provide time and payment relief • Following the end of the deferral period, we expect our customer to fall into one of three categories: (1) business is back to usual or close and no further aid necessary, (2) business reopened but more time is necessary and may need an interest-only period or another short-term deferral, or (3) business permanently impaired and moves to a workout and possibly classified credit • At 8/31/2020, there were five loans totaling $9.0 million what were previously deferred that were 30 days or more past due (1) Deferral information presented above does not include PPP loans. (2) Percentage based on gross loans at the date indicated.. (3) Second deferrals are loans that were deferred at the date indicated for which an additional deferral period was granted Number of loans Prinicipal (000) % Number of loans Prinicipal (000) % Commercial and Industrial 297 105,063 $ 3.6% 98 40,508 $ 1.4% Real Estate: Commercial Real Estate 175 305,162 10.4% 31 62,495 2.1% Construction and Development 36 101,651 3.4% 9 24,697 0.8% 1-4 Family Residential 143 29,354 1.0% 2 341 0.0% Multi-family 7 2,811 0.1% 1 175 0.0% Consumer, Agriculture and Other 31 912 0.0% 3 314 0.0% Total Deferrals at Period-end 689 544,953 $ 18.5% 144 128,530 $ 4.3% Reverts to Original Payment Schedule Next Month 454 356,439 $ 12.1% 109 47,810 $ 1.6% Deferred Past Next Month 235 188,514 6.4% 35 80,720 2.7% Total Deferrals at Period-end 689 544,953 $ 18.5% 144 128,530 $ Second Deferrals(3) 16 23,727 $ 25 37,346 $ Previous Deferrals Paid-off 9 2,386 35 11,337 6/30/2020 8/31/2020 Loan Deferrals(1)(2) |
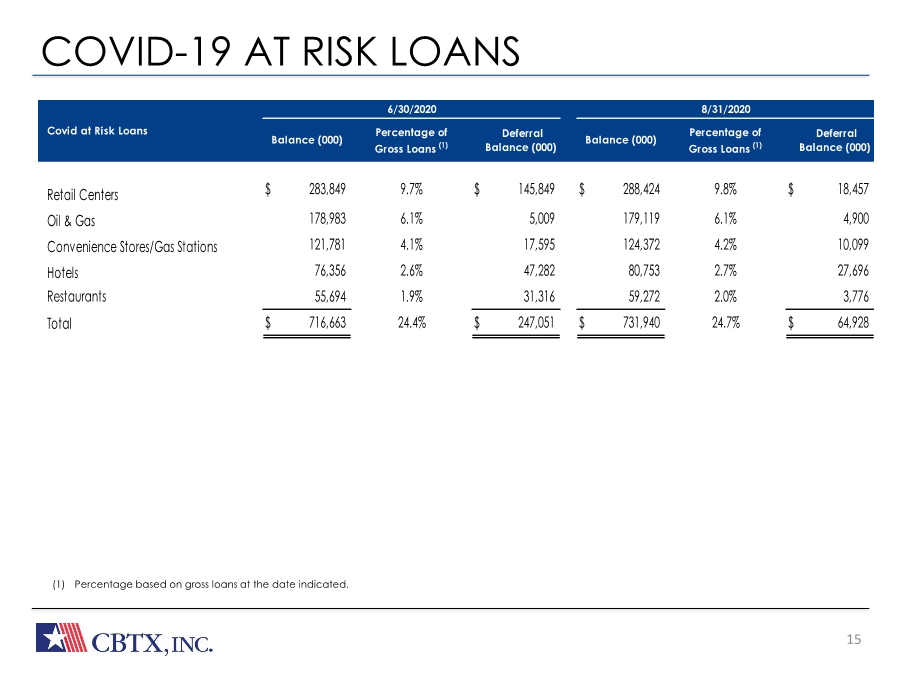
| The Bank Built or Business COVID-19 AT RISK LOANS 15 • Participating in the Paycheck Protection Program offered under the Cares Act •____ PPP loans outstanding, with average loan size of ___ at June 30, 2020 • SBA origination fees of $11.2 M through 6/30/2020. • Processing additional applications (1) Percentage based on gross loans at the date indicated. Percentage of Gross Loans (1) Deferral Balance (000) Percentage of Gross Loans (1) Deferral Balance (000) Covid at Risk Loans Balance (000) Balance (000) 6/30/2020 8/31/2020 Retail Centers $ 283,849 9.7% $ 145,849 $ 288,424 9.8% $ 18,457 Oil & Gas 178,983 6.1% 5,009 179,119 6.1% 4,900 Convenience Stores/Gas Stations 121,781 4.1% 17,595 124,372 4.2% 10,099 Hotels 76,356 2.6% 47,282 80,753 2.7% 27,696 Restaurants 55,694 1.9% 31,316 59,272 2.0% 3,776 Total $ 716,663 24.4% $ 247,051 $ 731,940 24.7% $ 64,928 |
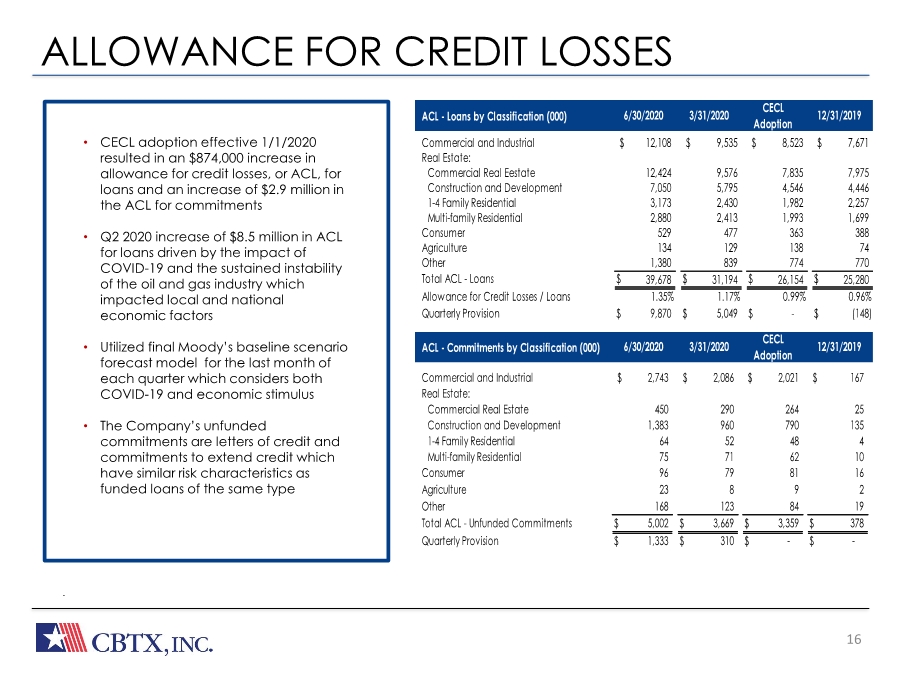
| The Bank Built or Business ALLOWANCE FOR CREDIT LOSSES 16 • Participating in the Paycheck Protection Program offered under the Cares Act •____ PPP loans outstanding, with average loan size of ___ at June 30, 2020 • SBA origination fees of $11.2 M through 6/30/2020. • Processing additional applications .. • CECL adoption effective 1/1/2020 resulted in an $874,000 increase in allowance for credit losses, or ACL, for loans and an increase of $2.9 million in the ACL for commitments • Q2 2020 increase of $8.5 million in ACL for loans driven by the impact of COVID-19 and the sustained instability of the oil and gas industry which impacted local and national economic factors • Utilized final Moody’s baseline scenario forecast model for the last month of each quarter which considers both COVID-19 and economic stimulus • The Company’s unfunded commitments are letters of credit and commitments to extend credit which have similar risk characteristics as funded loans of the same type ACL - Loans by Classification (000) 6/30/2020 3/31/2020 12/31/2019 CECL Adoption Commercial and Industrial $ 12,108 $ 9,535 $ 8,523 $ 7,671 Real Estate: Commercial Real Eestate 12,424 9,576 7,835 7,975 Construction and Development 7,050 5,795 4,546 4,446 1-4 Family Residential 3,173 2,430 1,982 2,257 Multi-family Residential 2,880 2,413 1,993 1,699 Consumer 529 477 363 388 Agriculture 134 129 138 74 Other 1,380 839 774 770 Total ACL - Loans $ 39,678 $ 31,194 $ 26,154 $ 25,280 Allowance for Credit Losses / Loans 1.35% 1.17% 0.99% 0.96% Quarterly Provision $ 9,870 $ 5,049 $ - $ (148) ACL - Commitments by Classification (000) 6/30/2020 3/31/2020 12/31/2019 CECL Adoption Commercial and Industrial $ 2,743 $ 2,086 $ 2,021 $ 167 Real Estate: Commercial Real Estate 450 290 264 25 Construction and Development 1,383 960 790 135 1-4 Family Residential 64 52 48 4 Multi-family Residential 75 71 62 10 Consumer 96 79 81 16 Agriculture 23 8 9 2 Other 168 123 84 19 Total ACL - Unfunded Commitments $ 5,002 $ 3,669 $ 3,359 $ 378 Quarterly Provision $ 1,333 $ 310 $ - $ - |
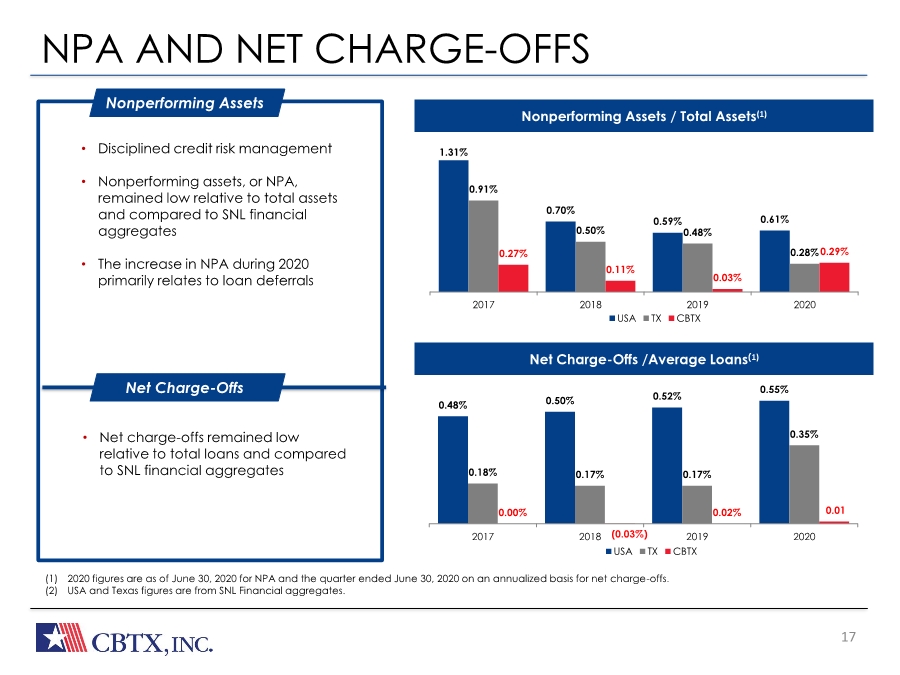
| The Bank Built or Business NPA AND NET CHARGE-OFFS 17 REVENUE • Net interest margin (NIM) remained strong, impacted by lower interest rates and lower yielding PPP loans • Average loan yield (excluding PPP loans) of 4.75% for Q2 2020 • • Average loan yield on PPP loans of 2.28% • Cost of interest bearing liabilities of 0.52% • Asset sensitive, with 49.5% variable rate loans as of June 30, 2020 • Approximately 77% of variable rate loan portfolio had floors EFFICIENCY EFFORTS • Investments in people, technology and systems • Infrastructure capable of supporting a much larger bank • Resulting scalability should allow for growth without significant expenses (1) 2020 figures are as of June 30, 2020 for NPA and the quarter ended June 30, 2020 on an annualized basis for net charge-offs. (2) USA and Texas figures are from SNL Financial aggregates. • Disciplined credit risk management • Nonperforming assets, or NPA, remained low relative to total assets and compared to SNL financial aggregates • The increase in NPA during 2020 primarily relates to loan deferrals Nonperforming Assets • Net charge-offs remained low relative to total loans and compared to SNL financial aggregates Net Charge-Offs Nonperforming Assets / Total Assets(1) Net Charge-Offs /Average Loans(1) 1.31% 0.70% 0.59% 0.61% 0.91% 0.50% 0.48% 0.28% 0.27% 0.11% 0.03% 0.29% 2017 2018 2019 2020 USA TX CBTX 0.48% 0.50% 0.52% 0.55% 0.18% 0.17% 0.17% 0.35% 0.00% (0.03%) 0.02% 0.01 2017 2018 2019 2020 USA TX CBTX |
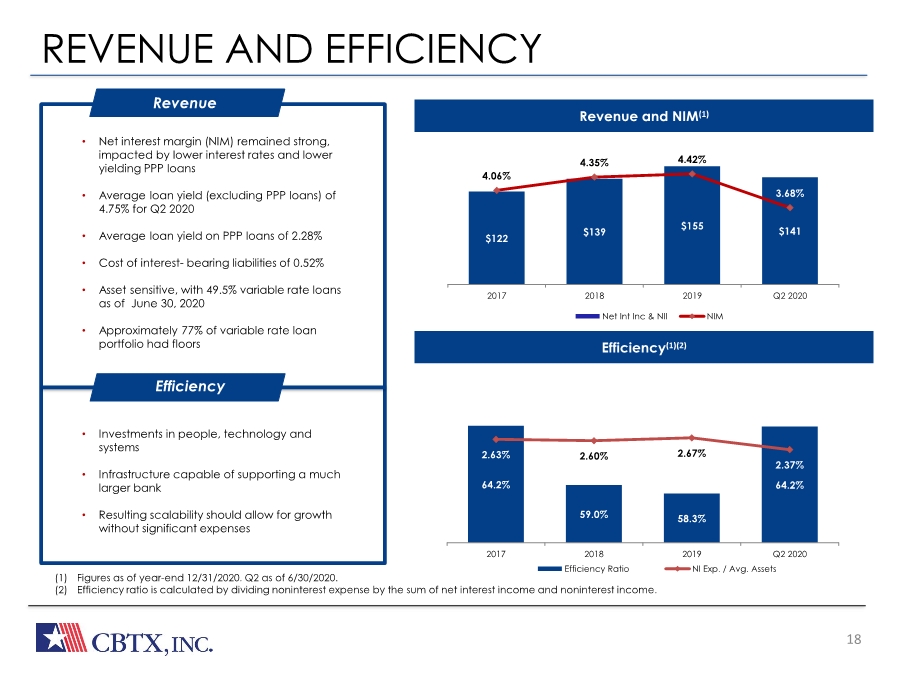
| The Bank Built or Business REVENUE AND EFFICIENCY 18 REVENUE • Net interest margin (NIM) remained strong, impacted by lower interest rates and lower yielding PPP loans • Average loan yield (excluding PPP loans) of 4.75% for Q2 2020 • • Average loan yield on PPP loans of 2.28% • Cost of interest bearing liabilities of 0.52% • Asset sensitive, with 49.5% variable rate loans as of June 30, 2020 • Approximately 77% of variable rate loan portfolio had floors EFFICIENCY EFFORTS • Investments in people, technology and systems • Infrastructure capable of supporting a much larger bank • Resulting scalability should allow for growth without significant expenses (1) Figures as of year-end 12/31/2020. Q2 as of 6/30/2020. (2) Efficiency ratio is calculated by dividing noninterest expense by the sum of net interest income and noninterest income. • Net interest margin (NIM) remained strong, impacted by lower interest rates and lower yielding PPP loans • Average loan yield (excluding PPP loans) of 4.75% for Q2 2020 • Average loan yield on PPP loans of 2.28% • Cost of interest- bearing liabilities of 0.52% • Asset sensitive, with 49.5% variable rate loans as of June 30, 2020 • Approximately 77% of variable rate loan portfolio had floors Revenue • Investments in people, technology and systems • Infrastructure capable of supporting a much larger bank • Resulting scalability should allow for growth without significant expenses Efficiency Revenue and NIM(1) Efficiency(1)(2) 64.2% 59.0% 58.3% 64.2% 2.63% 2.60% 2.67% 2.37% 2017 2018 2019 0.00% 0.50% 1.00% 1.50% 2.00% 2.50% 3.00% 3.50% 54% 56% 58% 60% 62% 64% 66% 2017 2018 2019 Q2 2020 Axis Title Axis Title Axis Title Efficiency Ratio NI Exp. / Avg. Assets $122 $139 $155 $141 4.06% 4.35% 4.42% 3.68% 2.00% 2.50% 3.00% 3.50% 4.00% 4.50% 5.00% $0 $20 $40 $60 $80 $100 $120 $140 $160 2017 2018 2019 Q2 2020 Net Int Inc & NII NIM |
| 19 At CommunityBank of Texas, we’re committed to building strong honest relationships. We strive to keep our clients’ and partners’ needs at the forefront of everything we do. And we measure our success by the success we help create for them. OUR VISION Here to Serve. OUR POSITIONING To experienced business owners, CommunityBank of Texas is the financial partner that delivers a better banking experience. OUR PERSONALITY Resourceful, Trustworthy, Friendly, Responsive, Strong At CommunityBank of Texas, we believe in a powerful and multi-faceted statement, one that drills straight to the heart of our reason for being, while clearly illuminating the mission that our many employees pursue each day: Here to serve. Here to serve is a commitment to building strong and honest relationships, a clarion call to remember that in everything we do, our highest purpose is to transform our extensive financial expertise into success for our clients. Relationships are the bedrock of our business – both internally and externally – and there is a stewardship in the word serve that promises that, in these relationships, we will be caring, humble and precise. That we will keep the needs of our clients at the forefront of our minds at all times and measure our performance by the success we create for each other. The other critical component of our brand vision is the word here, which serves several important roles. Here is a promise that we will be there for our clients and answer the call when they need us the most. We will be Dependable. Honest. Trustworthy. And we will remember that every time is the right time to put our clients’ needs first. Here is also a pledge to be visible and present in the communities we serve. It adds weight to the first and most key component of our name: Community. We are not some faceless financial institution located high above the rank and file, safely sheltered in an ivory tower. We are right here, serving the cities and communities in which we live. Day-in and day-out. We sponsor civic events, donate back to our neighbors in need, and spend the time to really get to know our clients on a personal level. In the face of an increasingly digital and impersonal world, we are proudly present in the lives of our clients and our communities. |
| APPENDIX |
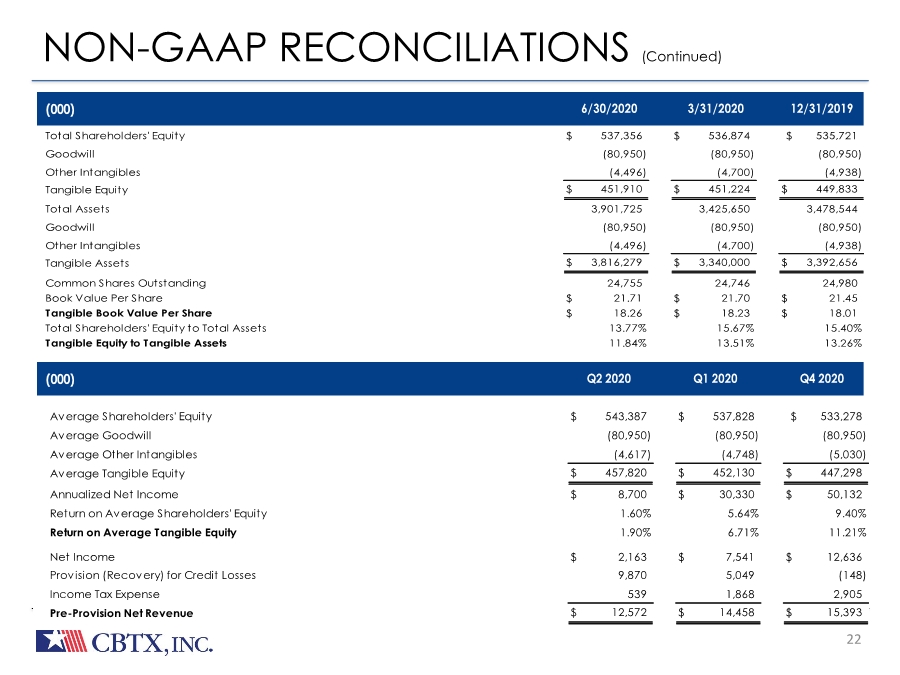
| 21 NON-GAAP RECONCILIATIONS Our management uses certain non-GAAP financial measures to evaluate performance. We have included in this presentation information related these non-GAAP financial measures for the applicable periods presented. The following tables reconcile, as of the dates set forth below (1) book value per share to tangible book value per share;(2) total shareholders’ equity to total assets to tangible equity to tangible assets;(3) return on average shareholders’ equity to return on average tangible equity; and (4) net income to pre-provision net revenue. The most directly comparable GAAP financial measure for tangible book value per share is book value per share and the most directly comparable GAAP financial measure for tangible equity to tangible assets is total shareholders’ equity to total assets. The most directly comparable GAAP financial measure for return on average tangible equity is return on average shareholders’ equity. The most directly comparable GAAP financial measure for pre-provision net revenue is net income. |
| 22 NON-GAAP RECONCILIATIONS (Continued) (000) 3/31/2020 6/30/2020 12/31/2019 Total Shareholders' Equity $ 537,356 $ 536,874 $ 535,721 Goodwill (80,950) (80,950) (80,950) Other Intangibles (4,496) (4,700) (4,938) Tangible Equity $ 451,910 $ 451,224 $ 449,833 Total Assets 3,901,725 3,425,650 3,478,544 Goodwill (80,950) (80,950) (80,950) Other Intangibles (4,496) (4,700) (4,938) Tangible Assets $ 3,816,279 $ 3,340,000 $ 3,392,656 Common Shares Outstanding 24,755 24,746 24,980 Book Value Per Share $ 21.71 $ 21.70 $ 21.45 Tangible Book Value Per Share $ 18.26 $ 18.23 $ 18.01 Total Shareholders' Equity to Total Assets 13.77% 15.67% 15.40% Tangible Equity to Tangible Assets 11.84% 13.51% 13.26% (000) Q4 2020 Q2 2020 Q1 2020 Average Shareholders' Equity $ 543,387 $ 537,828 $ 533,278 Average Goodwill (80,950) (80,950) (80,950) Average Other Intangibles (4,617) (4,748) (5,030) Average Tangible Equity $ 457,820 $ 452,130 $ 447,298 Annualized Net Income $ 8,700 $ 30,330 $ 50,132 Return on Average Shareholders' Equity 1.60% 5.64% 9.40% Return on Average Tangible Equity 1.90% 6.71% 11.21% Net Income $ 2,163 $ 7,541 $ 12,636 Provision (Recovery) for Credit Losses 9,870 5,049 (148) Income Tax Expense 539 1,868 2,905 Pre-Provision Net Revenue $ 12,572 $ 14,458 $ 15,393 |