UNITED STATES
SECURITIES AND EXCHANGE COMMISSION
Washington, D.C. 20549
FORM N-CSR
CERTIFIED SHAREHOLDER REPORT OF REGISTERED
MANAGEMENT INVESTMENT COMPANIES
Investment Company Act file number 811-22338
Legg Mason Global Asset Management Trust
(Exact name of registrant as specified in charter)
100 International Drive, Baltimore, MD, 21202
(Address of principal executive offices) (Zip code)
Marc A. De Oliveira
Franklin Templeton
100 First Stamford Place
Stamford, CT 06902
(Name and address of agent for service)
Registrant’s telephone number, including area code: 877-6LM-FUND/656-3863
Date of fiscal year end: October 31
Date of reporting period: October 31, 2024
| ITEM 1. | REPORT TO STOCKHOLDERS |
The Annual Report to Stockholders is filed herewith.
BrandywineGLOBAL - Alternative Credit Fund |  | |
| Class A [LMAPX] | ||
| Annual Shareholder Report | October 31, 2024 | ||
 | ||
You can find additional information about the Fund at https://www.franklintempleton.com/regulatory-fund-documents. You can also request this information by contacting us at 877-6LM-FUND/656-3863.
Class Name | Costs of a $10,000 investment | Costs paid as a percentage of a $10,000 investment* |
| Class A | $166 | 1.60% |
| * | Reflects fee waivers and/or expense reimbursements, without which expenses would have been higher. |
Top contributors to performance: | |
| ↑ | U.S. high yield allocations were the top contributor for the reporting period. Investor sentiment remained strong due to the resilience of the U.S. economy, which drove robust corporate earnings and kept default rates below trend. Additionally, high yield’s yield advantage over other fixed-income options attracted increased inflows, providing solid support for the asset class. |
| ↑ | Prime U.S. mortgage-backed securities (MBS) were another top contributor over the reporting period. The U.S. housing market remained resilient, supported by low inventory and stable demand. MBS demand was robust, as yields were attractive relative to other fixed-income assets. Additionally, investors perceived MBS as a safer asset class, bolstered by strong property appreciation, which reduced default risks. |
| ↑ | An overweight position in Egyptian T-bills contributed positively over the period. These bonds offered attractive yields along with improved safety, thanks to the Egyptian government’s economic reforms aimed at stabilizing the economy and attracting foreign investment. |
Top detractors from performance: | |
| ↓ | The Fund’s short position on the Nasdaq and S&P 500 in November 2023 encountered challenges as both indices rallied significantly, with the S&P 500 rising 8.9% and the Nasdaq surging 10.8%. This upswing, driven by cooling inflation and labor market data, bolstered investor confidence and led to market expectations of a Fed rate-cutting cycle in early 2024. Positive corporate earnings and favorable seasonal factors further propelled gains, creating a challenging environment for the short positions. In response to this shift in market sentiment, the Fund exited these positions by year-end, adapting its strategy to align with the evolving economic outlook. |
| ↓ | An overweight in hedged Colombian bonds detracted over the period due to sluggish growth and challenges surrounding the administration’s attempted reforms. Budget uncertainty weighed on investor sentiment, driven by concerns over limited growth potential and fiscal stability. Colombia’s high fiscal deficit, coupled with increased debt issuance to meet financing needs, put additional pressure on bond prices, contributing to the underperformance. |
| BrandywineGLOBAL - Alternative Credit Fund | PAGE 1 | 7512-ATSR-1224 |
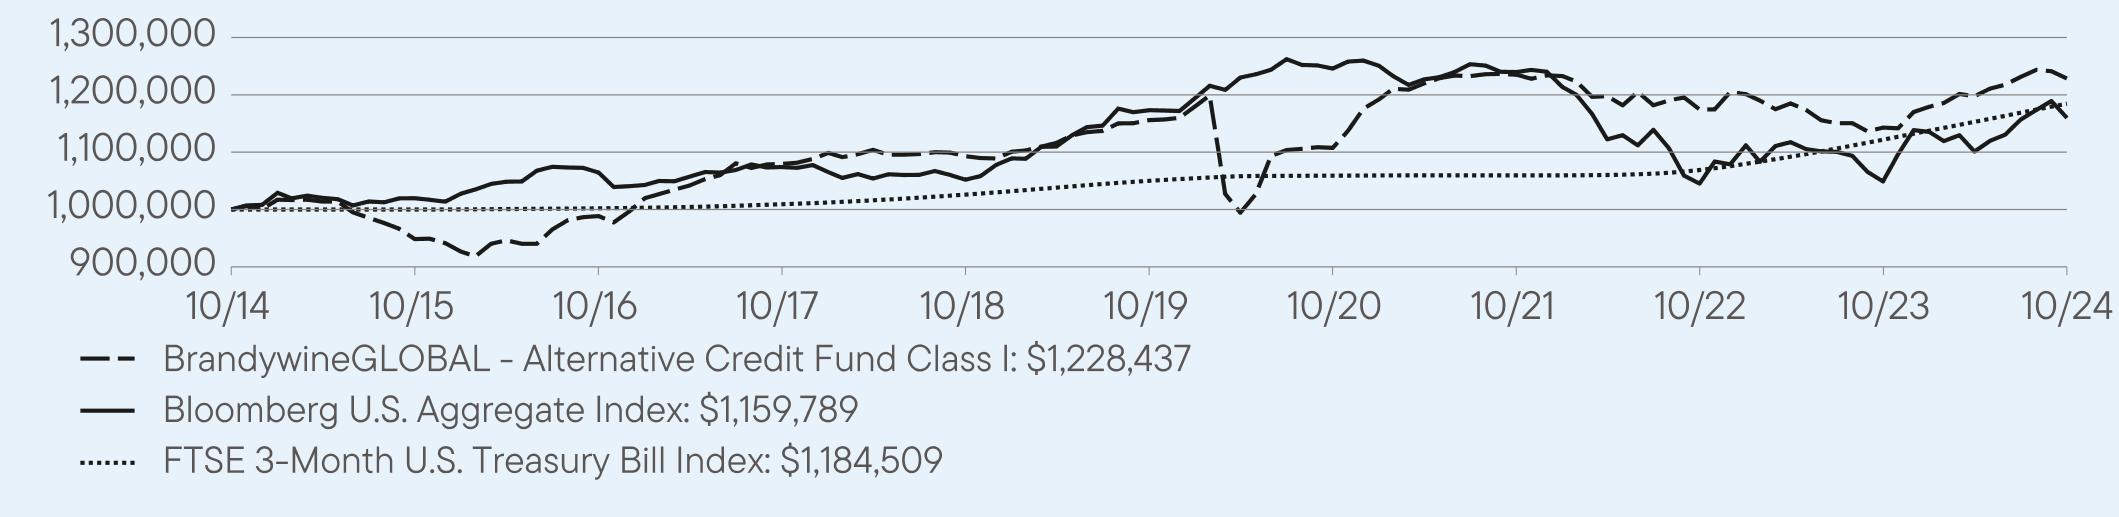
Class A 10/31/2014 — 10/31/2024
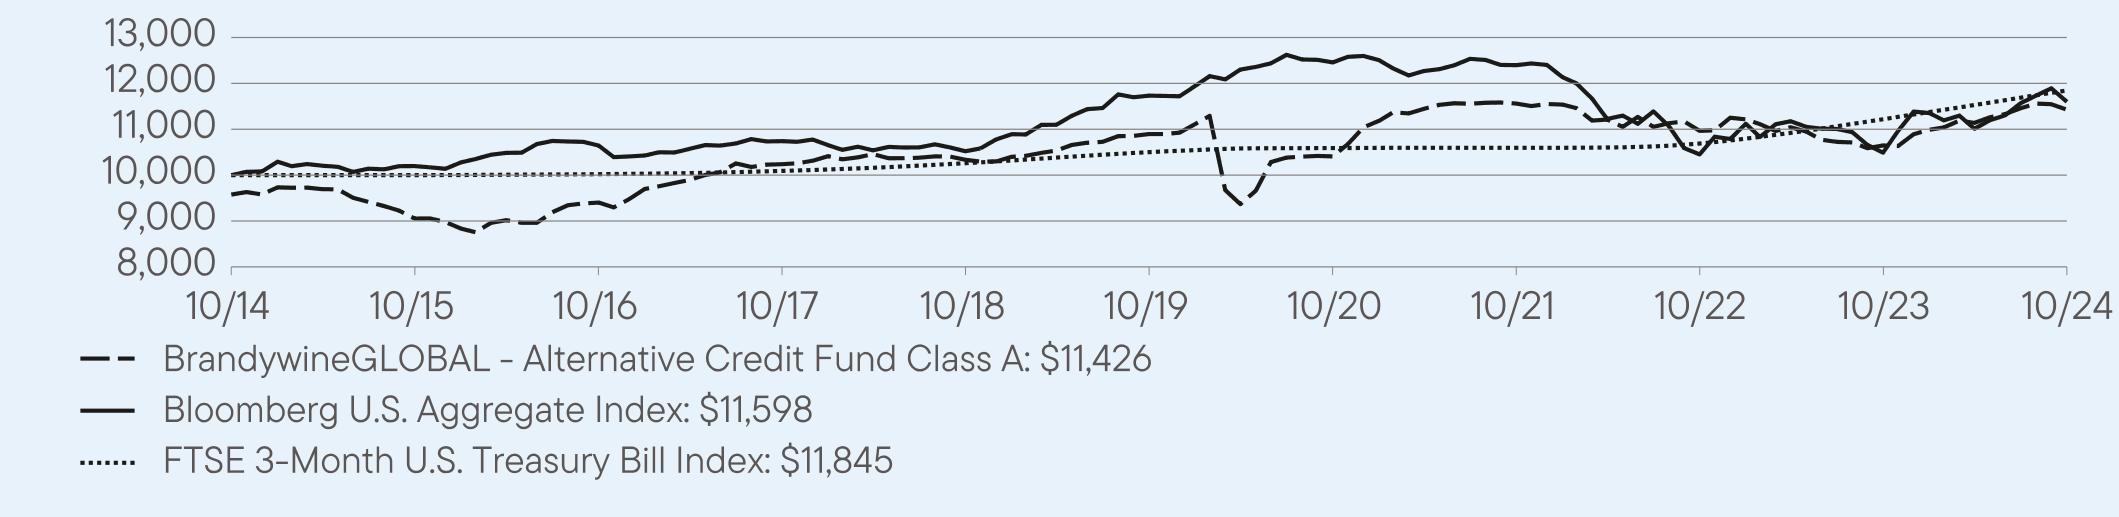
1 Year | 5 Year | 10 Year | |
Class A | 7.32 | 0.96 | 1.78 |
Class A (with sales charge) | 3.30 | 0.08 | 1.34 |
Bloomberg U.S. Aggregate Index | 10.55 | -0.23 | 1.49 |
FTSE 3-Month U.S. Treasury Bill Index | 5.59 | 2.44 | 1.71 |
Total Net Assets | $29,971,228 |
Total Number of Portfolio Holdings* | 68 |
Total Management Fee Paid | $545,082 |
Portfolio Turnover Rate | 159% |
| * | Does not include derivatives, except purchased options, if any. |
| BrandywineGLOBAL - Alternative Credit Fund | PAGE 2 | 7512-ATSR-1224 |

| * | Does not include derivatives, except purchased options, if any. |
prospectus@franklintempleton.com.
 | WHERE CAN I FIND ADDITIONAL INFORMATION ABOUT THE FUND? |
Additional information is available on https://www.franklintempleton.com/regulatory-fund-documents, including its: | |
| • prospectus • proxy voting information • financial information • holdings • tax information |
| BrandywineGLOBAL - Alternative Credit Fund | PAGE 3 | 7512-ATSR-1224 |
BrandywineGLOBAL - Alternative Credit Fund |  | |
| Class C [LMAQX] | ||
| Annual Shareholder Report | October 31, 2024 | ||
 | ||
You can find additional information about the Fund at https://www.franklintempleton.com/regulatory-fund-documents. You can also request this information by contacting us at 877-6LM-FUND/656-3863.
Class Name | Costs of a $10,000 investment | Costs paid as a percentage of a $10,000 investment* |
| Class C | $236 | 2.28% |
| * | Reflects fee waivers and/or expense reimbursements, without which expenses would have been higher. |
Top contributors to performance: | |
| ↑ | U.S. high yield allocations were the top contributor for the reporting period. Investor sentiment remained strong due to the resilience of the U.S. economy, which drove robust corporate earnings and kept default rates below trend. Additionally, high yield’s yield advantage over other fixed-income options attracted increased inflows, providing solid support for the asset class. |
| ↑ | Prime U.S. mortgage-backed securities (MBS) were another top contributor over the reporting period. The U.S. housing market remained resilient, supported by low inventory and stable demand. MBS demand was robust, as yields were attractive relative to other fixed-income assets. Additionally, investors perceived MBS as a safer asset class, bolstered by strong property appreciation, which reduced default risks. |
| ↑ | An overweight position in Egyptian T-bills contributed positively over the period. These bonds offered attractive yields along with improved safety, thanks to the Egyptian government’s economic reforms aimed at stabilizing the economy and attracting foreign investment. |
Top detractors from performance: | |
| ↓ | The Fund’s short position on the Nasdaq and S&P 500 in November 2023 encountered challenges as both indices rallied significantly, with the S&P 500 rising 8.9% and the Nasdaq surging 10.8%. This upswing, driven by cooling inflation and labor market data, bolstered investor confidence and led to market expectations of a Fed rate-cutting cycle in early 2024. Positive corporate earnings and favorable seasonal factors further propelled gains, creating a challenging environment for the short positions. In response to this shift in market sentiment, the Fund exited these positions by year-end, adapting its strategy to align with the evolving economic outlook. |
| ↓ | An overweight in hedged Colombian bonds detracted over the period due to sluggish growth and challenges surrounding the administration’s attempted reforms. Budget uncertainty weighed on investor sentiment, driven by concerns over limited growth potential and fiscal stability. Colombia’s high fiscal deficit, coupled with increased debt issuance to meet financing needs, put additional pressure on bond prices, contributing to the underperformance. |
| BrandywineGLOBAL - Alternative Credit Fund | PAGE 1 | 7522-ATSR-1224 |
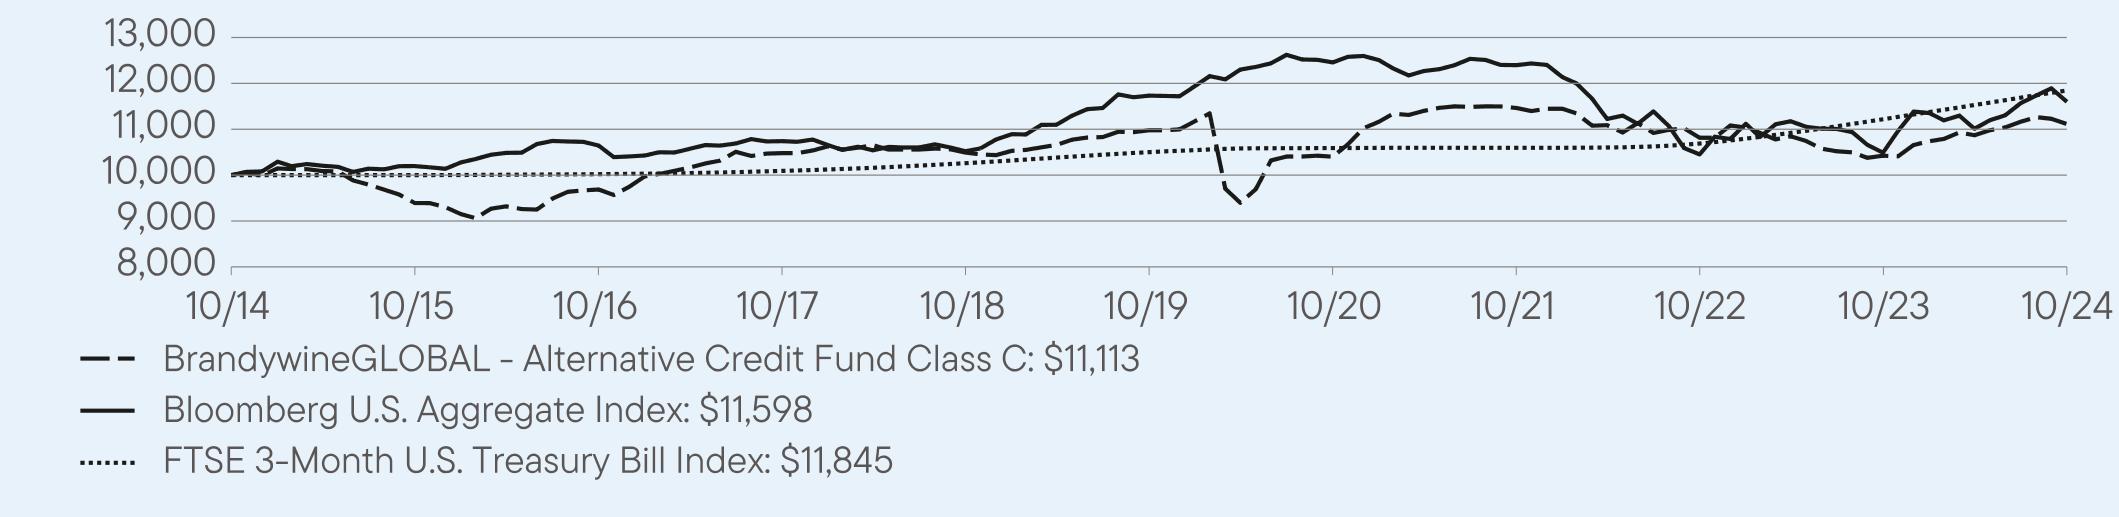
1 Year | 5 Year | 10 Year | |
Class C | 6.62 | 0.24 | 1.06 |
Class C (with sales charge) | 5.65 | 0.24 | 1.06 |
Bloomberg U.S. Aggregate Index | 10.55 | -0.23 | 1.49 |
FTSE 3-Month U.S. Treasury Bill Index | 5.59 | 2.44 | 1.71 |
Total Net Assets | $29,971,228 |
Total Number of Portfolio Holdings* | 68 |
Total Management Fee Paid | $545,082 |
Portfolio Turnover Rate | 159% |
| * | Does not include derivatives, except purchased options, if any. |
| BrandywineGLOBAL - Alternative Credit Fund | PAGE 2 | 7522-ATSR-1224 |
| * | Does not include derivatives, except purchased options, if any. |
prospectus@franklintempleton.com.
 | WHERE CAN I FIND ADDITIONAL INFORMATION ABOUT THE FUND? |
Additional information is available on https://www.franklintempleton.com/regulatory-fund-documents, including its: | |
| • prospectus • proxy voting information • financial information • holdings • tax information |
| BrandywineGLOBAL - Alternative Credit Fund | PAGE 3 | 7522-ATSR-1224 |
BrandywineGLOBAL - Alternative Credit Fund |  | |
| Class FI [LMAOX] | ||
| Annual Shareholder Report | October 31, 2024 | ||
 | ||
You can find additional information about the Fund at https://www.franklintempleton.com/regulatory-fund-documents. You can also request this information by contacting us at 877-6LM-FUND/656-3863.
Class Name | Costs of a $10,000 investment | Costs paid as a percentage of a $10,000 investment* |
| Class FI | $171 | 1.65% |
| * | Reflects fee waivers and/or expense reimbursements, without which expenses would have been higher. |
Top contributors to performance: | |
| ↑ | U.S. high yield allocations were the top contributor for the reporting period. Investor sentiment remained strong due to the resilience of the U.S. economy, which drove robust corporate earnings and kept default rates below trend. Additionally, high yield’s yield advantage over other fixed-income options attracted increased inflows, providing solid support for the asset class. |
| ↑ | Prime U.S. mortgage-backed securities (MBS) were another top contributor over the reporting period. The U.S. housing market remained resilient, supported by low inventory and stable demand. MBS demand was robust, as yields were attractive relative to other fixed-income assets. Additionally, investors perceived MBS as a safer asset class, bolstered by strong property appreciation, which reduced default risks. |
| ↑ | An overweight position in Egyptian T-bills contributed positively over the period. These bonds offered attractive yields along with improved safety, thanks to the Egyptian government’s economic reforms aimed at stabilizing the economy and attracting foreign investment. |
Top detractors from performance: | |
| ↓ | The Fund’s short position on the Nasdaq and S&P 500 in November 2023 encountered challenges as both indices rallied significantly, with the S&P 500 rising 8.9% and the Nasdaq surging 10.8%. This upswing, driven by cooling inflation and labor market data, bolstered investor confidence and led to market expectations of a Fed rate-cutting cycle in early 2024. Positive corporate earnings and favorable seasonal factors further propelled gains, creating a challenging environment for the short positions. In response to this shift in market sentiment, the Fund exited these positions by year-end, adapting its strategy to align with the evolving economic outlook. |
| ↓ | An overweight in hedged Colombian bonds detracted over the period due to sluggish growth and challenges surrounding the administration’s attempted reforms. Budget uncertainty weighed on investor sentiment, driven by concerns over limited growth potential and fiscal stability. Colombia’s high fiscal deficit, coupled with increased debt issuance to meet financing needs, put additional pressure on bond prices, contributing to the underperformance. |
| BrandywineGLOBAL - Alternative Credit Fund | PAGE 1 | 7123-ATSR-1224 |
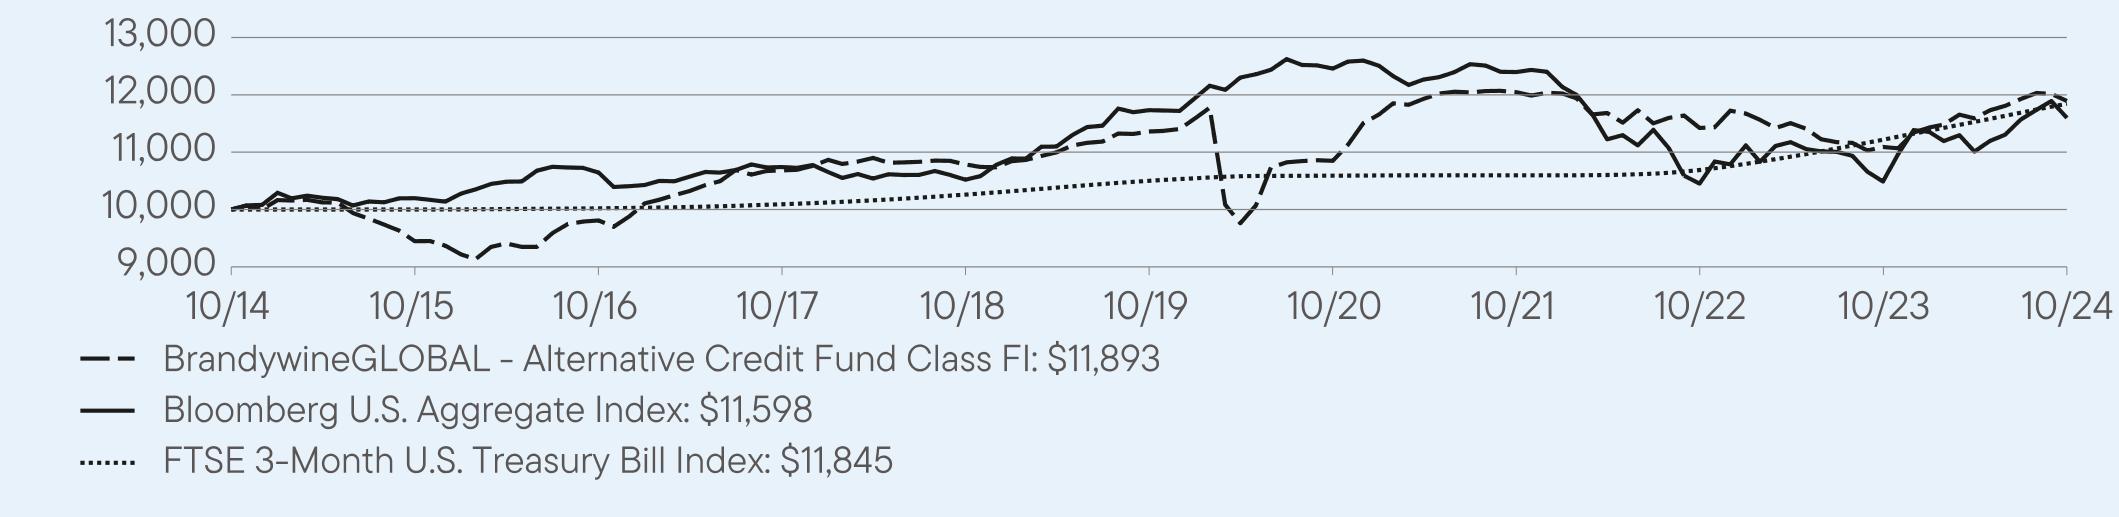
1 Year | 5 Year | 10 Year | |
Class FI | 7.22 | 0.92 | 1.75 |
Bloomberg U.S. Aggregate Index | 10.55 | -0.23 | 1.49 |
FTSE 3-Month U.S. Treasury Bill Index | 5.59 | 2.44 | 1.71 |
Total Net Assets | $29,971,228 |
Total Number of Portfolio Holdings* | 68 |
Total Management Fee Paid | $545,082 |
Portfolio Turnover Rate | 159% |
| * | Does not include derivatives, except purchased options, if any. |
| BrandywineGLOBAL - Alternative Credit Fund | PAGE 2 | 7123-ATSR-1224 |

| * | Does not include derivatives, except purchased options, if any. |
prospectus@franklintempleton.com.
 | WHERE CAN I FIND ADDITIONAL INFORMATION ABOUT THE FUND? |
Additional information is available on https://www.franklintempleton.com/regulatory-fund-documents, including its: | |
| • prospectus • proxy voting information • financial information • holdings • tax information |
| BrandywineGLOBAL - Alternative Credit Fund | PAGE 3 | 7123-ATSR-1224 |
BrandywineGLOBAL - Alternative Credit Fund |  | |
| Class I [LMANX] | ||
| Annual Shareholder Report | October 31, 2024 | ||
 | ||
You can find additional information about the Fund at https://www.franklintempleton.com/regulatory-fund-documents. You can also request this information by contacting us at 877-6LM-FUND/656-3863.
Class Name | Costs of a $10,000 investment | Costs paid as a percentage of a $10,000 investment* |
| Class I | $140 | 1.35% |
| * | Reflects fee waivers and/or expense reimbursements, without which expenses would have been higher. |
Top contributors to performance: | |
| ↑ | U.S. high yield allocations were the top contributor for the reporting period. Investor sentiment remained strong due to the resilience of the U.S. economy, which drove robust corporate earnings and kept default rates below trend. Additionally, high yield’s yield advantage over other fixed-income options attracted increased inflows, providing solid support for the asset class. |
| ↑ | Prime U.S. mortgage-backed securities (MBS) were another top contributor over the reporting period. The U.S. housing market remained resilient, supported by low inventory and stable demand. MBS demand was robust, as yields were attractive relative to other fixed-income assets. Additionally, investors perceived MBS as a safer asset class, bolstered by strong property appreciation, which reduced default risks. |
| ↑ | An overweight position in Egyptian T-bills contributed positively over the period. These bonds offered attractive yields along with improved safety, thanks to the Egyptian government’s economic reforms aimed at stabilizing the economy and attracting foreign investment. |
Top detractors from performance: | |
| ↓ | The Fund’s short position on the Nasdaq and S&P 500 in November 2023 encountered challenges as both indices rallied significantly, with the S&P 500 rising 8.9% and the Nasdaq surging 10.8%. This upswing, driven by cooling inflation and labor market data, bolstered investor confidence and led to market expectations of a Fed rate-cutting cycle in early 2024. Positive corporate earnings and favorable seasonal factors further propelled gains, creating a challenging environment for the short positions. In response to this shift in market sentiment, the Fund exited these positions by year-end, adapting its strategy to align with the evolving economic outlook. |
| ↓ | An overweight in hedged Colombian bonds detracted over the period due to sluggish growth and challenges surrounding the administration’s attempted reforms. Budget uncertainty weighed on investor sentiment, driven by concerns over limited growth potential and fiscal stability. Colombia’s high fiscal deficit, coupled with increased debt issuance to meet financing needs, put additional pressure on bond prices, contributing to the underperformance. |
| BrandywineGLOBAL - Alternative Credit Fund | PAGE 1 | 7524-ATSR-1224 |
1 Year | 5 Year | 10 Year | |
Class I | 7.49 | 1.22 | 2.08 |
Bloomberg U.S. Aggregate Index | 10.55 | -0.23 | 1.49 |
FTSE 3-Month U.S. Treasury Bill Index | 5.59 | 2.44 | 1.71 |
Total Net Assets | $29,971,228 |
Total Number of Portfolio Holdings* | 68 |
Total Management Fee Paid | $545,082 |
Portfolio Turnover Rate | 159% |
| * | Does not include derivatives, except purchased options, if any. |

| * | Does not include derivatives, except purchased options, if any. |
| BrandywineGLOBAL - Alternative Credit Fund | PAGE 2 | 7524-ATSR-1224 |
prospectus@franklintempleton.com.
 | WHERE CAN I FIND ADDITIONAL INFORMATION ABOUT THE FUND? |
Additional information is available on https://www.franklintempleton.com/regulatory-fund-documents, including its: | |
| • prospectus • proxy voting information • financial information • holdings • tax information |
| BrandywineGLOBAL - Alternative Credit Fund | PAGE 3 | 7524-ATSR-1224 |
BrandywineGLOBAL - Alternative Credit Fund |  | |
| Class IS [LMAMX] | ||
| Annual Shareholder Report | October 31, 2024 | ||
 | ||
You can find additional information about the Fund at https://www.franklintempleton.com/regulatory-fund-documents. You can also request this information by contacting us at 877-6LM-FUND/656-3863.
Class Name | Costs of a $10,000 investment | Costs paid as a percentage of a $10,000 investment* |
| Class IS | $130 | 1.25% |
| * | Reflects fee waivers and/or expense reimbursements, without which expenses would have been higher. |
Top contributors to performance: | |
| ↑ | U.S. high yield allocations were the top contributor for the reporting period. Investor sentiment remained strong due to the resilience of the U.S. economy, which drove robust corporate earnings and kept default rates below trend. Additionally, high yield’s yield advantage over other fixed-income options attracted increased inflows, providing solid support for the asset class. |
| ↑ | Prime U.S. mortgage-backed securities (MBS) were another top contributor over the reporting period. The U.S. housing market remained resilient, supported by low inventory and stable demand. MBS demand was robust, as yields were attractive relative to other fixed-income assets. Additionally, investors perceived MBS as a safer asset class, bolstered by strong property appreciation, which reduced default risks. |
| ↑ | An overweight position in Egyptian T-bills contributed positively over the period. These bonds offered attractive yields along with improved safety, thanks to the Egyptian government’s economic reforms aimed at stabilizing the economy and attracting foreign investment. |
Top detractors from performance: | |
| ↓ | The Fund’s short position on the Nasdaq and S&P 500 in November 2023 encountered challenges as both indices rallied significantly, with the S&P 500 rising 8.9% and the Nasdaq surging 10.8%. This upswing, driven by cooling inflation and labor market data, bolstered investor confidence and led to market expectations of a Fed rate-cutting cycle in early 2024. Positive corporate earnings and favorable seasonal factors further propelled gains, creating a challenging environment for the short positions. In response to this shift in market sentiment, the Fund exited these positions by year-end, adapting its strategy to align with the evolving economic outlook. |
| ↓ | An overweight in hedged Colombian bonds detracted over the period due to sluggish growth and challenges surrounding the administration’s attempted reforms. Budget uncertainty weighed on investor sentiment, driven by concerns over limited growth potential and fiscal stability. Colombia’s high fiscal deficit, coupled with increased debt issuance to meet financing needs, put additional pressure on bond prices, contributing to the underperformance. |
| BrandywineGLOBAL - Alternative Credit Fund | PAGE 1 | 7979-ATSR-1224 |
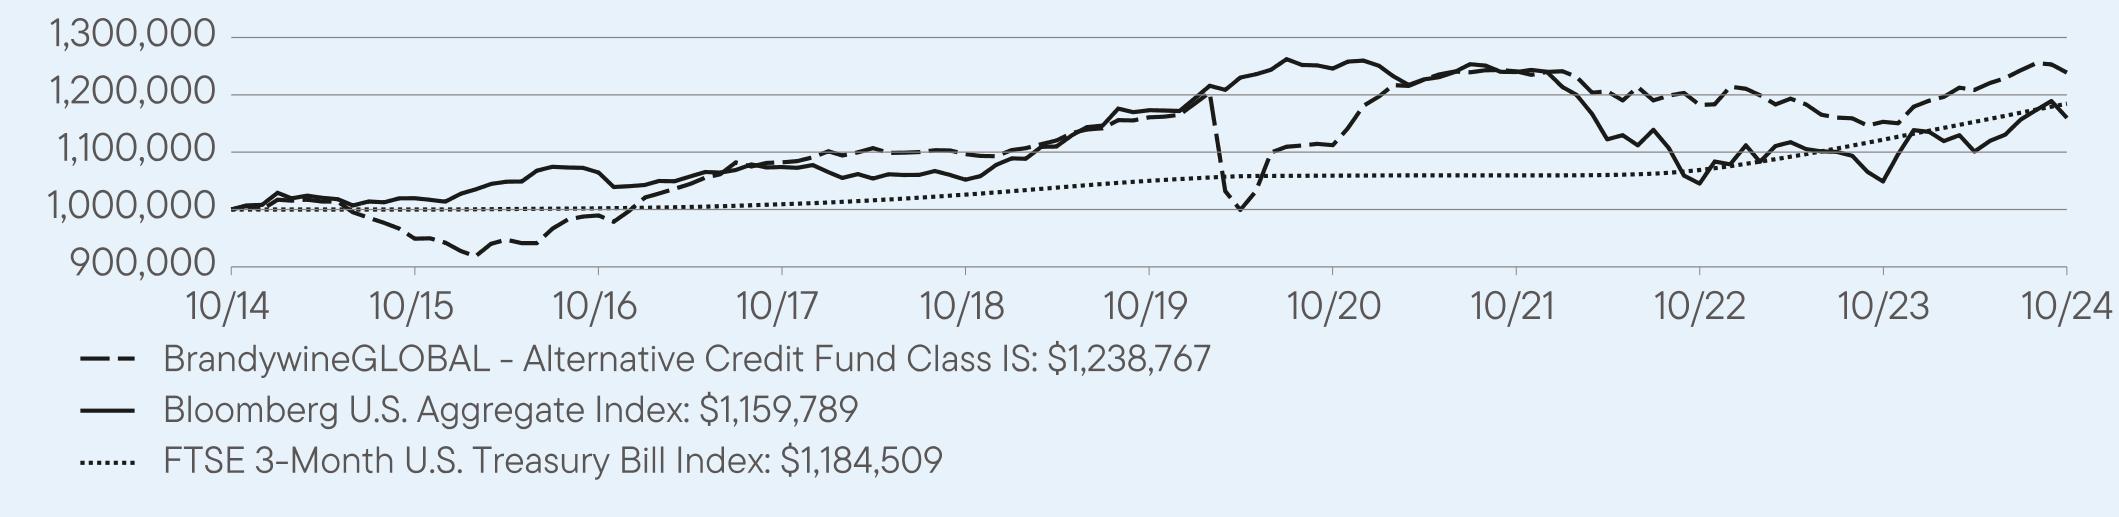
1 Year | 5 Year | 10 Year | |
Class IS | 7.44 | 1.31 | 2.16 |
Bloomberg U.S. Aggregate Index | 10.55 | -0.23 | 1.49 |
FTSE 3-Month U.S. Treasury Bill Index | 5.59 | 2.44 | 1.71 |
Total Net Assets | $29,971,228 |
Total Number of Portfolio Holdings* | 68 |
Total Management Fee Paid | $545,082 |
Portfolio Turnover Rate | 159% |
| * | Does not include derivatives, except purchased options, if any. |

| * | Does not include derivatives, except purchased options, if any. |
| BrandywineGLOBAL - Alternative Credit Fund | PAGE 2 | 7979-ATSR-1224 |
prospectus@franklintempleton.com.
 | WHERE CAN I FIND ADDITIONAL INFORMATION ABOUT THE FUND? |
Additional information is available on https://www.franklintempleton.com/regulatory-fund-documents, including its: | |
| • prospectus • proxy voting information • financial information • holdings • tax information |
| BrandywineGLOBAL - Alternative Credit Fund | PAGE 3 | 7979-ATSR-1224 |
| ITEM 2. | CODE OF ETHICS. |
The registrant has adopted a code of ethics that applies to the registrant’s principal executive officer, principal financial officer, principal accounting officer or controller.
| ITEM 3. | AUDIT COMMITTEE FINANCIAL EXPERT. |
The Board of Trustees of the registrant has determined that Stephen R. Gross, possesses the technical attributes identified in Instruction 2(b) of Item 3 to Form N-CSR to qualify as an “audit committee financial expert,” and has designated Stephen R. Gross as the Audit Committee’s financial expert. Stephen R. Gross is an “independent” Trustees pursuant to paragraph (a)(2) of Item 3 to Form N-CSR.
| Item 4. | Principal Accountant Fees and Services. |
(a) Audit Fees. The aggregate fees billed in the last two fiscal years ending October 31, 2023 and October 31, 2024 (the “Reporting Periods”) for professional services rendered by the Registrant’s principal accountant (the “Auditor”) for the audit of the Registrant’s annual financial statements, or services that are normally provided by the Auditor in connection with the statutory and regulatory filings or engagements for the Reporting Periods, were $200,329 in October 31, 2023 and $215,401 in October 31, 2024.
(b) Audit-Related Fees. The aggregate fees billed in the Reporting Period for assurance and related services by the Auditor that are reasonably related to the performance of the Registrant’s financial statements were $0 in October 31, 2023 and $0 in October 31, 2024.
(c) Tax Fees. The aggregate fees billed in the Reporting Periods for professional services rendered by the Auditor for tax compliance, tax advice and tax planning (“Tax Services”) were $52,000 in October 31, 2023 and $52,000 in October 31, 2024. These services consisted of (i) review or preparation of U.S. federal, state, local and excise tax returns; (ii) U.S. federal, state and local tax planning, advice and assistance regarding statutory, regulatory or administrative developments, and (iii) tax advice regarding tax qualification matters and/or treatment of various financial instruments held or proposed to be acquired or held.
There were no fees billed for tax services by to the service affiliates during the Reporting Periods that required pre-approval by the Audit Auditors Committee.
(d) All Other Fees. The aggregate fees for other fees billed in the Reporting Periods for products and services provided by the Auditor were $0 in October 31, 2023 and $0 in October 31, 2024, other than the services reported in paragraphs (a) through (c) of this item for the Legg Mason Global Asset Management Trust.
All Other Fees. There were no other non-audit services rendered by the Auditor to Franklin Templeton Fund Adviser, LLC (“FTFA”), and any entity controlling, controlled by or under common control with FTFA that provided ongoing services to Legg Mason Global Asset Management Trust requiring pre-approval by the Audit Committee in the Reporting Period.
(e) Audit Committee’s pre-approval policies and procedures described in paragraph (c) (7) of Rule 2-01 of Regulation S-X.
(1) The Charter for the Audit Committee (the “Committee”) of the Board of each registered investment company (the “Fund”) advised by FTFA or one of their affiliates (each, an “Adviser”) requires that the Committee shall approve (a) all audit and permissible non-audit services to be provided to the Fund and (b) all permissible non-audit services to be provided by the Fund’s independent auditors to the Adviser and any Covered Service Providers if the engagement relates directly to the operations and financial reporting of the Fund. The Committee may implement policies and procedures by which such services are approved other than by the full Committee.
The Committee shall not approve non-audit services that the Committee believes may impair the independence of the auditors. As of the date of the approval of this Audit Committee Charter, permissible non-audit services include any professional services (including tax services), that are not prohibited services as described below, provided to the Fund by the independent auditors, other than those provided to the Fund in connection with an audit or a review of the financial statements of the Fund. Permissible non-audit services may not include: (i) bookkeeping or other services related to the accounting records or financial statements of the Fund; (ii) financial information systems design and implementation; (iii) appraisal or valuation services, fairness opinions or contribution-in-kind reports; (iv) actuarial services; (v) internal audit outsourcing services; (vi) management functions or human resources; (vii) broker or dealer, investment adviser or investment banking services; (viii) legal services and expert services unrelated to the audit; and (ix) any other service the Public Company Accounting Oversight Board determines, by regulation, is impermissible.
Pre-approval by the Committee of any permissible non-audit services is not required so long as: (i) the aggregate amount of all such permissible non-audit services provided to the Fund, the Adviser and any service providers controlling, controlled by or under common control with the Adviser that provide ongoing services to the Fund (“Covered Service Providers”) constitutes not more than 5% of the total amount of revenues paid to the independent auditors during the fiscal year in which the permissible non-audit services are provided to (a) the Fund, (b) the Adviser and (c) any entity controlling, controlled by or under common control with the Adviser that provides ongoing services to the Fund during the fiscal year in which the services are provided that would have to be approved by the Committee; (ii) the permissible non-audit services were not recognized by the Fund at the time of the engagement to be non-audit services; and (iii) such services are promptly brought to the attention of the Committee and approved by the Committee (or its delegate(s)) prior to the completion of the audit.
(2) None of the services described in paragraphs (b) through (d) of this Item were performed in reliance on paragraph (c)(7)(i)(C) of Rule 2-01 of Regulation S-X.
(f) Not applicable.
(g) Non-audit fees billed by the Auditor for services rendered to Legg Mason Global Asset Management Trust, FTFA and any entity controlling, controlled by, or under common control with FTFA that provides ongoing services to Legg Mason Global Asset Management Trust during the reporting period were $835,053 in October 31, 2023 and $842,539 in October 31, 2024.
(h) Yes. Legg Mason Global Asset Management Trust’s Audit Committee has considered whether the provision of non-audit services that were rendered to Service Affiliates, which were not pre-approved (not requiring pre-approval), is compatible with maintaining the Accountant’s independence. All services provided by the Auditor to the Legg Mason Global Asset Management Trust or to Service Affiliates, which were required to be pre-approved, were pre-approved as required.
(i) Not applicable.
(j) Not applicable.
| ITEM 5. | AUDIT COMMITTEE OF LISTED REGISTRANTS. |
| a) | The independent board members are acting as the registrant’s audit committee as specified in Section 3(a)(58)(B) of the Exchange Act. The Audit Committee consists of the following Board members: |
Andrew L. Breech
Stephen R. Gross
Susan M. Heilbron
Arnold L. Lehman
Robin J. W. Masters
Ken Miller
G. Peter O’Brien*
Thomas F. Schlafly
* Effective February 7, 2024, Mr. O’Brien became Chair of the Board.
| b) | Not applicable |
| ITEM 6. | SCHEDULE OF INVESTMENTS. |
| (a) | Please see schedule of investments contained in the Financial Statements and Financial Highlights included under Item 7 of this Form N-CSR. |
| (b) | Not applicable. |
| ITEM 7. | FINANCIAL STATEMENTS AND FINANCIAL HIGLIGHTS FOR OPEN-END MANAGEMENT INVESTMENT COMPANIES. |

Alternative Credit Fund

1 | |
9 | |
11 | |
12 | |
13 | |
18 | |
36 | |
37 | |
38 | |
38 | |
38 | |
39 |
Security | Rate | Maturity Date | Face Amount† | Value | |
Corporate Bonds & Notes — 50.5% | |||||
Communication Services — 2.5% | |||||
Diversified Telecommunication Services — 1.3% | |||||
Level 3 Financing Inc., Senior Secured Notes | 10.500% | 5/15/30 | 370,000 | $406,537 (a) | |
Media — 1.2% | |||||
DISH Network Corp., Senior Secured Notes | 11.750% | 11/15/27 | 330,000 | 347,619 (a) | |
Total Communication Services | 754,156 | ||||
Consumer Discretionary — 3.9% | |||||
Hotels, Restaurants & Leisure — 3.9% | |||||
Affinity Interactive, Senior Secured Notes | 6.875% | 12/15/27 | 600,000 | 493,023 (a) | |
Grupo Posadas SAB de CV, Senior Secured Notes, Step bond (7.000% PIK to 12/30/25 then 8.000% Cash) | 7.000% | 12/30/27 | 340,000 | 310,779 (b)(c) | |
Mohegan Tribal Gaming Authority, Secured Notes | 8.000% | 2/1/26 | 370,000 | 367,742 (a) | |
Total Consumer Discretionary | 1,171,544 | ||||
Consumer Staples — 0.5% | |||||
Consumer Staples Distribution & Retail — 0.5% | |||||
Walgreens Boots Alliance Inc., Senior Notes | 3.200% | 4/15/30 | 190,000 | 151,230 | |
Energy — 21.5% | |||||
Energy Equipment & Services — 2.4% | |||||
Transocean Titan Financing Ltd., Senior Secured Notes | 8.375% | 2/1/28 | 340,000 | 350,138 (a) | |
Yinson Boronia Production BV, Senior Secured Notes | 8.947% | 7/31/42 | 330,000 | 350,380 (a) | |
Total Energy Equipment & Services | 700,518 | ||||
Oil, Gas & Consumable Fuels — 19.1% | |||||
Baytex Energy Corp., Senior Notes | 8.500% | 4/30/30 | 280,000 | 285,117 (a) | |
California Resources Corp., Senior Notes | 7.125% | 2/1/26 | 200,000 | 200,805 (a) | |
Ecopetrol SA, Senior Notes | 7.750% | 2/1/32 | 315,000 | 307,317 | |
Energean Israel Finance Ltd., Senior Secured Notes | 4.875% | 3/30/26 | 200,000 | 194,209 (c) | |
Kraken Oil & Gas Partners LLC, Senior Notes | 7.625% | 8/15/29 | 350,000 | 346,100 (a) | |
Leviathan Bond Ltd., Senior Secured Notes | 6.500% | 6/30/27 | 320,000 | 304,158 (c) | |
New Fortress Energy Inc., Senior Secured Notes | 6.750% | 9/15/25 | 700,000 | 699,098 (a) | |
New Fortress Energy Inc., Senior Secured Notes | 6.500% | 9/30/26 | 410,000 | 380,114 (a) | |
New Fortress Energy Inc., Senior Secured Notes | 8.750% | 3/15/29 | 160,000 | 133,721 (a) | |
OHI Group SA, Senior Secured Notes | 13.000% | 7/22/29 | 700,000 | 692,300 (a) | |
1
Security | Rate | Maturity Date | Face Amount† | Value | |
Oil, Gas & Consumable Fuels — continued | |||||
Petroleos Mexicanos, Senior Notes | 5.350% | 2/12/28 | 460,000 | $428,780 | |
Saturn Oil & Gas Inc., Senior Secured Notes | 9.625% | 6/15/29 | 654,000 | 646,401 (a) | |
Talos Production Inc., Secured Notes | 9.375% | 2/1/31 | 145,000 | 149,408 (a) | |
Transportadora de Gas del Sur SA, Senior Notes | 8.500% | 7/24/31 | 260,000 | 270,236 (a) | |
Wildfire Intermediate Holdings LLC, Senior Notes | 7.500% | 10/15/29 | 155,000 | 150,716 (a) | |
YPF SA, Senior Secured Notes | 9.000% | 2/12/26 | 540,000 | 545,732 (c) | |
Total Oil, Gas & Consumable Fuels | 5,734,212 | ||||
Total Energy | 6,434,730 | ||||
Financials — 3.5% | |||||
Banks — 0.7% | |||||
Bank of Nova Scotia, Junior Subordinated Notes (4.900% to 6/4/25 then 5 year Treasury Constant Maturity Rate + 4.551%) | 4.900% | 6/4/25 | 220,000 | 218,513 (d)(e) | |
Consumer Finance — 1.8% | |||||
Ally Financial Inc., Junior Subordinated Notes (4.700% to 5/15/26 then 5 year Treasury Constant Maturity Rate + 3.868%) | 4.700% | 5/15/26 | 390,000 | 352,069 (d)(e) | |
Enova International Inc., Senior Notes | 9.125% | 8/1/29 | 190,000 | 195,209 (a) | |
Total Consumer Finance | 547,278 | ||||
Financial Services — 0.3% | |||||
Freedom Mortgage Corp., Senior Notes | 12.000% | 10/1/28 | 70,000 | 75,693 (a) | |
Insurance — 0.7% | |||||
Ardonagh Finco Ltd., Senior Secured Notes | 7.750% | 2/15/31 | 200,000 | 205,238 (a) | |
Total Financials | 1,046,722 | ||||
Health Care — 1.3% | |||||
Health Care Providers & Services — 1.3% | |||||
Star Parent Inc., Senior Secured Notes | 9.000% | 10/1/30 | 360,000 | 374,851 (a) | |
Industrials — 5.4% | |||||
Building Products — 2.5% | |||||
AmeriTex HoldCo Intermediate LLC, Senior Secured Notes | 10.250% | 10/15/28 | 720,000 | 758,476 (a) | |
Machinery — 0.5% | |||||
Manitowoc Co. Inc., Secured Notes | 9.250% | 10/1/31 | 150,000 | 152,497 (a) | |
Passenger Airlines — 1.8% | |||||
Allegiant Travel Co., Senior Secured Notes | 7.250% | 8/15/27 | 255,000 | 251,426 (a) | |
AS Mileage Plan IP Ltd., Senior Secured Notes | 5.021% | 10/20/29 | 155,000 | 150,612 (a) | |
2
Security | Rate | Maturity Date | Face Amount† | Value | |
Passenger Airlines — continued | |||||
AS Mileage Plan IP Ltd., Senior Secured Notes | 5.308% | 10/20/31 | 155,000 | $149,657 (a) | |
Total Passenger Airlines | 551,695 | ||||
Trading Companies & Distributors — 0.6% | |||||
Air Lease Corp., Junior Subordinated Notes (4.650% to 6/15/26 then 5 year Treasury Constant Maturity Rate + 4.076%) | 4.650% | 6/15/26 | 175,000 | 170,157 (d)(e) | |
Total Industrials | 1,632,825 | ||||
Information Technology — 2.2% | |||||
Communications Equipment — 1.0% | |||||
Connect Finco SARL/Connect US Finco LLC, Senior Secured Notes | 9.000% | 9/15/29 | 300,000 | 285,330 (a) | |
IT Services — 1.2% | |||||
Sabre GLBL Inc., Senior Secured Notes | 8.625% | 6/1/27 | 380,000 | 367,072 (a) | |
Total Information Technology | 652,402 | ||||
Materials — 6.7% | |||||
Chemicals — 2.9% | |||||
Braskem Idesa SAPI, Senior Secured Notes | 7.450% | 11/15/29 | 240,000 | 190,558 (a) | |
Braskem Netherlands Finance BV, Senior Notes | 8.500% | 1/12/31 | 360,000 | 373,056 (a) | |
Cerdia Finanz GmbH, Senior Secured Notes | 9.375% | 10/3/31 | 300,000 | 309,285 (a) | |
Total Chemicals | 872,899 | ||||
Metals & Mining — 3.8% | |||||
CSN Resources SA, Senior Notes | 8.875% | 12/5/30 | 290,000 | 291,408 (a) | |
First Quantum Minerals Ltd., Senior Notes | 6.875% | 10/15/27 | 450,000 | 447,323 (a) | |
Taseko Mines Ltd., Senior Secured Notes | 8.250% | 5/1/30 | 380,000 | 393,145 (a) | |
Total Metals & Mining | 1,131,876 | ||||
Total Materials | 2,004,775 | ||||
Real Estate — 2.5% | |||||
Real Estate Management & Development — 2.5% | |||||
Fideicomiso Irrevocable de Administracion y Fuente de Pago Numero CIB/4323, Senior Secured Notes (11.000% PIK) | 11.000% | 9/12/30 | 710,000 | 740,175 (a)(b) | |
Utilities — 0.5% | |||||
Electric Utilities — 0.5% | |||||
YPF Energia Electrica SA, Senior Notes | 7.875% | 10/16/32 | 160,000 | 157,312 (a) | |
Total Corporate Bonds & Notes (Cost — $14,826,549) | 15,120,722 | ||||
Collateralized Mortgage Obligations(f) — 16.1% | |||||
ACRES Commercial Realty Ltd., 2021-FL1 D (1 mo. Term SOFR + 2.764%) | 7.545% | 6/15/36 | 150,000 | 145,029 (a)(e) | |
3
Security | Rate | Maturity Date | Face Amount† | Value | |
Collateralized Mortgage Obligations(f) — continued | |||||
Federal Home Loan Mortgage Corp. (FHLMC) REMIC, 5332 SA, IO (-1.000 x 30 Day Average SOFR + 6.000%) | 1.143% | 8/25/53 | 13,380,314 | $835,258 (e) | |
Federal Home Loan Mortgage Corp. (FHLMC) REMIC, Structured Agency Credit Risk Trust, 2022-DNA2 B1 (30 Day Average SOFR + 4.750%) | 9.607% | 2/25/42 | 110,000 | 116,013 (a)(e) | |
Federal Home Loan Mortgage Corp. (FHLMC) REMIC, Structured Agency Credit Risk Trust, 2022-DNA2 M2 (30 Day Average SOFR + 3.750%) | 8.607% | 2/25/42 | 750,000 | 786,113 (a)(e) | |
Federal Home Loan Mortgage Corp. (FHLMC) REMIC, Structured Agency Credit Risk Trust, 2022-DNA7 M2 (30 Day Average SOFR + 7.000%) | 11.857% | 3/25/52 | 500,000 | 572,272 (a)(e) | |
Federal Home Loan Mortgage Corp. (FHLMC) REMIC, Structured Agency Credit Risk Trust, 2022-HQA1 M1B (30 Day Average SOFR + 3.500%) | 8.357% | 3/25/42 | 320,000 | 333,697 (a)(e) | |
Federal National Mortgage Association (FNMA) — CAS, 2019-R03 1B1 (30 Day Average SOFR + 4.214%) | 9.071% | 9/25/31 | 1,095,577 | 1,162,778 (a)(e) | |
Federal National Mortgage Association (FNMA) — CAS, 2019-R04 2B1 (30 Day Average SOFR + 5.364%) | 10.221% | 6/25/39 | 811,357 | 859,537 (a)(e) | |
Total Collateralized Mortgage Obligations (Cost — $4,757,693) | 4,810,697 | ||||
Senior Loans — 8.0% | |||||
Communication Services — 2.1% | |||||
Diversified Telecommunication Services — 2.1% | |||||
Numericable U.S. LLC, USD Term Loan B14 (3 mo. Term SOFR + 5.500%) | 10.156% | 8/15/28 | 788,000 | 633,213 (e)(g)(h) | |
Consumer Discretionary — 0.9% | |||||
Textiles, Apparel & Luxury Goods — 0.9% | |||||
Hanesbrands Inc., Initial Term Loan B (1 mo. Term SOFR + 3.750%) | 8.435% | 3/8/30 | 268,013 | 270,358 (e)(g)(h)(i) | |
Energy — 3.5% | |||||
Oil, Gas & Consumable Fuels — 3.5% | |||||
New Fortress Energy Inc., Initial Term Loan (3 mo. Term SOFR + 5.000%) | 9.585% | 10/30/28 | 1,117,186 | 1,057,690 (e)(g)(h) | |
4
Security | Rate | Maturity Date | Face Amount† | Value | |
Health Care — 1.3% | |||||
Health Care Technology — 1.3% | |||||
Cotiviti Inc., Initial Term Loan (1 mo. Term SOFR + 3.250%) | 8.094% | 5/1/31 | 398,000 | $398,623 (e)(g)(h) | |
Industrials — 0.2% | |||||
Passenger Airlines — 0.2% | |||||
AS Mileage Plan IP Ltd., Initial Term Loan (3 mo. Term SOFR + 2.000%) | 6.656% | 10/1/31 | 50,000 | 49,938 (e)(g)(h) | |
Total Senior Loans (Cost — $2,375,040) | 2,409,822 | ||||
Asset-Backed Securities — 5.7% | |||||
Bain Capital Credit CLO Ltd., 2020-1A DR (3 mo. Term SOFR + 3.700%) | 8.332% | 4/18/33 | 650,000 | 651,996 (a)(e) | |
Bain Capital Credit CLO Ltd., 2023-1A E (3 mo. Term SOFR + 8.050%) | 12.697% | 4/16/36 | 410,000 | 420,475 (a)(e) | |
Exeter Automobile Receivables Trust, 2021-1A E | 2.210% | 2/15/28 | 650,000 | 634,420 (a) | |
Total Asset-Backed Securities (Cost — $1,713,329) | 1,706,891 | ||||
U.S. Government & Agency Obligations — 5.0% | |||||
U.S. Government Obligations — 5.0% | |||||
U.S. Treasury Notes (3 mo. U.S. Treasury Money Market Yield + 0.150%) (Cost — $1,498,207) | 4.692% | 4/30/26 | 1,500,000 | 1,498,891 (e) | |
Sovereign Bonds — 1.4% | |||||
Argentina — 0.5% | |||||
Argentine Republic Government International Bond, Senior Notes, Step bond (0.750% to 7/9/27 then 1.750%) | 0.750% | 7/9/30 | 240,000 | 162,080 | |
Panama — 0.9% | |||||
Panama Government International Bond, Senior Notes | 3.870% | 7/23/60 | 480,000 | 271,582 | |
Total Sovereign Bonds (Cost — $439,696) | 433,662 | ||||
Total Investments before Short-Term Investments (Cost — $25,610,514) | 25,980,685 | ||||
Short-Term Investments — 9.6% | |||||
Sovereign Bonds — 8.4% | |||||
Egypt Treasury Bills | 28.796% | 12/17/24 | 62,375,000 EGP | 1,233,516 (j) | |
Egypt Treasury Bills | 30.503% | 3/11/25 | 68,700,000 EGP | 1,275,912 (j) | |
Total Sovereign Bonds (Cost — $2,555,788) | 2,509,428 | ||||
5
Security | Rate | Shares | Value | ||
Money Market Funds — 1.2% | |||||
Western Asset Premier Institutional U.S. Treasury Reserves, Premium Shares (Cost — $377,738) | 4.746% | 377,738 | $377,738 (k)(l) | ||
Total Short-Term Investments (Cost — $2,933,526) | 2,887,166 | ||||
Total Investments — 96.3% (Cost — $28,544,040) | 28,867,851 | ||||
Other Assets in Excess of Liabilities — 3.7% | 1,103,377 | ||||
Total Net Assets — 100.0% | $29,971,228 | ||||
† | Face amount denominated in U.S. dollars, unless otherwise noted. |
(a) | Security is exempt from registration under Rule 144A of the Securities Act of 1933. This security may be resold in transactions that are exempt from registration, normally to qualified institutional buyers. This security has been deemed liquid pursuant to guidelines approved by the Board of Trustees. |
(b) | Payment-in-kind security for which the issuer has the option at each interest payment date of making interest payments in cash or additional securities. |
(c) | Security is exempt from registration under Regulation S of the Securities Act of 1933. Regulation S applies to securities offerings that are made outside of the United States and do not involve direct selling efforts in the United States. This security has been deemed liquid pursuant to guidelines approved by the Board of Trustees. |
(d) | Security has no maturity date. The date shown represents the next call date. |
(e) | Variable rate security. Interest rate disclosed is as of the most recent information available. Certain variable rate securities are not based on a published reference rate and spread but are determined by the issuer or agent and are based on current market conditions. These securities do not indicate a reference rate and spread in their description above. |
(f) | Collateralized mortgage obligations are secured by an underlying pool of mortgages or mortgage pass-through certificates that are structured to direct payments on underlying collateral to different series or classes of the obligations. The interest rate may change positively or inversely in relation to one or more interest rates, financial indices or other financial indicators and may be subject to an upper and/or lower limit. |
(g) | Interest rates disclosed represent the effective rates on senior loans. Ranges in interest rates are attributable to multiple contracts under the same loan. |
(h) | Senior loans may be considered restricted in that the Fund ordinarily is contractually obligated to receive approval from the agent bank and/or borrower prior to the disposition of a senior loan. |
(i) | Security is valued using significant unobservable inputs (Note 1). |
(j) | Rate shown represents yield-to-maturity. |
(k) | Rate shown is one-day yield as of the end of the reporting period. |
(l) | In this instance, as defined in the Investment Company Act of 1940, an “Affiliated Company” represents Fund ownership of at least 5% of the outstanding voting securities of an issuer, or a company which is under common ownership or control with the Fund. At October 31, 2024, the total market value of investments in Affiliated Companies was $377,738 and the cost was $377,738 (Note 8). |
6
Abbreviation(s) used in this schedule: | ||
CAS | — | Connecticut Avenue Securities |
CLO | — | Collateralized Loan Obligation |
EGP | — | Egyptian Pound |
IO | — | Interest Only |
PIK | — | Payment-In-Kind |
REMIC | — | Real Estate Mortgage Investment Conduit |
SOFR | — | Secured Overnight Financing Rate |
USD | — | United States Dollar |
Currency Purchased | Currency Sold | Counterparty | Settlement Date | Unrealized Depreciation | ||
USD | 413,028 | EUR | 380,000 | JPMorgan Chase & Co. | 11/7/24 | $(459 ) |
Abbreviation(s) used in this table: | ||
EUR | — | Euro |
USD | — | United States Dollar |
OTC CREDIT DEFAULT SWAPS ON SOVEREIGN ISSUES — SELL PROTECTION1 | |||||||
Swap Counterparty (Reference Entity) | Notional Amount2 | Termination Date | Implied Credit Spread at October 31, 20243 | Periodic Payments Received by the Fund† | Market Value | Upfront Premiums Paid (Received) | Unrealized Depreciation |
Barclays Bank PLC (Panama Government International Bond, 8.875%, due 9/30/27) | $1,590,000 | 12/20/33 | 2.615% | 1.000% quarterly | $(178,541) | $(155,794) | $(22,747) |
7
1 | If the Fund is a seller of protection and a credit event occurs, as defined under the terms of that particular swap agreement, the Fund will either (i) pay to the buyer of protection an amount equal to the notional amount of the swap and take delivery of the referenced obligation or underlying securities comprising the referenced index or (ii) pay a net settlement amount in the form of cash or securities equal to the notional amount of the swap less the recovery value of the referenced obligation or underlying securities comprising the referenced index. |
2 | The maximum potential amount the Fund could be required to pay as a seller of credit protection or receive as a buyer of credit protection if a credit event occurs as defined under the terms of that particular swap agreement. |
3 | Implied credit spreads, utilized in determining the market value of credit default swap agreements on corporate or sovereign issues as of period end, serve as an indicator of the current status of the payment/performance risk and represent the likelihood or risk of default for the credit derivative. The implied credit spread of a particular referenced entity reflects the cost of buying/selling protection and may include upfront payments required to be made to enter into the agreement. Wider credit spreads represent a deterioration of the referenced entity’s credit soundness and a greater likelihood or risk of default or other credit event occurring as defined under the terms of the agreement. A credit spread identified as “Defaulted” indicates a credit event has occurred for the referenced entity or obligation. |
† | Percentage shown is an annual percentage rate. |
Summary of Investments by Country# (unaudited) | |
United States | 55.1 % |
Brazil | 5.9 |
Mexico | 5.8 |
Canada | 5.3 |
Argentina | 3.9 |
Cayman Islands | 2.3 |
France | 2.2 |
Israel | 1.7 |
United Kingdom | 1.7 |
Zambia | 1.5 |
Jersey | 1.5 |
Germany | 1.1 |
Colombia | 1.1 |
Panama | 0.9 |
Short-Term Investments | 10.0 |
100.0 % | |
# | As a percentage of total investments. Please note that the Fund holdings are as of October 31, 2024, and are subject to change. |
8
Assets: | |
Investments in unaffiliated securities, at value (Cost — $28,166,302) | $28,490,113 |
Investments in affiliated securities, at value (Cost — $377,738) | 377,738 |
Foreign currency, at value (Cost — $668) | 660 |
Cash | 54,326 |
Receivable for securities sold | 1,074,387 |
Deposits with brokers for OTC derivatives | 360,000 |
Interest and dividends receivable from unaffiliated investments | 320,415 |
Receivable for Fund shares sold | 12,809 |
Dividends receivable from affiliated investments | 8,329 |
Receivable for open OTC swap contracts | 1,855 |
Deposits with brokers | 12 |
Other assets | 15,815 |
Prepaid expenses | 46,839 |
Total Assets | 30,763,298 |
Liabilities: | |
Payable for securities purchased | 449,688 |
OTC swaps, at value (premiums received — $155,794) | 178,541 |
Audit and tax fees payable | 47,953 |
Fund accounting fees payable | 35,414 |
Payable for Fund shares repurchased | 22,601 |
Trustees’ fees payable | 18,444 |
Investment management fee payable | 7,348 |
Service and/or distribution fees payable | 1,235 |
Unrealized depreciation on forward foreign currency contracts | 459 |
Accrued expenses | 30,387 |
Total Liabilities | 792,070 |
Total Net Assets | $29,971,228 |
Net Assets: | |
Par value (Note 7) | $35 |
Paid-in capital in excess of par value | 162,012,172 |
Total distributable earnings (loss) | (132,040,979 ) |
Total Net Assets | $29,971,228 |
9
Net Assets: | |
Class A | $4,015,071 |
Class C | $432,033 |
Class FI | $81,767 |
Class I | $23,820,788 |
Class IS | $1,621,569 |
Shares Outstanding: | |
Class A | 467,014 |
Class C | 50,476 |
Class FI | 9,492 |
Class I | 2,772,476 |
Class IS | 188,262 |
Net Asset Value: | |
Class A (and redemption price) | $8.60 |
Class C* | $8.56 |
Class FI (and redemption price) | $8.61 |
Class I (and redemption price) | $8.59 |
Class IS (and redemption price) | $8.61 |
Maximum Public Offering Price Per Share: | |
Class A (based on maximum initial sales charge of 3.75%) | $8.94 |
* | Redemption price per share is NAV of Class C shares reduced by a 1.00% CDSC if shares are redeemed within one year from purchase payment (Note 2). |
10
Investment Income: | |
Interest | $5,938,536 |
Dividends from affiliated investments | 162,033 |
Less: Foreign taxes withheld | (1,643 ) |
Total Investment Income | 6,098,926 |
Expenses: | |
Investment management fee (Note 2) | 774,289 |
Registration fees | 79,203 |
Fund accounting fees | 78,227 |
Transfer agent fees (Notes 2 and 5) | 49,637 |
Audit and tax fees | 48,453 |
Legal fees | 32,539 |
Service and/or distribution fees (Notes 2 and 5) | 16,854 |
Shareholder reports | 16,360 |
Trustees’ fees | 4,618 |
Custody fees | 2,085 |
Insurance | 621 |
Commitment fees (Note 9) | 588 |
Miscellaneous expenses | 11,615 |
Total Expenses | 1,115,089 |
Less: Fee waivers and/or expense reimbursements (Notes 2 and 5) | (229,207 ) |
Net Expenses | 885,882 |
Net Investment Income | 5,213,044 |
Realized and Unrealized Gain (Loss) on Investments, Futures Contracts, Swap Contracts, Forward Foreign Currency Contracts and Foreign Currency Transactions (Notes 1, 3 and 4): | |
Net Realized Gain (Loss) From: | |
Investment transactions in unaffiliated securities | (1,404,674 ) |
Futures contracts | (408,061 ) |
Swap contracts | (63,962 ) |
Forward foreign currency contracts | 28,331 |
Foreign currency transactions | (23,236 ) |
Net Realized Loss | (1,871,602 ) |
Change in Net Unrealized Appreciation (Depreciation) From: | |
Investments in unaffiliated securities | 3,886,043 |
Futures contracts | (1,088,662 ) |
Swap contracts | (68,721 ) |
Forward foreign currency contracts | (285,015 ) |
Foreign currencies | (11,184 ) |
Change in Net Unrealized Appreciation (Depreciation) | 2,432,461 |
Net Gain on Investments, Futures Contracts, Swap Contracts, Forward Foreign Currency Contracts and Foreign Currency Transactions | 560,859 |
Increase in Net Assets From Operations | $5,773,903 |
11
For the Years Ended October 31, | 2024 | 2023 |
Operations: | ||
Net investment income | $5,213,044 | $5,930,818 |
Net realized loss | (1,871,602 ) | (15,051,347 ) |
Change in net unrealized appreciation (depreciation) | 2,432,461 | 6,883,191 |
Increase (Decrease) in Net Assets From Operations | 5,773,903 | (2,237,338 ) |
Distributions to Shareholders From (Notes 1 and 6): | ||
Total distributable earnings | (5,500,014 ) | (4,600,014 ) |
Decrease in Net Assets From Distributions to Shareholders | (5,500,014 ) | (4,600,014 ) |
Fund Share Transactions (Note 7): | ||
Net proceeds from sale of shares | 12,650,087 | 15,930,481 |
Reinvestment of distributions | 5,487,620 | 4,590,579 |
Cost of shares repurchased | (65,102,062 ) | (55,402,358 ) |
Decrease in Net Assets From Fund Share Transactions | (46,964,355 ) | (34,881,298 ) |
Decrease in Net Assets | (46,690,466 ) | (41,718,650 ) |
Net Assets: | ||
Beginning of year | 76,661,694 | 118,380,344 |
End of year | $29,971,228 | $76,661,694 |
12
For a share of each class of beneficial interest outstanding throughout each year ended October 31: | |||||
Class A Shares1 | 2024 | 2023 | 2022 | 2021 | 2020 |
Net asset value, beginning of year | $8.87 | $9.54 | $10.28 | $9.75 | $10.56 |
Income (loss) from operations: | |||||
Net investment income | 0.67 | 0.53 | 0.26 | 0.29 | 0.24 |
Net realized and unrealized gain (loss) | (0.04 )2 | (0.79 ) | (0.78 ) | 0.78 | (0.71 ) |
Total income (loss) from operations | 0.63 | (0.26) | (0.52) | 1.07 | (0.47) |
Less distributions from: | |||||
Net investment income | (0.90 ) | (0.41 ) | (0.22 ) | (0.54 ) | (0.34 ) |
Total distributions | (0.90 ) | (0.41 ) | (0.22 ) | (0.54 ) | (0.34 ) |
Net asset value, end of year | $8.60 | $8.87 | $9.54 | $10.28 | $9.75 |
Total return3 | 7.32 % | (2.91 )% | (5.15 )% | 11.07 % | (4.47 )% |
Net assets, end of year (000s) | $4,015 | $5,403 | $12,257 | $11,942 | $9,840 |
Ratios to average net assets: | |||||
Gross expenses | 1.91 % | 1.79 %4 | 1.69 %4 | 1.69 %4 | 1.71 %4 |
Net expenses5,6 | 1.60 | 1.61 4 | 1.65 4 | 1.65 4 | 1.65 4 |
Net investment income | 7.45 | 5.68 | 2.61 | 2.79 | 2.48 |
Portfolio turnover rate | 159 % | 169 % | 182 % | 187 % | 73 % |
1 | Per share amounts have been calculated using the average shares method. |
2 | Calculation of the net loss per share (both realized and unrealized) does not correlate to the aggregate realized and unrealized gain presented in the Statement of Operations due to the timing of sales and repurchases of Fund shares. |
3 | Performance figures, exclusive of sales charges, may reflect compensating balance arrangements, fee waivers and/or expense reimbursements. In the absence of compensating balance arrangements, fee waivers and/or expense reimbursements, the total return would have been lower. Past performance is no guarantee of future results. |
4 | Reflects recapture of fees waived and/or expenses reimbursed from prior fiscal years. |
5 | As a result of an expense limitation arrangement, the ratio of total annual fund operating expenses, other than interest, brokerage commissions, dividend expense on short sales, taxes, extraordinary expenses and acquired fund fees and expenses, to average net assets of Class A shares did not exceed 1.65%. This expense limitation arrangement cannot be terminated prior to December 31, 2026 without the Board of Trustees’ consent. In addition, the manager has agreed to waive the Fund’s management fee to an extent sufficient to offset the net management fee payable in connection with any investment in an affiliated money market fund. |
6 | Reflects fee waivers and/or expense reimbursements. |
13
For a share of each class of beneficial interest outstanding throughout each year ended October 31: | |||||
Class C Shares1 | 2024 | 2023 | 2022 | 2021 | 2020 |
Net asset value, beginning of year | $8.83 | $9.47 | $10.20 | $9.67 | $10.49 |
Income (loss) from operations: | |||||
Net investment income | 0.61 | 0.45 | 0.19 | 0.21 | 0.17 |
Net realized and unrealized gain (loss) | (0.04 )2 | (0.78 ) | (0.76 ) | 0.77 | (0.72 ) |
Total income (loss) from operations | 0.57 | (0.33) | (0.57) | 0.98 | (0.55) |
Less distributions from: | |||||
Net investment income | (0.84 ) | (0.31 ) | (0.16 ) | (0.45 ) | (0.27 ) |
Total distributions | (0.84 ) | (0.31 ) | (0.16 ) | (0.45 ) | (0.27 ) |
Net asset value, end of year | $8.56 | $8.83 | $9.47 | $10.20 | $9.67 |
Total return3 | 6.62 % | (3.63 )% | (5.67 )% | 10.22 % | (5.26 )% |
Net assets, end of year (000s) | $432 | $460 | $3,079 | $2,767 | $4,877 |
Ratios to average net assets: | |||||
Gross expenses | 2.59 % | 2.50 % | 2.40 % | 2.40 %4 | 2.44 %4 |
Net expenses5,6 | 2.28 | 2.33 | 2.36 | 2.36 4 | 2.40 4 |
Net investment income | 6.82 | 4.76 | 1.96 | 2.03 | 1.73 |
Portfolio turnover rate | 159 % | 169 % | 182 % | 187 % | 73 % |
1 | Per share amounts have been calculated using the average shares method. |
2 | Calculation of the net loss per share (both realized and unrealized) does not correlate to the aggregate realized and unrealized gain presented in the Statement of Operations due to the timing of sales and repurchases of Fund shares. |
3 | Performance figures, exclusive of CDSC, may reflect compensating balance arrangements, fee waivers and/or expense reimbursements. In the absence of compensating balance arrangements, fee waivers and/or expense reimbursements, the total return would have been lower. Past performance is no guarantee of future results. |
4 | Reflects recapture of fees waived and/or expenses reimbursed from prior fiscal years. |
5 | As a result of an expense limitation arrangement, the ratio of total annual fund operating expenses, other than interest, brokerage commissions, dividend expense on short sales, taxes, extraordinary expenses and acquired fund fees and expenses, to average net assets of Class C shares did not exceed 2.40%. This expense limitation arrangement cannot be terminated prior to December 31, 2026 without the Board of Trustees’ consent. In addition, the manager has agreed to waive the Fund’s management fee to an extent sufficient to offset the net management fee payable in connection with any investment in an affiliated money market fund. |
6 | Reflects fee waivers and/or expense reimbursements. |
14
For a share of each class of beneficial interest outstanding throughout each year ended October 31: | |||||
Class FI Shares1 | 2024 | 2023 | 2022 | 2021 | 2020 |
Net asset value, beginning of year | $8.83 | $9.51 | $10.26 | $9.73 | $10.53 |
Income (loss) from operations: | |||||
Net investment income | 0.61 | 0.53 | 0.31 | 0.29 | 0.24 |
Net realized and unrealized gain (loss) | 0.01 | (0.80 ) | (0.83 ) | 0.77 | (0.72 ) |
Total income (loss) from operations | 0.62 | (0.27) | (0.52) | 1.06 | (0.48) |
Less distributions from: | |||||
Net investment income | (0.84 ) | (0.41 ) | (0.23 ) | (0.53 ) | (0.32 ) |
Total distributions | (0.84 ) | (0.41 ) | (0.23 ) | (0.53 ) | (0.32 ) |
Net asset value, end of year | $8.61 | $8.83 | $9.51 | $10.26 | $9.73 |
Total return2 | 6.97 % | (2.89 )% | (5.18 )% | 11.04 % | (4.51 )% |
Net assets, end of year (000s) | $82 | $3,721 | $4,087 | $104 | $107 |
Ratios to average net assets: | |||||
Gross expenses | 1.97 % | 1.85 % | 1.73 % | 1.81 % | 1.70 %3 |
Net expenses4,5 | 1.65 | 1.65 | 1.65 | 1.65 | 1.65 3 |
Net investment income | 6.79 | 5.71 | 3.24 | 2.78 | 2.41 |
Portfolio turnover rate | 159 % | 169 % | 182 % | 187 % | 73 % |
1 | Per share amounts have been calculated using the average shares method. |
2 | Performance figures may reflect compensating balance arrangements, fee waivers and/or expense reimbursements. In the absence of compensating balance arrangements, fee waivers and/or expense reimbursements, the total return would have been lower. Past performance is no guarantee of future results. |
3 | Reflects recapture of fees waived and/or expenses reimbursed from prior fiscal years. |
4 | As a result of an expense limitation arrangement, the ratio of total annual fund operating expenses, other than interest, brokerage commissions, dividend expense on short sales, taxes, extraordinary expenses and acquired fund fees and expenses, to average net assets of Class FI shares did not exceed 1.65%. This expense limitation arrangement cannot be terminated prior to December 31, 2026 without the Board of Trustees’ consent. In addition, the manager has agreed to waive the Fund’s management fee to an extent sufficient to offset the net management fee payable in connection with any investment in an affiliated money market fund. |
5 | Reflects fee waivers and/or expense reimbursements. |
15
For a share of each class of beneficial interest outstanding throughout each year ended October 31: | |||||
Class I Shares1 | 2024 | 2023 | 2022 | 2021 | 2020 |
Net asset value, beginning of year | $8.86 | $9.54 | $10.29 | $9.76 | $10.57 |
Income (loss) from operations: | |||||
Net investment income | 0.69 | 0.56 | 0.29 | 0.33 | 0.27 |
Net realized and unrealized gain (loss) | (0.04 )2 | (0.80 ) | (0.79 ) | 0.77 | (0.71 ) |
Total income (loss) from operations | 0.65 | (0.24) | (0.50) | 1.10 | (0.44) |
Less distributions from: | |||||
Net investment income | (0.92 ) | (0.44 ) | (0.25 ) | (0.57 ) | (0.37 ) |
Total distributions | (0.92 ) | (0.44 ) | (0.25 ) | (0.57 ) | (0.37 ) |
Net asset value, end of year | $8.59 | $8.86 | $9.54 | $10.29 | $9.76 |
Total return3 | 7.49 % | (2.70 )% | (4.91 )% | 11.53 % | (4.19 )% |
Net assets, end of year (000s) | $23,821 | $27,338 | $49,984 | $50,981 | $119,524 |
Ratios to average net assets: | |||||
Gross expenses | 1.74 % | 1.60 % | 1.44 % | 1.35 % | 1.34 % |
Net expenses4,5 | 1.35 | 1.35 | 1.35 | 1.31 | 1.32 |
Net investment income | 7.75 | 5.96 | 2.96 | 3.17 | 2.70 |
Portfolio turnover rate | 159 % | 169 % | 182 % | 187 % | 73 % |
1 | Per share amounts have been calculated using the average shares method. |
2 | Calculation of the net loss per share (both realized and unrealized) does not correlate to the aggregate realized and unrealized gain presented in the Statement of Operations due to the timing of sales and repurchases of Fund shares. |
3 | Performance figures may reflect compensating balance arrangements, fee waivers and/or expense reimbursements. In the absence of compensating balance arrangements, fee waivers and/or expense reimbursements, the total return would have been lower. Past performance is no guarantee of future results. |
4 | As a result of an expense limitation arrangement, the ratio of total annual fund operating expenses, other than interest, brokerage commissions, dividend expense on short sales, taxes, extraordinary expenses and acquired fund fees and expenses, to average net assets of Class I shares did not exceed 1.35%. This expense limitation arrangement cannot be terminated prior to December 31, 2026 without the Board of Trustees’ consent. In addition, the manager has agreed to waive the Fund’s management fee to an extent sufficient to offset the net management fee payable in connection with any investment in an affiliated money market fund. |
5 | Reflects fee waivers and/or expense reimbursements. |
16
For a share of each class of beneficial interest outstanding throughout each year ended October 31: | |||||
Class IS Shares1 | 2024 | 2023 | 2022 | 2021 | 2020 |
Net asset value, beginning of year | $8.89 | $9.57 | $10.31 | $9.77 | $10.59 |
Income (loss) from operations: | |||||
Net investment income | 0.70 | 0.57 | 0.28 | 0.33 | 0.28 |
Net realized and unrealized gain (loss) | (0.05 )2 | (0.80 ) | (0.76 ) | 0.79 | (0.73 ) |
Total income (loss) from operations | 0.65 | (0.23) | (0.48) | 1.12 | (0.45) |
Less distributions from: | |||||
Net investment income | (0.93 ) | (0.45 ) | (0.26 ) | (0.58 ) | (0.37 ) |
Total distributions | (0.93 ) | (0.45 ) | (0.26 ) | (0.58 ) | (0.37 ) |
Net asset value, end of year | $8.61 | $8.89 | $9.57 | $10.31 | $9.77 |
Total return3 | 7.44 % | (2.48 )% | (4.73 )% | 11.58 % | (4.19 )% |
Net assets, end of year (000s) | $1,622 | $39,739 | $48,973 | $148,457 | $86,118 |
Ratios to average net assets: | |||||
Gross expenses | 1.56 % | 1.43 % | 1.29 % | 1.29 % | 1.28 %4 |
Net expenses5,6 | 1.25 | 1.25 | 1.25 | 1.25 | 1.25 4 |
Net investment income | 7.79 | 6.09 | 2.84 | 3.19 | 2.83 |
Portfolio turnover rate | 159 % | 169 % | 182 % | 187 % | 73 % |
1 | Per share amounts have been calculated using the average shares method. |
2 | Calculation of the net loss per share (both realized and unrealized) does not correlate to the aggregate realized and unrealized gain presented in the Statement of Operations due to the timing of sales and repurchases of Fund shares. |
3 | Performance figures may reflect compensating balance arrangements, fee waivers and/or expense reimbursements. In the absence of compensating balance arrangements, fee waivers and/or expense reimbursements, the total return would have been lower. Past performance is no guarantee of future results. |
4 | Reflects recapture of fees waived and/or expenses reimbursed from prior fiscal years. |
5 | As a result of an expense limitation arrangement, the ratio of total annual fund operating expenses, other than interest, brokerage commissions, dividend expense on short sales, taxes, extraordinary expenses and acquired fund fees and expenses, to average net assets of Class IS shares did not exceed 1.25%. In addition, the ratio of total annual fund operating expenses for Class IS shares did not exceed the ratio of total annual fund operating expenses for Class I shares. These expense limitation arrangements cannot be terminated prior to December 31, 2026 without the Board of Trustees’ consent. In addition, the manager has agreed to waive the Fund’s management fee to an extent sufficient to offset the net management fee payable in connection with any investment in an affiliated money market fund. |
6 | Reflects fee waivers and/or expense reimbursements. |
17
18
19
ASSETS | ||||
Description | Quoted Prices (Level 1) | Other Significant Observable Inputs (Level 2) | Significant Unobservable Inputs (Level 3) | Total |
Long-Term Investments†: | ||||
Corporate Bonds & Notes | — | $15,120,722 | — | $15,120,722 |
Collateralized Mortgage Obligations | — | 4,810,697 | — | 4,810,697 |
Senior Loans: | ||||
Consumer Discretionary | — | — | $270,358 | 270,358 |
Other Senior Loans | — | 2,139,464 | — | 2,139,464 |
Asset-Backed Securities | — | 1,706,891 | — | 1,706,891 |
U.S. Government & Agency Obligations | — | 1,498,891 | — | 1,498,891 |
Sovereign Bonds | — | 433,662 | — | 433,662 |
Total Long-Term Investments | — | 25,710,327 | 270,358 | 25,980,685 |
Short-Term Investments†: | ||||
Sovereign Bonds | — | 2,509,428 | — | 2,509,428 |
Money Market Funds | $377,738 | — | — | 377,738 |
Total Short-Term Investments | 377,738 | 2,509,428 | — | 2,887,166 |
Total Investments | $377,738 | $28,219,755 | $270,358 | $28,867,851 |
LIABILITIES | ||||
Description | Quoted Prices (Level 1) | Other Significant Observable Inputs (Level 2) | Significant Unobservable Inputs (Level 3) | Total |
Other Financial Instruments: | ||||
Forward Foreign Currency Contracts†† | — | $459 | — | $459 |
OTC Credit Default Swaps on Sovereign Issues — Sell Protection‡ | — | 178,541 | — | 178,541 |
Total | — | $179,000 | — | $179,000 |
† | See Schedule of Investments for additional detailed categorizations. |
†† | Reflects the unrealized appreciation (depreciation) of the instruments. |
‡ | Value includes any premium paid or received with respect to swap contracts. |
20
21
22
23
24
25
26
Total Distributable Earnings (Loss) | Paid-in Capital | |
(a) | $(7,326) | $7,326 |
27
During the year ended October 31, 2024, fees waived and/or expenses reimbursed amounted to $229,207, which included an affiliated money market fund waiver of $2,773.
Class A | Class C | Class FI | Class I | Class IS | |
Expires October 31, 2025 | $4,591 | $1,202 | $1,627 | $49,043 | $47,385 |
Expires October 31, 2026 | 13,417 | 1,445 | 8,100 | 101,365 | 78,384 |
Expires October 31, 2027 | 13,732 | 1,332 | 1,681 | 94,965 | 114,724 |
Total fee waivers/expense reimbursements subject to recapture | $31,740 | $3,979 | $11,408 | $245,373 | $240,493 |
28
Class A | |
Sales charges | $16 |
CDSCs | — |
Investments | U.S. Government & Agency Obligations | |
Purchases | $74,420,207 | $22,222,790 |
Sales | 118,536,526 | 27,263,764 |
29
Cost/Premiums Paid (Received) | Gross Unrealized Appreciation | Gross Unrealized Depreciation | Net Unrealized Depreciation | |
Securities | $31,885,372 | $550,291 | $(3,567,812) | $(3,017,521) |
Forward foreign currency contracts | — | — | (459) | (459) |
Swap contracts | (155,794) | — | (22,747) | (22,747) |
LIABILITY DERIVATIVES1 | |||
Foreign Exchange Risk | Credit Risk | Total | |
Forward foreign currency contracts | $459 | — | $459 |
OTC swap contracts2 | — | $178,541 | 178,541 |
Total | $459 | $178,541 | $179,000 |
1 | Generally, the balance sheet location for asset derivatives is receivables/net unrealized appreciation and for liability derivatives is payables/net unrealized depreciation. |
2 | Values include premiums paid (received) on swap contracts which are shown separately in the Statement of Assets and Liabilities. |
AMOUNT OF NET REALIZED GAIN (LOSS) ON DERIVATIVES RECOGNIZED | |||||
Interest Rate Risk | Foreign Exchange Risk | Credit Risk | Equity Risk | Total | |
Futures contracts | $11,617 | — | — | $(419,678 ) | $(408,061 ) |
Swap contracts | — | — | $(63,962 ) | — | (63,962 ) |
Forward foreign currency contracts | — | $28,331 | — | — | 28,331 |
Total | $11,617 | $28,331 | $(63,962 ) | $(419,678 ) | $(443,692 ) |
30
CHANGE IN NET UNREALIZED APPRECIATION (DEPRECIATION) ON DERIVATIVES RECOGNIZED | |||||
Interest Rate Risk | Foreign Exchange Risk | Credit Risk | Equity Risk | Total | |
Futures contracts | $(81,473 ) | — | — | $(1,007,189 ) | $(1,088,662 ) |
Swap contracts | — | — | $(68,721 ) | — | (68,721 ) |
Forward foreign currency contracts | — | $(285,015 ) | — | — | (285,015 ) |
Total | $(81,473 ) | $(285,015 ) | $(68,721 ) | $(1,007,189 ) | $(1,442,398 ) |
Average Market Value | |
Futures contracts (to sell)† | $1,489,111 |
Forward foreign currency contracts (to buy)† | 2,724,486 |
Forward foreign currency contracts (to sell) | 3,448,301 |
Average Notional Balance | |
Credit default swap contracts (buy protection)† | $673,115 |
Credit default swap contracts (sell protection) | 1,823,077 |
† | At October 31, 2024, there were no open positions held in this derivative. |
Counterparty | Gross Assets Subject to Master Agreements | Gross Liabilities Subject to Master Agreements1 | Net Assets (Liabilities) Subject to Master Agreements | Collateral Pledged (Received)2,3 | Net Amount4,5 |
Barclays Capital Inc. | — | $(178,541) | $(178,541) | $178,541 | — |
JPMorgan Chase & Co. | — | (459) | (459) | — | $(459) |
Total | — | $(179,000) | $(179,000) | $178,541 | $(459) |
1 | Absent an event of default or early termination, derivative assets and liabilities are presented gross and not offset in the Statement of Assets and Liabilities. |
2 | Gross amounts are not offset in the Statement of Assets and Liabilities. |
3 | In some instances, the actual collateral received and/or pledged may be more than the amount shown here due to overcollateralization. |
4 | Net amount may also include forward foreign currency exchange contracts that are not required to be collateralized. |
5 | Represents the net amount receivable (payable) from (to) the counterparty in the event of default. |
31
Service and/or Distribution Fees | Transfer Agent Fees | |
Class A | $11,193 | $4,517 |
Class C | 4,344 | 133 |
Class FI | 1,317 | 850 |
Class I | — | 43,590 |
Class IS | — | 547 |
Total | $16,854 | $49,637 |
Waivers/Expense Reimbursements | |
Class A | $13,933 |
Class C | 1,352 |
Class FI | 1,693 |
Class I | 96,122 |
Class IS | 116,107 |
Total | $229,207 |
Year Ended October 31, 2024 | Year Ended October 31, 2023 | |
Net Investment Income: | ||
Class A | $431,103 | $335,984 |
Class C | 40,386 | 24,283 |
Class FI | 8,189 | 177,818 |
Class I | 2,529,112 | 1,923,293 |
Class IS | 2,491,224 | 2,138,636 |
Total | $5,500,014 | $4,600,014 |
32
Year Ended October 31, 2024 | Year Ended October 31, 2023 | |||
Shares | Amount | Shares | Amount | |
Class A | ||||
Shares sold | 22,521 | $204,949 | 272,292 | $2,616,623 |
Shares issued on reinvestment | 47,954 | 423,217 | 36,141 | 334,069 |
Shares repurchased | (212,841 ) | (1,909,441 ) | (983,614 ) | (9,271,043 ) |
Net decrease | (142,366 ) | $(1,281,275 ) | (675,181 ) | $(6,320,351 ) |
Class C | ||||
Shares sold | 2,274 | $20,584 | 4,156 | $39,544 |
Shares issued on reinvestment | 4,600 | 40,386 | 2,628 | 24,283 |
Shares repurchased | (8,517 ) | (75,802 ) | (279,774 ) | (2,652,109 ) |
Net decrease | (1,643 ) | $(14,832 ) | (272,990 ) | $(2,588,282 ) |
Class FI | ||||
Shares sold | 6,424 | $56,493 | 79,531 | $736,688 |
Shares issued on reinvestment | 923 | 8,189 | 19,353 | 177,796 |
Shares repurchased | (419,201 ) | (3,732,024 ) | (107,183 ) | (986,759 ) |
Net decrease | (411,854 ) | $(3,667,342 ) | (8,299 ) | $(72,275 ) |
Class I | ||||
Shares sold | 943,153 | $8,490,791 | 877,116 | $8,184,231 |
Shares issued on reinvestment | 286,965 | 2,528,445 | 207,138 | 1,917,498 |
Shares repurchased | (1,542,213 ) | (13,762,828 ) | (3,236,760 ) | (29,911,197 ) |
Net decrease | (312,095 ) | $(2,743,592 ) | (2,152,506 ) | $(19,809,468 ) |
Class IS | ||||
Shares sold | 434,502 | $3,877,270 | 465,232 | $4,353,395 |
Shares issued on reinvestment | 278,334 | 2,487,383 | 231,042 | 2,136,933 |
Shares repurchased | (4,995,098 ) | (45,621,967 ) | (1,341,992 ) | (12,581,250 ) |
Net decrease | (4,282,262 ) | $(39,257,314 ) | (645,718 ) | $(6,090,922 ) |
33
Affiliate Value at October 31, 2023 | Purchased | Sold | |||
Cost | Shares | Proceeds | Shares | ||
Western Asset Premier Institutional U.S. Treasury Reserves, Premium Shares | $924,775 | $95,881,237 | 95,881,237 | $96,428,274 | 96,428,274 |
(cont’d) | Realized Gain (Loss) | Dividend Income | Net Increase (Decrease) in Unrealized Appreciation (Depreciation) | Affiliate Value at October 31, 2024 |
Western Asset Premier Institutional U.S. Treasury Reserves, Premium Shares | — | $162,033 | — | $377,738 |
2024 | 2023 | |
Distributions paid from: | ||
Ordinary income | $5,500,014 | $4,600,014 |
34
Undistributed ordinary income — net | $376,199 |
Deferred capital losses* | (129,364,325) |
Other book/tax temporary differences(a) | (227) |
Unrealized appreciation (depreciation)(b) | (3,052,626) |
Total distributable earnings (loss) — net | $(132,040,979) |
* | These capital losses have been deferred in the current year as either short-term or long-term losses. The losses will be deemed to occur on the first day of the next taxable year in the same character as they were originally deferred and will be available to offset future taxable capital gains. |
(a) | Other book/tax temporary differences are attributable to the tax deferral of losses on straddles and book/tax differences in the timing of the deductibility of various expenses. |
(b) | The difference between book-basis and tax-basis unrealized appreciation (depreciation) is attributable to the tax deferral of losses on wash sales and the difference between book and tax accretion of market discount on fixed income securities. |
35
December 20, 2024
36
Pursuant to: | Amount Reported | |
Qualified Net Interest Income (QII) | §871(k)(1)(C) | $3,204,658 |
Section 163(j) Interest Earned | §163(j) | $5,870,568 |
Interest Earned from Federal Obligations | Note (1) | $197,582 |
37
38
39
40
41
42
43
44
Chair
Services, LLC
3344 Quality Drive
Rancho Cordova, CA 95670-7313
Baltimore, MD
Legg Mason Funds
100 International Drive
Baltimore, MD 21202
Your Privacy Is Our Priority
https://www.franklintempleton.com/help/privacy-policy or contact us for a copy at (800) 632-2301.

| ITEM 8. | CHANGES IN AND DISAGREEMENTS WITH ACCOUNTANTS FOR OPEN-END MANAGEMENT INVESTMENT COMPANIES. |
The information is disclosed as part of the Financial Statements included in Item 7 of this Form N-CSR.
| ITEM 9. | PROXY DISCLOSURES FOR OPEN-END MANAGEMENT INVESTMENT COMPANIES. |
The information is disclosed as part of the Financial Statements included in Item 7 of this Form N-CSR.
| ITEM 10. | REMUNERATION PAID TO DIRECTORS, OFFICERS, AND OTHERS OF OPEN-END MANAGEMENT INVESTMENT COMPANIES. |
The information is disclosed as part of the Financial Statements included in Item 7 of this Form N-CSR.
| ITEM 11. | STATEMENT REGARDING BASIS FOR APPROVAL OF INVESTMENT ADVISORY CONTRACT. |
The information is disclosed as part of the Financial Statements included in Item 7 of this Form N-CSR, as applicable.
| ITEM 12. | DISCLOSURE OF PROXY VOTING POLICIES AND PROCEDURES FOR CLOSED-END MANAGEMENT INVESTMENT COMPANIES. |
Not applicable.
| ITEM 13. | PORTFOLIO MANAGERS OF CLOSED-END MANAGEMENT INVESTMENT COMPANIES. |
Not applicable.
| ITEM 14. | PURCHASES OF EQUITY SECURITIES BY CLOSED-END MANAGEMENT INVESTMENT COMPANY AND AFFILIATED PURCHASERS. |
Not applicable.
| ITEM 15. | SUBMISSION OF MATTERS TO A VOTE OF SECURITY HOLDERS. |
Not applicable.
| ITEM 16. | CONTROLS AND PROCEDURES. |
| (a) | The registrant’s principal executive officer and principal financial officer have concluded that the registrant’s disclosure controls and procedures (as defined in Rule 30a-3(c) under the Investment Company Act of 1940, as amended (the “1940 Act”)) are effective as of a date within 90 days of the filing date of this report that includes the disclosure required by this paragraph, based on their evaluation of the disclosure controls and procedures required by Rule 30a-3(b) under the 1940 Act and 15d-15(b) under the Securities Exchange Act of 1934. |
| (b) | There were no changes in the registrant’s internal control over financial reporting (as defined in Rule 30a-3(d) under the 1940 Act) that occurred during the period covered by this report that have materially affected, or are likely to materially affect the registrant’s internal control over financial reporting. |
| ITEM 17. | DISCLOSURE OF SECURITIES LENDING ACTIVITIES FOR CLOSED-END MANAGEMENT INVESTMENT COMPANIES. |
Not applicable.
| ITEM 18. | RECOVERY OF ERRONEOUSLY AWARDED COMPENSATION. |
| (a) | Not applicable. |
| (b) | Not applicable. |
| ITEM 19. | EXHIBITS. |
(a) (1) Code of Ethics attached hereto.
Exhibit 99.CODE ETH
(a) (2) Certifications pursuant to section 302 of the Sarbanes-Oxley Act of 2002 attached hereto.
Exhibit 99.CERT
(b) Certifications pursuant to Section 906 of the Sarbanes-Oxley Act of 2002 attached hereto.
Exhibit 99.906CERT
SIGNATURES
Pursuant to the requirements of the Securities Exchange Act of 1934 and the Investment Company Act of 1940, the registrant has duly caused this Report to be signed on its behalf by the undersigned, there unto duly authorized.
Legg Mason Global Asset Management Trust
| By: | /s/ Jane Trust | |
| Jane Trust | ||
| Chief Executive Officer |
| Date: | December 23, 2024 |
Pursuant to the requirements of the Securities Exchange Act of 1934 and the Investment Company Act of 1940, this report has been signed below by the following persons on behalf of the registrant and in the capacities and on the dates indicated.
| By: | /s/ Jane Trust | |
| Jane Trust | ||
| Chief Executive Officer |
| Date: | December 23, 2024 |
| By: | /s/ Christopher Berarducci | |
| Christopher Berarducci | ||
| Principal Financial Officer |
| Date: | December 23, 2024 |