UNITED STATES
SECURITIES AND EXCHANGE COMMISSION
Washington, D.C. 20549
FORM N-CSR
CERTIFIED SHAREHOLDER REPORT OF REGISTERED
MANAGEMENT INVESTMENT COMPANIES
Investment Company Act file number 811-22338
Legg Mason Global Asset Management Trust
(Exact name of registrant as specified in charter)
620 Eighth Avenue, 49th Floor, New York, NY 10018
(Address of principal executive offices) (Zip code)
Robert I. Frenkel, Esq.
Legg Mason & Co., LLC
100 First Stamford Place
Stamford, CT 06902
(Name and address of agent for service)
Registrant’s telephone number, including area code: 1-877-721-1926
Date of fiscal year end: September 30
Date of reporting period: September 30, 2013
| ITEM 1. | REPORT TO STOCKHOLDERS. |
The Annual Report to Stockholders is filed herewith.

Annual Report  September 30, 2013
LEGG MASON BW
DIVERSIFIED
LARGE CAP
VALUE FUND
INVESTMENT PRODUCTS: NOT FDIC INSURED • NO BANK GUARANTEE • MAY LOSE VALUE
Fund objective
The Fund seeks long-term capital appreciation.
Letter from the president

Dear Shareholder,
We are pleased to provide the annual report of Legg Mason BW Diversified Large Cap Value Fund for the twelve-month reporting period ended September 30, 2013. Please read on for a detailed look at prevailing economic and market conditions during the Fund’s reporting period and to learn how those conditions have affected Fund performance.
I am pleased to introduce myself as the new President and Chief Executive Officer of the Fund, succeeding R. Jay Gerken, as he embarks upon his retirement. Jay has most recently served as Chairman of the Board and President of the Fund and other funds in the Legg Mason complex. On behalf of all our shareholders and the Fund’s Board of Trustees, I would like to thank Jay for his vision and guidance, and wish him all the best.
I am honored to have been appointed to my new role with the Fund. During my 23 year career in the financial industry, I have seen it evolve and expand. Despite these changes, keeping an unwavering focus on our shareholders and their needs remains paramount. This was a consistent focus of Jay’s, and I look forward to following his lead in the years to come.
As always, we remain committed to providing you with excellent service and a full spectrum of investment choices. We also remain committed to supplementing the support you receive from your financial advisor. One way we accomplish this is through our website, www.leggmason.com/individualinvestors. Here you can gain immediate access to market and investment information, including:
| Ÿ | | Fund prices and performance, |
| Ÿ | | Market insights and commentaries from our portfolio managers, and |
| Ÿ | | A host of educational resources. |
| | |
| II | | Legg Mason BW Diversified Large Cap Value Fund |
We look forward to helping you meet your financial goals.
Sincerely,

Kenneth D. Fuller
President and Chief Executive Officer
October 25, 2013
| | |
| Legg Mason BW Diversified Large Cap Value Fund | | III |
Investment commentary
Economic review
The U.S. economy continued to grow over the twelve months ended September 30, 2013 (the “reporting period”), but the pace was far from robust. Looking back, U.S. gross domestic product (“GDP”)i growth, as reported by the U.S. Department of Commerce, was an anemic 0.1% during the fourth quarter of 2012. This weakness was partially driven by moderating private inventory investment and federal government spending. Economic growth then improved, as first quarter 2013 GDP growth was 1.1%, partially driven by strengthening consumer spending. GDP growth in the second quarter further improved to 2.5%. This was partially due to increases in exports and non-residential fixed investments, along with a smaller decline in federal government spending versus the previous quarter. Due to the U.S. government’s sixteen-day partial shutdown, which began on October 1, 2013, after the reporting period ended, the U.S. Department of Commerce’s initial reading for third quarter 2013 GDP growth will not be released until November 7, 2013.
While there was some improvement in the U.S. job market, unemployment remained elevated throughout the reporting period. When the period began, unemployment, as reported by the U.S. Department of Labor, was 7.9%. The unemployment rate fluctuated between 7.8% and 7.9% over the next four months. Unemployment then fell to 7.7% in February 2013 and edged lower over much of the next seven months to reach 7.2% in September 2013, its lowest reading since November 2008. However, this was partially due to a decline in the workforce participation rate, which was 63.2% in September, the lowest level since 1978.
Meanwhile, the housing market continued to show signs of strength, as sales generally improved and home prices moved higher. According to the National Association of Realtors (“NAR”), existing-home sales dipped 1.9% on a seasonally adjusted basis in September 2013 versus the previous month, but were 10.7% higher than in September 2012. In addition, the NAR reported that the median existing-home price for all housing types was $199,200 in September 2013, up 11.7% from September 2012. This marked the tenth consecutive month that home prices experienced a double-digit increase compared to the same period a year earlier. The inventory of homes available for sale in September 2013 was 0.1% higher than the previous month at a 5.0 month supply at the current sales pace and was 1.8% higher than in September 2012.
The manufacturing sector expanded during the majority of the reporting period, although it experienced several soft patches. Based on the Institute for Supply Management’s Purchasing Managers’ Index (“PMI”)ii, after expanding the prior two months, the PMI fell to 49.5 in November 2012. This represented the PMI’s lowest reading since July 2009 (a reading below 50 indicates a contraction, whereas a reading above 50 indicates an expansion). Manufacturing then expanded over the next five months, before contracting again in May 2013, with a PMI of 49.0. However, this was a temporary setback, as the PMI rose over the next four months and was 56.2 in September, the best reading since April 2011.
The Federal Reserve Board (“Fed”)iii took a number of actions as it sought to meet its dual mandate of fostering maximum employment and price stability. As has been
| | |
| IV | | Legg Mason BW Diversified Large Cap Value Fund |
the case since December 2008, the Fed kept the federal funds rateiv at a historically low range between zero and 0.25%. At its meeting in December 2012, the Fed announced that it would continue purchasing $40 billion per month of agency mortgage-backed securities (“MBS”), as well as initially purchasing $45 billion per month of longer-term Treasuries. The Fed also said that it would keep the federal funds rate on hold “…as long as the unemployment rate remains above 6.5%, inflation between one and two years ahead is projected to be no more than a half percentage point above the Committee’s 2.0% longer-run goal, and longer-term inflation expectations continue to be well anchored.” At its meeting that ended on June 19, 2013, the Fed did not make any material changes to its official policy statement. However, in a press conference following the meeting, Fed Chairman Bernanke said “…the Committee currently anticipates that it would be appropriate to moderate the monthly pace of purchases later this year; and if the subsequent data remain broadly aligned with our current expectations for the economy, we would continue to reduce the pace of purchases in measured steps through the first half of next year, ending purchases around midyear.” In a surprise to many investors, at its meeting that ended on September 18, 2013, the Fed did not taper its asset purchase program and said that it “…decided to await more evidence that progress will be sustained before adjusting the pace of its purchases.” Fed Chairman Bernanke also brought up the potential for a partial government shutdown on October 1 and the debt ceiling debate as reasons for maintaining its current policy. At the Fed’s meeting that concluded on October 30, 2013, after the reporting period ended, the Fed maintained its asset purchase program and said that “Asset purchases are not on a preset course, and the Committee’s decisions about their pace will remain contingent on the Committee’s economic outlook as well as its assessment of the likely efficacy and costs of such purchases.”
As always, thank you for your confidence in our stewardship of your assets.
Sincerely,
Kenneth D. Fuller
President and Chief Executive Officer
October 31, 2013
All investments are subject to risk including the possible loss of principal. Past performance is no guarantee of future results.
| i | Gross domestic product (“GDP”) is the market value of all final goods and services produced within a country in a given period of time. |
| ii | The Institute for Supply Management’s PMI is based on a survey of purchasing executives who buy the raw materials for manufacturing at more than 350 companies. It offers an early reading on the health of the manufacturing sector. |
| iii | The Federal Reserve Board (“Fed”) is responsible for the formulation of policies designed to promote economic growth, full employment, stable prices and a sustainable pattern of international trade and payments. |
| iv | The federal funds rate is the rate charged by one depository institution on an overnight sale of immediately available funds (balances at the Federal Reserve) to another depository institution; the rate may vary from depository institution to depository institution and from day to day. |
| | |
| Legg Mason BW Diversified Large Cap Value Fund | | V |
Fund overview
Q. What is the Fund’s investment strategy?
A. The Fund seeks long-term capital appreciation. The Fund normally invests at least 80% of its net assets in equity securities of large-capitalization companies. The Fund invests primarily in equity securities that, in our opinion, are undervalued or out of favor. We invest in securities that meet our value criteria, based on both quantitative and fundamental analysis. The Fund expects to hold approximately 150-250 stocks under normal market conditions. The Fund may invest in foreign equity securities, either directly or through depositary receipts.
We firmly believe that combining the discipline and consistency of our quantitative process with the insights derived from our fundamental stock research offers the greatest potential to outperform the large-cap value benchmark. Our core value philosophy has remained unchanged since the inception of the Diversified Large Cap Value Equity strategy in 1999.
Our Diversified Large Cap Value Equity philosophy is based in part on our fundamental academic research. Our research studies confirm our experience-derived belief that concentrating on U.S. large-capitalization stocks with low valuation ratios produces excellent investment result potential. Our investment philosophy is based on our belief that stocks with the lowest prices relative to current earnings or book value will provide strong returns over longer periods of time. Avoiding stocks with poor recent relative performance helps prevent investing too early in any particular value stock. Focusing on companies that relatively have been able to reduce their equity shares helps identify the stocks with the financial strength to generate strong returns. We employ quantitative techniques to identify each of these attractive characteristics.
Regarding our fundamental research, we have determined that our exclusionary process, which seeks to eliminate poor performers, is an effective means to capitalize on the value-based opportunities. In this process, we use our fundamental research to exclude from our quantitatively select investment universe those stocks that we feel have the least ability to outperform. We periodically update our research to confirm and enhance our process and approach.
Q. What were the overall market conditions during the Fund’s reporting period?
A. Despite a tumultuous investment environment, U.S. equity markets were quite strong for the year ended September 30, 2013 with the large cap value market as defined by the Russell 1000 Value Indexi rising 22.30%. In the prior year, investor concerns focused primarily outside the U.S., particularly the European sovereign debt crisis and its potential impact on the world financial system and the global economy. In the most recent year, the European situation was considerably less volatile and investors instead had to contend with U.S. uncertainty, primarily of the political rather than economic variety. The 2012 election, the year-end budget crisis, the introduction of sequestration, and the ongoing government shutdown and debt ceiling debate each introduced the possibility of heightened market instability. In addition, Federal Reserve Board (“Fed”)ii policy has been a hot topic this summer as investors anticipation of the Fed’s reduction in its bond purchases
| | |
| Legg Mason BW Diversified Large Cap Value Fund 2013 Annual Report | | 1 |
Fund overview (cont’d)
pushed long-term rates higher. This rate increase paused in September when the Fed announced that it would continue its quantitative easing purchases through the fall. Through all these events, U.S. equity market volatility, as measured by the VIX Index remained lower than in the previous twelve month period and well below the highs of the 2008-2009 financial crisis. Apparently investors have anticipated that after all the tumult and bluster, the politicians would work out a deal with minimum real impact on the U.S. economy and that the Fed will navigate a success exit from quantitative easing.
On the economic front, this last year can be described as one of modest but steady growth. In the second quarter, the economy expanded at a 2.5% rate compared to 1.1% in the first quarter. Housing continued to rebound but momentum appears to be slowing as a result of this summer’s higher interest rates. Prices in the twelve months through July climbed 12.4% for the biggest yearly gain since February 2006. However, homebuilders reported an increase in cancellations and began work on fewer homes than expected in August. In an additional sign that the tightening of rates is affecting the housing rebound, pending home sales fell in August. The labor market continued its gradual but uneven progress. Fewer dismissals lowered jobless claims to 2007 levels but, employers also added jobs at a slower pace in the latest quarter. The unemployment rate fell to 7.3% but the participation rate has declined to levels not seen since 1978 as workers on the margin left the labor force.
Globally, markets benefited from a reduction in Middle East tensions as Syria agreed to a proposal for dismantling its chemical weapons. The European recovery and global economic indicators gained traction as Spain emerged from recession in the third quarter. Additionally, encouraging exports from China supported the resumption of global growth.
Q. How did we respond to these changing market conditions?
A. As always, we responded to this unsettled environment by the consistent, disciplined execution of our investment strategy. We are aware of the macro implications of events for specific markets and securities, but do not alter our core focus on value, quality, and favorable sentiment or rely on top-down adjustments in our investment process.
Performance review
For the twelve months ended September 30, 2013, Class A shares of Legg Mason BW Diversified Large Cap Value Fund, excluding sales charges, returned 18.62%. The Fund’s unmanaged benchmark, the Russell 1000 Value Index, returned 22.30% for the same period. The Lipper Large-Cap Value Funds Category Average1 returned 22.13% over the same time frame.
| 1 | Lipper, Inc., a wholly-owned subsidiary of Reuters, provides independent insight on global collective investments. Returns are based on the twelve-month period ended September 30, 2013, including the reinvestment of all distributions, including returns of capital, if any, calculated among the 471 funds in the Fund’s Lipper category, and excluding sales charges. |
| | |
| 2 | | Legg Mason BW Diversified Large Cap Value Fund 2013 Annual Report |
| | | | | | | | |
Performance Snapshot as of September 30, 2013
(unaudited) | |
| (excluding sales charges) | | 6 months | | | 12 months | |
Legg Mason BW Diversified Large Cap
Value Fund: | |
Class A | | | 7.29 | % | | | 18.62 | % |
Class A2 | | | 7.18 | % | | | N/A | |
Class C | | | 6.89 | % | | | 17.77 | % |
Class I | | | 7.46 | % | | | 18.99 | % |
Class IS | | | 7.46 | % | | | 18.98 | % |
| Russell 1000 Value Index | | | 7.27 | % | | | 22.30 | % |
| Lipper Large-Cap Value Funds Category Average1 | | | 8.46 | % | | | 22.13 | % |
The performance shown represents past performance. Past performance is no guarantee of future results and current performance may be higher or lower than the performance shown above. Principal value and investment returns will fluctuate and investors’ shares, when redeemed, may be worth more or less than their original cost. To obtain performance data current to the most recent month-end, please visit our website at www.leggmason.com/individualinvestors.
All share class returns assume the reinvestment of all distributions at net asset value and the deduction of all Fund expenses. Returns have not been adjusted to include sales charges that may apply or the deduction of taxes that a shareholder would pay on Fund distributions. If sales charges were reflected, the performance quoted would be lower. Performance figures for periods shorter than one year represent cumulative figures and are not annualized.
Fund performance figures reflect fee waivers and/or expense reimbursements, without which the performance would have been lower.
Performance of Class A2 shares for the twelve-month period is not shown because this share class commenced operations on October 31, 2012.
|
| Total Annual Operating Expenses (unaudited) |
As of the Fund’s current prospectus dated February 1, 2013, the gross total annual operating expense ratios for Class A, Class A2, Class C, Class I and Class IS shares were 1.38%, 1.58%, 2.11%, 0.94% and 0.84%, respectively.
Actual expenses may be higher. For example, expenses may be higher than those shown if average net assets decrease. Net assets are more likely to decrease and Fund expense ratios are more likely to increase when markets are volatile.
As a result of expense limitation arrangements, the ratio of expenses, other than interest, brokerage commissions, dividend expense on short sales, taxes, extraordinary expenses and acquired fund fees and expenses, to average net assets is not expected to exceed 1.30% for Class A shares, 1.50% for Class A2 shares, 2.05% for Class C shares, 0.95% for Class I shares and 0.85% for Class IS shares. In addition, the total annual operating expenses of Class IS shares will not exceed those of Class I shares. These expense limitation arrangements cannot be terminated prior to December 31, 2014 without the Board of Trustees’ consent. The manager currently intends to voluntarily waive fees and/or reimburse operating expenses (other than interest, brokerage commissions, dividend expense on short sales, taxes, extraordinary expenses and acquired fund fees and expenses) so that the ratio of expenses, to average net assets is not expected to
| 1 | Lipper, Inc., a wholly-owned subsidiary of Reuters, provides independent insight on global collective investments. Returns are based on the period ended September 30, 2013, including the reinvestment of all distributions, including returns of capital, if any, calculated among the 488 funds for the six-month period and among the 471 funds for the twelve-month period in the Fund’s Lipper category, and excluding sales charges. |
| | |
| Legg Mason BW Diversified Large Cap Value Fund 2013 Annual Report | | 3 |
Fund overview (cont’d)
exceed 1.10% for Class A shares, 1.30% for Class A2 shares, 1.85% for Class C shares and 0.85% for Class I shares. These expense limitation arrangements are expected to continue until December 31, 2014 but may be terminated at any time by the manager.
The manager is permitted to recapture amounts waived or reimbursed to a class within three years after the fiscal year in which the manager earned the fee or incurred the expense if the class’ total annual operating expenses have fallen to a level below the expense limitation (“expense cap”) in effect at the time the fees were earned or the expenses incurred. In no case will the manager recapture any amount that would result, on any particular business day of the Fund, in the class’ total annual operating expenses exceeding the expense cap or any other lower limit then in effect.
Q. What were the leading contributors to performance?
A. The strongest contributor to our performance for the period came from the Fund’s below index weight in interest rate sensitive stocks, such as Utilities1 and Real Estate Investment Trusts. With the summer’s rise in longer term rates, these stocks significantly lagged the broader market. For instance, the Utilities sector rose only 8.6% over the prior twelve months. The Fund’s aerospace and defense stocks performed relatively well as the companies weathered the government’s sequestration cuts better than expected. Within the Materials sector, the Fund benefited from its low weighting in precious metals and mining as gold prices retreated through most of the reporting period.
Q. What were the leading detractors from performance?
A. Technology was the largest detractor for the trailing year as the Fund’s holdings in the sector, particularly in software and services lagged the Fund’s benchmark. Our significant holdings in IBM, Microsoft, and Oracle all performed well below the tech sector and the benchmark. Although each of these companies has a large, profitable legacy business, they each struggled to gain meaningful participation in the rapidly growing market for mobile devices. Within Consumer Staples, Wal-Mart’s difficulties sustaining its historical earnings growth rate led the stock to underperform as well. Lower quality stocks, which we identify as stocks with a low return on equity, generally performed better than stocks with higher return on equity for this period. Our investment process does tend to favor the higher quality companies, such as our larger tech holdings and Wal-Mart, which was a negative for the portfolio. Smaller companies also tended to perform better for the year and our portfolio market cap was moderately above the Fund’s benchmark.
Q. Were there any significant changes to the Fund during the reporting period?
A. We made no significant changes to the Fund’s investment process over the past year, and we remain focused on maintaining a portfolio of quality large cap value stocks with favorable momentum characteristics. As always, changes in the Fund’s positions and sector weights are the result of our bottom up stock selection process, rather than any macro themes. Our Financials sector weight increased again this year with
| 1 | Utilities consists of the following industries: Electric, Natural Gas and Other Utility. |
| | |
| 4 | | Legg Mason BW Diversified Large Cap Value Fund 2013 Annual Report |
purchases in both regional and major banks as their long term recovery from the financial crisis continues. While still below the benchmark’s financial weight, primarily due to our exclusion of real estate investment trusts, this sector is no longer the most underweight in the Fund’s portfolio. Sales in the Energy sector as well as lagging returns left that group the most underweight sector in the portfolio. During the period, we added to drug stores and tobacco within Consumer Staples and auto components and retailers within Consumer Discretionary. The biggest sector decline was in Technology where our sales of IBM, Intel and others based on poor performance were only partially offset by purchases in hardware and data storage. In Industrials, our aerospace and defense as well as farm and construction and equipment sales were mostly the result of strong price appreciation pushing the stocks above our valuation sell targets. These overall changes generally moved the Fund to be somewhat more cyclical and market sensitive position than in recent years.
Thank you for your investment in Legg Mason BW Diversified Large Cap Value Fund. As always, we appreciate that you have chosen us to manage your assets and we remain focused on achieving the Fund’s investment goals.
Sincerely,

Henry F. Otto
Portfolio Manager
Brandywine Global Investment Management, LLC

Steven M. Tonkovich
Portfolio Manager
Brandywine Global Investment Management, LLC

Joseph J. Kirby
Portfolio Manager
Brandywine Global Investment Management, LLC
October 14, 2013
RISKS: Equity securities are subject to market fluctuations. Foreign securities are subject to certain risks of overseas investing including currency fluctuations and changes in political and economic conditions, which could result in significant market fluctuations. These risks are magnified in emerging markets. The Fund may use derivatives, such as options and futures, which can be illiquid, may disproportionately increase losses, and have a potentially large impact on Fund performance. Please see the Fund’s prospectus for a more complete discussion of these and other risks, and the Fund’s investment strategies.
Portfolio holdings and breakdowns are as of September 30, 2013 and are subject to change and may not be representative of the portfolio managers’ current or future investments. The Fund’s top ten holdings (as a percentage of net assets) as of this date were: General Electric Co. (3.7%), Chevron Corp. (3.3%), Wells Fargo & Co. (3.1%), JPMorgan Chase & Co. (3.0%), Wal-Mart Stores Inc. (3.0%), Pfizer Inc. (2.7%), Bank of America Corp. (2.1%), Exxon Mobil Corp. (2.1%), Merck & Co. Inc. (2.0%) and iShares Trust — iShares Russell 1000 Value Index Fund (1.9%).
| | |
| Legg Mason BW Diversified Large Cap Value Fund 2013 Annual Report | | 5 |
Fund overview (cont’d)
Please refer to pages 13 through 22 for a list and percentage breakdown of the Fund’s holdings.
The mention of sector breakdowns is for informational purposes only and should not be construed as a recommendation to purchase or sell any securities. The information provided regarding such sectors is not a sufficient basis upon which to make an investment decision. Investors seeking financial advice regarding the appropriateness of investing in any securities or investment strategies discussed should consult their financial professional. The Fund’s top five sector holdings (as a percentage of net assets) as of September 30, 2013 were: Financials (25.0%), Health Care (13.1%), Industrials (12.3%), Energy (11.0%) and Consumer Discretionary (8.4%). The Fund’s portfolio composition is subject to change at any time.
All investments are subject to risk including the possible loss of principal. Past performance is no guarantee of future results. All index performance reflects no deduction for fees, expenses or taxes. Please note that an investor cannot invest directly in an index.
The information provided is not intended to be a forecast of future events, a guarantee of future results or investment advice. Views expressed may differ from those of the firm as a whole.
| i | The Russell 1000 Value Index measures the performance of those Russell 1000 Index companies with lower price-to-book ratios and lower forecasted growth values. (A price-to-book ratio is the price of a stock compared to the difference between a company’s assets and liabilities.) |
| ii | The Federal Reserve Board (“Fed”) is responsible for the formulation of policies designed to promote economic growth, full employment, stable prices and a sustainable pattern of international trade and payments. |
| | |
| 6 | | Legg Mason BW Diversified Large Cap Value Fund 2013 Annual Report |
Fund at a glance† (unaudited)
Investment breakdown (%) as a percent of total investments
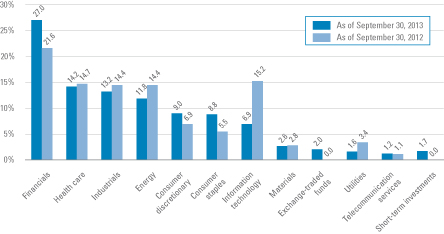
| † | The bar graph above represents the composition of the Fund’s investments as of September 30, 2013 and September 30, 2012. The Fund is actively managed. As a result, the composition of the Fund’s investments is subject to change at any time. |
| | |
| Legg Mason BW Diversified Large Cap Value Fund 2013 Annual Report | | 7 |
Fund expenses (unaudited)
Example
As a shareholder of the Fund, you may incur two types of costs: (1) transaction costs, including front-end and back-end sales charges (loads) on purchase payments; and (2) ongoing costs, including management fees; service and/or distribution (12b-1) fees, and other Fund expenses. This example is intended to help you understand your ongoing costs (in dollars) of investing in the Fund and to compare these costs with the ongoing costs of investing in other mutual funds.
This example is based on an investment of $1,000 invested on April 1, 2013 and held for the six months ended September 30, 2013.
Actual expenses
The table below titled “Based on Actual Total Return” provides information about actual account values and actual expenses. You may use the information provided in this table, together with the amount you invested, to estimate the expenses that you paid over the period. To estimate the expenses you paid on your account, divide your ending account value by $1,000 (for example, an $8,600 ending account value divided by $1,000 = 8.6), then multiply the result by the number under the heading entitled “Expenses Paid During the Period”.
Hypothetical example for comparison purposes
The table below titled “Based on Hypothetical Total Return” provides information about hypothetical account values and hypothetical expenses based on the actual expense ratio and an assumed rate of return of 5.00% per year before expenses, which is not the Fund’s actual return. The hypothetical account values and expenses may not be used to estimate the actual ending account balance or expenses you paid for the period. You may use the information provided in this table to compare the ongoing costs of investing in the Fund and other funds. To do so, compare the 5.00% hypothetical example relating to the Fund with the 5.00% hypothetical examples that appear in the shareholder reports of the other funds.
Please note that the expenses shown in the table below are meant to highlight your ongoing costs only and do not reflect any transactional costs, such as front-end or back-end sales charges (loads). Therefore, the table is useful in comparing ongoing costs only, and will not help you determine the relative total costs of owning different funds. In addition, if these transaction costs were included, your costs would have been higher.
| | | | | | | | | | | | | | | | | | | | | | | | | | | | | | | | | | | | | | | | | | | | |
| Based on actual total return1 | | | | | Based on hypothetical total return1 | |
| | | Actual
Total Return
Without
Sales
Charge2 | | | Beginning
Account
Value | | | Ending
Account
Value | | | Annualized
Expense
Ratio | | | Expenses
Paid
During
the
Period3 | | | | | | | Hypothetical
Annualized
Total Return | | | Beginning
Account
Value | | | Ending
Account
Value | | | Annualized
Expense
Ratio | | | Expenses
Paid
During
the
Period3 | |
| Class A | | | 7.29 | % | | $ | 1,000.00 | | | $ | 1,072.90 | | | | 1.10 | % | | $ | 5.72 | | | | | Class A | | | 5.00 | % | | $ | 1,000.00 | | | $ | 1,019.55 | | | | 1.10 | % | | $ | 5.57 | |
| Class A2 | | | 7.18 | | | | 1,000.00 | | | | 1,071.80 | | | | 1.29 | | | | 6.70 | | | | | Class A2 | | | 5.00 | | | | 1,000.00 | | | | 1,018.60 | | | | 1.29 | | | | 6.53 | |
| Class C | | | 6.89 | | | | 1,000.00 | | | | 1,068.90 | | | | 1.85 | | | | 9.59 | | | | | Class C | | | 5.00 | | | | 1,000.00 | | | | 1,015.79 | | | | 1.85 | | | | 9.35 | |
| Class I | | | 7.46 | | | | 1,000.00 | | | | 1,074.60 | | | | 0.85 | | | | 4.42 | | | | | Class I | | | 5.00 | | | | 1,000.00 | | | | 1,020.81 | | | | 0.85 | | | | 4.31 | |
| Class IS | | | 7.46 | | | | 1,000.00 | | | | 1,074.60 | | | | 0.85 | | | | 4.42 | | | | | Class IS | | | 5.00 | | | | 1,000.00 | | | | 1,020.81 | | | | 0.85 | | | | 4.31 | |
| | |
| 8 | | Legg Mason BW Diversified Large Cap Value Fund 2013 Annual Report |
| 1 | For the six months ended September 30, 2013. |
| 2 | Assumes the reinvestment of all distributions, including returns of capital, if any, at net asset value and does not reflect the deduction of the applicable sales charge with respect to Class A shares and Class A2 shares or the applicable contingent deferred sales charge (“CDSC”) with Class C shares. Total return is not annualized, as it may not be representative of the total return for the year. Performance figures may reflect compensating balance arrangements, fee waivers and/or expense reimbursements. In the absence of compensating balance arrangements, fee waivers and/or expense reimbursements, the total return would have been lower. Past performance is no guarantee of future results. |
| 3 | Expenses (net of compensating balance arrangements, fee waivers and/or expense reimbursements) are equal to each class’ respective annualized expense ratio multiplied by the average account value over the period, multiplied by the number of days in the most recent fiscal half-year (183), then divided by 365. |
| | |
| Legg Mason BW Diversified Large Cap Value Fund 2013 Annual Report | | 9 |
Fund performance (unaudited)
| | | | | | | | | | | | | | | | | | | | |
| Average annual total returns | |
| Without sales charges1 | | Class A | | | Class A2† | | | Class C | | | Class I | | | Class IS | |
| Twelve Months Ended 9/30/13 | | | 18.62 | % | | | N/A | | | | 17.77 | % | | | 18.99 | % | | | 18.98 | % |
| Inception* through 9/30/13 | | | 17.30 | | | | 19.77 | % | | | 16.43 | | | | 17.68 | | | | 17.75 | |
| | | | | |
| With sales charges2 | | Class A | | | Class A2† | | | Class C | | | Class I | | | Class IS | |
| Twelve Months Ended 9/30/13 | | | 11.82 | % | | | N/A | | | | 16.77 | % | | | 18.99 | % | | | 18.98 | % |
| Inception* through 9/30/13 | | | 15.06 | | | | 12.91 | % | | | 16.43 | | | | 17.68 | | | | 17.75 | |
| | | | |
| Cumulative total returns | | | |
| Without sales charges1 | | | |
| Class A (Inception date of 9/7/10 through 9/30/13) | | | 63.08 | % |
| Class A2 (Inception date of 10/31/12 through 09/30/13) | | | 19.77 | |
| Class C (Inception date of 9/7/10 through 9/30/13) | | | 59.41 | |
| Class I (Inception date of 9/7/10 through 9/30/13) | | | 64.71 | |
| Class IS (Inception date of 9/7/10 through 9/30/13) | | | 65.02 | |
All figures represent past performance and are not a guarantee of future results. Investment return and principal value of an investment will fluctuate so that an investor’s shares, when redeemed, may be worth more or less than their original cost. The returns shown do not reflect the deduction of taxes that a shareholder would pay on Fund distributions or the redemption of Fund shares. Performance figures may reflect compensating balance arrangements, fee waivers and/or expense reimbursements. In the absence of compensating balance arrangements, fee waivers and/or expense reimbursements, the total return would have been lower.
| 1 | Assumes the reinvestment of all distributions, including returns of capital, if any, at net asset value and does not reflect the deduction of the applicable sales charge with respect to Class A shares and Class A2 shares or the applicable contingent deferred sales charge (“CDSC”) with respect to Class C shares. |
| 2 | Assumes the reinvestment of all distributions, including returns of capital, if any, at net asset value. In addition, Class A shares and Class A2 shares reflect the deduction of the maximum initial sales charge of 5.75%. Class C shares reflect the deduction of a 1.00% CDSC, which applies if shares are redeemed within one year from purchase payment. |
| * | Inception dates for Class A, A2, C, I and IS shares are September 7, 2010, October 31, 2012, September 7, 2010, September 7, 2010. and September 7, 2010, respectively. |
| | |
| 10 | | Legg Mason BW Diversified Large Cap Value Fund 2013 Annual Report |
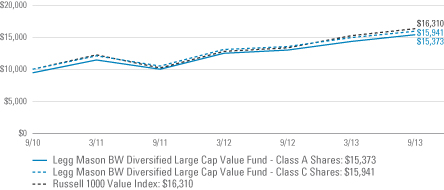
Historical performance
Value of $10,000 invested in
Class A and C Shares of Legg Mason BW Diversified Large Cap Value Fund vs. Russell 1000 Value Index† — September 7, 2010 - September 2013
Value of $1,000,000 invested in
Class I and IS Shares of Legg Mason BW Diversified Large Cap Value Fund vs. Russell 1000 Value Index† — September 7, 2010 - September 2013
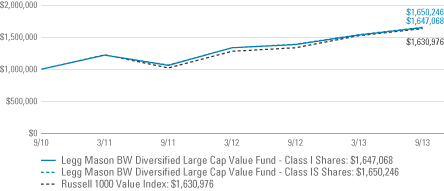
All figures represent past performance and are not a guarantee of future results. Investment return and principal value of an investment will fluctuate so that an investor’s shares, when redeemed, may be worth more or less than their original cost. The returns shown do not reflect the deduction of taxes that a shareholder would pay on Fund distributions or the redemption of Fund shares. Performance figures may reflect compensating balance arrangements, fee waivers and/or expense reimbursements. In the absence of compensating balance arrangements, fee waivers and/or expense reimbursements, the total return would have been lower.
| | |
| Legg Mason BW Diversified Large Cap Value Fund 2013 Annual Report | | 11 |
Fund performance (unaudited) (cont’d)
| † | Hypothetical illustration of $10,000 invested in Class A and C shares and $1,000,000 invested in Class I and IS shares of Legg Mason BW Diversified Large Cap Value Fund on September 7, 2010 (inception date), assuming the deduction of the maximum sales charge of 5.75% at the time of investment for Class A shares and the reinvestment of all distributions, including returns of capital, if any, at net asset value through September 30, 2013. The hypothetical illustration also assumes a $10,000 or $1,000,000 investment, as applicable, in the Russell 1000 Value Index. The Russell 1000 Value Index measures the performance of those Russell 1000 Index companies with lower price-to-book ratios and lower forecasted growth values. The Index is unmanaged and is not subject to the same management and trading expenses as a mutual fund. Please note that an investor cannot invest directly in an index. The performance of the Fund’s other class may be greater or less than the Class A, C, I and IS shares’ performance indicated on these charts, depending on whether greater or lower sales charges and fees were incurred by shareholders investing in the other class. |
| | |
| 12 | | Legg Mason BW Diversified Large Cap Value Fund 2013 Annual Report |
Schedule of investments
September 30, 2013
Legg Mason BW Diversified Large Cap Value Fund
| | | | | | | | | | | | |
| Security | | | | | | Shares | | | Value | |
| Common Stocks — 91.3% | | | | | | | | | | | | |
| Consumer Discretionary — 8.4% | | | | | | | | | | | | |
Auto Components — 0.9% | | | | | | | | | | | | |
Delphi Automotive PLC | | | | | | | 24,400 | | | $ | 1,425,448 | |
Goodyear Tire & Rubber Co. | | | | | | | 20,800 | | | | 466,960 | * |
Johnson Controls Inc. | | | | | | | 64,700 | | | | 2,685,050 | |
Lear Corp. | | | | | | | 7,800 | | | | 558,246 | |
TRW Automotive Holdings Corp. | | | | | | | 11,100 | | | | 791,541 | * |
Total Auto Components | | | | | | | | | | | 5,927,245 | |
Automobiles — 0.7% | | | | | | | | | | | | |
General Motors Co. | | | | | | | 130,800 | | | | 4,704,876 | * |
Hotels, Restaurants & Leisure — 0.2% | | | | | | | | | | | | |
Hyatt Hotels Corp., Class A Shares | | | | | | | 3,300 | | | | 141,768 | * |
International Game Technology | | | | | | | 24,700 | | | | 467,571 | |
Royal Caribbean Cruises Ltd. | | | | | | | 15,900 | | | | 608,652 | |
Wyndham Worldwide Corp. | | | | | | | 1,400 | | | | 85,358 | |
Total Hotels, Restaurants & Leisure | | | | | | | | | | | 1,303,349 | |
Household Durables — 0.2% | | | | | | | | | | | | |
Newell Rubbermaid Inc. | | | | | | | 27,300 | | | | 750,750 | |
Tupperware Brands Corp. | | | | | | | 4,900 | | | | 423,213 | |
Total Household Durables | | | | | | | | | | | 1,173,963 | |
Leisure Equipment & Products — 0.2% | | | | | | | | | | | | |
Hasbro Inc. | | | | | | | 12,300 | | | | 579,822 | |
Mattel Inc. | | | | | | | 26,700 | | | | 1,117,662 | |
Total Leisure Equipment & Products | | | | | | | | | | | 1,697,484 | |
Media — 3.5% | | | | | | | | | | | | |
DIRECTV | | | | | | | 51,900 | | | | 3,101,025 | * |
Gannett Co. Inc. | | | | | | | 21,600 | | | | 578,664 | |
Omnicom Group Inc. | | | | | | | 21,100 | | | | 1,338,584 | |
Time Warner Cable Inc. | | | | | | | 22,600 | | | | 2,522,160 | |
Time Warner Inc. | | | | | | | 133,900 | | | | 8,811,959 | |
Viacom Inc., Class B Shares | | | | | | | 85,700 | | | | 7,162,806 | |
Total Media | | | | | | | | | | | 23,515,198 | |
Multiline Retail — 1.3% | | | | | | | | | | | | |
Kohl’s Corp. | | | | | | | 20,500 | | | | 1,060,875 | |
Macy’s Inc. | | | | | | | 75,100 | | | | 3,249,577 | |
Nordstrom Inc. | | | | | | | 16,600 | | | | 932,920 | |
Target Corp. | | | | | | | 54,300 | | | | 3,474,114 | |
Total Multiline Retail | | | | | | | | | | | 8,717,486 | |
See Notes to Financial Statements.
| | |
| Legg Mason BW Diversified Large Cap Value Fund 2013 Annual Report | | 13 |
Schedule of investments (cont’d)
September 30, 2013
Legg Mason BW Diversified Large Cap Value Fund
| | | | | | | | | | | | |
| Security | | | | | | Shares | | | Value | |
Specialty Retail — 1.4% | | | | | | | | | | | | |
Advance Auto Parts Inc. | | | | | | | 6,800 | | | $ | 562,224 | |
AutoNation Inc. | | | | | | | 8,500 | | | | 443,445 | * |
AutoZone Inc. | | | | | | | 3,200 | | | | 1,352,736 | * |
Bed Bath & Beyond Inc. | | | | | | | 20,600 | | | | 1,593,616 | * |
Best Buy Co. Inc. | | | | | | | 28,800 | | | | 1,080,000 | |
GameStop Corp., Class A Shares | | | | | | | 9,800 | | | | 486,570 | |
Gap Inc. | | | | | | | 44,200 | | | | 1,780,376 | |
Penske Automotive Group Inc. | | | | | | | 8,600 | | | | 367,478 | |
Signet Jewelers Ltd. | | | | | | | 7,600 | | | | 544,540 | |
Staples Inc. | | | | | | | 62,500 | | | | 915,625 | |
Total Specialty Retail | | | | | | | | | | | 9,126,610 | |
Total Consumer Discretionary | | | | | | | | | | | 56,166,211 | |
| Consumer Staples — 8.2% | | | | | | | | | | | | |
Beverages — 0.2% | | | | | | | | | | | | |
Coca-Cola Enterprises Inc. | | | | | | | 25,300 | | | | 1,017,313 | |
Molson Coors Brewing Co., Class B Shares | | | | | | | 12,700 | | | | 636,651 | |
Total Beverages | | | | | | | | | | | 1,653,964 | |
Food & Staples Retailing — 4.6% | | | | | | | | | | | | |
CVS Caremark Corp. | | | | | | | 116,100 | | | | 6,588,675 | |
Kroger Co. | | | | | | | 49,200 | | | | 1,984,728 | |
Safeway Inc. | | | | | | | 18,800 | | | | 601,412 | |
Sysco Corp. | | | | | | | 47,200 | | | | 1,502,376 | |
Wal-Mart Stores Inc. | | | | | | | 268,100 | | | | 19,828,676 | |
Total Food & Staples Retailing | | | | | | | | | | | 30,505,867 | |
Food Products — 1.4% | | | | | | | | | | | | |
Archer-Daniels-Midland Co. | | | | | | | 62,300 | | | | 2,295,132 | |
Bunge Ltd. | | | | | | | 11,700 | | | | 888,147 | |
Campbell Soup Co. | | | | | | | 29,700 | | | | 1,209,087 | |
General Mills Inc. | | | | | | | 60,000 | | | | 2,875,200 | |
J.M. Smucker Co. | | | | | | | 10,800 | | | | 1,134,432 | |
Tyson Foods Inc., Class A Shares | | | | | | | 26,700 | | | | 755,076 | |
Total Food Products | | | | | | | | | | | 9,157,074 | |
Household Products — 0.6% | | | | | | | | | | | | |
Energizer Holdings Inc. | | | | | | | 5,200 | | | | 473,980 | |
Kimberly-Clark Corp. | | | | | | | 36,200 | | | | 3,410,764 | |
Total Household Products | | | | | | | | | | | 3,884,744 | |
Tobacco — 1.4% | | | | | | | | | | | | |
Altria Group Inc. | | | | | | | 162,300 | | | | 5,575,005 | |
Lorillard Inc. | | | | | | | 35,300 | | | | 1,580,734 | |
See Notes to Financial Statements.
| | |
| 14 | | Legg Mason BW Diversified Large Cap Value Fund 2013 Annual Report |
Legg Mason BW Diversified Large Cap Value Fund
| | | | | | | | | | | | |
| Security | | | | | | Shares | | | Value | |
Tobacco — continued | | | | | | | | | | | | |
Reynolds American Inc. | | | | | | | 51,400 | | | $ | 2,507,292 | |
Total Tobacco | | | | | | | | | | | 9,663,031 | |
Total Consumer Staples | | | | | | | | | | | 54,864,680 | |
| Energy — 11.0% | | | | | | | | | | | | |
Energy Equipment & Services — 0.7% | | | | | | | | | | | | |
Atwood Oceanics Inc. | | | | | | | 5,200 | | | | 286,208 | * |
Helmerich & Payne Inc. | | | | | | | 9,100 | | | | 627,445 | |
National-Oilwell Varco Inc. | | | | | | | 40,500 | | | | 3,163,455 | |
Patterson-UTI Energy Inc. | | | | | | | 10,300 | | | | 220,214 | |
Rowan Cos. PLC, Class A Shares | | | | | | | 11,800 | | | | 433,296 | * |
Total Energy Equipment & Services | | | | | | | | | | | 4,730,618 | |
Oil, Gas & Consumable Fuels — 10.3% | | | | | | | | | | | | |
Chevron Corp. | | | | | | | 183,300 | | | | 22,270,950 | |
ConocoPhillips | | | | | | | 144,200 | | | | 10,023,342 | |
Denbury Resources Inc. | | | | | | | 30,800 | | | | 567,028 | * |
Devon Energy Corp. | | | | | | | 38,300 | | | | 2,212,208 | |
Energen Corp. | | | | | | | 800 | | | | 61,112 | |
Exxon Mobil Corp. | | | | | | | 161,800 | | | | 13,921,272 | |
Hess Corp. | | | | | | | 32,500 | | | | 2,513,550 | |
Marathon Oil Corp. | | | | | | | 60,000 | | | | 2,092,800 | |
Marathon Petroleum Corp. | | | | | | | 27,500 | | | | 1,768,800 | |
Murphy Oil Corp. | | | | | | | 16,200 | | | | 977,184 | |
Occidental Petroleum Corp. | | | | | | | 76,200 | | | | 7,127,748 | |
Phillips 66 | | | | | | | 57,800 | | | | 3,341,996 | |
Tesoro Corp. | | | | | | | 11,600 | | | | 510,168 | |
Valero Energy Corp. | | | | | | | 46,200 | | | | 1,577,730 | |
Total Oil, Gas & Consumable Fuels | | | | | | | | | | | 68,965,888 | |
Total Energy | | | | | | | | | | | 73,696,506 | |
| Exchange-Traded Funds — 1.9% | | | | | | | | | | | | |
iShares Trust - iShares Russell 1000 Value Index Fund | | | | | | | 144,200 | | | | 12,430,040 | |
| Financials — 25.0% | | | | | | | | | | | | |
Capital Markets — 4.4% | | | | | | | | | | | | |
Ameriprise Financial Inc. | | | | | | | 18,700 | | | | 1,703,196 | |
Bank of New York Mellon Corp. | | | | | | | 108,800 | | | | 3,284,672 | |
BlackRock Inc. | | | | | | | 15,900 | | | | 4,302,858 | |
Franklin Resources Inc. | | | | | | | 60,100 | | | | 3,038,055 | |
Goldman Sachs Group Inc. | | | | | | | 42,500 | | | | 6,723,925 | |
Invesco Ltd. | | | | | | | 41,900 | | | | 1,336,610 | |
See Notes to Financial Statements.
| | |
| Legg Mason BW Diversified Large Cap Value Fund 2013 Annual Report | | 15 |
Schedule of investments (cont’d)
September 30, 2013
Legg Mason BW Diversified Large Cap Value Fund
| | | | | | | | | | | | |
| Security | | | | | | Shares | | | Value | |
Capital Markets — continued | | | | | | | | | | | | |
Morgan Stanley | | | | | | | 185,200 | | | $ | 4,991,140 | |
Northern Trust Corp. | | | | | | | 19,800 | | | | 1,076,922 | |
State Street Corp. | | | | | | | 42,200 | | | | 2,774,650 | |
Total Capital Markets | | | | | | | | | | | 29,232,028 | |
Commercial Banks — 6.2% | | | | | | | | | | | | |
BB&T Corp. | | | | | | | 58,000 | | | | 1,957,500 | |
CIT Group Inc. | | | | | | | 19,000 | | | | 926,630 | * |
Comerica Inc. | | | | | | | 17,500 | | | | 687,925 | |
Commerce Bancshares Inc. | | | | | | | 8,600 | | | | 376,766 | |
Cullen/Frost Bankers Inc. | | | | | | | 4,900 | | | | 345,695 | |
East-West Bancorp Inc. | | | | | | | 13,000 | | | | 415,350 | |
Fifth Third Bancorp | | | | | | | 80,500 | | | | 1,452,220 | |
Huntington Bancshares Inc. | | | | | | | 78,500 | | | | 648,410 | |
KeyCorp | | | | | | | 86,100 | | | | 981,540 | |
PNC Financial Services Group Inc. | | | | | | | 50,200 | | | | 3,636,990 | |
Regions Financial Corp. | | | | | | | 131,900 | | | | 1,221,394 | |
SunTrust Banks Inc. | | | | | | | 50,800 | | | | 1,646,936 | |
U.S. Bancorp | | | | | | | 156,700 | | | | 5,732,086 | |
Wells Fargo & Co. | | | | | | | 502,100 | | | | 20,746,772 | |
Zions Bancorporation | | | | | | | 17,400 | | | | 477,108 | |
Total Commercial Banks | | | | | | | | | | | 41,253,322 | |
Consumer Finance — 2.1% | | | | | | | | | | | | |
American Express Co. | | | | | | | 102,000 | | | | 7,703,040 | |
Capital One Financial Corp. | | | | | | | 48,200 | | | | 3,313,268 | |
Discover Financial Services | | | | | | | 45,800 | | | | 2,314,732 | |
SLM Corp. | | | | | | | 37,000 | | | | 921,300 | |
Total Consumer Finance | | | | | | | | | | | 14,252,340 | |
Diversified Financial Services — 5.3% | | | | | | | | | | | | |
Bank of America Corp. | | | | | | | 1,015,800 | | | | 14,018,040 | |
JPMorgan Chase & Co. | | | | | | | 384,700 | | | | 19,885,143 | |
Nasdaq OMX Group Inc. | | | | | | | 15,800 | | | | 507,022 | |
Principal Financial Group Inc. | | | | | | | 27,900 | | | | 1,194,678 | |
Total Diversified Financial Services | | | | | | | | | | | 35,604,883 | |
Insurance — 6.8% | | | | | | | | | | | | |
ACE Ltd. | | | | | | | 32,200 | | | | 3,012,632 | |
AFLAC Inc. | | | | | | | 44,000 | | | | 2,727,560 | |
Alleghany Corp. | | | | | | | 1,600 | | | | 655,440 | * |
Allstate Corp. | | | | | | | 43,800 | | | | 2,214,090 | |
See Notes to Financial Statements.
| | |
| 16 | | Legg Mason BW Diversified Large Cap Value Fund 2013 Annual Report |
Legg Mason BW Diversified Large Cap Value Fund
| | | | | | | | | | | | |
| Security | | | | | | Shares | | | Value | |
Insurance — continued | | | | | | | | | | | | |
American Financial Group Inc. | | | | | | | 20,600 | | | $ | 1,113,636 | |
American International Group Inc. | | | | | | | 139,600 | | | | 6,788,748 | |
Arch Capital Group Ltd. | | | | | | | 12,600 | | | | 682,038 | * |
Assurant Inc. | | | | | | | 7,000 | | | | 378,700 | |
Axis Capital Holdings Ltd. | | | | | | | 10,800 | | | | 467,748 | |
Chubb Corp. | | | | | | | 59,300 | | | | 5,293,118 | |
Cincinnati Financial Corp. | | | | | | | 13,000 | | | | 613,080 | |
Everest Re Group Ltd. | | | | | | | 4,600 | | | | 668,886 | |
HCC Insurance Holdings Inc. | | | | | | | 12,800 | | | | 560,896 | |
Lincoln National Corp. | | | | | | | 25,100 | | | | 1,053,949 | |
Loews Corp. | | | | | | | 84,800 | | | | 3,963,552 | |
Old Republic International Corp. | | | | | | | 24,600 | | | | 378,840 | |
PartnerRe Ltd. | | | | | | | 5,100 | | | | 466,854 | |
Prudential Financial Inc. | | | | | | | 43,800 | | | | 3,415,524 | |
Reinsurance Group of America Inc. | | | | | | | 7,800 | | | | 522,522 | |
RenaissanceRe Holdings Ltd. | | | | | | | 10,900 | | | | 986,777 | |
Torchmark Corp. | | | | | | | 22,200 | | | | 1,606,170 | |
Travelers Cos. Inc. | | | | | | | 71,100 | | | | 6,027,147 | |
Unum Group | | | | | | | 25,000 | | | | 761,000 | |
W.R. Berkley Corp. | | | | | | | 16,400 | | | | 702,904 | |
XL Group PLC | | | | | | | 27,100 | | | | 835,222 | |
Total Insurance | | | | | | | | | | | 45,897,033 | |
Thrifts & Mortgage Finance — 0.2% | | | | | | | | | | | | |
First Niagara Financial Group Inc. | | | | | | | 30,000 | | | | 311,100 | |
New York Community Bancorp Inc. | | | | | | | 41,700 | | | | 630,087 | |
People’s United Financial Inc. | | | | | | | 30,400 | | | | 437,152 | |
Total Thrifts & Mortgage Finance | | | | | | | | | | | 1,378,339 | |
Total Financials | | | | | | | | | | | 167,617,945 | |
| Health Care — 13.1% | | | | | | | | | | | | |
Biotechnology — 1.2% | | | | | | | | | | | | |
Amgen Inc. | | | | | | | 71,200 | | | | 7,970,128 | |
United Therapeutics Corp. | | | | | | | 4,700 | | | | 370,595 | * |
Total Biotechnology | | | | | | | | | | | 8,340,723 | |
Health Care Equipment & Supplies — 2.8% | | | | | | | | | | | | |
Becton, Dickinson & Co. | | | | | | | 18,300 | | | | 1,830,366 | |
Boston Scientific Corp. | | | | | | | 110,600 | | | | 1,298,444 | * |
CareFusion Corp. | | | | | | | 15,700 | | | | 579,330 | * |
Covidien PLC | | | | | | | 43,500 | | | | 2,650,890 | |
See Notes to Financial Statements.
| | |
| Legg Mason BW Diversified Large Cap Value Fund 2013 Annual Report | | 17 |
Schedule of investments (cont’d)
September 30, 2013
Legg Mason BW Diversified Large Cap Value Fund
| | | | | | | | | | | | |
| Security | | | | | | Shares | | | Value | |
Health Care Equipment & Supplies — continued | | | | | | | | | | | | |
Medtronic Inc. | | | | | | | 94,300 | | | $ | 5,021,475 | |
St. Jude Medical Inc. | | | | | | | 27,200 | | | | 1,459,008 | |
Stryker Corp. | | | | | | | 35,700 | | | | 2,412,963 | |
Varian Medical Systems Inc. | | | | | | | 8,500 | | | | 635,205 | * |
Zimmer Holdings Inc. | | | | | | | 30,600 | | | | 2,513,484 | |
Total Health Care Equipment & Supplies | | | | | | | | | | | 18,401,165 | |
Health Care Providers & Services — 3.1% | | | | | | | | | | | | |
Cardinal Health Inc. | | | | | | | 32,200 | | | | 1,679,230 | |
CIGNA Corp. | | | | | | | 26,800 | | | | 2,059,848 | |
Humana Inc. | | | | | | | 14,800 | | | | 1,381,284 | |
Laboratory Corporation of America Holdings | | | | | | | 8,600 | | | | 852,604 | * |
McKesson Corp. | | | | | | | 39,200 | | | | 5,029,360 | |
UnitedHealth Group Inc. | | | | | | | 96,100 | | | | 6,881,721 | |
Universal Health Services Inc., Class B Shares | | | | | | | 6,500 | | | | 487,435 | |
WellPoint Inc. | | | | | | | 28,300 | | | | 2,366,163 | |
Total Health Care Providers & Services | | | | | | | | | | | 20,737,645 | |
Life Sciences Tools & Services — 0.2% | | | | | | | | | | | | |
Agilent Technologies Inc. | | | | | | | 29,200 | | | | 1,496,500 | |
Pharmaceuticals — 5.8% | | | | | | | | | | | | |
Eli Lilly & Co. | | | | | | | 93,100 | | | | 4,685,723 | |
Forest Laboratories Inc. | | | | | | | 42,700 | | | | 1,827,133 | * |
Merck & Co. Inc. | | | | | | | 276,700 | | | | 13,173,687 | |
Mylan Inc. | | | | | | | 36,100 | | | | 1,377,937 | * |
Pfizer Inc. | | | | | | | 626,000 | | | | 17,972,460 | |
Total Pharmaceuticals | | | | | | | | | | | 39,036,940 | |
Total Health Care | | | | | | | | | | | 88,012,973 | |
| Industrials — 12.3% | | | | | | | | | | | | |
Aerospace & Defense — 2.8% | | | | | | | | | | | | |
General Dynamics Corp. | | | | | | | 35,900 | | | | 3,141,968 | |
Honeywell International Inc. | | | | | | | 56,300 | | | | 4,675,152 | |
L-3 Communications Holdings Inc. | | | | | | | 8,500 | | | | 803,250 | |
Lockheed Martin Corp. | | | | | | | 30,400 | | | | 3,877,520 | |
Northrop Grumman Corp. | | | | | | | 28,300 | | | | 2,695,858 | |
Raytheon Co. | | | | | | | 30,500 | | | | 2,350,635 | |
Rockwell Collins Inc. | | | | | | | 12,800 | | | | 868,608 | |
Total Aerospace & Defense | | | | | | | | | | | 18,412,991 | |
Air Freight & Logistics — 0.4% | | | | | | | | | | | | |
FedEx Corp. | | | | | | | 26,100 | | | | 2,978,271 | |
See Notes to Financial Statements.
| | |
| 18 | | Legg Mason BW Diversified Large Cap Value Fund 2013 Annual Report |
Legg Mason BW Diversified Large Cap Value Fund
| | | | | | | | | | | | |
| Security | | | | | | Shares | | | Value | |
Airlines — 0.4% | | | | | | | | | | | | |
Alaska Air Group Inc. | | | | | | | 6,600 | | | $ | 413,292 | |
Delta Air Lines Inc. | | | | | | | 60,000 | | | | 1,415,400 | |
Southwest Airlines Co. | | | | | | | 66,800 | | | | 972,608 | |
Total Airlines | | | | | | | | | | | 2,801,300 | |
Building Products — 0.1% | | | | | | | | | | | | |
Owens Corning Inc. | | | | | | | 10,100 | | | | 383,598 | * |
Commercial Services & Supplies — 0.1% | | | | | | | | | | | | |
Republic Services Inc. | | | | | | | 29,200 | | | | 974,112 | |
Construction & Engineering — 0.4% | | | | | | | | | | | | |
Fluor Corp. | | | | | | | 15,400 | | | | 1,092,784 | |
KBR Inc. | | | | | | | 12,600 | | | | 411,264 | |
Quanta Services Inc. | | | | | | | 16,300 | | | | 448,413 | * |
URS Corp. | | | | | | | 7,000 | | | | 376,250 | |
Total Construction & Engineering | | | | | | | | | | | 2,328,711 | |
Electrical Equipment — 0.6% | | | | | | | | | | | | |
Emerson Electric Co. | | | | | | | 61,200 | | | | 3,959,640 | |
Industrial Conglomerates — 4.8% | | | | | | | | | | | | |
3M Co. | | | | | | | 55,100 | | | | 6,579,491 | |
General Electric Co. | | | | | | | 1,034,300 | | | | 24,709,427 | |
Textron Inc. | | | | | | | 20,800 | | | | 574,288 | |
Total Industrial Conglomerates | | | | | | | | | | | 31,863,206 | |
Machinery — 1.8% | | | | | | | | | | | | |
AGCO Corp. | | | | | | | 9,200 | | | | 555,864 | |
Cummins Inc. | | | | | | | 16,100 | | | | 2,139,207 | |
Dover Corp. | | | | | | | 14,200 | | | | 1,275,586 | |
Illinois Tool Works Inc. | | | | | | | 37,100 | | | | 2,829,617 | |
Lincoln Electric Holdings Inc. | | | | | | | 6,700 | | | | 446,354 | |
Oshkosh Corp. | | | | | | | 8,300 | | | | 406,534 | * |
Parker Hannifin Corp. | | | | | | | 14,100 | | | | 1,532,952 | |
Snap-on Inc. | | | | | | | 5,500 | | | | 547,250 | |
Stanley Black & Decker Inc. | | | | | | | 15,100 | | | | 1,367,607 | |
Timken Co. | | | | | | | 9,000 | | | | 543,600 | |
WABCO Holdings Inc. | | | | | | | 5,200 | | | | 438,152 | * |
Total Machinery | | | | | | | | | | | 12,082,723 | |
Professional Services — 0.1% | | | | | | | | | | | | |
Dun & Bradstreet Corp. | | | | | | | 3,800 | | | | 394,630 | |
Manpower Inc. | | | | | | | 6,500 | | | | 472,810 | |
Total Professional Services | | | | | | | | | | | 867,440 | |
See Notes to Financial Statements.
| | |
| Legg Mason BW Diversified Large Cap Value Fund 2013 Annual Report | | 19 |
Schedule of investments (cont’d)
September 30, 2013
Legg Mason BW Diversified Large Cap Value Fund
| | | | | | | | | | | | |
| Security | | | | | | Shares | | | Value | |
Road & Rail — 0.8% | | | | | | | | | | | | |
CSX Corp. | | | | | | | 96,300 | | | $ | 2,478,762 | |
Hertz Global Holdings Inc. | | | | | | | 37,900 | | | | 839,864 | * |
Norfolk Southern Corp. | | | | | | | 29,500 | | | | 2,281,825 | |
Total Road & Rail | | | | | | | | | | | 5,600,451 | |
Total Industrials | | | | | | | | | | | 82,252,443 | |
| Information Technology — 6.4% | | | | | | | | | | | | |
Communications Equipment — 1.7% | | | | | | | | | | | | |
Cisco Systems Inc. | | | | | | | 452,800 | | | | 10,604,576 | |
Harris Corp. | | | | | | | 10,100 | | | | 598,930 | |
Total Communications Equipment | | | | | | | | | | | 11,203,506 | |
Computers & Peripherals — 0.9% | | | | | | | | | | | | |
Hewlett-Packard Co. | | | | | | | 181,700 | | | | 3,812,066 | |
SanDisk Corp. | | | | | | | 19,800 | | | | 1,178,298 | |
Western Digital Corp. | | | | | | | 22,400 | | | | 1,418,662 | |
Total Computers & Peripherals | | | | | | | | | | | 6,409,026 | |
Electronic Equipment, Instruments & Components — 0.6% | | | | | | | | | | | | |
Arrow Electronics Inc. | | | | | | | 9,500 | | | | 461,035 | * |
Avnet Inc. | | | | | | | 20,500 | | | | 855,055 | |
Corning Inc. | | | | | | | 138,100 | | | | 2,014,879 | |
Jabil Circuit Inc. | | | | | | | 19,100 | | | | 414,088 | |
Total Electronic Equipment, Instruments & Components | | | | | | | | | | | 3,745,057 | |
IT Services — 0.3% | | | | | | | | | | | | |
Computer Sciences Corp. | | | | | | | 14,000 | | | | 724,360 | |
Global Payments Inc. | | | | | | | 6,400 | | | | 326,912 | |
Western Union Co. | | | | | | | 52,200 | | | | 974,052 | |
Total IT Services | | | | | | | | | | | 2,025,324 | |
Office Electronics — 0.2% | | | | | | | | | | | | |
Xerox Corp. | | | | | | | 116,500 | | | | 1,198,785 | |
Semiconductors & Semiconductor Equipment — 0.3% | | | | | | | | | | | | |
KLA-Tencor Corp. | | | | | | | 14,000 | | | | 851,900 | |
Marvell Technology Group Ltd. | | | | | | | 46,600 | | | | 535,900 | |
NVIDIA Corp. | | | | | | | 54,700 | | | | 851,132 | |
Total Semiconductors & Semiconductor Equipment | | | | | | | | | | | 2,238,932 | |
Software — 2.4% | | | | | | | | | | | | |
Activision Blizzard Inc. | | | | | | | 86,900 | | | | 1,448,623 | |
CA Inc. | | | | | | | 43,100 | | | | 1,278,777 | |
Microsoft Corp. | | | | | | | 349,500 | | | | 11,641,845 | |
See Notes to Financial Statements.
| | |
| 20 | | Legg Mason BW Diversified Large Cap Value Fund 2013 Annual Report |
Legg Mason BW Diversified Large Cap Value Fund
| | | | | | | | | | | | |
| Security | | | | | | Shares | | | Value | |
Software — continued | | | | | | | | | | | | |
Symantec Corp. | | | | | | | 66,100 | | | $ | 1,635,975 | |
Total Software | | | | | | | | | | | 16,005,220 | |
Total Information Technology | | | | | | | | | | | 42,825,850 | |
| Materials — 2.4% | | | | | | | | | | | | |
Chemicals — 2.0% | | | | | | | | | | | | |
Air Products & Chemicals Inc. | | | | | | | 17,600 | | | | 1,875,632 | |
Albemarle Corp. | | | | | | | 7,400 | | | | 465,756 | |
Ashland Inc. | | | | | | | 7,300 | | | | 675,104 | |
Celanese Corp., Series A Shares | | | | | | | 15,100 | | | | 797,129 | |
E.I. du Pont de Nemours & Co. | | | | | | | 71,700 | | | | 4,198,752 | |
Huntsman Corp. | | | | | | | 22,800 | | | | 469,908 | |
LyondellBasell Industries NV, Class A Shares | | | | | | | 53,000 | | | | 3,881,190 | |
NewMarket Corp. | | | | | | | 1,100 | | | | 316,701 | |
Westlake Chemical Corp. | | | | | | | 6,300 | | | | 659,358 | |
Total Chemicals | | | | | | | | | | | 13,339,530 | |
Containers & Packaging — 0.3% | | | | | | | | | | | | |
Bemis Co. Inc. | | | | | | | 9,800 | | | | 382,298 | |
Crown Holdings Inc. | | | | | | | 13,600 | | | | 575,008 | * |
Owens-Illinois Inc. | | | | | | | 15,500 | | | | 465,310 | * |
Sonoco Products Co. | | | | | | | 9,000 | | | | 350,460 | |
Total Containers & Packaging | | | | | | | | | | | 1,773,076 | |
Metals & Mining — 0.1% | | | | | | | | | | | | |
Nucor Corp. | | | | | | | 11,500 | | | | 563,730 | |
Steel Dynamics Inc. | | | | | | | 17,600 | | | | 294,096 | |
Total Metals & Mining | | | | | | | | | | | 857,826 | |
Total Materials | | | | | | | | | | | 15,970,432 | |
| Telecommunication Services — 1.1% | | | | | | | | | | | | |
Diversified Telecommunication Services — 1.1% | | | | | | | | | | | | |
AT&T Inc. | | | | | | | 226,100 | | | | 7,646,702 | |
| Utilities — 1.5% | | | | | | | | | | | | |
Electric Utilities — 0.5% | | | | | | | | | | | | |
Edison International | | | | | | | 40,600 | | | | 1,870,036 | |
Northeast Utilities | | | | | | | 26,000 | | | | 1,072,500 | |
Pinnacle West Capital Corp. | | | | | | | 9,100 | | | | 498,134 | |
Total Electric Utilities | | | | | | | | | | | 3,440,670 | |
Gas Utilities — 0.1% | | | | | | | | | | | | |
Atmos Energy Corp. | | | | | | | 8,700 | | | | 370,533 | |
Independent Power Producers & Energy Traders — 0.1% | | | | | | | | | | | | |
AES Corp. | | | | | | | 70,100 | | | | 931,629 | |
See Notes to Financial Statements.
| | |
| Legg Mason BW Diversified Large Cap Value Fund 2013 Annual Report | | 21 |
Schedule of investments (cont’d)
September 30, 2013
Legg Mason BW Diversified Large Cap Value Fund
| | | | | | | | | | | | | | |
| Security | | | | | | | Shares | | | Value | |
Multi-Utilities — 0.7% | | | | | | | | | | | | | | |
Alliant Energy Corp. | | | | | | | | | 10,500 | | | $ | 520,275 | |
Ameren Corp. | | | | | | | | | 22,900 | | | | 797,836 | |
Integrys Energy Group Inc. | | | | | | | | | 6,800 | | | | 380,052 | |
MDU Resources Group Inc. | | | | | | | | | 15,100 | | | | 422,347 | |
Public Service Enterprise Group Inc. | | | | | | | | | 36,800 | | | | 1,211,824 | |
Sempra Energy | | | | | | | | | 16,100 | | | | 1,378,160 | |
Total Multi-Utilities | | | | | | | | | | | | | 4,710,494 | |
Water Utilities — 0.1% | | | | | | �� | | | | | | | | |
American Water Works Co. Inc. | | | | | | | | | 13,800 | | | | 569,664 | |
Total Utilities | | | | | | | | | | | | | 10,022,990 | |
Total Investments before Short-Term Investments (Cost — $476,072,300) | | | | | | | | | | 611,506,772 | |
| | | | |
| | | Rate | | | | | Face
Amount | | | | |
| Short-Term Investments — 1.6% | | | | | | | | | | | | | | |
State Street Institutional Liquid Reserves Fund (Cost — $10,770,829) | | | 0.070 | % | | | | $ | 10,770,829 | | | | 10,770,829 | |
Total Investments — 92.9% (Cost — $486,843,129#) | | | | | | | | | | | | | 622,277,601 | |
Other Assets in Excess of Liabilities — 7.1% | | | | | | | | | | | | | 47,447,325 | |
Total Net Assets — 100.0% | | | | | | | | | | | | $ | 669,724,926 | |
| * | Non-income producing security. |
| # | Aggregate cost for federal income tax purposes is $486,905,790. |
See Notes to Financial Statements.
| | |
| 22 | | Legg Mason BW Diversified Large Cap Value Fund 2013 Annual Report |
Statement of assets and liabilities
September 30, 2013
| | | | |
| |
| Assets: | | | | |
Investments, at value (Cost — $486,843,129) | | $ | 622,277,601 | |
Receivable for Fund shares sold | | | 51,684,956 | |
Receivable for securities sold | | | 50,489,716 | |
Dividends and interest receivable | | | 869,977 | |
Prepaid expenses | | | 60,646 | |
Total Assets | | | 725,382,896 | |
| |
| Liabilities: | | | | |
Payable for securities purchased | | | 55,059,113 | |
Investment management fee payable | | | 383,761 | |
Payable for Fund shares repurchased | | | 114,414 | |
Service and/or distribution fees payable | | | 1,017 | |
Trustees’ fees payable | | | 457 | |
Accrued expenses | | | 99,208 | |
Total Liabilities | | | 55,657,970 | |
| Total Net Assets | | $ | 669,724,926 | |
| |
| Net Assets: | | | | |
Par value (Note 7) | | $ | 369 | |
Paid-in capital in excess of par value | | | 496,860,736 | |
Undistributed net investment income | | | 5,055,367 | |
Accumulated net realized gain on investments | | | 32,373,982 | |
Net unrealized appreciation on investments | | | 135,434,472 | |
| Total Net Assets | | $ | 669,724,926 | |
| |
| Shares Outstanding: | | | | |
Class A | | | 170,734 | |
Class A2 | | | 70,628 | |
Class C | | | 11,326 | |
Class I | | | 219,394 | |
Class IS | | | 36,452,500 | |
| |
| Net Asset Value: | | | | |
Class A (and redemption price) | | | $18.11 | |
Class A2 (and redemption price) | | | $18.07 | |
Class C* | | | $17.99 | |
Class I (and redemption price) | | | $18.13 | |
Class IS (and redemption price) | | | $18.14 | |
| Maximum Public Offering Price Per Share: | | | | |
Class A (based on maximum initial sales charge of 5.75%) | | | $19.21 | |
Class A2 (based on maximum initial sales charge of 5.75%) | | | $19.17 | |
| * | Redemption price per share is NAV of Class C shares reduced by a 1.00% CDSC, if shares are redeemed within one year from purchase payment (See Note 2). |
See Notes to Financial Statements.
| | |
| Legg Mason BW Diversified Large Cap Value Fund 2013 Annual Report | | 23 |
Statement of operations
For the Year Ended September 30, 2013
| | | | |
| |
| Investment Income: | | | | |
Dividends | | $ | 13,990,644 | |
Interest | | | 8,393 | |
Less: Foreign taxes withheld | | | (6,698) | |
Total Investment Income | | | 13,992,339 | |
| |
| Expenses: | | | | |
Investment management fee (Note 2) | | | 4,283,648 | |
Legal fees | | | 130,082 | |
Registration fees | | | 89,350 | |
Trustees’ fees | | | 81,847 | |
Fund accounting fees | | | 60,966 | |
Shareholder reports | | | 44,615 | |
Audit and tax | | | 36,334 | |
Fees recaptured by investment manager (Note 2) | | | 34,650 | |
Transfer agent fees (Note 5) | | | 25,131 | |
Insurance | | | 11,480 | |
Service and/or distribution fees (Notes 2 and 5) | | | 7,453 | |
Custody fees | | | 6,244 | |
Miscellaneous expenses | | | 22,894 | |
Total Expenses | | | 4,834,694 | |
Less: Fee waivers and/or expense reimbursements (Notes 2 and 5) | | | (15,618) | |
Net Expenses | | | 4,819,076 | |
| Net Investment Income | | | 9,173,263 | |
| |
| Realized and Unrealized Gain on Investments (Notes 1 and 3): | | | | |
Net Realized Gain from Investment Transactions | | | 32,621,727 | |
Change in Net Unrealized Appreciation (Depreciation) from Investments | | | 58,139,586 | |
| Net Gain on Investments | | | 90,761,313 | |
| Increase in Net Assets from Operations | | $ | 99,934,576 | |
See Notes to Financial Statements.
| | |
| 24 | | Legg Mason BW Diversified Large Cap Value Fund 2013 Annual Report |
Statements of changes in net assets
| | | | | | | | |
| For the Years Ended September 30, | | 2013 | | | 2012 | |
| | |
| Operations: | | | | | | | | |
Net investment income | | $ | 9,173,263 | | | $ | 8,669,853 | |
Net realized gain | | | 32,621,727 | | | | 18,239,049 | |
Change in net unrealized appreciation (depreciation) | | | 58,139,586 | | | | 100,509,993 | |
Increase in Net Assets From Operations | | | 99,934,576 | | | | 127,418,895 | |
| | |
| Distributions to Shareholders From (Notes 1 and 6): | | | | | | | | |
Net investment income | | | (10,500,017) | | | | (5,000,007) | |
Net realized gains | | | (18,179,406) | | | | (6,062,126) | |
Decrease in Net Assets From Distributions to Shareholders | | | (28,679,423) | | | | (11,062,133) | |
| | |
| Fund Share Transactions (Note 7): | | | | | | | | |
Net proceeds from sale of shares | | | 138,206,811 | | | | 54,973,029 | |
Reinvestment of distributions | | | 28,627,761 | | | | 11,062,133 | |
Cost of shares repurchased | | | (87,693,532) | | | | (103,032,859) | |
Increase (Decrease) in Net Assets From Fund Share Transactions | | | 79,141,040 | | | | (36,997,697) | |
Increase in Net Assets | | | 150,396,193 | | | | 79,359,065 | |
| | |
| Net Assets: | | | | | | | | |
Beginning of year | | | 519,328,733 | | | | 439,969,668 | |
End of year* | | $ | 669,724,926 | | | $ | 519,328,733 | |
* Includes undistributed net investment income of: | | | $5,055,367 | | | | $6,382,121 | |
See Notes to Financial Statements.
| | |
| Legg Mason BW Diversified Large Cap Value Fund 2013 Annual Report | | 25 |
Financial highlights
| | | | | | | | | | | | | | | | |
For a share of each class of beneficial interest outstanding throughout each year ended September 30,
unless otherwise noted: | |
| Class A Shares1 | | 2013 | | | 2012 | | | 2011 | | | 20102 | |
| | | | |
| Net asset value, beginning of year | | | $16.13 | | | | $12.65 | | | | $12.52 | | | | $12.00 | |
| | | | |
| Income from operations: | | | | | | | | | | | | | | | | |
Net investment income | | | 0.22 | | | | 0.20 | | | | 0.15 | | | | 0.02 | |
Net realized and unrealized gain | | | 2.62 | | | | 3.55 | | | | 0.02 | | | | 0.50 | |
Total income from operations | | | 2.84 | | | | 3.75 | | | | 0.17 | | | | 0.52 | |
| | | | |
| Less distributions from: | | | | | | | | | | | | | | | | |
Net investment income | | | (0.30) | | | | (0.09) | | | | (0.02) | | | | — | |
Net realized gains | | | (0.56) | | | | (0.18) | | | | (0.02) | | | | — | |
Total distributions | | | (0.86) | | | | (0.27) | | | | (0.04) | | | | — | |
| | | | |
| Net asset value, end of year | | | $18.11 | | | | $16.13 | | | | $12.65 | | | | $12.52 | |
Total return3 | | | 18.62 | % | | | 30.03 | % | | | 1.35 | % | | | 4.33 | % |
| | | | |
| Net assets, end of year (000s) | | | $3,093 | | | | $656 | | | | $156 | | | | $104 | |
| | | | |
| Ratios to average net assets: | | | | | | | | | | | | | | | | |
Gross expenses | | | 1.45 | % | | | 1.38 | %9 | | | 1.43 | %9 | | | 2.19 | %4 |
Net expenses5,6,7 | | | 1.10 | 8 | | | 1.22 | 8,9 | | | 1.30 | 9 | | | 1.27 | 4 |
Net investment income | | | 1.30 | | | | 1.31 | | | | 1.10 | | | | 1.98 | 4 |
| | | | |
| Portfolio turnover rate | | | 53 | % | | | 38 | % | | | 59 | % | | | 6 | % |
| 1 | Per share amounts have been calculated using the average shares method. |
| 2 | For the period September 7, 2010 (inception date) to September 30, 2010. |
| 3 | Performance figures, exclusive of sales charges, may reflect compensating balance arrangements, fee waivers and/or expense reimbursements. In the absence of compensating balance arrangements, fee waivers and/or expense reimbursements, the total return would have been lower. Past performance is no guarantee of future results. Total returns for periods of less than one year are not annualized. |
| 5 | Reflects fee waivers and/or expense reimbursements. |
| 6 | As a result of an expense limitation arrangement, the ratio of expenses, other than brokerage commissions, interest, dividend expense on short sales, taxes, extraordinary expenses and acquired fund fees and expenses, to average net assets of Class A shares did not exceed 1.30%. This expense limitation arrangement cannot be terminated prior to December 31, 2014 without the Board of Trustees’ consent. |
| 7 | The impact of compensating balance arrangements, if any, was less than 0.01%. |
| 8 | As a result of a voluntary expense limitation arrangement, effective July 1, 2012, the ratio of expenses other than interest, brokerage commissions, dividend expense on short sales, taxes, extraordinary expenses and acquired fund fees and expenses, to average net assets of Class A shares did not exceed 1.10%. This expense limitation arrangement is expected to continue until December 31, 2014, but may be terminated at any time by the manager. |
| 9 | Reflects recapture of expenses waived/reimbursed from prior fiscal years. |
See Notes to Financial Statements.
| | |
| 26 | | Legg Mason BW Diversified Large Cap Value Fund 2013 Annual Report |
| | | | |
For a share of each class of beneficial interest outstanding throughout each year ended September 30,
unless otherwise noted: | |
| Class A2 Shares1 | | 20132 | |
| |
| Net asset value, beginning of period | | | $15.96 | |
| |
| Income from operations: | | | | |
Net investment income | | | 0.17 | |
Net realized and unrealized gain | | | 2.82 | |
Total income from operations | | | 2.99 | |
| |
| Less distributions from: | | | | |
Net investment income | | | (0.32) | |
Net realized gains | | | (0.56) | |
Total distributions | | | (0.88) | |
| |
| Net asset value, end of period | | | $18.07 | |
Total return3 | | | 19.77 | % |
| |
| Net assets, end of year (000s) | | | $1,276 | |
| |
| Ratios to average net assets: | | | | |
Gross expenses4 | | | 1.26 | % |
Net expenses4,5,6,7,8 | | | 1.26 | |
Net investment income4 | | | 1.08 | |
| |
| Portfolio turnover rate | | | 53 | % |
| 1 | Per share amounts have been calculated using the average shares method. |
| 2 | For the period October 31, 2012 (inception date) to September 30, 2013. |
| 3 | Performance figures, exclusive of sales charges, may reflect compensating balance arrangements, fee waivers and/or expense reimbursements. In the absence of compensating balance arrangements, fee waivers and/or expense reimbursements, the total return would have been lower. Past performance is no guarantee of future results. Total returns for periods of less than one year are not annualized. |
| 5 | Reflects fee waivers and/or expense reimbursements. |
| 6 | As a result of an expense limitation arrangement, the ratio of expenses, other than brokerage commissions, interest, dividend expense on short sales, taxes, extraordinary expenses and acquired fund fees and expenses, to average net assets of Class A2 shares did not exceed 1.50%. This expense limitation arrangement cannot be terminated prior to December 31, 2014 without the Board of Trustees’ consent. |
| 7 | The impact of compensating balance arrangements, if any, was less than 0.01%. |
| 8 | As a result of a voluntary expense limitation arrangement, the ratio of expenses other than interest, brokerage commissions, dividend expense on short sales, taxes, extraordinary expenses and acquired fund fees and expenses, to average net assets of Class A2 shares did not exceed 1.30%. This expense limitation arrangement is expected to continue until December 31, 2014, but may be terminated at any time by the manager. |
See Notes to Financial Statements.
| | |
| Legg Mason BW Diversified Large Cap Value Fund 2013 Annual Report | | 27 |
Financial highlights (cont’d)
| | | | | | | | | | | | | | | | |
For a share of each class of beneficial interest outstanding throughout each year ended September 30,
unless otherwise noted: | |
| Class C Shares1 | | 2013 | | | 2012 | | | 2011 | | | 20102 | |
| | | | |
| Net asset value, beginning of year | | | $16.00 | | | | $12.56 | | | | $12.52 | | | | $12.00 | |
| | | | |
| Income from operations: | | | | | | | | | | | | | | | | |
Net investment income | | | 0.10 | | | | 0.09 | | | | 0.05 | | | | 0.01 | |
Net realized and unrealized gain | | | 2.61 | | | | 3.53 | | | | 0.01 | | | | 0.51 | |
Total income from operations | | | 2.71 | | | | 3.62 | | | | 0.06 | | | | 0.52 | |
| | | | |
| Less distributions from: | | | | | | | | | | | | | | | | |
Net investment income | | | (0.16) | | | | — | | | | — | | | | — | |
Net realized gains | | | (0.56) | | | | (0.18) | | | | (0.02) | | | | — | |
Total distributions | | | (0.72) | | | | (0.18) | | | | (0.02) | | | | — | |
| | | | |
| Net asset value, end of year | | | $17.99 | | | | $16.00 | | | | $12.56 | | | | $12.52 | |
Total return3 | | | 17.77 | % | | | 29.09 | % | | | 0.50 | % | | | 4.33 | % |
| | | | |
| Net assets, end of year (000s) | | | $204 | | | | $177 | | | | $71 | | | | $104 | |
| | | | |
| Ratios to average net assets: | | | | | | | | | | | | | | | | |
Gross expenses | | | 2.17 | % | | | 2.11 | %9 | | | 2.18 | %9 | | | 2.94 | %4 |
Net expenses5,6,7 | | | 1.85 | 8 | | | 1.99 | 8,9 | | | 2.05 | 9 | | | 2.02 | 4 |
Net investment income | | | 0.61 | | | | 0.62 | | | | 0.33 | | | | 1.23 | 4 |
| | | | |
| Portfolio turnover rate | | | 53 | % | | | 38 | % | | | 59 | % | | | 6 | % |
| 1 | Per share amounts have been calculated using the average shares method. |
| 2 | For the period September 7, 2010 (inception date) to September 30, 2010. |
| 3 | Performance figures, exclusive of CDSC, may reflect compensating balance arrangements, fee waivers and/or expense reimbursements. In the absence of compensating balance arrangements, fee waivers and/or expense reimbursements, the total return would have been lower. Past performance is no guarantee of future results. Total returns for periods of less than one year are not annualized. |
| 5 | Reflects fee waivers and/or expense reimbursements. |
| 6 | As a result of an expense limitation arrangement, the ratio of expenses, other than brokerage commissions, interest, dividend expense on short sales, taxes, extraordinary expenses and acquired fund fees and expenses, to average net assets of Class C shares did not exceed 2.05%. This expense limitation arrangement cannot be terminated prior to December 31, 2014 without the Board of Trustees’ consent. |
| 7 | The impact of compensating balance arrangements, if any, was less than 0.01%. |
| 8 | As a result of a voluntary expense limitation arrangement, effective July 1, 2012, the ratio of expenses other than interest, brokerage commissions, dividend expense on short sales, taxes, extraordinary expenses and acquired fund fees and expenses, to average net assets of Class C shares did not exceed 1.85%. This expense limitation arrangement is expected to continue until December 31, 2014, but may be terminated at any time by the manager. |
| 9 | Reflects recapture of expenses waived/reimbursed from prior fiscal years. |
See Notes to Financial Statements.
| | |
| 28 | | Legg Mason BW Diversified Large Cap Value Fund 2013 Annual Report |
| | | | | | | | | | | | | | | | |
For a share of each class of beneficial interest outstanding throughout each year ended September 30,
unless otherwise noted: | |
| Class I Shares1 | | 2013 | | | 2012 | | | 2011 | | | 20102 | |
| | | | |
| Net asset value, beginning of year | | | $16.13 | | | | $12.65 | | | | $12.53 | | | | $12.00 | |
| | | | |
| Income from operations: | | | | | | | | | | | | | | | | |
Net investment income | | | 0.27 | | | | 0.24 | | | | 0.20 | | | | 0.02 | |
Net realized and unrealized gain | | | 2.61 | | | | 3.56 | | | | 0.00 | 3 | | | 0.51 | |
Total income from operations | | | 2.88 | | | | 3.80 | | | | 0.20 | | | | 0.53 | |
| | | | |
| Less distributions from: | | | | | | | | | | | | | | | | |
Net investment income | | | (0.32) | | | | (0.14) | | | | (0.06) | | | | — | |
Net realized gains | | | (0.56) | | | | (0.18) | | | | (0.02) | | | | — | |
Total distributions | | | (0.88) | | | | (0.32) | | | | (0.08) | | | | — | |
| | | | |
| Net asset value, end of year | | | $18.13 | | | | $16.13 | | | | $12.65 | | | | $12.53 | |
Total return4 | | | 18.99 | % | | | 30.45 | % | | | 1.62 | % | | | 4.42 | % |
| | | | |
| Net assets, end of year (000s) | | | $3,978 | | | | $3,015 | | | | $65 | | | | $105 | |
| | | | |
| Ratios to average net assets: | | | | | | | | | | | | | | | | |
Gross expenses | | | 1.08 | %10 | | | 0.94 | %10 | | | 1.18 | %10 | | | 1.94 | %5 |
Net expenses6,7,8 | | | 0.85 | 9,10 | | | 0.88 | 9,10 | | | 0.95 | 10 | | | 0.92 | 5 |
Net investment income | | | 1.60 | | | | 1.60 | | | | 1.43 | | | | 2.33 | 5 |
| | | | |
| Portfolio turnover rate | | | 53 | % | | | 38 | % | | | 59 | % | | | 6 | % |
| 1 | Per share amounts have been calculated using the average shares method. |
| 2 | For the period September 7, 2010 (inception date) to September 30, 2010. |
| 3 | Amount represents less than $0.005 per share. |
| 4 | Performance figures may reflect compensating balance arrangements, fee waivers and/or expense reimbursements. In the absence of compensating balance arrangements, fee waivers and/or expense reimbursements, the total return would have been lower. Past performance is no guarantee of future results. Total returns for periods of less than one year are not annualized. |
| 6 | Reflects fee waivers and/or expense reimbursements. |
| 7 | As a result of an expense limitation arrangement, the ratio of expenses, other than brokerage commissions, interest, dividend expense on short sales, taxes, extraordinary expenses and acquired fund fees and expenses, to average net assets of Class I shares did not exceed 0.95%. This expense limitation arrangement cannot be terminated prior to December 31, 2014 without the Board of Trustees’ consent. |
| 8 | The impact of compensating balance arrangements, if any, was less than 0.01%. |
| 9 | As a result of a voluntary expense limitation arrangement, effective July 1, 2012, the ratio of expenses other than interest, brokerage commissions, dividend expense on short sales, taxes, extraordinary expenses and acquired fund fees and expenses, to average net assets of Class I shares did not exceed 0.85%. This expense limitation arrangement is expected to continue until December 31, 2014, but may be terminated at any time by the manager. |
| 10 | Reflects recapture of expenses waived/reimbursed from prior fiscal years. |
See Notes to Financial Statements.
| | |
| Legg Mason BW Diversified Large Cap Value Fund 2013 Annual Report | | 29 |
Financial highlights (cont’d)
| | | | | | | | | | | | | | | | |
For a share of each class of beneficial interest outstanding throughout each year ended September 30,
unless otherwise noted: | |
| Class IS Shares1 | | 2013 | | | 2012 | | | 2011 | | | 20102 | |
| | | | |
| Net asset value, beginning of year | | | $16.13 | | | | $12.65 | | | | $12.53 | | | | $12.00 | |
| | | | |
| Income from operations: | | | | | | | | | | | | | | | | |
Net investment income | | | 0.27 | | | | 0.26 | | | | 0.22 | | | | 0.02 | |
Net realized and unrealized gain | | | 2.62 | | | | 3.55 | | | | 0.00 | 3 | | | 0.51 | |
Total income from operations | | | 2.89 | | | | 3.81 | | | | 0.22 | | | | 0.53 | |
| | | | |
| Less distributions from: | | | | | | | | | | | | | | | | |
Net investment income | | | (0.32) | | | | (0.15) | | | | (0.08) | | | | — | |
Net realized gains | | | (0.56) | | | | (0.18) | | | | (0.02) | | | | — | |
Total distributions | | | (0.88) | | | | (0.33) | | | | (0.10) | | | | — | |
| | | | |
| Net asset value, end of year | | | $18.14 | | | | $16.13 | | | | $12.65 | | | | $12.53 | |
Total return4 | | | 18.98 | % | | | 30.58 | % | | | 1.72 | % | | | 4.42 | % |
| | | | |
| Net assets, end of year (000s) | | | $661,174 | | | | $515,481 | | | | $439,678 | | | | $122,063 | |
| | | | |
| Ratios to average net assets: | | | | | | | | | | | | | | | | |
Gross expenses | | | 0.84 | %9 | | | 0.84 | %9 | | | 0.94 | %9 | | | 1.70 | %5 |
Net expenses6,7 | | | 0.84 | 9 | | | 0.84 | 9 | | | 0.85 | 8,9 | | | 0.82 | 5,8 |
Net investment income | | | 1.61 | | | | 1.78 | | | | 1.58 | | | | 2.40 | 5 |
| | | | |
| Portfolio turnover rate | | | 53 | % | | | 38 | % | | | 59 | % | | | 6 | % |
| 1 | Per share amounts have been calculated using the average shares method. |
| 2 | For the period September 7, 2010 (inception date) to September 30, 2010. |
| 3 | Amount represents less than $0.005 per share. |
| 4 | Performance figures may reflect compensating balance arrangements, fee waivers and/or expense reimbursements. In the absence of compensating balance arrangements, fee waivers and/or expense reimbursements, the total return would have been lower. Past performance is no guarantee of future results. Total returns for periods of less than one year are not annualized. |
| 6 | As a result of an expense limitation arrangement, the ratio of expenses, other than brokerage commissions, interest, dividend expense on short sales, taxes, extraordinary expenses and acquired fund fees and expenses, to average net assets of Class IS shares did not exceed 0.85%. This expense limitation arrangement cannot be terminated prior to December 31, 2014 without the Board of Trustees’ consent. |
| 7 | The impact of compensating balance arrangements, if any, was less than 0.01%. |
| 8 | Reflects fee waivers and/or expense reimbursements. |
| 9 | Reflects recapture of expenses waived/reimbursed from prior fiscal years. |
See Notes to Financial Statements.
| | |
| 30 | | Legg Mason BW Diversified Large Cap Value Fund 2013 Annual Report |
Notes to financial statements
1. Organization and significant accounting policies
Legg Mason BW Diversified Large Cap Value Fund (the “Fund”) is a separate diversified investment series of Legg Mason Global Asset Management Trust (the “Trust”). The Trust, a Maryland statutory trust, is registered under the Investment Company Act of 1940, as amended (the “1940 Act”), as an open-end management investment company.
The following are significant accounting policies consistently followed by the Fund and are in conformity with U.S. generally accepted accounting principles (“GAAP”). Estimates and assumptions are required to be made regarding assets, liabilities and changes in net assets resulting from operations when financial statements are prepared. Changes in the economic environment, financial markets and any other parameters used in determining these estimates could cause actual results to differ. Subsequent events have been evaluated through the date the financial statements were issued.
(a) Investment valuation. Equity securities for which market quotations are available are valued at the last reported sales price or official closing price on the primary market or exchange on which they trade. The valuations for fixed income securities (which may include, but are not limited to, corporate, government, municipal, mortgage-backed, collateralized mortgage obligations and asset-backed securities) and certain derivative instruments are typically the prices supplied by independent third party pricing services, which may use market prices or broker/dealer quotations or a variety of valuation techniques and methodologies. The independent third party pricing services use inputs that are observable such as issuer details, interest rates, yield curves, prepayment speeds, credit risks/spreads, default rates and quoted prices for similar securities. Short-term fixed income securities that will mature in 60 days or less are valued at amortized cost, unless it is determined that using this method would not reflect an investment’s fair value. When the Fund holds securities or other assets that are denominated in a foreign currency, the Fund will normally use the currency exchange rates as of 4:00 p.m. (Eastern Time). If independent third party pricing services are unable to supply prices for a portfolio investment, or if the prices supplied are deemed by the manager to be unreliable, the market price may be determined by the manager using quotations from one or more broker/dealers or at the transaction price if the security has recently been purchased and no value has yet been obtained from a pricing service or pricing broker. When reliable prices are not readily available, such as when the value of a security has been significantly affected by events after the close of the exchange or market on which the security is principally traded, but before the Fund calculates its net asset value, the Fund values these securities as determined in accordance with procedures approved by the Fund’s Board of Trustees.
The Board of Trustees is responsible for the valuation process and has delegated the supervision of the daily valuation process to the Legg Mason North American Fund Valuation Committee (the “Valuation Committee”). The Valuation Committee, pursuant to the policies adopted by the Board of Trustees, is responsible for making fair value determinations, evaluating the effectiveness of the Fund’s pricing policies, and reporting to the Board of Trustees. When determining the reliability of third party pricing information for investments
| | |
| Legg Mason BW Diversified Large Cap Value Fund 2013 Annual Report | | 31 |
Notes to financial statements (cont’d)
owned by the Fund, the Valuation Committee, among other things, conducts due diligence reviews of pricing vendors, monitors the daily change in prices and reviews transactions among market participants.
The Valuation Committee will consider pricing methodologies it deems relevant and appropriate when making fair value determinations. Examples of possible methodologies include, but are not limited to, multiple of earnings; discount from market of a similar freely traded security; discounted cash-flow analysis; book value or a multiple thereof; risk premium/yield analysis; yield to maturity; and/or fundamental investment analysis. The Valuation Committee will also consider factors it deems relevant and appropriate in light of the facts and circumstances. Examples of possible factors include, but are not limited to, the type of security; the issuer’s financial statements; the purchase price of the security; the discount from market value of unrestricted securities of the same class at the time of purchase; analysts’ research and observations from financial institutions; information regarding any transactions or offers with respect to the security; the existence of merger proposals or tender offers affecting the security; the price and extent of public trading in similar securities of the issuer or comparable companies; and the existence of a shelf registration for restricted securities.
For each portfolio security that has been fair valued pursuant to the policies adopted by the Board of Trustees, the fair value price is compared against the last available and next available market quotations. The Valuation Committee reviews the results of such back testing monthly and fair valuation occurrences are reported to the Board of Trustees quarterly.
The Fund uses valuation techniques to measure fair value that are consistent with the market approach and/or income approach, depending on the type of security and the particular circumstance. The market approach uses prices and other relevant information generated by market transactions involving identical or comparable securities. The income approach uses valuation techniques to discount estimated future cash flows to present value.
GAAP establishes a disclosure hierarchy that categorizes the inputs to valuation techniques used to value assets and liabilities at measurement date. These inputs are summarized in the three broad levels listed below:
| Ÿ | | Level 1 — quoted prices in active markets for identical investments |
| Ÿ | | Level 2 — other significant observable inputs (including quoted prices for similar investments, interest rates, prepayment speeds, credit risk, etc.) |
| Ÿ | | Level 3 — significant unobservable inputs (including the Fund’s own assumptions in determining the fair value of investments) |
The inputs or methodologies used to value securities are not necessarily an indication of the risk associated with investing in those securities.
| | |
| 32 | | Legg Mason BW Diversified Large Cap Value Fund 2013 Annual Report |
The following is a summary of the inputs used in valuing the Fund’s assets carried at fair value:
| | | | | | | | | | | | | | | | |
| ASSETS | |
| Description | | Quoted Prices
(Level 1) | | | Other Significant
Observable Inputs
(Level 2) | | | Significant
Unobservable
Inputs
(Level 3) | | | Total | |
| Common stocks† | | $ | 611,506,772 | | | | — | | | | — | | | $ | 611,506,772 | |
| Short-term investments† | | | 10,770,829 | | | | — | | | | — | | | | 10,770,829 | |
| Total investments | | $ | 622,277,601 | | | | — | | | | — | | | $ | 622,277,601 | |
| † | See Schedule of Investments for additional detailed categorizations. |
(b) Repurchase agreements. The Fund may enter into repurchase agreements with institutions that its investment adviser has determined are creditworthy. Each repurchase agreement is recorded at cost. Under the terms of a typical repurchase agreement, the Fund acquires a debt security subject to an obligation of the seller to repurchase, and of the Fund to resell, the security at an agreed-upon price and time, thereby determining the yield during the Fund’s holding period. When entering into repurchase agreements, it is the Fund’s policy that its custodian or a third party custodian, acting on the Fund’s behalf, take possession of the underlying collateral securities, the market value of which, at all times, at least equals the principal amount of the repurchase transaction, including accrued interest. To the extent that any repurchase transaction maturity exceeds one business day, the value of the collateral is marked-to-market and measured against the value of the agreement in an effort to ensure the adequacy of the collateral. If the counterparty defaults, the Fund generally has the right to use the collateral to satisfy the terms of the repurchase transaction. However, if the market value of the collateral declines during the period in which the Fund seeks to assert its rights or if bankruptcy proceedings are commenced with respect to the seller of the security, realization of the collateral by the Fund may be delayed or limited.
(c) Foreign currency translation. Investment securities and other assets and liabilities denominated in foreign currencies are translated into U.S. dollar amounts based upon prevailing exchange rates on the date of valuation. Purchases and sales of investment securities and income and expense items denominated in foreign currencies are translated into U.S. dollar amounts based upon prevailing exchange rates on the respective dates of such transactions.
The Fund does not isolate that portion of the results of operations resulting from fluctuations in foreign exchange rates on investments from the fluctuations arising from changes in market prices of securities held. Such fluctuations are included with the net realized and unrealized gain or loss on investments.
Net realized foreign exchange gains or losses arise from sales of foreign currencies, including gains and losses on forward foreign currency contracts, currency gains or losses realized between the trade and settlement dates on securities transactions, and the difference
| | |
| Legg Mason BW Diversified Large Cap Value Fund 2013 Annual Report | | 33 |
Notes to financial statements (cont’d)
between the amounts of dividends, interest, and foreign withholding taxes recorded on the Fund’s books and the U.S. dollar equivalent of the amounts actually received or paid. Net unrealized foreign exchange gains and losses arise from changes in the values of assets and liabilities, other than investments in securities, on the date of valuation, resulting from changes in exchange rates.
Foreign security and currency transactions may involve certain considerations and risks not typically associated with those of U.S. dollar denominated transactions as a result of, among other factors, the possibility of lower levels of governmental supervision and regulation of foreign securities markets and the possibility of political or economic instability.
(d) Foreign investment risks. The Fund’s investments in foreign securities may involve risks not present in domestic investments. Since securities may be denominated in foreign currencies, may require settlement in foreign currencies or pay interest or dividends in foreign currencies, changes in the relationship of these foreign currencies to the U.S. dollar can significantly affect the value of the investments and earnings of the Fund. Foreign investments may also subject the Fund to foreign government exchange restrictions, expropriation, taxation or other political, social or economic developments, all of which affect the market and/or credit risk of the investments.
(e) Security transactions and investment income. Security transactions are accounted for on a trade date basis. Interest income, adjusted for amortization of premium and accretion of discount, is recorded on the accrual basis. Dividend income is recorded on the ex-dividend date. The cost of investments sold is determined by use of the specific identification method. To the extent any issuer defaults or a credit event occurs that impacts the issuer, the Fund may halt any additional interest income accruals and consider the realizability of interest accrued up to the date of default or credit event.
(f) Distributions to shareholders. Distributions from net investment income and distributions of net realized gains, if any, are declared at least annually. Distributions to shareholders of the Fund are recorded on the ex-dividend date and are determined in accordance with income tax regulations, which may differ from GAAP.
(g) Share class accounting. Investment income, common expenses and realized/unrealized gains (losses) on investments are allocated to the various classes of the Fund on the basis of daily net assets of each class. Fees relating to a specific class are charged directly to that share class.
(h) Compensating balance arrangements. The Fund has an arrangement with its custodian bank whereby a portion of the custodian’s fees is paid indirectly by credits earned on the Fund’s cash on deposit with the bank.
(i) Federal and other taxes. It is the Fund’s policy to comply with the federal income and excise tax requirements of the Internal Revenue Code of 1986 (the “Code”), as amended, applicable to regulated investment companies. Accordingly, the Fund intends to distribute its taxable income and net realized gains, if any, to shareholders in accordance with
| | |
| 34 | | Legg Mason BW Diversified Large Cap Value Fund 2013 Annual Report |
timing requirements imposed by the Code. Therefore, no federal or state income tax provision is required in the Fund’s financial statements.
Management has analyzed the Fund’s tax positions taken on income tax returns for all open tax years and has concluded that as of September 30, 2013, no provision for income tax is required in the Fund’s financial statements. The Fund’s federal and state income and federal excise tax returns for tax years for which the applicable statutes of limitations have not expired are subject to examination by the Internal Revenue Service and state departments of revenue.
Under the applicable foreign tax law, a withholding tax may be imposed on interest, dividends and capital gains at various rates.
(j) Reclassification. GAAP requires that certain components of net assets be reclassified to reflect permanent differences between financial and tax reporting. These reclassifications have no effect on net assets or net asset values per share. During the current year, the Fund had no reclassifications.
2. Investment management agreement and other transactions with affiliates
Legg Mason Partners Fund Advisor, LLC (“LMPFA”) is the Fund’s investment manager and Brandywine Global Investment Management, LLC (“Brandywine Global”) is the Fund’s investment advisor. LMPFA and Brandywine Global are wholly-owned subsidiaries of Legg Mason, Inc. (“Legg Mason”).
Under the investment management agreement, the Fund pays an investment management fee, calculated daily and paid monthly, in accordance with the following breakpoint schedule:
| | | | |
| Average Daily Net Assets | | Annual Rate | |
| First $1 billion | | | 0.750 | % |
| Next $1 billion | | | 0.725 | |
| Next $3 billion | | | 0.700 | |
| Next $5 billion | | | 0.675 | |
| Over $10 billion | | | 0.650 | |
LMPFA provides administrative and certain oversight services to the Fund. LMPFA delegates to the investment adviser the day-to-day portfolio management of the Fund. For its services, LMPFA pays Brandywine Global 90% of the net management fee it receives from the Fund.
As a result of expense limitation arrangements between the Fund and LMPFA, the ratio of expenses other than interest, taxes, extraordinary expenses, brokerage commissions, dividend expense on short sales, and acquired fund fees and expenses, to average net assets of the Fund’s Class A, Class A2, Class C, Class I and Class IS shares did not exceed 1.30%, 1.50%, 2.05%, 0.95% and 0.85%, respectively. In addition, total annual fund operating expenses for Class IS shares did not exceed total annual fund operating expenses for Class I shares. These expense limitation arrangements cannot be terminated prior to December 31, 2014 without the Board of Trustees’ consent.
As a result of voluntary expense limitation arrangements, the ratio of expenses other than interest, brokerage commissions, dividend expense on short sales, taxes, extraordinary
| | |
| Legg Mason BW Diversified Large Cap Value Fund 2013 Annual Report | | 35 |
Notes to financial statements (cont’d)
expenses and acquired fund fees and expenses, to average net assets of the Fund’s Class A, Class A2, Class C and Class I shares did not exceed 1.10%, 1.30%, 1.85% and 0.85%, respectively. These arrangements are expected to continue until December 31, 2014, but may be terminated at any time by the investment manager.
During the year ended September 30, 2013, fees waived and/or expenses reimbursed amounted to $15,618.
The investment manager is permitted to recapture amounts waived or reimbursed to a class within three years after the fiscal year in which the investment manager earned the fee or incurred the expense if the class’ total annual operating expenses have fallen to a level below the expense limitation (“expense cap”) in effect at the time the fees were earned or the expenses incurred. In no case will the investment manager recapture any amount that would result, on any particular business day of the Fund, in the class’ total annual operating expenses exceeding the expense cap or any other lower limit then in effect.
Pursuant to these arrangements, at September 30, 2013, the Fund had remaining fee waivers and/or expense reimbursements subject to recapture by LMPFA and respective dates of expiration as follows:
| | | | | | | | | | | | | | | | | | | | |
| | | Class A | | | Class A2† | | | Class C | | | Class I | | | Class IS | |
| Expires September 30, 2014 | | $ | 136 | | | | — | | | $ | 98 | | | $ | 175 | | | $ | 56,503 | |
| Expires September 30, 2015 | | | 458 | | | | — | | | | 163 | | | | 462 | | | | — | |
| Expires September 30, 2016 | | | 5,705 | | | $ | 9 | | | | 601 | | | | 9,303 | | | | — | |
| Fee waivers/expense reimbursements subject to recapture | | $ | 6,299 | | | $ | 9 | | | $ | 862 | | | $ | 9,940 | | | $ | 56,503 | |
| † | For the period October 31, 2012 (inception date) to September 31, 2013. |
For the year ended September 30, 2013, LMPFA recaptured $4 and $34,646 for Class I and Class IS shares, respectively.
Legg Mason Investor Services, LLC (“LMIS”), a wholly-owned broker-dealer subsidiary of Legg Mason, serves as the Fund’s sole and exclusive distributor.
There is a maximum initial sales charge of 5.75% for Class A and Class A2 shares. There is a contingent deferred sales charge (“CDSC”) of 1.00% on Class C shares, which applies if redemption occurs within 12 months from purchase payment. In certain cases, Class A and Class A2 shares have a 1.00% CDSC, which applies if redemption occurs within 18 months from purchase payment. This CDSC only applies to those purchases of Class A and Class A2 shares, which, when combined with current holdings of other shares of funds sold by LMIS, equal or exceed $1,000,000 in the aggregate. These purchases do not incur an initial sales charge.
For the year ended September 30, 2013, LMIS and its affiliates retained sales charges of approximately $730 and $5,422 on sales of the Fund’s Class A and Class A2 shares, respectively. In addition, for the year ended September 30, 2013, CDSCs paid to LMIS and its affiliates were:
| | | | | | | | | | | | |
| | | Class A | | | Class A2 | | | Class C | |
| CDSCs | | | — | | | | — | | | $ | 7 | |
| | |
| 36 | | Legg Mason BW Diversified Large Cap Value Fund 2013 Annual Report |
Under a Deferred Compensation Plan (the “Plan”), Trustees may elect to defer receipt of all or a specified portion of their compensation. A participating Trustee may select one or more funds managed by affiliates of Legg Mason in which his or her deferred trustee’s fees will be deemed to be invested. Deferred amounts remain in the Fund until distributed in accordance with the Plan.
All officers and two Trustees of the Trust are employees of Legg Mason or its affiliates and do not receive compensation from the Trust.
As of September 30, 2013, Legg Mason and its affiliates owned 93.2% of the Fund.
3. Investments
During the year ended September 30, 2013, the aggregate cost of purchases and proceeds from sales of investments (excluding short-term investments) were as follows:
| | | | |
| Purchases | | $ | 309,763,295 | |
| Sales | | | 299,233,728 | |
At September 30, 2013, the aggregate gross unrealized appreciation and depreciation of investments for federal income tax purposes were as follows:
| | | | |
| Gross unrealized appreciation | | $ | 136,918,383 | |
| Gross unrealized depreciation | | | (1,546,572) | |
| Net unrealized appreciation | | $ | 135,371,811 | |
4. Derivative instruments and hedging activities
GAAP requires enhanced disclosure about an entity’s derivative and hedging activities.
During the year ended September 30, 2013, the Fund did not invest in any derivative instruments.
5. Class specific expenses, waivers and/or expense reimbursements
The Fund has adopted a Rule 12b-1 distribution plan and under that plan the Fund pays a service fee with respect to its Class A, Class A2 and Class C shares calculated at the annual rate of 0.25% of the average daily net assets of each respective class. The Fund also pays a distribution fee with respect to its Class C shares calculated at the annual rate of 0.75% of the average daily net assets of Class C shares. Service and distribution fees are accrued daily and paid monthly.
For the year ended September 30, 2013, class specific expenses were as follows:
| | | | | | | | |
| | | Service and/or
Distribution Fees | | | Transfer Agent
Fees | |
| Class A | | $ | 4,058 | | | $ | 5,839 | |
| Class A2† | | | 1,511 | | | | 1,051 | |
| Class C | | | 1,884 | | | | 629 | |
| Class I | | | — | | | | 9,894 | |
| Class IS | | | — | | | | 7,718 | |
| Total | | $ | 7,453 | | | $ | 25,131 | |
| † | For the period October 31, 2012 (inception date) to September 30, 2013. |
| | |
| Legg Mason BW Diversified Large Cap Value Fund 2013 Annual Report | | 37 |
Notes to financial statements (cont’d)
For the year ended September 30, 2013, waivers and/or expense reimbursements by class were as follows:
| | | | |
| | | Waivers/Expense
Reimbursements | |
| Class A | | $ | 5,705 | |
| Class A2† | | | 9 | |
| Class C | | | 601 | |
| Class I | | | 9,303 | |
| Class IS | | | — | |
| Total | | $ | 15,618 | |
| † | For the period October 31, 2012 (inception date) to September 30, 2013. |
6. Distributions to shareholders by class
| | | | | | | | |
| | | Year Ended
September 30, 2013 | | | Year Ended
September 30, 2012 | |
| Net Investment Income: | | | | | | | | |
| Class A | | $ | 19,891 | | | $ | 1,184 | |
| Class A2† | | | 2,136 | | | | — | |
| Class C | | | 1,750 | | | | — | |
| Class I | | | 72,675 | | | | 1,244 | |
| Class IS | | | 10,403,565 | | | | 4,997,579 | |
| Total | | $ | 10,500,017 | | | $ | 5,000,007 | |
| | |
| Net Realized Gains: | | | | | | | | |
| Class A | | $ | 36,970 | | | $ | 2,393 | |
| Class A2† | | | 3,718 | | | | — | |
| Class C | | | 6,008 | | | | 1,537 | |
| Class I | | | 125,495 | | | | 946 | |
| Class IS | | | 18,007,215 | | | | 6,057,250 | |
| Total | | $ | 18,179,406 | | | $ | 6,062,126 | |
| † | For the period October 31, 2012 (inception date) to September 30, 2013. |
7. Shares of beneficial interest
At September 30, 2013, the Trust had an unlimited number of shares of beneficial interest authorized with a par value of $0.00001 per share. The Fund has the ability to issue multiple classes of shares. Each class of shares represents an identical interest and has the same rights, except that each class bears certain direct expenses, including those specifically related to the distribution of its shares.
| | |
| 38 | | Legg Mason BW Diversified Large Cap Value Fund 2013 Annual Report |
Transactions in shares of each class were as follows:
| | | | | | | | | | | | | | | | |
| | | Year Ended
September 30, 2013 | | | Year Ended
September 30, 2012 | |
| | | Shares | | | Amount | | | Shares | | | Amount | |
| Class A | | | | | | | | | | | | | | | | |
| Shares sold | | | 207,440 | | | $ | 3,524,567 | | | | 29,896 | | | $ | 461,767 | |
| Shares issued on reinvestment | | | 3,724 | | | | 56,861 | | | | 256 | | | | 3,577 | |
| Shares repurchased | | | (81,138) | | | | (1,427,220) | | | | (1,756) | | | | (25,808) | |
| Net increase | | | 130,026 | | | $ | 2,154,208 | | | | 28,396 | | | $ | 439,536 | |
| | | | |
| Class A2† | | | | | | | | | | | | | | | | |
| Shares sold | | | 80,206 | | | $ | 1,345,581 | | | | — | | | | — | |
| Shares issued on reinvestment | | | 383 | | | | 5,854 | | | | — | | | | — | |
| Shares repurchased | | | (9,961) | | | | (174,467) | | | | — | | | | — | |
| Net increase | | | 70,628 | | | $ | 1,176,968 | | | | — | | | | — | |
| | | | |
| Class C | | | | | | | | | | | | | | | | |
| Shares sold | | | 1,117 | | | $ | 19,072 | | | | 7,405 | | | $ | 107,777 | |
| Shares issued on reinvestment | | | 509 | | | | 7,758 | | | | 111 | | | | 1,537 | |
| Shares repurchased | | | (1,364) | | | | (22,192) | | | | (2,142) | | | | (31,564) | |
| Net increase | | | 262 | | | $ | 4,638 | | | | 5,374 | | | $ | 77,750 | |
| | | | |
| Class I | | | | | | | | | | | | | | | | |
| Shares sold | | | 96,223 | | | $ | 1,549,989 | | | | 183,342 | | | $ | 2,807,735 | |
| Shares issued on reinvestment | | | 9,607 | | | | 146,508 | | | | 158 | | | | 2,190 | |
| Shares repurchased | | | (73,416) | | | | (1,272,659) | | | | (1,656) | | | | (24,177) | |
| Net increase | | | 32,414 | | | $ | 423,838 | | | | 181,844 | | | $ | 2,785,748 | |
| | | | |
| Class IS | | | | | | | | | | | | | | | | |
| Shares sold | | | 7,632,021 | | | $ | 131,767,602 | | | | 3,479,157 | | | $ | 51,595,750 | |
| Shares issued on reinvestment | | | 1,861,781 | | | | 28,410,780 | | | | 793,544 | | | | 11,054,829 | |
| Shares repurchased | | | (5,000,932) | | | | (84,796,994) | | | | (7,060,214) | | | | (102,951,310) | |
| Net increase (decrease) | | | 4,492,870 | | | $ | 75,381,388 | | | | (2,787,513) | | | $ | (40,300,731) | |
| † | For the period October 31, 2012 (inception date) to September 30, 2013. |
8. Income tax information and distributions to shareholders
The tax character of distributions paid during the fiscal years ended September 30, was as follows:
| | | | | | | | |
| | | 2013 | | | 2012 | |
| Distributions Paid From: | | | | | | | | |
| Ordinary income | | $ | 19,478,170 | | | $ | 10,698,155 | |
| Net long-term capital gains | | | 9,201,253 | | | | 363,978 | |
| Total taxable distributions | | $ | 28,679,423 | | | $ | 11,062,133 | |
| | |
| Legg Mason BW Diversified Large Cap Value Fund 2013 Annual Report | | 39 |
Notes to financial statements (cont’d)
As of September 30, 2013, the components of accumulated earnings on a tax basis were as follows:
| | | | |
| Undistributed ordinary income — net | | $ | 13,459,593 | |
| Undistributed long-term capital gains — net | | | 24,094,592 | |
| Total undistributed earnings | | $ | 37,554,185 | |
| Other book/tax temporary differences(a) | | | (62,175) | |
| Unrealized appreciation (depreciation)(b) | | | 135,371,811 | |
| Total accumulated earnings (losses) — net | | $ | 172,863,821 | |
| (a) | Other book/tax temporary differences are attributable primarily to book/tax differences in the timing of the deductibility of various expenses. |
| (b) | The difference between book-basis and tax-basis unrealized appreciation (depreciation) is attributable primarily to the tax deferral of losses on wash sales. |
9. Line of credit
The Fund, along with certain other Legg Mason Funds, participated in a $200 million line of credit (“Credit Agreement”) to be used for temporary or emergency purposes. This 364-day revolving Credit Agreement matured on February 28, 2013. Pursuant to the Credit Agreement, each participating fund was liable only for principal and interest payments related to borrowings made by that fund. Borrowings under the Credit Agreement bore interest at a rate equal to the prevailing LIBOR rate plus the LIBOR rate margin. The Fund did not utilize the line of credit during the period ended February 28, 2013. The Fund did not renew the Credit Agreement.
| | |
| 40 | | Legg Mason BW Diversified Large Cap Value Fund 2013 Annual Report |
Report of independent registered public accounting firm
To the Board of Trustees of Legg Mason Global Asset Management Trust and Shareholders of Legg Mason BW Diversified Large Cap Value Fund:
In our opinion, the accompanying statement of assets and liabilities, including the schedule of investments, and the related statements of operations and of changes in net assets and the financial highlights present fairly, in all material respects, the financial position of Legg Mason BW Diversified Large Cap Value Fund (one of the funds comprising Legg Mason Global Asset Management Trust, the “Fund”) at September 30, 2013, the results of its operations, the changes in its net assets, and the financial highlights for the periods presented, in conformity with accounting principles generally accepted in the United States of America. These financial statements and financial highlights (hereafter referred to as “financial statements”) are the responsibility of the Fund’s management; our responsibility is to express an opinion on these financial statements based on our audits. We conducted our audits of these financial statements in accordance with the standards of the Public Company Accounting Oversight Board (United States). Those standards require that we plan and perform the audit to obtain reasonable assurance about whether the financial statements are free of material misstatement. An audit includes examining, on a test basis, evidence supporting the amounts and disclosures in the financial statements, assessing the accounting principles used and significant estimates made by management, and evaluating the overall financial statement presentation. We believe that our audits, which included confirmation of securities at September 30, 2013 by correspondence with the custodian and brokers, provide a reasonable basis for our opinion.
PricewaterhouseCoopers LLP
Baltimore, Maryland
November 18, 2013
| | |
| Legg Mason BW Diversified Large Cap Value Fund 2013 Annual Report | | 41 |
Additional information (unaudited)
Information about Trustees and Officers
The business and affairs of Legg Mason BW Diversified Large Cap Value Fund (the “Fund”) are conducted by management under the supervision and subject to the direction of its Board of Trustees. The business address of each Trustee is c/o Kenneth D. Fuller, 100 International Drive, 5th Floor, Baltimore, Maryland 21202. Information pertaining to the Trustees and officers of the Fund is set forth below.
The Statement of Additional Information includes additional information about Trustees and is available, without charge, upon request by calling the Fund at 1-877-721-1926.
| | |
| Independent Trustees1 |
| Ruby P. Hearn |
| Year of birth | | 1940 |
| Position(s) with Trust | | Trustee |
| Term of office and length of time served2 | | Since 2009 |
| Principal occupation(s) during past five years | | Senior Vice President Emerita of The Robert Wood Johnson Foundation (non-profit) since 2001; Member of the Institute of Medicine since 1982; formerly: Trustee of the New York Academy of Medicine (2004 to 2012); Director of the Institute for Healthcare Improvement (2002 to 2012); Senior Vice President of The Robert Wood Johnson Foundation (1996 to 2001); Fellow of The Yale Corporation (1992 to 1998). |
| Number of funds in fund complex overseen by Trustee | | 15 |
| Other board memberships held by Trustee during past five years | | None |
|
| Arnold L. Lehman |
| Year of birth | | 1944 |
| Position(s) with Trust | | Lead Independent Trustee |
| Term of office and length of time served2 | | Since 2009 |
| Principal occupation(s) during past five years | | Director of the Brooklyn Museum since 1997; Trustee of American Federation of Arts since 1998. Formerly: Director of The Baltimore Museum of Art (1979 to 1997). |
| Number of funds in fund complex overseen by Trustee | | 15 |
| Other board memberships held by Trustee during past five years | | None |
|
| Robin J.W. Masters |
| Year of birth | | 1955 |
| Position(s) with Trust | | Trustee |
| Term of office and length of time served2 | | Since 2009 |
| Principal occupation(s) during past five years | | Retired; formerly: Chief Investment Officer of ACE Limited (insurance) (1986 to 2000). |
| Number of funds in fund complex overseen by Trustee | | 15 |
| Other board memberships held by Trustee during past five years | | Director of Cheyne Capital International Limited (investment advisory firm). Formerly, Director/Trustee of Legg Mason Institutional Funds plc, WAFixed Income Funds plc and Western Asset Debt Securities Fund plc. (2007 to 2011) |
| | |
| 42 | | Legg Mason BW Diversified Large Cap Value Fund |
| | |
| Independent Trustees1 cont’d |
| Jill E. McGovern |
| Year of birth | | 1944 |
| Position(s) with Trust | | Trustee |
| Term of office and length of time served2 | | Since 2009 |
| Principal occupation(s) during past five years | | Senior Consultant, American Institute for Contemporary German Studies (AICGS) since 2007; formerly: Chief Executive Officer of The Marrow Foundation (non-profit) (1993 to 2007); Executive Director of the Baltimore International Festival (1991 to 1993); Senior Assistant to the President of The Johns Hopkins University (1986 to 1990). |
| Number of funds in fund complex overseen by Trustee | | 15 |
| Other board memberships held by Trustee during past five years | | Director of International Biomedical Research Alliance; Director of Lois Roth Endowment |
|
| Arthur S. Mehlman |
| Year of birth | | 1942 |
| Position(s) with Trust | | Trustee |
| Term of office and length of time served2 | | Since 2009 |
| Principal occupation(s) during past five years | | Retired. Director, The University of Maryland Foundation since 1992; Director, The League for People with Disabilities since 2003; formerly: Director, Municipal Mortgage & Equity LLC (2004 to 2011); Partner, KPMG LLP (international accounting firm) (1972 to 2002). |
| Number of funds in fund complex overseen by Trustee | | Director/Trustee of all Legg Mason Funds consisting of 15 portfolios; Director/Trustee of the Royce Family of Funds consisting of 35 portfolios. |
| Other board memberships held by Trustee during past five years | | Director of Municipal Mortgage & Equity, LLC. (2004 to 2011) |
|
| G. Peter O’Brien |
| Year of birth | | 1945 |
| Position(s) with Trust | | Trustee |
| Term of office and length of time served2 | | Since 2009 |
| Principal occupation(s) during past five years | | Retired. Trustee Emeritus of Colgate University; Board Member, Hill House, Inc. (residential home care); Board Member, Bridges School (pre- school); formerly: Managing Director, Equity Capital Markets Group of Merrill Lynch & Co. (1971-1999). |
| Number of funds in fund complex overseen by Trustee | | Director/Trustee of all Legg Mason funds consisting of 15 portfolios; Director/Trustee of the Royce Family of Funds consisting of 35 portfolios. |
| Other board memberships held by Trustee during past five years | | Director of Ticc Investment Capital Corp. |
| | |
| Legg Mason BW Diversified Large Cap Value Fund | | 43 |
Additional information (unaudited) (cont’d)
Information about Trustees and Officers
| | |
| Independent Trustees1 cont’d |
| S. Ford Rowan |
| Year of birth | | 1943 |
| Position(s) with Trust | | Trustee |
| Term of office and length of time served2 | | Since 2009 |
| Principal occupation(s) during past five years | | Chairman, National Center for Critical Incident Analysis, National Defense University Foundation, since 2004; Trustee, St. John’s College, since 2006; formerly: Consultant, Rowan & Blewitt Inc. (management consulting) (1984 to 2007); Lecturer in Journalism, Northwestern University (1980 to 1993); Lecturer in Organizational Sciences, George Washington University (2000 to 2008); Director, Santa Fe Institute (1999 to 2008). |
| Number of funds in fund complex overseen by Trustee | | 15 |
| Other board memberships held by Trustee during past five years | | None |
|
| Robert M. Tarola |
| Year of birth | | 1950 |
| Position(s) with Trust | | Trustee |
| Term of office and length of time served2 | | Since 2009 |
| Principal occupation(s) during past five years | | President of Right Advisory LLC (corporate finance and governance consulting) since 2008; Member, Investor Advisory Group of the Public Company Accounting Oversight Board since 2009; formerly Senior Vice President and Chief Financial Officer of The Howard University (2009 to 2013) (higher education and health care); Senior Vice President and Chief Financial Officer of W.R. Grace & Co. (specialty chemicals) (1999 to 2008) and MedStar Health, Inc. (healthcare) (1996 to 1999); Partner, Price Waterhouse, LLP (accounting and auditing) (1984 to 1996). |
| Number of funds in fund complex overseen by Trustee | | 15 |
| Other board memberships held by Trustee during past five years | | Director of TeleTech Holdings, Inc. (business process outsourcing); Director of American Kidney Fund (renal disease assistance) |
| | |
| Interested Trustees3 |
Jennifer W. Murphy | | |
| Year of birth | | 1964 |
| Position(s) with Trust | | Trustee and Chair |
| Term of office and length of time served2 | | Since 2013 |
| Principal occupation(s) during past five years | | Executive Vice President and Chief Administrative Officer of Legg Mason, Inc. (since 2013); formerly: Chief Operations Officer of LMM LLC (1999 to 2013); President and CEO of Legg Mason Capital Management, LLC (“LMCM”) and Manager of LMCM and predecessors (1998 to 2013). |
| Number of funds in fund complex overseen by Trustee | | 15 |
| Other board memberships held by Trustee during past five years | | None |
| | |
| 44 | | Legg Mason BW Diversified Large Cap Value Fund |
| | |
| Interested Trustees3 cont’d |
| Kenneth D. Fuller | | |
| Year of birth | | 1958 |
| Position(s) with Trust | | Trustee, President and Chief Executive Officer |
| Term of office1 and length of time served2 | | Since 2013 |
| Principal occupation(s) during past five years | | Managing Director of Legg Mason & Co., LLC (“Legg Mason & Co.”) (since 2013); Officer and/or Trustee/Director of 167 funds associated with Legg Mason Partners Fund Advisor, LLC (“LMPFA”) or its affiliates (since 2013); President and Chief Executive Officer of LM Asset Services, LLC (“LMAS”) and Legg Mason Fund Asset Management, Inc. (“LMFAM”) (formerly registered investment advisers) (since 2013); formerly, Senior Vice President of LMPFA (2012 to 2013); formerly, Director of Legg Mason & Co. (2012 to 2013); formerly, Vice President of Legg Mason & Co. (2009 to 2012); formerly, Vice President — Equity Division of T. Rowe Price Associates (1993 to 2009), as well as Investment Analyst and Portfolio Manager for certain asset allocation accounts (2004 to 2009) |
| Number of funds in fund complex overseen by Trustee | | 156 |
| Other board memberships held by Trustee | | None |
| Executive Officers |
| |
Richard F. Sennett Legg Mason 100 International Drive, 7th Floor, Baltimore, MD 21202 | | |
| Year of birth | | 1970 |
| Position(s) with Trust | | Principal Financial Officer |
| Term of office and length of time served2 | | Since 2011 |
| Principal occupation(s) during past five years | | Principal Financial Officer of certain mutual funds associated with Legg Mason & Co. or its affiliates (since 2011); Managing Director of Legg Mason & Co. and Senior Manager of the Treasury Policy group for Legg Mason & Co.’s Global Fiduciary Platform (since 2011); formerly, Chief Accountant within the SEC’s Division of Investment Management (2007 to 2011); formerly, Assistant Chief Accountant within the SEC’s Division of Investment Management (2002 to 2007) |
| |
Robert I. Frenkel Legg Mason 100 First Stamford Place, 6th Floor, Stamford, CT 06902 | | |
| Year of birth | | 1954 |
| Position(s) with Trust | | Secretary and Chief Legal Officer |
| Term of office and length of time served2 | | Since 2009 |
| Principal occupation(s) during past five years | | Vice President and Deputy General Counsel of Legg Mason (since 2006); Managing Director and General Counsel of Global Mutual Funds for Legg Mason & Co. (since 2006) and Legg Mason & Co. predecessors (since 1994); Secretary and Chief Legal Officer of certain mutual funds associated with Legg Mason & Co. or its affiliates (since 2006) and Legg Mason & Co. predecessors (prior to 2006) |
| | |
| Legg Mason BW Diversified Large Cap Value Fund | | 45 |
Additional information (unaudited) (cont’d)
Information about Trustees and Officers
| | |
| Executive Officers cont’d |
Ted P. Becker Legg Mason 620 Eighth Avenue, 49th Floor, New York, NY 10018 | | |
| Year of birth | | 1951 |
| Position(s) with Trust | | Vice President and Chief Compliance Officer |
| Term of office and length of time served2 | | Since 2009 |
| Principal occupation(s) during past five years | | Director of Global Compliance at Legg Mason (since 2006); Chief Compliance Officer of LMPFA (since 2006); Managing Director of Compliance of Legg Mason & Co. (since 2005); Chief Compliance Officer of certain mutual funds associated with Legg Mason & Co. or its affiliates (since 2006) and Legg Mason & Co. predecessors (prior to 2006) |
| |
Christopher Berarducci Legg Mason 620 Eighth Avenue, 49th Floor, New York, NY 10018 | | |
| Year of birth | | 1974 |
| Position(s) with Trust | | Treasurer |
| Term of office and length of time served2 | | Since 2010 |
| Principal occupation(s) during past five years | | Vice President of Legg Mason & Co. (since 2011); Treasurer of certain mutual funds associated with Legg Mason & Co. or its affiliates (since 2010); formerly, Assistant Controller of certain mutual funds associated with Legg Mason & Co. or its affiliates (prior to 2010); formerly, Manager of Fund Administration at UBS Global Asset Management (prior to 2007) |
| 1 | Trustees who are not “interested persons” of the Fund within the meaning of Section 2(a)(19) of the 1940 Act. Each of the Independent Trustees serves on the standing committees of the Board of Trustees, which include the Audit Committee (chair: Arthur S. Mehlman), the Nominating Committee (co-chairs: G. Peter O’Brien and Jill E. McGovern), and the Independent Trustees Committee (chair: Arnold L. Lehman). |
| 2 | Officers of the Trust are elected to serve until their successors are elected and qualified. Trustees of the Trust serve a term of indefinite length until their retirement, in accordance with the Board’s retirement policy, resignation or removal, and stand for re-election by shareholders only as and when required by the 1940 Act. |
| 3 | Effective June 1, 2013, Ms. Murphy was appointed to the position of Trustee and Chair and Mr. Fuller was appointed to the position of Trustee, President and Chief Executive Officer. Prior to this date, R. Jay Gerken served as Chairman, President and Chief Executive Officer, Mr. Gerken retired May 31, 2013. Ms. Murphy and Mr. Fuller are considered to be interested persons, as defined in the 1940 Act, of the Fund on the basis of their current employment with the Fund’s investment adviser or its affiliated entities (including the Fund’s principal underwriter) and Legg Mason, Inc., the parent holding company of these entities as well as their ownership of Legg Mason, Inc. stock. |
| | |
| 46 | | Legg Mason BW Diversified Large Cap Value Fund |
Important tax information (unaudited)
The following information is provided with respect to the distributions paid during the taxable year ended September 30, 2013:
| | | | |
| Record date: | | | 12/11/2012 | |
| Payable date: | | | 12/12/2012 | |
| Ordinary income: | | | | |
Qualified dividend income for individuals | | | 73.58 | % |
Dividends qualifying for the dividends received deduction for corporations | | | 71.57 | % |
| Long-term capital gain dividend | | $ | 0.283750 | |
Please retain this information for your records.
| | |
| Legg Mason BW Diversified Large Cap Value Fund | | 47 |
Legg Mason BW
Diversified Large Cap Value Fund
Trustees
Kenneth D. Fuller*
President
Ruby P. Hearn
Arnold L. Lehman
Robin J.W. Masters
Jill E. McGovern
Arthur S. Mehlman
Jennifer W. Murphy*
Chair
G. Peter O’Brien
S. Ford Rowan
Robert M. Tarola
Investment manager
Legg Mason Partners Fund Advisor, LLC
Investment adviser
Brandywine Global Investment Management, LLC
Distributor
Legg Mason Investor Services, LLC
Custodian
State Street Bank and Trust Company
Co-transfer agents
Boston Financial Data Services, Inc.
2000 Crown Colony Drive
Quincy, MA 02169
BNY Mellon Asset Servicing
4400 Computer Drive
Westborough, MA 01581
Independent registered public accounting firm
PricewaterhouseCoopers LLP
Baltimore, MD
| * | Effective June 1, 2013, Ms. Murphy became a Trustee and Chair and Mr. Fuller became a Trustee, President and Chief Executive Officer. |
Legg Mason BW Diversified Large Cap Value Fund
The Fund is a separate investment series of Legg Mason Global Asset Management Trust, a Maryland statutory trust.
Legg Mason BW Diversified Large Cap Value Fund
Legg Mason Funds
620 Eighth Avenue, 49th Floor
New York, NY 10018
The Fund files its complete schedule of portfolio holdings with the Securities and Exchange Commission (“SEC”) for the first and third quarters of each fiscal year on Form N-Q. The Fund’s Forms N-Q are available on the SEC’s website at www.sec.gov. The Fund’s Forms N-Q may be reviewed and copied at the SEC’s Public Reference Room in Washington, D.C., and information on the operation of the Public Reference Room may be obtained by calling 1-800-SEC-0330. To obtain information on Form N-Q, shareholders can call the Fund at 1-877-721-1926.
Information on how the Fund voted proxies relating to portfolio securities during the prior 12-month period ended June 30th of each year and a description of the policies and procedures that the Fund uses to determine how to vote proxies relating to portfolio transactions are available (1) without charge, upon request, by calling the Fund at 1-877-721-1926, (2) on the Fund’s website at www.leggmason.com/individualinvestors and (3) on the SEC’s website at www.sec.gov.
This report is submitted for the general information of the shareholders of Legg Mason BW Diversified Large Cap Value Fund. This report is not authorized for distribution to prospective investors in the Fund unless preceded or accompanied by a current prospectus.
Investors should consider the Fund’s investment objectives, risks, charges and expenses carefully before investing. The prospectus contains this and other important information about the Fund. Please read the prospectus carefully before you invest.
www.leggmason.com/individualinvestors
©2013 Legg Mason Investor Services, LLC
Member FINRA, SIPC
Legg Mason Funds Privacy and Security Notice
Your Privacy and the Security of Your Personal Information is Very Important to the Legg Mason Funds
This Privacy and Security Notice (the “Privacy Notice”) addresses the Legg Mason Funds’ privacy and data protection practices with respect to nonpublic personal information the Funds receive. The Legg Mason Funds include any funds sold by the Funds’ distributor, Legg Mason Investor Services, LLC, as well as Legg Mason-sponsored closed-end funds and certain closed-end funds managed or sub-advised by Legg Mason or its affiliates. The provisions of this Privacy Notice apply to your information both while you are a shareholder and after you are no longer invested with the Funds.
The Type of Nonpublic Personal Information the Funds Collect About You
The Funds collect and maintain nonpublic personal information about you in connection with your shareholder account. Such information may include, but is not limited to:
| Ÿ | | Personal information included on applications or other forms; |
| Ÿ | | Account balances, transactions, and mutual fund holdings and positions; |
| Ÿ | | Online account access user IDs, passwords, security challenge question responses; and |
| Ÿ | | Information received from consumer reporting agencies regarding credit history and creditworthiness (such as the amount of an individual’s total debt, payment history, etc.). |
How the Funds Use Nonpublic Personal Information About You
The Funds do not sell or share your nonpublic personal information with third parties or with affiliates for their marketing purposes, or with other financial institutions or affiliates for joint marketing purposes, unless you have authorized the Funds to do so. The Funds do not disclose any nonpublic personal information about you except as may be required to perform transactions or services you have authorized or as permitted or required by law. The Funds may disclose information about you to:
| Ÿ | | Employees, agents, and affiliates on a “need to know” basis to enable the Funds to conduct ordinary business or comply with obligations to government regulators; |
| Ÿ | | Service providers, including the Funds’ affiliates, who assist the Funds as part of the ordinary course of business (such as printing, mailing services, or processing or servicing your account with us) or otherwise perform services on the Funds’ behalf, including companies that may perform marketing services solely for the Funds; |
| Ÿ | | The Funds’ representatives such as legal counsel, accountants and auditors; and |
| Ÿ | | Fiduciaries or representatives acting on your behalf, such as an IRA custodian or trustee of a grantor trust. |
|
| NOT PART OF THE ANNUAL REPORT |
Legg Mason Funds Privacy and Security Notice (cont’d)
Except as otherwise permitted by applicable law, companies acting on the Funds’ behalf are contractually obligated to keep nonpublic personal information the Funds provide to them confidential and to use the information the Funds share only to provide the services the Funds ask them to perform.
The Funds may disclose nonpublic personal information about you when necessary to enforce their rights or protect against fraud, or as permitted or required by applicable law, such as in connection with a law enforcement or regulatory request, subpoena, or similar legal process. In the event of a corporate action or in the event a Fund service provider changes, the Funds may be required to disclose your nonpublic personal information to third parties. While it is the Funds’ practice to obtain protections for disclosed information in these types of transactions, the Funds cannot guarantee their privacy policy will remain unchanged.
Keeping You Informed of the Funds’ Privacy and Security Practices
The Funds will notify you annually of their privacy policy as required by federal law. While the Funds reserve the right to modify this policy at any time they will notify you promptly if this privacy policy changes.
The Funds’ Security Practices
The Funds maintain appropriate physical, electronic and procedural safeguards designed to guard your nonpublic personal information. The Funds’ internal data security policies restrict access to your nonpublic personal information to authorized employees, who may use your nonpublic personal information for Fund business purposes only.
Although the Funds strive to protect your nonpublic personal information, they cannot ensure or warrant the security of any information you provide or transmit to them, and you do so at your own risk. In the event of a breach of the confidentiality or security of your nonpublic personal information, the Funds will attempt to notify you as necessary so you can take appropriate protective steps. If you have consented to the Funds using electronic communications or electronic delivery of statements, they may notify you under such circumstances using the most current email address you have on record with them.
In order for the Funds to provide effective service to you, keeping your account information accurate is very important. If you believe that your account information is incomplete, not accurate or not current, or if you have questions about the Funds’ privacy practices, write the Funds using the contact information on your account statements, email the Funds by clicking on the Contact Us section of the Funds’ website at www.leggmason.com, or contact the Fund at 1-877-721-1926.
Revised April 2011
|
| NOT PART OF THE ANNUAL REPORT |
www.leggmason.com/individualinvestors
©2013 Legg Mason Investor Services, LLC Member FINRA, SIPC
LMFX012987 11/13 SR13-2061
| | The registrant has adopted a code of ethics that applies to the registrant’s principal executive officer, principal financial officer, principal accounting officer or controller. |
| ITEM 3. | AUDIT COMMITTEE FINANCIAL EXPERT. |
| | The Board of Trustees of the registrant has determined that Arthur S. Mehlman the Chairman of the Board’s Audit Committee and Robert M. Tarola, possess the technical attributes identified in Instruction 2(b) of Item 3 to Form N-CSR to qualify as “audit committee financial experts,” and have designated Mr. Mehlman and Mr. Tarola as the Audit Committee’s financial experts. Mr. Mehlman and Mr. Tarola are “independent” Trustees pursuant to paragraph (a) (2) of Item 3 to Form N-CSR. |
| ITEM 4. | PRINCIPAL ACCOUNTANT FEES AND SERVICES. |
| | a) Audit Fees. The aggregate fees billed in the last two fiscal years ending September 30, 2012 and September 30, 2013 (the “Reporting Periods”) for professional services rendered by the Registrant’s principal accountant (the “Auditor”) for the audit of the Registrant’s annual financial statements, or services that are normally provided by the Auditor in connection with the statutory and regulatory filings or engagements for the Reporting Periods, were $84,600 in 2012 and $28,200 in 2013. |
| | b) Audit-Related Fees. The aggregate fees billed in the Reporting Period for assurance and related services by the Auditor that are reasonably related to the performance of the Registrant’s financial statements were $0 in 2012 and $4,250 in 2013. These services consisted of procedures performed in connection with the Re-domiciliation of the various reviews of Prospectus supplements, and consent issuances related to the N-1A filings for the Legg Mason Global Asset Management Trust. |
| | In addition, there were no Audit-Related Fees billed in the Reporting Period for assurance and related services by the Auditor to the Registrant’s investment adviser (not including any sub-adviser whose role is primarily portfolio management and is subcontracted with or overseen by another investment adviser), and any entity controlling, controlled by or under common control with the investment adviser that provides ongoing services to the Legg Mason Global Asset Management Trust (“service affiliates”), that were reasonably related to the performance of the annual audit of the service affiliates. Accordingly, there were no such fees that required pre-approval by the Audit Committee for the Reporting Periods. |
| | (c) Tax Fees. The aggregate fees billed in the Reporting Periods for professional services rendered by the Auditor for tax compliance, tax advice and tax planning (“Tax Services”) were $11,100 in 2012 and $3,700 in 2013. These services consisted of (i) review or preparation of U.S. federal, state, local and excise tax returns; (ii) U.S. federal, state and local tax planning, advice and assistance regarding statutory, regulatory or administrative developments, and (iii) tax advice regarding tax qualification matters and/or treatment of various financial instruments held or proposed to be acquired or held. |
| | There were no fees billed for tax services by the Auditors to service affiliates during the Reporting Periods that required pre-approval by the Audit Committee. |
| | d) All Other Fees. The aggregate fees for other fees billed in the Reporting Periods for products and services provided by the Auditor were $1,494 in 2012 and $694 in 2013, other than the services reported in paragraphs (a) through (c) of this Item for the Legg Mason Global Asset Management Trust. |
| | All Other Fees. There were no other non-audit services rendered by the Auditor to Legg Mason Partners Fund Advisors, LLC (“LMPFA”), and any entity controlling, controlled by or under common control with LMPFA that provided ongoing services to Legg Mason Global Asset Management Trust requiring pre-approval by the Audit Committee in the Reporting Period. |
| | (e) Audit Committee’s pre–approval policies and procedures described in paragraph (c) |
| | (7) of Rule 2-01 of Regulation S-X. |
| | (1) The Charter for the Audit Committee (the “Committee”) of the Board of each registered investment company (the “Fund”) advised by LMPFA or one of their affiliates (each, an “Adviser”) requires that the Committee shall approve (a) all audit and permissible non-audit services to be provided to the Fund and (b) all permissible non-audit services to be provided by the Fund’s independent auditors to the Adviser and any Covered Service Providers if the engagement relates directly to the operations and financial reporting of the Fund. The Committee may implement policies and procedures by which such services are approved other than by the full Committee. |
| | The Committee shall not approve non-audit services that the Committee believes may impair the independence of the auditors. As of the date of the approval of this Audit Committee Charter, permissible non-audit services include any professional services (including tax services), that are not prohibited services as described below, provided to the Fund by the independent auditors, other than those provided to the Fund in connection with an audit or a review of the financial statements of the Fund. Permissible non-audit services may not include: (i) bookkeeping or other services related to the accounting records or financial statements of the Fund; (ii) financial information systems design and implementation; (iii) appraisal or valuation services, fairness opinions or contribution-in-kind reports; (iv) actuarial services; (v) internal audit outsourcing services; (vi) management functions or human resources; (vii) broker or dealer, investment adviser or investment banking services; (viii) legal services and expert services unrelated to the audit; and (ix) any other service the Public Company Accounting Oversight Board determines, by regulation, is impermissible. |
| | Pre-approval by the Committee of any permissible non-audit services is not required so long as: (i) the aggregate amount of all such permissible non-audit services provided to the Fund, the Adviser |
| | and any service providers controlling, controlled by or under common control with the Adviser that provide ongoing services to the Fund (“Covered Service Providers”) constitutes not more than 5% of the total amount of revenues paid to the independent auditors during the fiscal year in which the permissible non-audit services are provided to (a) the Fund, (b) the Adviser and (c) any entity controlling, controlled by or under common control with the Adviser that provides ongoing services to the Fund during the fiscal year in which the services are provided that would have to be approved by the Committee; (ii) the permissible non-audit services were not recognized by the Fund at the time of the engagement to be non-audit services; and (iii) such services are promptly brought to the attention of the Committee and approved by the Committee (or its delegate(s)) prior to the completion of the audit. |
| | (2) For the Legg Mason Global Asset Management Trust, the percentage of fees that were approved by the audit committee, with respect to: Audit-Related Fees were 100% and 100% for 2012 and 2013; Tax Fees were 100% and 100% for 2012 and 2013; and Other Fees were 100% and 100% for 2012 and 2013. |
| | (g) Non-audit fees billed by the Auditor for services rendered to Legg Mason Global Asset Management Trust, LMPFA and any entity controlling, controlled by, or under common control with LMPFA that provides ongoing services to Legg Mason Global Asset Management Trust during the reporting period were $11,100 in 2012 and $3,700 in 2013. |
| | (h) Yes. Legg Mason Global Asset Management Trust’s Audit Committee has considered whether the provision of non-audit services that were rendered to Service Affiliates, which were not pre-approved (not requiring pre-approval), is compatible with maintaining the Accountant’s independence. All services provided by the Auditor to the Legg Mason Global Asset Management Trust or to Service Affiliates, which were required to be pre-approved, were pre-approved as required. |
| ITEM 5. | AUDIT COMMITTEE OF LISTED REGISTRANTS. |
| | a) | The independent board members are acting as the registrant’s audit committee as specified in Section 3(a)(58)(B) of the Exchange Act .The Audit Committee consists of the following Board members: |
Ruby P. Hearn
Arnold L. Lehman
Robin J.W. Masters
Jill E. McGovern
Arthur S. Mehlman
G. Peter O’Brien
S. Ford Rowan
Robert M. Tarola
| ITEM 6. | SCHEDULE OF INVESTMENTS. |
| | Included herein under Item 1. |
| ITEM 7. | DISCLOSURE OF PROXY VOTING POLICIES AND PROCEDURES FOR CLOSED-END MANAGEMENT INVESTMENT COMPANIES. |
| ITEM 8. | PORTFOLIO MANAGERS OF CLOSED-END MANAGEMENT INVESTMENT COMPANIES. |
| ITEM 9. | PURCHASES OF EQUITY SECURITIES BY CLOSED-END MANAGEMENT INVESTMENT COMPANY AND AFFILIATED PURCHASERS. |
| ITEM 10. | SUBMISSION OF MATTERS TO A VOTE OF SECURITY HOLDERS. |
| ITEM 11. | CONTROLS AND PROCEDURES. |
| | (a) | The registrant’s principal executive officer and principal financial officer have concluded that the registrant’s disclosure controls and procedures (as defined in Rule 30a- 3(c) under the Investment Company Act of 1940, as amended (the “1940 Act”)) are effective as of a date within 90 days of the filing date of this report that includes the disclosure required by this paragraph, based on their evaluation of the disclosure controls and procedures required by Rule 30a-3(b) under the 1940 Act and 15d-15(b) under the Securities Exchange Act of 1934. |
| | (b) | There were no changes in the registrant’s internal control over financial reporting (as defined in Rule 30a-3(d) under the 1940 Act) that occurred during the second fiscal quarter of the period covered by this report that have materially affected, or are likely to materially affect the registrant’s internal control over financial reporting. |
| | (a) (1) Code of Ethics attached hereto. |
| | (a) (2) Certifications pursuant to section 302 of the Sarbanes-Oxley Act of 2002 attached hereto. |
| | (b) Certifications pursuant to Section 906 of the Sarbanes-Oxley Act of 2002 attached hereto. |
SIGNATURES
Pursuant to the requirements of the Securities Exchange Act of 1934 and the Investment Company Act of 1940, the registrant has duly caused this Report to be signed on its behalf by the undersigned, there unto duly authorized.
Legg Mason Global Asset Management Trust
| | |
| By: | | /s/ Kenneth D. Fuller |
| | Kenneth D. Fuller |
| | Chief Executive Officer |
| | Legg Mason Global Asset Management Trust |
| |
| Date: | | November 25, 2013 |
Pursuant to the requirements of the Securities Exchange Act of 1934 and the Investment Company Act of 1940, this report has been signed below by the following persons on behalf of the registrant and in the capacities and on the dates indicated.
| | |
| By: | | /s/ Kenneth D. Fuller |
| | Kenneth D. Fuller |
| | Chief Executive Officer |
| | Legg Mason Global Asset Management Trust |
| |
| Date: | | November 25, 2013 |
| |
| By: | | /s/ Richard F. Sennett |
| | Richard F. Sennett |
| | Principal Financial Officer |
| | Legg Mason Global Asset Management Trust |
| |
| Date: | | November 25, 2013 |