UNITED STATES
SECURITIES AND EXCHANGE COMMISSION
Washington, D.C. 20549
FORM N-CSR
CERTIFIED SHAREHOLDER REPORT OF REGISTERED
MANAGEMENT INVESTMENT COMPANIES
Investment Company Act file number 811-22338
Legg Mason Global Asset Management Trust
(Exact name of registrant as specified in charter)
620 Eighth Avenue, 49th Floor, New York, NY 10018
(Address of principal executive offices) (Zip code)
Robert I. Frenkel, Esq.
Legg Mason & Co., LLC
100 First Stamford Place
Stamford, CT 06902
(Name and address of agent for service)
Registrant’s telephone number, including area code: 1-877-721-1926
Date of fiscal year end: September 30
Date of reporting period: September 30, 2014
| ITEM 1. | REPORT TO STOCKHOLDERS. |
The Annual Report to Stockholders is filed herewith.

| | |
| Annual Report | | September 30, 2014 |
QS LEGG MASON
STRATEGIC REAL
RETURN FUND

|
| INVESTMENT PRODUCTS: NOT FDIC INSURED • NO BANK GUARANTEE • MAY LOSE VALUE |
Fund objective
The Fund seeks to provide an attractive long-term real return.
Letter from the president

Dear Shareholder,
At a meeting held in May 2014, the Fund’s Board of Trustees approved a recommendation from Legg Mason Partners Fund Advisor, LLC, the Fund’s investment manager, to change the fiscal year-end of the Fund from November 30 to September 30. As a result of this change, shareholders are being provided with a short-period annual report for the ten-month period from December 1, 2013 through September 30, 2014. Please read on for a more detailed look at the prevailing economic and market conditions during the Fund’s abbreviated reporting period and to learn how those conditions have affected Fund performance.
As always, we remain committed to providing you with excellent service and a full spectrum of investment choices. We also remain committed to supplementing the support you receive from your financial advisor. One way we accomplish this is through our website, www.leggmason.com/individualinvestors. Here you can gain immediate access to market and investment information, including:
| Ÿ | | Fund prices and performance, |
| Ÿ | | Market insights and commentaries from our portfolio managers, and |
| Ÿ | | A host of educational resources. |
We look forward to helping you meet your financial goals.
Sincerely,

Kenneth D. Fuller
President and Chief Executive Officer
October 31, 2014
| | |
| II | | QS Legg Mason Strategic Real Return Fund |
Investment commentary
Economic review
Since the end of the Great Recession, the U.S. economy has expanded at a slower than usual pace, compared to recent history. U.S. gross domestic product (“GDP”)i growth, as reported by the U.S. Department of Commerce’s revised figures, was 4.5% during the third quarter of 2013, its best reading since the fourth quarter of 2011. During the period from December 1, 2013 through September 30, 2014 (the “reporting period”), the severe winter weather of January and February played a key role in a sharp reversal in the economy, a 2.1% contraction during the first quarter of 2014. This was the first negative GDP report in three years. Negative contributions were widespread: private inventory investment, exports, state and local government spending, nonresidential and residential fixed investment. Thankfully, this setback was very brief, as second quarter GDP growth was 4.6%, suggesting the recovery has some resilience and continues to recover from the severe consequences of the Great Recession. The second quarter rebound in GDP growth was driven by several factors, including an acceleration in personal consumption expenditures (“PCE”), increased private inventory investment and exports, as well as an upturn in state and local government spending. After the reporting period ended, the Department of Commerce’s initial estimate for third quarter GDP growth was 3.5%, driven by contributions from PCE, exports, nonresidential fixed investment and government spending.
The U.S. manufacturing sector continued to support the economy during the reporting period. Based on figures for the Institute for Supply Management’s Purchasing Managers’ Index (“PMI”)ii, U.S. manufacturing expanded during all ten months of the reporting period (a reading below 50 indicates a contraction, whereas a reading above 50 indicates an expansion). After a reading of 56.5 in December 2013, the PMI fell to 51.3 in January 2014, its weakest reading since May 2013. PMI peaked in August 2014, with a reading of 59.0, representing its highest reading since March 2011. While PMI dipped to 56.6 in September, fifteen of the eighteen industries within the PMI expanded during the month.
The U.S. job market improved during the reporting period. When the period began, unemployment, as reported by the U.S. Department of Labor, was 6.7%. After falling to 6.6% in January 2014, it ticked up to 6.7% in February 2014. However, unemployment then generally declined over the next several months, reaching a low of 5.9% in September 2014. This represented the lowest level since July 2008. Falling unemployment during the period was partially due to a decline in the workforce participation rate, which was 62.7% in September 2014, its lowest level since 1978.
The Federal Reserve Board (“Fed”)iii took a number of actions as it sought to meet its dual mandate of fostering maximum employment and price stability. As has been the case since December 2008, the Fed kept the federal funds rateiv at a historically low range between zero and 0.25%. At its meeting in December 2012, prior to the beginning of the reporting period, the Fed announced that it would continue purchasing $40 billion per month of agency mortgage-backed securities (“MBS”), as well as initially purchasing $45 billion per month of longer-term Treasuries. Following the meeting that concluded on December 18, 2013, the Fed announced that it would begin reducing its monthly
| | |
| QS Legg Mason Strategic Real Return Fund | | III |
Investment commentary (cont’d)
asset purchases, saying “Beginning in January 2014, the Committee will add to its holdings of agency MBS at a pace of $35 billion per month rather than $40 billion per month, and will add to its holdings of longer-term Treasury securities at a pace of $40 billion per month rather than $45 billion per month.” At each of the Fed’s next six meetings (January, March, April, June, July and September 2014), it announced further $10 billion tapering of its asset purchases. Finally, at its meeting that ended on October 29, 2014, after the reporting period ended, the Fed announced that its asset purchase program had concluded. The Fed also said that it “currently anticipates that, even after employment and inflation are near mandate-consistent levels, economic conditions may, for some time, warrant keeping the target federal funds rate below levels the Committee views as normal in the longer run.”
Inflation was generally well contained during the reporting period. The seasonally unadjusted rate of inflation, as measured by the Consumer Price Index for All Urban Consumers (“CPI-U”)v, was 2.13%. The CPI-U less food and energy was 1.53% over the same time frame. Given limited pricing pressures and moderating inflation expectations, U.S. Treasury Inflation-Protected Securities (“TIPS”)vi generated weak results. During the reporting period, the Barclays U.S. TIPS Indexvii returned 2.14%.
As always, thank you for your confidence in our stewardship of your assets.
Sincerely,
Kenneth D. Fuller
President and Chief Executive Officer
October 31, 2014
All investments are subject to risk including the possible loss of principal. Past performance is no guarantee of future results. All index performance reflects no deduction for fees, expenses or taxes. Please note that an investor cannot invest directly in an index.
| | |
| IV | | QS Legg Mason Strategic Real Return Fund |
| i | Gross domestic product (“GDP”) is the market value of all final goods and services produced within a country in a given period of time. |
| ii | The Institute for Supply Management’s PMI is based on a survey of purchasing executives who buy the raw materials for manufacturing at more than 350 companies. It offers an early reading on the health of the U.S. manufacturing sector. |
| iii | The Federal Reserve Board (“Fed”) is responsible for the formulation of policies designed to promote economic growth, full employment, stable prices and a sustainable pattern of international trade and payments. |
| iv | The federal funds rate is the rate charged by one depository institution on an overnight sale of immediately available funds (balances at the Federal Reserve) to another depository institution; the rate may vary from depository institution to depository institution and from day to day. |
| v | The Consumer Price Index for All Urban Consumers (“CPI-U”) is a measure of the average change in prices over time of goods and services purchased by households, which covers approximately 87% of the total population and includes, in addition to wage earners and clerical worker households, groups such as professional, managerial and technical workers, the self-employed, short-term workers, the unemployed and retirees and others not in the labor force. |
| vi | U.S. Treasury Inflation-Protected Securities (“TIPS”) are inflation-indexed securities issued by the U.S. Treasury in five-year, ten-year and twenty-year maturities. The principal is adjusted to the Consumer Price Index, the commonly used measure of inflation. The coupon rate is constant, but generates a different amount of interest when multiplied by the inflation-adjusted principal. |
| vii | The Barclays U.S. TIPS Index represents an unmanaged market index made up of U.S. Treasury Inflation-Linked Index securities. |
| | |
| QS Legg Mason Strategic Real Return Fund | | V |
Fund overview
Q. What is the Fund’s investment strategy?
A. Under normal market conditions, the Fund, using a tactical asset allocation program, seeks to provide an attractive long-term real return. The Fund defines real return as total return reduced by the impact of inflation. In seeking to meet its investment goal, the Fund may allocate its assets among five investment “sleeves” which QS Legg Mason Global Asset Allocation, LLC (“QS LMGAA”), the Fund’s adviser, believes generally complement each other, with the following target allocations of the Fund’s net assets:
| Ÿ | | Inflation-Linked Debt Securities (40%) |
| Ÿ | | Global Equity Securities (20%) |
| Ÿ | | Commodity-Linked Securities (20%) |
| Ÿ | | Real Estate Investment Trusts (“REITs”)i (10%) |
| Ÿ | | Tactical Strategy (10%) |
QS LMGAA uses tactical asset allocation to dynamically shift the portfolio among these five sleeves, depending on the fundamental drivers of inflation at the time. The composition and asset allocation of the Fund’s investment portfolio will vary over time, based on QS LMGAA’s overall allocation decisions, and may be changed without shareholder approval. Asset allocation decisions are primarily based on QS LMGAA’s evaluations of future consumer price trends and the relative attractiveness of the asset classes in which the Fund invests. These evaluations are based on modeling processes that assign probabilities to different inflation scenarios. The processes take into account several factors, including quantitative analysis, qualitative inputs and risk management guidelines.
The Fund utilizes a “multi-manager” approach, whereby the adviser and each subadviser provide day-to-day management for one or more of the investment sleeves. The adviser and each subadviser use different investment strategies in managing the sleeves, act independently from the others in their management of the relevant investment sleeve, and use their own methodology for selecting investments.
Currently, Western Asset Management Company (“Western Asset”), Western Asset Management Company Limited in London (“WAML”) and Western Asset Management Company Ltd. in Japan (“Western Japan”) manage the Inflation-Linked Debt Securities Sleeve, QS Batterymarch Financial Management, Inc. (“QS Batterymarch”) manages the Global Equity Securities Sleeve and QS LMGAA manages the Commodity-Linked Securities Sleeve, the REITs Sleeve and the Tactical Strategy Sleeve. QS LMGAA may also allocate a portion of the Fund’s assets to ClearBridge Investments, LLC (“ClearBridge”), either in place of, or in addition to, the subadvisers named above. Western Asset manages the Fund’s cash and short-term instruments.
The Fund uses commodity derivatives (swaps and S&P GSCI®ii futures) to gain exposure to commodities. These derivatives are fully collateralized with cash.
Q. What were the overall market conditions during the Fund’s reporting period?
A. Inflation remained low during the reporting period. At the start of the reporting period on December 1, 2013, U.S. inflation was running at an annual rate of 1.2%. For most of the ensuing 10 months, the inflation rate ranged between 1.1% and 2.1%, but
| | |
| QS Legg Mason Strategic Real Return Fund 2014 Annual Report | | 1 |
Fund overview (cont’d)
toward the end of the reporting period the rate of Inflation increased toward 1.8%. Core inflation, which excludes the effects of food and energy prices, moved within a narrower range, staying between 1.6% and 2.0% during the entire period. Slack in the U.S. labor market has helped inflation remain low, despite the Federal Reserve Board (“Fed”)iii policy of “quantitative easing.”
Over the ten months ended September 30, 2014, investors have enjoyed a relatively benign market environment still supported by central bank policy. Equity markets have floated upwards, with REITs doing particularly well. U.S. economic growth was relatively robust, leading to a stronger U.S. dollar and more subdued fixed-income returns. In addition, weaker economic growth in Europe and Japan were a headwind for global growth, creating a challenging environment for commodities.
The Composite Index (the “Composite”)iv, representing the funds underlying investments declined by 0.40% over the ten months ended September 30, 2014. Global equities, as measured by the MSCI All Country World Index (“MSCI ACWI”)v, returned 5.52% over the reporting period. The FTSE NAREIT All REITs Indexvi, which measures the performance of real estate investment trusts, gained 14.04%. The S&P GSCI® Index of commodity markets returned -5.67%. The Barclays U.S. TIPS Indexvii returned 2.14%. The Citigroup 1-Month U.S. Treasury Bill Indexviii, a measure of one-month Treasury bills (also a component in the Composite), returned 0.02%, reflecting the near-zero level of short-term interest rates. The Composite is hedged 40% into a basket of foreign currencies, represented by the U.S. Dollar Index (“USDX”).ix The USDX rose 6.62% over the ten months ended September 30, 2014.
Q. How did we respond to these changing market conditions?
A. For most of the reporting period we were overweight global equities and underweight TIPS based on attractive equity valuations, improving economic fundamentals in the U.S., and continued support for U.S. growth from the Fed’s quantitative easing program. Given the tapering of quantitative easing and U.S. equity markets reaching record levels, we moved to a neutral stocks versus bonds position at the end of June 2014.
We were overweight REITs for the majority of the period but reduced our overweight gradually as the relative attractiveness of REIT yields relative to corporate bond yields declined. By the end of the reporting period we had closed out our overweight to REITs.
We remained neutral to commodities throughout the reporting period due to uncertain global growth prospects. U.S. economic growth was robust but growth in Europe and Japan was lackluster. In addition, there were no major geopolitical events affecting the medium term of supply versus demand. Given uncertainties about the demand and supply dynamics of commodities, we remained neutral.
Performance review
For the ten-month period from December 1, 2013 through September 30, 2014, Class A shares of QS Legg Mason Strategic Real Return Fund, excluding sales charges, returned -0.15%. The Fund’s unmanaged benchmark, the Barclays U.S. TIPS Index, returned 2.14% for the same period. The
| | |
| 2 | | QS Legg Mason Strategic Real Return Fund 2014 Annual Report |
Lipper Flexible Portfolio Funds Category Average1 returned 3.91% over the same time frame.
| | | | | | | | |
Performance Snapshot as of September 30, 2014
(unaudited) | |
| (excluding sales charges) | | 6 months | | | 10 months | |
| QS Legg Mason Strategic Real Return Fund: | | | | | | | | |
Class A | | | -3.50 | % | | | -0.15 | % |
Class A2 | | | -3.59 | % | | | -0.30 | % |
Class C | | | -3.81 | % | | | -0.74 | % |
Class I | | | -3.38 | % | | | -0.01 | % |
Class IS | | | -3.28 | % | | | 0.21 | % |
| Barclays U.S. TIPS Index | | | 1.69 | % | | | 2.14 | % |
| Composite Index | | | -3.30 | % | | | -0.40 | % |
Lipper Flexible Portfolio Funds
Category Average1 | | | 1.12 | % | | | 3.91 | % |
The performance shown represents past performance. Past performance is no guarantee of future results and current performance may be higher or lower than the performance shown above. Principal value and investment returns will fluctuate and investors’ shares, when redeemed, may be worth more or less than their original cost. To obtain performance data current to the most recent month-end, please visit our website at www.leggmason.com/individualinvestors.
All share class returns assume the reinvestment of all distributions, including returns of capital, if any, at net asset value and the deduction of all Fund expenses. Returns have not been adjusted to include sales charges that may apply or the deduction of taxes that a shareholder would pay on Fund distributions. If sales charges were reflected, the performance quoted would be lower. Performance figures for periods shorter than one year represent cumulative figures and are not annualized.
Fund performance figures reflect fee waivers and/or expense reimbursements, without which the performance would have been lower.
|
| Total Annual Operating Expenses (unaudited) |
As of the Fund’s current prospectus dated March 31, 2014, the gross total annual operating expense ratios for Class A, Class A2, Class C, Class I and Class IS shares were 1.56%, 1.87%, 2.47%, 1.30% and 1.13%, respectively.
Actual expenses may be higher. For example, expenses may be higher than those shown if average net assets decrease. Net assets are more likely to decrease and Fund expense ratios are more likely to increase when markets are volatile.
As a result of expense limitation arrangements, the ratio of expenses, other than interest, brokerage commissions (except for brokerage commissions paid on purchases and sales of shares of ETFs), dividend expense on short sales, taxes and extraordinary expenses, to average net assets is not expected to exceed 1.35% for Class A shares, 1.55% for Class A2 shares, 2.10% for Class C shares, 1.10% for Class I shares and 1.00% for Class IS shares. In addition, total annual fund operating expenses for Class IS shares will not exceed total annual fund operating expenses for Class I shares, subject to recapture as described below. These expense limitation arrangements take into account the expenses of the underlying funds. These expense limitation arrangements cannot be terminated prior to December 31, 2015 without the Board of Trustees’ consent.
| 1 | Lipper, Inc., a wholly-owned subsidiary of Reuters, provides independent insight on global collective investments. Returns are based on the period ended September 30, 2014, including the reinvestment of all distributions, including returns of capital, if any, calculated among the 506 funds for the six-month period and among the 482 funds for the ten-month period in the Fund’s Lipper category, and excluding sales charges |
| | |
| QS Legg Mason Strategic Real Return Fund 2014 Annual Report | | 3 |
Fund overview (cont’d)
The manager is permitted to recapture amounts waived or reimbursed to a class within three years after the fiscal year in which the manager earned the fee or incurred the expense if the class’ total annual operating expenses have fallen to a level below the expense limitation (“expense cap”) in effect at the time the fees were earned or the expenses incurred. In no case will the manager recapture any amount that would result, on any particular business day of the Fund, in the class’ total annual operating expenses exceeding the expense cap or any other lower limit then in effect.
Q. What were the leading contributors to performance?
A. The leading contributors to performance were the allocation to the Vanguard REIT Index ETF (“VNQ”) (representing 10.81% of the total Fund as of September 30, 2014) and the Equity sleeve (managed by QS Batterymarch and representing 20.19% of the total Fund as of September 30, 2014). Over the ten months ended September 30, 2014, FTSE NAREIT All REITs Index returned 14.04% and the MSCI ACWI Index returned 5.52%.
Q. What were the leading detractors from performance?
A. The leading detractors from performance were an allocation to the futures contracts and total return swaps within the Commodities sleeve (representing 19.28% of the total Fund as of September 30, 2014) and the foreign currency exposure of the Fund (representing 49.84% of the total Fund as of September 30, 2014). For the ten months ended September 30, 2014, the S&P GSCI® Index returned -5.67% and the trade weighted U.S. dollar index returned 6.62%. Since FX positions essentially represent a short position on the dollar, an increase in the dollar index leads to a loss in FX.
Thank you for your investment in QS Legg Mason Strategic Real Return Fund. As always, we appreciate that you have chosen us to manage your assets and we remain focused on achieving the Fund’s investment goals.
Sincerely,

Y. Wayne Lin
Portfolio Manager
QS Legg Mason Global Asset Allocation, LLC

Thomas Picciochi
Portfolio Manager
QS Legg Mason Global Asset Allocation, LLC

Ellen Tesler
Portfolio Manager
QS Legg Mason Global Asset Allocation, LLC
October 21, 2014
RISKS: The Fund is subject to interest rate, credit, income, prepayment and inflation risks. As interest rates rise, bond prices fall, reducing the value of a fixed-income investment. Changes in inflation will cause the Fund’s income to fluctuate, sometimes substantially. Periods of deflation may adversely affect the Fund’s net asset value. Equity securities are subject to price fluctuation and possible loss of principal. The Fund is non-diversified, which means that it is permitted to invest a higher percentage of its assets in any one issuer than a diversified
| | |
| 4 | | QS Legg Mason Strategic Real Return Fund 2014 Annual Report |
fund. This may magnify the Fund’s losses from events affecting a particular issuer. In addition to the Fund’s operating expenses, you will indirectly bear the operating expenses of any underlying funds, including ETFs. Each underlying fund may engage in active and frequent trading, resulting in higher portfolio turnover and transaction costs. Derivatives, such as options and futures, which can be illiquid, may disproportionately increase losses and have a potentially large impact on Fund performance. International investments are subject to special risks including currency fluctuations and social, economic and political uncertainties, which could increase volatility. These risks are magnified in emerging markets. The Fund may use leverage which may increase volatility and possibility of loss. The Fund may invest in REITs, which are closely linked to the performance of the real estate markets. REITs are subject to illiquidity, credit and interest rate risks, as well as risks associated with small- and mid-cap investments. The model used to manage the Fund’s assets provides no assurance that the recommended allocation will either maximize returns or minimize risks. There is no assurance that a recommended allocation will prove the ideal allocation in all circumstances. The Fund may engage in short selling, which is a speculative strategy that involves special risks. Unlike the possible loss on a security that is purchased, there is no limit on the amount of loss on an appreciating security that is sold short. Additional risks may include those risks associated with investing in commodities, ETFs, exchange-traded notes (“ETNs”) and master limited partnerships (“MLPs”). Please see the Fund’s prospectus for a more complete discussion of these and other risks, and the Fund’s investment strategies.
Portfolio holdings and breakdowns are as of September 30, 2014 and are subject to change and may not be representative of the portfolio managers’ current or future investments. Please refer to pages 13 through 22 for a list and percentage breakdown of the Fund’s holdings.
All investments are subject to risk including the possible loss of principal. Past performance is no guarantee of future results. All index performance reflects no deduction for fees, expenses or taxes. Please note that an investor cannot invest directly in an index.
The information provided is not intended to be a forecast of future events, a guarantee of future results or investment advice. Views expressed may differ from those of the firm as a whole.
| | |
| QS Legg Mason Strategic Real Return Fund 2014 Annual Report | | 5 |
Fund overview (cont’d)
| i | Real estate investment trusts (“REITs”) invest in real estate or loans secured by real estate and issue shares in such investments, which can be illiquid. |
| ii | The S&P GSCI® is a composite index of commodity sector returns representing an unleveraged, long-only investment in commodity futures that is broadly diversified across the spectrum of commodities. The returns are calculated on a fully collateralized basis with full reinvestment. |
| iii | The Federal Reserve Board (“Fed”) is responsible for the formulation of policies designed to promote economic growth, full employment, stable prices and a sustainable pattern of international trade and payments. |
| iv | The Composite Index reflects the blended rate of return of the following underlying indices: 40% Barclays U.S. TIPS Index, 20% MSCI All Country World Index, 20% S&P GSCI®, 10% FTSE NAREIT All REITs Index and 10% Citigroup 1-Month U.S. Treasury Bill Index. This Composite Index is hedged to 40% exposure to the U.S. dollar, as defined by the USDX. The Composite Index’s unhedged currency exposure is predominantly U.S. dollar-based. The Fund’s target hedged currency exposure is 40% U.S. dollar, 60% non-U.S. dollar. The Fund may deviate, either up or down, from its target currency allocation due to market conditions. To better align the components of the Composite Index with the Fund’s target currency exposure, a 40% U.S. dollar hedge is applied to the Composite Index by subtracting the returns of the USDX from 40% of the blended rate of return of the Composite Index. |
| v | The MSCI All Country World Index (“MSCI ACWI”) is a free float-adjusted market capitalization weighted index that is designed to measure the equity market performance of developed and emerging markets. |
| vi | The FTSE NAREIT All REITs Index consists of all tax-qualified REITs listed on the New York Stock Exchange, American Stock Exchange or NASDAQ National Market List. |
| vii | The Barclays U.S. TIPS Index represents an unmanaged market index made up of U.S. Treasury Inflation-Linked Index securities. |
| viii | The Citigroup 1-Month U.S. Treasury Bill Index is a market value-weighted index of public obligations of the U.S. Treasury with maturities of one month. |
| ix | The U.S. Dollar Index (“USDX”) is a measure of the value of the U.S. dollar relative to a majority of its most significant trading partners. |
| | |
| 6 | | QS Legg Mason Strategic Real Return Fund 2014 Annual Report |
Fund at a glance† (unaudited)
Investment breakdown (%) as a percent of total investments
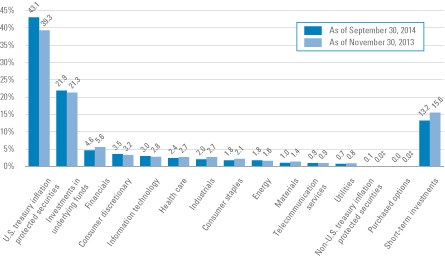
| † | The bar graph above represents the composition of the Fund’s investments as of September 30, 2014 and November 30, 2013 and does not include derivatives, such as futures contracts, written options, swap contracts and forward foreign currency contracts. The Fund is actively managed. As a result, the composition of the Fund’s investments is subject to change at any time. |
| ‡ | Represents less than 0.1%. |
| | |
| QS Legg Mason Strategic Real Return Fund 2014 Annual Report | | 7 |
Fund expenses (unaudited)
Example
As a shareholder of the Fund, you may incur two types of costs: (1) transaction costs, including front-end and back-end sales charges (loads) on purchase payments and (2) ongoing costs, including management fees; service and/or distribution (12b-1) fees; and other Fund expenses. This example is intended to help you understand your ongoing costs (in dollars) of investing in the Fund and to compare these costs with the ongoing costs of investing in other mutual funds.
This example is based on an investment of $1,000 invested on April 1, 2014 and held for the six months ended September 30, 2014.
Actual expenses
The table below titled “Based on Actual Total Return” provides information about actual account values and actual expenses. You may use the information provided in this table, together with the amount you invested, to estimate the expenses that you paid over the period. To estimate the expenses you paid on your account, divide your ending account value by $1,000 (for example, an $8,600 ending account value divided by $1,000 = 8.6), then multiply the result by the number under the heading entitled “Expenses Paid During the Period”.
Hypothetical example for comparison purposes
The table below titled “Based on Hypothetical Total Return” provides information about hypothetical account values and hypothetical expenses based on the actual expense ratio and an assumed rate of return of 5.00% per year before expenses, which is not the Fund’s actual return. The hypothetical account values and expenses may not be used to estimate the actual ending account balance or expenses you paid for the period. You may use the information provided in this table to compare the ongoing costs of investing in the Fund and other funds. To do so, compare the 5.00% hypothetical example relating to the Fund with the 5.00% hypothetical examples that appear in the shareholder reports of the other funds.
Please note that the expenses shown in the table below are meant to highlight your ongoing costs only and do not reflect any transactional costs, such as front-end or back-end sales charges (loads). Therefore, the table is useful in comparing ongoing costs only, and will not help you determine the relative total costs of owning different funds. In addition, if these transaction costs were included, your costs would have been higher.
| | | | | | | | | | | | | | | | | | | | | | | | | | | | | | | | | | | | | | | | | | | | |
| Based on actual total return1 | | | | | | | | Based on hypothetical total return1 | |
| | | Actual
Total Return
Without
Sales
Charge2 | | | Beginning
Account
Value | | | Ending
Account
Value | | | Annualized
Expense
Ratio3 | | | Expenses
Paid
During
the
Period4 | | | | | | | Hypothetical
Annualized
Total Return | | | Beginning
Account
Value | | | Ending
Account
Value | | | Annualized
Expense
Ratio3 | | | Expenses
Paid
During
the
Period4 | |
| Class A | | | -3.50 | % | | $ | 1,000.00 | | | $ | 965.00 | | | | 1.32 | % | | $ | 6.50 | | | | | Class A | | | 5.00 | % | | $ | 1,000.00 | | | $ | 1,018.45 | | | | 1.32 | % | | $ | 6.68 | |
| Class A2 | | | -3.59 | | | | 1,000.00 | | | | 964.10 | | | | 1.52 | | | | 7.48 | | | | | Class A2 | | | 5.00 | | | | 1,000.00 | | | | 1,017.45 | | | | 1.52 | | | | 7.69 | |
| Class C | | | -3.81 | | | | 1,000.00 | | | | 961.90 | | | | 2.07 | | | | 10.18 | | | | | Class C | | | 5.00 | | | | 1,000.00 | | | | 1,014.69 | | | | 2.07 | | | | 10.45 | |
| Class I | | | -3.38 | | | | 1,000.00 | | | | 966.20 | | | | 1.07 | | | | 5.27 | | | | | Class I | | | 5.00 | | | | 1,000.00 | | | | 1,019.70 | | | | 1.07 | | | | 5.42 | |
| Class IS | | | -3.28 | | | | 1,000.00 | | | | 967.20 | | | | 0.97 | | | | 4.78 | | | | | Class IS | | | 5.00 | | | | 1,000.00 | | | | 1,020.21 | | | | 0.97 | | | | 4.91 | |
| | |
| 8 | | QS Legg Mason Strategic Real Return Fund 2014 Annual Report |
| 1 | For the six months ended September 30, 2014. |
| 2 | Assumes the reinvestment of all distributions, including returns of capital, if any, at net asset value and does not reflect the deduction of the applicable sales charge with respect to Class A and Class A2 shares or the applicable contingent deferred sales charge (“CDSC”) with respect to Class C shares. Total return is not annualized, as it may not be representative of the total return for the year. Performance figures may reflect compensating balance arrangements, fee waivers and/or expense reimbursements. In the absence of compensating balance arrangements, fee waivers and/or expense reimbursements, the total return would have been lower. Past performance is no guarantee of future results. |
| 3 | Does not include expenses of the Underlying Funds in which the Fund invests. |
| 4 | Expenses (net of compensating balance arrangements, fee waivers and/or expense reimbursements) are equal to each class’ respective annualized expense ratio multiplied by the average account value over the period, multiplied by the number of days in the most recent fiscal half-year (183), then divided by 365. |
| | |
| QS Legg Mason Strategic Real Return Fund 2014 Annual Report | | 9 |
Fund performance (unaudited)
| | | | | | | | | | | | | | | | | | | | |
| Average annual total returns | |
| Without sales charges1 | | Class A | | | Class A2 | | | Class C | | | Class I | | | Class IS | |
| Twelve Months Ended 9/30/14 | | | 1.13 | % | | | 0.99 | % | | | 0.40 | % | | | 1.33 | % | | | 1.49 | % |
| Inception* through 9/30/14 | | | 5.18 | | | | 1.53 | | | | 4.43 | | | | 5.45 | | | | 4.59 | |
| | | | | |
| With sales charges2 | | Class A | | | Class A2 | | | Class C | | | Class I | | | Class IS | |
| Twelve Months Ended 9/30/14 | | | -4.72 | % | | | -4.81 | % | | | -0.58 | % | | | 1.33 | % | | | 1.49 | % |
| Inception* through 9/30/14 | | | 3.84 | | | | -1.54 | | | | 4.43 | | | | 5.45 | | | | 4.59 | |
| | | | |
| Cumulative total returns | |
| Without sales charges1 | | | |
| Class A (Inception date of 2/26/10 through 9/30/14) | | | 26.12 | % |
| Class A2 (Inception date of 10/31/12 through 9/30/14) | | | 2.95 | |
| Class C (Inception date of 2/26/10 through 9/30/14) | | | 22.03 | |
| Class I (Inception date of 2/26/10 through 9/30/14) | | | 27.60 | |
| Class IS (Inception date of 12/15/11 through 9/30/14) | | | 13.35 | |
All figures represent past performance and are not a guarantee of future results. Investment return and principal value of an investment will fluctuate so that an investor’s shares, when redeemed, may be worth more or less than their original cost. The returns shown do not reflect the deduction of taxes that a shareholder would pay on Fund distributions or the redemption of Fund shares. Performance figures may reflect compensating balance arrangements, fee waivers and/or expense reimbursements. In the absence of compensating balance arrangements, fee waivers and/or expense reimbursements, the total return would have been lower.
| 1 | Assumes the reinvestment of all distributions, including returns of capital, if any, at net asset value and does not reflect the deduction of the applicable sales charge with respect to Class A shares and Class A2 shares or the applicable contingent deferred sales charge (“CDSC”) with respect to Class C shares. |
| 2 | Assumes the reinvestment of all distributions, including returns of capital, if any, at net asset value. In addition, Class A shares and Class A2 shares each reflect the deduction of the maximum initial sales charge of 5.75%. Class C shares reflect the deduction of a 1.00% CDSC, which applies if shares are redeemed within one year from purchase payment. |
| * | Inception dates for Class A, A2, C, I and IS shares are February 26, 2010, October 31, 2012, February 26, 2010, February 26, 2010 and December 15, 2011, respectively. |
| | |
| 10 | | QS Legg Mason Strategic Real Return Fund 2014 Annual Report |
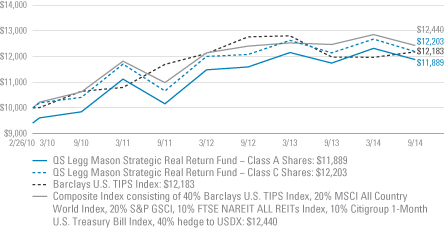
Historical performance
Value of $10,000 invested in
Class A and C Shares of QS Legg Mason Strategic Real Return Fund vs. Barclays U.S. TIPS Index and the Composite Index consisting of 40% Barclays U.S. TIPS Index, 20% MSCI All Country World Index, 20% S&P GSCI®, 10% FTSE NAREIT All REITs Index, 10% Citigroup 1-Month U.S. Treasury Bill Index, 40% hedge to USDX‡ — February 26, 2010 - September 2014
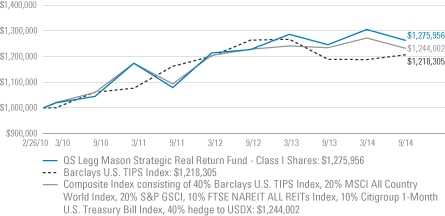
Value of $1,000,000 invested in
Class I Shares of QS Legg Mason Strategic Real Return Fund vs. Barclays U.S. TIPS Index and the Composite Index consisting of 40% Barclays U.S. TIPS Index, 20% MSCI All Country World Index, 20% S&P GSCI®, 10% FTSE NAREIT All REITs Index, 10% Citigroup 1-Month U.S. Treasury Bill Index, 40% hedge to USDX‡ — February 26, 2010 - September 2014
| | |
| QS Legg Mason Strategic Real Return Fund 2014 Annual Report | | 11 |
Fund performance (unaudited) (cont’d)
All figures represent past performance and are not a guarantee of future results. Investment return and principal value of an investment will fluctuate so that an investor’s shares, when redeemed, may be worth more or less than their original cost. The returns shown do not reflect the deduction of taxes that a shareholder would pay on Fund distributions or the redemption of Fund shares. Performance figures may reflect compensating balance arrangements, fee waivers and/or expense reimbursements. In the absence of compensating balance arrangements, fee waivers and/or expense reimbursements, the total return would have been lower.
| ‡ | Hypothetical illustration of $10,000 invested in Class A and C shares and $1,000,000 invested in Class I shares of Legg Mason Strategic Real Return Fund on February 26, 2010 (inception date), assuming the deduction of the maximum initial sales charge of 5.75% at the time of investment for Class A shares and the reinvestment of all distributions, including returns of capital, if any, at net asset value through September 30, 2014. The hypothetical illustration also assumes a $10,000 or $1,000,000 investment, as applicable, in the Barclays U.S. TIPS Index and the Composite Index. The Barclays U.S. TIPS Index represents an unmanaged market index made up of U.S. Treasury Inflation-Linked Index securities. The Composite Index reflects the blended rate of return of the following underlying indices: 40% Barclays U.S. TIPS Index, 20% MSCI All Country World Index, 20% S&P GSCI®, 10% FTSE NAREIT All REITs Index and 10% Citigroup 1-Month U.S. Treasury Bill Index. The Composite Index is hedged to 40% exposure to the U.S. dollar, as defined by the USDX. Please note that an investor cannot invest directly in an index. The performance of the Fund’s other classes may be greater or less than the Class A, C and I shares’ performance indicated on these charts, depending on whether greater or lesser sales charges and fees were incurred by shareholders investing in the other classes. |
| | |
| 12 | | QS Legg Mason Strategic Real Return Fund 2014 Annual Report |
Consolidated schedule of investments
September 30, 2014
QS Legg Mason Strategic Real Return Fund
| | | | | | | | | | | | | | | | |
| Security | | Rate | | | Maturity
Date | | | Face
Amount† | | | Value | |
| U.S. Treasury Inflation Protected Securities — 40.9% | | | | | | | | | | | | | | | | |
U.S. Treasury Bonds, Inflation Indexed | | | 2.375 | % | | | 1/15/25 | | | | 1,845,382 | | | $ | 2,161,403 | |
U.S. Treasury Bonds, Inflation Indexed | | | 2.000 | % | | | 1/15/26 | | | | 2,370,790 | | | | 2,698,440 | |
U.S. Treasury Bonds, Inflation Indexed | | | 1.750 | % | | | 1/15/28 | | | | 2,456,503 | | | | 2,734,204 | |
U.S. Treasury Bonds, Inflation Indexed | | | 3.625 | % | | | 4/15/28 | | | | 935,393 | | | | 1,270,235 | |
U.S. Treasury Bonds, Inflation Indexed | | | 2.500 | % | | | 1/15/29 | | | | 366,201 | | | | 446,966 | |
U.S. Treasury Bonds, Inflation Indexed | | | 3.875 | % | | | 4/15/29 | | | | 1,115,953 | | | | 1,574,192 | |
U.S. Treasury Bonds, Inflation Indexed | | | 2.125 | % | | | 2/15/40 | | | | 749,576 | | | | 927,601 | |
U.S. Treasury Bonds, Inflation Indexed | | | 2.125 | % | | | 2/15/41 | | | | 783,331 | | | | 974,574 | |
U.S. Treasury Bonds, Inflation Indexed | | | 0.750 | % | | | 2/15/42 | | | | 1,413,950 | | | | 1,294,759 | |
U.S. Treasury Bonds, Inflation Indexed | | | 0.625 | % | | | 2/15/43 | | | | 1,243,536 | | | | 1,097,808 | |
U.S. Treasury Bonds, Inflation Indexed | | | 1.375 | % | | | 2/15/44 | | | | 715,603 | | | | 765,415 | |
U.S. Treasury Notes, Inflation Indexed | | | 0.500 | % | | | 4/15/15 | | | | 1,242,322 | | | | 1,243,195 | |
U.S. Treasury Notes, Inflation Indexed | | | 2.000 | % | | | 1/15/16 | | | | 2,460,820 | | | | 2,547,333 | |
U.S. Treasury Notes, Inflation Indexed | | | 0.125 | % | | | 4/15/16 | | | | 4,986,782 | | | | 5,044,439 | |
U.S. Treasury Notes, Inflation Indexed | | | 2.500 | % | | | 7/15/16 | | | | 501,394 | | | | 532,221 | |
U.S. Treasury Notes, Inflation Indexed | | | 2.375 | % | | | 1/15/17 | | | | 2,114,760 | | | | 2,258,001 | |
U.S. Treasury Notes, Inflation Indexed | | | 0.125 | % | | | 4/15/17 | | | | 2,307,734 | | | | 2,338,383 | |
U.S. Treasury Notes, Inflation Indexed | | | 1.625 | % | | | 1/15/18 | | | | 1,580,805 | | | | 1,678,741 | |
U.S. Treasury Notes, Inflation Indexed | | | 0.125 | % | | | 4/15/18 | | | | 2,185,042 | | | | 2,202,454 | |
U.S. Treasury Notes, Inflation Indexed | | | 1.375 | % | | | 7/15/18 | | | | 1,104,870 | | | | 1,173,666 | |
U.S. Treasury Notes, Inflation Indexed | | | 2.125 | % | | | 1/15/19 | | | | 676,917 | | | | 739,479 | |
U.S. Treasury Notes, Inflation Indexed | | | 0.125 | % | | | 4/15/19 | | | | 508,395 | | | | 509,626 | |
U.S. Treasury Notes, Inflation Indexed | | | 1.875 | % | | | 7/15/19 | | | | 881,514 | | | | 961,883 | |
U.S. Treasury Notes, Inflation Indexed | | | 1.250 | % | | | 7/15/20 | | | | 1,033,486 | | | | 1,097,272 | |
U.S. Treasury Notes, Inflation Indexed | | | 1.125 | % | | | 1/15/21 | | | | 4,639,736 | | | | 4,866,647 | |
U.S. Treasury Notes, Inflation Indexed | | | 0.625 | % | | | 7/15/21 | | | | 2,885,883 | | | | 2,944,051 | |
U.S. Treasury Notes, Inflation Indexed | | | 0.125 | % | | | 1/15/22 | | | | 4,273,800 | | | | 4,175,635 | |
U.S. Treasury Notes, Inflation Indexed | | | 0.125 | % | | | 7/15/22 | | | | 2,061,740 | | | | 2,012,612 | |
U.S. Treasury Notes, Inflation Indexed | | | 0.125 | % | | | 1/15/23 | | | | 1,692,792 | | | | 1,637,776 | |
U.S. Treasury Notes, Inflation Indexed | | | 0.375 | % | | | 7/15/23 | | | | 2,866,584 | | | | 2,835,456 | |
U.S. Treasury Notes, Inflation Indexed | | | 0.625 | % | | | 1/15/24 | | | | 1,616,401 | | | | 1,624,483 | |
U.S. Treasury Notes, Inflation Indexed | | | 0.125 | % | | | 7/15/24 | | | | 822,788 | | | | 789,941 | |
Total U.S. Treasury Inflation Protected Securities (Cost — $59,620,630) | | | | | | | | 59,158,891 | |
| Non-U.S. Treasury Inflation Protected Securities — 0.1% | | | | | | | | | | | | | | | | |
Canada — 0.1% | | | | | | | | | | | | | | | | |
Government of Canada, Bonds (Cost — $62,083) | | | 4.250 | % | | | 12/1/26 | | | | 42,940 | CAD | | | 55,723 | |
See Notes to Consolidated Financial Statements.
| | |
| QS Legg Mason Strategic Real Return Fund 2014 Annual Report | | 13 |
Consolidated schedule of investments (cont’d)
September 30, 2014
QS Legg Mason Strategic Real Return Fund
| | | | | | | | | | | | |
| Security | | | | | | Shares | | | Value | |
| Common Stocks — 20.4% | | | | | | | | | | | | |
| Consumer Discretionary — 3.4% | | | | | | | | | | | | |
Auto Components — 0.1% | | | | | | | | | | | | |
Magna International Inc., Class A Shares | | | | | | | 1,100 | | | $ | 104,401 | |
Automobiles — 0.3% | | | | | | | | | | | | |
Fuji Heavy Industries Ltd. | | | | | | | 4,900 | | | | 162,000 | |
Mazda Motor Corp. | | | | | | | 3,600 | | | | 90,234 | |
Mitsubishi Motors Corp. | | | | | | | 5,900 | | | | 71,602 | |
Toyota Motor Corp. | | | | | | | 2,000 | | | | 117,857 | |
Total Automobiles | | | | | | | | | | | 441,693 | |
Diversified Consumer Services — 0.0% | | | | | | | | | | | | |
New Oriental Education & Technology Group Inc., ADR | | | | | | | 2,300 | | | | 53,360 | * |
Hotels, Restaurants & Leisure — 0.7% | | | | | | | | | | | | |
Brinker International Inc. | | | | | | | 1,500 | | | | 76,185 | |
Galaxy Entertainment Group Ltd. | | | | | | | 11,000 | | | | 63,891 | |
Jack in the Box Inc. | | | | | | | 1,334 | | | | 90,965 | |
Las Vegas Sands Corp. | | | | | | | 1,500 | | | | 93,315 | |
MGM China Holdings Ltd. | | | | | | | 76,400 | | | | 218,922 | |
Sands China Ltd. | | | | | | | 24,400 | | | | 127,266 | |
TUI Travel PLC | | | | | | | 13,472 | | | | 84,980 | |
Wyndham Worldwide Corp. | | | | | | | 2,600 | | | | 211,276 | |
Total Hotels, Restaurants & Leisure | | | | | | | | | | | 966,800 | |
Household Durables — 0.1% | | | | | | | | | | | | |
Newell Rubbermaid Inc. | | | | | | | 2,276 | | | | 78,317 | |
Leisure Products — 0.1% | | | | | | | | | | | | |
Fuji Photo Film Co., Ltd. | | | | | | | 5,200 | | | | 159,781 | |
Media — 1.0% | | | | | | | | | | | | |
British Sky Broadcasting Group PLC | | | | | | | 14,554 | | | | 208,101 | |
Comcast Corp., Class A Shares | | | | | | | 3,450 | | | | 185,541 | |
DIRECTV | | | | | | | 1,900 | | | | 164,388 | * |
ITV PLC | | | | | | | 53,514 | | | | 180,276 | |
Rightmove PLC | | | | | | | 3,624 | | | | 126,431 | |
Starz | | | | | | | 7,300 | | | | 241,484 | * |
Time Warner Cable Inc. | | | | | | | 1,700 | | | | 243,933 | |
Walt Disney Co. | | | | | | | 1,500 | | | | 133,545 | |
Total Media | | | | | | | | | | | 1,483,699 | |
Multiline Retail — 0.2% | | | | | | | | | | | | |
Macy’s Inc. | | | | | | | 1,600 | | | | 93,088 | |
Next PLC | | | | | | | 1,652 | | | | 176,891 | |
Total Multiline Retail | | | | | | | | | | | 269,979 | |
See Notes to Consolidated Financial Statements.
| | |
| 14 | | QS Legg Mason Strategic Real Return Fund 2014 Annual Report |
QS Legg Mason Strategic Real Return Fund
| | | | | | | | | | | | |
| Security | | | | | | Shares | | | Value | |
Specialty Retail — 0.5% | | | | | | | | | | | | |
AutoNation Inc. | | | | | | | 1,539 | | | $ | 77,427 | * |
Dixons Carphone PLC | | | | | | | 18,787 | | | | 111,563 | |
Gap Inc. | | | | | | | 2,800 | | | | 116,732 | |
Home Depot Inc. | | | | | | | 2,400 | | | | 220,176 | |
Lowe’s Cos. Inc. | | | | | | | 2,500 | | | | 132,300 | |
PetSmart Inc. | | | | | | | 1,000 | | | | 70,090 | |
Total Specialty Retail | | | | | | | | | | | 728,288 | |
Textiles, Apparel & Luxury Goods — 0.4% | | | | | | | | | | | | |
Hanesbrands Inc. | | | | | | | 2,200 | | | | 236,368 | |
Pandora A/S | | | | | | | 4,091 | | | | 320,766 | |
Total Textiles, Apparel & Luxury Goods | | | | | | | | | | | 557,134 | |
Total Consumer Discretionary | | | | | | | | | | | 4,843,452 | |
| Consumer Staples — 1.6% | | | | | | | | | | | | |
Beverages — 0.4% | | | | | | | | | | | | |
Britvic PLC | | | | | | | 15,654 | | | | 169,522 | |
Coca-Cola Enterprises Inc. | | | | | | | 1,700 | | | | 75,412 | |
Constellation Brands Inc., Class A Shares | | | | | | | 1,800 | | | | 156,888 | * |
Dr. Pepper Snapple Group Inc. | | | | | | | 2,800 | | | | 180,068 | |
Total Beverages | | | | | | | | | | | 581,890 | |
Food & Staples Retailing — 0.2% | | | | | | | | | | | | |
Alimentation Couche-Tard Inc., Class B Shares | | | | | | | 2,700 | | | | 86,332 | |
Kroger Co. | | | | | | | 4,250 | | | | 221,000 | |
Total Food & Staples Retailing | | | | | | | | | | | 307,332 | |
Food Products — 0.5% | | | | | | | | | | | | |
Archer-Daniels-Midland Co. | | | | | | | 5,000 | | | | 255,500 | |
Bunge Ltd. | | | | | | | 1,700 | | | | 143,191 | |
Tate & Lyle PLC | | | | | | | 17,800 | | | | 170,686 | |
Unilever PLC | | | | | | | 3,900 | | | | 163,436 | |
Total Food Products | | | | | | | | | | | 732,813 | |
Household Products — 0.3% | | | | | | | | | | | | |
Clorox Co. | | | | | | | 1,700 | | | | 163,268 | |
Reckitt Benckiser Group PLC | | | | | | | 2,658 | | | | 230,532 | |
Total Household Products | | | | | | | | | | | 393,800 | |
Personal Products — 0.2% | | | | | | | | | | | | |
Kao Corp. | | | | | | | 8,400 | | | | 327,537 | |
Total Consumer Staples | | | | | | | | | | | 2,343,372 | |
See Notes to Consolidated Financial Statements.
| | |
| QS Legg Mason Strategic Real Return Fund 2014 Annual Report | | 15 |
Consolidated schedule of investments (cont’d)
September 30, 2014
QS Legg Mason Strategic Real Return Fund
| | | | | | | | | | | | |
| Security | | | | | | Shares | | | Value | |
| Energy — 1.7% | | | | | | | | | | | | |
Energy Equipment & Services — 0.4% | | | | | | | | | | | | |
China Oilfield Services Ltd. | | | | | | | 54,000 | | | $ | 142,565 | |
Dril-Quip Inc. | | | | | | | 1,750 | | | | 156,450 | * |
Helmerich & Payne Inc. | | | | | | | 700 | | | | 68,509 | |
Schlumberger Ltd. | | | | | | | 1,500 | | | | 152,535 | |
Total Energy Equipment & Services | | | | | | | | | | | 520,059 | |
Oil, Gas & Consumable Fuels — 1.3% | | | | | | | | | | | | |
ConocoPhillips | | | | | | | 1,500 | | | | 114,780 | |
Dragon Oil PLC | | | | | | | 10,943 | | | | 109,190 | |
Enerplus Corp. | | | | | | | 6,600 | | | | 125,288 | |
EOG Resources Inc. | | | | | | | 1,050 | | | | 103,971 | |
Exxon Mobil Corp. | | | | | | | 4,007 | | | | 376,858 | |
Marathon Petroleum Corp. | | | | | | | 1,200 | | | | 101,604 | |
Occidental Petroleum Corp. | | | | | | | 931 | | | | 89,516 | |
Phillips 66 | | | | | | | 2,990 | | | | 243,117 | |
Polish Oil & Gas Co. | | | | | | | 97,360 | | | | 148,810 | |
Ultra Petroleum Corp. | | | | | | | 6,000 | | | | 139,560 | * |
Valero Energy Corp. | | | | | | | 6,580 | | | | 304,457 | |
Woodside Petroleum Ltd. | | | | | | | 2,325 | | | | 82,647 | |
Total Oil, Gas & Consumable Fuels | | | | | | | | | | | 1,939,798 | |
Total Energy | | | | | | | | | | | 2,459,857 | |
| Financials — 4.3% | | | | | | | | | | | | |
Banks — 1.5% | | | | | | | | | | | | |
Bank of America Corp. | | | | | | | 14,600 | | | | 248,930 | |
Bank of Montreal | | | | | | | 1,000 | | | | 73,602 | |
Credit Agricole SA | | | | | | | 14,477 | | | | 218,416 | |
DBS Group Holdings Ltd. | | | | | | | 7,000 | | | | 101,074 | |
DNB ASA | | | | | | | 3,800 | | | | 71,153 | |
Fifth Third Bancorp | | | | | | | 14,350 | | | | 287,287 | |
JPMorgan Chase & Co. | | | | | | | 6,463 | | | | 389,331 | |
KeyCorp | | | | | | | 4,950 | | | | 65,984 | |
Mizuho Financial Group Inc. | | | | | | | 79,500 | | | | 142,002 | |
Resona Holdings Inc. | | | | | | | 20,400 | | | | 115,025 | |
Sumitomo Mitsui Financial Group Inc. | | | | | | | 5,000 | | | | 203,829 | |
Wells Fargo & Co. | | | | | | | 5,070 | | | | 262,981 | |
Total Banks | | | | | | | | | | | 2,179,614 | |
Capital Markets — 0.2% | | | | | | | | | | | | |
3i Group PLC | | | | | | | 13,761 | | | | 85,509 | |
GAM Holding AG | | | | | | | 3,321 | | | | 57,397 | |
See Notes to Consolidated Financial Statements.
| | |
| 16 | | QS Legg Mason Strategic Real Return Fund 2014 Annual Report |
QS Legg Mason Strategic Real Return Fund
| | | | | | | | | | | | |
| Security | | | | | | Shares | | | Value | |
Capital Markets — continued | | | | | | | | | | | | |
Macquarie Group Ltd. | | | | | | | 2,754 | | | $ | 138,865 | |
Schroders PLC | | | | | | | 1,572 | | | | 60,933 | |
Total Capital Markets | | | | | | | | | | | 342,704 | |
Consumer Finance — 0.1% | | | | | | | | | | | | |
Corrections Corp. of America | | | | | | | 3,200 | | | | 109,952 | |
Insurance — 2.0% | | | | | | | | | | | | |
Ageas | | | | | | | 2,609 | | | | 86,617 | |
Allianz AG, Registered Shares | | | | | | | 2,011 | | | | 326,008 | |
Allstate Corp. | | | | | | | 3,245 | | | | 199,146 | |
American Financial Group Inc. | | | | | | | 3,397 | | | | 196,652 | |
Assurant Inc. | | | | | | | 2,896 | | | | 186,213 | |
Aviva PLC | | | | | | | 9,032 | | | | 76,652 | |
AXA SA | | | | | | | 5,142 | | | | 126,710 | |
Axis Capital Holdings Ltd. | | | | | | | 1,400 | | | | 66,262 | |
Everest Re Group Ltd. | | | | | | | 1,000 | | | | 162,010 | |
Hannover Rueck SE | | | | | | | 3,000 | | | | 242,581 | |
Hanover Insurance Group Inc. | | | | | | | 1,800 | | | | 110,556 | |
Hiscox Ltd. | | | | | | | 9,654 | | | | 98,599 | |
Legal & General Group PLC | | | | | | | 21,616 | | | | 80,213 | |
Muenchener Rueckversicherungs-Gesellschaft AG (MunichRe), Registered Shares | | | | | | | 953 | | | | 188,437 | |
PartnerRe Ltd. | | | | | | | 600 | | | | 65,934 | |
Prudential PLC | | | | | | | 9,225 | | | | 205,782 | |
SCOR SE | | | | | | | 1,915 | | | | 59,828 | |
St. James’s Place PLC | | | | | | | 6,138 | | | | 72,640 | |
Swiss Life Holding | | | | | | | 767 | | | | 183,334 | |
Swiss Re AG | | | | | | | 1,710 | | | | 136,395 | |
Travelers Cos. Inc. | | | | | | | 900 | | | | 84,546 | |
Total Insurance | | | | | | | | | | | 2,955,115 | |
Real Estate Investment Trusts (REITs) — 0.1% | | | | | | | | | | | | |
GPT Group | | | | | | | 30,842 | | | | 104,504 | |
Real Estate Management & Development — 0.4% | | | | | | | | | | | | |
China Overseas Land & Investment Ltd. | | | | | | | 50,000 | | | | 128,528 | |
China Resources Land Ltd. | | | | | | | 30,000 | | | | 61,972 | |
Country Garden Holdings Co., Ltd. | | | | | | | 224,000 | | | | 84,525 | |
Daito Trust Construction Co., Ltd. | | | | | | | 1,300 | | | | 153,558 | |
Shimao Property Holdings Ltd. | | | | | | | 55,000 | | | | 111,206 | |
Total Real Estate Management & Development | | | | | | | | | | | 539,789 | |
Total Financials | | | | | | | | | | | 6,231,678 | |
See Notes to Consolidated Financial Statements.
| | |
| QS Legg Mason Strategic Real Return Fund 2014 Annual Report | | 17 |
Consolidated schedule of investments (cont’d)
September 30, 2014
QS Legg Mason Strategic Real Return Fund
| | | | | | | | | | | | |
| Security | | | | | | Shares | | | Value | |
| Health Care — 2.3% | | | | | | | | | | | | |
Biotechnology — 0.5% | | | | | | | | | | | | |
Actelion Ltd. | | | | | | | 1,260 | | | $ | 148,212 | |
Grifols SA | | | | | | | 2,881 | | | | 118,044 | |
Myriad Genetics Inc. | | | | | | | 5,000 | | | | 192,850 | * |
United Therapeutics Corp. | | | | | | | 2,000 | | | | 257,300 | * |
Total Biotechnology | | | | | | | | | | | 716,406 | |
Health Care Equipment & Supplies — 0.1% | | | | | | | | | | | | |
Medtronic Inc. | | | | | | | 3,000 | | | | 185,850 | |
Health Care Providers & Services — 0.4% | | | | | | | | | | | | |
Aetna Inc. | | | | | | | 1,530 | | | | 123,930 | |
Cardinal Health Inc. | | | | | | | 2,600 | | | | 194,792 | |
WellPoint Inc. | | | | | | | 1,789 | | | | 214,000 | |
Total Health Care Providers & Services | | | | | | | | | | | 532,722 | |
Pharmaceuticals — 1.3% | | | | | | | | | | | | |
AbbVie Inc. | | | | | | | 4,846 | | | | 279,905 | |
Eli Lilly & Co. | | | | | | | 1,200 | | | | 77,820 | |
Johnson & Johnson | | | | | | | 2,800 | | | | 298,452 | |
Novo Nordisk A/S, Class B Shares | | | | | | | 8,500 | | | | 406,716 | |
Pfizer Inc. | | | | | | | 6,397 | | | | 189,159 | |
Roche Holding AG | | | | | | | 1,700 | | | | 504,106 | |
Shire PLC | | | | | | | 1,266 | | | | 109,597 | |
Total Pharmaceuticals | | | | | | | | | | | 1,865,755 | |
Total Health Care | | | | | | | | | | | 3,300,733 | |
| Industrials — 1.9% | | | | | | | | | | | | |
Aerospace & Defense — 0.8% | | | | | | | | | | | | |
Alliant Techsystems Inc. | | | | | | | 2,150 | | | | 274,426 | |
Boeing Co. | | | | | | | 2,500 | | | | 318,450 | |
Lockheed Martin Corp. | | | | | | | 1,770 | | | | 323,521 | |
Northrop Grumman Corp. | | | | | | | 1,800 | | | | 237,168 | |
Total Aerospace & Defense | | | | | | | | | | | 1,153,565 | |
Airlines — 0.1% | | | | | | | | | | | | |
Copa Holdings SA, Class A Shares | | | | | | | 800 | | | | 85,832 | |
easyJet PLC | | | | | | | 2,971 | | | | 68,538 | |
Total Airlines | | | | | | | | | | | 154,370 | |
Building Products — 0.1% | | | | | | | | | | | | |
Lennox International Inc. | | | | | | | 1,400 | | | | 107,618 | |
Construction & Engineering — 0.1% | | | | | | | | | | | | |
Aecom Technology Corp. | | | | | | | 4,250 | | | | 143,437 | * |
See Notes to Consolidated Financial Statements.
| | |
| 18 | | QS Legg Mason Strategic Real Return Fund 2014 Annual Report |
QS Legg Mason Strategic Real Return Fund
| | | | | | | | | | | | |
| Security | | | | | | Shares | | | Value | |
Electrical Equipment — 0.1% | | | | | | | | | | | | |
Mitsubishi Electric Corp. | | | | | | | 6,000 | | | $ | 79,900 | |
Industrial Conglomerates — 0.4% | | | | | | | | | | | | |
DCC PLC | | | | | | | 4,771 | | | | 264,675 | |
Siemens AG, Registered Shares | | | | | | | 1,791 | | | | 213,476 | |
United Technologies Corp. | | | | | | | 610 | | | | 64,416 | |
Total Industrial Conglomerates | | | | | | | | | | | 542,567 | |
Machinery — 0.0% | | | | | | | | | | | | |
Toro Co. | | | | | | | 1,000 | | | | 59,230 | |
Professional Services — 0.0% | | | | | | | | | | | | |
Manpower Inc. | | | | | | | 1,000 | | | | 70,100 | |
Road & Rail — 0.3% | | | | | | | | | | | | |
Central Japan Railway Co. | | | | | | | 2,500 | | | | 337,702 | |
West Japan Railway Co. | | | | | | | 3,200 | | | | 143,245 | |
Total Road & Rail | | | | | | | | | | | 480,947 | |
Total Industrials | | | | | | | | | | | 2,791,734 | |
| Information Technology — 2.8% | | | | | | | | | | | | |
Communications Equipment — 0.6% | | | | | | | | | | | | |
Brocade Communications Systems Inc. | | | | | | | 27,400 | | | | 297,838 | |
Cisco Systems Inc. | | | | | | | 13,950 | | | | 351,121 | |
QUALCOMM Inc. | | | | | | | 2,850 | | | | 213,095 | |
Total Communications Equipment | | | | | | | | | | | 862,054 | |
Electronic Equipment, Instruments & Components — 0.1% | | | | | | | | | | | | |
Zebra Technologies Corp., Class A Shares | | | | | | | 1,200 | | | | 85,164 | * |
Internet Software & Services — 0.0% | | | | | | | | | | | | |
United Internet AG | | | | | | | 1,458 | | | | 62,050 | |
IT Services — 0.4% | | | | | | | | | | | | |
Cielo SA | | | | | | | 7,400 | | | | 120,927 | |
Computer Sciences Corp. | | | | | | | 2,550 | | | | 155,933 | |
NeuStar Inc. | | | | | | | 3,400 | | | | 84,422 | * |
Visa Inc., Class A Shares | | | | | | | 300 | | | | 64,011 | |
Xerox Corp. | | | | | | | 14,100 | | | | 186,543 | |
Total IT Services | | | | | | | | | | | 611,836 | |
Semiconductors & Semiconductor Equipment — 0.2% | | | | | | | | | | | | |
Marvell Technology Group Ltd. | | | | | | | 6,600 | | | | 88,968 | |
Texas Instruments Inc. | | | | | | | 4,000 | | | | 190,760 | |
Total Semiconductors & Semiconductor Equipment | | | | | | | | | | | 279,728 | |
Software — 0.6% | | | | | | | | | | | | |
Activision Blizzard Inc. | | | | | | | 3,400 | | | | 70,686 | |
See Notes to Consolidated Financial Statements.
| | |
| QS Legg Mason Strategic Real Return Fund 2014 Annual Report | | 19 |
Consolidated schedule of investments (cont’d)
September 30, 2014
QS Legg Mason Strategic Real Return Fund
| | | | | | | | | | | | |
| Security | | | | | | Shares | | | Value | |
Software — continued | | | | | | | | | | | | |
Amdocs Ltd. | | | | | | | 2,300 | | | $ | 105,524 | |
Aspen Technology Inc. | | | | | | | 3,600 | | | | 135,792 | * |
Constellation Software Inc. | | | | | | | 700 | | | | 175,939 | |
Electronic Arts Inc. | | | | | | | 2,600 | | | | 92,586 | * |
Microsoft Corp. | | | | | | | 5,195 | | | | 240,840 | |
Total Software | | | | | | | | | | | 821,367 | |
Technology Hardware, Storage & Peripherals — 0.9% | | | | | | | | | | | | |
Apple Inc. | | | | | | | 7,000 | | | | 705,250 | |
Samsung Electronics Co., Ltd. | | | | | | | 266 | | | | 298,455 | |
SanDisk Corp. | | | | | | | 2,000 | | | | 195,900 | |
Seiko Epson Corp. | | | | | | | 2,800 | | | | 134,543 | |
Total Technology Hardware, Storage & Peripherals | | | | | | | | | | | 1,334,148 | |
Total Information Technology | | | | | | | | | | | 4,056,347 | |
| Materials — 0.9% | | | | | | | | | | | | |
Chemicals — 0.7% | | | | | | | | | | | | |
EMS-Chemie Holding AG | | | | | | | 342 | | | | 142,306 | |
LyondellBasell Industries NV, Class A Shares | | | | | | | 2,200 | | | | 239,052 | |
Nippon Paint Co., Ltd. | | | | | | | 12,000 | | | | 269,706 | |
PPG Industries Inc. | | | | | | | 1,650 | | | | 324,621 | |
Total Chemicals | | | | | | | | | | | 975,685 | |
Construction Materials — 0.1% | | | | | | | | | | | | |
Imerys SA | | | | | | | 1,794 | | | | 132,284 | |
Taiwan Cement Corp. | | | | | | | 52,000 | | | | 77,437 | |
Total Construction Materials | | | | | | | | | | | 209,721 | |
Containers & Packaging — 0.1% | | | | | | | | | | | | |
Packaging Corp. of America | | | | | | | 2,400 | | | | 153,168 | |
Total Materials | | | | | | | | | | | 1,338,574 | |
| Telecommunication Services — 0.9% | | | | | | | | | | | | |
Diversified Telecommunication Services — 0.7% | | | | | | | | | | | | |
AT&T Inc. | | | | | | | 4,700 | | | | 165,628 | |
BT Group PLC | | | | | | | 37,119 | | | | 228,426 | |
Hellenic Telecommunications Organization SA | | | | | | | 4,280 | | | | 56,221 | * |
Nippon Telegraph & Telephone Corp. | | | | | | | 1,200 | | | | 74,631 | |
PT Telekomunikasi Indonesia Persero Tbk | | | | | | | 517,500 | | | | 123,801 | |
Verizon Communications Inc. | | | | | | | 6,300 | | | | 314,937 | |
Total Diversified Telecommunication Services | | | | | | | | | | | 963,644 | |
Wireless Telecommunication Services — 0.2% | | | | | | | | | | | | |
Freenet AG | | | | | | | 4,226 | | | | 109,982 | |
See Notes to Consolidated Financial Statements.
| | |
| 20 | | QS Legg Mason Strategic Real Return Fund 2014 Annual Report |
QS Legg Mason Strategic Real Return Fund
| | | | | | | | | | | | |
| Security | | | | | | Shares | | | Value | |
Wireless Telecommunication Services — continued | | | | | | | | | | | | |
KDDI Corp. | | | | | | | 2,200 | | | $ | 132,251 | |
Sistema JSFC, Registered Shares, GDR | | | | | | | 6,700 | | | | 46,230 | |
Total Wireless Telecommunication Services | | | | | | | | | | | 288,463 | |
Total Telecommunication Services | | | | | | | | | | | 1,252,107 | |
| Utilities — 0.6% | | | | | | | | | | | | |
Electric Utilities — 0.2% | | | | | | | | | | | | |
E.ON SE | | | | | | | 3,706 | | | | 67,849 | |
Huaneng Power International Inc., Class H Shares | | | | | | | 142,000 | | | | 155,079 | |
Red Electrica Corporacion SA | | | | | | | 1,021 | | | | 88,413 | |
Total Electric Utilities | | | | | | | | | | | 311,341 | |
Gas Utilities — 0.2% | | | | | | | | | | | | |
Gas Natural SDG SA | | | | | | | 7,303 | | | | 215,013 | |
Multi-Utilities — 0.1% | | | | | | | | | | | | |
Wisconsin Energy Corp. | | | | | | | 3,800 | | | | 163,400 | |
Water Utilities — 0.1% | | | | | | | | | | | | |
Guangdong Investment Ltd. | | | | | | | 160,000 | | | | 186,893 | |
Total Utilities | | | | | | | | | | | 876,647 | |
Total Common Stocks (Cost — $23,389,143) | | | | | | | | | | | 29,494,501 | |
| Investments in Underlying Funds — 20.7% | | | | | | | | | | | | |
iShares Trust — iShares Barclays TIPS Bond Fund | | | | | | | 17,095 | | | | 1,915,837 | |
iShares Trust — iShares MSCI EAFE Index Fund | | | | | | | 100,266 | | | | 6,429,056 | |
Vanguard Index Funds — Vanguard Total Stock Market Fund, ETF Shares | | | | | | | 67,138 | | | | 6,797,051 | |
Vanguard Specialized Funds — Vanguard REIT Index Fund, ETF Shares | | | | | | | 206,443 | | | | 14,832,929 | |
Total Investments in Underlying Funds (Cost — $24,094,763) | | | | | | | 29,974,873 | |
| Preferred Stocks — 0.3% | | | | | | | | | | | | |
| Consumer Staples — 0.1% | | | | | | | | | | | | |
Household Products — 0.1% | | | | | | | | | | | | |
Henkel AG & Co. KGaA | | | | | | | 1,603 | | | | 160,070 | |
| Financials — 0.1% | | | | | | | | | | | | |
Banks — 0.1% | | | | | | | | | | | | |
Itau Unibanco Holding SA | | | | | | | 9,020 | | | | 124,812 | |
| Utilities — 0.1% | | | | | | | | | | | | |
Independent Power and Renewable Electricity Producers — 0.1% | | | | | | | | | | |
Cia Energetica de Sao Paulo | | | | | | | 9,200 | | | | 98,399 | |
Total Preferred Stocks (Cost — $432,860) | | | | | | | | | | | 383,281 | |
Total Investments before Short-Term Investments (Cost — $107,599,479) | | | | 119,067,269 | |
See Notes to Consolidated Financial Statements.
| | |
| QS Legg Mason Strategic Real Return Fund 2014 Annual Report | | 21 |
Consolidated schedule of investments (cont’d)
September 30, 2014
QS Legg Mason Strategic Real Return Fund
| | | | | | | | | | | | | | | | |
| | | Rate | | | Maturity
Date | | | Face
Amount† | | | Value | |
| Short-Term Investments — 12.5% | | | | | | | | | | | | | | | | |
Repurchase Agreements — 12.5% | | | | | | | | | | | | | | | | |
Interest in $1,332,731,000 joint tri-party repurchase agreement dated 9/30/14 with RBS Securities Inc.; Proceeds at maturity — $18,150,000; (Fully collateralized by various U.S. government obligations, 0.125% to 3.875% due 4/15/15 to 2/15/44; Market value — $18,513,002) (Cost — $18,150,000) | | | 0.001 | % | | | 10/1/14 | | | | 18,150,000 | | | $ | 18,150,000 | |
Total Investments — 94.9% (Cost — $125,749,479#) | | | | | | | | | | | | | | | 137,217,269 | |
Other Assets in Excess of Liabilities — 5.1% | | | | | | | | | | | | | | | 7,344,380 | |
Total Net Assets — 100.0% | | | | | | | | | | | | | | $ | 144,561,649 | |
| † | Face amount denominated in U.S. dollars, unless otherwise noted. |
| * | Non-income producing security. |
| # | Aggregate cost for federal income tax purposes is $126,218,077. |
| | |
Abbreviations used in this schedule: |
| ADR | | — American Depositary Receipts |
| CAD | | — Canadian Dollar |
| GDR | | — Global Depositary Receipts |
See Notes to Consolidated Financial Statements.
| | |
| 22 | | QS Legg Mason Strategic Real Return Fund 2014 Annual Report |
Consolidated statement of assets and liabilities
September 30, 2014
| | | | |
| |
| Assets: | | | | |
Investments, at value (Cost — $107,599,479) | | $ | 119,067,269 | |
Repurchase agreements, at value (Cost — $18,150,000) | | | 18,150,000 | |
Foreign currency, at value (Cost — $161,814) | | | 153,543 | |
Cash | | | 4,974,773 | |
Deposits with brokers for open futures contracts | | | 3,456,077 | |
Receivable for securities sold | | | 742,017 | |
Unrealized appreciation on forward foreign currency contracts | | | 237,938 | |
Interest and dividends receivable | | | 219,524 | |
Receivable for Fund shares sold | | | 1,079 | |
Prepaid expenses | | | 42,518 | |
Total Assets | | | 147,044,738 | |
| |
| Liabilities: | | | | |
Unrealized depreciation on forward foreign currency contracts | | | 1,236,264 | |
Payable to broker — variation margin on open futures contracts | | | 1,069,097 | |
Investment management fee payable | | | 57,191 | |
Payable for Fund shares repurchased | | | 5,214 | |
Trustees’ fees payable | | | 2,517 | |
Service and/or distribution fees payable | | | 2,063 | |
Accrued expenses | | | 110,743 | |
Total Liabilities | | | 2,483,089 | |
| Total Net Assets | | $ | 144,561,649 | |
| |
| Net Assets: | | | | |
Par value (Note 7) | | $ | 104 | |
Paid-in capital in excess of par value | | | 135,073,884 | |
Undistributed net investment income | | | 857,166 | |
Accumulated net realized loss on investments, futures contracts, written options, swap contracts and foreign currency transactions | | | (748,978) | |
Net unrealized appreciation on investments, futures contracts and foreign currencies | | | 9,379,473 | |
| Total Net Assets | | $ | 144,561,649 | |
See Notes to Consolidated Financial Statements.
| | |
| QS Legg Mason Strategic Real Return Fund 2014 Annual Report | | 23 |
Consolidated statement of assets and liabilities (cont’d)
September 30, 2014
| | | | |
| |
| Shares Outstanding: | | | | |
Class A | | | 268,301 | |
Class A2 | | | 134,773 | |
Class C | | | 75,968 | |
Class I | | | 68,079 | |
Class IS | | | 9,897,186 | |
| |
| Net Asset Value: | | | | |
Class A (and redemption price) | | | $13.78 | |
Class A2 (and redemption price) | | | $13.69 | |
Class C* | | | $13.63 | |
Class I (and redemption price) | | | $14.02 | |
Class IS (and redemption price) | | | $13.85 | |
| Maximum Public Offering Price Per Share: | | | | |
Class A (based on maximum initial sales charge of 5.75%) | | | $14.62 | |
Class A2 (based on maximum initial sales charge of 5.75%) | | | $14.53 | |
| * | Redemption price per share is NAV of Class C shares reduced by a 1.00% CDSC, if shares are redeemed within one year from purchase payment (See Note 2). |
See Notes to Consolidated Financial Statements.
| | |
| 24 | | QS Legg Mason Strategic Real Return Fund 2014 Annual Report |
Consolidated statements of operations
For the Period Ended September 30, 2014 and the Year Ended November 30, 2013
| | | | | | | | |
| | | 2014† | | | 2013 | |
| | |
| Investment Income: | | | | | | | | |
Dividends | | $ | 1,805,541 | | | $ | 1,913,355 | |
Return of capital (Note 1(n)) | | | (561,357) | | | | — | |
Net dividends | | | 1,244,184 | | | | — | |
Interest | | | 899,067 | | | | 501,637 | |
Less: Foreign taxes withheld | | | (41,106) | | | | (54,807) | |
Total Investment Income | | | 2,102,145 | | | | 2,360,185 | |
| | |
| Expenses: | | | | | | | | |
Investment management fee (Note 2) | | | 942,277 | | | | 1,036,723 | |
Legal fees | | | 78,985 | | | | 79,561 | |
Custody fees | | | 72,650 | | | | 84,028 | |
Audit and tax fees | | | 71,286 | | | | 76,132 | |
Registration fees | | | 60,367 | | | | 87,381 | |
Shareholder reports | | | 47,619 | | | | 59,268 | |
Transfer agent fees (Note 5) | | | 34,250 | | | | 32,500 | |
Commodity pool reports | | | 26,042 | | | | — | |
Fund accounting fees | | | 25,987 | | | | 29,536 | |
Service and/or distribution fees (Notes 2 and 5) | | | 22,962 | | | | 34,974 | |
Trustees’ fees | | | 11,516 | | | | 31,527 | |
Insurance | | | 3,070 | | | | 3,950 | |
Fees recaptured by investment manager (Note 2) | | | — | | | | 12 | |
Miscellaneous expenses | | | 6,169 | | | | 10,267 | |
Total Expenses | | | 1,403,180 | | | | 1,565,859 | |
Less: Fee waivers and/or expense reimbursements (Notes 2 and 5) | | | (149,831) | | | | (179,965) | |
Net Expenses | | | 1,253,349 | | | | 1,385,894 | |
| Net Investment Income | | | 848,796 | | | | 974,291 | |
| | |
| Realized and Unrealized Gain (Loss) on Investments, Futures Contracts, Written Options, Swap Contracts and Foreign Currency Transactions (Notes 1, 3 and 4): | | | | | | | | |
Net Realized Gain (Loss) From: | | | | | | | | |
Investment transactions | | | 2,304,449 | | | | 4,474,033 | |
REIT distributions | | | 78,972 | | | | — | |
Futures contracts | | | (2,170,739) | | | | (441,351) | |
Written options | | | 111,907 | | | | 103,608 | |
Swap contracts | | | 1,639,280 | | | | (428,296) | |
Foreign currency transactions | | | (1,699,008) | | | | (1,471,119) | |
Net Realized Gain | | | 264,861 | | | | 2,236,875 | |
Change in Net Unrealized Appreciation (Depreciation) From: | | | | | | | | |
Investments | | | 2,129,506 | | | | (56,705) | |
Futures contracts | | | (1,341,109) | | | | 213,366 | |
Written options | | | (1,459) | | | | 554 | |
Swap contracts | | | (181,087) | | | | (280,919) | |
Foreign currencies | | | (1,288,908) | | | | 368,818 | |
Change in Net Unrealized Appreciation (Depreciation) | | | (683,057) | | | | 245,114 | |
| Net Gain (Loss) on Investments, Futures Contracts, Written Options, Swap Contracts and Foreign Currency Transactions | | | (418,196) | | | | 2,481,989 | |
| Increase in Net Assets from Operations | | $ | 430,600 | | | $ | 3,456,280 | |
| † | For the period December 1, 2013 through September 30, 2014. |
See Notes to Consolidated Financial Statements.
| | |
| QS Legg Mason Strategic Real Return Fund 2014 Annual Report | | 25 |
Consolidated statements of changes in net assets
| | | | | | | | | | | | |
For the Period Ended September 30, 2014
and the Years Ended November 30, | | 2014† | | | 2013 | | | 2012 | |
| | | |
| Operations: | | | | | | | | | | | | |
Net investment income | | $ | 848,796 | | | $ | 974,291 | | | $ | 1,411,578 | |
Net realized gain | | | 264,861 | | | | 2,236,875 | | | | 867,857 | |
Change in net unrealized appreciation (depreciation) | | | (683,057) | | | | 245,114 | | | | 7,540,743 | |
Increase in Net Assets From Operations | | | 430,600 | | | | 3,456,280 | | | | 9,820,178 | |
| | | |
| Distributions to Shareholders From (Notes 1 and 6): | | | | | | | | | | | | |
Net investment income | | | — | | | | (2,500,010) | | | | (1,145,023) | |
Net realized gains | | | (3,971,806) | | | | (581,310) | | | | (85,338) | |
Decrease in Net Assets From Distributions to Shareholders | | | (3,971,806) | | | | (3,081,320) | | | | (1,230,361) | |
| | | |
| Fund Share Transactions (Note 7): | | | | | | | | | | | | |
Net proceeds from sale of shares | | | 15,666,132 | | | | 24,674,406 | | | | 131,022,701 | |
Reinvestment of distributions | | | 3,970,336 | | | | 3,078,820 | | | | 1,229,108 | |
Cost of shares repurchased | | | (14,276,139) | | | | (19,223,259) | | | | (138,547,581) | |
Increase (Decrease) in Net Assets From Fund Share Transactions | | | 5,360,329 | | | | 8,529,967 | | | | (6,295,772) | |
Increase in Net Assets | | | 1,819,123 | | | | 8,904,927 | | | | 2,294,045 | |
| | | |
| Net Assets: | | | | | | | | | | | | |
Beginning of period | | | 142,742,526 | | | | 133,837,599 | | | | 131,543,554 | |
End of period* | | $ | 144,561,649 | | | $ | 142,742,526 | | | $ | 133,837,599 | |
*Includes undistributed (overdistributed) net investment income of: | | | $857,166 | | | | $(411,076) | | | | $2,234,379 | |
| † | For the period December 1, 2013 through September 30, 2014. |
See Notes to Consolidated Financial Statements.
| | |
| 26 | | QS Legg Mason Strategic Real Return Fund 2014 Annual Report |
Consolidated financial highlights
| | | | | | | | | | | | | | | | | | | | |
For a share of each class of beneficial interest outstanding throughout each year ended September 30,
unless otherwise noted: | |
| Class A Shares1 | | 20142 | | | 20133 | | | 20123 | | | 20113 | | | 20104 | |
| | | | | |
| Net asset value, beginning of period | | | $14.20 | | | | $14.16 | | | | $13.27 | | | | $12.73 | | | | $12.00 | |
| | | | | |
| Income (loss) from operations: | | | | | | | | | | | | | | | | | | | | |
Net investment income | | | 0.04 | | | | 0.06 | | | | 0.10 | | | | 0.18 | | | | 0.06 | |
Net realized and unrealized gain (loss) | | | (0.06) | | | | 0.26 | | | | 0.87 | | | | 0.87 | | | | 0.67 | |
Total income (loss) from operations | | | (0.02) | | | | 0.32 | | | | 0.97 | | | | 1.05 | | | | 0.73 | |
| | | | | |
| Less distributions from: | | | | | | | | | | | | | | | | | | | | |
Net investment income | | | — | | | | (0.22) | | | | (0.07) | | | | (0.51) | | | | — | |
Net realized gains | | | (0.40) | | | | (0.06) | | | | (0.01) | | | | — | | | | — | |
Total distributions | | | (0.40) | | | | (0.28) | | | | (0.08) | | | | (0.51) | | | | — | |
| | | | | |
| Net asset value, end of period | | | $13.78 | | | | $14.20 | | | | $14.16 | | | | $13.27 | | | | $12.73 | |
Total return5 | | | (0.15) | % | | | 2.27 | % | | | 7.39 | % | | | 8.42 | % | | | 6.08 | % |
| | | | | |
| Net assets, end of period (000s) | | | $3,697 | | | | $5,156 | | | | $7,573 | | | | $7,201 | | | | $17,464 | |
| | | | | |
| Ratios to average net assets: | | | | | | | | | | | | | | | | | | | | |
Gross expenses6 | | | 1.58 | %7 | | | 1.52 | % | | | 1.51 | % | | | 2.46 | % | | | 4.81 | %7 |
Net expenses6,8,9,10 | | | 1.32 | 7 | | | 1.32 | | | | 1.31 | | | | 1.31 | | | | 1.26 | 7 |
Net investment income | | | 0.32 | 7 | | | 0.41 | | | | 0.75 | | | | 1.33 | | | | 0.63 | 7 |
| | | | | |
| Portfolio turnover rate | | | 25 | % | | | 55 | % | | | 66 | % | | | 70 | % | | | 42 | % |
| 1 | Per share amounts have been calculated using the average shares method. |
| 2 | For the period December 1, 2013 through September 30, 2014. |
| 3 | For the year ended November 30. |
| 4 | For the period February 26, 2010 (inception date) to November 30, 2010. |
| 5 | Performance figures, exclusive of sales charges, may reflect compensating balance arrangements, fee waivers and/or expense reimbursements. In the absence of compensating balance arrangements, fee waivers and/or expense reimbursements, the total return would have been lower. Past performance is no guarantee of future results. Total returns for periods of less than one year are not annualized. |
| 6 | Does not include expenses of the Underlying Funds in which the Fund invests. |
| 8 | As a result of an expense limitation arrangement, the ratio of expenses, other than interest, brokerage commissions (except for brokerage commissions paid on purchases and sales of shares of ETFs), dividend expenses on short sales, taxes and extraordinary expenses, to average net assets of Class A shares did not exceed 1.35%. This expense limitation arrangement cannot be terminated prior to December 31, 2015 without the Board of Trustees’ consent. Acquired fund fees and expenses are subject to the expense limitation arrangement. |
| 9 | Reflects fee waivers and/or expense reimbursements. |
| 10 | The impact of compensating balance arrangements, if any, was less than 0.01%. |
See Notes to Consolidated Financial Statements.
| | |
| QS Legg Mason Strategic Real Return Fund 2014 Annual Report | | 27 |
Consolidated financial highlights (cont’d)
| | | | | | | | | | | | |
For a share of each class of beneficial interest outstanding throughout each year ended September 30,
unless otherwise noted: | |
| Class A2 Shares1 | | 20142 | | | 20133 | | | 20124 | |
| | | |
| Net asset value, beginning of period | | | $14.13 | | | | $14.16 | | | | $14.01 | |
| | | |
| Income (loss) from operations: | | | | | | | | | | | | |
Net investment income | | | 0.02 | | | | 0.03 | | | | 0.01 | |
Net realized and unrealized gain (loss) | | | (0.06) | | | | 0.27 | | | | 0.14 | |
Total income (loss) from operations | | | (0.04) | | | | 0.30 | | | | 0.15 | |
| | | |
| Less distributions from: | | | | | | | | | | | | |
Net investment income | | | — | | | | (0.27) | | | | — | |
Net realized gains | | | (0.40) | | | | (0.06) | | | | — | |
Total distributions | | | (0.40) | | | | (0.33) | | | | — | |
| | | |
| Net asset value, end of period | | | $13.69 | | | | $14.13 | | | | $14.16 | |
Total return5 | | | (0.30) | % | | | 2.17 | % | | | 1.07 | % |
| | | |
| Net assets, end of period (000s) | | | $1,844 | | | | $1,672 | | | | $154 | |
| | | |
| Ratios to average net assets: | | | | | | | | | | | | |
Gross expenses6 | | | 2.08 | %7 | | | 1.83 | %8 | | | 1.74 | %7 |
Net expenses6,9,10,11 | | | 1.52 | 7 | | | 1.49 | 8 | | | 1.51 | 7 |
Net investment income | | | 0.17 | 7 | | | 0.24 | | | | 1.20 | 7 |
| | | |
| Portfolio turnover rate | | | 25 | % | | | 55 | % | | | 66 | % |
| 1 | Per share amounts have been calculated using the average shares method. |
| 2 | For the period December 1, 2013 through September 30, 2014. |
| 3 | For the year ended November 30. |
| 4 | For the period October 31, 2012 (inception date) to November 30, 2012. |
| 5 | Performance figures, exclusive of sales charges, may reflect compensating balance arrangements, fee waivers and/or expense reimbursements. In the absence of compensating balance arrangements, fee waivers and/or expense reimbursements, the total return would have been lower. Past performance is no guarantee of future results. Total returns for periods of less than one year are not annualized. |
| 6 | Does not include expenses of the Underlying Funds in which the Fund invests. |
| 8 | Reflects recapture of expenses waived/reimbursed from prior fiscal years. |
| 9 | As a result of an expense limitation arrangement, the ratio of expenses, other than interest, brokerage commissions (except for brokerage commissions paid on purchases and sales of shares of ETFs), dividend expenses on short sales, taxes and extraordinary expenses, to average net assets of Class A2 shares did not exceed 1.55%. This expense limitation arrangement cannot be terminated prior to December 31, 2015 without the Board of Trustees’ consent. Acquired fund fees and expenses are subject to the expense limitation arrangement. |
| 10 | Reflects fee waivers and/or expense reimbursements. |
| 11 | The impact of compensating balance arrangements, if any, was less than 0.01%. |
See Notes to Consolidated Financial Statements.
| | |
| 28 | | QS Legg Mason Strategic Real Return Fund 2014 Annual Report |
| | | | | | | | | | | | | | | | | | | | |
For a share of each class of beneficial interest outstanding throughout each year ended September 30,
unless otherwise noted: | |
| Class C Shares1 | | 20142 | | | 20133 | | | 20123 | | | 20113 | | | 20104 | |
| | | | | |
| Net asset value, beginning of period | | | $14.13 | | | | $14.07 | | | | $13.22 | | | | $12.66 | | | | $12.00 | |
| | | | | |
| Income (loss) from operations: | | | | | | | | | | | | | | | | | | | | |
Net investment income (loss) | | | (0.05) | | | | (0.05) | | | | (0.00) | 5 | | | 0.08 | | | | (0.02) | |
Net realized and unrealized gain (loss) | | | (0.05) | | | | 0.26 | | | | 0.86 | | | | 0.89 | | | | 0.68 | |
Total income (loss) from operations | | | (0.10) | | | | 0.21 | | | | 0.86 | | | | 0.97 | | | | 0.66 | |
| | | | | |
| Less distributions from: | | | | | | | | | | | | | | | | | | | | |
Net investment income | | | — | | | | (0.09) | | | | (0.00) | 5 | | | (0.41) | | | | — | |
Net realized gains | | | (0.40) | | | | (0.06) | | | | (0.01) | | | | — | | | | — | |
Total distributions | | | (0.40) | | | | (0.15) | | | | (0.01) | | | | (0.41) | | | | — | |
| | | | | |
| Net asset value, end of period | | | $13.63 | | | | $14.13 | | | | $14.07 | | | | $13.22 | | | | $12.66 | |
Total return6 | | | (0.74) | % | | | 1.49 | % | | | 6.52 | % | | | 7.79 | % | | | 5.50 | % |
| | | | | |
| Net assets, end of period (000s) | | | $1,035 | | | | $1,260 | | | | $1,808 | | | | $2,061 | | | | $1,013 | |
| | | | | |
| Ratios to average net assets: | | | | | | | | | | | | | | | | | | | | |
Gross expenses7 | | | 2.42 | %8 | | | 2.43 | % | | | 2.45 | % | | | 3.41 | % | | | 5.44 | %8 |
Net expenses7,9,10,11 | | | 2.07 | 8 | | | 2.07 | | | | 2.06 | | | | 2.06 | | | | 2.01 | 8 |
Net investment income (loss) | | | (0.42) | 8 | | | (0.33) | | | | (0.02) | | | | 0.57 | | | | (0.22) | 8 |
| | | | | |
| Portfolio turnover rate | | | 25 | % | | | 55 | % | | | 66 | % | | | 70 | % | | | 42 | % |
| 1 | Per share amounts have been calculated using the average shares method. |
| 2 | For the period December 1, 2013 through September 30, 2014. |
| 3 | For the year ended November 30. |
| 4 | For the period February 26, 2010 (inception date) to November 30, 2010. |
| 5 | Amount represents less than $0.01 per share. |
| 6 | Performance figures, exclusive of CDSC, may reflect compensating balance arrangements, fee waivers and/or expense reimbursements. In the absence of compensating balance arrangements, fee waivers and/or expense reimbursements, the total return would have been lower. Past performance is no guarantee of future results. Total returns for periods of less than one year are not annualized. |
| 7 | Does not include expenses of the Underlying Funds in which the Fund invests. |
| 9 | As a result of an expense limitation arrangement, the ratio of expenses, other than interest, brokerage commissions (except for brokerage commissions paid on purchases and sales of shares of ETFs), dividend expenses on short sales, taxes and extraordinary expenses, to average net assets of Class C shares did not exceed 2.10%. This expense limitation arrangement cannot be terminated prior to December 31, 2015 without the Board of Trustees’ consent. Acquired fund fees and expenses are subject to the expense limitation arrangement. |
| 10 | Reflects fee waivers and/or expense reimbursements. |
| 11 | The impact of compensating balance arrangements, if any, was less than 0.01%. |
See Notes to Consolidated Financial Statements.
| | |
| QS Legg Mason Strategic Real Return Fund 2014 Annual Report | | 29 |
Consolidated financial highlights (cont’d)
| | | | | | | | | | | | | | | | | | | | |
For a share of each class of beneficial interest outstanding throughout each year ended September 30,
unless otherwise noted: | |
| Class I Shares1 | | 20142 | | | 20133 | | | 20123 | | | 20113 | | | 20104 | |
| | | | | |
| Net asset value, beginning of period | | | $14.42 | | | | $14.19 | | | | $13.30 | | | | $12.75 | | | | $12.00 | |
| | | | | |
| Income (loss) from operations: | | | | | | | | | | | | | | | | | | | | |
Net investment income (loss) | | | 0.07 | | | | 0.10 | | | | (0.04) | | | | 0.07 | | | | 0.05 | |
Net realized and unrealized gain (loss) | | | (0.07) | | | | 0.26 | | | | 1.05 | | | | 1.03 | | | | 0.70 | |
Total income (loss) from operations | | | (0.00) | 5 | | | 0.36 | | | | 1.01 | | | | 1.10 | | | | 0.75 | |
| | | | | |
| Less distributions from: | | | | | | | | | | | | | | | | | | | | |
Net investment income | | | — | | | | (0.07) | | | | (0.11) | | | | (0.55) | | | | — | |
Net realized gains | | | (0.40) | | | | (0.06) | | | | (0.01) | | | | — | | | | — | |
Total distributions | | | (0.40) | | | | (0.13) | | | | (0.12) | | | | (0.55) | | | | — | |
| | | | | |
| Net asset value, end of period | | | $14.02 | | | | $14.42 | | | | $14.19 | | | | $13.30 | | | | $12.75 | |
Total return6 | | | (0.01) | % | | | 2.59 | % | | | 7.64 | % | | | 8.76 | % | | | 6.25 | % |
| | | | | |
| Net assets, end of period (000s) | | | $955 | | | | $890 | | | | $613 | | | | $122,282 | | | | $823 | |
| | | | | |
| Ratios to average net assets: | | | | | | | | | | | | | | | | | | | | |
Gross expenses7 | | | 1.44 | %8 | | | 1.26 | %9 | | | 1.22 | % | | | 1.61 | % | | | 4.67 | %8 |
Net expenses7,10,11,12 | | | 1.07 | 8 | | | 1.07 | 9 | | | 1.06 | | | | 1.06 | | | | 1.01 | 8 |
Net investment income (loss) | | | 0.61 | 8 | | | 0.69 | | | | (0.32) | | | | 0.61 | | | | 0.50 | 8 |
| | | | | |
| Portfolio turnover rate | | | 25 | % | | | 55 | % | | | 66 | % | | | 70 | % | | | 42 | % |
| 1 | Per share amounts have been calculated using the average shares method. |
| 2 | For the period December 1, 2013 through September 30, 2014. |
| 3 | For the year ended November 30. |
| 4 | For the period February 26, 2010 (inception date) to November 30, 2010. |
| 5 | Amount represents less than $0.01 per share. |
| 6 | Performance figures may reflect compensating balance arrangements, fee waivers and/or expense reimbursements. In the absence of compensating balance arrangements, fee waivers and/or expense reimbursements, the total return would have been lower. Past performance is no guarantee of future results. Total returns for periods of less than one year are not annualized. |
| 7 | Does not include expenses of the Underlying Funds in which the Fund invests. |
| 9 | Reflects recapture of expenses waived/reimbursed from prior fiscal years. |
| 10 | As a result of an expense limitation arrangement, the ratio of expenses, other than interest, brokerage commissions (except for brokerage commissions paid on purchases and sales of shares of ETFs), dividend expenses on short sales, taxes and extraordinary expenses, to average net assets of Class I shares did not exceed 1.10%. This expense limitation arrangement cannot be terminated prior to December 31, 2015 without the Board of Trustees’ consent. Acquired fund fees and expenses are subject to the expense limitation arrangement. |
| 11 | Reflects fee waivers and/or expense reimbursements. |
| 12 | The impact of compensating balance arrangements, if any, was less than 0.01%. |
See Notes to Consolidated Financial Statements.
| | |
| 30 | | QS Legg Mason Strategic Real Return Fund 2014 Annual Report |
| | | | | | | | | | | | |
For a share of each class of beneficial interest outstanding throughout each year ended September 30,
unless otherwise noted: | |
| Class IS Shares1 | | 20142 | | | 20133 | | | 20124 | |
| | | |
| Net asset value, beginning of period | | | $14.22 | | | | $14.19 | | | | $12.99 | |
| | | |
| Income (loss) from operations: | | | | | | | | | | | | |
Net investment income | | | 0.08 | | | | 0.10 | | | | 0.15 | |
Net realized and unrealized gain (loss) | | | (0.05) | | | | 0.26 | | | | 1.17 | |
Total income from operations | | | 0.03 | | | | 0.36 | | | | 1.32 | |
| | | |
| Less distributions from: | | | | | | | | | | | | |
Net investment income | | | — | | | | (0.27) | | | | (0.12) | |
Net realized gains | | | (0.40) | | | | (0.06) | | | | (0.00) | 5 |
Total distributions | | | (0.40) | | | | (0.33) | | | | (0.12) | |
| | | |
| Net asset value, end of period | | | $13.85 | | | | $14.22 | | | | $14.19 | |
Total return6 | | | 0.21 | % | | | 2.60 | % | | | 10.25 | % |
| | | |
| Net assets, end of period (000s) | | | $137,031 | | | | $133,765 | | | | $123,690 | |
| | | |
| Ratios to average net assets: | | | | | | | | | | | | |
Gross expenses7 | | | 1.08 | %8 | | | 1.09 | % | | | 1.06 | %8 |
Net expenses7,9,10,11 | | | 0.97 | 8 | | | 0.97 | | | | 0.96 | 8 |
Net investment income | | | 0.70 | 8 | | | 0.74 | | | | 1.16 | 8 |
| | | |
| Portfolio turnover rate | | | 25 | % | | | 55 | % | | | 66 | % |
| 1 | Per share amounts have been calculated using the average shares method. |
| 2 | For the period December 1, 2013 through September 30, 2014. |
| 3 | For the year ended November 30. |
| 4 | For the period December 15, 2011 (inception date) to November 30, 2012. |
| 5 | Amount represents less than $0.01 per share. |
| 6 | Performance figures may reflect compensating balance arrangements, fee waivers and/or expense reimbursements. In the absence of compensating balance arrangements, fee waivers and/or expense reimbursements, the total return would have been lower. Past performance is no guarantee of future results. Total returns for periods of less than one year are not annualized. |
| 7 | Does not include expenses of the Underlying Funds in which the Fund invests. |
| 9 | As a result of an expense limitation arrangement, the ratio of expenses, other than interest, brokerage commissions (except for brokerage commissions paid on purchases and sales of shares of ETFs), dividend expenses on short sales, taxes and extraordinary expenses, to average net assets of Class IS shares did not exceed 1.00%. In addition, total annual operating expenses for Class IS shares did not exceed total annual operating expenses for Class I shares. These expense limitation arrangements cannot be terminated prior to December 31, 2015 without the Board of Trustees’ consent. Acquired fund fees and expenses are subject to the expense limitation arrangement. |
| 10 | Reflects fee waivers and/or expense reimbursements. |
| 11 | The impact of compensating balance arrangements, if any, was less than 0.01%. |
See Notes to Consolidated Financial Statements.
| | |
| QS Legg Mason Strategic Real Return Fund 2014 Annual Report | | 31 |
Notes to consolidated financial statements
1. Organization and significant accounting policies
QS Legg Mason Strategic Real Return Fund (formerly Legg Mason Strategic Real Return Fund) (the “Fund”) is a separate non-diversified investment series of Legg Mason Global Asset Management Trust (the “Trust”). The Trust, a Maryland statutory trust, is registered under the Investment Company Act of 1940, as amended (the “1940 Act”), as an open-end management investment company. At a meeting held in May 2014, the Fund’s Board of Trustees approved changing the Fund’s fiscal year-end from November 30th to September 30th. This change resulted in a short-period annual report for the ten-month period from December 1, 2013 through September 30, 2014.
The Fund gains exposure to the commodities markets by investing a portion of its assets in a wholly-owned subsidiary, Real Return Fund Ltd. (the “Subsidiary”), organized under the laws of the Cayman Islands. Among other investments, the Subsidiary may invest in commodity-linked instruments. These financial statements are consolidated financial statements of the Fund and the Subsidiary.
The following are significant accounting policies consistently followed by the Fund and are in conformity with U.S. generally accepted accounting principles (“GAAP”). Estimates and assumptions are required to be made regarding assets, liabilities and changes in net assets resulting from operations when financial statements are prepared. Changes in the economic environment, financial markets and any other parameters used in determining these estimates could cause actual results to differ. Subsequent events have been evaluated through the date the consolidated financial statements were issued.
(a) Investment valuation. Equity securities for which market quotations are available are valued at the last reported sales price or official closing price on the primary market or exchange on which they trade. The valuations for fixed income securities (which may include, but are not limited to, corporate, government, municipal, mortgage-backed, collateralized mortgage obligations and asset-backed securities) and certain derivative instruments are typically the prices supplied by independent third party pricing services, which may use market prices or broker/dealer quotations or a variety of valuation techniques and methodologies. The independent third party pricing services use inputs that are observable such as issuer details, interest rates, yield curves, prepayment speeds, credit risks/spreads, default rates and quoted prices for similar securities. Short-term fixed income securities that will mature in 60 days or less are valued at amortized cost, unless it is determined that using this method would not reflect an investment’s fair value. Futures contracts are valued daily at the settlement price established by the board of trade or exchange on which they are traded. When the Fund holds securities or other assets that are denominated in a foreign currency, the Fund will normally use the currency exchange rates as of 4:00 p.m. (Eastern Time). If independent third party pricing services are unable to supply prices for a portfolio investment, or if the prices supplied are deemed by the manager to be unreliable, the market price may be determined by the manager using quotations from one or more broker/dealers or at the transaction price if the security has recently been purchased and no value has yet been obtained from a pricing service or pricing broker.
| | |
| 32 | | QS Legg Mason Strategic Real Return Fund 2014 Annual Report |
When reliable prices are not readily available, such as when the value of a security has been significantly affected by events after the close of the exchange or market on which the security is principally traded, but before the Fund calculates its net asset value, the Fund values these securities as determined in accordance with procedures approved by the Fund’s Board of Trustees.
The Board of Trustees is responsible for the valuation process and has delegated the supervision of the daily valuation process to the Legg Mason North American Fund Valuation Committee (the “Valuation Committee”). The Valuation Committee, pursuant to the policies adopted by the Board of Trustees, is responsible for making fair value determinations, evaluating the effectiveness of the Fund’s pricing policies, and reporting to the Board of Trustees. When determining the reliability of third party pricing information for investments owned by the Fund, the Valuation Committee, among other things, conducts due diligence reviews of pricing vendors, monitors the daily change in prices and reviews transactions among market participants.
The Valuation Committee will consider pricing methodologies it deems relevant and appropriate when making fair value determinations. Examples of possible methodologies include, but are not limited to, multiple of earnings; discount from market of a similar freely traded security; discounted cash-flow analysis; book value or a multiple thereof; risk premium/yield analysis; yield to maturity; and/or fundamental investment analysis. The Valuation Committee will also consider factors it deems relevant and appropriate in light of the facts and circumstances. Examples of possible factors include, but are not limited to, the type of security; the issuer’s financial statements; the purchase price of the security; the discount from market value of unrestricted securities of the same class at the time of purchase; analysts’ research and observations from financial institutions; information regarding any transactions or offers with respect to the security; the existence of merger proposals or tender offers affecting the security; the price and extent of public trading in similar securities of the issuer or comparable companies; and the existence of a shelf registration for restricted securities.
For each portfolio security that has been fair valued pursuant to the policies adopted by the Board of Trustees, the fair value price is compared against the last available and next available market quotations. The Valuation Committee reviews the results of such back testing monthly and fair valuation occurrences are reported to the Board of Trustees quarterly.
The Fund uses valuation techniques to measure fair value that are consistent with the market approach and/or income approach, depending on the type of security and the particular circumstance. The market approach uses prices and other relevant information generated by market transactions involving identical or comparable securities. The income approach uses valuation techniques to discount estimated future cash flows to present value.
| | |
| QS Legg Mason Strategic Real Return Fund 2014 Annual Report | | 33 |
Notes to consolidated financial statements (cont’d)
GAAP establishes a disclosure hierarchy that categorizes the inputs to valuation techniques used to value assets and liabilities at measurement date. These inputs are summarized in the three broad levels listed below:
| Ÿ | | Level 1 — quoted prices in active markets for identical investments |
| Ÿ | | Level 2 — other significant observable inputs (including quoted prices for similar investments, interest rates, prepayment speeds, credit risk, etc.) |
| Ÿ | | Level 3 — significant unobservable inputs (including the Fund’s own assumptions in determining the fair value of investments) |
The inputs or methodologies used to value securities are not necessarily an indication of the risk associated with investing in those securities.
The following is a summary of the inputs used in valuing the Fund’s assets and liabilities carried at fair value:
| | | | | | | | | | | | | | | | |
| ASSETS | |
| Description | | Quoted Prices
(Level 1) | | | Other Significant
Observable Inputs
(Level 2) | | | Significant
Unobservable
Inputs
(Level 3) | | | Total | |
| Long-term investments†: | | | | | | | | | | | | | | | | |
U.S. Treasury inflation protected securities | | | — | | | $ | 59,158,891 | | | | — | | | $ | 59,158,891 | |
Non-U.S. Treasury inflation protected securities | | | — | | | | 55,723 | | | | — | | | | 55,723 | |
Common stocks | | $ | 29,494,501 | | | | — | | | | — | | | | 29,494,501 | |
Investments in underlying funds | | | 29,974,873 | | | | — | | | | — | | | | 29,974,873 | |
Preferred stocks | | | 383,281 | | | | — | | | | — | | | | 383,281 | |
| Total long-term investments | | $ | 59,852,655 | | | $ | 59,214,614 | | | | — | | | $ | 119,067,269 | |
| Short-term investments† | | | — | | | | 18,150,000 | | | | — | | | | 18,150,000 | |
| Total investments | | $ | 59,852,655 | | | $ | 77,364,614 | | | | — | | | $ | 137,217,269 | |
| Other financial instruments: | | | | | | | | | | | | | | | | |
Forward foreign currency contracts | | | — | | | $ | 237,938 | | | | — | | | $ | 237,938 | |
| Total | | $ | 59,852,655 | | | $ | 77,602,552 | | | | — | | | $ | 137,455,207 | |
| | | | | | | | | | | | | | | | |
| LIABILITIES | |
| Description | | Quoted Prices
(Level 1) | | | Other Significant
Observable Inputs
(Level 2) | | | Significant
Unobservable
Inputs
(Level 3) | | | Total | |
| Other financial instruments: | | | | | | | | | | | | | | | | |
Futures contracts | | $ | 1,079,594 | | | | — | | | | — | | | $ | 1,079,594 | |
Forward foreign currency contracts | | | — | | | $ | 1,236,264 | | | | — | | | | 1,236,264 | |
| Total | | $ | 1,079,594 | | | $ | 1,236,264 | | | | — | | | $ | 2,315,858 | |
| † | See Schedule of Investments for additional detailed categorizations. |
(b) Repurchase agreements. The Fund may enter into repurchase agreements with institutions that its investment adviser has determined are creditworthy. Each repurchase
| | |
| 34 | | QS Legg Mason Strategic Real Return Fund 2014 Annual Report |
agreement is recorded at cost. Under the terms of a typical repurchase agreement, the Fund acquires a debt security subject to an obligation of the seller to repurchase, and of the Fund to resell, the security at an agreed-upon price and time, thereby determining the yield during the Fund’s holding period. When entering into repurchase agreements, it is the Fund’s policy that its custodian or a third party custodian, acting on the Fund’s behalf, take possession of the underlying collateral securities, the market value of which, at all times, at least equals the principal amount of the repurchase transaction, including accrued interest. To the extent that any repurchase transaction maturity exceeds one business day, the value of the collateral is marked-to-market and measured against the value of the agreement in an effort to ensure the adequacy of the collateral. If the counterparty defaults, the Fund generally has the right to use the collateral to satisfy the terms of the repurchase transaction. However, if the market value of the collateral declines during the period in which the Fund seeks to assert its rights or if bankruptcy proceedings are commenced with respect to the seller of the security, realization of the collateral by the Fund may be delayed or limited.
(c) Futures contracts. The Fund uses futures contracts generally to gain exposure to, or hedge against, changes in interest rates or gain exposure to, or hedge against, changes in certain asset classes, including commodity markets. A futures contract represents a commitment for the future purchase or sale of an asset at a specified price on a specified date.
Upon entering into a futures contract, the Fund is required to deposit cash or cash equivalents with a broker in an amount equal to a certain percentage of the contract amount. This is known as the ‘‘initial margin’’ and subsequent payments (‘‘variation margin’’) are made or received by the Fund each day, depending on the daily fluctuation in the value of the contract. For certain futures, including foreign denominated futures, variation margin is not settled daily, but is recorded as a net variation margin payable or receivable. Futures contracts are valued daily at the settlement price established by the board of trade or exchange on which they are traded. The daily changes in contract value are recorded as unrealized gains or losses in the Consolidated Statements of Operations and the Fund recognizes a realized gain or loss when the contract is closed.
Futures contracts involve, to varying degrees, risk of loss in excess of the amounts reflected in the financial statements. In addition, there is the risk that the Fund may not be able to enter into a closing transaction because of an illiquid secondary market.
(d) Forward foreign currency contracts. The Fund enters into a forward foreign currency contract to maintain its target exposure to foreign currencies, to hedge against foreign currency exchange rate risk on its non-U.S. dollar denominated securities, to facilitate settlement of a foreign currency denominated portfolio transaction or to attempt to increase the Fund’s return. A forward foreign currency contract is an agreement between two parties to buy and sell a currency at a set price with delivery and settlement at a future date. The contract is marked-to-market daily and the change in value is recorded by the Fund as an unrealized gain or loss. When a forward foreign currency contract is closed, through either delivery or offset by entering into another forward foreign currency contract, the Fund
| | |
| QS Legg Mason Strategic Real Return Fund 2014 Annual Report | | 35 |
Notes to consolidated financial statements (cont’d)
recognizes a realized gain or loss equal to the difference between the value of the contract at the time it was opened and the value of the contract at the time it is closed.
Forward foreign currency contracts involve elements of market risk in excess of the amounts reflected on the Consolidated Statement of Assets and Liabilities. The Fund bears the risk of an unfavorable change in the foreign exchange rate underlying the forward foreign currency contract. Risks may also arise upon entering into these contracts from the potential inability of the counterparties to meet the terms of their contracts.
(e) Purchased options. When the Fund purchases an option, an amount equal to the premium paid by the Fund is recorded as an investment on the Consolidated Statement of Assets and Liabilities, the value of which is marked-to-market to reflect the current market value of the option purchased. If the purchased option expires, the Fund realizes a loss equal to the amount of premium paid. When an instrument is purchased or sold through the exercise of an option, the related premium paid is added to the basis of the instrument acquired or deducted from the proceeds of the instrument sold. The risk associated with purchasing put and call options is limited to the premium paid.
(f) Written options. The Fund writes options to attempt to increase the Fund’s return, as a substitute for investing directly in a security or to attempt to hedge the Fund’s investments. When the Fund writes an option, an amount equal to the premium received by the Fund is recorded as a liability, the value of which is marked-to-market daily to reflect the current market value of the option written. If the option expires, the premium received is recorded as a realized gain. When a written call option is exercised, the difference between the premium received plus the option exercise price and the Fund’s basis in the underlying security (in the case of a covered written call option), or the cost to purchase the underlying security (in the case of an uncovered written call option), including brokerage commission, is recognized as a realized gain or loss. When a written put option is exercised, the amount of the premium received is subtracted from the cost of the security purchased by the Fund from the exercise of the written put option to form the Fund’s basis in the underlying security purchased. The writer or buyer of an option traded on an exchange can liquidate the position before the exercise of the option by entering into a closing transaction. The cost of a closing transaction is deducted from the original premium received resulting in a realized gain or loss to the Fund.
The risk in writing a covered call option is that the Fund may forego the opportunity of profit if the market price of the underlying security increases and the option is exercised. The risk in writing a put option is that the Fund may incur a loss if the market price of the underlying security decreases and the option is exercised. The risk in writing an uncovered call option is that the Fund is exposed to the risk of loss if the market price of the underlying security increases. In addition, there is the risk that the Fund may not be able to enter into a closing transaction because of an illiquid secondary market.
(g) Swap agreements. The Fund invests in swaps for the purpose of managing its exposure to interest rate, credit or market risk, or for other purposes, including to increase
| | |
| 36 | | QS Legg Mason Strategic Real Return Fund 2014 Annual Report |
the Fund’s return. The use of swaps involves risks that are different from those associated with other portfolio transactions. Swap agreements are privately negotiated in the over-the-counter market (“OTC Swaps”) or may be executed on a registered exchange (“Centrally Cleared Swaps”). Unlike Centrally Cleared Swaps, the Fund has credit exposure to the counterparties of OTC Swaps.
Swap contracts are marked-to-market daily and changes in value are recorded as unrealized appreciation (depreciation). The daily change in valuation of Centrally Cleared Swaps, if any, is recorded as a receivable or payable for variation margin on the Consolidated Statement of Assets and Liabilities. Gains or losses are realized upon termination of the swap agreement. Collateral, in the form of restricted cash or securities, may be required to be held in segregated accounts with the Fund’s custodian in compliance with the terms of the swap contracts. Securities posted as collateral for swap contracts are identified in the Consolidated Schedule of Investments and restricted cash, if any, is identified on the Consolidated Statement of Assets and Liabilities. Risks may exceed amounts recorded in the Consolidated Statement of Assets and Liabilities. These risks include changes in the returns of the underlying instruments, failure of the counterparties to perform under the contracts’ terms, and the possible lack of liquidity with respect to the swap agreements.
OTC swap payments received or made at the beginning of the measurement period are reflected as a premium or deposit, respectively, on the Consolidated Statement of Assets and Liabilities. These upfront payments are amortized over the life of the swap and are recognized as realized gain or loss in the Consolidated Statements of Operations. Net periodic payments received or paid by the Fund are recognized as a realized gain or loss in the Consolidated Statements of Operations.
The Fund’s maximum exposure in the event of a defined credit event on a credit default swap to sell protection is the notional amount. As of September 30, 2014, the Fund did not hold any credit default swaps to sell protection.
For average notional amounts of swaps held during the period ended September 30, 2014, see Note 4.
Commodity swaps.
The Fund enters into commodity swaps for the purposes of managing its exposure to commodity markets. Commodity swaps are agreements between two parties to exchange cash flows based upon changes to a commodity reference price for a specified notional principal amount. To the extent the commodity reference price exceeds the offsetting interest obligation, the Fund will receive a payment from the counterparty. To the extent it is less, the Fund will make a payment to the counterparty. The risks of commodity swaps include changes in market conditions that will affect the value of the contract or changes in the present value of the future cash flow streams and the possible inability of the counterparty to fulfill its obligations under the agreement. The Fund’s maximum risk of loss from counterparty credit risk is the discounted net value of the cash flows to be received from the counterparty over the contract’s remaining life, to the extent that the amount is positive.
| | |
| QS Legg Mason Strategic Real Return Fund 2014 Annual Report | | 37 |
Notes to consolidated financial statements (cont’d)
(h) Foreign currency translation. Investment securities and other assets and liabilities denominated in foreign currencies are translated into U.S. dollar amounts based upon prevailing exchange rates on the date of valuation. Purchases and sales of investment securities and income and expense items denominated in foreign currencies are translated into U.S. dollar amounts based upon prevailing exchange rates on the respective dates of such transactions.
The Fund does not isolate that portion of the results of operations resulting from fluctuations in foreign exchange rates on investments from the fluctuations arising from changes in market prices of securities held. Such fluctuations are included with the net realized and unrealized gain or loss on investments.
Net realized foreign exchange gains or losses arise from sales of foreign currencies, including gains and losses on forward foreign currency contracts, currency gains or losses realized between the trade and settlement dates on securities transactions, and the difference between the amounts of dividends, interest, and foreign withholding taxes recorded on the Fund’s books and the U.S. dollar equivalent of the amounts actually received or paid. Net unrealized foreign exchange gains and losses arise from changes in the values of assets and liabilities, other than investments in securities, on the date of valuation, resulting from changes in exchange rates.
Foreign security and currency transactions may involve certain considerations and risks not typically associated with those of U.S. dollar denominated transactions as a result of, among other factors, the possibility of lower levels of governmental supervision and regulation of foreign securities markets and the possibility of political or economic instability.
(i) Inflation-indexed bonds. Inflation-indexed bonds are fixed-income securities whose principal value or interest rate is periodically adjusted according to the rate of inflation. As the index measuring inflation changes, the principal value or interest rate of inflation-indexed bonds will be adjusted accordingly. Inflation adjustments to the principal amount of inflation-indexed bonds are reflected as an increase or decrease to investment income on the Consolidated Statements of Operations. Repayment of the original bond principal upon maturity (as adjusted for inflation) is guaranteed in the case of U.S. Treasury inflation-indexed bonds. For bonds that do not provide a similar guarantee, the adjusted principal value of the bond repaid at maturity may be less than the original principal.
(j) Foreign investment risks. The Fund’s investments in foreign securities may involve risks not present in domestic investments. Since securities may be denominated in foreign currencies, may require settlement in foreign currencies or pay interest or dividends in foreign currencies, changes in the relationship of these foreign currencies to the U.S. dollar can significantly affect the value of the investments and earnings of the Fund. Foreign investments may also subject the Fund to foreign government exchange restrictions, expropriation, taxation or other political, social or economic developments, all of which affect the market and/or credit risk of the investments.
| | |
| 38 | | QS Legg Mason Strategic Real Return Fund 2014 Annual Report |
(k) Counterparty risk and credit-risk-related contingent features of derivative instruments. The Fund may invest in certain securities or engage in other transactions, where the Fund is exposed to counterparty credit risk in addition to broader market risks. The Fund may invest in securities of issuers, which may also be considered counterparties as trading partners in other transactions. This may increase the risk of loss in the event of default or bankruptcy by the counterparty or if the counterparty otherwise fails to meet its contractual obligations. The Fund’s investment manager attempts to mitigate counterparty risk by (i) periodically assessing the creditworthiness of its trading partners, (ii) monitoring and/or limiting the amount of its net exposure to each individual counterparty based on its assessment and (iii) requiring collateral from the counterparty for certain transactions. Market events and changes in overall economic conditions may impact the assessment of such counterparty risk by the investment manager. In addition, declines in the values of underlying collateral received may expose the Fund to increased risk of loss.
The Fund has entered into master agreements with certain of its derivative counterparties that provide for general obligations, representations, agreements, collateral, events of default or termination and credit related contingent features. The credit related contingent features include, but are not limited to, a percentage decrease in the Fund’s net assets or NAV over a specified period of time. If these credit related contingent features were triggered, the derivatives counterparty could terminate the positions and demand payment or require additional collateral.
Collateral requirements differ by type of derivative. Collateral or margin requirements are set by the broker or exchange clearinghouse for exchange traded derivatives while collateral terms are contract specific for over-the-counter traded derivatives. Cash collateral that has been pledged to cover obligations of the Fund under derivative contracts, if any, will be reported separately in the Consolidated Statement of Assets and Liabilities. Securities pledged as collateral, if any, for the same purpose are noted in the Consolidated Schedule of Investments.
Absent an event of default by the counterparty or a termination of the agreement, the terms of the master agreements do not result in an offset of reported amounts of financial assets and financial liabilities in the Consolidated Statement of Assets and Liabilities across transactions between the Fund and the applicable counterparty. The enforceability of the right to offset may vary by jurisdiction.
As of September 30, 2014, the Fund held forward foreign currency contracts with credit related contingent features which had a liability position of $1,236,264. If a contingent feature in the master agreements would have been triggered, the Fund would have been required to pay this amount to its derivatives counterparties.
(l) Security transactions and investment income. Security transactions are accounted for on a trade date basis. Interest income, adjusted for amortization of premium and accretion of discount, is recorded on the accrual basis. Dividend income is recorded on the ex-dividend date. Foreign dividend income is recorded on the ex-dividend date or as
| | |
| QS Legg Mason Strategic Real Return Fund 2014 Annual Report | | 39 |
Notes to consolidated financial statements (cont’d)
soon as practicable after the Fund determines the existence of a dividend declaration after exercising reasonable due diligence. The cost of investments sold is determined by use of the specific identification method. To the extent any issuer defaults or a credit event occurs that impacts the issuer, the Fund may halt any additional interest income accruals and consider the realizability of interest accrued up to the date of default or credit event.
(m) Distributions to shareholders. Distributions from net investment income and distributions of net realized gains, if any, are declared at least annually. Distributions to shareholders of the Fund are recorded on the ex-dividend date and are determined in accordance with income tax regulations, which may differ from GAAP.
(n) REIT distributions. The character of distributions received from Real Estate Investment Trusts (‘‘REITs’’) held by the Fund is generally comprised of net investment income, capital gains, and return of capital. It is the policy of the Fund to estimate the character of distributions received from underlying REITs based on historical data provided by the REITs. After each calendar year end, REITs report the actual tax character of these distributions. Differences between the estimated and actual amounts reported by the REITs are reflected in the Fund’s records in the year in which they are reported by the REITs by adjusting related investment cost basis, capital gains and income, as necessary.
(o) Compensating balance arrangements. The Fund has an arrangement with its custodian bank whereby a portion of the custodian’s fees is paid indirectly by credits earned on the Fund’s cash on deposit with the bank.
(p) Share class accounting. Investment income, common expenses and realized/unrealized gains (losses) on investments are allocated to the various classes of the Fund on the basis of daily net assets of each class. Fees relating to a specific class are charged directly to that share class.
(q) Federal and other taxes. It is the Fund’s policy to comply with the federal income and excise tax requirements of the Internal Revenue Code of 1986 (the “Code”), as amended, applicable to regulated investment companies. Accordingly, the Fund intends to distribute its taxable income and net realized gains, if any, to shareholders in accordance with timing requirements imposed by the Code. Therefore, no federal or state income tax provision is required in the Fund’s financial statements.
Management has analyzed the Fund’s tax positions taken on income tax returns for all open tax years and has concluded that as of September 30, 2014, no provision for income tax is required in the Fund’s financial statements. The Fund’s federal and state income and federal excise tax returns for tax years for which the applicable statutes of limitations have not expired are subject to examination by the Internal Revenue Service and state departments of revenue.
Under the applicable foreign tax laws, a withholding tax may be imposed on interest, dividends and capital gains at various rates.
| | |
| 40 | | QS Legg Mason Strategic Real Return Fund 2014 Annual Report |
(r) Reclassification. GAAP requires that certain components of net assets be reclassified to reflect permanent differences between financial and tax reporting. These reclassifications have no effect on net assets or net asset value per share. During the current period, the following reclassifications have been made:
| | | | | | | | | | | | |
| | | Undistributed Net
Investment Income | | | Accumulated Net
Realized Loss | | | Paid-in
Capital | |
| (a) | | $ | 1,160,893 | | | | — | | | $ | (1,160,893) | |
| (b) | | | (741,447) | | | $ | 741,447 | | | | — | |
| (a) | Reclassifications are due to a tax net operating loss. |
| (b) | Reclassifications are due to foreign currency transactions treated as ordinary income for tax purposes, book/tax differences in the treatment of distributions from real estate investment trusts and a tax net operating loss which offsets short-term capital gains for tax purposes. |
2. Investment management agreement and other transactions with affiliates
Legg Mason Partners Fund Advisor, LLC (“LMPFA”) is the Fund’s investment manager. QS Legg Mason Global Asset Allocation, LLC (formerly Legg Mason Global Asset Allocation, LLC) (“QS LMGAA”) is the Fund’s investment adviser. QS Batterymarch Financial Management, Inc. (formerly Batterymarch Financial Management, Inc.) (“QS Batterymarch”), ClearBridge Investments, LLC (“ClearBridge”), Western Asset Management Company (“Western Asset”), Western Asset Management Company Limited (“Western Asset Limited”) and Western Asset Management Company Ltd (“Western Japan”) are the Fund’s subadvisers. LMPFA, QS LMGAA, QS Batterymarch, ClearBridge, Western Asset, Western Asset Limited and Western Japan are wholly-owned subsidiaries of Legg Mason, Inc. (“Legg Mason”). ClearBridge did not manage any portion of the Fund’s assets during the reporting period.
Under the management agreement, the Fund pays LMPFA an investment management fee, calculated daily and paid monthly, at an annual rate of 0.75% of the Fund’s average daily net assets.
LMPFA provides administrative and certain oversight services to the Fund. LMPFA delegates to QS LMGAA the day-to-day portfolio management of the Fund, except for the management of cash and short term instruments, which is provided by Western Asset. QS LMGAA is responsible for monitoring and coordinating the overall management of the Fund, including rebalancing the Fund’s target asset allocations among itself and the subadvisers. QS LMGAA also provides management for a portion of the Fund’s assets.
LMPFA pays QS LMGAA for its services to the Fund an advisory fee, calculated daily and paid monthly, at an annual rate of 0.20% of the Fund’s average daily net assets. The Subsidiary has agreed to reimburse the Fund for the fees paid thereby for the services provided by QS LMGAA to the Subsidiary. LMPFA pays QS Batterymarch for its services to the Fund a sub-advisory fee, calculated daily and paid monthly, at an annual rate of 0.45% of the average daily net assets managed by QS Batterymarch. LMPFA pays ClearBridge for its services to the Fund a sub-advisory fee, calculated daily and paid monthly, at an annual rate of
| | |
| QS Legg Mason Strategic Real Return Fund 2014 Annual Report | | 41 |
Notes to consolidated financial statements (cont’d)
0.35% of the average daily net assets managed by ClearBridge. LMPFA pays Western Asset for its services to the Fund a sub-advisory fee, calculated daily and paid monthly, at an annual rate of 0.25% of the average daily net assets managed by Western Asset. Western Asset pays Western Asset Limited for its services to the Fund a sub-advisory fee, calculated daily and paid monthly, at an annual rate of 0.25% of the average daily net assets managed by Western Asset Limited. Western Asset pays Western Japan for its services to the Fund a sub-advisory fee, calculated daily and paid monthly, at an annual rate of 0.25% of the average daily net assets managed by Western Japan.
The investment manager has agreed to waive fees and/or reimburse operating expenses (other than interest, brokerage commissions (except for brokerage commissions paid on purchases and sales of shares of ETFs), dividend expense on short sales, taxes and extraordinary expenses), subject to recapture as described below. As a result, total annual operating expenses did not exceed 1.35%, 1.55%, 2.10%, 1.10% and 1.00% for Class A, Class A2, Class C, Class I and Class IS shares, respectively. In addition, the total annual operating expenses for Class IS shares did not exceed those of Class I shares. Acquired fund fees and expenses are subject to the expense limitation arrangements, and are calculated based on an average of the net expense ratio (as shown in the most recent prospectus or shareholder report for each acquired fund as of the date of the Fund’s most recent prospectus) of each acquired fund held by the Fund, weighted in proportion to the Fund’s investment allocation among the acquired funds. These arrangements are expected to continue until December 31, 2015, may be terminated prior to that date by agreement of the investment manager and the Board of Trustees, and may be terminated at any time after that date by the investment manager. The arrangements, however, may be modified by the investment manager to decrease total annual operating expenses at any time.
During the year ended November 30, 2013, fees waived and/or expenses reimbursed amounted to $179,965.
During the period ended September 30, 2014, fees waived and/or expenses reimbursed amounted to $149,831.
The investment manager is permitted to recapture amounts waived or reimbursed to a class within three years after the fiscal year in which the investment manager earned the fee or incurred the expense if the class’ total annual operating expenses have fallen to a level below the expense limitation (“expense cap”) in effect at the time the fees were earned or the expenses incurred. In no case will the investment manager recapture any amount that would result, on any particular business day of the Fund, in the class’ total annual operating expenses exceeding the expense cap or any other lower limit then in effect.
| | |
| 42 | | QS Legg Mason Strategic Real Return Fund 2014 Annual Report |
Pursuant to these arrangements, at November 30, 2013, the Fund had remaining fee waivers and/or expense reimbursements subject to recapture by LMPFA and respective dates of expiration as follows:
| | | | | | | | | | | | | | | | | | | | |
| | | Class A | | | Class A2 | | | Class C | | | Class I | | | Class IS | |
| Expires November 30, 2014 | | $ | 244,026 | | | | — | | | $ | 22,789 | | | $ | 25,008 | | | | — | |
| Expires November 30, 2015 | | | 15,770 | | | | — | | | | 7,129 | | | | 10,565 | | | $ | 118,855 | |
| Expires November 30, 2016 | | | 13,990 | | | $ | 3,934 | | | | 5,428 | | | | 1,497 | | | | 155,116 | |
Total fee waivers/expense
reimbursements subject to recapture | | $ | 273,786 | | | $ | 3,934 | | | $ | 35,346 | | | $ | 37,070 | | | $ | 273,971 | |
For the year ended November 30, 2013, LMPFA recaptured $11 and $1 for Class A2 and Class I shares, respectively.
Pursuant to these arrangements, at September 30, 2014, the Fund had remaining fee waivers and/or expense reimbursements subject to recapture by LMPFA and respective dates of expiration as follows:
| | | | | | | | | | | | | | | | | | | | |
| | | Class A | | | Class A2 | | | Class C | | | Class I | | | Class IS | |
| Expires September 30, 2015 | | $ | 15,770 | | | | — | | | $ | 7,129 | | | $ | 10,565 | | | $ | 118,855 | |
| Expires September 30, 2016 | | | 13,990 | | | $ | 3,934 | | | | 5,428 | | | | 1,497 | | | | 155,116 | |
| Expires September 30, 2017 | | | 9,563 | | | | 8,576 | | | | 3,462 | | | | 2,799 | | | | 125,431 | |
Total fee waivers/expense
reimbursements subject to recapture | | $ | 39,323 | | | $ | 12,510 | | | $ | 16,019 | | | $ | 14,861 | | | $ | 399,402 | |
For the period ended September 30, 2014, LMPFA did not recapture any fees.
Legg Mason Investor Services, LLC (“LMIS”), a wholly-owned broker-dealer subsidiary of Legg Mason, serves as the Fund’s sole and exclusive distributor.
There is a maximum initial sales charge of 5.75% for Class A and Class A2 shares. There is a contingent deferred sales charge (“CDSC”) of 1.00% on Class C shares, which applies if redemption occurs within 12 months from purchase payment. In certain cases, Class A and Class A2 shares have a 1.00% CDSC, which applies if redemption occurs within 18 months from purchase payment. This CDSC only applies to those purchases of Class A and Class A2 shares, which, when combined with current holdings of other shares of funds sold by LMIS, equal or exceed $1,000,000 in the aggregate. These purchases do not incur an initial sales charge.
For the year ended November 30, 2013, LMIS and its affiliates retained sales charges of
$2,881 and $7,754 on sales of the Fund’s Class A and Class A2 shares, respectively. In addition, for the year ended November 30, 2013, CDSCs paid to LMIS and its affiliates were:
For the period ended September 30, 2014, LMIS and its affiliates retained sales charges of $342 and $2,778 on sales of the Fund’s Class A and Class A2 shares, respectively. In addition, there were no CDSCs paid to LMIS and its affiliates for the period ended September 30, 2014.
| | |
| QS Legg Mason Strategic Real Return Fund 2014 Annual Report | | 43 |
Notes to consolidated financial statements (cont’d)
Under a Deferred Compensation Plan (the “Plan”), Trustees may elect to defer receipt of all or a specified portion of their compensation. A participating Trustee may select one or more funds managed by affiliates of Legg Mason in which his or her deferred trustee’s fees will be deemed to be invested. Deferred amounts remain in the Fund until distributed in accordance with the Plan.
All officers and two Trustees of the Trust are employees of Legg Mason or its affiliates and do not receive compensation from the Trust.
As of September 30, 2014, Legg Mason and its affiliates owned 95% of the Fund.
3. Investments
During the period ended September 30, 2014, the aggregate cost of purchases and proceeds from sales of investments (excluding short-term investments) and U.S Government & Agency Obligations were as follows:
| | | | | | | | |
| | | Investments | | | U.S. Government &
Agency Obligations | |
| Purchases | | $ | 17,061,704 | | | $ | 15,301,376 | |
| Sales | | | 20,942,254 | | | | 9,151,782 | |
At September 30, 2014, the aggregate gross unrealized appreciation and depreciation of investments for federal income tax purposes were as follows:
| | | | |
| Gross unrealized appreciation | | $ | 13,286,116 | |
| Gross unrealized depreciation | | | (2,286,924) | |
| Net unrealized appreciation | | $ | 10,999,192 | |
During the period ended September 30, 2014, written option transactions for the Fund were as follows:
| | | | | | | | |
| | | Number of Contracts | | | Premiums | |
| Written options, outstanding as of November 30, 2013 | | | 56 | | | $ | 18,740 | |
| Options written | | | 747 | | | | 198,736 | |
| Options closed | | | (675) | | | | (184,259) | |
| Options exercised | | | (128) | | | | (33,217) | |
| Options expired | | | — | | | | — | |
| Written options, outstanding as of September 30, 2014 | | | — | | | | — | |
At September 30, 2014, the Fund had the following open futures contracts:
| | | | | | | | | | | | | | | | | | | | |
| | | Number of
Contracts | | | Expiration
Date | | | Basis
Value | | | Market
Value | | | Unrealized
Depreciation | |
| Contracts to Buy: | | | | | | | | | | | | | | | | | | | | |
| S&P GSCI | | | 202 | | | | 10/14 | | | $ | 30,050,025 | | | $ | 28,976,900 | | | $ | (1,073,125) | |
| Contracts to Sell: | | | | | | | | | | | | | | | | | | | | |
| U.S. Treasury 5-Year Notes | | | 36 | | | | 12/14 | | | | 4,250,812 | | | | 4,257,281 | | | | (6,469) | |
| Net unrealized depreciation on open futures contracts | | | | | | | $ | (1,079,594) | |
| | |
| 44 | | QS Legg Mason Strategic Real Return Fund 2014 Annual Report |
At September 30, 2014, the Fund had the following open forward foreign currency contracts:
| | | | | | | | | | | | | | | | | | |
| Foreign Currency | | Counterparty | | Local
Currency | | | Market
Value | | | Settlement
Date | | | Unrealized
Appreciation
(Depreciation) | |
| Contracts to Buy: | | | | | | | | | | | | | | | | | | |
| Australian Dollar | | HSBC Bank USA | | | 3,311,000 | | | $ | 2,896,280 | | | | 10/15/14 | | | $ | (87,660) | |
| British Pound | | HSBC Bank USA | | | 3,327,000 | | | | 5,392,958 | | | | 10/15/14 | | | | (5,898) | |
| Canadian Dollar | | HSBC Bank USA | | | 7,951,000 | | | | 7,097,058 | | | | 10/15/14 | | | | (79,906) | |
| Euro Currency | | HSBC Bank USA | | | 20,255,000 | | | | 25,585,226 | | | | 10/15/14 | | | | (626,364) | |
| Japanese Yen | | HSBC Bank USA | | | 660,200,000 | | | | 6,020,129 | | | | 10/15/14 | | | | (143,283) | |
| Mexican Peso | | HSBC Bank USA | | | 40,320,000 | | | | 2,999,400 | | | | 10/15/14 | | | | (45,273) | |
| New Zealand Dollar | | HSBC Bank USA | | | 3,697,000 | | | | 2,882,331 | | | | 10/15/14 | | | | (128,506) | |
| Norwegian Krone | | HSBC Bank USA | | | 19,020,000 | | | | 2,959,085 | | | | 10/15/14 | | | | (13,394) | |
| Swedish Krona | | HSBC Bank USA | | | 13,570,000 | | | | 1,880,445 | | | | 10/15/14 | | | | (25,534) | |
| Swiss Franc | | HSBC Bank USA | | | 1,530,000 | | | | 1,602,768 | | | | 10/15/14 | | | | (6,471) | |
| British Pound | | Credit Suisse | | | 370,000 | | | | 599,602 | | | | 11/14/14 | | | | (17,551) | |
| Canadian Dollar | | Bank of America, N.A. | | | 1,140,000 | | | | 1,016,843 | | | | 11/14/14 | | | | 211 | |
| Japanese Yen | | Bank of America, N.A. | | | 114,140,000 | | | | 1,041,013 | | | | 11/14/14 | | | | (9,139) | �� |
| New Zealand Dollar | | Bank of America, N.A. | | | 730,000 | | | | 567,448 | | | | 11/14/14 | | | | (47,285) | |
| | | | | | | | | | | | | | | | | | (1,236,053) | |
| Contracts to Sell: | | | | | | | | | | | | | | | | | | |
| British Pound | | Credit Suisse | | | 687,711 | | | | 1,114,466 | | | | 11/14/14 | | | | 42,652 | |
| Canadian Dollar | | Bank of America, N.A. | | | 2,560,000 | | | | 2,283,437 | | | | 11/14/14 | | | | 43,698 | |
| Euro | | Citibank, N.A. | | | 449,394 | | | | 567,772 | | | | 11/14/14 | | | | 34,235 | |
| Japanese Yen | | Bank of America, N.A. | | | 150,703,223 | | | | 1,374,487 | | | | 11/14/14 | | | | 97,720 | |
| Japanese Yen | | Credit Suisse | | | 29,412,158 | | | | 268,253 | | | | 11/14/14 | | | | 19,422 | |
| | | | | | | | | | | | | | | | | | 237,727 | |
| Net unrealized depreciation on open forward foreign currency contracts | | | | | | | $ | (998,326) | |
4. Derivative instruments and hedging activities
GAAP requires enhanced disclosure about an entity’s derivative and hedging activities.
Below is a table, grouped by derivative type, that provides information about the fair value and the location of derivatives within the Consolidated Statement of Assets and Liabilities at September 30, 2014.
| | | | | | | | | | |
| ASSET DERIVATIVES1 | |
| | | | | | | | | Foreign Exchange
Risk | |
| Forward foreign currency contracts | | | | | | | | $ | 237,938 | |
| | | | | | | | | | | | | | | | |
| LIABILITY DERIVATIVES1 | |
| | | Interest Rate
Risk | | | Foreign Exchange
Risk | | | Commodity
Risk | | | Total | |
| Futures contracts2 | | $ | 6,469 | | | | — | | | $ | 1,073,125 | | | $ | 1,079,594 | |
| Forward foreign currency contracts | | | — | | | $ | 1,236,264 | | | | — | | | | 1,236,264 | |
| Total | | $ | 6,469 | | | $ | 1,236,264 | | | $ | 1,073,125 | | | $ | 2,315,858 | |
| | |
| QS Legg Mason Strategic Real Return Fund 2014 Annual Report | | 45 |
Notes to consolidated financial statements (cont’d)
| 1 | Generally, the balance sheet location for asset derivatives is receivables/net unrealized appreciation (depreciation) and for liability derivatives is payables/net unrealized appreciation (depreciation). |
| 2 | Includes cumulative appreciation (depreciation) of futures contracts as reported in the footnotes. Only variation margin is reported within the receivables and/or payables on the Consolidated Statement of Assets and Liabilities. |
The following tables provide information about the effect of derivatives and hedging activities on the Fund’s Consolidated Statement of Operations for the year ended November 30, 2013. The first table provides additional detail about the amounts and sources of gains (losses) realized on derivatives during the period. The second table provides additional information about the change in unrealized appreciation (depreciation) resulting from the Fund’s derivatives and hedging activities during the period.
| | | | | | | | | | | | | | | | |
| AMOUNT OF REALIZED GAIN (LOSS) ON DERIVATIVES RECOGNIZED | |
| | | Interest Rate
Risk | | | Foreign Exchange
Risk | | | Commodity
Risk | | | Total | |
| Purchased options1 | | $ | (97,216) | | | | — | | | | — | | | $ | (97,216) | |
| Written options | | | 103,608 | | | | — | | | | — | | | | 103,608 | |
| Futures contracts | | | (45,152) | | | | — | | | $ | (396,199) | | | | (441,351) | |
| Swap contracts | | | — | | | | — | | | | (428,296) | | | | (428,296) | |
| Forward foreign currency contracts2 | | | — | | | $ | (1,096,367) | | | | — | | | | (1,096,367) | |
| Total | | $ | (38,760) | | | $ | (1,096,367) | | | $ | (824,495) | | | $ | (1,959,622) | |
| 1 | Net realized gain (loss) from purchased options is reported in net realized gain (loss) from investment transactions in the Consolidated Statement of Operations. |
| 2 | Net realized gain (loss) from forward foreign currency contracts is reported in net realized gain (loss) from foreign currency transactions in the Consolidated Statement of Operations. |
| | | | | | | | | | | | | | | | |
| CHANGE IN UNREALIZED APPRECIATION (DEPRECIATION) ON DERIVATIVES RECOGNIZED | |
| | | Interest Rate
Risk | | | Foreign Exchange
Risk | | | Commodity
Risk | | | Total | |
| Purchased options1 | | $ | 693 | | | | — | | | | — | | | $ | 693 | |
| Written options | | | 554 | | | | — | | | | — | | | | 554 | |
| Futures contracts | | | 10,418 | | | | — | | | $ | 202,948 | | | | 213,366 | |
| Swap contracts | | | — | | | | — | | | | (280,919) | | | | (280,919) | |
| Forward foreign currency contracts2 | | | — | | | $ | 369,013 | | | | — | | | | 369,013 | |
| Total | | $ | 11,665 | | | $ | 369,013 | | | $ | (77,971) | | | $ | 302,707 | |
| 1 | The change in unrealized appreciation (depreciation) from purchased options is reported in the change in net unrealized appreciation (depreciation) from investments in the Consolidated Statement of Operations. |
| 2 | The change in unrealized appreciation (depreciation) from forward foreign currency contracts is reported in the change in net unrealized appreciation (depreciation) from foreign currencies in the Consolidated Statement of Operations. |
The following tables provide information about the effect of derivatives and hedging activities on the Fund’s Consolidated Statement of Operations for the period ended September 30, 2014. The first table provides additional detail about the amounts and sources of gains (losses) realized on derivatives during the period. The second table provides additional information about the change in unrealized appreciation (depreciation) resulting from the Fund’s derivatives and hedging activities during the period.
| | |
| 46 | | QS Legg Mason Strategic Real Return Fund 2014 Annual Report |
| | | | | | | | | | | | | | | | |
| AMOUNT OF REALIZED GAIN (LOSS) ON DERIVATIVES RECOGNIZED | |
| | | Interest Rate
Risk | | | Foreign Exchange
Risk | | | Commodity
Risk | | | Total | |
| Purchased options1 | | $ | (242,111) | | | | — | | | | — | | | $ | (242,111) | |
| Written options | | | 111,907 | | | | — | | | | — | | | | 111,907 | |
| Futures contracts | | | (193,173) | | | | — | | | $ | (1,977,566) | | | | (2,170,739) | |
| Swap contracts | | | — | | | | — | | | | 1,639,280 | | | | 1,639,280 | |
| Forward foreign currency contracts2 | | | — | | | $ | (1,691,926) | | | | — | | | | (1,691,926) | |
| Total | | $ | (323,377) | | | $ | (1,691,926) | | | $ | (338,286) | | | $ | (2,353,589) | |
| 1 | Net realized gain (loss) from purchased options is reported in net realized gain (loss) from investment transactions in the Consolidated Statement of Operations. |
| 2 | Net realized gain (loss) from forward foreign currency contracts is reported in net realized gain (loss) from foreign currency transactions in the Consolidated Statement of Operations. |
| | | | | | | | | | | | | | | | |
| CHANGE IN UNREALIZED APPRECIATION (DEPRECIATION) ON DERIVATIVES RECOGNIZED | |
| | | Interest Rate
Risk | | | Foreign Exchange
Risk | | | Commodity
Risk | | | Total | |
| Purchased options1 | | $ | (693) | | | | — | | | | — | | | $ | (693) | |
| Written options | | | (1,459) | | | | — | | | | — | | | | (1,459) | |
| Futures contracts | | | (15,303) | | | | — | | | $ | (1,325,806) | | | | (1,341,109) | |
| Swap contracts | | | — | | | | — | | | | (181,087) | | | | (181,087) | |
| Forward foreign currency contracts2 | | | — | | | $ | (1,277,119) | | | | — | | | | (1,277,119) | |
| Total | | $ | (17,455) | | | $ | (1,277,119) | | | $ | (1,506,893) | | | $ | (2,801,467) | |
| 1 | The change in unrealized appreciation (depreciation) from purchased options is reported in the change in net unrealized appreciation (depreciation) from investments in the Consolidated Statement of Operations. |
| 2 | The change in unrealized appreciation (depreciation) from forward foreign currency contracts is reported in the change in net unrealized appreciation (depreciation) from foreign currencies in the Consolidated Statement of Operations. |
During the period ended September 30, 2014, the volume of derivative activity for the Fund was as follows:
| | | | |
| | | Average Market
Value | |
| Purchased options† | | $ | 14,284 | |
| Written options† | | | 8,335 | |
| Futures contracts (to buy) | | | 21,426,270 | |
| Futures contracts (to sell) | | | 8,772,508 | |
| Forward foreign currency contracts (to buy) | | | 64,222,170 | |
| Forward foreign currency contracts (to sell) | | | 8,351,990 | |
| |
| | | Average Notional
Balance | |
| Commodity index swap contracts† | | $ | 12,512,345 | |
| † | At September 30, 2014, there were no open positions held in this derivative. |
| | |
| QS Legg Mason Strategic Real Return Fund 2014 Annual Report | | 47 |
Notes to consolidated financial statements (cont’d)
The following table presents by financial instrument, the Fund’s derivative assets net of the related collateral received by the Fund at September 30, 2014:
| | | | | | | | | | | | |
| | | Gross Amount of Derivative
Assets in the
Consolidated Statement of
Assets and Liabilities1 | | | Collateral
Received | | | Net
Amount | |
| Forward foreign currency contracts | | $ | 237,938 | | | | — | | | $ | 237,938 | |
The following table presents by financial instrument, the Fund’s derivative liabilities net of the related collateral pledged by the Fund at September 30, 2014:
| | | | | | | | | | | | |
| | | Gross Amount of Derivative
Liabilities in the
Consolidated Statement of
Assets and Liabilities1 | | | Collateral
Pledged2,3 | | | Net
Amount | |
| Futures contracts4 | | $ | 1,069,097 | | | $ | (1,069,097) | | | | — | |
| Forward foreign currency contracts | | | 1,236,264 | | | | — | | | $ | 1,236,264 | |
| Total | | $ | 2,305,361 | | | $ | (1,069,097) | | | $ | 1,236,264 | |
| 1 | Absent an event of default or early termination, derivative assets and liabilities are presented gross and not offset in the Consolidated Statement of Assets and Liabilities. |
| 2 | Gross amounts are not offset in the Consolidated Statement of Assets and Liabilities. |
| 3 | In some instances, the actual collateral received and/or pledged may be more than the amount shown here due to overcollateralization. |
| 4 | Amount represents the current day’s variation margin as reported in the Consolidated Statement of Assets and Liabilities. It differs from the cumulative appreciation (depreciation) presented in the previous table. |
5. Class specific expenses, waivers and/or expense reimbursements
The Fund has adopted a Rule 12b-1 distribution plan and under that plan the Fund pays a service fee with respect to its Class A, Class A2 and Class C shares calculated at the annual rate of 0.25% of the average daily net assets of each respective class. The Fund also pays a distribution fee with respect to its Class C shares calculated at an annual rate of 0.75% of the average net assets of the class. Service and distribution fees are accrued daily and paid monthly.
For the year ended November 30, 2013, class specific expenses were as follows:
| | | | | | | | |
| | | Service and/or
Distribution Fees | | | Transfer Agent
Fees | |
| Class A | | $ | 16,915 | | | $ | 12,912 | |
| Class A2 | | | 2,873 | | | | 5,648 | |
| Class C | | | 15,186 | | | | 5,192 | |
| Class I | | | — | | | | 1,362 | |
| Class IS | | | — | | | | 7,386 | |
| Total | | $ | 34,974 | | | $ | 32,500 | |
| | |
| 48 | | QS Legg Mason Strategic Real Return Fund 2014 Annual Report |
For the period ended September 30, 2014, class specific expenses were as follows:
| | | | | | | | |
| | | Service and/or
Distribution Fees | | | Transfer Agent
Fees | |
| Class A | | $ | 9,187 | | | $ | 9,783 | |
| Class A2 | | | 3,804 | | | | 11,557 | |
| Class C | | | 9,971 | | | | 3,508 | |
| Class I | | | — | | | | 2,786 | |
| Class IS | | | — | | | | 6,616 | |
| Total | | $ | 22,962 | | | $ | 34,250 | |
For the year ended November 30, 2013, waivers and/or expense reimbursements by class were as follows:
| | | | |
| | | Waivers/Expense
Reimbursements | |
| Class A | | $ | 13,990 | |
| Class A2 | | | 3,934 | |
| Class C | | | 5,428 | |
| Class I | | | 1,497 | |
| Class IS | | | 155,116 | |
| Total | | $ | 179,965 | |
For the period ended September 30, 2014, waivers and/or expense reimbursements by class were as follows:
| | | | |
| | | Waivers/Expense
Reimbursements | |
| Class A | | $ | 9,563 | |
| Class A2 | | | 8,576 | |
| Class C | | | 3,462 | |
| Class I | | | 2,799 | |
| Class IS | | | 125,431 | |
| Total | | $ | 149,831 | |
6. Distributions to shareholders by class
| | | | | | | | | | | | |
| | | Period Ended
September 30, 2014† | | | Year Ended
November 30, 2013 | | | Year Ended
November 30, 2012 | |
| Net Investment Income: | | | | | | | | | | | | |
| Class A | | | — | | | $ | 115,740 | | | $ | 40,977 | |
| Class A2 | | | — | | | | 6,379 | | | | — | ‡ |
| Class C | | | — | | | | 10,219 | | | | 339 | |
| Class I | | | — | | | | 3,179 | | | | 18,006 | |
| Class IS | | | — | | | | 2,364,493 | | | | 1,085,701 | * |
| Total | | | — | | | $ | 2,500,010 | | | $ | 1,145,023 | |
| | |
| QS Legg Mason Strategic Real Return Fund 2014 Annual Report | | 49 |
Notes to consolidated financial statements (cont’d)
| | | | | | | | | | | | |
| | | Period Ended
September 30, 2014† | | | Year Ended
November 30, 2013 | | | Year Ended
November 30, 2012 | |
| Net Realized Gains: | | | | | | | | | | | | |
| Class A | | $ | 142,570 | | | $ | 32,861 | | | $ | 4,714 | |
| Class A2 | | | 47,030 | | | | 964 | | | | — | ‡ |
| Class C | | | 35,151 | | | | 7,359 | | | | 1,203 | |
| Class I | | | 24,524 | | | | 2,671 | | | | 78,336 | |
| Class IS | | | 3,722,531 | | | | 537,455 | | | | 1,085 | * |
| Total | | $ | 3,971,806 | | | $ | 581,310 | | | $ | 85,338 | |
| † | For the period December 1, 2013 through September 30, 2014. |
| ‡ | For the period October 31, 2012 (inception date) to November 30, 2012. |
| * | For the period December 15, 2011 (inception date) to November 30, 2012. |
7. Shares of beneficial interest
At September 30, 2014, the Trust had an unlimited number of shares of beneficial interest authorized with a par value of $0.00001 per share. The Fund has the ability to issue multiple classes of shares. Each class of shares represents an identical interest and has the same rights, except that each class bears certain direct expenses, including those specifically related to the distribution of its shares.
Transactions in shares of each class were as follows:
| | | | | | | | | | | | | | | | | | | | | | | | |
| | | Period Ended
September 30, 2014† | | | Year Ended
November 30, 2013 | | | Year Ended
November 30, 2012 | |
| | | Shares | | | Amount | | | Shares | | | Amount | | | Shares | | | Amount | |
| Class A | | | | | | | | | | | | | | | | | | | | | | | | |
| Shares sold | | | 22,883 | | | $ | 331,591 | | | | 64,258 | | | $ | 918,542 | | | | 186,299 | | | $ | 2,554,658 | |
| Shares issued on reinvestment | | | 10,275 | | | | 141,081 | | | | 10,504 | | | | 147,672 | | | | 3,376 | | | | 44,546 | |
| Shares repurchased | | | (128,039) | | | | (1,823,119) | | | | (246,394) | | | | (3,500,748) | | | | (197,334) | | | | (2,715,592) | |
| Net decrease | | | (94,881) | | | $ | (1,350,447) | | | | (171,632) | | | $ | (2,434,534) | | | | (7,659) | | | $ | (116,388) | |
| | | | | | |
| Class A2 | | | | | | | | | | | | | | | | | | | | | | | | |
| Shares sold | | | 37,448 | | | $ | 537,242 | | | | 136,747 | | | $ | 1,938,126 | | | | 10,920 | ‡ | | $ | 151,806 | ‡ |
| Shares issued on reinvestment | | | 3,444 | | | | 47,049 | | | | 525 | | | | 7,343 | | | | — | ‡ | | | — | ‡ |
| Shares repurchased | | | (24,464) | | | | (347,301) | | | | (29,815) | | | | (418,810) | | | | (32) | ‡ | | | (449) | ‡ |
| Net increase | | | 16,428 | | | $ | 236,990 | | | | 107,457 | | | $ | 1,526,659 | | | | 10,888 | ‡ | | $ | 151,357 | ‡ |
| | | | | | |
| Class C | | | | | | | | | | | | | | | | | | | | | | | | |
| Shares sold | | | 4,196 | | | $ | 59,084 | | | | 18,879 | | | $ | 268,535 | | | | 26,699 | | | $ | 367,035 | |
| Shares issued on reinvestment | | | 2,573 | | | | 35,151 | | | | 1,136 | | | | 16,007 | | | | 109 | | | | 1,434 | |
| Shares repurchased | | | (19,960) | | | | (285,378) | | | | (59,333) | | | | (834,453) | | | | (54,288) | | | | (733,644) | |
| Net decrease | | | (13,191) | | | $ | (191,143) | | | | (39,318) | | | $ | (549,911) | | | | (27,480) | | | $ | (365,175) | |
| | | | | | |
| Class I | | | | | | | | | | | | | | | | | | | | | | | | |
| Shares sold | | | 14,875 | | | $ | 214,417 | | | | 79,090 | | | $ | 1,147,963 | | | | 47,687 | | | $ | 647,091 | |
| Shares issued on reinvestment | | | 1,758 | | | | 24,524 | | | | 411 | | | | 5,850 | | | | 7,277 | | | | 96,342 | |
| Shares repurchased | | | (10,276) | | | | (146,316) | | | | (60,938) | | | | (863,852) | | | | (9,202,626) | | | | (119,731,627) | |
| Net increase (decrease) | | | 6,357 | | | $ | 92,625 | | | | 18,563 | | | $ | 289,961 | | | | (9,147,662) | | | $ | (118,988,194) | |
| | |
| 50 | | QS Legg Mason Strategic Real Return Fund 2014 Annual Report |
| | | | | | | | | | | | | | | | | | | | | | | | |
| | | Period Ended
September 30, 2014† | | | Year Ended
November 30, 2013 | | | Year Ended
November 30, 2012 | |
| | | Shares | | | Amount | | | Shares | | | Amount | | | Shares | | | Amount | |
| Class IS | | | | | | | | | | | | | | | | | | | | | | | | |
| Shares sold | | | 1,035,964 | | | $ | 14,523,798 | | | | 1,438,874 | | | $ | 20,401,240 | | | | 9,749,422 | * | | $ | 127,302,111 | * |
| Shares issued on reinvestment | | | 270,533 | | | | 3,722,531 | | | | 206,677 | | | | 2,901,948 | | | | 82,544 | * | | | 1,086,786 | * |
| Shares repurchased | | | (813,426) | | | | (11,674,025) | | | | (956,672) | | | | (13,605,396) | | | | (1,116,730) | * | | | (15,366,269) | * |
| Net increase | | | 493,071 | | | $ | 6,572,304 | | | | 688,879 | | | $ | 9,697,792 | | | | 8,715,236 | * | | $ | 113,022,628 | * |
| † | For the period December 1, 2013 through September 30, 2014. |
| ‡ | For the period October 31, 2012 (inception date) to November 30, 2012. |
| * | For the period December 15, 2011 (inception date) to November 30, 2012. On December 15, 2011, Class I shareholders exchanged $116,485,228 into Class IS. |
8. Income tax information and distributions to shareholders
The tax character of distributions paid for the period ended September 30, 2014 and the fiscal years ended November 30, 2013 and November 30, 2012, was as follows:
| | | | | | | | | | | | |
| | | 2014 | | | 2013 | | | 2012 | |
| Distributions Paid From: | | | | | | | | | | | | |
| Ordinary income | | $ | 16,280 | | | $ | 2,899,399 | | | $ | 1,145,068 | |
| Net long-term capital gains | | | 3,955,526 | | | | 181,921 | | | | 85,293 | |
| Total taxable distributions | | $ | 3,971,806 | | | $ | 3,081,320 | | | $ | 1,230,361 | |
As of September 30, 2014, the components of accumulated earnings on a tax basis were as follows:
| | | | |
| Undistributed long-term capital gains — net | | $ | 2,072,860 | |
| Other book/tax temporary differences(a) | | | (1,496,074) | |
| Unrealized appreciation (depreciation)(b) | | | 8,910,875 | |
| Total accumulated earnings (losses) — net | | $ | 9,487,661 | |
| (a) | Other book/tax temporary differences are attributable to the tax deferral of losses on straddles, the realization for tax purposes of unrealized gains (losses) on certain futures and foreign currency contracts and book/tax differences in the timing of the deductibility of various expenses. |
| (b) | The difference between book-basis and tax-basis unrealized appreciation (depreciation) is attributable to the tax deferral of losses on wash sales and other book/tax basis adjustments. |
| | |
| QS Legg Mason Strategic Real Return Fund 2014 Annual Report | | 51 |
Report of independent registered public accounting firm
To the Board of Trustees of Legg Mason Global Asset Management Trust and to the Shareholders of QS Legg Mason Strategic Real Return Fund:
In our opinion, the accompanying consolidated statement of assets and liabilities, including the consolidated schedule of investments, and the related consolidated statements of operations and of changes in net assets and the consolidated financial highlights present fairly, in all material respects, the financial position of the QS Legg Mason Strategic Real Return Fund (one of the funds comprising Legg Mason Global Asset Management Trust, the “Fund”) at September 30, 2014, the results of its operations, the changes in its net assets and the financial highlights for each of the periods presented, in conformity with accounting principles generally accepted in the United States of America. These consolidated financial statements and financial highlights (hereafter referred to as “financial statements”) are the responsibility of the Fund’s management. Our responsibility is to express an opinion on these financial statements based on our audits. We conducted our audits of these financial statements in accordance with the standards of the Public Company Accounting Oversight Board (United States). Those standards require that we plan and perform the audit to obtain reasonable assurance about whether the financial statements are free of material misstatement. An audit includes examining, on a test basis, evidence supporting the amounts and disclosures in the financial statements, assessing the accounting principles used and significant estimates made by management, and evaluating the overall financial statement presentation. We believe that our audits, which included confirmation of securities at September 30, 2014 by correspondence with the custodian and brokers, provide a reasonable basis for our opinion.
PricewaterhouseCoopers LLP
Baltimore, Maryland
November 14, 2014
| | |
| 52 | | QS Legg Mason Strategic Real Return Fund 2014 Annual Report |
Additional information (unaudited)
Information about Trustees and Officers
The business and affairs of QS Legg Mason Strategic Real Return Fund (the “Fund”) are conducted by management under the supervision and subject to the direction of its Board of Trustees. The business address of each Trustee is c/o Kenneth D. Fuller, Legg Mason, 100 International Drive, 11th Floor, Baltimore, Maryland 21202. Information pertaining to the Trustees and officers of the Fund is set forth below.
The Statement of Additional Information includes additional information about Trustees and is available, without charge, upon request by calling the Fund at 1-877-721-1926.
| | |
| Independent Trustees1 |
| Ruby P. Hearn |
| Year of birth | | 1940 |
| Position(s) with Trust | | Trustee |
| Term of office and length of time served2 | | Since 2009 |
| Principal occupation(s) during past five years | | Senior Vice President Emerita of The Robert Wood Johnson Foundation (non-profit) since 2001; Member of the Institute of Medicine since 1982; formerly: Trustee of the New York Academy of Medicine (2004 to 2012); Director of the Institute for Healthcare Improvement (2002 to 2012); Senior Vice President of The Robert Wood Johnson Foundation (1996 to 2001); Fellow of The Yale Corporation (1992 to 1998). |
| Number of funds in fund complex overseen by Trustee | | 18 |
| Other board memberships held by Trustee during past five years | | None |
|
| Arnold L. Lehman |
| Year of birth | | 1944 |
| Position(s) with Trust | | Lead Independent Trustee |
| Term of office and length of time served2 | | Since 2009 |
| Principal occupation(s) during past five years | | Director of the Brooklyn Museum since 1997; Trustee of American Federation of Arts since 1998. Formerly: Director of The Baltimore Museum of Art (1979 to 1997). |
| Number of funds in fund complex overseen by Trustee | | 18 |
| Other board memberships held by Trustee during past five years | | None |
|
| Robin J.W. Masters |
| Year of birth | | 1955 |
| Position(s) with Trust | | Trustee |
| Term of office and length of time served2 | | Since 2009 |
| Principal occupation(s) during past five years | | Retired; formerly: Chief Investment Officer of ACE Limited (insurance) (1986 to 2000). |
| Number of funds in fund complex overseen by Trustee | | 18 |
| Other board memberships held by Trustee during past five years | | Director of Cheyne Capital International Limited (investment advisory firm). Formerly, Director/Trustee of Legg Mason Institutional Funds plc, WAFixed Income Funds plc and Western Asset Debt Securities Fund plc. (2007 to 2011) |
| | |
| QS Legg Mason Strategic Real Return Fund | | 53 |
Additional information (unaudited) (cont’d)
Information about Trustees and Officers
| | |
| Independent Trustees1 cont’d |
| Jill E. McGovern |
| Year of birth | | 1944 |
| Position(s) with Trust | | Trustee |
| Term of office and length of time served2 | | Since 2009 |
| Principal occupation(s) during past five years | | Senior Consultant, American Institute for Contemporary German Studies (AICGS) since 2007; formerly: Chief Executive Officer of The Marrow Foundation (non-profit) (1993 to 2007); Executive Director of the Baltimore International Festival (1991 to 1993); Senior Assistant to the President of The Johns Hopkins University (1986 to 1990). |
| Number of funds in fund complex overseen by Trustee | | 18 |
| Other board memberships held by Trustee during past five years | | Director of International Biomedical Research Alliance; Director of Lois Roth Endowment |
|
| Arthur S. Mehlman |
| Year of birth | | 1942 |
| Position(s) with Trust | | Trustee |
| Term of office and length of time served2 | | Since 2009 |
| Principal occupation(s) during past five years | | Retired. Director, The University of Maryland Foundation since 1992; Director, The League for People with Disabilities since 2003; formerly: Director, Municipal Mortgage & Equity LLC (2004 to 2011); Partner, KPMG LLP (international accounting firm) (1972 to 2002). |
| Number of funds in fund complex overseen by Trustee | | Director/Trustee of all Legg Mason Funds consisting of 18 portfolios; Director/Trustee of the Royce Family of Funds consisting of 33 portfolios. |
| Other board memberships held by Trustee during past five years | | Director of Municipal Mortgage & Equity, LLC. (2004 to 2011) |
|
| G. Peter O’Brien |
| Year of birth | | 1945 |
| Position(s) with Trust | | Trustee |
| Term of office and length of time served2 | | Since 2009 |
| Principal occupation(s) during past five years | | Retired. Trustee Emeritus of Colgate University; Board Member, Hill House, Inc. (residential home care); Board Member, Bridges School (pre- school); formerly: Managing Director, Equity Capital Markets Group of Merrill Lynch & Co. (1971-1999). |
| Number of funds in fund complex overseen by Trustee | | Director/Trustee of all Legg Mason funds consisting of 18 portfolios; Director/Trustee of the Royce Family of Funds consisting of 33 portfolios. |
| Other board memberships held by Trustee during past five years | | Director of TICC Capital Corp. |
| | |
| 54 | | QS Legg Mason Strategic Real Return Fund |
| | |
| Independent Trustees1 cont’d |
| S. Ford Rowan |
| Year of birth | | 1943 |
| Position(s) with Trust | | Trustee |
| Term of office and length of time served2 | | Since 2009 |
| Principal occupation(s) during past five years | | Chairman, National Center for Critical Incident Analysis, National Defense University Foundation, since 2004; Consultant to University of Maryland University College, since 2013; Lecturer in Organizational Sciences, George Washington University, since 2000; formerly: Trustee, St. John’s College (2006 to 2012); Consultant, Rowan & Blewitt Inc. (management consulting) (1984 to 2007); Lecturer in Journalism, Northwestern University (1980 to 1993); Director, Santa Fe Institute (1999 to 2008). |
| Number of funds in fund complex overseen by Trustee | | 18 |
| Other board memberships held by Trustee during past five years | | None |
|
| Robert M. Tarola |
| Year of birth | | 1950 |
| Position(s) with Trust | | Trustee |
| Term of office and length of time served2 | | Since 2009 |
| Principal occupation(s) during past five years | | President of Right Advisory LLC (corporate finance and governance consulting) since 2008; Member, Investor Advisory Group of the Public Company Accounting Oversight Board since 2009; formerly Senior Vice President and Chief Financial Officer of The Howard University (2009 to 2013) (higher education and health care); Senior Vice President and Chief Financial Officer of W.R. Grace & Co. (specialty chemicals) (1999 to 2008) and MedStar Health, Inc. (healthcare) (1996 to 1999); Partner, Price Waterhouse, LLP (accounting and auditing) (1984 to 1996). |
| Number of funds in fund complex overseen by Trustee | | 18 |
| Other board memberships held by Trustee during past five years | | Director of TeleTech Holdings, Inc. (business process outsourcing); Director of American Kidney Fund (renal disease assistance) |
| | |
| Interested Trustees3 |
| Jennifer W. Murphy | | |
| Year of birth | | 1964 |
| Position(s) with Trust | | Trustee and Chair |
| Term of office and length of time served2 | | Since 2013 |
| Principal occupation(s) during past five years | | Executive Vice President and Chief Administrative Officer of Legg Mason, Inc. (since 2013); formerly: Chief Operations Officer of LMM LLC (1999 to 2013); President and CEO of Legg Mason Capital Management, LLC (“LMCM”) and Manager of LMCM and predecessors (1998 to 2013). |
| Number of funds in fund complex overseen by Trustee | | 18 |
| Other board memberships held by Trustee during past five years | | None |
| | |
| QS Legg Mason Strategic Real Return Fund | | 55 |
Additional information (unaudited) (cont’d)
Information about Trustees and Officers
| | |
| Interested Trustees3 cont’d |
| Kenneth D. Fuller | | |
| Year of birth | | 1958 |
| Position(s) with Trust | | Trustee, President and Chief Executive Officer |
| Term of office and length of time served2 | | Since 2013 |
| Principal occupation(s) during past five years | | Managing Director of Legg Mason & Co., LLC (“Legg Mason & Co.”) (since 2013); Officer and/or Trustee/Director of 170 funds associated with Legg Mason Partners Fund Advisor, LLC (“LMPFA”) or its affiliates (since 2013); President and Chief Executive Officer of LM Asset Services, LLC (“LMAS”) and Legg Mason Fund Asset Management, Inc. (“LMFAM”) (formerly registered investment advisers) (since 2013); formerly, Senior Vice President of LMPFA (2012 to 2013); formerly, Director of Legg Mason & Co. (2012 to 2013); formerly, Vice President of Legg Mason & Co. (2009 to 2012); formerly, Vice President — Equity Division of T. Rowe Price Associates (1993 to 2009), as well as Investment Analyst and Portfolio Manager for certain asset allocation accounts (2004 to 2009) |
| Number of funds in fund complex overseen by Trustee | | 158 |
Other board memberships held by Trustee during past
five years | | None |
| | |
| Executive Officers |
Richard F. Sennett Legg Mason 100 International Drive, 7th Floor, Baltimore, MD 21202 | | |
| Year of birth | | 1970 |
| Position(s) with Trust | | Principal Financial Officer |
| Term of office and length of time served2 | | Since 2011 |
| Principal occupation(s) during past five years | | Principal Financial Officer and Treasurer of certain mutual funds associated with Legg Mason & Co. or its affiliates (since 2011 and since 2013); Managing Director of Legg Mason & Co. and Senior Manager of the Treasury Policy group for Legg Mason & Co.’s Global Fiduciary Platform (since 2011); formerly, Chief Accountant within the SEC’s Division of Investment Management (2007 to 2011); formerly, Assistant Chief Accountant within the SEC’s Division of Investment Management (2002 to 2007) |
| |
Robert I. Frenkel Legg Mason 100 First Stamford Place, 6th Floor, Stamford, CT 06902 | | |
| Year of birth | | 1954 |
| Position(s) with Trust | | Secretary and Chief Legal Officer |
| Term of office and length of time served2 | | Since 2009 |
| Principal occupation(s) during past five years | | Vice President and Deputy General Counsel of Legg Mason (since 2006); Managing Director and General Counsel of Global Mutual Funds for Legg Mason & Co. (since 2006) and Legg Mason & Co. predecessors (since 1994); Secretary and Chief Legal Officer of certain mutual funds associated with Legg Mason & Co. or its affiliates (since 2006) and Legg Mason & Co. predecessors (prior to 2006) |
| | |
| 56 | | QS Legg Mason Strategic Real Return Fund |
| | |
| Executive Officers cont’d |
Ted P. Becker Legg Mason 620 Eighth Avenue, 49th Floor, New York, NY 10018 | | |
| Year of birth | | 1951 |
| Position(s) with Trust | | Vice President and Chief Compliance Officer |
| Term of office and length of time served2 | | Since 2009 |
| Principal occupation(s) during past five years | | Director of Global Compliance at Legg Mason (since 2006); Chief Compliance Officer of LMPFA (since 2006); Managing Director of Compliance of Legg Mason & Co. (since 2005); Chief Compliance Officer of certain mutual funds associated with Legg Mason & Co. or its affiliates (since 2006) and Legg Mason & Co. predecessors (prior to 2006) |
| |
Christopher Berarducci Legg Mason 620 Eighth Avenue, 49th Floor, New York, NY 10018 | | |
| Year of birth | | 1974 |
| Position(s) with Trust | | Treasurer |
| Term of office and length of time served2 | | Since 2010 |
| Principal occupation(s) during past five years | | Vice President of Legg Mason & Co. (since 2011); Treasurer of certain mutual funds associated with Legg Mason & Co. or its affiliates (since 2010); formerly, Assistant Controller of certain mutual funds associated with Legg Mason & Co. or its affiliates (prior to 2010); formerly, Manager of Fund Administration at UBS Global Asset Management (prior to 2007) |
| |
Susan Kerr Legg Mason 620 Eighth Avenue, 49th Floor, New York, NY 10018 | | |
| Year of birth | | 1949 |
| Position(s) with Trust | | Chief Anti-Money Laundering Compliance Officer |
| Term of office and length of time served2 | | Since 2013 |
| Principal occupation(s) during past five years | | Assistant Vice President of Legg Mason & Co. and Legg Mason Investor Services, LLC (“LMIS”) (since 2010); Chief Anti-Money Laundering Compliance Officer of certain mutual funds associated with Legg Mason & Co. or its affiliates (since 2013) and Anti-Money Laundering Compliance Officer of LMIS (since 2012); Senior Compliance Officer of LMIS (since 2011); formerly, AML Consultant, DTCC (2010); formerly, AML Consultant, Rabobank Netherlands, (2009); formerly, First Vice President, Director of Marketing & Advertising Compliance and Manager of Communications Review Group at Citigroup Inc. (1996 to 2008) |
| | |
| QS Legg Mason Strategic Real Return Fund | | 57 |
Additional information (unaudited) (cont’d)
Information about Trustees and Officers
| | |
| Executive Officers cont’d |
Vanessa A. Williams Legg Mason 100 First Stamford Place, 6th Floor, Stamford, CT 06902 | | |
| Year of birth | | 1979 |
| Position(s) with Trust | | Identity Theft Prevention Officer |
| Term of office and length of time served2 | | Since 2013 |
| Principal occupation(s) during past five years | | Vice President of Legg Mason & Co. (since 2012); Identity Theft Prevention Officer of certain mutual funds associated with Legg Mason & Co. or its affiliates (since 2011); formerly, Chief Anti-Money Laundering Compliance Officer of certain mutual funds associated with Legg Mason & Co. or its affiliates (2011 to 2013); formerly, Senior Compliance Officer of Legg Mason & Co. (2008 to 2011); formerly, Compliance Analyst of Legg Mason & Co. (2006 to 2008) and Legg Mason & Co. predecessors (prior to 2006) |
| 1 | Trustees who are not “interested persons” of the Fund within the meaning of Section 2(a)(19) of the 1940 Act. Each of the Independent Trustees serves on the standing committees of the Board of Trustees, which include the Audit Committee (chair: Arthur S. Mehlman), the Nominating Committee (co-chairs: G. Peter O’Brien and Jill E. McGovern), and the Independent Trustees Committee (chair: Arnold L. Lehman). |
| 2 | Officers of the Trust are elected to serve until their successors are elected and qualified. Trustees of the Trust serve a term of indefinite length until their retirement, in accordance with the Board’s retirement policy, resignation or removal, and stand for re-election by shareholders only as and when required by the 1940 Act. |
| 3 | Ms. Murphy and Mr. Fuller are considered to be interested persons, as defined in the 1940 Act, of the Fund on the basis of their current employment with the Fund’s investment adviser or its affiliated entities (including the Fund’s principal underwriter) and Legg Mason, Inc., the parent holding company of these entities as well as their ownership of Legg Mason, Inc. stock. |
| | |
| 58 | | QS Legg Mason Strategic Real Return Fund |
Important tax information (unaudited)
The following information is provided with respect to the distributions paid during the taxable period ended September 30, 2014:
| | | | |
| Record date: | | | 12/10/2013 | |
| Payable date: | | | 12/11/2013 | |
| Ordinary income: | | | | |
Qualified dividend income for individuals | | | 100.00 | % |
Dividends qualifying for the dividends | | | | |
received deduction for corporations | | | 100.00 | % |
| Interest from Federal obligations | | | 20.50 | % |
| Long-term capital gain dividend | | $ | 0.381231 | |
Please retain this information for your records.
| | |
| QS Legg Mason Strategic Real Return Fund | | 59 |
QS Legg Mason
Strategic Real Return Fund
Trustees
Kenneth D. Fuller
President
Ruby P. Hearn
Arnold L. Lehman
Robin J.W. Masters
Jill E. McGovern
Arthur S. Mehlman
Jennifer W. Murphy
Chair
G. Peter O’Brien
S. Ford Rowan
Robert M. Tarola
Investment manager
Legg Mason Partners Fund Advisor, LLC
Investment adviser
QS Legg Mason Global Asset Allocation, LLC
Subadvisers
QS Batterymarch Financial Management, Inc.
ClearBridge Investments, LLC
Western Asset Management Company
Western Asset Management Company Limited
Western Asset Management Company Ltd
Distributor
Legg Mason Investor Services, LLC
Custodian
State Street Bank & Trust Company
Transfer agent
BNY Mellon Investment Servicing (US) Inc.
4400 Computer Drive
Westborough, MA 01581
Counsel
K&L Gates LLP
Washington, DC
Independent registered public accounting firm
PricewaterhouseCoopers LLP
Baltimore, MD
QS Legg Mason Strategic Real Return Fund
The Fund is a separate investment series of Legg Mason Global Asset Management Trust, a Maryland statutory trust.
QS Legg Mason Strategic Real Return Fund
Legg Mason Funds
620 Eighth Avenue, 49th Floor
New York, NY 10018
The Fund files its complete schedule of portfolio holdings with the Securities and Exchange Commission (“SEC”) for the first and third quarters of each fiscal year on Form N-Q. The Fund’s Forms N-Q are available on the SEC’s website at www.sec.gov. The Fund’s Forms N-Q may be reviewed and copied at the SEC’s Public Reference Room in Washington, D.C., and information on the operation of the Public Reference Room may be obtained by calling 1-800-SEC-0330. To obtain information on Form N-Q, shareholders can call the Fund at 1-877-721-1926.
Information on how the Fund voted proxies relating to portfolio securities during the prior 12-month period ended June 30th of each year and a description of the policies and procedures that the Fund uses to determine how to vote proxies related to portfolio transactions are available (1) without charge, upon request, by calling the Fund at 1-877-721-1926, (2) on the Fund’s website at www.leggmason.com/individualinvestors and (3) on the SEC’s website at www.sec.gov.
This report is submitted for the general information of the shareholders of QS Legg Mason Strategic Real Return Fund. This report is not authorized for distribution to prospective investors in the Fund unless preceded or accompanied by a current prospectus.
Investors should consider the Fund’s investment objectives, risks, charges and expenses carefully before investing. The prospectus contains this and other important information about the Fund. Please read the prospectus carefully before investing.
www.leggmason.com/individualinvestors
© 2014 Legg Mason Investor Services, LLC
Member FINRA, SIPC
Legg Mason Funds Privacy and Security Notice
Your Privacy and the Security of Your Personal Information is Very Important to the Legg Mason Funds
This Privacy and Security Notice (the “Privacy Notice”) addresses the Legg Mason Funds’ privacy and data protection practices with respect to nonpublic personal information the Funds receive. The Legg Mason Funds include any funds sold by the Funds’ distributor, Legg Mason Investor Services, LLC, as well as Legg Mason-sponsored closed-end funds and certain closed-end funds managed or sub-advised by Legg Mason or its affiliates. The provisions of this Privacy Notice apply to your information both while you are a shareholder and after you are no longer invested with the Funds.
The Type of Nonpublic Personal Information the Funds Collect About You
The Funds collect and maintain nonpublic personal information about you in connection with your shareholder account. Such information may include, but is not limited to:
| Ÿ | | Personal information included on applications or other forms; |
| Ÿ | | Account balances, transactions, and mutual fund holdings and positions; |
| Ÿ | | Online account access user IDs, passwords, security challenge question responses; and |
| Ÿ | | Information received from consumer reporting agencies regarding credit history and creditworthiness (such as the amount of an individual’s total debt, payment history, etc.). |
How the Funds Use Nonpublic Personal Information About You
The Funds do not sell or share your nonpublic personal information with third parties or with affiliates for their marketing purposes, or with other financial institutions or affiliates for joint marketing purposes, unless you have authorized the Funds to do so. The Funds do not disclose any nonpublic personal information about you except as may be required to perform transactions or services you have authorized or as permitted or required by law. The Funds may disclose information about you to:
| Ÿ | | Employees, agents, and affiliates on a “need to know” basis to enable the Funds to conduct ordinary business or comply with obligations to government regulators; |
| Ÿ | | Service providers, including the Funds’ affiliates, who assist the Funds as part of the ordinary course of business (such as printing, mailing services, or processing or servicing your account with us) or otherwise perform services on the Funds’ behalf, including companies that may perform marketing services solely for the Funds; |
| Ÿ | | The Funds’ representatives such as legal counsel, accountants and auditors; and |
| Ÿ | | Fiduciaries or representatives acting on your behalf, such as an IRA custodian or trustee of a grantor trust. |
|
| NOT PART OF THE ANNUAL REPORT |
Legg Mason Funds Privacy and Security Notice (cont’d)
Except as otherwise permitted by applicable law, companies acting on the Funds’ behalf are contractually obligated to keep nonpublic personal information the Funds provide to them confidential and to use the information the Funds share only to provide the services the Funds ask them to perform.
The Funds may disclose nonpublic personal information about you when necessary to enforce their rights or protect against fraud, or as permitted or required by applicable law, such as in connection with a law enforcement or regulatory request, subpoena, or similar legal process. In the event of a corporate action or in the event a Fund service provider changes, the Funds may be required to disclose your nonpublic personal information to third parties. While it is the Funds’ practice to obtain protections for disclosed information in these types of transactions, the Funds cannot guarantee their privacy policy will remain unchanged.
Keeping You Informed of the Funds’ Privacy and Security Practices
The Funds will notify you annually of their privacy policy as required by federal law. While the Funds reserve the right to modify this policy at any time they will notify you promptly if this privacy policy changes.
The Funds’ Security Practices
The Funds maintain appropriate physical, electronic and procedural safeguards designed to guard your nonpublic personal information. The Funds’ internal data security policies restrict access to your nonpublic personal information to authorized employees, who may use your nonpublic personal information for Fund business purposes only.
Although the Funds strive to protect your nonpublic personal information, they cannot ensure or warrant the security of any information you provide or transmit to them, and you do so at your own risk. In the event of a breach of the confidentiality or security of your nonpublic personal information, the Funds will attempt to notify you as necessary so you can take appropriate protective steps. If you have consented to the Funds using electronic communications or electronic delivery of statements, they may notify you under such circumstances using the most current email address you have on record with them.
In order for the Funds to provide effective service to you, keeping your account information accurate is very important. If you believe that your account information is incomplete, not accurate or not current, or if you have questions about the Funds’ privacy practices, write the Funds using the contact information on your account statements, email the Funds by clicking on the Contact Us section of the Funds’ website at www.leggmason.com, or contact the Fund at 1-877-721-1926.
Revised April 2011
|
| NOT PART OF THE ANNUAL REPORT |
www.leggmason.com/individualinvestors
© 2014 Legg Mason Investor Services, LLC Member FINRA, SIPC
LMFX013120 11/14 SR14-2345
The registrant has adopted a code of ethics that applies to the registrant’s principal executive officer, principal financial officer, principal accounting officer or controller.
| ITEM 3. | AUDIT COMMITTEE FINANCIAL EXPERT. |
The Board of Trustees of the registrant has determined that Arthur S. Mehlman the Chairman of the Board’s Audit Committee and Robert M. Tarola, possess the technical attributes identified in Instruction 2(b) of Item 3 to Form N-CSR to qualify as “audit committee financial experts,” and have designated Mr. Mehlman and Mr. Tarola as the Audit Committee’s financial experts. Mr. Mehlman and Mr. Tarola are “independent” Trustees pursuant to paragraph (a) (2) of Item 3 to Form N-CSR.
| ITEM 4. | PRINCIPAL ACCOUNTANT FEES AND SERVICES. |
a) Audit Fees. The aggregate fees billed in the previous fiscal years ending September 30, 2012, September 30, 2013 and September 30, 2014 (the “Reporting Periods”) for professional services rendered by the Registrant’s principal accountant (the “Auditor”) for the audit of the Registrant’s annual financial statements, or services that are normally provided by the Auditor in connection with the statutory and regulatory filings or engagements for the Reporting Periods, were $132,226 in 2012, $195,250 in 2013 and $187,820 in 2014.
b) Audit-Related Fees. The aggregate fees billed in the Reporting Period for assurance and related services by the Auditor that are reasonably related to the performance of the Registrant’s financial statements were $0 in 2012, $8,500 in 2013 and $0 in 2014. These services consisted of procedures performed in connection with the Re-domiciliation of the various reviews of Prospectus supplements, and consent issuances related to the N-1A filings for the Legg Mason Global Asset Management Trust.
In addition, there were no Audit-Related Fees billed in the Reporting Period for assurance and related services by the Auditor to the Registrant’s investment adviser (not including any sub-adviser whose role is primarily portfolio management and is subcontracted with or overseen by another investment adviser), and any entity controlling, controlled by or under common control with the investment adviser that provides ongoing services to the Legg Mason Global Asset Management Trust (“service affiliates”), that were reasonably related to the performance of the annual audit of the service affiliates. Accordingly, there were no such fees that required pre-approval by the Audit Committee for the Reporting Periods.
(c) Tax Fees. The aggregate fees billed in the Reporting Periods for professional services rendered by the Auditor for tax compliance, tax advice and tax planning (“Tax Services”) were $15,600 in 2012, $19,420 in 2013 and $75,738 in 2014. These services consisted of (i) review or preparation of U.S. federal, state, local and excise tax returns; (ii) U.S. federal, state and local tax planning, advice and assistance regarding statutory, regulatory or administrative developments, and (iii) tax advice regarding tax qualification matters and/or treatment of various financial instruments held or proposed to be acquired or held.
There were no fees billed for tax services by the Auditors to service affiliates during the Reporting Periods that required pre-approval by the Audit Committee.
d) All Other Fees. The aggregate fees for other fees billed in the Reporting Periods for products and services provided by the Auditor were $2,530 in 2012, $1,730 in 2013 and $2,928 in 2014, other than the services reported in paragraphs (a) through (c) of this Item for the Legg Mason Global Asset Management Trust.
All Other Fees. There were no other non-audit services rendered by the Auditor to Legg Mason Partners Fund Advisors, LLC (“LMPFA”), and any entity controlling, controlled by or under common control with LMPFA that provided ongoing services to Legg Mason Global Asset Management Trust requiring pre-approval by the Audit Committee in the Reporting Period.
(e) Audit Committee’s pre–approval policies and procedures described in paragraph (c)
(7) of Rule 2-01 of Regulation S-X.
(1) The Charter for the Audit Committee (the “Committee”) of the Board of each registered investment company (the “Fund”) advised by LMPFA or one of their affiliates (each, an “Adviser”) requires that the Committee shall approve (a) all audit and permissible non-audit services to be provided to the Fund and (b) all permissible non-audit services to be provided by the Fund’s independent auditors to the Adviser and any Covered Service Providers if the engagement relates directly to the operations and financial reporting of the Fund. The Committee may implement policies and procedures by which such services are approved other than by the full Committee.
The Committee shall not approve non-audit services that the Committee believes may impair the independence of the auditors. As of the date of the approval of this Audit Committee Charter, permissible non-audit services include any professional services (including tax services), that are not prohibited services as described below, provided to the Fund by the independent auditors, other than those provided to the Fund in connection with an audit or a review of the financial statements of the Fund. Permissible non-audit services may not include: (i) bookkeeping or other services related to the accounting records or financial statements of the Fund; (ii) financial information systems design and implementation; (iii) appraisal or valuation services, fairness opinions or contribution-in-kind reports; (iv) actuarial services; (v) internal audit outsourcing services; (vi) management functions or human resources; (vii) broker or dealer, investment adviser or investment banking services; (viii) legal services and expert services unrelated to the audit; and (ix) any other service the Public Company Accounting Oversight Board determines, by regulation, is impermissible.
Pre-approval by the Committee of any permissible non-audit services is not required so long as: (i) the aggregate amount of all such permissible non-audit services provided to the Fund, the Adviser
and any service providers controlling, controlled by or under common control with the Adviser that provide ongoing services to the Fund (“Covered Service Providers”) constitutes not more than 5% of the total amount of revenues paid to the independent auditors during the fiscal year in which the permissible non-audit services are provided to (a) the Fund, (b) the Adviser and (c) any entity controlling, controlled by or under common control with the Adviser that provides ongoing services to the Fund during the fiscal year in which the services are provided that would have to be approved by the Committee; (ii) the permissible non-audit services were not recognized by the Fund at the time of the engagement to be non-audit services; and (iii) such services are promptly brought to the attention of the Committee and approved by the Committee (or its delegate(s)) prior to the completion of the audit.
(2) For the Legg Mason Global Asset Management Trust, the percentage of fees that were approved by the audit committee, with respect to: Audit-Related Fees were 100%, 100% and 100% for 2012, 2013 and 2014; Tax Fees were 100%, 100% and 100% for 2012, 2013 and 2014; and Other Fees were 100%, 100% and 100% for 2012, 2013 and 2014.
(f) N/A
(g) Non-audit fees billed by the Auditor for services rendered to Legg Mason Global Asset Management Trust, LMPFA and any entity controlling, controlled by, or under common control with LMPFA that provides ongoing services to Legg Mason Global Asset Management Trust during the reporting period were $270,453 in 2012, $254,500 in 2013 and $248,092 in 2014.
(h) Yes. Legg Mason Global Asset Management Trust’s Audit Committee has considered whether the provision of non-audit services that were rendered to Service Affiliates, which were not pre-approved (not requiring pre-approval), is compatible with maintaining the Accountant’s independence. All services provided by the Auditor to the Legg Mason Global Asset Management Trust or to Service Affiliates, which were required to be pre-approved, were pre-approved as required.
| ITEM 5. | AUDIT COMMITTEE OF LISTED REGISTRANTS. |
| | a) | The independent board members are acting as the registrant’s audit committee as specified in Section 3(a)(58)(B) of the Exchange Act .The Audit Committee consists of the following Board members: |
Ruby P. Hearn
Arnold L. Lehman
Robin J.W. Masters
Jill E. McGovern
Arthur S. Mehlman
G. Peter O’Brien
S. Ford Rowan
Robert M. Tarola
| ITEM 6. | SCHEDULE OF INVESTMENTS. |
Included herein under Item 1.
| ITEM 7. | DISCLOSURE OF PROXY VOTING POLICIES AND PROCEDURES FOR CLOSED-END MANAGEMENT INVESTMENT COMPANIES. |
Not applicable.
| ITEM 8. | PORTFOLIO MANAGERS OF CLOSED-END MANAGEMENT INVESTMENT COMPANIES. |
Not applicable.
| ITEM 9. | PURCHASES OF EQUITY SECURITIES BY CLOSED-END MANAGEMENT INVESTMENT COMPANY AND AFFILIATED PURCHASERS. |
Not applicable.
| ITEM 10. | SUBMISSION OF MATTERS TO A VOTE OF SECURITY HOLDERS. |
Not applicable.
| ITEM 11. | CONTROLS AND PROCEDURES. |
| | (a) | The registrant’s principal executive officer and principal financial officer have concluded that the registrant’s disclosure controls and procedures (as defined in Rule 30a- 3(c) under the Investment Company Act of 1940, as amended (the “1940 Act”)) are effective as of a date within 90 days of the filing date of this report that includes the disclosure required by this paragraph, based on their evaluation of the disclosure controls and procedures required by Rule 30a-3(b) under the 1940 Act and 15d-15(b) under the Securities Exchange Act of 1934. |
| | (b) | There were no changes in the registrant’s internal control over financial reporting (as defined in Rule 30a-3(d) under the 1940 Act) that occurred during the second fiscal quarter of the period covered by this report that have materially affected, or are likely to materially affect the registrant’s internal control over financial reporting. |
(a) (1) Code of Ethics attached hereto.
Exhibit 99.CODE ETH
(a) (2) Certifications pursuant to section 302 of the Sarbanes-Oxley Act of 2002 attached hereto.
Exhibit 99.CERT
(b) Certifications pursuant to Section 906 of the Sarbanes-Oxley Act of 2002 attached hereto.
Exhibit 99.906CERT
SIGNATURES
Pursuant to the requirements of the Securities Exchange Act of 1934 and the Investment Company Act of 1940, the registrant has duly caused this Report to be signed on its behalf by the undersigned, there unto duly authorized.
| | |
| Legg Mason Global Asset Management Trust |
| |
| By: | | /s/ Kenneth D. Fuller |
| | Kenneth D. Fuller |
| | Chief Executive Officer |
| |
| Date: | | November 25, 2014 |
Pursuant to the requirements of the Securities Exchange Act of 1934 and the Investment Company Act of 1940, this report has been signed below by the following persons on behalf of the registrant and in the capacities and on the dates indicated.
| | |
| By: | | /s/ Kenneth D. Fuller |
| | Kenneth D. Fuller |
| | Chief Executive Officer |
| |
| Date: | | November 25, 2014 |
| |
| By: | | /s/ Richard F. Sennett |
| | Richard F. Sennett |
| | Principal Financial Officer |
| |
| Date: | | November 25, 2014 |