UNITED STATES
SECURITIES AND EXCHANGE COMMISSION
Washington, D.C. 20549
FORM N-CSR
CERTIFIED SHAREHOLDER REPORT OF REGISTERED
MANAGEMENT INVESTMENT COMPANIES
Investment Company Act file number 811-22338
Legg Mason Global Asset Management Trust
(Exact name of registrant as specified in charter)
620 Eighth Avenue, 47th Floor, New York, NY 10018
(Address of principal executive offices) (Zip code)
Marc A. De Oliveira
Franklin Templeton
100 First Stamford Place
Stamford, CT 06902
(Name and address of agent for service)
Registrant’s telephone number, including area code: 1-877-721-1926
Date of fiscal year end: December 31
Date of reporting period: December 31, 2020
| ITEM 1. | REPORT TO STOCKHOLDERS |
The Annual Report to Stockholders is filed herewith.

| | |
| Annual Report | | December 31, 2020 |
QS
U.S. SMALL CAPITALIZATION EQUITY FUND
Beginning in or after January 2021, as permitted by regulations adopted by the Securities and Exchange Commission, the Fund intends to no longer mail paper copies of the Fund’s shareholder reports like this one, unless you specifically request paper copies of the reports from the Fund or from your Service Agent or financial intermediary (such as a broker-dealer or bank). Instead, the reports will be made available on a website, and you will be notified by mail each time a report is posted and provided with a website link to access the report.
If you already elected to receive shareholder reports electronically (“e-delivery”), you will not be affected by this change and you need not take any action. If you have not already elected e-delivery, you may elect to receive shareholder reports and other communications from the Fund electronically by contacting your Service Agent or, if you are a direct shareholder with the Fund, by calling 1-877-721-1926.
You may elect to receive all future reports in paper free of charge. If you invest through a Service Agent, you can contact your Service Agent to request that you continue to receive paper copies of your shareholder reports. That election will apply to all Legg Mason Funds held in your account at that Service Agent. If you are a direct shareholder with the Fund, you can call the Fund at 1-877-721-1926, or write to the Fund by regular mail at Legg Mason Funds, P.O. Box 9699, Providence, RI 02940-9699 or by express, certified or registered mail to Legg Mason Funds, 4400 Computer Drive, Westborough, MA 01581 to let the Fund know you wish to continue receiving paper copies of your shareholder reports. That election will apply to all Legg Mason Funds held in your account held directly with the fund complex.

|
| INVESTMENT PRODUCTS: NOT FDIC INSURED • NO BANK GUARANTEE • MAY LOSE VALUE |
Fund objective
The Fund seeks long-term capital appreciation.
Letter from the president

Dear Shareholder,
We are pleased to provide the annual report of QS U.S. Small Capitalization Equity Fund for the twelve-month reporting period ended December 31, 2020. Please read on for a detailed look at prevailing economic and market conditions during the Fund’s reporting period and to learn how those conditions have affected Fund performance.
As always, we remain committed to providing you with excellent service and a full spectrum of investment choices. We also remain committed to supplementing the support you receive from your financial advisor. One way we accomplish this is through our website, www.leggmason.com. Here you can gain immediate access to market and investment information, including:
| • | | Fund prices and performance, |
| • | | Market insights and commentaries from our portfolio managers, and |
| • | | A host of educational resources. |
We look forward to helping you meet your financial goals.
Sincerely,

Jane Trust, CFA
President and Chief Executive Officer
January 29, 2021
| | |
II | | QS U.S. Small Capitalization Equity Fund |
Fund overview
Q. What is the Fund’s investment strategy?
A. The Fund’s investment objective is long-term capital appreciation. Under normal market conditions, the Fund will invest at least 80% of net assets, plus any borrowings for investment purposes, in equity securities of companies with small market capitalizations domiciled, or having their principal activities, in the U.S., at the time of investment or other investments with similar economic characteristics. The Fund normally intends to hold a portfolio that is generally comparable to, but not the same as, the Russell 2000 Indexi in terms of economic sector weightings and market capitalization but may depart from this if we believe it to be in the best interests of the Fund. The Fund may also invest in securities of foreign companies in the form of American Depositary Receipts (“ADRs”).
At QS Investors, LLC, the Fund’s subadviser, all portfolios are managed on a collaborative basis using a systematic, rules-based approach. We use a bottom-up, quantitative stock selection process. The cornerstone of this process is a proprietary stock selection model that ranks the stocks in the Fund’s investable universe on a daily basis according to a variety of fundamental measures of relative attractiveness.
Q. What were the overall market conditions during the Fund’s reporting period?
A. U.S. equities, as measured by the Russell 2000 Index (the “Index”), returned 20% for the twelve-month reporting period ended December 31, 2020, with considerable volatility within and across quarters, as the spread of COVID-19 and the prospects for a vaccine dominated the narrative. Historical lows were reached in the first quarter of 2020, but an additional selloff in October 2020 was followed by a significant surge in the final months of the reporting period.
With the arrival of COVID-19 in the first quarter of 2020, U.S. equities declined almost 20% despite a series of moves by the Federal Reserve Board (the “Fed”)ii to mitigate the impact of the pandemic. On March 15, 2020, the Fed embarked on a large-scale program employing emergency powers in order to stabilize the economy. Chief among these emergency actions was cutting interest rates effectively to zero and a $700 billion round of quantitative easing. Despite these actions, stock prices continued their steep decline. At the end of the first quarter, the White House and Congress reached a deal on a two trillion-dollar stimulus package (approximately 10% of U.S. GDPiii), against the backdrop of the largest ever unemployment claims number.
U.S. retail sales increased 17% between April 2020 and May 2020, as states began to lift restrictions. This led to a strong recovery in equity markets in the second calendar quarter of 2020, which persisted into the summer. News of a potential treatment for the virus seemed to offset the impact of a summer surge in COVID-19 in parts of the country. August 2020 saw an increase in manufacturing activity, better-than-expected factory orders and fewer jobless claims, pushing U.S. equity markets, as measured by the Russell 1000 Indexiv, to record highs. In addition, the Fed indicated a shift in approach with respect to inflation, suggesting that interest rates may remain low for longer than expected.
| | |
| QS U.S. Small Capitalization Equity Fund 2020 Annual Report | | 1 |
Fund overview (cont’d)
A modest pullback in September 2020 was followed by a more significant selloff in October 2020, driven by a resurgence in COVID-19 cases, delays in additional fiscal-stimulus and fears of an unclear or contested U.S. presidential election outcome. The Biden/Harris win in November 2020, coupled with vaccine news, which exceeded expectations in terms of both timing and efficacy, brought a renewed surge in U.S. equity returns.
Sector returns varied greatly for the full reporting period. Health Care, Information Technology and Consumer Discretionary stocks led the way, with the Health Care sector returning 46% in the Index and the other two sectors over 30% for the twelve-month reporting period. The Energy sector was especially hard hit by the pandemic and posted a -36.7% return. A supply side price war between Saudi Arabia and Russia dominated the market in the first quarter of 2020, as did a deteriorating demand for oil due to the impact of the coronavirus on global economic growth. Losses in the Energy sector were only partially mitigated by second calendar quarter outperformance, as economies began to ease lockdown restrictions and oil companies in North America reduced supply. While the last half of the reporting period brought additional waves of COVID-19 again impacting demand, news in November 2020 of positive vaccine trial results stoked crude oil’s largest monthly price gain since May 2020, ending a volatile stretch of selling that began in late August 2020.
The Financials sector also underperformed the Index. Despite measures being taken by the federal government and the Fed, bank asset quality, net interest margins and earnings came under pressure, and banks were faced with credit losses and capital declines.
Q. How did we respond to these changing market conditions?
A. We believe that fundamentals, the very basis of our investment process, will continue to be the primary driver of long-term returns. As a result, we continue to adhere to our investment philosophy while continuing to enhance our process to address sustainable market shifts. We also believe that integrated risk management is an important element of portfolio construction and our investment process will continue to reflect these long-held views. We strongly believe, particularly during times of extreme market volatility, in the value of a broadly diversified, rules-based, risk-controlled process.
Much of our research continues to be focused on developing tools to enhance performance regardless of market environment. This includes both individual factor research as well as factor allocation strategies.
Performance review
For the twelve months ended December 31, 2020, Class I shares of QS U.S. Small Capitalization Equity Fund returned 11.26%. The Fund’s unmanaged benchmark, the Russell 2000 Index, returned 19.96% for the same period. The Lipper Small-Cap Core Funds Category Averagev returned 9.22% over the same time frame.
| | |
2 | | QS U.S. Small Capitalization Equity Fund 2020 Annual Report |
| | | | | | | | |
| Performance Snapshot as of December 31, 2020 (unaudited) | |
| (excluding sales charges) | | 6 months | | | 12 months | |
| QS U.S. Small Capitalization Equity Fund: | | | | | | | | |
Class A | | | 32.63 | % | | | 10.99 | % |
Class A2 | | | 32.43 | % | | | 10.72 | % |
Class C | | | 32.17 | % | | | 10.16 | % |
Class FI | | | 32.55 | % | | | 10.94 | % |
Class I | | | 32.84 | % | | | 11.26 | % |
Class IS | | | 32.87 | % | | | 11.47 | % |
| Russell 2000 Index | | | 37.85 | % | | | 19.96 | % |
| Lipper Small-Cap Core Funds Category Average | | | 33.40 | % | | | 9.22 | % |
The performance shown represents past performance. Past performance is no guarantee of future results and current performance may be higher or lower than the performance shown above. Principal value and investment returns will fluctuate and investors’ shares, when redeemed, may be worth more or less than their original cost. To obtain performance data current to the most recent month-end, please visit our website at www.leggmason.com/mutualfunds.
All share class returns assume the reinvestment of all distributions at net asset value and the deduction of all Fund expenses. Returns have not been adjusted to include sales charges that may apply or the deduction of taxes that a shareholder would pay on Fund distributions. If sales charges were reflected, the performance quoted would be lower. Performance figures for periods shorter than one year represent cumulative figures and are not annualized.
Fund performance figures reflect fee waivers and/or expense reimbursements, without which the performance would have been lower.
|
| Total Annual Operating Expenses (unaudited) |
As of the Fund’s current prospectus dated May 1, 2020, the gross total annual fund operating expense ratios for Class A, Class A2, Class C, Class FI, Class I and Class IS shares were 1.13%, 1.51%, 1.98%, 1.41%, 1.02% and 0.86%, respectively.
Actual expenses may be higher. For example, expenses may be higher than those shown if average net assets decrease. Net assets are more likely to decrease and Fund expense ratios are more likely to increase when markets are volatile.
As a result of expense limitation arrangements, the ratio of total annual operating fund expenses, other than interest, brokerage commissions, dividend expense on short sales, taxes, extraordinary expenses and acquired fund fees and expenses, to average net assets will not exceed 1.30% for Class A shares, 1.50% for Class A2 shares, 2.05% for Class C shares, 1.30% for Class FI shares, 1.00% for Class I shares and 0.75% for Class IS shares. In addition, the ratio of total annual fund operating expenses for Class IS shares will not exceed the ratio of total annual fund operating expenses for Class I shares. These expense limitation arrangements cannot be terminated prior to December 31, 2022 without the Board of Trustees’ consent.
The manager has also agreed to voluntarily waive fees and/or reimburse operating expenses, other than interest, brokerage commissions, dividend expense on short sales, taxes, extraordinary expenses and acquired fund fees and expenses, so that annual operating expenses will not exceed
| | |
| QS U.S. Small Capitalization Equity Fund 2020 Annual Report | | 3 |
Fund overview (cont’d)
1.20% for Class A shares, 1.40% for Class A2 shares, 1.95% for Class C shares, 1.20% for Class FI shares and 0.90% for Class I shares. These arrangements are expected to continue until December 31, 2022, but may be terminated at any time by the manager.
The manager is permitted to recapture amounts waived and/or reimbursed to a class within three years after the fiscal year in which the manager earned the fee or incurred the expense if the class’ total annual operating expenses have fallen to a level below the expense limitation (“expense cap”) in effect at the time the fees were earned or the expenses incurred. In no case will the manager recapture any amount that would result, on any particular business day of the Fund, in the class’ total annual operating expenses exceeding the expense cap or any other lower limit then in effect.
Q. What were the leading contributors to performance?
A. Stock selection in the non-bank portion of the Financials sector and in the Materials and Energy sectors was the leading contributor to relative performance for the year. Sector allocation results were also strong in certain segments; underweights to Banks and Real Estate, two industries that suffered during the period and experienced negative returns, contributed.
At the security level, the leading contributor was Etsy Inc., which is not in the Index and returned over 300% in the portfolio, benefiting from the increase in online retail sales during the pandemic; sales were up almost 70% for the period. More recent deterioration in valuation and expectations data have resulted in a reduction in portfolio position going into the end of the reporting period.
Overweighting OnTrak Inc. (formerly Catasys Inc.) was a major contributor, returning over 200%. OnTrak is a technology-enabled health care company with a platform to predict people whose chronic disease will improve with behavior changes and recommend effective care in order to provide cost savings to health care payers. Strong second quarter sales results and fiscal year 2020 forecasts boosted the stock and garnered increased price targets from several analysts.
Another holding not in the Index, HubSpot Inc., was also a leading contributor, returning 150% for the period. The Cambridge, MA-based firm sells sales and marketing software, focusing on blogs, internet search engines and social media, and benefited from the acquisition in November 2020 of PieSync, which operates a two-way sync customer analytics platform. Strong fundamentals and expectations data continue to support our position in this name.
Q. What were the leading detractors from performance?
A. Stock selection overall detracted from relative return for the period, especially in the Industrials, Consumer Discretionary and Real Estate sectors. A modest underweight to the Consumer Discretionary sector also detracted, as it had one of the strongest returns in the Index.
| | |
4 | | QS U.S. Small Capitalization Equity Fund 2020 Annual Report |
Underweighting Teledoc Health Inc., which returned over 130% for the reporting period, was the leading detractor at the security level. While the company has clearly benefited for the need for virtual health care, there is no history of positive net earnings — or an expectation that will change in the near-term - making evaluation difficult. As a result, this company carries a poor rating in our stock selection model and it is not held.
Quidel Corp., which focuses on developing medical diagnostic products and has been active in the COVID-19 testing market, was also a security level detractor by virtue of trade timing. It became a strong buy candidate in our model in May 2020, as earnings growth and expectations soared following the FDA approval of its Antigen test. An overweight position was initiated at that time. However, the company’s fortunes abated in August 2020, as competitor Abbott’s rapid test was approved and multiple test-maker shares slipped. Despite recovering through October 2020, the stock took another hit in early November 2020 following Pfizer’s vaccine approval. The company continues to have a strong forward outlook and high rank in our stock selection model.
Small engine manufacturer Briggs & Stratton Corp. was also a detractor, as the 112-year-old manufacturer of engines for lawn mowers and gardening tools filed for Chapter 11 in July 2020. The company cited changing weather patterns, the collapse of Sears, unfair Chinese competition, and Covid-19 shutdowns as factors contributing to its financial straits.
Thank you for your investment in QS U.S. Small Capitalization Equity Fund. As always, we appreciate that you have chosen us to manage your assets and we remain focused on achieving the Fund’s investment goals.
Sincerely,
QS Investors, LLC
January 14, 2021
RISKS: Equity securities are subject to market and price fluctuations. Investments in small-cap companies may involve greater risks and volatility than investments in larger, more established companies. Small-cap companies may have limited product lines, operating histories, markets or financial resources. The Fund may use derivatives, such as options and futures, which can be illiquid, may disproportionately increase losses, and may have a potentially large impact on Fund performance. Please see the Fund’s prospectus for a more complete discussion of these and other risks and the Fund’s investment strategies.
Portfolio holdings and breakdowns are as of December 31, 2020 and are subject to change and may not be representative of the portfolio managers’ current or future investments. The Fund’s top ten holdings (as a percentage of net assets) as of December 31, 2020 were: SPS Commerce Inc. (0.8%), Invesco Treasury Portfolio (0.7%), Mr. Cooper Group Inc. (0.7%), Herc Holdings Inc. (0.7%), Workiva Inc. (0.7%), Dycom Industries Inc. (0.6%), Darling Ingredients Inc. (0.6%), Deckers Outdoor Corp. (0.6%), Manhattan Associates Inc. (0.6%) and Trinseo SA (0.6%). Please refer to pages 12 through 24 for a list and percentage breakdown of the Fund’s holdings.
| | |
| QS U.S. Small Capitalization Equity Fund 2020 Annual Report | | 5 |
Fund overview (cont’d)
The mention of sector breakdowns is for informational purposes only and should not be construed as a recommendation to purchase or sell any securities. The information provided regarding such sectors is not a sufficient basis upon which to make an investment decision. Investors seeking financial advice regarding the appropriateness of investing in any securities or investment strategies discussed should consult their financial professional. The Fund’s top five sector holdings (as a percentage of net assets) as of December 31, 2020 were: Health Care (20.5%), Financials (15.2%), Information Technology (15.0%), Industrials (14.5%) and Consumer Discretionary (12.7%). The Fund’s portfolio composition is subject to change at any time.
All investments are subject to risk including the possible loss of principal. Past performance is no guarantee of future results. All index performance reflects no deduction for fees, expenses or taxes. Please note that an investor cannot invest directly in an index.
The information provided is not intended to be a forecast of future events, a guarantee of future results or investment advice. Views expressed may differ from those of the firm as a whole.
| i | The Russell 2000 Index measures the performance of the small-cap segment of the U.S. equity universe. The Russell 2000 is a subset of the Russell 3000 Index representing approximately 10% of the total market capitalization of that index. It includes approximately 2,000 of the smallest securities based on a combination of their market cap and current index membership. The Russell 3000 Index measures the performance of the 3,000 largest U.S. companies based on total market capitalization, which represents approximately 98% of the U.S. equity market. |
| ii | The Federal Reserve Board (the “Fed”) is responsible for the formulation of U.S. policies designed to promote economic growth, full employment, stable prices and a sustainable pattern of international trade and payments. |
| iii | Gross domestic product (“GDP”) is the market value of all final goods and services produced within a country in a given period of time. |
| iv | The Russell 1000 Index measures the performance of the large-cap segment of the U.S. equity universe. It is a subset of the Russell 3000 Index and includes approximately 1,000 of the largest securities based on a combination of their market cap and current index membership. The Russell 1000 represents approximately 90% of the U.S. market. |
| v | Lipper, Inc., a wholly-owned subsidiary of Reuters, provides independent insight on global collective investments. Returns are based on the period ended December 31, 2020, including the reinvestment of all distributions, including returns of capital, if any, calculated among the 910 funds for the six-month period and among the 899 funds for the twelve-month period in the Fund’s Lipper category, and excluding sales charges, if any. |
| | |
6 | | QS U.S. Small Capitalization Equity Fund 2020 Annual Report |
Fund at a glance† (unaudited)
Investment breakdown (%) as a percent of total investments
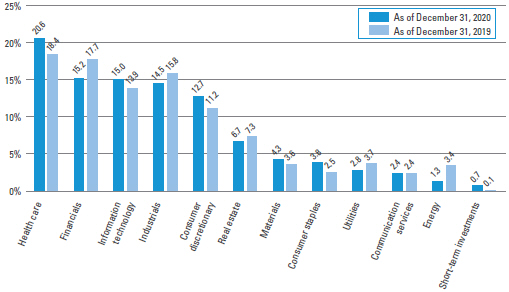
| † | The bar graph above represents the composition of the Fund’s investments as of December 31, 2020 and December 31, 2019 and does not include derivatives such as futures contracts. The Fund is actively managed. As a result, the composition of the Fund’s investments is subject to change at any time. |
| | |
| QS U.S. Small Capitalization Equity Fund 2020 Annual Report | | 7 |
Fund expenses (unaudited)
Example
As a shareholder of the Fund, you may incur two types of costs: (1) transaction costs, including front-end and back-end sales charges (loads) on purchase payments; and (2) ongoing costs, including management fees; service and/or distribution (12b-1) fees; and other Fund expenses. This example is intended to help you understand your ongoing costs (in dollars) of investing in the Fund and to compare these costs with the ongoing costs of investing in other mutual funds.
This example is based on an investment of $1,000 invested on July 1, 2020 and held for the six months ended December 31, 2020.
Actual expenses
The table below titled “Based on Actual Total Return” provides information about actual account values and actual expenses. You may use the information provided in this table, together with the amount you invested, to estimate the expenses that you paid over the period. To estimate the expenses you paid on your account, divide your ending account value by $1,000 (for example, an $8,600 ending account value divided by $1,000 = 8.6), then multiply the result by the number under the heading entitled “Expenses Paid During the Period”.
Hypothetical example for comparison purposes
The table below titled “Based on Hypothetical Total Return” provides information about hypothetical account values and hypothetical expenses based on the actual expense ratio and an assumed rate of return of 5.00% per year before expenses, which is not the Fund’s actual return. The hypothetical account values and expenses may not be used to estimate the actual ending account balance or expenses you paid for the period. You may use the information provided in this table to compare the ongoing costs of investing in the Fund and other funds. To do so, compare the 5.00% hypothetical example relating to the Fund with the 5.00% hypothetical examples that appear in the shareholder reports of the other funds.
Please note that the expenses shown in the table below are meant to highlight your ongoing costs only and do not reflect any transactional costs, such as front-end or back-end sales charges (loads). Therefore, the table is useful in comparing ongoing costs only, and will not help you determine the relative total costs of owning different funds. In addition, if these transaction costs were included, your costs would have been higher.
| | | | | | | | | | | | | | | | | | | | | | | | | | | | | | | | | | | | | | | | | | | | | | |
| | | |
| Based on actual total return1 | | | | | | | | | Based on hypothetical total return1 | |
| | | Actual
Total Return
Without
Sales
Charge2 | | | Beginning
Account
Value | | | Ending
Account
Value | | | Annualized
Expense
Ratio | | | Expenses
Paid
During
the
Period3 | | | | | | | | Hypothetical
Annualized
Total Return | | | Beginning
Account
Value | | | Ending
Account
Value | | | Annualized
Expense
Ratio | | | Expenses
Paid
During
the
Period3 | |
| Class A | | | 32.63 | % | | $ | 1,000.00 | | | $ | 1,326.30 | | | | 1.12 | % | | $ | 6.55 | | | | | | | Class A | | | 5.00 | % | | $ | 1,000.00 | | | $ | 1,019.51 | | | | 1.12 | % | | $ | 5.69 | |
| Class A2 | | | 32.43 | | | | 1,000.00 | | | | 1,324.30 | | | | 1.39 | | | | 8.12 | | | | | | | Class A2 | | | 5.00 | | | | 1,000.00 | | | | 1,018.15 | | | | 1.39 | | | | 7.05 | |
| Class C | | | 32.17 | | | | 1,000.00 | | | | 1,321.70 | | | | 1.86 | | | | 10.85 | | | | | | | Class C | | | 5.00 | | | | 1,000.00 | | | | 1,015.79 | | | | 1.86 | | | | 9.42 | |
| Class FI | | | 32.55 | | | | 1,000.00 | | | | 1,325.50 | | | | 1.20 | | | | 7.01 | | | | | | | Class FI | | | 5.00 | | | | 1,000.00 | | | | 1,019.10 | | | | 1.20 | | | | 6.09 | |
| Class I | | | 32.84 | | | | 1,000.00 | | | | 1,328.40 | | | | 0.90 | | | | 5.27 | | | | | | | Class I | | | 5.00 | | | | 1,000.00 | | | | 1,020.61 | | | | 0.90 | | | | 4.57 | |
| Class IS | | | 32.87 | | | | 1,000.00 | | | | 1,328.70 | | | | 0.75 | | | | 4.39 | | | | | | | Class IS | | | 5.00 | | | | 1,000.00 | | | | 1,021.37 | | | | 0.75 | | | | 3.81 | |
| | |
8 | | QS U.S. Small Capitalization Equity Fund 2020 Annual Report |
| 1 | For the six months ended December 31, 2020. |
| 2 | Assumes the reinvestment of all distributions, including returns of capital, if any, at net asset value and does not reflect the deduction of the applicable sales charge with respect to Class A and Class A2 shares or the applicable contingent deferred sales charge (“CDSC”) with respect to Class C shares. Total return is not annualized, as it may not be representative of the total return for the year. Performance figures may reflect compensating balance arrangements, fee waivers and/or expense reimbursements. In the absence of compensating balance arrangements, fee waivers and/or expense reimbursements, the total return would have been lower. Past performance is no guarantee of future results. |
| 3 | Expenses (net of compensating balance arrangements, fee waivers and/or expense reimbursements) are equal to each class’ respective annualized expense ratio multiplied by the average account value over the period, multiplied by the number of days in the most recent fiscal half-year (184), then divided by 366. |
| | |
| QS U.S. Small Capitalization Equity Fund 2020 Annual Report | | 9 |
Fund performance (unaudited)
| | | | | | | | | | | | | | | | | | | | | | | | |
| Average annual total returns | | | | | | | | | | | | | | | | | | |
| Without sales charges1 | | Class A | | | Class A2 | | | Class C | | | Class FI | | | Class I | | | Class IS | |
| Twelve Months Ended 12/31/20 | | | 10.99 | % | | | 10.72 | % | | | 10.16 | % | | | 10.94 | % | | | 11.26 | % | | | 11.47 | % |
| Five Years Ended 12/31/20 | | | 7.89 | | | | 7.65 | | | | 7.10 | | | | 7.86 | | | | 8.18 | | | | 8.36 | |
| Ten Years Ended 12/31/20 | | | 8.98 | | | | N/A | | | | 8.16 | | | | 8.94 | | | | 9.36 | | | | N/A | |
| Inception* through 12/31/20 | | | — | | | | 9.80 | | | | — | | | | — | | | | — | | | | 9.59 | |
| | | | | | |
| With sales charges2 | | Class A | | | Class A2 | | | Class C | | | Class FI | | | Class I | | | Class IS | |
| Twelve Months Ended 12/31/20 | | | 4.58 | % | | | 4.38 | % | | | 9.16 | % | | | 10.94 | % | | | 11.26 | % | | | 11.47 | % |
| Five Years Ended 12/31/20 | | | 6.62 | | | | 6.38 | | | | 7.10 | | | | 7.86 | | | | 8.18 | | | | 8.36 | |
| Ten Years Ended 12/31/20 | | | 8.34 | | | | N/A | | | | 8.16 | | | | 8.94 | | | | 9.36 | | | | N/A | |
| Inception* through 12/31/20 | | | — | | | | 9.01 | | | | — | | | | — | | | | — | | | | 9.59 | |
| | | | |
| Cumulative total returns | |
| Without sales charges1 | | | |
| Class A (12/31/10 through 12/31/20) | | | 136.34 | % |
| Class A2 (Inception date of 10/31/12 through 12/31/20) | | | 114.65 | |
| Class C (12/31/10 through 12/31/20) | | | 119.15 | |
| Class FI (12/31/10 through 12/31/20) | | | 135.43 | |
| Class I (12/31/10 through 12/31/20) | | | 144.77 | |
| Class IS (Inception date of 3/23/12 through 12/31/20) | | | 123.31 | |
All figures represent past performance and are not a guarantee of future results. Investment return and principal value of an investment will fluctuate so that an investor’s shares, when redeemed, may be worth more or less than their original cost. The returns shown do not reflect the deduction of taxes that a shareholder would pay on Fund distributions or the redemption of Fund shares. Performance figures may reflect compensating balance arrangements, fee waivers and/or expense reimbursements. In the absence of compensating balance arrangements, fee waivers and/or expense reimbursements, the total return would have been lower.
| 1 | Assumes the reinvestment of all distributions, including returns of capital, if any, at net asset value and does not reflect the deduction of the applicable sales charge with respect to Class A and Class A2 shares or the applicable contingent deferred sales charge (“CDSC”) with respect to Class C shares. |
| 2 | Assumes the reinvestment of all distributions, including returns of capital, if any, at net asset value. In addition, Class A and Class A2 shares reflect the deduction of the maximum initial sales charge of 5.75%. Class C shares reflect the deduction of a 1.00% CDSC, which applies if shares are redeemed within one year from purchase payment. |
| * | Inception dates for Class A, A2, C, FI, I and IS shares are February 5, 2009, October 31, 2012, February 5, 2009, January 9, 2003, March 13, 2000 and March 23, 2012, respectively. |
| | |
10 | | QS U.S. Small Capitalization Equity Fund 2020 Annual Report |
Historical performance
Value of $1,000,000 invested in
Class I Shares of QS U.S. Small Capitalization Equity Fund vs. Russell 2000 Index† — December 2010 - December 2020
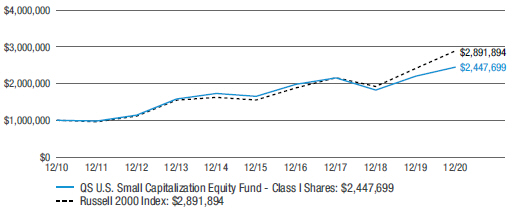
All figures represent past performance and are not a guarantee of future results. Investment return and principal value of an investment will fluctuate so that an investor’s shares, when redeemed, may be worth more or less than their original cost. The returns shown do not reflect the deduction of taxes that a shareholder would pay on Fund distributions or the redemption of Fund shares. Performance figures may reflect compensating balance arrangements, fee waivers and/or expense reimbursements. In the absence of compensating balance arrangements, fee waivers and/or expense reimbursements, the total return would have been lower.
| † | Hypothetical illustration of $1,000,000 invested in Class I shares of QS U.S. Small Capitalization Equity Fund on December 31, 2010, assuming the reinvestment of all distributions, including returns of capital, if any, at net asset value through December 31, 2020. The hypothetical illustration also assumes a $1,000,000 investment in the Russell 2000 Index. The Russell 2000 Index (the “Index”) measures the performance of the small-cap segment of the U.S. equity universe. The Index is a subset of the Russell 3000 Index representing approximately 10% of the total market capitalization of that index. It includes approximately 2,000 of the smallest securities based on a combination of their market cap and current index membership. The Russell 3000 Index measures the performance of the 3,000 largest U.S. companies based on total market capitalization, which represents approximately 98% of the U.S. equity market. The Index is unmanaged and is not subject to the same management and trading expenses as a mutual fund. Please note that an investor cannot invest directly in an index. The performance of the Fund’s other classes may be greater or less than the Class I shares’ performance indicated on this chart, depending on whether greater or lesser sales charges and fees were incurred by shareholders investing in the other classes. |
| | |
| QS U.S. Small Capitalization Equity Fund 2020 Annual Report | | 11 |
Schedule of investments
December 31, 2020
QS U.S. Small Capitalization Equity Fund
| | | | | | | | |
| Security | | Shares | | | Value | |
| Common Stocks — 99.2% | | | | | | | | |
| Communication Services — 2.4% | | | | | | | | |
Diversified Telecommunication Services — 0.5% | | | | | | | | |
ATN International Inc. | | | 4,000 | | | | $167,040 | |
Cogent Communications Holdings Inc. | | | 12,500 | | | | 748,375 | |
Total Diversified Telecommunication Services | | | | | | | 915,415 | |
Entertainment — 0.5% | | | | | | | | |
Glu Mobile Inc. | | | 93,000 | | | | 837,930 | * |
Marcus Corp. | | | 12,600 | | | | 169,848 | |
Total Entertainment | | | | | | | 1,007,778 | |
Interactive Media & Services — 0.9% | | | | | | | | |
ANGI Homeservices Inc., Class A Shares | | | 29,300 | | | | 386,614 | * |
EverQuote Inc., Class A Shares | | | 4,600 | | | | 171,810 | * |
TrueCar Inc. | | | 72,000 | | | | 302,400 | * |
Yelp Inc. | | | 26,000 | | | | 849,420 | * |
Total Interactive Media & Services | | | | | | | 1,710,244 | |
Media — 0.2% | | | | | | | | |
Media General Inc., CVR | | | 20,404 | | | | 0 | *(a)(b)(c) |
Perion Network Ltd. | | | 25,000 | | | | 318,250 | * |
Total Media | | | | | | | 318,250 | |
Wireless Telecommunication Services — 0.3% | | | | | | | | |
Telephone & Data Systems Inc. | | | 11,800 | | | | 219,126 | |
United States Cellular Corp. | | | 8,000 | | | | 245,520 | * |
Total Wireless Telecommunication Services | | | | | | | 464,646 | |
Total Communication Services | | | | | | | 4,416,333 | |
| Consumer Discretionary — 12.7% | | | | | | | | |
Auto Components — 1.3% | | | | | | | | |
Cooper Tire & Rubber Co. | | | 12,500 | | | | 506,250 | |
Dana Inc. | | | 41,000 | | | | 800,320 | |
Dorman Products Inc. | | | 4,000 | | | | 347,280 | * |
LCI Industries | | | 2,500 | | | | 324,200 | |
Standard Motor Products Inc. | | | 9,300 | | | | 376,278 | |
Total Auto Components | | | | | | | 2,354,328 | |
Automobiles — 0.3% | | | | | | | | |
Winnebago Industries Inc. | | | 9,000 | | | | 539,460 | |
Diversified Consumer Services — 0.8% | | | | | | | | |
American Public Education Inc. | | | 12,200 | | | | 371,856 | * |
Perdoceo Education Corp. | | | 28,000 | | | | 353,640 | * |
Stride Inc. | | | 18,000 | | | | 382,140 | * |
WW International Inc. | | | 13,000 | | | | 317,200 | * |
Total Diversified Consumer Services | | | | | | | 1,424,836 | |
See Notes to Financial Statements.
| | |
12 | | QS U.S. Small Capitalization Equity Fund 2020 Annual Report |
QS U.S. Small Capitalization Equity Fund
| | | | | | | | | | | | | | | | |
| Security | | | | | | | | Shares | | | Value | |
Hotels, Restaurants & Leisure — 2.5% | | | | | | | | | | | | | | | | |
BJ’s Restaurants Inc. | | | | | | | | | | | 17,648 | | | $ | 679,271 | |
Bloomin’ Brands Inc. | | | | | | | | | | | 39,000 | | | | 757,380 | |
Brinker International Inc. | | | | | | | | | | | 10,700 | | | | 605,299 | |
Cracker Barrel Old Country Store Inc. | | | | | | | | | | | 1,200 | | | | 158,304 | |
Dine Brands Global Inc. | | | | | | | | | | | 10,200 | | | | 591,600 | |
International Game Technology PLC | | | | | | | | | | | 35,000 | | | | 592,900 | |
Jack in the Box Inc. | | | | | | | | | | | 3,600 | | | | 334,080 | |
Papa John’s International Inc. | | | | | | | | | | | 4,000 | | | | 339,400 | |
Ruth’s Hospitality Group Inc. | | | | | | | | | | | 24,815 | | | | 439,970 | |
Total Hotels, Restaurants & Leisure | | | | | | | | | | | | | | | 4,498,204 | |
Household Durables — 2.3% | | | | | | | | | | | | | | | | |
Beazer Homes USA Inc. | | | | | | | | | | | 42,000 | | | | 636,300 | * |
KB Home | | | | | | | | | | | 28,000 | | | | 938,560 | |
M/I Homes Inc. | | | | | | | | | | | 10,400 | | | | 460,616 | * |
MDC Holdings Inc. | | | | | | | | | | | 17,500 | | | | 850,500 | |
Meritage Homes Corp. | | | | | | | | | | | 9,000 | | | | 745,380 | * |
TRI Pointe Group Inc. | | | | | | | | | | | 28,100 | | | | 484,725 | * |
Total Household Durables | | | | | | | | | | | | | | | 4,116,081 | |
Internet & Direct Marketing Retail — 0.7% | | | | | | | | | | | | | | | | |
At Home Group Inc. | | | | | | | | | | | 20,000 | | | | 309,200 | * |
Etsy Inc. | | | | | | | | | | | 3,500 | | | | 622,685 | * |
Overstock.com Inc. | | | | | | | | | | | 3,500 | | | | 167,895 | * |
PetMed Express Inc. | | | | | | | | | | | 4,200 | | | | 134,652 | |
Total Internet & Direct Marketing Retail | | | | | | | | | | | | | | | 1,234,432 | |
Leisure Products — 0.5% | | | | | | | | | | | | | | | | |
Nautilus Inc. | | | | | | | | | | | 13,000 | | | | 235,820 | * |
Smith & Wesson Brands Inc. | | | | | | | | | | | 19,000 | | | | 337,250 | |
Vista Outdoor Inc. | | | | | | | | | | | 18,600 | | | | 441,936 | * |
Total Leisure Products | | | | | | | | | | | | | | | 1,015,006 | |
Multiline Retail — 0.3% | | | | | | | | | | | | | | | | |
Big Lots Inc. | | | | | | | | | | | 11,700 | | | | 502,281 | |
Specialty Retail — 3.1% | | | | | | | | | | | | | | | | |
Academy Sports & Outdoors Inc. | | | | | | | | | | | 19,000 | | | | 393,870 | * |
Big 5 Sporting Goods Corp. | | | | | | | | | | | 37,300 | | | | 380,833 | |
Camping World Holdings Inc., Class A Shares | | | | | | | | | | | 12,500 | | | | 325,625 | |
Dick’s Sporting Goods Inc. | | | | | | | | | | | 6,000 | | | | 337,260 | |
Genesco Inc. | | | | | | | | | | | 10,500 | | | | 315,945 | * |
Hibbett Sports Inc. | | | | | | | | | | | 18,500 | | | | 854,330 | * |
Lithia Motors Inc., Class A Shares | | | | | | | | | | | 2,900 | | | | 848,743 | |
MarineMax Inc. | | | | | | | | | | | 14,500 | | | | 507,935 | * |
See Notes to Financial Statements.
| | |
| QS U.S. Small Capitalization Equity Fund 2020 Annual Report | | 13 |
Schedule of investments (cont’d)
December 31, 2020
QS U.S. Small Capitalization Equity Fund
| | | | | | | | | | | | | | | | |
| Security | | | | | | | | Shares | | | Value | |
Specialty Retail — continued | | | | | | | | | | | | | | | | |
Rent-A-Center Inc. | | | | | | | | | | | 19,300 | | | $ | 738,997 | |
Sportsman’s Warehouse Holdings Inc. | | | | | | | | | | | 24,000 | | | | 421,200 | * |
TravelCenters of America Inc. | | | | | | | | | | | 12,800 | | | | 417,280 | * |
Zumiez Inc. | | | | | | | | | | | 5,600 | | | | 205,968 | * |
Total Specialty Retail | | | | | | | | | | | | | | | 5,747,986 | |
Textiles, Apparel & Luxury Goods — 0.9% | | | | | | | | | | | | | | | | |
Deckers Outdoor Corp. | | | | | | | | | | | 4,000 | | | | 1,147,120 | * |
Lakeland Industries Inc. | | | | | | | | | | | 17,000 | | | | 463,250 | * |
Total Textiles, Apparel & Luxury Goods | | | | | | | | | | | | | | | 1,610,370 | |
Total Consumer Discretionary | | | | | | | | | | | | | | | 23,042,984 | |
| Consumer Staples — 3.8% | | | | | | | | | | | | | | | | |
Beverages — 0.6% | | | | | | | | | | | | | | | | |
Boston Beer Co. Inc., Class A Shares | | | | | | | | | | | 1,050 | | | | 1,044,005 | * |
Food & Staples Retailing — 1.2% | | | | | | | | | | | | | | | | |
Andersons Inc. | | | | | | | | | | | 20,500 | | | | 502,455 | |
Rite Aid Corp. | | | | | | | | | | | 24,300 | | | | 384,669 | * |
SpartanNash Co. | | | | | | | | | | | 35,915 | | | | 625,280 | |
Sprouts Farmers Market Inc. | | | | | | | | | | | 12,700 | | | | 255,270 | * |
United Natural Foods Inc. | | | | | | | | | | | 30,600 | | | | 488,682 | * |
Total Food & Staples Retailing | | | | | | | | | | | | | | | 2,256,356 | |
Food Products — 0.9% | | | | | | | | | | | | | | | | |
Darling Ingredients Inc. | | | | | | | | | | | 20,000 | | | | 1,153,600 | * |
Fresh Del Monte Produce Inc. | | | | | | | | | | | 7,600 | | | | 182,932 | |
John B Sanfilippo & Son Inc. | | | | | | | | | | | 4,400 | | | | 346,984 | |
Total Food Products | | | | | | | | | | | | | | | 1,683,516 | |
Household Products — 0.3% | | | | | | | | | | | | | | | | |
Spectrum Brands Holdings Inc. | | | | | | | | | | | 6,800 | | | | 537,064 | |
Personal Products — 0.5% | | | | | | | | | | | | | | | | |
Medifast Inc. | | | | | | | | | | | 2,500 | | | | 490,850 | |
USANA Health Sciences Inc. | | | | | | | | | | | 4,900 | | | | 377,790 | * |
Total Personal Products | | | | | | | | | | | | | | | 868,640 | |
Tobacco — 0.3% | | | | | | | | | | | | | | | | |
Vector Group Ltd. | | | | | | | | | | | 44,000 | | | | 512,600 | |
Total Consumer Staples | | | | | | | | | | | | | | | 6,902,181 | |
| Energy — 1.3% | | | | | | | | | | | | | | | | |
Oil, Gas & Consumable Fuels — 1.3% | | | | | | | | | | | | | | | | |
Arch Resources Inc. | | | | | | | | | | | 8,100 | | | | 354,537 | |
DHT Holdings Inc. | | | | | | | | | | | 75,900 | | | | 396,957 | |
International Seaways Inc. | | | | | | | | | | | 10,000 | | | | 163,300 | |
See Notes to Financial Statements.
| | |
14 | | QS U.S. Small Capitalization Equity Fund 2020 Annual Report |
QS U.S. Small Capitalization Equity Fund
| | | | | | | | | | | | | | | | |
| Security | | | | | | | | Shares | | | Value | |
Oil, Gas & Consumable Fuels — continued | | | | | | | | | | | | | | | | |
Nordic American Tankers Ltd. | | | | | | | | | | | 185,900 | | | $ | 548,405 | |
World Fuel Services Corp. | | | | | | | | | | | 28,000 | | | | 872,480 | |
Total Energy | | | | | | | | | | | | | | | 2,335,679 | |
| Financials — 15.2% | | | | | | | | | | | | | | | | |
Banks — 6.5% | | | | | | | | | | | | | | | | |
Bancorp Inc. | | | | | | | | | | | 40,000 | | | | 546,000 | * |
Bank of N.T. Butterfield & Son Ltd. | | | | | | | | | | | 19,000 | | | | 592,040 | |
Berkshire Hills Bancorp Inc. | | | | | | | | | | | 28,001 | | | | 479,377 | |
Boston Private Financial Holdings Inc. | | | | | | | | | | | 53,300 | | | | 450,385 | |
Cadence BanCorp | | | | | | | | | | | 42,000 | | | | 689,640 | |
Central Pacific Financial Corp. | | | | | | | | | | | 17,200 | | | | 326,972 | |
Community Trust Bancorp Inc. | | | | | | | | | | | 3,600 | | | | 133,380 | |
Equity Bancshares Inc., Class A Shares | | | | | | | | | | | 5,500 | | | | 118,745 | * |
First BanCorp | | | | | | | | | | | 99,920 | | | | 921,262 | |
First Busey Corp. | | | | | | | | | | | 12,000 | | | | 258,600 | |
First Commonwealth Financial Corp. | | | | | | | | | | | 32,646 | | | | 357,147 | |
First Financial Corp. | | | | | | | | | | | 9,900 | | | | 384,615 | |
First Horizon Corp. | | | | | | | | | | | 80,187 | | | | 1,023,186 | |
First Midwest Bancorp Inc. | | | | | | | | | | | 35,692 | | | | 568,217 | |
Flushing Financial Corp. | | | | | | | | | | | 20,400 | | | | 339,456 | |
Great Western Bancorp Inc. | | | | | | | | | | | 19,000 | | | | 397,100 | |
Hancock Whitney Corp. | | | | | | | | | | | 11,253 | | | | 382,827 | |
Hanmi Financial Corp. | | | | | | | | | | | 36,708 | | | | 416,269 | |
Heartland Financial USA Inc. | | | | | | | | | | | 11,300 | | | | 456,181 | |
Hope Bancorp Inc. | | | | | | | | | | | 48,300 | | | | 526,953 | |
Investors Bancorp Inc. | | | | | | | | | | | 27,500 | | | | 290,400 | |
Midland States Bancorp Inc. | | | | | | | | | | | 21,286 | | | | 380,381 | |
OFG Bancorp | | | | | | | | | | | 27,642 | | | | 512,483 | |
Peoples Bancorp Inc. | | | | | | | | | | | 10,600 | | | | 287,154 | |
Umpqua Holdings Corp. | | | | | | | | | | | 24,000 | | | | 363,360 | |
United Community Banks Inc. | | | | | | | | | | | 18,000 | | | | 511,920 | |
Total Banks | | | | | | | | | | | | | | | 11,714,050 | |
Capital Markets — 2.7% | | | | | | | | | | | | | | | | |
Affiliated Managers Group Inc. | | | | | | | | | | | 8,800 | | | | 894,960 | |
Artisan Partners Asset Management Inc., Class A Shares | | | | | | | | | | | 17,300 | | | | 870,882 | |
BGC Partners Inc., Class A Shares | | | | | | | | | | | 130,900 | | | | 523,600 | |
Brightsphere Investment Group Inc. | | | | | | | | | | | 52,000 | | | | 1,002,560 | |
Evercore Inc., Class A Shares | | | | | | | | | | | 9,500 | | | | 1,041,580 | |
Federated Hermes Inc., Class B Shares | | | | | | | | | | | 21,000 | | | | 606,690 | |
Total Capital Markets | | | | | | | | | | | | | | | 4,940,272 | |
See Notes to Financial Statements.
| | |
| QS U.S. Small Capitalization Equity Fund 2020 Annual Report | | 15 |
Schedule of investments (cont’d)
December 31, 2020
QS U.S. Small Capitalization Equity Fund
| | | | | | | | | | | | | | | | |
| Security | | | | | | | | Shares | | | Value | |
Consumer Finance — 1.1% | | | | | | | | | | | | | | | | |
Encore Capital Group Inc. | | | | | | | | | | | 13,900 | | | $ | 541,405 | * |
Enova International Inc. | | | | | | | | | | | 45,000 | | | | 1,114,650 | * |
EZCORP Inc., Class A Shares | | | | | | | | | | | 58,000 | | | | 277,820 | * |
Navient Corp. | | | | | | | | | | | 14,500 | | | | 142,390 | |
Total Consumer Finance | | | | | | | | | | | | | | | 2,076,265 | |
Insurance — 1.7% | | | | | | | | | | | | | | | | |
Assured Guaranty Ltd. | | | | | | | | | | | 12,900 | | | | 406,221 | |
eHealth Inc. | | | | | | | | | | | 6,300 | | | | 444,843 | * |
Employers Holdings Inc. | | | | | | | | | | | 14,000 | | | | 450,660 | |
Primerica Inc. | | | | | | | | | | | 4,071 | | | | 545,229 | |
Safety Insurance Group Inc. | | | | | | | | | | | 7,800 | | | | 607,620 | |
Stewart Information Services Corp. | | | | | | | | | | | 8,000 | | | | 386,880 | |
White Mountains Insurance Group Ltd. | | | | | | | | | | | 200 | | | | 200,132 | |
Total Insurance | | | | | | | | | | | | | | | 3,041,585 | |
Thrifts & Mortgage Finance — 3.2% | | | | | | | | | | | | | | | | |
Dime Community Bancshares Inc. | | | | | | | | | | | 7,617 | | | | 120,120 | |
Essent Group Ltd. | | | | | | | | | | | 14,000 | | | | 604,800 | |
Flagstar Bancorp Inc. | | | | | | | | | | | 15,000 | | | | 611,400 | |
Meridian Bancorp Inc. | | | | | | | | | | | 14,000 | | | | 208,740 | |
Meta Financial Group Inc. | | | | | | | | | | | 18,900 | | | | 690,984 | |
MGIC Investment Corp. | | | | | | | | | | | 67,000 | | | | 840,850 | |
Mr. Cooper Group Inc. | | | | | | | | | | | 41,000 | | | | 1,272,230 | * |
NMI Holdings Inc., Class A Shares | | | | | | | | | | | 20,000 | | | | 453,000 | * |
Radian Group Inc. | | | | | | | | | | | 52,518 | | | | 1,063,489 | |
Total Thrifts & Mortgage Finance | | | | | | | | | | | | | | | 5,865,613 | |
Total Financials | | | | | | | | | | | | | | | 27,637,785 | |
| Health Care — 20.5% | | | | | | | | | | | | | | | | |
Biotechnology — 9.8% | | | | | | | | | | | | | | | | |
Abeona Therapeutics Inc. | | | | | | | | | | | 210,000 | | | | 329,700 | * |
ACADIA Pharmaceuticals Inc. | | | | | | | | | | | 11,500 | | | | 614,790 | * |
Acceleron Pharma Inc. | | | | | | | | | | | 3,800 | | | | 486,172 | * |
Achillion Pharmaceuticals Inc., CVR | | | | | | | | | | | 89,796 | | | | 0 | *(a)(b)(c) |
Acorda Therapeutics Inc. | | | | | | | | | | | 21,148 | | | | 14,594 | * |
Amicus Therapeutics Inc. | | | | | | | | | | | 23,000 | | | | 531,070 | * |
AnaptysBio Inc. | | | | | | | | | | | 14,400 | | | | 309,600 | * |
Arcus Biosciences Inc. | | | | | | | | | | | 5,000 | | | | 129,800 | * |
Arena Pharmaceuticals Inc. | | | | | | | | | | | 11,671 | | | | 896,683 | * |
Arrowhead Pharmaceuticals Inc. | | | | | | | | | | | 7,000 | | | | 537,110 | * |
Avid Bioservices Inc. | | | | | | | | | | | 12,641 | | | | 145,877 | * |
Bioxcel Therapeutics Inc. | | | | | | | | | | | 3,200 | | | | 147,840 | * |
See Notes to Financial Statements.
| | |
16 | | QS U.S. Small Capitalization Equity Fund 2020 Annual Report |
QS U.S. Small Capitalization Equity Fund
| | | | | | | | | | | | | | | | |
| Security | | | | | | | | Shares | | | Value | |
Biotechnology — continued | | | | | | | | | | | | | | | | |
Bluebird Bio Inc. | | | | | | | | | | | 2,400 | | | $ | 103,848 | * |
Blueprint Medicines Corp. | | | | | | | | | | | 7,000 | | | | 785,050 | * |
CareDx Inc. | | | | | | | | | | | 12,000 | | | | 869,400 | * |
Catalyst Pharmaceuticals Inc. | | | | | | | | | | | 85,800 | | | | 286,572 | * |
Celldex Therapeutics Inc. | | | | | | | | | | | 5,172 | | | | 90,613 | * |
Chimerix Inc. | | | | | | | | | | | 40,401 | | | | 195,137 | * |
Cyclerion Therapeutics Inc. | | | | | | | | | | | 100,000 | | | | 306,000 | * |
Deciphera Pharmaceuticals Inc. | | | | | | | | | | | 3,500 | | | | 199,745 | * |
Eagle Pharmaceuticals Inc. | | | | | | | | | | | 8,195 | | | | 381,641 | * |
Emergent BioSolutions Inc. | | | | | | | | | | | 6,058 | | | | 542,797 | * |
Enanta Pharmaceuticals Inc. | | | | | | | | | | | 8,400 | | | | 353,640 | * |
FibroGen Inc. | | | | | | | | | | | 6,900 | | | | 255,921 | * |
Five Prime Therapeutics Inc. | | | | | | | | | | | 63,800 | | | | 1,085,238 | * |
G1 Therapeutics Inc. | | | | | | | | | | | 16,000 | | | | 287,840 | * |
Geron Corp. | | | | | | | | | | | 90,000 | | | | 143,100 | * |
Halozyme Therapeutics Inc. | | | | | | | | | | | 16,732 | | | | 714,624 | * |
Ideaya Biosciences Inc. | | | | | | | | | | | 5,803 | | | | 81,242 | * |
Infinity Pharmaceuticals Inc. | | | | | | | | | | | 30,551 | | | | 64,768 | * |
Intercept Pharmaceuticals Inc. | | | | | | | | | | | 2,400 | | | | 59,280 | * |
Jounce Therapeutics Inc. | | | | | | | | | | | 18,000 | | | | 126,000 | * |
Ligand Pharmaceuticals Inc. | | | | | | | | | | | 2,500 | | | | 248,625 | * |
MacroGenics Inc. | | | | | | | | | | | 7,000 | | | | 160,020 | * |
Mirati Therapeutics Inc. | | | | | | | | | | | 2,500 | | | | 549,100 | * |
NantKwest Inc. | | | | | | | | | | | 19,500 | | | | 259,935 | * |
Novavax Inc. | | | | | | | | | | | 4,300 | | | | 479,493 | * |
PDL BioPharma Inc. | | | | | | | | | | | 152,500 | | | | 376,675 | *(a) |
Qualigen Therapeutics Inc. | | | | | | | | | | | 80,000 | | | | 240,800 | * |
RAPT Therapeutics Inc. | | | | | | | | | | | 16,000 | | | | 316,000 | * |
REGENXBIO Inc. | | | | | | | | | | | 8,200 | | | | 371,952 | * |
Sage Therapeutics Inc. | | | | | | | | | | | 3,900 | | | | 337,389 | * |
Sangamo Therapeutics Inc. | | | | | | | | | | | 36,000 | | | | 561,780 | * |
Sorrento Therapeutics Inc. | | | | | | | | | | | 20,000 | | | | 136,500 | * |
Spectrum Pharmaceuticals Inc. | | | | | | | | | | | 18,000 | | | | 61,380 | * |
Syros Pharmaceuticals Inc. | | | | | | | | | | | 24,000 | | | | 260,400 | * |
T2 Biosystems Inc. | | | | | | | | | | | 109,000 | | | | 135,160 | * |
Trevena Inc. | | | | | | | | | | | 31,141 | | | | 66,642 | * |
Turning Point Therapeutics Inc. | | | | | | | | | | | 2,500 | | | | 304,625 | * |
Ultragenyx Pharmaceutical Inc. | | | | | | | | | | | 3,000 | | | | 415,290 | * |
Vanda Pharmaceuticals Inc. | | | | | | | | | | | 28,000 | | | | 367,920 | * |
VAXART Inc. | | | | | | | | | | | 70,000 | | | | 399,700 | * |
See Notes to Financial Statements.
| | |
| QS U.S. Small Capitalization Equity Fund 2020 Annual Report | | 17 |
Schedule of investments (cont’d)
December 31, 2020
QS U.S. Small Capitalization Equity Fund
| | | | | | | | | | | | | | | | |
| Security | | | | | | | | Shares | | | Value | |
Biotechnology — continued | | | | | | | | | | | | | | | | |
Vaxcyte Inc. | | | | | | | | | | | 7,100 | | | $ | 188,647 | * |
Vir Biotechnology Inc. | | | | | | | | | | | 300 | | | | 8,034 | * |
XBiotech Inc. | | | | | | | | | | | 10,500 | | | | 164,325 | * |
Xencor Inc. | | | | | | | | | | | 6,600 | | | | 287,958 | * |
Total Biotechnology | | | | | | | | | | | | | | | 17,774,042 | |
Health Care Equipment & Supplies — 5.6% | | | | | | | | | | | | | | | | |
Antares Pharma Inc. | | | | | | | | | | | 117,500 | | | | 468,825 | * |
Apyx Medical Corp. | | | | | | | | | | | 53,600 | | | | 385,920 | * |
Electromed Inc. | | | | | | | | | | | 30,600 | | | | 300,186 | * |
GenMark Diagnostics Inc. | | | | | | | | | | | 44,000 | | | | 642,400 | * |
Globus Medical Inc., Class A Shares | | | | | | | | | | | 8,200 | | | | 534,804 | * |
Haemonetics Corp. | | | | | | | | | | | 7,500 | | | | 890,625 | * |
iRhythm Technologies Inc. | | | | | | | | | | | 2,800 | | | | 664,188 | * |
Masimo Corp. | | | | | | | | | | | 2,850 | | | | 764,883 | * |
Meridian Bioscience Inc. | | | | | | | | | | | 16,374 | | | | 306,030 | * |
Natus Medical Inc. | | | | | | | | | | | 16,774 | | | | 336,151 | * |
Neogen Corp. | | | | | | | | | | | 5,100 | | | | 404,430 | * |
Nevro Corp. | | | | | | | | | | | 4,800 | | | | 830,880 | * |
Novocure Ltd. | | | | | | | | | | | 6,000 | | | | 1,038,240 | * |
Orthofix Medical Inc. | | | | | | | | | | | 5,600 | | | | 240,688 | * |
Quidel Corp. | | | | | | | | | | | 2,650 | | | | 476,072 | * |
Repro-Med Systems Inc. | | | | | | | | | | | 42,300 | | | | 254,646 | * |
STAAR Surgical Co. | | | | | | | | | | | 12,000 | | | | 950,640 | * |
Surmodics Inc. | | | | | | | | | | | 6,300 | | | | 274,176 | * |
Tactile Systems Technology Inc. | | | | | | | | | | | 4,000 | | | | 179,760 | * |
Zynex Inc. | | | | | | | | | | | 24,000 | | | | 323,040 | * |
Total Health Care Equipment & Supplies | | | | | | | | | | | | | | | 10,266,584 | |
Health Care Providers & Services — 2.5% | | | | | | | | | | | | | | | | |
Amedisys Inc. | | | | | | | | | | | 1,750 | | | | 513,328 | * |
Ensign Group Inc. | | | | | | | | | | | 14,209 | | | | 1,036,120 | |
Fulgent Genetics Inc. | | | | | | | | | | | 12,801 | | | | 666,932 | * |
Joint Corp. | | | | | | | | | | | 23,800 | | | | 624,988 | * |
LHC Group Inc. | | | | | | | | | | | 900 | | | | 191,988 | * |
Pennant Group Inc. | | | | | | | | | | | 7,104 | | | | 412,458 | * |
Providence Service Corp. | | | | | | | | | | | 4,600 | | | | 637,698 | * |
Triple-S Management Corp., Class B Shares | | | | | | | | | | | 20,076 | | | | 428,623 | * |
Total Health Care Providers & Services | | | | | | | | | | | | | | | 4,512,135 | |
Life Sciences Tools & Services — 1.3% | | | | | | | | | | | | | | | | |
Fluidigm Corp. | | | | | | | | | | | 62,500 | | | | 375,000 | * |
Luminex Corp. | | | | | | | | | | | 8,014 | | | | 185,284 | |
See Notes to Financial Statements.
| | |
18 | | QS U.S. Small Capitalization Equity Fund 2020 Annual Report |
QS U.S. Small Capitalization Equity Fund
| | | | | | | | | | | | | | | | |
| Security | | | | | | | | Shares | | | Value | |
Life Sciences Tools & Services — continued | | | | | | | | | | | | | | | | |
Medpace Holdings Inc. | | | | | | | | | | | 4,000 | | | $ | 556,800 | * |
Pacific Biosciences of California Inc. | | | | | | | | | | | 24,000 | | | | 622,560 | * |
Repligen Corp. | | | | | | | | | | | 2,200 | | | | 421,586 | * |
Syneos Health Inc. | | | | | | | | | | | 3,700 | | | | 252,081 | * |
Total Life Sciences Tools & Services | | | | | | | | | | | | | | | 2,413,311 | |
Pharmaceuticals — 1.3% | | | | | | | | | | | | | | | | |
Amphastar Pharmaceuticals Inc. | | | | | | | | | | | 13,000 | | | | 261,430 | * |
Cymabay Therapeutics Inc. | | | | | | | | | | | 53,800 | | | | 308,812 | * |
Endo International PLC | | | | | | | | | | | 33,000 | | | | 236,940 | * |
Harrow Health Inc. | | | | | | | | | | | 15,000 | | | | 102,900 | * |
Innoviva Inc. | | | | | | | | | | | 24,500 | | | | 303,555 | * |
Intersect ENT Inc. | | | | | | | | | | | 11,000 | | | | 251,900 | * |
Pacira BioSciences Inc. | | | | | | | | | | | 10,000 | | | | 598,400 | * |
Phibro Animal Health Corp., Class A Shares | | | | | | | | | | | 13,000 | | | | 252,460 | |
Recro Pharma Inc. | | | | | | | | | | | 11,000 | | | | 31,350 | * |
Total Pharmaceuticals | | | | | | | | | | | | | | | 2,347,747 | |
Total Health Care | | | | | | | | | | | | | | | 37,313,819 | |
| Industrials — 14.5% | | | | | | | | | | | | | | | | |
Aerospace & Defense — 0.3% | | | | | | | | | | | | | | | | |
Astronics Corp. | | | | | | | | | | | 41,548 | | | | 549,680 | * |
Airlines — 0.3% | | | | | | | | | | | | | | | | |
Hawaiian Holdings Inc. | | | | | | | | | | | 19,960 | | | | 353,292 | |
SkyWest Inc. | | | | | | | | | | | 3,200 | | | | 128,992 | |
Total Airlines | | | | | | | | | | | | | | | 482,284 | |
Building Products — 1.5% | | | | | | | | | | | | | | | | |
Apogee Enterprises Inc. | | | | | | | | | | | 17,500 | | | | 554,400 | |
Caesarstone Ltd. | | | | | | | | | | | 19,200 | | | | 247,488 | |
Insteel Industries Inc. | | | | | | | | | | | 14,900 | | | | 331,823 | |
Masonite International Corp. | | | | | | | | | | | 8,700 | | | | 855,558 | * |
Patrick Industries Inc. | | | | | | | | | | | 10,000 | | | | 683,500 | |
Total Building Products | | | | | | | | | | | | | | | 2,672,769 | |
Commercial Services & Supplies — 1.2% | | | | | | | | | | | | | | | | |
Cimpress PLC | | | | | | | | | | | 2,300 | | | | 201,802 | * |
HNI Corp. | | | | | | | | | | | 26,000 | | | | 895,960 | |
Interface Inc. | | | | | | | | | | | 12,500 | | | | 131,250 | |
McGrath RentCorp. | | | | | | | | | | | 6,700 | | | | 449,570 | |
Steelcase Inc., Class A Shares | | | | | | | | | | | 33,000 | | | | 447,150 | |
Total Commercial Services & Supplies | | | | | | | | | | | | | | | 2,125,732 | |
Construction & Engineering — 2.7% | | | | | | | | | | | | | | | | |
Aegion Corp. | | | | | | | | | | | 9,000 | | | | 170,910 | * |
See Notes to Financial Statements.
| | |
| QS U.S. Small Capitalization Equity Fund 2020 Annual Report | | 19 |
Schedule of investments (cont’d)
December 31, 2020
QS U.S. Small Capitalization Equity Fund
| | | | | | | | | | | | | | | | |
| Security | | | | | | | | Shares | | | Value | |
Construction & Engineering — continued | | | | | | | | | | | | | | | | |
Argan Inc. | | | | | | | | | | | 12,693 | | | $ | 564,712 | |
Dycom Industries Inc. | | | | | | | | | | | 15,500 | | | | 1,170,560 | * |
Great Lakes Dredge & Dock Corp. | | | | | | | | | | | 45,000 | | | | 592,650 | * |
MYR Group Inc. | | | | | | | | | | | 9,439 | | | | 567,284 | * |
Orion Group Holdings Inc. | | | | | | | | | | | 150,000 | | | | 744,000 | * |
Primoris Services Corp. | | | | | | | | | | | 28,351 | | | | 782,771 | |
Tutor Perini Corp. | | | | | | | | | | | 24,000 | | | | 310,800 | * |
Total Construction & Engineering | | | | | | | | | | | | | | | 4,903,687 | |
Machinery — 3.0% | | | | | | | | | | | | | | | | |
Briggs & Stratton Corp. | | | | | | | | | | | 158,200 | | | | 11,556 | |
Greenbrier Cos. Inc. | | | | | | | | | | | 16,700 | | | | 607,546 | |
Hyster-Yale Materials Handling Inc. | | | | | | | | | | | 9,500 | | | | 565,725 | |
Manitowoc Co. Inc. | | | | | | | | | | | 35,000 | | | | 465,850 | * |
Meritor Inc. | | | | | | | | | | | 25,000 | | | | 697,750 | * |
Navistar International Corp. | | | | | | | | | | | 13,600 | | | | 597,856 | * |
REV Group Inc. | | | | | | | | | | | 68,500 | | | | 603,485 | |
Terex Corp. | | | | | | | | | | | 18,000 | | | | 628,020 | |
Titan International Inc. | | | | | | | | | | | 160,000 | | | | 777,600 | |
Wabash National Corp. | | | | | | | | | | | 33,000 | | | | 568,590 | |
Total Machinery | | | | | | | | | | | | | | | 5,523,978 | |
Professional Services — 1.9% | | | | | | | | | | | | | | | | |
Barrett Business Services Inc. | | | | | | | | | | | 2,400 | | | | 163,704 | |
CRA International Inc. | | | | | | | | | | | 7,000 | | | | 356,510 | |
Exponent Inc. | | | | | | | | | | | 5,500 | | | | 495,165 | |
FTI Consulting Inc. | | | | | | | | | | | 6,700 | | | | 748,524 | * |
Insperity Inc. | | | | | | | | | | | 10,800 | | | | 879,336 | |
Kforce Inc. | | | | | | | | | | | 11,100 | | | | 467,199 | |
TrueBlue Inc. | | | | | | | | | | | 19,949 | | | | 372,847 | * |
Total Professional Services | | | | | | | | | | | | | | | 3,483,285 | |
Road & Rail — 0.5% | | | | | | | | | | | | | | | | |
Werner Enterprises Inc. | | | | | | | | | | | 24,000 | | | | 941,280 | |
Trading Companies & Distributors — 2.9% | | | | | | | | | | | | | | | | |
BlueLinx Holdings Inc. | | | | | | | | | | | 13,500 | | | | 395,010 | * |
H&E Equipment Services Inc. | | | | | | | | | | | 11,500 | | | | 342,815 | |
Herc Holdings Inc. | | | | | | | | | | | 18,000 | | | | 1,195,380 | * |
MRC Global Inc. | | | | | | | | | | | 34,600 | | | | 229,398 | * |
NOW Inc. | | | | | | | | | | | 71,200 | | | | 511,216 | * |
Rush Enterprises Inc., Class A Shares | | | | | | | | | | | 13,000 | | | | 538,460 | |
Textainer Group Holdings Ltd. | | | | | | | | | | | 35,000 | | | | 671,300 | * |
See Notes to Financial Statements.
| | |
20 | | QS U.S. Small Capitalization Equity Fund 2020 Annual Report |
QS U.S. Small Capitalization Equity Fund
| | | | | | | | | | | | | | | | |
| Security | | | | | | | | Shares | | | Value | |
Trading Companies & Distributors — continued | | | | | | | | | | | | | | | | |
Triton International Ltd. | | | | | | | | | | | 14,000 | | | $ | 679,140 | |
Veritiv Corp. | | | | | | | | | | | 34,000 | | | | 706,860 | * |
Total Trading Companies & Distributors | | | | | | | | | | | | | | | 5,269,579 | |
Transportation Infrastructure — 0.2% | | | | | | | | | | | | | | | | |
Teekay LNG Partners LP | | | | | | | | | | | 29,900 | | | | 342,654 | |
Total Industrials | | | | | | | | | | | | | | | 26,294,928 | |
| Information Technology — 15.0% | | | | | | | | | | | | | | | | |
Communications Equipment — 1.0% | | | | | | | | | | | | | | | | |
ADTRAN Inc. | | | | | | | | | | | 29,000 | | | | 428,330 | |
Applied Optoelectronics Inc. | | | | | | | | | | | 31,700 | | | | 269,767 | * |
EchoStar Corp., Class A Shares | | | | | | | | | | | 12,000 | | | | 254,280 | * |
NETGEAR Inc. | | | | | | | | | | | 13,038 | | | | 529,734 | * |
NetScout Systems Inc. | | | | | | | | | | | 14,500 | | | | 397,590 | * |
Total Communications Equipment | | | | | | | | | | | | | | | 1,879,701 | |
Electronic Equipment, Instruments & Components — 3.0% | | | | | | | | | | | | | | | | |
Arlo Technologies Inc. | | | | | | | | | | | 67,300 | | | | 524,267 | * |
Avnet Inc. | | | | | | | | | | | 12,500 | | | | 438,875 | |
Benchmark Electronics Inc. | | | | | | | | | | | 36,000 | | | | 972,360 | |
Fabrinet | | | | | | | | | | | 11,000 | | | | 853,490 | * |
Plexus Corp. | | | | | | | | | | | 7,252 | | | | 567,179 | * |
Sanmina Corp. | | | | | | | | | | | 26,500 | | | | 845,085 | * |
ScanSource Inc. | | | | | | | | | | | 7,438 | | | | 196,214 | * |
TTM Technologies Inc. | | | | | | | | | | | 32,000 | | | | 441,440 | * |
Vishay Intertechnology Inc. | | | | | | | | | | | 28,000 | | | | 579,880 | |
Total Electronic Equipment, Instruments & Components | | | | | | | | | | | | | | | 5,418,790 | |
IT Services — 1.7% | | | | | | | | | | | | | | | | |
Alliance Data Systems Corp. | | | | | | | | | | | 5,500 | | | | 407,550 | |
ExlService Holdings Inc. | | | | | | | | | | | 7,500 | | | | 638,475 | * |
LiveRamp Holdings Inc. | | | | | | | | | | | 9,000 | | | | 658,710 | * |
MAXIMUS Inc. | | | | | | | | | | | 6,803 | | | | 497,912 | |
NIC Inc. | | | | | | | | | | | 35,577 | | | | 918,954 | |
Total IT Services | | | | | | | | | | | | | | | 3,121,601 | |
Semiconductors & Semiconductor Equipment — 2.2% | | | | | | | | | | | | | | | | |
Amkor Technology Inc. | | | | | | | | | | | 57,937 | | | | 873,690 | |
Axcelis Technologies Inc. | | | | | | | | | | | 16,600 | | | | 483,392 | * |
Cirrus Logic Inc. | | | | | | | | | | | 8,000 | | | | 657,600 | * |
Ichor Holdings Ltd. | | | | | | | | | | | 5,000 | | | | 150,725 | * |
Lattice Semiconductor Corp. | | | | | | | | | | | 4,200 | | | | 192,444 | * |
MagnaChip Semiconductor Corp. | | | | | | | | | | | 29,000 | | | | 392,080 | * |
NeoPhotonics Corp. | | | | | | | | | | | 50,000 | | | | 454,500 | * |
See Notes to Financial Statements.
| | |
| QS U.S. Small Capitalization Equity Fund 2020 Annual Report | | 21 |
Schedule of investments (cont’d)
December 31, 2020
QS U.S. Small Capitalization Equity Fund
| | | | | | | | | | | | | | | | |
| Security | | | | | | | | Shares | | | Value | |
Semiconductors & Semiconductor Equipment — continued | | | | | | | | | | | | | | | | |
Photronics Inc. | | | | | | | | | | | 40,000 | | | $ | 446,400 | * |
SunPower Corp. | | | | | | | | | | | 15,000 | | | | 384,600 | * |
Total Semiconductors & Semiconductor Equipment | | | | | | | | | | | | | | | 4,035,431 | |
Software — 6.5% | | | | | | | | | | | | | | | | |
A10 Networks Inc. | | | | | | | | | | | 51,400 | | | | 506,804 | * |
Alarm.com Holdings Inc. | | | | | | | | | | | 7,500 | | | | 775,875 | * |
Box Inc., Class A Shares | | | | | | | | | | | 55,543 | | | | 1,002,551 | * |
CommVault Systems Inc. | | | | | | | | | | | 12,633 | | | | 699,489 | * |
eGain Corp. | | | | | | | | | | | 30,900 | | | | 364,929 | * |
Five9 Inc. | | | | | | | | | | | 6,000 | | | | 1,046,400 | * |
HubSpot Inc. | | | | | | | | | | | 2,500 | | | | 991,100 | * |
Manhattan Associates Inc. | | | | | | | | | | | 10,792 | | | | 1,135,103 | * |
Paylocity Holding Corp. | | | | | | | | | | | 4,300 | | | | 885,413 | * |
Qualys Inc. | | | | | | | | | | | 7,600 | | | | 926,212 | * |
SailPoint Technologies Holding Inc. | | | | | | | | | | | 15,500 | | | | 825,220 | * |
SPS Commerce Inc. | | | | | | | | | | | 13,000 | | | | 1,411,670 | * |
Workiva Inc. | | | | | | | | | | | 13,000 | | | | 1,191,060 | * |
Total Software | | | | | | | | | | | | | | | 11,761,826 | |
Technology Hardware, Storage & Peripherals — 0.6% | | | | | | | | | | | | | | | | |
3D Systems Corp. | | | | | | | | | | | 60,000 | | | | 628,800 | * |
Diebold Nixdorf Inc. | | | | | | | | | | | 39,000 | | | | 415,740 | * |
Total Technology Hardware, Storage & Peripherals | | | | | | | | | | | | | | | 1,044,540 | |
Total Information Technology | | | | | | | | | | | | | | | 27,261,889 | |
| Materials — 4.3% | | | | | | | | | | | | | | | | |
Chemicals — 0.9% | | | | | | | | | | | | | | | | |
Rayonier Advanced Materials Inc. | | | | | | | | | | | 86,598 | | | | 564,619 | * |
Trinseo SA | | | | | | | | | | | 22,000 | | | | 1,126,620 | |
Total Chemicals | | | | | | | | | | | | | | | 1,691,239 | |
Metals & Mining — 1.7% | | | | | | | | | | | | | | | | |
Alcoa Corp. | | | | | | | | | | | 36,000 | | | | 829,800 | * |
Coeur Mining Inc. | | | | | | | | | | | 56,741 | | | | 587,269 | * |
Haynes International Inc. | | | | | | | | | | | 14,200 | | | | 338,528 | |
Schnitzer Steel Industries Inc., Class A Shares | | | | | | | | | | | 7,500 | | | | 239,325 | |
SunCoke Energy Inc. | | | | | | | | | | | 92,800 | | | | 403,680 | |
Warrior Met Coal Inc. | | | | | | | | | | | 27,500 | | | | 586,300 | |
Total Metals & Mining | | | | | | | | | | | | | | | 2,984,902 | |
Paper & Forest Products — 1.7% | | | | | | | | | | | | | | | | |
Boise Cascade Co. | | | | | | | | | | | 15,000 | | | | 717,000 | |
Domtar Corp. | | | | | | | | | | | 12,000 | | | | 379,800 | |
Louisiana-Pacific Corp. | | | | | | | | | | | 28,000 | | | | 1,040,760 | |
See Notes to Financial Statements.
| | |
22 | | QS U.S. Small Capitalization Equity Fund 2020 Annual Report |
QS U.S. Small Capitalization Equity Fund
| | | | | | | | | | | | | | | | |
| Security | | | | | | | | Shares | | | Value | |
Paper & Forest Products — continued | | | | | | | | | | | | | | | | |
Resolute Forest Products Inc. | | | | | | | | | | | 63,900 | | | | $417,906 | * |
Verso Corp., Class A Shares | | | | | | | | | | | 43,000 | | | | 516,860 | |
Total Paper & Forest Products | | | | | | | | | | | | | | | 3,072,326 | |
Total Materials | | | | | | | | | | | | | | | 7,748,467 | |
| Real Estate — 6.7% | | | | | | | | | | | | | | | | |
Equity Real Estate Investment Trusts (REITs) — 5.2% | | | | | | | | | | | | | | | | |
Alexander’s Inc. | | | | | | | | | | | 1,050 | | | | 291,217 | |
CareTrust REIT Inc. | | | | | | | | | | | 26,000 | | | | 576,680 | |
CoreCivic Inc. | | | | | | | | | | | 51,600 | | | | 337,980 | |
DiamondRock Hospitality Co. | | | | | | | | | | | 98,311 | | | | 811,066 | |
Empire State Realty Trust Inc., Class A Shares | | | | | | | | | | | 49,700 | | | | 463,204 | |
Essential Properties Realty Trust Inc. | | | | | | | | | | | 24,000 | | | | 508,800 | |
GEO Group Inc. | | | | | | | | | | | 35,000 | | | | 310,100 | |
Global Medical REIT Inc. | | | | | | | | | | | 32,700 | | | | 427,062 | |
Hersha Hospitality Trust | | | | | | | | | | | 40,000 | | | | 315,600 | |
Industrial Logistics Properties Trust | | | | | | | | | | | 26,000 | | | | 605,540 | |
Outfront Media Inc. | | | | | | | | | | | 21,900 | | | | 428,364 | |
Pebblebrook Hotel Trust | | | | | | | | | | | 26,000 | | | | 488,800 | |
Piedmont Office Realty Trust Inc., Class A Shares | | | | | | | | | | | 35,500 | | | | 576,165 | |
RLJ Lodging Trust | | | | | | | | | | | 42,097 | | | | 595,673 | |
RPT Realty | | | | | | | | | | | 31,461 | | | | 272,138 | |
Sabra Health Care REIT Inc. | | | | | | | | | | | 25,000 | | | | 434,250 | |
Summit Hotel Properties Inc. | | | | | | | | | | | 49,418 | | | | 445,256 | |
Sunstone Hotel Investors Inc. | | | | | | | | | | | 79,219 | | | | 897,551 | |
Tanger Factory Outlet Centers Inc. | | | | | | | | | | | 32,500 | | | | 323,700 | |
Urban Edge Properties | | | | | | | | | | | 28,900 | | | | 373,966 | |
Total Equity Real Estate Investment Trusts (REITs) | | | | | | | | | | | | | | | 9,483,112 | |
Real Estate Management & Development — 1.5% | | | | | | | | | | | | | | | | |
Cushman & Wakefield PLC | | | | | | | | | | | 13,000 | | | | 192,790 | * |
Forestar Group Inc. | | | | | | | | | | | 19,000 | | | | 383,420 | * |
Jones Lang LaSalle Inc. | | | | | | | | | | | 2,919 | | | | 433,092 | |
Marcus & Millichap Inc. | | | | | | | | | | | 14,039 | | | | 522,672 | * |
Newmark Group Inc., Class A Shares | | | | | | | | | | | 41,500 | | | | 302,535 | |
RE/MAX Holdings Inc., Class A Shares | | | | | | | | | | | 5,050 | | | | 183,466 | |
Realogy Holdings Corp. | | | | | | | | | | | 52,000 | | | | 682,240 | * |
Total Real Estate Management & Development | | | | | | | | | | | | | | | 2,700,215 | |
Total Real Estate | | | | | | | | | | | | | | | 12,183,327 | |
| Utilities — 2.8% | | | | | | | | | | | | | | | | |
Electric Utilities — 1.6% | | | | | | | | | | | | | | | | |
ALLETE Inc. | | | | | | | | | | | 9,100 | | | | 563,654 | |
See Notes to Financial Statements.
| | |
| QS U.S. Small Capitalization Equity Fund 2020 Annual Report | | 23 |
Schedule of investments (cont’d)
December 31, 2020
QS U.S. Small Capitalization Equity Fund
| | | | | | | | | | | | | | | | |
| Security | | | | | | | | Shares | | | Value | |
Electric Utilities — continued | | | | | | | | | | | | | | | | |
IDACORP Inc. | | | | | | | | | | | 7,700 | | | $ | 739,431 | |
Otter Tail Corp. | | | | | | | | | | | 15,500 | | | | 660,455 | |
PNM Resources Inc. | | | | | | | | | | | 6,000 | | | | 291,180 | |
Portland General Electric Co. | | | | | | | | | | | 16,393 | | | | 701,129 | |
Total Electric Utilities | | | | | | | | | | | | | | | 2,955,849 | |
Gas Utilities — 0.6% | | | | | | | | | | | | | | | | |
National Fuel Gas Co. | | | | | | | | | | | 7,300 | | | | 300,249 | |
Northwest Natural Holding Co. | | | | | | | | | | | 8,000 | | | | 367,920 | |
Spire Inc. | | | | | | | | | | | 6,500 | | | | 416,260 | |
Total Gas Utilities | | | | | | | | | | | | | | | 1,084,429 | |
Multi-Utilities — 0.6% | | | | | | | | | | | | | | | | |
Avista Corp. | | | | | | | | | | | 22,000 | | | | 883,080 | |
Unitil Corp. | | | | | | | | | | | 3,000 | | | | 132,810 | |
Total Multi-Utilities | | | | | | | | | | | | | | | 1,015,890 | |
Total Utilities | | | | | | | | | | | | | | | 5,056,168 | |
Total Investments before Short-Term Investments (Cost — $156,697,555) | | | | | | | | | | | | | | | 180,193,560 | |
| | | | |
| | | Rate | | | | | | | | | | |
| Short-Term Investments — 0.8% | | | | | | | | | | | | | | | | |
Invesco Treasury Portfolio, Institutional Class (Cost — $1,333,423) | | | 0.010 | % | | | | | | | 1,333,423 | | | | 1,333,423 | |
Total Investments — 100.0% (Cost — $158,030,978) | | | | | | | | | | | | | | | 181,526,983 | |
Other Assets in Excess of Liabilities — 0.0%†† | | | | | | | | | | | | | | | 70,212 | |
Total Net Assets — 100.0% | | | | | | | | | | | | | | $ | 181,597,195 | |
| †† | Represents less than 0.1%. |
| * | Non-income producing security. |
| (a) | Security is valued in good faith in accordance with procedures approved by the Board of Trustees (Note 1). |
| (b) | Security is valued using significant unobservable inputs (Note 1). |
| (c) | Value is less than $1. |
| | |
Abbreviation(s) used in this schedule: |
| |
| CVR | | — Contingent Value Rights |
| |
| REIT | | — Real Estate Investment Trust |
At December 31, 2020, the Fund had the following open futures contracts:
| | | | | | | | | | | | | | | | | | | | |
| | | Number of
Contracts | | | Expiration
Date | | | Notional
Amount | | | Market Value | | | Unrealized
Appreciation | |
| Contracts to Buy: | | | | | | | | | | | | | | | | | | | | |
| E-mini Russell 2000 Index | | | 11 | | | | 3/21 | | | $ | 1,053,126 | | | $ | 1,086,140 | | | $ | 33,014 | |
See Notes to Financial Statements.
| | |
24 | | QS U.S. Small Capitalization Equity Fund 2020 Annual Report |
Statement of assets and liabilities
December 31, 2020
| | | | |
| |
| Assets: | | | | |
Investments, at value (Cost — $158,030,978) | | $ | 181,526,983 | |
Dividends and interest receivable | | | 113,468 | |
Deposits with brokers for open futures contracts | | | 86,544 | |
Receivable for Fund shares sold | | | 14,367 | |
Other assets | | | 166,767 | |
Prepaid expenses | | | 27,232 | |
Total Assets | | | 181,935,361 | |
| |
| Liabilities: | | | | |
Trustees’ fees payable | | | 170,892 | |
Investment management fee payable | | | 96,965 | |
Service and/or distribution fees payable | | | 11,963 | |
Payable for Fund shares repurchased | | | 10,490 | |
Payable to broker — net variation margin on open futures contracts | | | 935 | |
Accrued expenses | | | 46,921 | |
Total Liabilities | | | 338,166 | |
| Total Net Assets | | $ | 181,597,195 | |
| |
| Net Assets: | | | | |
Par value (Note 7) | | $ | 139 | |
Paid-in capital in excess of par value | | | 155,619,397 | |
Total distributable earnings (loss) | | | 25,977,659 | |
| Total Net Assets | | $ | 181,597,195 | |
See Notes to Financial Statements.
| | |
| QS U.S. Small Capitalization Equity Fund 2020 Annual Report | | 25 |
Statement of assets and liabilities (cont’d)
December 31, 2020
| | | | |
| |
| Net Assets: | | | | |
Class A | | | $12,128,084 | |
Class A2 | | �� | $42,433,941 | |
Class C | | | $640,497 | |
Class FI | | | $18,079 | |
Class I | | | $3,718,413 | |
Class IS | | | $122,658,181 | |
| |
| Shares Outstanding: | | | | |
Class A | | | 926,272 | |
Class A2 | | | 3,295,930 | |
Class C | | | 53,590 | |
Class FI | | | 1,452 | |
Class I | | | 276,838 | |
Class IS | | | 9,387,012 | |
| |
| Net Asset Value: | | | | |
Class A (and redemption price) | | | $13.09 | |
Class A2 (and redemption price) | | | $12.87 | |
Class C* | | | $11.95 | |
Class FI (and redemption price) | | | $12.45 | |
Class I (and redemption price) | | | $13.43 | |
Class IS (and redemption price) | | | $13.07 | |
| Maximum Public Offering Price Per Share: | | | | |
Class A (based on maximum initial sales charge of 5.75%) | | | $13.89 | |
Class A2 (based on maximum initial sales charge of 5.75%) | | | $13.66 | |
| * | Redemption price per share is NAV of Class C shares reduced by a 1.00% CDSC if shares are redeemed within one year from purchase payment (Note 2). |
See Notes to Financial Statements.
| | |
26 | | QS U.S. Small Capitalization Equity Fund 2020 Annual Report |
Statement of operations
For the Year Ended December 31, 2020
| | | | |
| |
| Investment Income: | | | | |
Dividends | | $ | 2,341,235 | |
Interest | | | 1,580 | |
Less: Foreign taxes withheld | | | (7,270) | |
Total Investment Income | | | 2,335,545 | |
| |
| Expenses: | | | | |
Investment management fee (Note 2) | | | 1,085,730 | |
Transfer agent fees (Note 5) | | | 153,034 | |
Service and/or distribution fees (Notes 2 and 5) | | | 120,391 | |
Registration fees | | | 93,902 | |
Fund accounting fees | | | 68,705 | |
Audit and tax fees | | | 42,233 | |
Trustees’ fees | | | 25,187 | |
Legal fees | | | 21,951 | |
Shareholder reports | | | 20,907 | |
Fees recaptured by investment manager (Note 2) | | | 6,521 | |
Insurance | | | 3,174 | |
Custody fees | | | 3,110 | |
Interest expense | | | 871 | |
Miscellaneous expenses | | | 7,731 | |
Total Expenses | | | 1,653,447 | |
Less: Fee waivers and/or expense reimbursements (Notes 2 and 5) | | | (212,609) | |
Net Expenses | | | 1,440,838 | |
| Net Investment Income | | | 894,707 | |
| |
| Realized and Unrealized Gain on Investments and Futures Contracts (Notes 1, 3 and 4): | | | | |
Net Realized Gain From: | | | | |
Investment transactions | | | 6,921,771 | |
Futures contracts | | | 383,169 | |
Net Realized Gain | | | 7,304,940 | |
Change in Net Unrealized Appreciation (Depreciation) From: | | | | |
Investments | | | 8,855,891 | |
Futures contracts | | | 33,014 | |
Change in Net Unrealized Appreciation (Depreciation) | | | 8,888,905 | |
| Net Gain on Investments and Futures Contracts | | | 16,193,845 | |
| Increase in Net Assets From Operations | | $ | 17,088,552 | |
See Notes to Financial Statements.
| | |
| QS U.S. Small Capitalization Equity Fund 2020 Annual Report | | 27 |
Statements of changes in net assets
| | | | | | | | |
| For the Years Ended December 31, | | 2020 | | | 2019 | |
| | |
| Operations: | | | | | | | | |
Net investment income | | $ | 894,707 | | | $ | 1,115,580 | |
Net realized gain | | | 7,304,940 | | | | 1,142,355 | |
Change in net unrealized appreciation (depreciation) | | | 8,888,905 | | | | 31,299,997 | |
Increase in Net Assets From Operations | | | 17,088,552 | | | | 33,557,932 | |
| | |
| Distributions to Shareholders From (Notes 1 and 6): | | | | | | | | |
Total distributable earnings | | | (6,531,293) | | | | (3,141,537) | |
Decrease in Net Assets From Distributions to Shareholders | | | (6,531,293) | | | | (3,141,537) | |
| | |
| Fund Share Transactions (Note 7): | | | | | | | | |
Net proceeds from sale of shares | | | 15,835,313 | | | | 38,941,004 | |
Reinvestment of distributions | | | 6,520,706 | | | | 3,136,655 | |
Cost of shares repurchased | | | (37,491,870) | | | | (50,275,564) | |
Decrease in Net Assets From Fund Share Transactions | | | (15,135,851) | | | | (8,197,905) | |
Increase (Decrease) in Net Assets | | | (4,578,592) | | | | 22,218,490 | |
| | |
| Net Assets: | | | | | | | | |
Beginning of year | | | 186,175,787 | | | | 163,957,297 | |
End of year | | $ | 181,597,195 | | | $ | 186,175,787 | |
See Notes to Financial Statements.
| | |
28 | | QS U.S. Small Capitalization Equity Fund 2020 Annual Report |
Financial highlights
| | | | | | | | | | | | | | | | | | | | |
| For a share of each class of beneficial interest outstanding throughout each year ended December 31: | |
| Class A Shares1 | | 2020 | | | 2019 | | | 2018 | | | 2017 | | | 2016 | |
| | | | | |
| Net asset value, beginning of year | | | $12.22 | | | | $10.29 | | | | $13.55 | | | | $13.58 | | | | $11.95 | |
| | | | | |
| Income (loss) from operations: | | | | | | | | | | | | | | | | | | | | |
Net investment income | | | 0.04 | | | | 0.04 | | | | 0.02 | | | | 0.00 | 2 | | | 0.02 | |
Net realized and unrealized gain (loss) | | | 1.29 | | | | 2.05 | | | | (2.13) | | | | 1.15 | | | | 2.31 | |
Total income (loss) from operations | | | 1.33 | | | | 2.09 | | | | (2.11) | | | | 1.15 | | | | 2.33 | |
| | | | | |
| Less distributions from: | | | | | | | | | | | | | | | | | | | | |
Net investment income | | | (0.10) | | | | (0.02) | | | | (0.01) | | | | (0.19) | | | | (0.04) | |
Net realized gains | | | (0.36) | | | | (0.14) | | | | (1.14) | | | | (0.99) | | | | (0.66) | |
Total distributions | | | (0.46) | | | | (0.16) | | | | (1.15) | | | | (1.18) | | | | (0.70) | |
| | | | | |
| Net asset value, end of year | | | $13.09 | | | | $12.22 | | | | $10.29 | | | | $13.55 | | | | $13.58 | |
Total return3 | | | 10.99 | % | | | 20.43 | % | | | (15.58) | % | | | 8.46 | % | | | 19.46 | % |
| | | | | |
| Net assets, end of year (000s) | | | $12,128 | | | | $13,223 | | | | $11,916 | | | | $18,602 | | | | $20,690 | |
| | | | | |
| Ratios to average net assets: | | | | | | | | | | | | | | | | | | | | |
Gross expenses | | | 1.27 | % | | | 1.24 | % | | | 1.22 | % | | | 1.19 | % | | | 1.19 | %4 |
Net expenses5 | | | 1.14 | 6 | | | 1.12 | 6 | | | 1.13 | 6 | | | 1.19 | 6 | | | 1.19 | 4 |
Net investment income | | | 0.37 | | | | 0.38 | | | | 0.11 | | | | 0.03 | | | | 0.18 | |
| | | | | |
| Portfolio turnover rate | | | 37 | % | | | 51 | % | | | 26 | % | | | 41 | %7 | | | 33 | % |
| 1 | Per share amounts have been calculated using the average shares method. |
| 2 | Amount represents less than $0.005 per share. |
| 3 | Performance figures, exclusive of sales charges, may reflect compensating balance arrangements, fee waivers and/or expense reimbursements. In the absence of compensating balance arrangements, fee waivers and/or expense reimbursements, the total return would have been lower. Past performance is no guarantee of future results. |
| 4 | Reflects recapture of expenses waived/reimbursed from prior fiscal years. |
| 5 | As a result of an expense limitation arrangement, the ratio of total annual fund operating expenses to average net assets of Class A shares did not exceed 1.30%. This expense limitation arrangement cannot be terminated prior to December 31, 2022 without the Board of Trustees’ consent. The manager currently intends to voluntarily waive fees and/or reimburse expenses so that total annual fund operating expenses do not exceed 1.20%. This arrangement is expected to continue until December 31, 2022, but may be terminated at any time by the manager. These expense limitation arrangements do not include interest, brokerage commissions, dividend expense on short sales, taxes, extraordinary expenses and acquired fund fees and expenses. |
| 6 | Reflects fee waivers and/or expense reimbursements. |
| 7 | Excludes securities delivered as a result of a redemption in-kind. |
See Notes to Financial Statements.
| | |
| QS U.S. Small Capitalization Equity Fund 2020 Annual Report | | 29 |
Financial highlights (cont’d)
| | | | | | | | | | | | | | | | | | | | |
| For a share of each class of beneficial interest outstanding throughout each year ended December 31: | |
| Class A2 Shares1 | | 2020 | | | 2019 | | | 2018 | | | 2017 | | | 2016 | |
| | | | | |
| Net asset value, beginning of year | | | $12.02 | | | | $10.13 | | | | $13.39 | | | | $13.44 | | | | $11.84 | |
| | | | | |
| Income (loss) from operations: | | | | | | | | | | | | | | | | | | | | |
Net investment income (loss) | | | 0.01 | | | | 0.01 | | | | (0.01) | | | | (0.02) | | | | 0.00 | 2 |
Net realized and unrealized gain (loss) | | | 1.27 | | | | 2.02 | | | | (2.11) | | | | 1.14 | | | | 2.28 | |
Total income (loss) from operations | | | 1.28 | | | | 2.03 | | | | (2.12) | | | | 1.12 | | | | 2.28 | |
| | | | | |
| Less distributions from: | | | | | | | | | | | | | | | | | | | | |
Net investment income | | | (0.07) | | | | — | | | | — | | | | (0.18) | | | | (0.02) | |
Net realized gains | | | (0.36) | | | | (0.14) | | | | (1.14) | | | | (0.99) | | | | (0.66) | |
Total distributions | | | (0.43) | | | | (0.14) | | | | (1.14) | | | | (1.17) | | | | (0.68) | |
| | | | | |
| Net asset value, end of year | | | $12.87 | | | | $12.02 | | | | $10.13 | | | | $13.39 | | | | $13.44 | |
Total return3 | | | 10.72 | % | | | 20.12 | % | | | (15.82) | % | | | 8.29 | % | | | 19.23 | % |
| | | | | |
| Net assets, end of year (000s) | | | $42,434 | | | | $41,027 | | | | $34,495 | | | | $38,534 | | | | $31,598 | |
| | | | | |
| Ratios to average net assets: | | | | | | | | | | | | | | | | | | | | |
Gross expenses | | | 1.53 | %4 | | | 1.51 | %4 | | | 1.45 | % | | | 1.42 | %4 | | | 1.45 | % |
Net expenses5,6 | | | 1.40 | 4 | | | 1.40 | 4 | | | 1.35 | | | | 1.40 | 4 | | | 1.40 | |
Net investment income (loss) | | | 0.11 | | | | 0.12 | | | | (0.08) | | | | (0.17) | | | | (0.02) | |
| | | | | |
| Portfolio turnover rate | | | 37 | % | | | 51 | % | | | 26 | % | | | 41 | %7 | | | 33 | % |
| 1 | Per share amounts have been calculated using the average shares method. |
| 2 | Amount represents less than $0.005 per share. |
| 3 | Performance figures, exclusive of sales charges, may reflect compensating balance arrangements, fee waivers and/or expense reimbursements. In the absence of compensating balance arrangements, fee waivers and/or expense reimbursements, the total return would have been lower. Past performance is no guarantee of future results. |
| 4 | Reflects recapture of expenses waived/reimbursed from prior fiscal years. |
| 5 | As a result of an expense limitation arrangement, the ratio of total annual fund operating expenses to average net assets of Class A2 shares did not exceed 1.50%. This expense limitation arrangement cannot be terminated prior to December 31, 2022 without the Board of Trustees’ consent. The manager currently intends to voluntarily waive fees and/or reimburse expenses so that total annual fund operating expenses do not exceed 1.40%. This arrangement is expected to continue until December 31, 2022, but may be terminated at any time by the manager. These expense limitation arrangements do not include interest, brokerage commissions, dividend expense on short sales, taxes, extraordinary expenses and acquired fund fees and expenses. |
| 6 | Reflects fee waivers and/or expense reimbursements. |
| 7 | Excludes securities delivered as a result of a redemption in-kind. |
See Notes to Financial Statements.
| | |
30 | | QS U.S. Small Capitalization Equity Fund 2020 Annual Report |
| | | | | | | | | | | | | | | | | | | | |
| For a share of each class of beneficial interest outstanding throughout each year ended December 31: | |
| Class C Shares1 | | 2020 | | | 2019 | | | 2018 | | | 2017 | | | 2016 | |
| | | | | |
| Net asset value, beginning of year | | | $11.17 | | | | $9.47 | | | | $12.66 | | | | $12.76 | | | | $11.31 | |
| | | | | |
| Income (loss) from operations: | | | | | | | | | | | | | | | | | | | | |
Net investment loss | | | (0.04) | | | | (0.05) | | | | (0.08) | | | | (0.09) | | | | (0.07) | |
Net realized and unrealized gain (loss) | | | 1.18 | | | | 1.89 | | | | (1.97) | | | | 1.07 | | | | 2.18 | |
Total income (loss) from operations | | | 1.14 | | | | 1.84 | | | | (2.05) | | | | 0.98 | | | | 2.11 | |
| | | | | |
| Less distributions from: | | | | | | | | | | | | | | | | | | | | |
Net investment income | | | — | | | | — | | | | — | | | | (0.09) | | | | — | |
Net realized gains | | | (0.36) | | | | (0.14) | | | | (1.14) | | | | (0.99) | | | | (0.66) | |
Total distributions | | | (0.36) | | | | (0.14) | | | | (1.14) | | | | (1.08) | | | | (0.66) | |
| | | | | |
| Net asset value, end of year | | | $11.95 | | | | $11.17 | | | | $9.47 | | | | $12.66 | | | | $12.76 | |
Total return2 | | | 10.16 | % | | | 19.52 | % | | | (16.18) | % | | | 7.66 | % | | | 18.61 | % |
| | | | | |
| Net assets, end of year (000s) | | | $640 | | | | $1,125 | | | | $3,579 | | | | $5,110 | | | | $5,646 | |
| | | | | |
| Ratios to average net assets: | | | | | | | | | | | | | | | | | | | | |
Gross expenses | | | 2.05 | % | | | 2.04 | %3 | | | 1.93 | %3 | | | 1.96 | %3 | | | 1.96 | %3 |
Net expenses4,5 | | | 1.91 | | | | 1.93 | 3 | | | 1.83 | 3 | | | 1.95 | 3 | | | 1.95 | 3 |
Net investment loss | | | (0.42) | | | | (0.42) | | | | (0.58) | | | | (0.73) | | | | (0.59) | |
| | | | | |
| Portfolio turnover rate | | | 37 | % | | | 51 | % | | | 26 | % | | | 41 | %6 | | | 33 | % |
| 1 | Per share amounts have been calculated using the average shares method. |
| 2 | Performance figures, exclusive of CDSC, may reflect compensating balance arrangements, fee waivers and/or expense reimbursements. In the absence of compensating balance arrangements, fee waivers and/or expense reimbursements, the total return would have been lower. Past performance is no guarantee of future results. |
| 3 | Reflects recapture of expenses waived/reimbursed from prior fiscal years. |
| 4 | As a result of an expense limitation arrangement, the ratio of total annual fund operating expenses to average net assets of Class C shares did not exceed 2.05%. This expense limitation arrangement cannot be terminated prior to December 31, 2022 without the Board of Trustees’ consent. The manager currently intends to voluntarily waive fees and/or reimburse expenses so that total annual fund operating expenses do not exceed 1.95%. This arrangement is expected to continue until December 31, 2022, but may be terminated at any time by the manager. These expense limitation arrangements do not include interest, brokerage commissions, dividend expense on short sales, taxes, extraordinary expenses and acquired fund fees and expenses. |
| 5 | Reflects fee waivers and/or expense reimbursements. |
| 6 | Excludes securities delivered as a result of a redemption in-kind. |
See Notes to Financial Statements.
| | |
| QS U.S. Small Capitalization Equity Fund 2020 Annual Report | | 31 |
Financial highlights (cont’d)
| | | | | | | | | | | | | | | | | | | | |
| For a share of each class of beneficial interest outstanding throughout each year ended December 31: | |
| Class FI Shares1 | | 2020 | | | 2019 | | | 2018 | | | 2017 | | | 2016 | |
| | | | | |
| Net asset value, beginning of year | | | $11.61 | | | | $9.78 | | | | $12.96 | | | | $13.04 | | | | $11.54 | |
| | | | | |
| Income (loss) from operations: | | | | | | | | | | | | | | | | | | | | |
Net investment income | | | 0.02 | | | | 0.04 | | | | 0.00 | 2 | | | 0.00 | 2 | | | 0.02 | |
Net realized and unrealized gain (loss) | | | 1.24 | | | | 1.95 | | | | (2.04) | | | | 1.11 | | | | 2.24 | |
Total income (loss) from operations | | | 1.26 | | | | 1.99 | | | | (2.04) | | | | 1.11 | | | | 2.26 | |
| | | | | |
| Less distributions from: | | | | | | | | | | | | | | | | | | | | |
Net investment income | | | (0.06) | | | | (0.02) | | | | — | | | | (0.20) | | | | (0.10) | |
Net realized gains | | | (0.36) | | | | (0.14) | | | | (1.14) | | | | (0.99) | | | | (0.66) | |
Total distributions | | | (0.42) | | | | (0.16) | | | | (1.14) | | | | (1.19) | | | | (0.76) | |
| | | | | |
| Net asset value, end of year | | | $12.45 | | | | $11.61 | | | | $9.78 | | | | $12.96 | | | | $13.04 | |
Total return3 | | | 10.94 | % | | | 20.42 | % | | | (15.73) | % | | | 8.49 | % | | | 19.51 | % |
| | | | | |
| Net assets, end of year (000s) | | | $18 | | | | $150 | | | | $107 | | | | $216 | | | | $167 | |
| | | | | |
| Ratios to average net assets: | | | | | | | | | | | | | | | | | | | | |
Gross expenses | | | 1.72 | % | | | 1.41 | %4 | | | 1.36 | %4 | | | 1.28 | % | | | 1.66 | %4 |
Net expenses5,6 | | | 1.20 | | | | 1.20 | 4 | | | 1.20 | 4 | | | 1.20 | | | | 1.20 | 4 |
Net investment income | | | 0.24 | | | | 0.33 | | | | 0.02 | | | | 0.04 | | | | 0.20 | |
| | | | | |
| Portfolio turnover rate | | | 37 | % | | | 51 | % | | | 26 | % | | | 41 | %7 | | | 33 | % |
| 1 | Per share amounts have been calculated using the average shares method. |
| 2 | Amount represents less than $0.005 per share. |
| 3 | Performance figures may reflect compensating balance arrangements, fee waivers and/or expense reimbursements. In the absence of compensating balance arrangements, fee waivers and/or expense reimbursements, the total return would have been lower. Past performance is no guarantee of future results. |
| 4 | Reflects recapture of expenses waived/reimbursed from prior fiscal years. |
| 5 | As a result of an expense limitation arrangement, the ratio of total annual fund operating expenses to average net assets of Class FI shares did not exceed 1.30%. This expense limitation arrangement cannot be terminated prior to December 31, 2022 without the Board of Trustees’ consent. The manager currently intends to voluntarily waive fees and/or reimburse expenses so that total annual fund operating expenses do not exceed 1.20%. This arrangement is expected to continue until December 31, 2022, but may be terminated at any time by the manager. These expense limitation arrangements do not include interest, brokerage commissions, dividend expense on short sales, taxes, extraordinary expenses and acquired fund fees and expenses. |
| 6 | Reflects fee waivers and/or expense reimbursements. |
| 7 | Excludes securities delivered as a result of a redemption in-kind. |
See Notes to Financial Statements.
| | |
32 | | QS U.S. Small Capitalization Equity Fund 2020 Annual Report |
| | | | | | | | | | | | | | | | | | | | |
| For a share of each class of beneficial interest outstanding throughout each year ended December 31: | |
| Class I Shares1 | | 2020 | | | 2019 | | | 2018 | | | 2017 | | | 2016 | |
| | | | | |
| Net asset value, beginning of year | | | $12.52 | | | | $10.53 | | | | $13.84 | | | | $13.85 | | | | $12.10 | |
| | | | | |
| Income (loss) from operations: | | | | | | | | | | | | | | | | | | | | |
Net investment income | | | 0.07 | | | | 0.07 | | | | 0.04 | | | | 0.04 | | | | 0.05 | |
Net realized and unrealized gain (loss) | | | 1.33 | | | | 2.11 | | | | (2.18) | | | | 1.18 | | | | 2.36 | |
Total income (loss) from operations | | | 1.40 | | | | 2.18 | | | | (2.14) | | | | 1.22 | | | | 2.41 | |
| | | | | |
| Less distributions from: | | | | | | | | | | | | | | | | | | | | |
Net investment income | | | (0.13) | | | | (0.05) | | | | (0.03) | | | | (0.24) | | | | — | |
Net realized gains | | | (0.36) | | | | (0.14) | | | | (1.14) | | | | (0.99) | | | | (0.66) | |
Total distributions | | | (0.49) | | | | (0.19) | | | | (1.17) | | | | (1.23) | | | | (0.66) | |
| | | | | |
| Net asset value, end of year | | | $13.43 | | | | $12.52 | | | | $10.53 | | | | $13.84 | | | | $13.85 | |
Total return2 | | | 11.26 | % | | | 20.74 | % | | | (15.41) | % | | | 8.77 | % | | | 19.88 | % |
| | | | | |
| Net assets, end of year (000s) | | | $3,718 | | | | $4,257 | | | | $10,457 | | | | $22,847 | | | | $23,387 | |
| | | | | |
| Ratios to average net assets: | | | | | | | | | | | | | | | | | | | | |
Gross expenses | | | 1.06 | % | | | 1.05 | %3 | | | 1.01 | %3 | | | 0.92 | %3 | | | 0.98 | % |
Net expenses4,5 | | | 0.90 | | | | 0.90 | 3 | | | 0.90 | 3 | | | 0.90 | 3 | | | 0.90 | |
Net investment income | | | 0.60 | | | | 0.58 | | | | 0.31 | | | | 0.32 | | | | 0.43 | |
| | | | | |
| Portfolio turnover rate | | | 37 | % | | | 51 | % | | | 26 | % | | | 41 | %6 | | | 33 | % |
| 1 | Per share amounts have been calculated using the average shares method. |
| 2 | Performance figures may reflect compensating balance arrangements, fee waivers and/or expense reimbursements. In the absence of compensating balance arrangements, fee waivers and/or expense reimbursements, the total return would have been lower. Past performance is no guarantee of future results. |
| 3 | Reflects recapture of expenses waived/reimbursed from prior fiscal years. |
| 4 | As a result of an expense limitation arrangement, the ratio of total annual fund operating expenses to average net assets of Class I shares did not exceed 1.00%. This expense limitation arrangement cannot be terminated prior to December 31, 2022 without the Board of Trustees’ consent. The manager currently intends to voluntarily waive fees and/or reimburse expenses so that total annual fund operating expenses do not exceed 0.90%. This arrangement is expected to continue until December 31, 2022, but may be terminated at any time by the manager. These expense limitation arrangements do not include interest, brokerage commissions, dividend expense on short sales, taxes, extraordinary expenses and acquired fund fees and expenses. |
| 5 | Reflects fee waivers and/or expense reimbursements. |
| 6 | Excludes securities delivered as a result of a redemption in-kind. |
See Notes to Financial Statements.
| | |
| QS U.S. Small Capitalization Equity Fund 2020 Annual Report | | 33 |
Financial highlights (cont’d)
| | | | | | | | | | | | | | | | | | | | |
| For a share of each class of beneficial interest outstanding throughout each year ended December 31: | |
| Class IS Shares1 | | 2020 | | | 2019 | | | 2018 | | | 2017 | | | 2016 | |
| | | | | |
| Net asset value, beginning of year | | | $12.19 | | | | $10.26 | | | | $13.54 | | | | $13.56 | | | | $11.92 | |
| | | | | |
| Income (loss) from operations: | | | | | | | | | | | | | | | | | | | | |
Net investment income | | | 0.08 | | | | 0.09 | | | | 0.07 | | | | 0.06 | | | | 0.07 | |
Net realized and unrealized gain (loss) | | | 1.30 | | | | 2.05 | | | | (2.15) | | | | 1.17 | | | | 2.33 | |
Total income (loss) from operations | | | 1.38 | | | | 2.14 | | | | (2.08) | | | | 1.23 | | | | 2.40 | |
| | | | | |
| Less distributions from: | | | | | | | | | | | | | | | | | | | | |
Net investment income | | | (0.14) | | | | (0.07) | | | | (0.06) | | | | (0.26) | | | | (0.10) | |
Net realized gains | | | (0.36) | | | | (0.14) | | | | (1.14) | | | | (0.99) | | | | (0.66) | |
Total distributions | | | (0.50) | | | | (0.21) | | | | (1.20) | | | | (1.25) | | | | (0.76) | |
| | | | | |
| Net asset value, end of year | | | $13.07 | | | | $12.19 | | | | $10.26 | | | | $13.54 | | | | $13.56 | |
Total return2 | | | 11.47 | % | | | 20.92 | % | | | (15.33) | % | | | 9.02 | % | | | 20.04 | % |
| | | | | |
| Net assets, end of year (millions) | | | $123 | | | | $126 | | | | $103 | | | | $142 | | | | $811 | |
| | | | | |
| Ratios to average net assets: | | | | | | | | | | | | | | | | | | | | |
Gross expenses | | | 0.89 | % | | | 0.86 | %3 | | | 0.85 | %3 | | | 0.76 | % | | | 0.76 | %3 |
Net expenses4,5 | | | 0.75 | | | | 0.75 | 3 | | | 0.75 | 3 | | | 0.75 | | | | 0.75 | 3 |
Net investment income | | | 0.76 | | | | 0.77 | | | | 0.50 | | | | 0.47 | | | | 0.60 | |
| | | | | |
| Portfolio turnover rate | | | 37 | % | | | 51 | % | | | 26 | % | | | 41 | %6 | | | 33 | % |
| 1 | Per share amounts have been calculated using the average shares method. |
| 2 | Performance figures may reflect compensating balance arrangements, fee waivers and/or expense reimbursements. In the absence of compensating balance arrangements, fee waivers and/or expense reimbursements, the total return would have been lower. Past performance is no guarantee of future results. |
| 3 | Reflects recapture of expenses waived/reimbursed from prior fiscal years. |
| 4 | As a result of an expense limitation arrangement, the ratio of total annual fund operating expenses to average net assets of Class IS shares did not exceed 0.75%. In addition, the ratio of total annual fund operating expenses for Class IS shares did not exceed the ratio of total annual fund operating expenses for Class I shares. These expense limitation arrangements cannot be terminated prior to December 31, 2022 without the Board of Trustees’ consent. These expense limitation arrangements do not include interest, brokerage commissions, dividend expense on short sales, taxes, extraordinary expenses and acquired fund fees and expenses. |
| 5 | Reflects fee waivers and/or expense reimbursements. |
| 6 | Excludes securities delivered as a result of a redemption in-kind. |
See Notes to Financial Statements.
| | |
34 | | QS U.S. Small Capitalization Equity Fund 2020 Annual Report |
Notes to financial statements
1. Organization and significant accounting policies
QS U.S. Small Capitalization Equity Fund (the “Fund”) is a separate diversified investment series of Legg Mason Global Asset Management Trust (the “Trust”). The Trust, a Maryland statutory trust, is registered under the Investment Company Act of 1940, as amended (the “1940 Act”), as an open-end management investment company.
The following are significant accounting policies consistently followed by the Fund and are in conformity with U.S. generally accepted accounting principles (“GAAP”). Estimates and assumptions are required to be made regarding assets, liabilities and changes in net assets resulting from operations when financial statements are prepared. Changes in the economic environment, financial markets and any other parameters used in determining these estimates could cause actual results to differ. Subsequent events have been evaluated through the date the financial statements were issued.
(a) Investment valuation. Equity securities for which market quotations are available are valued at the last reported sales price or official closing price on the primary market or exchange on which they trade. The valuations for fixed income securities (which may include, but are not limited to, corporate, government, municipal, mortgage-backed, collateralized mortgage obligations and asset-backed securities) and certain derivative instruments are typically the prices supplied by independent third party pricing services, which may use market prices or broker/dealer quotations or a variety of valuation techniques and methodologies. The independent third party pricing services use inputs that are observable such as issuer details, interest rates, yield curves, prepayment speeds, credit risks/spreads, default rates and quoted prices for similar securities. Investments in open-end funds are valued at the closing net asset value per share of each fund on the day of valuation. Futures contracts are valued daily at the settlement price established by the board of trade or exchange on which they are traded. When the Fund holds securities or other assets that are denominated in a foreign currency, the Fund will normally use the currency exchange rates as of 4:00 p.m. (Eastern Time). If independent third party pricing services are unable to supply prices for a portfolio investment, or if the prices supplied are deemed by the manager to be unreliable, the market price may be determined by the manager using quotations from one or more broker/dealers or at the transaction price if the security has recently been purchased and no value has yet been obtained from a pricing service or pricing broker. When reliable prices are not readily available, such as when the value of a security has been significantly affected by events after the close of the exchange or market on which the security is principally traded, but before the Fund calculates its net asset value, the Fund values these securities as determined in accordance with procedures approved by the Fund’s Board of Trustees.
The Board of Trustees is responsible for the valuation process and has delegated the supervision of the daily valuation process to the Legg Mason North Atlantic Fund Valuation Committee (the “Valuation Committee”). The Valuation Committee, pursuant to the policies adopted by the Board of Trustees, is responsible for making fair value determinations,
| | |
| QS U.S. Small Capitalization Equity Fund 2020 Annual Report | | 35 |
Notes to financial statements (cont’d)
evaluating the effectiveness of the Fund’s pricing policies, and reporting to the Board of Trustees. When determining the reliability of third party pricing information for investments owned by the Fund, the Valuation Committee, among other things, conducts due diligence reviews of pricing vendors, monitors the daily change in prices and reviews transactions among market participants.
The Valuation Committee will consider pricing methodologies it deems relevant and appropriate when making fair value determinations. Examples of possible methodologies include, but are not limited to, multiple of earnings; discount from market of a similar freely traded security; discounted cash-flow analysis; book value or a multiple thereof; risk premium/yield analysis; yield to maturity; and/or fundamental investment analysis. The Valuation Committee will also consider factors it deems relevant and appropriate in light of the facts and circumstances. Examples of possible factors include, but are not limited to, the type of security; the issuer’s financial statements; the purchase price of the security; the discount from market value of unrestricted securities of the same class at the time of purchase; analysts’ research and observations from financial institutions; information regarding any transactions or offers with respect to the security; the existence of merger proposals or tender offers affecting the security; the price and extent of public trading in similar securities of the issuer or comparable companies; and the existence of a shelf registration for restricted securities.
For each portfolio security that has been fair valued pursuant to the policies adopted by the Board of Trustees, the fair value price is compared against the last available and next available market quotations. The Valuation Committee reviews the results of such back testing monthly and fair valuation occurrences are reported to the Board of Trustees quarterly.
The Fund uses valuation techniques to measure fair value that are consistent with the market approach and/or income approach, depending on the type of security and the particular circumstance. The market approach uses prices and other relevant information generated by market transactions involving identical or comparable securities. The income approach uses valuation techniques to discount estimated future cash flows to present value.
GAAP establishes a disclosure hierarchy that categorizes the inputs to valuation techniques used to value assets and liabilities at measurement date. These inputs are summarized in the three broad levels listed below:
| • | | Level 1 — quoted prices in active markets for identical investments |
| • | | Level 2 — other significant observable inputs (including quoted prices for similar investments, interest rates, prepayment speeds, credit risk, etc.) |
| • | | Level 3 — significant unobservable inputs (including the Fund’s own assumptions in determining the fair value of investments) |
| | |
36 | | QS U.S. Small Capitalization Equity Fund 2020 Annual Report |
The inputs or methodologies used to value securities are not necessarily an indication of the risk associated with investing in those securities.
The following is a summary of the inputs used in valuing the Fund’s assets carried at fair value:
| | | | | | | | | | | | | | | | |
| ASSETS | |
| Description | | Quoted Prices
(Level 1) | | | Other Significant
Observable Inputs
(Level 2) | | | Significant
Unobservable
Inputs (Level 3) | | | Total | |
| Long-Term Investments†: | | | | | | | | | | | | | | | | |
Common Stocks: | | | | | | | | | | | | | | | | |
Communication Services | | $ | 4,416,333 | | | | — | | | $ | 0 | * | | $ | 4,416,333 | |
Health Care | | | 36,937,144 | | | $ | 376,675 | | | | 0 | * | | | 37,313,819 | |
Other Common Stocks | | | 138,463,408 | | | | — | | | | — | | | | 138,463,408 | |
| Total Long-Term Investments | | | 179,816,885 | | | | 376,675 | | | | 0 | * | | | 180,193,560 | |
| Short-Term Investments† | | | 1,333,423 | | | | — | | | | — | | | | 1,333,423 | |
| Total Investments | | $ | 181,150,308 | | | $ | 376,675 | | | $ | 0 | * | | $ | 181,526,983 | |
| Other Financial Instruments: | | | | | | | | | | | | | | | | |
Futures Contracts | | $ | 33,014 | | | | — | | | | — | | | $ | 33,014 | |
| Total | | $ | 181,183,322 | | | $ | 376,675 | | | | — | | | $ | 181,559,997 | |
| † | See Schedule of Investments for additional detailed categorizations. |
* Amount represents less than $1.
(b) Futures contracts. The Fund uses futures contracts generally to gain exposure to, or hedge against, changes in interest rates or gain exposure to, or hedge against, changes in certain asset classes. A futures contract represents a commitment for the future purchase or sale of an asset at a specified price on a specified date.
Upon entering into a futures contract, the Fund is required to deposit cash or securities with a broker in an amount equal to a certain percentage of the contract amount. This is known as the ‘‘initial margin’’ and subsequent payments (‘‘variation margin’’) are made or received by the Fund each day, depending on the daily fluctuation in the value of the contract. For certain futures, including foreign denominated futures, variation margin is not settled daily, but is recorded as a net variation margin payable or receivable. The daily changes in contract value are recorded as unrealized gains or losses in the Statement of Operations and the Fund recognizes a realized gain or loss when the contract is closed.
Futures contracts involve, to varying degrees, risk of loss in excess of the amounts reflected in the financial statements. In addition, there is the risk that the Fund may not be able to enter into a closing transaction because of an illiquid secondary market.
(c) Foreign investment risks. The Fund’s investments in foreign securities may involve risks not present in domestic investments. Since securities may be denominated in foreign currencies, may require settlement in foreign currencies or pay interest or dividends in foreign currencies, changes in the relationship of these foreign currencies to the U.S. dollar
| | |
| QS U.S. Small Capitalization Equity Fund 2020 Annual Report | | 37 |
Notes to financial statements (cont’d)
can significantly affect the value of the investments and earnings of the Fund. Foreign investments may also subject the Fund to foreign government exchange restrictions, expropriation, taxation or other political, social or economic developments, all of which affect the market and/or credit risk of the investments.
(d) Counterparty risk and credit-risk-related contingent features of derivative instruments. The Fund may invest in certain securities or engage in other transactions where the Fund is exposed to counterparty credit risk in addition to broader market risks. The Fund may invest in securities of issuers, which may also be considered counterparties as trading partners in other transactions. This may increase the risk of loss in the event of default or bankruptcy by the counterparty or if the counterparty otherwise fails to meet its contractual obligations. The Fund’s subadviser attempts to mitigate counterparty risk by (i) periodically assessing the creditworthiness of its trading partners, (ii) monitoring and/or limiting the amount of its net exposure to each individual counterparty based on its assessment and (iii) requiring collateral from the counterparty for certain transactions. Market events and changes in overall economic conditions may impact the assessment of such counterparty risk by the subadviser. In addition, declines in the values of underlying collateral received may expose the Fund to increased risk of loss.
With exchange traded and centrally cleared derivatives, there is less counterparty risk to the Fund since the exchange or clearinghouse, as counterparty to such instruments, guarantees against a possible default. The clearinghouse stands between the buyer and the seller of the contract; therefore, the credit risk is limited to failure of the clearinghouse. While offset rights may exist under applicable law, the Fund does not have a contractual right of offset against a clearing broker or clearinghouse in the event of a default of the clearing broker or clearinghouse.
The Fund has entered into master agreements, such as an International Swaps and Derivatives Association, Inc. Master Agreement (“ISDA Master Agreement”) or similar agreement, with certain of its derivative counterparties that govern over-the-counter (“OTC”) derivatives and provide for general obligations, representations, agreements, collateral posting terms, netting provisions in the event of default or termination and credit related contingent features. The credit related contingent features include, but are not limited to, a percentage decrease in the Fund’s net assets or net asset value per share over a specified period of time. If these credit related contingent features were triggered, the derivatives counterparty could terminate the positions and demand payment or require additional collateral.
Under an ISDA Master Agreement, the Fund may, under certain circumstances, offset with the counterparty certain derivative financial instruments’ payables and/or receivables with collateral held and/or posted and create one single net payment. However, absent an event of default by the counterparty or a termination of the agreement, the terms of the ISDA Master Agreements do not result in an offset of reported amounts of financial assets and
| | |
38 | | QS U.S. Small Capitalization Equity Fund 2020 Annual Report |
financial liabilities in the Statement of Assets and Liabilities across transactions between the Fund and the applicable counterparty. The enforceability of the right to offset may vary by jurisdiction.
Collateral requirements differ by type of derivative. Collateral or margin requirements are set by the broker or exchange clearinghouse for exchange traded derivatives while collateral terms are contract specific for OTC traded derivatives. Cash collateral that has been pledged to cover obligations of the Fund under derivative contracts, if any, will be reported separately in the Statement of Assets and Liabilities. Securities pledged as collateral, if any, for the same purpose are noted in the Schedule of Investments.
As of December 31, 2020, the Fund did not have any open OTC derivative transactions with credit related contingent features in a net liability position.
(e) Security transactions and investment income. Security transactions are accounted for on a trade date basis. Interest income (including interest income from payment-in-kind securities), adjusted for amortization of premium and accretion of discount, is recorded on the accrual basis. Dividend income is recorded on the ex-dividend date for dividends received in cash and/or securities. Foreign dividend income is recorded on the ex-dividend date or as soon as practicable after the Fund determines the existence of a dividend declaration after exercising reasonable due diligence. The cost of investments sold is determined by use of the specific identification method. To the extent any issuer defaults or a credit event occurs that impacts the issuer, the Fund may halt any additional interest income accruals and consider the realizability of interest accrued up to the date of default or credit event.
(f) REIT distributions. The character of distributions received from Real Estate Investment Trusts (‘‘REITs’’) held by the Fund is generally comprised of net investment income, capital gains, and return of capital. It is the policy of the Fund to estimate the character of distributions received from underlying REITs based on historical data provided by the REITs. After each calendar year end, REITs report the actual tax character of these distributions. Differences between the estimated and actual amounts reported by the REITs are reflected in the Fund’s records in the year in which they are reported by the REITs by adjusting related investment cost basis, capital gains and income, as necessary.
(g) Distributions to shareholders. Distributions from net investment income and distributions of net realized gains, if any, are declared at least annually. Distributions to shareholders of the Fund are recorded on the ex-dividend date and are determined in accordance with income tax regulations, which may differ from GAAP.
(h) Share class accounting. Investment income, common expenses and realized/ unrealized gains (losses) on investments are allocated to the various classes of the Fund on the basis of daily net assets of each class. Fees relating to a specific class are charged directly to that share class.
| | |
| QS U.S. Small Capitalization Equity Fund 2020 Annual Report | | 39 |
Notes to financial statements (cont’d)
(i) Compensating balance arrangements. The Fund has an arrangement with its custodian bank whereby a portion of the custodian’s fees is paid indirectly by credits earned on the Fund’s cash on deposit with the bank.
(j) Federal and other taxes. It is the Fund’s policy to comply with the federal income and excise tax requirements of the Internal Revenue Code of 1986 (the “Code”), as amended, applicable to regulated investment companies. Accordingly, the Fund intends to distribute its taxable income and net realized gains, if any, to shareholders in accordance with timing requirements imposed by the Code. Therefore, no federal or state income tax provision is required in the Fund’s financial statements.
Management has analyzed the Fund’s tax positions taken on income tax returns for all open tax years and has concluded that as of December 31, 2020, no provision for income tax is required in the Fund’s financial statements. The Fund’s federal and state income and federal excise tax returns for tax years for which the applicable statutes of limitations have not expired are subject to examination by the Internal Revenue Service and state departments of revenue.
Under the applicable foreign tax laws, a withholding tax may be imposed on interest, dividends and capital gains at various rates.
(k) Reclassification. GAAP requires that certain components of net assets be reclassified to reflect permanent differences between financial and tax reporting. These reclassifications have no effect on net assets or net asset value per share. During the current year, the Fund had no reclassifications.
2. Investment management agreement and other transactions with affiliates
Legg Mason Partners Fund Advisor, LLC (“LMPFA”) is the Fund’s investment manager and QS Investors, LLC (“QS Investors”) is the Fund’s subadviser. Western Asset Management Company, LLC (“Western Asset”) manages the portion of the Fund’s cash and short-term instruments allocated to it. As of July 31, 2020, LMPFA, QS Investors and Western Asset are indirect, wholly-owned subsidiaries of Franklin Resources, Inc. (“Franklin Resources”). Prior to July 31, 2020, LMPFA, QS Investors and Western Asset were wholly-owned subsidiaries of Legg Mason, Inc. (“Legg Mason”). As of July 31, 2020, Legg Mason is a subsidiary of Franklin Resources.
Under the investment management agreement, the Fund pays an investment management fee, calculated daily and paid monthly, at an annual rate of 0.70% of the Fund’s average daily net assets.
LMPFA provides administrative and certain oversight services to the Fund. LMPFA delegates to the subadviser the day-to-day portfolio management of the Fund, except for the management of the portion of the cash and short-term instruments allocated to Western Asset. To the extent LMPFA receives a management fee after taking into account its contractual obligation to limit expenses as discussed below, LMPFA pays QS Investors
| | |
40 | | QS U.S. Small Capitalization Equity Fund 2020 Annual Report |
monthly the entire management fee it receives from the Fund, net of any fees paid to Western Asset. For Western Asset’s services to the Fund, LMPFA pays Western Asset monthly 0.02% of the portion of the Fund’s average daily net assets that are allocated to Western Asset by LMPFA.
As a result of expense limitation arrangements between the Fund and LMPFA, the ratio of total annual fund operating expenses, other than interest, brokerage commissions, dividend expense on short sales, taxes, extraordinary expenses and acquired fund fees and expenses, to average net assets of Class A, Class A2, Class C, Class FI, Class I and Class IS shares did not exceed 1.30%, 1.50%, 2.05%, 1.30%, 1.00% and 0.75%, respectively. In addition, the ratio of total annual fund operating expenses for Class IS shares did not exceed the ratio of total annual fund operating expenses for Class I shares. These expense limitation arrangements cannot be terminated prior to December 31, 2022 without the Board of Trustees’ consent.
As a result of voluntary expense limitation arrangements, the ratio of total annual fund operating expenses, other than interest, brokerage commissions, dividend expense on short sales, taxes, extraordinary expenses and acquired fund fees and expenses, to average net assets did not exceed 1.20%, 1.40%, 1.95%, 1.20% and 0.90% for Class A, Class A2, Class C, Class FI and Class I shares, respectively. These arrangements are expected to continue until December 31, 2022, but may be terminated at any time by LMPFA.
During the year ended December 31, 2020, fees waived and/or expenses reimbursed amounted to $212,609.
LMPFA is permitted to recapture amounts waived and/or reimbursed to a class within three years after the fiscal year in which LMPFA earned the fee or incurred the expense if the class’ total annual fund operating expenses have fallen to a level below the expense limitation (“expense cap”) in effect at the time the fees were earned or the expenses incurred. In no case will LMPFA recapture any amount that would result, on any particular business day of the Fund, in the class’ total annual fund operating expenses exceeding the expense cap or any other lower limit then in effect.
Pursuant to these arrangements, at December 31, 2020, the Fund had remaining fee waivers and/or expense reimbursements subject to recapture by LMPFA and respective dates of expiration as follows:
| | | | | | | | | | | | | | | | | | | | | | | | |
| | | Class A | | | Class A2 | | | Class C | | | Class FI | | | Class I | | | Class IS | |
| Expires December 31, 2021 | | $ | 16,204 | | | $ | 38,084 | | | $ | 4,772 | | | $ | 339 | | | $ | 16,859 | | | $ | 130,157 | |
| Expires December 31, 2022 | | | 14,462 | | | | 44,327 | | | | 2,605 | | | | 286 | | | | 12,984 | | | | 145,072 | |
| Expires December 31, 2023 | | | 14,124 | | | | 46,944 | | | | 961 | | | | 285 | | | | 5,132 | | | | 143,218 | |
| Total fee waivers/expense reimbursements subject to recapture | | $ | 44,790 | | | $ | 129,355 | | | $ | 8,338 | | | $ | 910 | | | $ | 34,975 | | | $ | 418,447 | |
| | |
| QS U.S. Small Capitalization Equity Fund 2020 Annual Report | | 41 |
Notes to financial statements (cont’d)
For the year ended December 31, 2020, fee waivers and/or expense reimbursements recaptured by LMPFA, if any, were as follows:
| | | | |
| | | Class A2 | |
| LMPFA recaptured | | $ | 6,521 | |
Legg Mason Investor Services, LLC (“LMIS”) serves as the Fund’s sole and exclusive distributor. As of July 31, 2020, LMIS is an indirect, wholly-owned broker-dealer subsidiary of Franklin Resources. Prior to July 31, 2020, LMIS was a wholly-owned broker-dealer subsidiary of Legg Mason.
There is a maximum initial sales charge of 5.75% for Class A and Class A2 shares. There is a contingent deferred sales charge (“CDSC”) of 1.00% on Class C shares, which applies if redemption occurs within 12 months from purchase payment. In certain cases, Class A and Class A2 shares have a 1.00% CDSC, which applies if redemption occurs within 18 months from purchase payment. This CDSC only applies to those purchases of Class A and Class A2 shares, which, when combined with current holdings of other shares of funds sold by LMIS, equal or exceed $1,000,000 in the aggregate. These purchases do not incur an initial sales charge.
For the year ended December 31, 2020, sales charges retained by and CDSCs paid to LMIS and its affiliates, if any, were as follows:
| | | | | | | | |
| | | Class A | | | Class A2 | |
| Sales charges | | $ | 80 | | | $ | 24,026 | |
| CDSCs | | | — | | | | 71 | |
Under a Deferred Compensation Plan (the “Plan”), Trustees may have elected to defer receipt of all or a specified portion of their compensation. A participating Trustee selected one or more funds managed by affiliates of Legg Mason in which his or her deferred trustee’s fees were deemed to be invested. Until distributed in accordance with the Plan, deferred amounts remain in the Fund and are included in Trustees’ fee payable on the Statement of Assets and Liabilities. In May 2015, the Board of Trustees approved an amendment to the Plan so that effective January 1, 2016, no compensation earned after that date may be deferred under the Plan.
As of July 31, 2020, all officers and one Trustee of the Trust are employees of Franklin Resources or its affiliates and do not receive compensation from the Trust. Prior to July 31, 2020, all officers and one Trustee of the Trust were employees of Legg Mason and did not receive compensation from the Trust.
As of December 31, 2020, Franklin Resources and its affiliates owned 67% of the Fund.
| | |
42 | | QS U.S. Small Capitalization Equity Fund 2020 Annual Report |
3. Investments
During the year ended December 31, 2020, the aggregate cost of purchases and proceeds from sales of investments (excluding short-term investments) were as follows:
| | | | |
| Purchases | | $ | 57,100,601 | |
| Sales | | | 78,399,044 | |
At December 31, 2020, the aggregate cost of investments and the aggregate gross unrealized appreciation and depreciation of investments for federal income tax purposes were as follows:
| | | | | | | | | | | | | | | | |
| | | Cost | | | Gross
Unrealized
Appreciation | | | Gross
Unrealized
Depreciation | | | Net
Unrealized
Appreciation | |
| Securities | | $ | 158,033,816 | | | $ | 43,765,781 | | | $ | (20,272,614) | | | $ | 23,493,167 | |
| Futures contracts | | | — | | | | 33,014 | | | | — | | | | 33,014 | |
4. Derivative instruments and hedging activities
Below is a table, grouped by derivative type, that provides information about the fair value and the location of derivatives within the Statement of Assets and Liabilities at December 31, 2020.
| | | | | | | | |
| ASSET DERIVATIVES1 | |
| | | | | | Equity
Risk | |
| Futures contracts2 | | | | | | $ | 33,014 | |
| 1 | Generally, the balance sheet location for asset derivatives is receivables/net unrealized appreciation and for liability derivatives is payables/net unrealized depreciation. |
| 2 | Includes cumulative unrealized appreciation (depreciation) of futures contracts as reported in the Schedule of Investments. Only variation margin is reported within the receivables and/or payables on the Statement of Assets and Liabilities. |
The following tables provide information about the effect of derivatives and hedging activities on the Fund’s Statement of Operations for the year ended December 31, 2020. The first table provides additional detail about the amounts and sources of gains (losses) realized on derivatives during the period. The second table provides additional information about the change in unrealized appreciation (depreciation) resulting from the Fund’s derivatives and hedging activities during the period.
| | | | |
| AMOUNT OF REALIZED GAIN (LOSS) ON DERIVATIVES RECOGNIZED | |
| | | Equity
Risk | |
| Futures contracts | | $ | 383,169 | |
| | |
| QS U.S. Small Capitalization Equity Fund 2020 Annual Report | | 43 |
Notes to financial statements (cont’d)
| | | | |
| CHANGE IN UNREALIZED APPRECIATION (DEPRECIATION) ON DERIVATIVES RECOGNIZED | |
| | | Equity Risk | |
| Futures contracts | | $ | 33,014 | |
During the year ended December 31, 2020, the volume of derivative activity for the Fund was as follows:
| | | | |
| | | Average
Market Value | |
| Futures contracts (to buy) | | $ | 394,186 | |
5. Class specific expenses, waivers and/or expense reimbursements
The Fund has adopted a Rule 12b-1 shareholder services and distribution plan and under that plan the Fund pays service and/or distribution fees with respect to its Class A, Class A2, Class C and Class FI shares calculated at the annual rate of 0.25%, 0.25%, 1.00% and 0.25% of the average daily net assets of each class, respectively. Service and/or distribution fees are accrued daily and paid monthly.
For the year ended December 31, 2020, class specific expenses were as follows:
| | | | | | | | |
| | | Service and/or
Distribution Fees | | | Transfer Agent
Fees | |
| Class A | | $ | 26,165 | | | $ | 14,275 | |
| Class A2 | | | 86,965 | | | | 131,313 | |
| Class C | | | 7,123 | | | | 1,136 | |
| Class FI | | | 138 | | | | 314 | |
| Class I | | | — | | | | 5,608 | |
| Class IS | | | — | | | | 388 | |
| Total | | $ | 120,391 | | | $ | 153,034 | |
For the year ended December 31, 2020, waivers and/or expense reimbursements by class were as follows:
| | | | |
| | | Waivers/Expense
Reimbursements | |
| Class A | | $ | 14,255 | |
| Class A2 | | | 47,372 | |
| Class C | | | 972 | |
| Class FI | | | 286 | |
| Class I | | | 5,172 | |
| Class IS | | | 144,552 | |
| Total | | $ | 212,609 | |
| | |
44 | | QS U.S. Small Capitalization Equity Fund 2020 Annual Report |
6. Distributions to shareholders by class
| | | | | | | | |
| | | Year Ended
December 31, 2020 | | | Year Ended
December 31, 2019 | |
| Net Investment Income: | | | | | | | | |
| Class A | | $ | 93,726 | | | $ | 26,157 | |
| Class A2 | | | 219,501 | | | | — | |
| Class C | | | — | | | | — | |
| Class FI | | | 111 | | | | 239 | |
| Class I | | | 35,243 | | | | 27,652 | |
| Class IS | | | 1,351,423 | | | | 695,956 | |
| Total | | $ | 1,700,004 | | | $ | 750,004 | |
| Net Realized Gains: | | | | | | | | |
| Class A | | $ | 321,647 | | | $ | 166,314 | |
| Class A2 | | | 1,144,525 | | | | 477,892 | |
| Class C | | | 18,812 | | | | 21,727 | |
| Class FI | | | 503 | | | | 1,852 | |
| Class I | | | 96,351 | | | | 99,536 | |
| Class IS | | | 3,249,451 | | | | 1,624,212 | |
| Total | | $ | 4,831,289 | | | $ | 2,391,533 | |
7. Shares of beneficial interest
At December 31, 2020, the Trust had an unlimited number of shares of beneficial interest authorized with a par value of $0.00001 per share. The Fund has the ability to issue multiple classes of shares. Each class of shares represents an identical interest and has the same rights, except that each class bears certain direct expenses, including those specifically related to the distribution of its shares.
Transactions in shares of each class were as follows:
| | | | | | | | | | | | | | | | |
| | | Year Ended
December 31, 2020 | | | Year Ended
December 31, 2019 | |
| | | Shares | | | Amount | | | Shares | | | Amount | |
| Class A | | | | | | | | | | | | | | | | |
| Shares sold | | | 9,419 | | | $ | 102,685 | | | | 231,080 | | | $ | 2,683,092 | |
| Shares issued on reinvestment | | | 32,125 | | | | 406,264 | | | | 16,245 | | | | 188,475 | |
| Shares repurchased | | | (197,288) | | | | (2,084,973) | | | | (323,687) | | | | (3,708,796) | |
| Net decrease | | | (155,744) | | | $ | (1,576,024) | | | | (76,362) | | | $ | (837,229) | |
| Class A2 | | | | | | | | | | | | | | | | |
| Shares sold | | | 482,912 | | | $ | 5,081,447 | | | | 534,922 | | | $ | 6,074,023 | |
| Shares issued on reinvestment | | | 109,268 | | | | 1,364,026 | | | | 42,216 | | | | 477,892 | |
| Shares repurchased | | | (708,546) | | | | (7,321,192) | | | | (570,033) | | | | (6,441,528) | |
| Net increase (decrease) | | | (116,366) | | | $ | (875,719) | | | | 7,105 | | | $ | 110,387 | |
| | |
| QS U.S. Small Capitalization Equity Fund 2020 Annual Report | | 45 |
Notes to financial statements (cont’d)
| | | | | | | | | | | | | | | | |
| | | Year Ended
December 31, 2020 | | | Year Ended
December 31, 2019 | |
| | | Shares | | | Amount | | | Shares | | | Amount | |
| Class C | | | | | | | | | | | | | | | | |
| Shares sold | | | 3,150 | | | $ | 30,507 | | | | 5,918 | | | $ | 62,116 | |
| Shares issued on reinvestment | | | 1,559 | | | | 18,760 | | | | 2,055 | | | | 21,663 | |
| Shares repurchased | | | (51,812) | | | | (500,007) | | | | (285,321) | | | | (3,033,180) | |
| Net decrease | | | (47,103) | | | $ | (450,740) | | | | (277,348) | | | $ | (2,949,401) | |
| Class FI | | | | | | | | | | | | | | | | |
| Shares sold | | | 802 | | | $ | 7,337 | | | | 3,147 | | | $ | 35,651 | |
| Shares issued on reinvestment | | | 52 | | | | 614 | | | | 190 | | | | 2,091 | |
| Shares repurchased | | | (12,285) | | | | (106,283) | | | | (1,396) | | | | (15,406) | |
| Net increase (decrease) | | | (11,431) | | | $ | (98,332) | | | | 1,941 | | | $ | 22,336 | |
| Class I | | | | | | | | | | | | | | | | |
| Shares sold | | | 53,108 | | | $ | 575,492 | | | | 62,541 | | | $ | 735,936 | |
| Shares issued on reinvestment | | | 10,010 | | | | 130,168 | | | | 10,575 | | | | 126,366 | |
| Shares repurchased | | | (126,302) | | | | (1,332,106) | | | | (726,284) | | | | (8,825,447) | |
| Net decrease | | | (63,184) | | | $ | (626,446) | | | | (653,168) | | | $ | (7,963,145) | |
| Class IS | | | | | | | | | | | | | | | | |
| Shares sold | | | 1,041,981 | | | $ | 10,037,845 | | | | 2,522,597 | | | $ | 29,350,186 | |
| Shares issued on reinvestment | | | 363,196 | | | | 4,600,874 | | | | 198,328 | | | | 2,320,168 | |
| Shares repurchased | | | (2,386,717) | | | | (26,147,309) | | | | (2,432,328) | | | | (28,251,207) | |
| Net increase (decrease) | | | (981,540) | | | $ | (11,508,590) | | | | 288,597 | | | $ | 3,419,147 | |
8. Income tax information and distributions to shareholders
The tax character of distributions paid during the fiscal years ended December 31, was as follows:
| | | | | | | | |
| | | 2020 | | | 2019 | |
| Distributions paid from: | | | | | | | | |
| Ordinary income | | $ | 1,700,004 | | | $ | 750,004 | |
| Net long-term capital gains | | | 4,831,289 | | | | 2,391,533 | |
| Total distributions paid | | $ | 6,531,293 | | | $ | 3,141,537 | |
| | |
46 | | QS U.S. Small Capitalization Equity Fund 2020 Annual Report |
As of December 31, 2020, the components of distributable earnings (loss) on a tax basis were as follows:
| | | | |
| Undistributed ordinary income — net | | $ | 237,548 | |
| Undistributed long-term capital gains — net | | | 2,287,178 | |
| Total undistributed earnings | | $ | 2,524,726 | |
| Other book/tax temporary differences(a) | | | (73,248) | |
| Unrealized appreciation (depreciation)(b) | | | 23,526,181 | |
| Total distributable earnings (loss) — net | | $ | 25,977,659 | |
| (a) | Other book/tax temporary differences are attributable to the realization for tax purposes of unrealized gains (losses) on certain futures contracts, book/tax differences in the treatment of distributions from real estate investment trusts and book/tax differences in the timing of the deductibility of various expenses. |
| (b) | The difference between book-basis and tax-basis unrealized appreciation (depreciation) is attributable to the tax deferral of losses on wash sales and the realization for tax purposes of unrealized gains on investments in passive foreign investment companies. |
9. Other matter
The outbreak of the respiratory illness COVID-19 (commonly referred to as “coronavirus”) has continued to rapidly spread around the world, causing considerable uncertainty for the global economy and financial markets. The ultimate economic fallout from the pandemic, and the long-term impact on economies, markets, industries and individual issuers, are not known. The COVID-19 pandemic could adversely affect the value and liquidity of the Fund’s investments, impair the Fund’s ability to satisfy redemption requests, and negatively impact the Fund’s performance. In addition, the outbreak of COVID-19, and measures taken to mitigate its effects, could result in disruptions to the services provided to the Fund by its service providers.
| | |
| QS U.S. Small Capitalization Equity Fund 2020 Annual Report | | 47 |
Report of independent registered public accounting firm
To the Board of Trustees of Legg Mason Global Asset Management Trust and Shareholders of QS U.S. Small Capitalization Equity Fund
Opinion on the Financial Statements
We have audited the accompanying statement of assets and liabilities, including the schedule of investments, of QS U.S. Small Capitalization Equity Fund (one of the funds constituting Legg Mason Global Asset Management Trust, referred to hereafter as the “Fund”) as of December 31, 2020, the related statement of operations for the year ended December 31, 2020, the statement of changes in net assets for each of the two years in the period ended December 31, 2020, including the related notes, and the financial highlights for each of the five years in the period ended December 31, 2020 (collectively referred to as the “financial statements”). In our opinion, the financial statements present fairly, in all material respects, the financial position of the Fund as of December 31, 2020, the results of its operations for the year then ended, the changes in its net assets for each of the two years in the period ended December 31, 2020 and the financial highlights for each of the five years in the period ended December 31, 2020 in conformity with accounting principles generally accepted in the United States of America.
Basis for Opinion
These financial statements are the responsibility of the Fund’s management. Our responsibility is to express an opinion on the Fund’s financial statements based on our audits. We are a public accounting firm registered with the Public Company Accounting Oversight Board (United States) (PCAOB) and are required to be independent with respect to the Fund in accordance with the U.S. federal securities laws and the applicable rules and regulations of the Securities and Exchange Commission and the PCAOB.
We conducted our audits of these financial statements in accordance with the standards of the PCAOB. Those standards require that we plan and perform the audit to obtain reasonable assurance about whether the financial statements are free of material misstatement, whether due to error or fraud.
Our audits included performing procedures to assess the risks of material misstatement of the financial statements, whether due to error or fraud, and performing procedures that respond to those risks. Such procedures included examining, on a test basis, evidence regarding the amounts and disclosures in the financial statements. Our audits also included evaluating the accounting principles used and significant estimates made by management, as well as evaluating the overall presentation of the financial statements. Our procedures included confirmation of securities owned as of December 31, 2020 by correspondence with the custodian and broker; when a reply was not received from the broker, we performed other auditing procedures. We believe that our audits provide a reasonable basis for our opinion.
/s/ PricewaterhouseCoopers LLP
Baltimore, Maryland
February 18, 2021
We have served as the auditor of one or more investment companies in the Franklin Templeton Group of Funds since 1948.
| | |
48 | | QS U.S. Small Capitalization Equity Fund 2020 Annual Report |
Additional shareholder information (unaudited)
Results of special meeting of shareholders
On July 14, 2020 a special meeting of shareholders was held for the following purposes: 1) to approve a new management agreement between the Fund and its investment manager; and 2) to approve a new subadvisory agreement with respect to each of the Fund’s subadvisers. The following table provides the number of votes cast for or against, as well as the number of abstentions and broker non-votes as to each matter voted on at the special meeting of shareholders. Each item voted on was approved.
| | | | | | | | | | | | | | | | |
| Item Voted On | | Voted For | | | Voted
Against | | | Abstentions | | | Broker
Non-Votes | |
| To Approve a New Management Agreement with Legg Mason Partners Fund Advisor, LLC | | | 76,799,680.013 | | | | 1,322,245.987 | | | | 7,437,940.047 | | | | 0 | |
| To Approve a New Subadvisory Agreement with QS Investors, LLC | | | 77,061,601.341 | | | | 956,854.596 | | | | 7,541,410.110 | | | | 0 | |
| To Approve a New Subadvisory Agreement with Western Asset Management Company, LLC | | | 76,659,488.062 | | | | 1,409,076.369 | | | | 7,491,301.616 | | | | 0 | |
| | |
| QS U.S. Small Capitalization Equity Fund | | 49 |
Statement regarding liquidity risk management program (unaudited)
As required by law, the fund has adopted and implemented a liquidity risk management program (the “Program”) that is designed to assess and manage liquidity risk. Liquidity risk is the risk that the fund could not meet requests to redeem its shares without significant dilution of remaining investors’ interests in the fund. Legg Mason Partners Fund Advisor, LLC (the “Manager”), the fund’s manager, is the administrator of the Program. The Manager has established a liquidity risk management committee (the “Committee”) to administer the Program on a day-to-day basis.
The Committee, on behalf of the Manager, provided the fund’s Board of Trustees with a report that addressed the operation of the Program, assessed its adequacy and effectiveness of implementation, including, if applicable, the operation of any highly liquid investment minimum (“HLIM”), and described any material changes that had been made to the Program or were recommended (the “Report”). The Report covered the period from December 1, 2018 through December 31, 2019 (the “Reporting Period”).
The Report confirmed that there were no material changes to the Program during the Reporting Period and that no changes were recommended.
The Report also confirmed that, throughout the Reporting Period, the Committee had monitored the fund’s portfolio liquidity and liquidity risk on an ongoing basis, as described in the Program and in Board reporting throughout the Reporting Period.
The Report discussed the Committee’s annual review of the Program, which addressed, among other things, the following elements of the Program:
Assessment, Management, and Periodic Review of Liquidity Risk. The Committee reviewed the fund’s investment strategy and liquidity of portfolio investments during both normal and reasonably foreseeable stressed conditions. The Committee noted that the fund’s investment strategy continues to be appropriate for an open-end fund, taking into account, among other things, whether and to what extent the fund held less liquid and illiquid assets and the extent to which any such investments affected the fund’s ability to meet redemption requests. In managing and reviewing the fund’s liquidity risk, the Committee also considered the extent to which the fund’s investment strategy involves a relatively concentrated portfolio or large positions in particular issuers, the extent to which the fund uses borrowing for investment purposes, and the extent to which the fund uses derivatives (including for hedging purposes). The Committee also reviewed the fund’s short-term and long-term cash flow projections during both normal and reasonably foreseeable stressed conditions. In assessing the fund’s cash flow projections, the Committee considered, among other factors, historical net redemption activity, redemption policies, ownership concentration, distribution channels, and the degree of certainty associated with the fund’s short-term and long-term cash flow projections. The Committee also considered the fund’s holdings of cash and cash equivalents, as well as borrowing arrangements and other
| | |
50 | | QS U.S. Small Capitalization Equity Fund |
funding sources, including, if applicable, the fund’s participation in a credit facility, as components of the fund’s ability to meet redemption requests.
Liquidity Classification. The Committee reviewed the Program’s liquidity classification methodology for categorizing the fund’s investments into one of four liquidity buckets. In reviewing the fund’s investments, the Committee considered, among other factors, whether trading varying portions of a position in a particular portfolio investment or asset class in sizes the fund would reasonably anticipate trading, would be reasonably expected to significantly affect liquidity.
Highly Liquid Investment Minimum. The Committee performed an analysis to determine whether the fund is required to maintain a Highly Liquid Investment Minimum, and determined that no such minimum is required because the fund primarily holds highly liquid investments.
Compliance with Limitation on Illiquid Investments. The Committee confirmed that during the Reporting Period, the fund did not acquire any illiquid investment such that, after the acquisition, the fund would have invested more than 15% of its assets in illiquid investments that are assets, in accordance with the Program and applicable SEC rules.
Redemptions in Kind. The Committee confirmed that no redemptions in-kind were effected by the fund during the Reporting Period.
The Report stated that the Committee concluded that the Program is reasonably designed and operated effectively to assess and manage the fund’s liquidity risk throughout the Reporting Period.
| | |
| QS U.S. Small Capitalization Equity Fund | | 51 |
Additional information (unaudited)
Information about Trustees and Officers
The business and affairs of QS U.S. Small Capitalization Equity Fund (the “Fund”) are conducted by management under the supervision and subject to the direction of its Board of Trustees. The business address of each Trustee is c/o Jane Trust, Legg Mason, 100 International Drive, 11th Floor, Baltimore, Maryland 21202. Information pertaining to the Trustees and officers of the Fund is set forth below.
The Statement of Additional Information includes additional information about Trustees and is available, without charge, upon request by calling the Fund at 1-877-721-1926.
| | |
| Independent Trustees† |
| |
| Ruby P. Hearn | | |
| |
| Year of birth | | 1940 |
| Position(s) with Trust | | Trustee |
| Term of office1 and length of time served2 | | Since 2004 |
| Principal occupation(s) during the past five years | | Senior Vice President Emerita of The Robert Wood Johnson Foundation (non-profit) (since 2001); Member of the National Academy of Medicine (formerly known as the Institute of Medicine) (since 1982); formerly, Trustee of the New York Academy of Medicine (2004 to 2011); Director of the Institute for Healthcare Improvement (2002 to 2011); Senior Vice President of The Robert Wood Johnson Foundation (1996 to 2001); Fellow of The Yale Corporation (1992 to 1998) |
| Number of funds in fund complex overseen by Trustee | | 20 |
| Other board memberships held by Trustee during the past five years | | None |
| |
| Arnold L. Lehman | | |
| Year of birth | | 1944 |
| Position(s) with Trust | | Trustee and Chairman |
| Term of office1 and length of time served2 | | Since 1982 and since 2015 |
| Principal occupation(s) during the past five years | | Senior Advisor, Phillips (auction house) (since 2015); formerly, Fellow, Ford Foundation (2015 to 2016); Director of the Brooklyn Museum (1997 to 2015) |
| Number of funds in fund complex overseen by Trustee | | 20 |
| Other board memberships held by Trustee during the past five years | | Trustee of American Federation of Arts (since 2002) |
| | |
52 | | QS U.S. Small Capitalization Equity Fund |
| | |
| Independent Trustees† (cont’d) |
| |
| Robin J.W. Masters | | |
| |
| Year of birth | | 1955 |
| |
| Position(s) with Trust | | Trustee |
| |
| Term of office1 and length of time served2 | | Since 2002 |
| |
| Principal occupation(s) during the past five years | | Retired; formerly, Chief Investment Officer of ACE Limited (insurance) (1986 to 2000) |
| |
| Number of funds in fund complex overseen by Trustee | | 20 |
| |
| Other board memberships held by Trustee during the past five years | | Director of HSBC Managed Portfolios Limited, HSBC Corporate Money Funds Limited and HSBC Specialist Funds Limited (since 2020); formerly, Director of Cheyne Capital International Limited (investment advisory firm) (2005 to 2020); Director/ Trustee of Legg Mason Institutional Funds plc, Western Asset Fixed Income Funds plc and Western Asset Debt Securities Fund plc. (2007 to 2011) |
| |
| Jill E. McGovern | | |
| Year of birth | | 1944 |
| Position(s) with Trust | | Trustee |
| Term of office1 and length of time served2 | | Since 1989 |
| Principal occupation(s) during the past five years | | Senior Consultant, American Institute for Contemporary German Studies (AICGS) (since 2007); formerly, Chief Executive Officer of The Marrow Foundation (non-profit) (1993 to 2007); Executive Director of the Baltimore International Festival (1991 to 1993); Senior Assistant to the President of The Johns Hopkins University (1986 to 1990) |
| Number of funds in fund complex overseen by Trustee | | 20 |
| Other board memberships held by Trustee during the past five years | | Director of International Biomedical Research Alliance (2002 to 2010); Director of Lois Roth Endowment (2005 to 2012) |
| |
| Arthur S. Mehlman | | |
| Year of birth | | 1942 |
| Position(s) with Trust | | Trustee |
| Term of office1 and length of time served2 | | Since 2002 |
| Principal occupation(s) during the past five years | | Retired. Director, The University of Maryland Foundation (since 1992); formerly, Director, The League for People with Disabilities (2003 to 2017); Director, Municipal Mortgage & Equity LLC (2004 to 2011); Partner (1972 to 2002), Partner-in-Charge of the Audit Practice for Baltimore and Washington offices (1998 to 2001), and Managing Partner of the Baltimore office (1992 to 1995) at KPMG LLP (international accounting firm) |
| Number of funds in fund complex overseen by Trustee | | Trustee of all Legg Mason Funds consisting of 20 portfolios; Director/Trustee of the Royce Family of Funds consisting of 22 portfolios |
| Other board memberships held by Trustee during the past five years | | Director of Municipal Mortgage & Equity, LLC. (2004 to 2011) |
| | |
| QS U.S. Small Capitalization Equity Fund | | 53 |
Additional information (unaudited) (cont’d)
Information about Trustees and Officers
| | |
| Independent Trustees† (cont’d) |
| |
| G. Peter O’Brien | | |
| |
| Year of birth | | 1945 |
| Position(s) with Trust | | Trustee |
| Term of office1 and length of time served2 | | Since 1999 |
| Principal occupation(s) during the past five years | | Retired. Trustee Emeritus of Colgate University (since 2005); Board Member, Hill House, Inc. (residential home care) (since 1999); formerly, Board Member, Bridges School (pre-school) (2006 to 2017); Managing Director, Equity Capital Markets Group of Merrill Lynch & Co. (1971 to 1999) |
| Number of funds in fund complex overseen by Trustee | | Trustee of all Legg Mason funds consisting of 20 portfolios; Director/Trustee of the Royce Family of Funds consisting of 22 portfolios |
| Other board memberships held by Trustee during the past five years | | Director of TICC Capital Corp. (2003 to 2017) |
| |
| S. Ford Rowan | | |
| Year of birth | | 1943 |
| Position(s) with Trust | | Trustee |
| Term of office1 and length of time served2 | | Since 2002 |
| Principal occupation(s) during the past five years | | Consultant to University of Maryland University College (since 2013); formerly, Chairman, National Center for Critical Incident Analysis (2004 to 2018); Lecturer in Organizational Sciences, George Washington University (2000 to 2014); Trustee, St. John’s College (2006 to 2012); Consultant, Rowan & Blewitt Inc. (management consulting) (1984 to 2007); Lecturer in Journalism, Northwestern University (1980 to 1993); Director, Santa Fe Institute (1999 to 2008) |
| Number of funds in fund complex overseen by Trustee | | 20 |
| Other board memberships held by Trustee during the past five years | | None |
| | |
54 | | QS U.S. Small Capitalization Equity Fund |
| | |
| Independent Trustees† (cont’d) |
| |
| Robert M. Tarola | | |
| |
| Year of birth | | 1950 |
| Position(s) with Trust | | Trustee |
| Term of office1 and length of time served2 | | Since 2004 |
| Principal occupation(s) during the past five years | | President of Rights Advisory LLC (corporate finance and governance consulting) (since 2008); Member, Investor Advisory Group of the Public Company Accounting Oversight Board (since 2009); formerly, Chief Financial Officer, Little Company of Mary Hospital and Health Care Centers (healthcare provider network) (2018); Executive Vice President and Chief Financial Officer, Southcoast Health System, Inc. (healthcare provider network) (2015 to 2017); Senior Vice President and Chief Financial Officer of The Howard University (higher education and health care) (2009 to 2013); Senior Vice President and Chief Financial Officer of W.R. Grace & Co. (specialty chemicals) (1999 to 2008); Chief Financial Officer of MedStar Health, Inc. (healthcare) (1996 to 1999); Partner, PriceWaterhouse, LLP (accounting and auditing) (1984 to 1996) |
| Number of funds in fund complex overseen by Trustee | | 20 |
| Other board memberships held by Trustee during the past five years | | Director of American Kidney Fund (renal disease assistance) (since 2008); Director and Board Chair of XBRL International, Inc. (global data standard setting) (since 2015); Director of Vista Outdoor, Inc. (consumer recreation products) (since 2015); formerly, Director of TeleTech Holdings, Inc. (business processing outsourcing) (2008 to 2018) |
| Interested Trustee and Officer |
| |
| Jane Trust, CFA3 | | |
| Year of birth | | 1962 |
| Position(s) with Trust | | Trustee, President and Chief Executive Officer |
| Term of office1 and length of time served2 | | Since 2015 |
| Principal occupation(s) during the past five years | | Senior Vice President, Fund Board Management, Franklin Templeton (since 2020); Officer and/or Trustee/Director of 147 funds associated with Legg Mason Partners Fund Advisor, LLC (“LMPFA”) or its affiliates (since 2015); President and Chief Executive Officer of LMPFA (since 2015); formerly, Senior Managing Director (2018 to 2020) and Managing Director (2016 to 2018) of Legg Mason & Co., LLC (“Legg Mason & Co.”); Senior Vice President of LMPFA (2015) |
| Number of funds in fund complex overseen by Trustee | | 145 |
| Other board memberships held by Trustee during the past five years | | None |
| | |
| QS U.S. Small Capitalization Equity Fund | | 55 |
Additional information (unaudited) (cont’d)
Information about Trustees and Officers
| | |
| Additional Officers |
| |
Christopher Berarducci
Franklin Templeton
620 Eighth Avenue, 47th Floor, New York, NY 10018 | | |
| |
| Year of birth | | 1974 |
| Position(s) with Trust | | Treasurer and Principal Financial Officer |
| Term of office1 and length of time served2 | | Since 2010 and 2019 |
| Principal occupation(s) during the past five years | | Vice President, Fund Administration and Reporting, Franklin Templeton (since 2020); Treasurer (since 2010) and Principal Financial Officer (since 2019) of certain funds associated with Legg Mason & Co. or its affiliates; formerly, Managing Director (2020), Director (2015 to 2020), and Vice President (2011 to 2015) of Legg Mason & Co. |
| |
Marc A. De Oliveira*
Franklin Templeton
100 First Stamford Place, 6th Floor, Stamford, CT 06902 | | |
| |
| Year of birth | | 1971 |
| Position(s) with Trust | | Secretary and Chief Legal Officer |
| Term of office1 and length of time served2 | | Since 2020 |
| Principal occupation(s) during the past five years | | Associate General Counsel of Franklin Templeton (since 2020); Assistant Secretary of certain funds associated with Legg Mason & Co. or its affiliates (since 2006); formerly, Managing Director (2016 to 2020) and Associate General Counsel of Legg Mason & Co. (2005 to 2020) |
| |
Thomas C. Mandia
Franklin Templeton
100 First Stamford Place, 6th Floor, Stamford, CT 06902 | | |
| |
| Year of birth | | 1962 |
| Position(s) with Trust | | Senior Vice President |
| Term of office1 and length of time served2 | | Since 2020 |
| Principal occupation(s) during the past five years | | Senior Associate General Counsel of Franklin Templeton (since 2020); Secretary of LMPFA (since 2006); Assistant Secretary of certain funds associated with Legg Mason & Co. or its affiliates (since 2006); Secretary of LM Asset Services, LLC (“LMAS”) (since 2002) and Legg Mason Fund Asset Management, Inc. (“LMFAM”) (since 2013) (formerly registered investment advisers); formerly, Managing Director and Deputy General Counsel of Legg Mason & Co. (2005 to 2020) |
| | |
56 | | QS U.S. Small Capitalization Equity Fund |
| | |
| Additional Officers (cont’d) |
| |
Ted P. Becker
Franklin Templeton
620 Eighth Avenue, 47th Floor, New York, NY 10018 | | |
| |
| Year of birth | | 1951 |
| Position(s) with Trust | | Chief Compliance Officer |
| Term of office1 and length of time served2 | | Since 2007 |
| Principal occupation(s) during the past five years | | Vice President, Global Compliance of Franklin Templeton (since 2020); Chief Compliance Officer of LMPFA (since 2006); Chief Compliance Officer of certain funds associated with Legg Mason & Co. or its affiliates (since 2006); formerly, Director of Global Compliance at Legg Mason, Inc. (2006 to 2020); Managing Director of Compliance of Legg Mason & Co. (2005 to 2020) |
| |
Susan Kerr
Franklin Templeton
620 Eighth Avenue, 47th Floor, New York, NY 10018 | | |
| |
| Year of birth | | 1949 |
| Position(s) with Trust | | Chief Anti-Money Laundering Compliance Officer |
| Term of office1 and length of time served2 | | Since 2013 |
| Principal occupation(s) during the past five years | | Senior Compliance Analyst, Franklin Templeton (since 2020); Chief Anti-Money Laundering Compliance Officer of certain funds associated with Legg Mason & Co. or its affiliates (since 2013) and Anti-Money Laundering Compliance Officer (since 2012), Senior Compliance Officer (since 2011) and Assistant Vice President (since 2010) of Legg Mason Investor Services, LLC (“LMIS”); formerly, Assistant Vice President of Legg Mason & Co. (2010 to 2020) |
| |
Jenna Bailey
Franklin Templeton
100 First Stamford Place, 5th Floor, Stamford, CT 06902 | | |
| |
| Year of birth | | 1978 |
| Position(s) with Trust | | Identity Theft Prevention Officer |
| Term of office1 and length of time served2 | | Since 2015 |
| Principal occupation(s) during the past five years | | Senior Compliance Analyst of Franklin Templeton (since 2020); Identity Theft Prevention Officer of certain funds associated with Legg Mason & Co. or its affiliates (since 2015); formerly, Compliance Officer of Legg Mason & Co. (2013 to 2020); Assistant Vice President of Legg Mason & Co. (2011 to 2020) |
| | |
| QS U.S. Small Capitalization Equity Fund | | 57 |
Additional information (unaudited) (cont’d)
Information about Trustees and Officers
| | |
| Additional Officers (cont’d) | | |
| |
Jeanne M. Kelly
Franklin Templeton
620 Eighth Avenue, 47th Floor, New York, NY 10018 | | |
| |
| Year of birth | | 1951 |
| Position(s) with Trust | | Senior Vice President |
| Term of office1 and length of time served2 | | Since 2007 |
| Principal occupation(s) during the past five years | | U.S. Fund Board Team Manager, Franklin Templeton (since 2020); Senior Vice President of certain funds associated with Legg Mason & Co. or its affiliates (since 2007); Senior Vice President of LMPFA (since 2006); President and Chief Executive Officer of LMAS and LMFAM (since 2015); formerly, Managing Director of Legg Mason & Co. (2005 to 2020); Senior Vice President of LMFAM (2013 to 2015) |
| † | Trustees who are not “interested persons” of the Fund within the meaning of Section 2(a)(19) of the Investment Company Act of 1940, as amended (the “1940 Act”). Each of the Independent Trustees serves on the standing committees of the Board of Trustees, which include the Audit Committee (chair: Arthur S. Mehlman), the Nominating Committee (co-chairs: G. Peter O’Brien and Jill E. McGovern), and the Independent Trustees Committee (chair: Arnold L. Lehman). |
| * | Effective September 10, 2020, Mr. De Oliveira became Secretary and Chief Legal Officer. |
| 1 | Each Trustee and officer serves until his or her respective successor has been duly elected and qualified or until his or her earlier death, resignation, retirement or removal. |
| 2 | Indicates the earliest year in which the Trustee became a board member for a fund in the Legg Mason fund complex or the officer took such office. |
| 3 | Ms. Trust is an “interested person” of the Fund, as defined in the 1940 Act, because of her position with LMPFA and/or certain of its affiliates. |
| | |
58 | | QS U.S. Small Capitalization Equity Fund |
Important tax information (unaudited)
The following information is provided with respect to the distributions paid during the taxable year ended December 31, 2020:
| | | | | | | | |
| Record date: | | | 6/17/2020 | | | | 12/21/2020 | |
| Payable date: | | | 6/18/2020 | | | | 12/22/2020 | |
| Ordinary Income: | | | | | | | | |
Qualified Dividend Income for Individuals | | | 100.00 | % | | | 100.00 | % |
Dividends Qualifying for the Dividends Received Deduction for Corporations | | | 100.00 | % | | | 100.00 | % |
| Long-Term Capital Gain Dividend | | | — | | | | $0.356670 | |
| | |
| QS U.S. Small Capitalization Equity Fund | | 59 |
QS
U.S. Small Capitalization Equity Fund
Trustees
Ruby P. Hearn
Arnold L. Lehman
Chairman
Robin J.W. Masters
Jill E. McGovern
Arthur S. Mehlman
G. Peter O’Brien
S. Ford Rowan
Robert M. Tarola
Jane Trust
Investment manager
Legg Mason Partners Fund Advisor, LLC
Subadviser
QS Investors, LLC
Distributor
Legg Mason Investor Services, LLC
Custodian
The Bank of New York Mellon
Transfer agent
BNY Mellon Investment Servicing (US) Inc.
4400 Computer Drive
Westborough, MA 01581
Independent registered public accounting firm
PricewaterhouseCoopers LLP
Baltimore, MD
QS U.S. Small Capitalization Equity Fund
The Fund is a separate investment series of Legg Mason Global Asset Management Trust, a Maryland statutory trust.
QS U.S. Small Capitalization Equity Fund
Legg Mason Funds
620 Eighth Avenue, 47th Floor
New York, NY 10018
The Fund files its complete schedule of portfolio holdings with the Securities and Exchange Commission (“SEC”) for the first and third quarters of each fiscal year as an exhibit to its reports on Form N-PORT. The Fund’s Forms N-PORT are available on the SEC’s website at www.sec.gov. To obtain information on Form N-PORT, shareholders can call the Fund at 1-877-721-1926.
Information on how the Fund voted proxies relating to portfolio securities during the prior 12-month period ended June 30th of each year and a description of the policies and procedures that the Fund uses to determine how to vote proxies related to portfolio transactions are available (1) without charge, upon request, by calling the Fund at 1-877-721-1926, (2) at www.leggmason.com/mutualfunds and (3) on the SEC’s website at www.sec.gov.
This report is submitted for the general information of the shareholders of QS U.S. Small Capitalization Equity Fund. This report is not authorized for distribution to prospective investors in the Fund unless preceded or accompanied by a current prospectus.
Investors should consider the Fund’s investment objectives, risks, charges and expenses carefully before investing. The prospectus contains this and other important information about the Fund. Please read the prospectus carefully before investing.
www.leggmason.com
© 2021 Legg Mason Investor Services, LLC
Member FINRA, SIPC
Legg Mason Funds Privacy and Security Notice
Your Privacy and the Security of Your Personal Information is Very Important to the Legg Mason Funds
This Privacy and Security Notice (the “Privacy Notice”) addresses the Legg Mason Funds’ privacy and data protection practices with respect to nonpublic personal information the Funds receive. The Legg Mason Funds include any funds sold by the Funds’ distributor, Legg Mason Investor Services, LLC, as well as Legg Mason-sponsored closed-end funds. The provisions of this Privacy Notice apply to your information both while you are a shareholder and after you are no longer invested with the Funds.
The Type of Nonpublic Personal Information the Funds Collect About You
The Funds collect and maintain nonpublic personal information about you in connection with your shareholder account. Such information may include, but is not limited to:
| • | | Personal information included on applications or other forms; |
| • | | Account balances, transactions, and mutual fund holdings and positions; |
| • | | Bank account information, legal documents, and identity verification documentation; |
| • | | Online account access user IDs, passwords, security challenge question responses; and |
| • | | Information received from consumer reporting agencies regarding credit history and creditworthiness (such as the amount of an individual’s total debt, payment history, etc.). |
How the Funds Use Nonpublic Personal Information About You
The Funds do not sell or share your nonpublic personal information with third parties or with affiliates for their marketing purposes, or with other financial institutions or affiliates for joint marketing purposes, unless you have authorized the Funds to do so. The Funds do not disclose any nonpublic personal information about you except as may be required to perform transactions or services you have authorized or as permitted or required by law.
The Funds may disclose information about you to:
| • | | Employees, agents, and affiliates on a “need to know” basis to enable the Funds to conduct ordinary business, or to comply with obligations to government regulators; |
| • | | Service providers, including the Funds’ affiliates, who assist the Funds as part of the ordinary course of business (such as printing, mailing services, or processing or servicing your account with us) or otherwise perform services on the Funds’ behalf, including companies that may perform statistical analysis, market research and marketing services solely for the Funds; |
| • | | Permit access to transfer, whether in the United States or countries outside of the United States to such Funds’ employees, agents and affiliates and service providers as required to enable the Funds to conduct ordinary business, or to comply with obligations to government regulators; |
| • | | The Funds’ representatives such as legal counsel, accountants and auditors to enable the Funds to conduct ordinary business, or to comply with obligations to government regulators; |
| • | | Fiduciaries or representatives acting on your behalf, such as an IRA custodian or trustee of a grantor trust. |
|
| NOT PART OF THE ANNUAL REPORT |
Legg Mason Funds Privacy and Security Notice (cont’d)
Except as otherwise permitted by applicable law, companies acting on the Funds’ behalf, including those outside the United States, are contractually obligated to keep nonpublic personal information the Funds provide to them confidential and to use the information the Funds share only to provide the services the Funds ask them to perform. The Funds may disclose nonpublic personal information about you when necessary to enforce their rights or protect against fraud, or as permitted or required by applicable law, such as in connection with a law enforcement or regulatory request, subpoena, or similar legal process. In the event of a corporate action or in the event a Fund service provider changes, the Funds may be required to disclose your nonpublic personal information to third parties. While it is the Funds’ practice to obtain protections for disclosed information in these types of transactions, the Funds cannot guarantee their privacy policy will remain unchanged.
Keeping You Informed of the Funds’ Privacy and Security Practices
The Funds will notify you annually of their privacy policy as required by federal law. While the Funds reserve the right to modify this policy at any time they will notify you promptly if this privacy policy changes.
The Funds’ Security Practices
The Funds maintain appropriate physical, electronic and procedural safeguards designed to guard your nonpublic personal information. The Funds’ internal data security policies restrict access to your nonpublic personal information to authorized employees, who may use your nonpublic personal information for Fund business purposes only.
Although the Funds strive to protect your nonpublic personal information, they cannot ensure or warrant the security of any information you provide or transmit to them, and you do so at your own risk. In the event of a breach of the confidentiality or security of your nonpublic personal information, the Funds will attempt to notify you as necessary, so you can take appropriate protective steps. If you have consented to the Funds using electronic communications or electronic delivery of statements, they may notify you under such circumstances using the most current email address you have on record with them.
In order for the Funds to provide effective service to you, keeping your account information accurate is very important. If you believe that your account information is incomplete, not accurate or not current, if you have questions about the Funds’ privacy practices, or our use of your nonpublic personal information, write the Funds using the contact information on your account statements, email the Funds by clicking on the Contact Us section of the Funds’ website at www.leggmason.com, or contact the Fund at 1-877-721-1926.
Revised April 2018
Legg Mason California Consumer Privacy Act Policy
Although much of the personal information we collect is “nonpublic personal information” subject to federal law, residents of California may, in certain circumstances, have additional rights under the California Consumer Privacy Act (“CCPA”). For example, if you are a broker,
|
| NOT PART OF THE ANNUAL REPORT |
Legg Mason Funds Privacy and Security Notice (cont’d)
dealer, agent, fiduciary, or representative acting by or on behalf of, or for, the account of any other person(s) or household, or a financial advisor, or if you have otherwise provided personal information to us separate from the relationship we have with personal investors, the provisions of this Privacy Policy apply to your personal information (as defined by the CCPA).
| • | | In addition to the provisions of the Legg Mason Funds Security and Privacy Notice, you may have the right to know the categories and specific pieces of personal information we have collected about you. |
| • | | You also have the right to request the deletion of the personal information collected or maintained by the Funds. |
If you wish to exercise any of the rights you have in respect of your personal information, you should advise the Funds by contacting them as set forth below. The rights noted above are subject to our other legal and regulatory obligations and any exemptions under the CCPA. You may designate an authorized agent to make a rights request on your behalf, subject to the identification process described below. We do not discriminate based on requests for information related to our use of your personal information, and you have the right not to receive discriminatory treatment related to the exercise of your privacy rights.
We may request information from you in order to verify your identity or authority in making such a request. If you have appointed an authorized agent to make a request on your behalf, or you are an authorized agent making such a request (such as a power of attorney or other written permission), this process may include providing a password/passcode, a copy of government issued identification, affidavit or other applicable documentation, i.e. written permission. We may require you to verify your identity directly even when using an authorized agent, unless a power of attorney has been provided. We reserve the right to deny a request submitted by an agent if suitable and appropriate proof is not provided.
For the 12-month period prior to the date of this Privacy Policy, the Legg Mason Funds have not sold any of your personal information; nor do we have any plans to do so in the future.
Contact Information
Address: Data Privacy Officer, 100 International Dr., Baltimore, MD 21202
Email: DataProtectionOfficer@franklintempleton.com
Phone: 1-800-396-4748
Revised October 2020
|
| NOT PART OF THE ANNUAL REPORT |
www.leggmason.com
© 2021 Legg Mason Investor Services, LLC Member FINRA, SIPC
LMFX013159 2/21 SR21-4080
The registrant has adopted a code of ethics that applies to the registrant’s principal executive officer, principal financial officer, principal accounting officer or controller.
| ITEM 3. | AUDIT COMMITTEE FINANCIAL EXPERT. |
The Board of Trustees of the registrant has determined that Arthur S. Mehlman the Chairman of the Board’s Audit Committee and Robert M. Tarola, possess the technical attributes identified in Instruction 2(b) of Item 3 to Form N-CSR to qualify as “audit committee financial experts,” and have designated Mr. Mehlman and Mr. Tarola as the Audit Committee’s financial experts. Mr. Mehlman and Mr. Tarola are “independent” Trustees pursuant to paragraph (a) (2) of Item 3 to Form N-CSR.
| ITEM 4. | PRINCIPAL ACCOUNTANT FEES AND SERVICES. |
a) Audit Fees. The aggregate fees billed in the last two fiscal years ending December 31, 2019 and December 31, 2020 (the “Reporting Periods”) for professional services rendered by the Registrant’s principal accountant (the “Auditor”) for the audit of the Registrant’s annual financial statements, or services that are normally provided by the Auditor in connection with the statutory and regulatory filings or engagements for the Reporting Periods, were $211,015 in December 31, 2019 and $229,436 in December 31, 2020.
b) Audit-Related Fees. The aggregate fees billed in the Reporting Period for assurance and related services by the Auditor that are reasonably related to the performance of the Registrant’s financial statements were $0 in December 31, 2019 and $0 in December 31, 2020.
(c) Tax Fees. The aggregate fees billed in the Reporting Periods for professional services rendered by the Auditor for tax compliance, tax advice and tax planning (“Tax Services”) were $0 in December 31, 2019 and $0 in December 31, 2020. These services consisted of (i) review or preparation of U.S. federal, state, local and excise tax returns; (ii) U.S. federal, state and local tax planning, advice and assistance regarding statutory, regulatory or administrative developments, and (iii) tax advice regarding tax qualification matters and/or treatment of various financial instruments held or proposed to be acquired or held.
There were no fees billed for tax services by to the service affiliates during the Reporting Periods that required pre-approval by the Audit Auditors Committee.
d) All Other Fees. The aggregate fees for other fees billed in the Reporting Periods for products and services provided by the Auditor were $0 in December 31, 2019 and $0 in December 31, 2020, other than the services reported in paragraphs (a) through (c) of this item for the Legg Mason Global Asset Management Trust.
All Other Fees. There were no other non-audit services rendered by the Auditor to Legg Mason Partners Fund Advisors, LLC (“LMPFA”), and any entity controlling, controlled by or under common control with LMPFA that provided ongoing services to Legg Mason Global Asset Management Trust requiring pre-approval by the Audit Committee in the Reporting Period.
(e) Audit Committee’s pre–approval policies and procedures described in paragraph (c)
(7) of Rule 2-01 of Regulation S-X.
(1) The Charter for the Audit Committee (the “Committee”) of the Board of each registered investment company (the “Fund”) advised by LMPFA or one of their affiliates (each, an “Adviser”) requires that the Committee shall approve (a) all audit and permissible non-audit services to be provided to the Fund and (b) all permissible non-audit services to be provided by the Fund’s independent auditors to the Adviser and any Covered Service Providers if the engagement relates directly to the operations and financial reporting of the Fund. The Committee may implement policies and procedures by which such services are approved other than by the full Committee.
The Committee shall not approve non-audit services that the Committee believes may impair the independence of the auditors. As of the date of the approval of this Audit Committee Charter, permissible non-audit services include any professional services (including tax services), that are not prohibited services as described below, provided to the Fund by the independent auditors, other than those provided to the Fund in connection with an audit or a review of the financial statements of the Fund. Permissible non-audit services may not include: (i) bookkeeping or other services related to the accounting records or financial statements of the Fund; (ii) financial information systems design and implementation; (iii) appraisal or valuation services, fairness opinions or contribution-in-kind reports; (iv) actuarial services; (v) internal audit outsourcing services; (vi) management functions or human resources; (vii) broker or dealer, investment adviser or investment banking services; (viii) legal services and expert services unrelated to the audit; and (ix) any other service the Public Company Accounting Oversight Board determines, by regulation, is impermissible.
Pre-approval by the Committee of any permissible non-audit services is not required so long as: (i) the aggregate amount of all such permissible non-audit services provided to the Fund, the Adviser and any service providers controlling, controlled by or under common control with the Adviser that provide ongoing services to the Fund (“Covered Service Providers”) constitutes not more than 5% of the total amount of revenues paid to the independent auditors during the fiscal year in which the permissible non-audit services are provided to (a) the Fund, (b) the Adviser and (c) any entity controlling, controlled by or under common control with the Adviser that provides ongoing services to the Fund during the fiscal year in which the services are provided that would have to be approved by the Committee; (ii) the permissible non-audit services were not recognized by the Fund at the time of the engagement to be non-audit services; and (iii) such services are promptly brought to the attention of the Committee and approved by the Committee (or its delegate(s)) prior to the completion of the audit.
(2) For the Legg Mason Global Asset Management Trust, the percentage of fees that were approved by the audit committee, with respect to: Audit-Related Fees were 100% and 100% for December 31, 2019 and December 31, 2020; Tax Fees were 100% and 100% for December 31, 2019 and December 31, 2020; and Other Fees were 100% and 100% for December 31, 2019 and December 31, 2020.
(f) N/A
(g) Non-audit fees billed by the Auditor for services rendered to Legg Mason Global Asset Management Trust, LMPFA and any entity controlling, controlled by, or under common control with LMPFA that provides ongoing services to Legg Mason Global Asset Management Trust during the reporting period were $657,336 in December 31, 2019 and $691,380 in December 31, 2020.
(h) Yes. Legg Mason Global Asset Management Trust’s Audit Committee has considered whether the provision of non-audit services that were rendered to Service Affiliates, which were not pre-approved (not requiring pre-approval), is compatible with maintaining the Accountant’s independence. All services provided by the Auditor to the Legg Mason Global Asset Management Trust or to Service Affiliates, which were required to be pre-approved, were pre-approved as required.
| ITEM 5. | AUDIT COMMITTEE OF LISTED REGISTRANTS. |
| | a) | The independent board members are acting as the registrant’s audit committee as specified in Section 3(a)(58)(B) of the Exchange Act. The Audit Committee consists of the following Board members: |
Ruby P. Hearn
Arnold L. Lehman
Robin J.W. Masters
Jill E. McGovern
Arthur S. Mehlman
G. Peter O’Brien
S. Ford Rowan
Robert M. Tarola
| ITEM 6. | SCHEDULE OF INVESTMENTS. |
Included herein under Item 1.
| ITEM 7. | DISCLOSURE OF PROXY VOTING POLICIES AND PROCEDURES FOR CLOSED-END MANAGEMENT INVESTMENT COMPANIES. |
Not applicable.
| ITEM 8. | PORTFOLIO MANAGERS OF CLOSED-END MANAGEMENT INVESTMENT COMPANIES. |
Not applicable.
| ITEM 9. | PURCHASES OF EQUITY SECURITIES BY CLOSED-END MANAGEMENT INVESTMENT COMPANY AND AFFILIATED PURCHASERS. |
Not applicable.
| ITEM 10. | SUBMISSION OF MATTERS TO A VOTE OF SECURITY HOLDERS. |
Not applicable.
| ITEM 11. | CONTROLS AND PROCEDURES. |
| | (a) | The registrant’s principal executive officer and principal financial officer have concluded that the registrant’s disclosure controls and procedures (as defined in Rule 30a- 3(c) under the Investment Company Act of 1940, as amended (the “1940 Act”)) are effective as of a date within 90 days of the filing date of this report that includes the disclosure required by this paragraph, based on their evaluation of the disclosure controls and procedures required by Rule 30a-3(b) under the 1940 Act and 15d-15(b) under the Securities Exchange Act of 1934. |
| | (b) | There were no changes in the registrant’s internal control over financial reporting (as defined in Rule 30a-3(d) under the 1940 Act) that occurred during the second fiscal quarter of the period covered by this report that have materially affected, or are likely to materially affect the registrant’s internal control over financial reporting. |
| ITEM 12. | DISCLOSURE OF SECURITIES LENDING ACTIVITIES FOR CLOSED-END MANAGEMENT INVESTMENT COMPANIES. |
Not applicable.
(a) (1) Code of Ethics attached hereto.
Exhibit 99.CODE ETH
(a) (2) Certifications pursuant to section 302 of the Sarbanes-Oxley Act of 2002 attached hereto.
Exhibit 99.CERT
(b) Certifications pursuant to Section 906 of the Sarbanes-Oxley Act of 2002 attached hereto.
Exhibit 99.906CERT
SIGNATURES
Pursuant to the requirements of the Securities Exchange Act of 1934 and the Investment Company Act of 1940, the registrant has duly caused this Report to be signed on its behalf by the undersigned, there unto duly authorized.
Legg Mason Global Asset Management Trust
| | |
| By: | | /s/ Jane Trust |
| | Jane Trust |
| | Chief Executive Officer |
| |
| Date: | | February 24, 2021 |
Pursuant to the requirements of the Securities Exchange Act of 1934 and the Investment Company Act of 1940, this report has been signed below by the following persons on behalf of the registrant and in the capacities and on the dates indicated.
| | |
| By: | | /s/ Jane Trust |
| | Jane Trust |
| | Chief Executive Officer |
| |
Date: | | February 24, 2021 |
| |
| By: | | /s/ Christopher Berarducci |
| | Christopher Berarducci |
| | Principal Financial Officer |
| |
Date: | | February 24, 2021 |