UNITED STATES
SECURITIES AND EXCHANGE COMMISSION
Washington, D.C. 20549
FORM N-CSR
CERTIFIED SHAREHOLDER REPORT OF REGISTERED
MANAGEMENT INVESTMENT COMPANIES
Investment Company Act file number 811-22338
Legg Mason Global Asset Management Trust
(Exact name of registrant as specified in charter)
620 Eighth Avenue, 47th Floor, New York, NY 10018
(Address of principal executive offices) (Zip code)
Marc A. De Oliveira
Franklin Templeton
100 First Stamford Place
Stamford, CT 06902
(Name and address of agent for service)
Registrant’s telephone number, including area code: 1-877-721-1926
Date of fiscal year end: October 31
Date of reporting period: October 31, 2021
| ITEM 1. | REPORT TO STOCKHOLDERS |
The Annual Report to Stockholders is filed herewith.

| | |
| Annual Report | | October 31, 2021 |
CLEARBRIDGE
INTERNATIONAL GROWTH FUND
The Fund intends to no longer mail paper copies of the Fund’s shareholder reports like this one, unless you specifically request paper copies of the reports from the Fund or from your Service Agent or financial intermediary (such as a broker-dealer or bank). Instead, the reports will be made available on a website, and you will be notified by mail each time a report is posted and provided with a website link to access the report.
If you already elected to receive shareholder reports electronically (“e-delivery”), you will not be affected by this change and you need not take any action. If you have not already elected e-delivery, you may elect to receive shareholder reports and other communications from the Fund electronically by contacting your Service Agent or, if you are a direct shareholder with the Fund, by calling 1-877-721-1926.
You may elect to receive all future reports in paper free of charge. If you invest through a Service Agent, you can contact your Service Agent to request that you continue to receive paper copies of your shareholder reports. That election will apply to all Legg Mason Funds held in your account at that Service Agent. If you are a direct shareholder with the Fund, you can call the Fund at 1-877-721-1926, or write to the Fund by regular mail at Legg Mason Funds, P.O. Box 9699, Providence, RI 02940-9699 or by express, certified or registered mail to Legg Mason Funds, 4400 Computer Drive, Westborough, MA 01581 to let the Fund know you wish to continue receiving paper copies of your shareholder reports. That election will apply to all Legg Mason Funds held in your account held directly with the fund complex.

|
| INVESTMENT PRODUCTS: NOT FDIC INSURED • NO BANK GUARANTEE • MAY LOSE VALUE |
Fund objective
The Fund seeks long-term growth of capital.
Letter from the president

Dear Shareholder,
We are pleased to provide the annual report of ClearBridge International Growth Fund for the twelve-month reporting period ended October 31, 2021. Please read on for a detailed look at prevailing economic and market conditions during the Fund’s reporting period and to learn how those conditions have affected Fund performance.
Special shareholder notices
Effective June 16, 2021, the Fund no longer sells Class A2 shares. Following the close of business on June 24, 2021, all outstanding Class A2 shares were automatically converted into Class A shares of the Fund. Shareholders holding Class A2 shares at the time of conversion received Class A shares having an aggregate net asset value equal to the aggregate net asset value of their Class A2 shares immediately prior to the conversion. No sales load or other charges were imposed in connection with the conversion. The conversion is not expected to be a taxable event for federal income tax purposes. For additional information, please see the Fund’s prospectus supplement dated May 24, 2021.
Effective October 1, 2021, Thor Olsson is no longer a portfolio manager for the Fund. For additional information, please see the Fund’s prospectus supplement dated October 1, 2021.
| | |
II | | ClearBridge International Growth Fund |
As always, we remain committed to providing you with excellent service and a full spectrum of investment choices. We also remain committed to supplementing the support you receive from your financial advisor. One way we accomplish this is through our website, www.franklintempleton.com. Here you can gain immediate access to market and investment information, including:
| • | | Fund prices and performance, |
| • | | Market insights and commentaries from our portfolio managers, and |
| • | | A host of educational resources. |
We look forward to helping you meet your financial goals.
Sincerely,

Jane Trust, CFA
President and Chief Executive Officer
November 30, 2021
| | |
| ClearBridge International Growth Fund | | III |
Fund overview
Q. What is the Fund’s investment strategy?
A. The Fund seeks long-term growth of capital. The Fund normally invests primarily in common stocks of foreign companies that, in our opinion, appear to offer above average growth potential and trade at a significant discount to our assessment of their intrinsic value. Intrinsic value, in our view, is the value of the company measured, to different extents depending on the type of the company, on factors such as, but not limited to, the discounted value of its projected future free cash flows, the company’s ability to earn returns on capital in excess of its cost of capital, private market values of similar companies and the costs to replicate the business. The Fund may invest in common stocks of foreign companies of any size located throughout the world. We consider foreign companies to include those organized, headquartered or with substantial operations outside of the United States. However, the Fund is not precluded from purchasing stocks of U.S. companies. These companies may be located, or have substantial operations, in emerging markets, provided that the Fund will normally not invest more than 15% of its net assets, at the time of purchase, in securities of companies domiciled in emerging markets. The Fund’s policy is to remain substantially invested in common stocks or securities convertible into or exchangeable for common stock. Any income realized will be incidental to the Fund’s objective.
The fund is classified as “non-diversified,” which means it may invest a larger percentage of its assets in a smaller number of issuers than a diversified fund.
Q. What were the overall market conditions during the Fund’s reporting period?
A. International equities delivered robust performance during the twelve-month reporting period ended October 31, 2021, as the approval and subsequent rollout of multiple COVID-19 vaccines combined with accommodative monetary policy and ambitious fiscal spending helped the MSCI EAFE Index (NR)i to a gain of 34.18%. The market was led by cyclical1 stocks benefiting from the economic recovery, as reopened businesses, greater mobility and a healthy consumer encouraged spending and production, and high-growth technology stocks benefiting from strong secular trends as well as a lingering stay-at-home environment. More defensive, non-cyclical2 sectors trailed.
The reporting period began with positive developments for COVID-19 vaccines, which led to a broadening of market leadership from the mega cap growth stocks that had soared during the height of pandemic lockdowns. Positive COVID-19 vaccine trial results from Pfizer/ BioNTech and Moderna increased optimism about an eventual return to normal economic activity, sparking a rally in cyclical areas of the market. In the fourth quarter of 2020, value stocks, led by energy and financials, outperformed growth stocks for the first time since 2018.
| 1 | Cyclicals consists of the following industries: automotive, entertainment, gaming, home construction, lodging, retailers, restaurants, textiles, and other consumer services. |
| 2 | Non-cyclicals consists of the following industries: consumer products, food/beverage, health care, pharmaceuticals, supermarkets and tobacco. |
| | | | | | |
| ClearBridge International Growth Fund 2021 Annual Report | | | | | 1 | |
Fund overview (cont’d)
Aggressive global fiscal and monetary policies continued unabated in early 2021, helping support consumer demand that, combined with stop-and-start supply chain recovery as COVID-19 rippled through global regions, raised inflation concerns and led to soaring commodity prices. Despite waves of COVID-19 periodically offering a bid to tech stocks that would benefit from a stay-at-home environment, inflation worries led to a steepening yield curve, weighing on high-multiple growth stocks and supporting cyclicals.
COVID-19’s resurgence due to the Delta variant threw numerous countries across Europe and Asia into renewed lockdowns, putting a damper on the reopening trade. China dominated the headlines later in the reporting period with its increased regulatory scrutiny over sectors such as education, information technology (“IT”), property, gaming, and potentially even the financials sector. Coupled with contagion fear over the Evergrande default and worsening power shortages across the country, China suddenly became the biggest risk to global growth.
Markets also wavered in the third quarter of 2021, as higher inflation coincided with signals from the European Central Bank and Bank of England that they would consider scaling back policy support. Equities delivered a flattish third quarter of 2021, as already-challenging labor and supply shortages and broad-based inflationary pressures intensified, weighing on industrials and materials companies. Energy felt crosswinds from a slowing Chinese economy even while global demand remained strong. Robust third quarter 2021 corporate earnings, however, suggesting companies have largely been able to absorb inflationary pressures, led to strong gains in October and brought the reporting period to a close on a high note.
Q. How did we respond to these changing market conditions?
A. Equities have endured quite a roller-coaster ride over the last eighteen months. As pandemic lockdowns were put in place, outperformance was driven by defensive and compounding growth companies, while cyclicals and value stocks collapsed. At the bottom of the recession, amid high earnings uncertainty, growth stocks took over, especially what we would consider emerging growth and work-from-home beneficiaries. And finally, as positive news on COVID-19 vaccines emerged and a recovery began, leadership switched forcefully into value and cyclicals. On balance, this is not an unusual sequence of events during a recession, but the magnitude of these moves was both unusual and compressed. Thus, we need to look at this entire cycle to understand where we are today.
The Fund kept pace amid the first leg of the value rotation in the fourth quarter of 2020. The first quarter of 2021, however, was the most challenging part of this cycle from a performance standpoint. Bonds sold off, the yield curve steepened, and long-duration assets suffered. In the meantime, low-quality value stocks such as deep cyclicals in the steel, mining and banking industries kept rallying while many of the high-quality stocks we favor were essentially flat. What we did not own led to underperformance for the quarter. This was not a surprise as such narrow value markets are exactly the type of environment where we would expect to struggle in the short term.
| | | | |
2 | | | | ClearBridge International Growth Fund 2021 Annual Report |
By the second quarter of 2021, bond yields stabilized, and market performance clearly broadened, with quality and growth participating along with value. In this broader market, Fund performance improved. However, the comeback for growth stocks has been erratic, with volatility in yields, recovering economic activity and demand for commodities causing investors to maintain cyclical exposure. While the performance gap between international growth and value stocks has narrowed over the twelve months ended October 31, 2021, it hasn’t been enough to boost Fund performance.
We have also been hurt by exposure to emerging markets, specifically China and Brazil. Beijing’s crackdown on several large tech companies and Chinese firms raising foreign capital has elevated our concerns about the country’s pivot toward increased regulation and reduced overseas reliance. Privately held companies are Beijing’s main target and China is fast becoming a market where we no longer have confidence in how capital will be allocated for shareholders. Most global investors feel the same way as earnings and multiples for these stocks have derated. Political risk in the country has ramped up significantly, causing the cost of capital to rise commensurately. We have said we would move aside when the government starts reallocating capital, and we did so with the sale of our largest Chinese position, internet conglomerate Tencent Holdings, as well as national insurer Ping An Insurance Group.
Brazil is another emerging market focus and here we were hurt by payments company StoneCo. The stock sold off primarily due to surprise write-downs in its lending business, which began in the first quarter and continued into the second and have weighed on earnings. We believe the worst of the write-downs are behind us and core company fundamentals remain solid.
Besides StoneCo, another tech laggard has been TeamViewer, a provider of communications and remote connectivity software for enterprises. After a strong runup during the work-from-home period of COVID-19, the company chose to engage in expensive marketing /brand building contracts such as a five-year sponsorship of Premier League powerhouse Manchester United. Combined with slowing growth as the work-from-home period wave ebbed, the company missed profit expectations in the second and third quarter of this year, causing us to sell the position.
Our overweight to the IT sector is our most active positioning in the Fund versus the benchmark and has been a contributor to performance. We maintain confidence in the innovations being developed by companies in the sector and believe the recent upward move in rates has unfairly punished many of these companies, which fall in our higher multiple emerging growth bucket. Nevertheless, the long-term thesis for holdings such as collaboration software maker Atlassian and e-commerce enablement platform Shopify remains intact.
| | | | | | |
| ClearBridge International Growth Fund 2021 Annual Report | | | | | 3 | |
Fund overview (cont’d)
Performance review
For the twelve months ended October 31, 2021, Class C shares of ClearBridge International Growth Fund, excluding sales charges, returned 23.74%. The Fund’s unmanaged benchmark, the MSCI EAFE Index (NR), returned 34.18% for the same reporting period. The Lipper International Multi-Cap Growth Funds Category Averageii returned 27.96% over the same time frame.
| | | | | | | | |
Performance Snapshot as of October 31, 2021
(unaudited) | |
| (excluding sales charges) | | 6 months | | | 12 months | |
| ClearBridge International Growth Fund: | | | | | | | | |
Class A | | | 3.76 | % | | | 24.69 | % |
Class C | | | 3.38 | % | | | 23.74 | % |
Class FI | | | 3.74 | % | | | 24.63 | % |
Class R | | | 3.57 | % | | | 24.24 | % |
Class I | | | 3.90 | % | | | 25.02 | % |
Class IS | | | 3.95 | % | | | 25.14 | % |
| MSCI EAFE Index (NR) | | | 4.14 | % | | | 34.18 | % |
| Lipper International Multi-Cap Growth Funds Category Average | | | 3.13 | % | | | 27.96 | % |
The performance shown represents past performance. Past performance is no guarantee of future results and current performance may be higher or lower than the performance shown above. Principal value and investment returns will fluctuate and investors’ shares, when redeemed, may be worth more or less than their original cost. To obtain performance data current to the most recent month-end, please visit our website at www.franklintempleton.com.
All share class returns assume the reinvestment of all distributions at net asset value and the deduction of all Fund expenses. Returns have not been adjusted to include sales charges that may apply or the deduction of taxes that a shareholder would pay on Fund distributions. If sales charges were reflected, the performance quoted would be lower. Performance figures for periods shorter than one year represent cumulative figures and are not annualized.
Fund performance figures reflect fee waivers and/or expense reimbursements, without which the performance would have been lower.
|
| Total Annual Operating Expenses (unaudited) |
As of the Fund’s current prospectus dated March 1, 2021, as supplemented May 21, 2021, the gross total annual fund operating expense ratios for Class A, Class C, Class FI, Class R, Class I, and Class IS shares were 1.10%, 1.83%, 1.13%, 1.43%, 0.81% and 0.72%, respectively.
Actual expenses may be higher. For example, expenses may be higher than those shown if average net assets decrease. Net assets are more likely to decrease and Fund expense ratios are more likely to increase when markets are volatile.
As a result of expense limitation arrangements, the ratio of total annual fund operating expenses, other than interest, brokerage commissions, dividend expense on short sales, taxes, extraordinary expenses and acquired fund fees and expenses, to average net assets will not exceed 1.06% for Class A shares, 1.90% for Class C shares, 1.15% for Class FI shares, 1.40% for Class R shares, 0.90%
| | | | |
4 | | | | ClearBridge International Growth Fund 2021 Annual Report |
for Class I shares and 0.80% for Class IS shares. In addition, the ratio of total annual fund operating expenses for Class IS shares will not exceed the ratio of total annual fund operating expenses for Class I shares. These expense imitation arrangements cannot be terminated prior to December 31, 2023 without the Board of Trustees’ consent. In addition, the manager has agreed to waive the Fund’s management fee to an extent sufficient to offset the net management fee payable in connection with any investment in an affiliated money market fund. This management fee waiver is not subject to the recapture provision discussed below.
The manager is permitted to recapture amounts waived and/or reimbursed to a class within three years after the fiscal year in which the manager earned the fee or incurred the expense if the class’ total annual fund operating expenses have fallen to a level below the expense limitation (“expense cap”) in effect at the time the fees were earned, or the expenses incurred. In no case will the manager recapture any amount that would result, on any particular business day of the Fund, in the class’ total annual fund operating expenses exceeding the expense cap or any other lower limit then in effect.
Q. What were the leading contributors to performance?
A. For the reporting period, on an absolute basis, the Fund had positive returns in nine out of ten sectors, with the greatest contributions to returns coming from the IT, industrials and health care sectors. In terms of individual stocks, ASML, Atlassian, Tokyo Electron and Adyen in the IT sector and LVMH in the consumer discretionary sector contributed the most to absolute returns.
Relative to the benchmark index, stock selection in the health care, consumer staples and materials sectors and an overweight allocation to the IT sector contributed to relative returns.
From a regional perspective, stock selection in emerging markets and Asia Ex-Japan, as well as, an underweight to Japan were contributors to performance.
Q. What were the leading detractors from performance?
A. Relative to the benchmark index, overall stock selection and sector allocation had negative impacts on results. In particular, stock selection in the financials, consumer discretionary, communication services and IT sectors and underweights to the financials and energy sectors hurt relative returns. In terms of individual positions, TeamViewer in the IT sector, Alibaba Group and Just Eat Takeaway in the consumer discretionary sector, Tencent Holdings in the communication services sector and InPost in the industrials sector detracted the most from returns
From a regional perspective, an overweight allocation to emerging markets as well as stock selection in Europe Ex-U.K. and the United Kingdom detracted the most from performance.
Q. Were there any significant changes to the Fund during the reporting period?
A. Overall, the Fund made a number of new purchases and sells. The largest purchases included Recruit Holdings and Canadian Pacific Railway in the industrials sector, TE Connectivity and Keyence in the IT sector, Schlumberger in the energy sector and BNP
| | | | | | |
| ClearBridge International Growth Fund 2021 Annual Report | | | | | 5 | |
Fund overview (cont’d)
Paribas in the financials sector. Meanwhile, some of the largest positions we sold included TeamViewer and Nintendo in the IT sector, Tencent Holdings and Spotify in the communication services sector and Legrand in the industrials sector.
Thank you for your investment in ClearBridge International Growth Fund. As always, we appreciate that you have chosen us to manage your assets and we remain focused on achieving the Fund’s investment goals.
Sincerely,

Michael Testorf, CFA
Portfolio Manager
ClearBridge Investments, LLC

Elisa Mazen
Portfolio Manager
ClearBridge Investments, LLC

Pawel Wroblewski, CFA
Portfolio Manager
ClearBridge Investments, LLC
November 18, 2021
| | | | |
6 | | | | ClearBridge International Growth Fund 2021 Annual Report |
RISKS: Equity securities are subject to market and price fluctuations. International investments are subject to special risks including currency fluctuations and social, economic and political uncertainties, which could increase volatility. These risks are magnified in emerging markets. Emerging market countries tend to have economic, political and legal systems that are less developed and are less stable than those of more developed countries. Small- and mid-cap stocks involve greater risks and volatility than large-cap stocks. As a non-diversified fund, it is permitted to invest a larger percentage of its assets in a smaller number of issuers than a diversified fund, which may magnify the Fund’s losses from events affecting a particular issuer. The manager’s investment style may become out of favor and/or the manager’s selection process may prove incorrect, which may have a negative impact on the Fund’s performance. Growth stocks as a group can be more volatile than value stocks and may be out of favor and underperform the overall equity market while the market concentrates on value stocks. The Fund may focus its investments in certain companies, industries or market sectors, increasing its vulnerability to market volatility. The Fund may engage in derivative transactions, which involve special risks and costs and may increase losses and have a potentially large impact on Fund performance. Please see the Fund’s prospectus for a more complete discussion of these and other risks and the Fund’s investment strategies.
Portfolio holdings and breakdowns are as of October 31, 2021 and are subject to change and may not be representative of the portfolio managers’ current or future investments. The Fund’s top ten holdings (as a percentage of net assets) as of October 31, 2021 were: Nestle SA (4.3%), ASML Holding NV (3.5%), Recruit Holdings Co., Ltd (3.1%), Linde PLC (2.9%), LVMH Moet Hennessy Louis Vuitton SE (2.8%), TE Connectivity Ltd. (2.7%), ICON PLC (2.7%), L’Oreal SA (2.6%), Keyence Corp. (2.6%) and Roche Holding AG (2.5%). Please refer to pages 14 through 18 for a list and percentage breakdown of the Fund’s holdings.
The mention of sector breakdowns is for informational purposes only and should not be construed as a recommendation to purchase or sell any securities. The information provided regarding such sectors is not a sufficient basis upon which to make an investment decision. Investors seeking financial advice regarding the appropriateness of investing in any securities or investment strategies discussed should consult their financial professional. The Fund’s top five sector holdings (as a percentage of net assets) as of October 31, 2021 were: information technology (22.6%), industrials (18.3%), health care (12.9%), consumer staples (11.5%) and consumer discretionary (10.7%). The Fund’s portfolio composition is subject to change at any time.
All investments are subject to risk including the possible loss of principal. Past performance is no guarantee of future results. All index performance reflects no deduction for fees, expenses or taxes. Please note that an investor cannot invest directly in an index.
The information provided is not intended to be a forecast of future events, a guarantee of future results or investment advice. Views expressed may differ from those of the firm as a whole.
| | | | | | |
| ClearBridge International Growth Fund 2021 Annual Report | | | | | 7 | |
Fund overview (cont’d)
| i | The MSCI EAFE Index (NR) is a free float-adjusted market capitalization index designed to measure developed market equity performance, excluding the U.S. and Canada. Net Returns (NR) include income net of tax withholding when dividends are paid. |
| ii | Lipper, Inc., a wholly-owned subsidiary of Refinitiv, provides independent insight on global collective investments. Returns are based on the period ended October 31, 2021, including the reinvestment of all distributions, including returns of capital, if any, calculated among the 388 funds for the six-month period and among the 380 funds for the twelve-month period in the Fund’s Lipper category, and excluding sales charges, if any. |
| | | | |
8 | | | | ClearBridge International Growth Fund 2021 Annual Report |
Fund at a glance† (unaudited)
Investment breakdown (%) as a percent of total investments
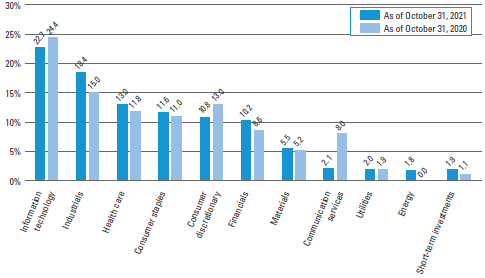
| † | The bar graph above represents the composition of the Fund’s investments as of October 31, 2021 and October 31, 2020. The Fund is actively managed. As a result, the composition of the Fund’s investments is subject to change at any time. |
| | | | | | |
| ClearBridge International Growth Fund 2021 Annual Report | | | | | 9 | |
Fund expenses (unaudited)
Example
As a shareholder of the Fund, you may incur two types of costs: (1) transaction costs, including front-end and back-end sales charges (loads) on purchase payments; and (2) ongoing costs, including management fees; service and/or distribution (12b-1) fees; and other Fund expenses. This example is intended to help you understand your ongoing costs (in dollars) of investing in the Fund and to compare these costs with the ongoing costs of investing in other mutual funds.
This example is based on an investment of $1,000 invested on May 1, 2021 and held for the six months ended October 31, 2021.
Actual expenses
The table below titled “Based on Actual Total Return” provides information about actual account values and actual expenses. You may use the information provided in this table, together with the amount you invested, to estimate the expenses that you paid over the period. To estimate the expenses you paid on your account, divide your ending account value by $1,000 (for example, an $8,600 ending account value divided by $1,000 = 8.6), then multiply the result by the number under the heading entitled “Expenses Paid During the Period”.
Hypothetical example for comparison purposes
The table below titled “Based on Hypothetical Total Return” provides information about hypothetical account values and hypothetical expenses based on the actual expense ratio and an assumed rate of return of 5.00% per year before expenses, which is not the Fund’s actual return. The hypothetical account values and expenses may not be used to estimate the actual ending account balance or expenses you paid for the period. You may use the information provided in this table to compare the ongoing costs of investing in the Fund and other funds. To do so, compare the 5.00% hypothetical example relating to the Fund with the 5.00% hypothetical examples that appear in the shareholder reports of the other funds.
Please note that the expenses shown in the table below are meant to highlight your ongoing costs only and do not reflect any transactional costs, such as front-end or back-end sales charges (loads). Therefore, the table is useful in comparing ongoing costs only, and will not help you determine the relative total costs of owning different funds. In addition, if these transaction costs were included, your costs would have been higher.
| | | | | | | | | | | | | | | | | | | | | | | | | | | | | | | | | | | | | | | | | | | | | | |
| | | |
| Based on actual total return1 | | | | | | | | | Based on hypothetical total return1 | |
| | | Actual
Total Return
Without
Sales
Charge2 | | | Beginning
Account
Value | | | Ending
Account
Value | | | Annualized
Expense
Ratio | | | Expenses
Paid
During
the
Period3 | | | | | | | | Hypothetical
Annualized
Total Return | | | Beginning
Account
Value | | | Ending
Account
Value | | | Annualized
Expense
Ratio | | | Expenses
Paid
During
the
Period3 | |
| Class A | | | 3.76 | % | | $ | 1,000.00 | | | $ | 1,037.60 | | | | 1.05 | % | | $ | 5.39 | | | | | | | Class A | | | 5.00 | | | $ | 1,000.00 | | | $ | 1,019.91 | | | | 1.05 | % | | $ | 5.35 | |
| Class C | | | 3.38 | | | | 1,000.00 | | | | 1,033.80 | | | | 1.79 | | | | 9.18 | | | | | | | Class C | | | 5.00 | | | | 1,000.00 | | | | 1,016.18 | | | | 1.79 | | | | 9.10 | |
| Class FI | | | 3.74 | | | | 1,000.00 | | | | 1,037.40 | | | | 1.08 | | | | 5.55 | | | | | | | Class FI | | | 5.00 | | | | 1,000.00 | | | | 1,019.76 | | | | 1.08 | | | | 5.50 | |
| Class R | | | 3.57 | | | | 1,000.00 | | | | 1,035.70 | | | | 1.40 | | | | 7.18 | | | | | | | Class R | | | 5.00 | | | | 1,000.00 | | | | 1,018.15 | | | | 1.40 | | | | 7.12 | |
| Class I | | | 3.90 | | | | 1,000.00 | | | | 1,039.00 | | | | 0.79 | | | | 4.06 | | | | | | | Class I | | | 5.00 | | | | 1,000.00 | | | | 1,021.22 | | | | 0.79 | | | | 4.02 | |
| Class IS | | | 3.95 | | | | 1,000.00 | | | | 1,039.50 | | | | 0.69 | | | | 3.55 | | | | | | | Class IS | | | 5.00 | | | | 1,000.00 | | | | 1,021.73 | | | | 0.69 | | | | 3.52 | |
| | | | |
10 | | | | ClearBridge International Growth Fund 2021 Annual Report |
| 1 | For the six months ended October 31, 2021. |
| 2 | Assumes the reinvestment of all distributions, including returns of capital, if any, at net asset value and does not reflect the deduction of the applicable sales charge with respect to Class A shares or the applicable contingent deferred sales charge (“CDSC”) with respect to Class C shares. Total return is not annualized, as it may not be representative of the total return for the year. Performance figures may reflect compensating balance arrangements, fee waivers and/or expense reimbursements. In the absence of compensating balance arrangements, fee waivers and/or expense reimbursements, the total return would have been lower. Past performance is no guarantee of future results. |
| 3 | Expenses (net of compensating balance arrangements, fee waivers and/or expense reimbursements) are equal to each class’ respective annualized expense ratio multiplied by the average account value over the period, multiplied by the number of days in the most recent fiscal half-year (184), then divided by 365. |
| | | | | | |
| ClearBridge International Growth Fund 2021 Annual Report | | | | | 11 | |
Fund performance (unaudited)
| | | | | | | | | | | | | | | | | | | | | | | | |
| Average annual total returns | | | | | | | | | | |
| Without sales charges1 | | Class A | | | Class C | | | Class FI | | | Class R | | | Class I | | | Class IS | |
| Twelve Months Ended 10/31/21 | | | 24.69 | % | | | 23.74 | % | | | 24.63 | % | | | 24.24 | % | | | 25.02 | % | | | 25.14 | % |
| Five Years Ended 10/31/21 | | | 15.69 | | | | 14.80 | | | | 15.67 | | | | 15.37 | | | | 16.00 | | | | N/A | |
| Ten Years Ended 10/31/21 | | | 12.24 | | | | 11.39 | | | | 12.23 | | | | 11.94 | | | | 12.53 | | | | N/A | |
| Inception* through 10/31/21 | | | — | | | | — | | | | — | | | | — | | | | — | | | | 13.87 | |
| | | | | | |
| With sales charges2 | | Class A | | | Class C | | | Class FI | | | Class R | | | Class I | | | Class IS | |
| Twelve Months Ended 10/31/21 | | | 17.52 | % | | | 22.74 | % | | | 24.63 | % | | | 24.24 | % | | | 25.02 | % | | | 25.14 | % |
| Five Years Ended 10/31/21 | | | 14.33 | | | | 14.80 | | | | 15.67 | | | | 15.37 | | | | 16.00 | | | | N/A | |
| Ten Years Ended 10/31/21 | | | 11.58 | | | | 11.39 | | | | 12.23 | | | | 11.94 | | | | 12.53 | | | | N/A | |
| Inception* through 10/31/21 | | | — | | | | — | | | | — | | | | — | | | | — | | | | 13.87 | |
| | | | |
| Cumulative total returns | |
| Without sales charges1 | | | |
| Class A (10/31/11 through 10/31/21) | | | 217.25 | % |
| Class C (10/31/11 through 10/31/21) | | | 194.07 | |
| Class FI (10/31/11 through 10/31/21) | | | 217.04 | |
| Class R (10/31/11 through 10/31/21) | | | 208.90 | |
| Class I (10/31/11 through 10/31/21) | | | 225.68 | |
| Class IS (Inception date of 9/17/18 through 10/31/21) | | | 49.97 | |
All figures represent past performance and are not a guarantee of future results. Investment return and principal value of an investment will fluctuate so that an investor’s shares, when redeemed, may be worth more or less than their original cost. The returns shown do not reflect the deduction of taxes that a shareholder would pay on Fund distributions or the redemption of Fund shares. Performance figures may reflect compensating balance arrangements, fee waivers and/or expense reimbursements. In the absence of compensating balance arrangements, fee waivers and/or expense reimbursements, the total return would have been lower.
| 1 | Assumes the reinvestment of all distributions, including returns of capital, if any, at net asset value and does not reflect the deduction of the applicable sales charge with respect to Class A shares or the applicable contingent deferred sales charge (“CDSC”) with respect to Class C shares. |
| 2 | Assumes the reinvestment of all distributions, including returns of capital, if any, at net asset value. In addition, Class A shares reflect the deduction of the maximum initial sales charge of 5.75%. Class C shares reflect the deduction of a 1.00% CDSC, which applies if shares are redeemed within one year from purchase payment. |
| * | Inception dates for Class A, C, FI, R, I and IS shares are February 3, 2009, April 17, 1995, January 29, 2004, December 28, 2006, March 4, 2004 and September 17, 2018. |
| | | | |
12 | | | | ClearBridge International Growth Fund 2021 Annual Report |
Historical performance
Value of $10,000 invested in
Class C Shares of ClearBridge International Growth Fund vs. MSCI EAFE Index (NR)† — October 2011 - October 2021
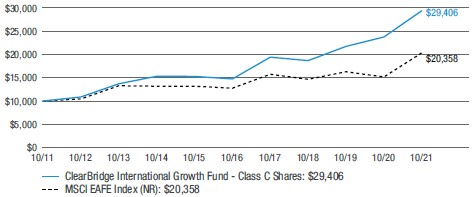
All figures represent past performance and are not a guarantee of future results. Investment return and principal value of an investment will fluctuate so that an investor’s shares, when redeemed, may be worth more or less than their original cost. The returns shown do not reflect the deduction of taxes that a shareholder would pay on Fund distributions or the redemption of Fund shares. Performance figures may reflect compensating balance arrangements, fee waivers and/or expense reimbursements. In the absence of compensating balance arrangements, fee waivers and/or expense reimbursements, the total return would have been lower.
| † | Hypothetical illustration of $10,000 invested in Class C shares of ClearBridge International Growth Fund on October 31, 2011, assuming the reinvestment of all distributions, including returns of capital, if any, at net asset value through October 31, 2021. The hypothetical illustration also assumes a $10,000 investment in the MSCI EAFE Index (NR). The MSCI EAFE Index (NR) (the “Index”) is a free float-adjusted market capitalization index designed to measure developed market equity performance, excluding the U.S. and Canada. The Index is unmanaged and is not subject to the same management and trading expenses as a mutual fund. Please note that an investor cannot invest directly in an index. The performance of the Fund’s other classes may be greater or less than the Class C shares’ performance indicated on this chart, depending on whether greater or lesser sales charges and fees were incurred by shareholders investing in the other classes. |
| | Effective December 31, 2015, the Fund’s global growth strategy was replaced with an international growth strategy, and the Fund changed its name from ClearBridge Global Growth Trust to ClearBridge International Growth Fund. The Fund’s past performance would have been different if the Fund was managed using the current investment strategy for the entire period. |
| | | | | | |
| ClearBridge International Growth Fund 2021 Annual Report | | | | | 13 | |
Schedule of investments
October 31, 2021
ClearBridge International Growth Fund
(Percentages shown based on Fund net assets)
| | | | | | | | |
| Security | | Shares | | | Value | |
| Common Stocks — 97.4% | | | | | | | | |
| Communication Services — 2.1% | | | | | | | | |
Diversified Telecommunication Services — 1.2% | | | | | | | | |
Cellnex Telecom SA | | | 1,342,754 | | | $ | 82,586,049 | (a)(b) |
Entertainment — 0.9% | | | | | | | | |
Sea Ltd., ADR | | | 175,229 | | | | 60,203,428 | * |
Total Communication Services | | | | | | | 142,789,477 | |
| Consumer Discretionary — 10.7% | | | | | | | | |
Hotels, Restaurants & Leisure — 1.5% | | | | | | | | |
Compass Group PLC | | | 4,655,950 | | | | 98,895,121 | *(b) |
Internet &Direct Marketing Retail — 0.8% | | | | | | | | |
Just Eat Takeaway.com NV | | | 148,930 | | | | 10,704,866 | *(a)(b) |
MercadoLibre Inc. | | | 29,783 | | | | 44,109,219 | * |
Total Internet & Direct Marketing Retail | | | | | | | 54,814,085 | |
Specialty Retail — 1.5% | | | | | | | | |
Industria de Diseno Textil SA | | | 2,884,004 | | | | 104,276,704 | (b) |
Textiles, Apparel &Luxury Goods — 6.9% | | | | | | | | |
adidas AG | | | 419,567 | | | | 137,406,698 | (b) |
Burberry Group PLC | | | 2,701,804 | | | | 71,539,506 | (b) |
Dr.Martens PLC | | | 5,362,470 | | | | 27,078,083 | *(b) |
EssilorLuxottica SA | | | 203,380 | | | | 42,095,603 | (b) |
LVMH Moet Hennessy Louis Vuitton SE | | | 237,140 | | | | 185,911,506 | (b) |
Total Textiles, Apparel & Luxury Goods | | | | | | | 464,031,396 | |
Total Consumer Discretionary | | | | | | | 722,017,306 | |
| Consumer Staples — 11.5% | | | | | | | | |
Beverages — 2.3% | | | | | | | | |
Diageo PLC, ADR | | | 763,950 | | | | 152,537,896 | |
Food & Staples Retailing — 0.8% | | | | | | | | |
Ocado Group PLC | | | 2,146,126 | | | | 52,996,024 | *(b) |
Food Products — 4.3% | | | | | | | | |
Nestle SA, Registered Shares | | | 2,189,713 | | | | 289,239,916 | (b) |
Personal Products — 4.1% | | | | | | | | |
L’Oreal SA | | | 382,113 | | | | 174,736,962 | (b) |
Shiseido Co. Ltd. | | | 1,544,501 | | | | 102,882,528 | (b) |
Total Personal Products | | | | | | | 277,619,490 | |
Total Consumer Staples | | | | | | | 772,393,326 | |
| Energy — 1.8% | | | | | | | | |
Energy Equipment & Services — 1.8% | | | | | | | | |
Schlumberger NV | | | 3,631,453 | | | | 117,150,674 | |
See Notes to Financial Statements.
| | | | |
14 | | | | ClearBridge International Growth Fund 2021 Annual Report |
ClearBridge International Growth Fund
(Percentages shown based on Fund net assets)
| | | | | | | | |
| Security | | Shares | | | Value | |
| Financials — 10.1% | | | | | | | | |
Banks — 4.2% | | | | | | | | |
BNP Paribas SA | | | 2,299,907 | | | | $154,286,966 | (b) |
Intesa Sanpaolo SpA | | | 22,404,320 | | | | 63,825,083 | (b) |
KBC Group NV | | | 727,955 | | | | 67,939,705 | (b) |
Total Banks | | | | | | | 286,051,754 | |
Capital Markets — 3.9% | | | | | | | | |
3i Group PLC | | | 3,646,018 | | | | 68,204,790 | (b) |
London Stock Exchange Group PLC | | | 1,643,145 | | | | 159,736,508 | (b) |
Vinci Partners Investments Ltd., Class A Shares | | | 159,607 | | | | 1,961,570 | |
XP Inc., Class A Shares | | | 937,237 | | | | 30,750,746 | * |
Total Capital Markets | | | | | | | 260,653,614 | |
Insurance — 2.0% | | | | | | | | |
AIA Group Ltd. | | | 11,746,092 | | | | 132,740,677 | (b) |
Total Financials | | | | | | | 679,446,045 | |
| Health Care — 12.9% | | | | | | | | |
Biotechnology — 1.1% | | | | | | | | |
Argenx SE, ADR | | | 192,946 | | | | 58,261,974 | * |
Zai Lab Ltd., ADR | | | 181,715 | | | | 18,971,046 | * |
Total Biotechnology | | | | | | | 77,233,020 | |
Health Care Equipment & Supplies — 4.6% | | | | | | | | |
Alcon Inc. | | | 1,845,730 | | | | 153,324,308 | (b) |
Hoya Corp. | | | 1,049,424 | | | | 154,377,381 | (b) |
Total Health Care Equipment & Supplies | | | | | | | 307,701,689 | |
Life Sciences Tools & Services — 2.7% | | | | | | | | |
ICON PLC | | | 624,186 | | | | 178,997,819 | * |
Pharmaceuticals — 4.5% | | | | | | | | |
Novo Nordisk A/S, ADR | | | 1,248,970 | | | | 137,549,066 | |
Roche Holding AG | | | 431,668 | | | | 167,233,756 | (b) |
Total Pharmaceuticals | | | | | | | 304,782,822 | |
Total Health Care | | | | | | | 868,715,350 | |
| Industrials — 18.3% | | | | | | | | |
Aerospace & Defense — 1.5% | | | | | | | | |
Airbus SE | | | 799,045 | | | | 102,442,744 | *(b) |
Commercial Services & Supplies — 1.4% | | | | | | | | |
Rentokil Initial PLC | | | 11,752,066 | | | | 94,761,645 | (b) |
Electrical Equipment — 0.9% | | | | | | | | |
Nidec Corp. | | | 528,682 | | | | 58,471,884 | (b) |
Machinery — 4.5% | | | | | | | | |
Atlas Copco AB, Class A Shares | | | 2,040,970 | | | | 130,928,018 | (b) |
See Notes to Financial Statements.
| | | | | | |
| ClearBridge International Growth Fund 2021 Annual Report | | | | | 15 | |
Schedule of investments (cont’d)
October 31, 2021
ClearBridge International Growth Fund
(Percentages shown based on Fund net assets)
| | | | | | | | |
| Security | | Shares | | | Value | |
Machinery — continued | | | | | | | | |
FANUC Corp. | | | 338,775 | | | $ | 66,575,209 | (b) |
Sandvik AB | | | 4,151,260 | | | | 105,391,386 | (b) |
Total Machinery | | | | | | | 302,894,613 | |
Professional Services — 6.3% | | | | | | | | |
Recruit Holdings Co., Ltd | | | 3,169,128 | | | | 211,219,885 | (b) |
Teleperformance | | | 258,300 | | | | 107,953,479 | (b) |
Thomson Reuters Corp. | | | 898,209 | | | | 108,044,904 | |
Total Professional Services | | | | | | | 427,218,268 | |
Road & Rail — 2.2% | | | | | | | | |
Canadian Pacific Railway Ltd. | | | 1,881,040 | | | | 145,592,131 | |
Trading Companies & Distributors — 1.5% | | | | | | | | |
Ashtead Group PLC | | | 508,770 | | | | 42,736,424 | (b) |
MonotaRO Co. Ltd. | | | 2,559,703 | | | | 58,081,542 | (b) |
Total Trading Companies & Distributors | | | | | | | 100,817,966 | |
Total Industrials | | | | | | | 1,232,199,251 | |
| Information Technology — 22.6% | | | | | | | | |
Electronic Equipment, Instruments & Components — 5.3% | | | | | | | | |
Keyence Corp. | | | 289,430 | | | | 174,529,191 | (b) |
TE Connectivity Ltd. | | | 1,226,950 | | | | 179,134,700 | |
Total Electronic Equipment, Instruments & Components | | | | | | | 353,663,891 | |
IT Services — 5.3% | | | | | | | | |
Adyen NV | | | 28,233 | | | | 85,283,463 | *(a)(b) |
Amadeus IT Group SA | | | 1,725,969 | | | | 115,661,692 | *(b) |
Shopify Inc., Class A Shares | | | 39,757 | | | | 58,312,785 | * |
StoneCo Ltd., Class A Shares | | | 1,009,682 | | | | 34,187,832 | * |
Worldline SA | | | 1,089,481 | | | | 63,579,457 | *(a)(b) |
Total IT Services | | | | | | | 357,025,229 | |
Semiconductors & Semiconductor Equipment — 6.5% | | | | | | | | |
ASML Holding NV | | | 289,847 | | | | 236,135,720 | (b) |
Taiwan Semiconductor Manufacturing Co. Ltd., ADR | | | 1,254,453 | | | | 142,631,306 | |
Tokyo Electron Ltd. | | | 123,394 | | | | 57,526,891 | (b) |
Total Semiconductors & Semiconductor Equipment | | | | | | | 436,293,917 | |
Software — 5.5% | | | | | | | | |
Atlassian Corp. PLC, Class A Shares | | | 362,270 | | | | 165,966,755 | * |
Elastic NV | | | 701,792 | | | | 121,767,930 | * |
Nice Ltd., ADR | | | 180,519 | | | | 51,090,488 | * |
Temenos AG, Registered Shares | | | 209,644 | | | | 32,016,989 | (b) |
Total Software | | | | | | | 370,842,162 | |
Total Information Technology | | | | | | | 1,517,825,199 | |
See Notes to Financial Statements.
| | | | |
16 | | | | ClearBridge International Growth Fund 2021 Annual Report |
ClearBridge International Growth Fund
(Percentages shown based on Fund net assets)
| | | | | | | | | | | | |
| Security | | | | | Shares | | | Value | |
| Materials — 5.4% | | | | | | | | | | | | |
Chemicals — 3.7% | | | | | | | | | | | | |
Givaudan SA, Registered Shares | | | | | | | 12,394 | | | $ | 58,402,357 | (b) |
Linde PLC | | | | | | | 602,279 | | | | 194,014,553 | (b) |
Total Chemicals | | | | | | | | | | | 252,416,910 | |
Construction Materials — 1.7% | | | | | | | | | | | | |
CRH PLC | | | | | | | 2,356,710 | | | | 112,859,862 | (b) |
Total Materials | | | | | | | | | | | 365,276,772 | |
| Utilities — 2.0% | | | | | | | | | | | | |
Electric Utilities — 2.0% | | | | | | | | | | | | |
EDP - Energias de Portugal SA | | | | | | | 24,233,698 | | | | 137,004,747 | (b) |
Total Investments before Short-Term Investments (Cost — $5,018,480,495) | | | | | | | | 6,554,818,147 | |
| | | |
| | | Rate | | | | | | | |
| Short-Term Investments — 1.9% | | | | | | | | | | | | |
JPMorgan 100% U.S. Treasury Securities Money Market Fund, Institutional Class | | | 0.006 | % | | | 100,715,577 | | | | 100,715,577 | |
Western Asset Premier Institutional U.S. Treasury Reserves, Premium Shares | | | 0.010 | % | | | 25,178,895 | | | | 25,178,895 | (c) |
Total Short-Term Investments (Cost — $125,894,472) | | | | | | | | | | | 125,894,472 | |
Total Investments — 99.3% (Cost — $5,144,374,967) | | | | | | | | | | | 6,680,712,619 | |
Other Assets in Excess of Liabilities — 0.7% | | | | | | | | | | | 49,255,835 | |
Total Net Assets — 100.0% | | | | | | | | | | $ | 6,729,968,454 | |
| * | Non-income producing security. |
| (a) | Security is exempt from registration under Rule 144A of the Securities Act of 1933. This security may be resold in transactions that are exempt from registration, normally to qualified institutional buyers. This security has been deemed liquid pursuant to guidelines approved by the Board of Trustees. |
| (b) | Security is valued in good faith in accordance with procedures approved by the Board of Trustees (Note 1). |
| (c) | In this instance, as defined in the Investment Company Act of 1940, an “Affiliated Company” represents Fund ownership of at least 5% of the outstanding voting securities of an issuer, or a company which is under common ownership or control with the Fund. At October 31, 2021, the total market value of investments in Affiliated Companies was $25,178,895 and the cost was $25,178,895 (Note 8). |
| | |
Abbreviation(s) used in this schedule: |
| |
| ADR | | — American Depositary Receipts |
See Notes to Financial Statements.
| | | | | | |
| ClearBridge International Growth Fund 2021 Annual Report | | | | | 17 | |
Schedule of investments (cont’d)
October 31, 2021
ClearBridge International Growth Fund
| | | | |
| Summary of Investments by Country** (unaudited) | | | |
| United Kingdom | | | 14.6 | % |
| Japan | | | 13.2 | |
| France | | | 12.4 | |
| Switzerland | | | 10.5 | |
| United States | | | 8.7 | |
| Netherlands | | | 5.7 | |
| Canada | | | 4.7 | |
| Spain | | | 4.5 | |
| Ireland | | | 4.4 | |
| Sweden | | | 3.5 | |
| Taiwan | | | 3.0 | |
| Denmark | | | 2.1 | |
| Germany | | | 2.1 | |
| Portugal | | | 2.0 | |
| Hong Kong | | | 2.0 | |
| Belgium | | | 1.0 | |
| Brazil | | | 1.0 | |
| Italy | | | 0.9 | |
| Israel | | | 0.8 | |
| Argentina | | | 0.7 | |
| China | | | 0.3 | |
| Short-Term Investments | | | 1.9 | |
| | | | 100.0 | % |
| ** | As a percentage of total investments. Please note that the Fund holdings are as of October 31, 2021 and are subject to change. |
See Notes to Financial Statements.
| | | | |
18 | | | | ClearBridge International Growth Fund 2021 Annual Report |
Statement of assets and liabilities
October 31, 2021
| | | | |
| |
| Assets: | | | | |
Investments in unaffiliated securities, at value (Cost — $5,119,196,072) | | $ | 6,655,533,724 | |
Investments in affiliated securities, at value (Cost — $25,178,895) | | | 25,178,895 | |
Foreign currency, at value (Cost — $122,671) | | | 123,106 | |
Receivable for securities sold | | | 43,934,958 | |
Dividends and interest receivable | | | 10,846,641 | |
Receivable for Fund shares sold | | | 10,663,024 | |
Prepaid expenses | | | 99,336 | |
Total Assets | | | 6,746,379,684 | |
| |
| Liabilities: | | | | |
Payable for securities purchased | | | 7,140,339 | |
Payable for Fund shares repurchased | | | 3,844,634 | |
Investment management fee payable | | | 3,624,467 | |
Transfer agent fees payable | | | 1,242,515 | |
Service and/or distribution fees payable | | | 221,611 | |
Trustees’ fees payable | | | 15,994 | |
Accrued expenses | | | 321,670 | |
Total Liabilities | | | 16,411,230 | |
| Total Net Assets | | $ | 6,729,968,454 | |
| |
| Net Assets: | | | | |
Par value (Note 7) | | $ | 956 | |
Paid-in capital in excess of par value | | | 5,056,593,516 | |
Total distributable earnings (loss) | | | 1,673,373,982 | |
| Total Net Assets | | $ | 6,729,968,454 | |
See Notes to Financial Statements.
| | | | | | |
| ClearBridge International Growth Fund 2021 Annual Report | | | | | 19 | |
Statement of assets and liabilities (cont’d)
October 31, 2021
| | | | |
| |
| Net Assets: | | | | |
Class A | | | $544,064,061 | |
Class C | | | $64,591,028 | |
Class FI | | | $192,370,929 | |
Class R | | | $38,142,217 | |
Class I | | | $4,648,755,559 | |
Class IS | | | $1,242,044,660 | |
| |
| Shares Outstanding: | | | | |
Class A | | | 8,295,643 | |
Class C | | | 1,077,797 | |
Class FI | | | 2,815,514 | |
Class R | | | 579,476 | |
Class I | | | 65,360,825 | |
Class IS | | | 17,444,091 | |
| |
| Net Asset Value: | | | | |
Class A (and redemption price) | | | $65.58 | |
Class C* | | | $59.93 | |
Class FI (and redemption price) | | | $68.33 | |
Class R (and redemption price) | | | $65.82 | |
Class I (and redemption price) | | | $71.12 | |
Class IS (and redemption price) | | | $71.20 | |
| Maximum Public Offering Price Per Share: | | | | |
Class A (based on maximum initial sales charge of 5.75%) | | | $69.58 | |
| * | Redemption price per share is NAV of Class C shares reduced by a 1.00% CDSC if shares are redeemed within one year from purchase payment (Note 2). |
See Notes to Financial Statements.
| | | | |
20 | | | | ClearBridge International Growth Fund 2021 Annual Report |
Statement of operations
For the Year Ended October 31, 2021
| | | | |
| |
| Investment Income: | | | | |
Dividends | | $ | 79,199,469 | |
Interest from unaffiliated investments | | | 3,755 | |
Interest from affiliated investments | | | 1,574 | |
Less: Foreign taxes withheld | | | (9,296,660) | |
Total Investment Income | | | 69,908,138 | |
| |
| Expenses: | | | | |
Investment management fee (Note 2) | | | 40,208,065 | |
Transfer agent fees (Note 5) | | | 5,190,685 | |
Service and/or distribution fees (Notes 2 and 5) | | | 2,423,683 | |
Trustees’ fees | | | 672,835 | |
Registration fees | | | 306,366 | |
Custody fees | | | 297,974 | |
Legal fees | | | 198,498 | |
Fund accounting fees | | | 137,164 | |
Insurance | | | 40,790 | |
Audit and tax fees | | | 38,476 | |
Shareholder reports | | | 34,369 | |
Interest expense | | | 28,311 | |
Fees recaptured by investment manager (Note 2) | | | 16,941 | |
Miscellaneous expenses | | | 28,333 | |
Total Expenses | | | 49,622,490 | |
Less: Fee waivers and/or expense reimbursements (Notes 2 and 5) | | | (225,370) | |
Net Expenses | | | 49,397,120 | |
| Net Investment Income | | | 20,511,018 | |
| |
| Realized and Unrealized Gain (Loss) on Investments, Written Options and Foreign Currency Transactions (Notes 1, 3 and 4): | | | | |
Net Realized Gain (Loss) From: | | | | |
Investment transactions in unaffiliated securities | | | 190,395,711 | |
Written options | | | 756,828 | |
Foreign currency transactions | | | (760,823) | |
Net Realized Gain | | | 190,391,716 | |
Change in Net Unrealized Appreciation (Depreciation) From: | | | | |
Investments in unaffiliated securities | | | 948,289,089 | |
Foreign currencies | | | (367,292) | |
Change in Net Unrealized Appreciation (Depreciation) | | | 947,921,797 | |
| Net Gain on Investments, Written Options and Foreign Currency Transactions | | | 1,138,313,513 | |
| Increase in Net Assets From Operations | | $ | 1,158,824,531 | |
See Notes to Financial Statements.
| | | | | | |
| ClearBridge International Growth Fund 2021 Annual Report | | | | | 21 | |
Statements of changes in net assets
| | | | | | | | |
| For the Years Ended October 31, | | 2021 | | | 2020 | |
| | |
| Operations: | | | | | | | | |
Net investment income | | $ | 20,511,018 | | | $ | 8,289,137 | |
Net realized gain (loss) | | | 190,391,716 | | | | (66,281,952) | |
Change in net unrealized appreciation (depreciation) | | | 947,921,797 | | | | 399,689,660 | |
Increase in Net Assets From Operations | | | 1,158,824,531 | | | | 341,696,845 | |
| | |
| Distributions to Shareholders From (Notes 1 and 6): | | | | | | | | |
Total distributable earnings | | | (8,375,058) | | | | (8,000,055) | |
Decrease in Net Assets From Distributions to Shareholders | | | (8,375,058) | | | | (8,000,055) | |
| | |
| Fund Share Transactions (Note 7): | | | | | | | | |
Net proceeds from sale of shares | | | 2,725,590,362 | | | | 2,832,017,634 | |
Reinvestment of distributions | | | 7,293,532 | | | | 7,090,498 | |
Cost of shares repurchased | | | (1,564,316,035) | | | | (1,218,163,701) | |
Increase in Net Assets From Fund Share Transactions | | | 1,168,567,859 | | | | 1,620,944,431 | |
Increase in Net Assets | | | 2,319,017,332 | | | | 1,954,641,221 | |
| | |
| Net Assets: | | | | | | | | |
Beginning of year | | | 4,410,951,122 | | | | 2,456,309,901 | |
End of year | | $ | 6,729,968,454 | | | $ | 4,410,951,122 | |
See Notes to Financial Statements.
| | | | |
22 | | | | ClearBridge International Growth Fund 2021 Annual Report |
Financial highlights
| | | | | | | | | | | | | | | | | | | | |
| For a share of each class of beneficial interest outstanding throughout each year ended October 31: | |
| Class A Shares1 | | 2021 | | | 2020 | | | 2019 | | | 2018 | | | 2017 | |
| | | | | |
| Net asset value, beginning of year | | | $52.60 | | | | $47.79 | | | | $40.78 | | | | $42.11 | | | | $31.85 | |
| | | | | |
| Income (loss) from operations: | | | | | | | | | | | | | | | | | | | | |
Net investment income | | | 0.05 | | | | 0.02 | | | | 0.16 | | | | 0.14 | | | | 0.19 | |
Net realized and unrealized gain (loss) | | | 12.93 | | | | 4.86 | | | | 6.86 | | | | (1.44) | | | | 10.20 | |
Total income (loss) from operations | | | 12.98 | | | | 4.88 | | | | 7.02 | | | | (1.30) | | | | 10.39 | |
| | | | | |
| Less distributions from: | | | | | | | | | | | | | | | | | | | | |
Net investment income | | | — | | | | (0.07) | | | | (0.01) | | | | (0.03) | | | | (0.13) | |
Total distributions | | | — | | | | (0.07) | | | | (0.01) | | | | (0.03) | | | | (0.13) | |
| | | | | |
| Net asset value, end of year | | | $65.58 | | | | $52.60 | | | | $47.79 | | | | $40.78 | | | | $42.11 | |
Total return2 | | | 24.69 | % | | | 10.23 | % | | | 17.22 | % | | | (3.09) | % | | | 32.75 | % |
| | | | | |
| Net assets, end of year (000s) | | | $544,064 | | | | $387,465 | | | | $304,492 | | | | $84,163 | | | | $35,981 | |
| | | | | |
| Ratios to average net assets: | | | | | | | | | | | | | | | | | | | | |
Gross expenses | | | 1.06 | % | | | 1.10 | % | | | 1.14 | %3 | | | 1.16 | %3 | | | 1.22 | % |
Net expenses4,5 | | | 1.05 | | | | 1.10 | | | | 1.14 | 3 | | | 1.15 | 3 | | | 1.15 | |
Net investment income | | | 0.09 | | | | 0.04 | | | | 0.37 | | | | 0.32 | | | | 0.52 | |
| | | | | |
| Portfolio turnover rate | | | 39 | % | | | 23 | % | | | 20 | % | | | 31 | %6 | | | 176 | % |
| 1 | Per share amounts have been calculated using the average shares method. |
| 2 | Performance figures, exclusive of sales charges, may reflect compensating balance arrangements, fee waivers and/or expense reimbursements. In the absence of compensating balance arrangements, fee waivers and/or expense reimbursements, the total return would have been lower. Past performance is no guarantee of future results. |
| 3 | Reflects recapture of fees waived and/or expenses reimbursed from prior fiscal years. |
| 4 | Reflects fee waivers and/or expense reimbursements. |
| 5 | As a result of an expense limitation arrangement, effective May 21, 2021, the ratio of total annual fund operating expenses, other than interest, brokerage commissions, dividend expense on short sales, taxes, extraordinary expenses and acquired fund fees and expenses, to average net assets of Class A shares did not exceed 1.06%. This expense limitation arrangement cannot be terminated prior to December 31, 2023 without the Board of Trustees’ consent. In addition, the manager has agreed to waive the Fund’s management fee to an extent sufficient to offset the net management fee payable in connection with any investment in an affiliated money market fund. Prior to May 21, 2021, as a result of an expense limitation arrangement, the ratio of total annual fund operating expenses to average net assets of Class A shares did not exceed 1.15%. |
| 6 | Excludes securities delivered as a result of a redemption in-kind. |
See Notes to Financial Statements.
| | | | | | |
| ClearBridge International Growth Fund 2021 Annual Report | | | | | 23 | |
Financial highlights (cont’d)
| | | | | | | | | | | | | | | | | | | | |
| For a share of each class of beneficial interest outstanding throughout each year ended October 31: | |
| Class C Shares1 | | 2021 | | | 2020 | | | 2019 | | | 2018 | | | 2017 | |
| | | | | |
| Net asset value, beginning of year | | | $48.43 | | | | $44.29 | | | | $38.08 | | | | $39.59 | | | | $30.05 | |
| | | | | |
| Income (loss) from operations: | | | | | | | | | | | | | | | | | | | | |
Net investment loss | | | (0.40) | | | | (0.35) | | | | (0.12) | | | | (0.15) | | | | (0.07) | |
Net realized and unrealized gain (loss) | | | 11.90 | | | | 4.49 | | | | 6.33 | | | | (1.36) | | | | 9.61 | |
Total income (loss) from operations | | | 11.50 | | | | 4.14 | | | | 6.21 | | | | (1.51) | | | | 9.54 | |
| | | | | |
| Net asset value, end of year | | | $59.93 | | | | $48.43 | | | | $44.29 | | | | $38.08 | | | | $39.59 | |
Total return2 | | | 23.74 | % | | | 9.32 | % | | | 16.34 | % | | | (3.81) | % | | | 31.75 | % |
| | | | | |
| Net assets, end of year (000s) | | | $64,591 | | | | $48,930 | | | | $43,066 | | | | $78,846 | | | | $82,265 | |
| | | | | |
| Ratios to average net assets: | | | | | | | | | | | | | | | | | | | | |
Gross expenses3 | | | 1.82 | % | | | 1.90 | % | | | 1.91 | % | | | 1.92 | % | | | 2.03 | % |
Net expenses3,4,5 | | | 1.81 | | | | 1.90 | | | | 1.90 | | | | 1.90 | | | | 1.90 | |
Net investment loss | | | (0.68) | | | | (0.77) | | | | (0.31) | | | | (0.35) | | | | (0.20) | |
| | | | | |
| Portfolio turnover rate | | | 39 | % | | | 23 | % | | | 20 | % | | | 31 | %6 | | | 176 | % |
| 1 | Per share amounts have been calculated using the average shares method. |
| 2 | Performance figures, exclusive of CDSC, may reflect compensating balance arrangements, fee waivers and/or expense reimbursements. In the absence of compensating balance arrangements, fee waivers and/or expense reimbursements, the total return would have been lower. Past performance is no guarantee of future results. |
| 3 | Reflects recapture of fees waived and/or expenses reimbursed from prior fiscal years. |
| 4 | Reflects fee waivers and/or expense reimbursements. |
| 5 | As a result of an expense limitation arrangement, the ratio of total annual fund operating expenses, other than interest, brokerage commissions, dividend expense on short sales, taxes, extraordinary expenses and acquired fund fees and expenses, to average net assets of Class C shares did not exceed 1.90%. This expense limitation arrangement cannot be terminated prior to December 31, 2023 without the Board of Trustees’ consent. In addition, the manager has agreed to waive the Fund’s management fee to an extent sufficient to offset the net management fee payable in connection with any investment in an affiliated money market fund. |
| 6 | Excludes securities delivered as a result of a redemption in-kind. |
See Notes to Financial Statements.
| | | | |
24 | | | | ClearBridge International Growth Fund 2021 Annual Report |
| | | | | | | | | | | | | | | | | | | | |
| For a share of each class of beneficial interest outstanding throughout each year ended October 31: | |
| Class FI Shares1 | | 2021 | | | 2020 | | | 2019 | | | 2018 | | | 2017 | |
| | | | | |
| Net asset value, beginning of year | | | $54.82 | | | | $49.83 | | | | $42.52 | | | | $43.90 | | | | $33.17 | |
| | | | | |
| Income (loss) from operations: | | | | | | | | | | | | | | | | | | | | |
Net investment income (loss) | | | 0.02 | | | | (0.01) | | | | 0.17 | | | | 0.14 | | | | 0.21 | |
Net realized and unrealized gain (loss) | | | 13.49 | | | | 5.08 | | | | 7.14 | | | | (1.50) | | | | 10.62 | |
Total income (loss) from operations | | | 13.51 | | | | 5.07 | | | | 7.31 | | | | (1.36) | | | | 10.83 | |
| | | | | |
| Less distributions from: | | | | | | | | | | | | | | | | | | | | |
Net investment income | | | — | | | | (0.08) | | | | (0.00) | 2 | | | (0.02) | | | | (0.10) | |
Total distributions | | | — | | | | (0.08) | | | | (0.00) | 2 | | | (0.02) | | | | (0.10) | |
| | | | | |
| Net asset value, end of year | | | $68.33 | | | | $54.82 | | | | $49.83 | | | | $42.52 | | | | $43.90 | |
Total return3 | | | 24.63 | % | | | 10.17 | % | | | 17.20 | % | | | (3.10) | % | | | 32.76 | % |
| | | | | |
| Net assets, end of year (000s) | | | $192,371 | | | | $136,487 | | | | $99,595 | | | | $30,126 | | | | $12,710 | |
| | | | | |
| Ratios to average net assets: | | | | | | | | | | | | | | | | | | | | |
Gross expenses | | | 1.09 | % | | | 1.15 | %4 | | | 1.17 | %4 | | | 1.22 | %4 | | | 1.29 | % |
Net expenses5,6 | | | 1.09 | | | | 1.15 | 4 | | | 1.15 | 4 | | | 1.15 | 4 | | | 1.15 | |
Net investment income (loss) | | | 0.03 | | | | (0.03) | | | | 0.37 | | | | 0.30 | | | | 0.55 | |
| | | | | |
| Portfolio turnover rate | | | 39 | % | | | 23 | % | | | 20 | % | | | 31 | %7 | | | 176 | % |
| 1 | Per share amounts have been calculated using the average shares method. |
| 2 | Amount represents less than $0.005 per share. |
| 3 | Performance figures may reflect compensating balance arrangements, fee waivers and/or expense reimbursements. In the absence of compensating balance arrangements, fee waivers and/or expense reimbursements, the total return would have been lower. Past performance is no guarantee of future results. |
| 4 | Reflects recapture of fees waived and/or expenses reimbursed from prior fiscal years. |
| 5 | Reflects fee waivers and/or expense reimbursements. |
| 6 | As a result of an expense limitation arrangement, the ratio of total annual fund operating expenses, other than interest, brokerage commissions, dividend expense on short sales, taxes, extraordinary expenses and acquired fund fees and expenses, to average net assets of Class FI shares did not exceed 1.15%. This expense limitation arrangement cannot be terminated prior to December 31, 2023 without the Board of Trustees’ consent. In addition, the manager has agreed to waive the Fund’s management fee to an extent sufficient to offset the net management fee payable in connection with any investment in an affiliated money market fund. |
| 7 | Excludes securities delivered as a result of a redemption in-kind. |
See Notes to Financial Statements.
| | | | | | |
| ClearBridge International Growth Fund 2021 Annual Report | | | | | 25 | |
Financial highlights (cont’d)
| | | | | | | | | | | | | | | | | | | | |
| For a share of each class of beneficial interest outstanding throughout each year ended October 31: | |
| Class R Shares1 | | 2021 | | | 2020 | | | 2019 | | | 2018 | | | 2017 | |
| | | | | |
| Net asset value, beginning of year | | | $52.98 | | | | $48.20 | | | | $41.23 | | | | $42.65 | | | | $32.30 | |
| | | | | |
| Income (loss) from operations: | | | | | | | | | | | | | | | | | | | | |
Net investment income (loss) | | | (0.16) | | | | (0.13) | | | | 0.07 | | | | 0.06 | | | | 0.19 | |
Net realized and unrealized gain (loss) | | | 13.00 | | | | 4.91 | | | | 6.90 | | | | (1.48) | | | | 10.25 | |
Total income (loss) from operations | | | 12.84 | | | | 4.78 | | | | 6.97 | | | | (1.42) | | | | 10.44 | |
| | | | | |
| Less distributions from: | | | | | | | | | | | | | | | | | | | | |
Net investment income | | | — | | | | — | | | | — | | | | — | | | | (0.09) | |
Total distributions | | | — | | | | — | | | | — | | | | — | | | | (0.09) | |
| | | | | |
| Net asset value, end of year | | | $65.82 | | | | $52.98 | | | | $48.20 | | | | $41.23 | | | | $42.65 | |
Total return2 | | | 24.24 | % | | | 9.92 | % | | | 16.90 | % | | | (3.33) | % | | | 32.43 | % |
| | | | | |
| Net assets, end of year (000s) | | | $38,142 | | | | $20,575 | | | | $13,030 | | | | $4,895 | | | | $1,895 | |
| | | | | |
| Ratios to average net assets: | | | | | | | | | | | | | | | | | | | | |
Gross expenses | | | 1.40 | % | | | 1.44 | %3 | | | 1.47 | %3 | | | 1.53 | % | | | 1.59 | % |
Net expenses4,5 | | | 1.40 | | | | 1.40 | 3 | | | 1.40 | 3 | | | 1.40 | | | | 1.40 | |
Net investment income (loss) | | | (0.25) | | | | (0.27) | | | | 0.15 | | | | 0.15 | | | | 0.51 | |
| | | | | |
| Portfolio turnover rate | | | 39 | % | | | 23 | % | | | 20 | % | | | 31 | %6 | | | 176 | % |
| 1 | Per share amounts have been calculated using the average shares method. |
| 2 | Performance figures may reflect compensating balance arrangements, fee waivers and/or expense reimbursements. In the absence of compensating balance arrangements, fee waivers and/or expense reimbursements, the total return would have been lower. Past performance is no guarantee of future results. |
| 3 | Reflects recapture of fees waived and/or expenses reimbursed from prior fiscal years. |
| 4 | Reflects fee waivers and/or expense reimbursements. |
| 5 | As a result of an expense limitation arrangement, the ratio of total annual fund operating expenses, other than interest, brokerage commissions, dividend expense on short sales, taxes, extraordinary expenses and acquired fund fees and expenses, to average net assets of Class R shares did not exceed 1.40%. This expense limitation arrangement cannot be terminated prior to December 31, 2023 without the Board of Trustees’ consent. In addition, the manager has agreed to waive the Fund’s management fee to an extent sufficient to offset the net management fee payable in connection with any investment in an affiliated money market fund. |
| 6 | Excludes securities delivered as a result of a redemption in-kind. |
See Notes to Financial Statements.
| | | | |
26 | | | | ClearBridge International Growth Fund 2021 Annual Report |
| | | | | | | | | | | | | | | | | | | | |
| For a share of each class of beneficial interest outstanding throughout each year ended October 31: | |
| Class I Shares1 | | 2021 | | | 2020 | | | 2019 | | | 2018 | | | 2017 | |
| | | | | |
| Net asset value, beginning of year | | | $56.99 | | | | $51.71 | | | | $44.09 | | | | $45.48 | | | | $34.37 | |
| | | | | |
| Income (loss) from operations: | | | | | | | | | | | | | | | | | | | | |
Net investment income | | | 0.25 | | | | 0.16 | | | | 0.33 | | | | 0.28 | | | | 0.29 | |
Net realized and unrealized gain (loss) | | | 13.99 | | | | 5.29 | | | | 7.39 | | | | (1.57) | | | | 11.01 | |
Total income (loss) from operations | | | 14.24 | | | | 5.45 | | | | 7.72 | | | | (1.29) | | | | 11.30 | |
| | | | | |
| Less distributions from: | | | | | | | | | | | | | | | | | | | | |
Net investment income | | | (0.11) | | | | (0.17) | | | | (0.10) | | | | (0.10) | | | | (0.19) | |
Total distributions | | | (0.11) | | | | (0.17) | | | | (0.10) | | | | (0.10) | | | | (0.19) | |
| | | | | |
| Net asset value, end of year | | | $71.12 | | | | $56.99 | | | | $51.71 | | | | $44.09 | | | | $45.48 | |
Total return2 | | | 25.02 | % | | | 10.57 | % | | | 17.56 | % | | | (2.85) | % | | | 33.07 | % |
| | | | | |
| Net assets, end of year (millions) | | | $4,649 | | | | $3,144 | | | | $1,739 | | | | $429 | | | | $78 | |
| | | | | |
| Ratios to average net assets: | | | | | | | | | | | | | | | | | | | | |
Gross expenses | | | 0.78 | % | | | 0.81 | % | | | 0.85 | %3 | | | 0.91 | %3 | | | 0.98 | % |
Net expenses4,5 | | | 0.78 | | | | 0.81 | | | | 0.85 | 3 | | | 0.90 | 3 | | | 0.90 | |
Net investment income | | | 0.37 | | | | 0.30 | | | | 0.68 | | | | 0.60 | | | | 0.74 | |
| | | | | |
| Portfolio turnover rate | | | 39 | % | | | 23 | % | | | 20 | % | | | 31 | %6 | | | 176 | % |
| 1 | Per share amounts have been calculated using the average shares method. |
| 2 | Performance figures may reflect compensating balance arrangements, fee waivers and/or expense reimbursements. In the absence of compensating balance arrangements, fee waivers and/or expense reimbursements, the total return would have been lower. Past performance is no guarantee of future results. |
| 3 | Reflects recapture of fees waived and/or expenses reimbursed from prior fiscal years. |
| 4 | Reflects fee waivers and/or expense reimbursements. |
| 5 | As a result of an expense limitation arrangement, the ratio of total annual fund operating expenses, other than interest, brokerage commissions, dividend expense on short sales, taxes, extraordinary expenses and acquired fund fees and expenses, to average net assets of Class I shares did not exceed 0.90%. This expense limitation arrangement cannot be terminated prior to December 31, 2023 without the Board of Trustees’ consent. In addition, the manager has agreed to waive the Fund’s management fee to an extent sufficient to offset the net management fee payable in connection with any investment in an affiliated money market fund. |
| 6 | Excludes securities delivered as a result of a redemption in-kind. |
See Notes to Financial Statements.
| | | | | | |
| ClearBridge International Growth Fund 2021 Annual Report | | | | | 27 | |
Financial highlights (cont’d)
| | | | | | | | | | | | | | | | |
For a share of each class of beneficial interest outstanding throughout each year ended October 31,
unless otherwise noted: | |
| Class IS Shares1 | | 2021 | | | 2020 | | | 2019 | | | 20182 | |
| | | | |
| Net asset value, beginning of year | | | $57.02 | | | | $51.73 | | | | $44.09 | | | | $47.90 | |
| | | | |
| Income (loss) from operations: | | | | | | | | | | | | | | | | |
Net investment income (loss) | | | 0.31 | | | | 0.18 | | | | 0.25 | | | | (0.01) | |
Net realized and unrealized gain (loss) | | | 14.01 | | | | 5.31 | | | | 7.51 | | | | (3.80) | |
Total income (loss) from operations | | | 14.32 | | | | 5.49 | | | | 7.76 | | | | (3.81) | |
| | | | |
| Less distributions from: | | | | | | | | | | | | | | | | |
Net investment income | | | (0.14) | | | | (0.20) | | | | (0.12) | | | | — | |
Total distributions | | | (0.14) | | | | (0.20) | | | | (0.12) | | | | — | |
| | | | |
| Net asset value, end of year | | | $71.20 | | | | $57.02 | | | | $51.73 | | | | $44.09 | |
Total return3 | | | 25.14 | % | | | 10.64 | % | | | 17.66 | % | | | (7.93) | % |
| | | | |
| Net assets, end of year (000s) | | | $1,242,045 | | | | $665,030 | | | | $254,867 | | | | $46 | |
| | | | |
| Ratios to average net assets: | | | | | | | | | | | | | | | | |
Gross expenses | | | 0.69 | % | | | 0.72 | % | | | 0.76 | %4 | | | 0.82 | %5 |
Net expenses6 | | | 0.69 | 7 | | | 0.72 | 7 | | | 0.76 | 4 | | | 0.80 | 5,7 |
Net investment income (loss) | | | 0.45 | | | | 0.32 | | | | 0.51 | | | | (0.17) | 5 |
| | | | |
| Portfolio turnover rate | | | 39 | % | | | 23 | % | | | 20 | % | | | 31 | %8,9 |
| 1 | Per share amounts have been calculated using the average shares method. |
| 2 | For the period September 17, 2018 (inception date) to October 31, 2018. |
| 3 | Performance figures may reflect compensating balance arrangements, fee waivers and/or expense reimbursements. In the absence of compensating balance arrangements, fee waivers and/or expense reimbursements, the total return would have been lower. Past performance is no guarantee of future results. Total returns for periods of less than one year are not annualized. |
| 4 | Reflects recapture of fees waived and/or expenses reimbursed from prior fiscal years. |
| 6 | As a result of an expense limitation arrangement, the ratio of total annual fund operating expenses, other than interest, brokerage commissions, dividend expense on short sales, taxes, extraordinary expenses and acquired fund fees and expenses, to average net assets of Class IS shares did not exceed 0.80%. In addition, the ratio of total annual fund operating expenses for Class IS shares did not exceed the ratio of total annual fund operating expenses for Class I shares. These expense limitation arrangements cannot be terminated prior to December 31, 2023 without the Board of Trustees’ consent. In addition, the manager has agreed to waive the Fund’s management fee to an extent sufficient to offset the net management fee payable in connection with any investment in an affiliated money market fund. |
| 7 | Reflects fee waivers and/or expense reimbursements. |
| 8 | Excludes securities delivered as a result of a redemption in-kind. |
| 9 | For the year ended October 31, 2018. |
See Notes to Financial Statements.
| | | | |
28 | | | | ClearBridge International Growth Fund 2021 Annual Report |
Notes to financial statements
1. Organization and significant accounting policies
ClearBridge International Growth Fund (the “Fund”) is a separate non-diversified investment series of Legg Mason Global Asset Management Trust (the “Trust”). The Trust, a Maryland statutory trust, is registered under the Investment Company Act of 1940, as amended (the “1940 Act”), as an open-end management investment company.
The following are significant accounting policies consistently followed by the Fund and are in conformity with U.S. generally accepted accounting principles (“GAAP”). Estimates and assumptions are required to be made regarding assets, liabilities and changes in net assets resulting from operations when financial statements are prepared. Changes in the economic environment, financial markets and any other parameters used in determining these estimates could cause actual results to differ. Subsequent events have been evaluated through the date the financial statements were issued.
(a) Investment valuation. Equity securities for which market quotations are available are valued at the last reported sales price or official closing price on the primary market or exchange on which they trade. The valuations for fixed income securities (which may include, but are not limited to, corporate, government, municipal, mortgage-backed, collateralized mortgage obligations and asset-backed securities) and certain derivative instruments are typically the prices supplied by independent third party pricing services, which may use market prices or broker/dealer quotations or a variety of valuation techniques and methodologies. The independent third party pricing services typically use inputs that are observable such as issuer details, interest rates, yield curves, prepayment speeds, credit risks/spreads, default rates and quoted prices for similar securities. Investments in open-end funds are valued at the closing net asset value per share of each fund on the day of valuation. When the Fund holds securities or other assets that are denominated in a foreign currency, the Fund will normally use the currency exchange rates as of 4:00 p.m. (Eastern Time). If independent third party pricing services are unable to supply prices for a portfolio investment, or if the prices supplied are deemed by the manager to be unreliable, the market price may be determined by the manager using quotations from one or more broker/dealers or at the transaction price if the security has recently been purchased and no value has yet been obtained from a pricing service or pricing broker. When reliable prices are not readily available, such as when the value of a security has been significantly affected by events after the close of the exchange or market on which the security is principally traded, but before the Fund calculates its net asset value, the Fund values these securities as determined in accordance with procedures approved by the Fund’s Board of Trustees.
The Board of Trustees is responsible for the valuation process and has delegated the supervision of the daily valuation process to the Global Fund Valuation Committee (known as Legg Mason North Atlantic Fund Valuation Committee prior to March 1, 2021) (the “Valuation Committee”). The Valuation Committee, pursuant to the policies adopted by the Board of Trustees, is responsible for making fair value determinations, evaluating the effectiveness of the Fund’s pricing policies, and reporting to the Board of Trustees. When determining the reliability of third party pricing information for investments owned by the
| | | | | | |
| ClearBridge International Growth Fund 2021 Annual Report | | | | | 29 | |
Notes to financial statements (cont’d)
Fund, the Valuation Committee, among other things, conducts due diligence reviews of pricing vendors, monitors the daily change in prices and reviews transactions among market participants.
The Valuation Committee will consider pricing methodologies it deems relevant and appropriate when making fair value determinations. Examples of possible methodologies include, but are not limited to, multiple of earnings; discount from market of a similar freely traded security; discounted cash-flow analysis; book value or a multiple thereof; risk premium/yield analysis; yield to maturity; and/or fundamental investment analysis. The Valuation Committee will also consider factors it deems relevant and appropriate in light of the facts and circumstances. Examples of possible factors include, but are not limited to, the type of security; the issuer’s financial statements; the purchase price of the security; the discount from market value of unrestricted securities of the same class at the time of purchase; analysts’ research and observations from financial institutions; information regarding any transactions or offers with respect to the security; the existence of merger proposals or tender offers affecting the security; the price and extent of public trading in similar securities of the issuer or comparable companies; and the existence of a shelf registration for restricted securities.
For each portfolio security that has been fair valued pursuant to the policies adopted by the Board of Trustees, the fair value price is compared against the last available and next available market quotations. The Valuation Committee reviews the results of such back testing monthly and fair valuation occurrences are reported to the Board of Trustees quarterly.
The Fund uses valuation techniques to measure fair value that are consistent with the market approach and/or income approach, depending on the type of security and the particular circumstance. The market approach uses prices and other relevant information generated by market transactions involving identical or comparable securities. The income approach uses valuation techniques to discount estimated future cash flows to present value.
GAAP establishes a disclosure hierarchy that categorizes the inputs to valuation techniques used to value assets and liabilities at measurement date. These inputs are summarized in the three broad levels listed below:
| • | | Level 1 — quoted prices in active markets for identical investments |
| • | | Level 2 — other significant observable inputs (including quoted prices for similar investments, interest rates, prepayment speeds, credit risk, etc.) |
| • | | Level 3 — significant unobservable inputs (including the Fund’s own assumptions in determining the fair value of investments) |
The inputs or methodologies used to value securities are not necessarily an indication of the risk associated with investing in those securities.
| | | | |
30 | | | | ClearBridge International Growth Fund 2021 Annual Report |
The following is a summary of the inputs used in valuing the Fund’s assets carried at fair value:
| | | | | | | | | | | | | | | | |
| ASSETS | |
| Description | | Quoted Prices
(Level 1) | | | Other Significant
Observable Inputs
(Level 2)* | | | Significant
Unobservable
Inputs (Level 3) | | | Total | |
| Long-Term Investments†: | | | | | | | | | | | | | | | | |
Common Stocks: | | | | | | | | | | | | | | | | |
Communication Services | | $ | 60,203,428 | | | $ | 82,586,049 | | | | — | | | $ | 142,789,477 | |
Consumer Discretionary | | | 44,109,219 | | | | 677,908,087 | | | | — | | | | 722,017,306 | |
Consumer Staples | | | 152,537,896 | | | | 619,855,430 | | | | — | | | | 772,393,326 | |
Financials | | | 32,712,316 | | | | 646,733,729 | | | | — | | | | 679,446,045 | |
Health Care | | | 393,779,905 | | | | 474,935,445 | | | | — | | | | 868,715,350 | |
Industrials | | | 253,637,035 | | | | 978,562,216 | | | | — | | | | 1,232,199,251 | |
Information Technology | | | 753,091,796 | | | | 764,733,403 | | | | — | | | | 1,517,825,199 | |
Materials | | | — | | | | 365,276,772 | | | | — | | | | 365,276,772 | |
Other Common Stocks | | | 254,155,421 | | | | — | | | | — | | | | 254,155,421 | |
| Total Long-Term Investments | | | 1,944,227,016 | | | | 4,610,591,131 | | | | — | | | | 6,554,818,147 | |
| Short-Term Investments† | | | 125,894,472 | | | | — | | | | — | | | | 125,894,472 | |
| Total Investments | | $ | 2,070,121,488 | | | $ | 4,610,591,131 | | | | — | | | $ | 6,680,712,619 | |
| * | As a result of the fair value pricing procedures for international equities utilized by the Fund, which account for events occurring after the close of the principal market of the security but prior to the calculation of the Fund’s net asset value, certain securities were classified as Level 2 within the fair value hierarchy. |
| † | See Schedule of Investments for additional detailed categorizations. |
(b) Written options. When the Fund writes an option, an amount equal to the premium received by the Fund is recorded as a liability, the value of which is marked-to-market daily to reflect the current market value of the option written. If the option expires, the premium received is recorded as a realized gain. When a written call option is exercised, the difference between the premium received plus the option exercise price and the Fund’s basis in the underlying security (in the case of a covered written call option), or the cost to purchase the underlying security (in the case of an uncovered written call option), including brokerage commission, is recognized as a realized gain or loss. When a written put option is exercised, the amount of the premium received is subtracted from the cost of the security purchased by the Fund from the exercise of the written put option to form the Fund’s basis in the underlying security purchased. The writer or buyer of an option traded on an exchange can liquidate the position before the exercise of the option by entering into a closing transaction. The cost of a closing transaction is deducted from the original premium received resulting in a realized gain or loss to the Fund.
The risk in writing a covered call option is that the Fund may forego the opportunity of profit if the market price of the underlying security increases and the option is exercised. The risk in writing a put option is that the Fund may incur a loss if the market price of the underlying security decreases and the option is exercised. The risk in writing an uncovered call option is that the Fund is exposed to the risk of loss if the market price of the underlying security
| | | | | | |
| ClearBridge International Growth Fund 2021 Annual Report | | | | | 31 | |
Notes to financial statements (cont’d)
increases. In addition, there is the risk that the Fund may not be able to enter into a closing transaction because of an illiquid secondary market.
(c) Foreign currency translation. Investment securities and other assets and liabilities denominated in foreign currencies are translated into U.S. dollar amounts based upon prevailing exchange rates on the date of valuation. Purchases and sales of investment securities and income and expense items denominated in foreign currencies are translated into U.S. dollar amounts based upon prevailing exchange rates on the respective dates of such transactions.
The Fund does not isolate that portion of the results of operations resulting from fluctuations in foreign exchange rates on investments from the fluctuations arising from changes in market prices of securities held. Such fluctuations are included with the net realized and unrealized gain or loss on investments.
Net realized foreign exchange gains or losses arise from sales of foreign currencies, including gains and losses on forward foreign currency contracts, currency gains or losses realized between the trade and settlement dates on securities transactions, and the difference between the amounts of dividends, interest, and foreign withholding taxes recorded on the Fund’s books and the U.S. dollar equivalent of the amounts actually received or paid. Net unrealized foreign exchange gains and losses arise from changes in the values of assets and liabilities, other than investments in securities, on the date of valuation, resulting from changes in exchange rates.
Foreign security and currency transactions may involve certain considerations and risks not typically associated with those of U.S. dollar denominated transactions as a result of, among other factors, the possibility of lower levels of governmental supervision and regulation of foreign securities markets and the possibility of political or economic instability.
(d) Foreign investment risks. The Fund’s investments in foreign securities may involve risks not present in domestic investments. Since securities may be denominated in foreign currencies, may require settlement in foreign currencies or may pay interest or dividends in foreign currencies, changes in the relationship of these foreign currencies to the U.S. dollar can significantly affect the value of the investments and earnings of the Fund. Foreign investments may also subject the Fund to foreign government exchange restrictions, expropriation, taxation or other political, social or economic developments, all of which affect the market and/or credit risk of the investments.
(e) Counterparty risk and credit-risk-related contingent features of derivative instruments. The Fund may invest in certain securities or engage in other transactions where the Fund is exposed to counterparty credit risk in addition to broader market risks. The Fund may invest in securities of issuers, which may also be considered counterparties as trading partners in other transactions. This may increase the risk of loss in the event of default or bankruptcy by the counterparty or if the counterparty otherwise fails to meet its contractual obligations. The Fund’s subadviser attempts to mitigate counterparty risk by (i) periodically assessing the creditworthiness of its trading partners, (ii) monitoring and/or limiting the amount of its net exposure to each individual counterparty based on its
| | | | |
32 | | | | ClearBridge International Growth Fund 2021 Annual Report |
assessment and (iii) requiring collateral from the counterparty for certain transactions. Market events and changes in overall economic conditions may impact the assessment of such counterparty risk by the subadviser. In addition, declines in the values of underlying collateral received may expose the Fund to increased risk of loss.
With exchange traded and centrally cleared derivatives, there is less counterparty risk to the Fund since the exchange or clearinghouse, as counterparty to such instruments, guarantees against a possible default. The clearinghouse stands between the buyer and the seller of the contract; therefore, the credit risk is limited to failure of the clearinghouse. While offset rights may exist under applicable law, the Fund does not have a contractual right of offset against a clearing broker or clearinghouse in the event of a default of the clearing broker or clearinghouse.
The Fund has entered into master agreements, such as an International Swaps and Derivatives Association, Inc. Master Agreement (“ISDA Master Agreement”) or similar agreement, with certain of its derivative counterparties that govern over-the-counter (“OTC”) derivatives and provide for general obligations, representations, agreements, collateral posting terms, netting provisions in the event of default or termination and credit related contingent features. The credit related contingent features include, but are not limited to, a percentage decrease in the Fund’s net assets or net asset value per share over a specified period of time. If these credit related contingent features were triggered, the derivatives counterparty could terminate the positions and demand payment or require additional collateral.
Under an ISDA Master Agreement, the Fund may, under certain circumstances, offset with the counterparty certain derivative financial instruments’ payables and/or receivables with collateral held and/or posted and create one single net payment. However, absent an event of default by the counterparty or a termination of the agreement, the terms of the ISDA Master Agreements do not result in an offset of reported amounts of financial assets and financial liabilities in the Statement of Assets and Liabilities across transactions between the Fund and the applicable counterparty. The enforceability of the right to offset may vary by jurisdiction.
Collateral requirements differ by type of derivative. Collateral or margin requirements are set by the broker or exchange clearinghouse for exchange traded derivatives while collateral terms are contract specific for OTC traded derivatives. Cash collateral that has been pledged to cover obligations of the Fund under derivative contracts, if any, will be reported separately in the Statement of Assets and Liabilities. Securities pledged as collateral, if any, for the same purpose are noted in the Schedule of Investments.
As of October 31, 2021, the Fund did not have any open OTC derivative transactions with credit related contingent features in a net liability position.
(f) Security transactions and investment income. Security transactions are accounted for on a trade date basis. Interest income (including interest income from payment-in-kind securities), adjusted for amortization of premium and accretion of discount, is recorded on the accrual basis. Dividend income is recorded on the ex-dividend date for dividends received in cash and/or securities. Foreign dividend income is recorded on the ex-dividend
| | | | | | |
| ClearBridge International Growth Fund 2021 Annual Report | | | | | 33 | |
Notes to financial statements (cont’d)
date or as soon as practicable after the Fund determines the existence of a dividend declaration after exercising reasonable due diligence. The cost of investments sold is determined by use of the specific identification method. To the extent any issuer defaults or a credit event occurs that impacts the issuer, the Fund may halt any additional interest income accruals and consider the realizability of interest accrued up to the date of default or credit event.
(g) Distributions to shareholders. Distributions from net investment income and distributions of net realized gains, if any, are declared at least annually. Distributions to shareholders of the Fund are recorded on the ex-dividend date and are determined in accordance with income tax regulations, which may differ from GAAP.
(h) Share class accounting. Investment income, common expenses and realized/ unrealized gains (losses) on investments are allocated to the various classes of the Fund on the basis of daily net assets of each class. Fees relating to a specific class are charged directly to that share class.
(i) Compensating balance arrangements. The Fund has an arrangement with its custodian bank whereby a portion of the custodian’s fees is paid indirectly by credits earned on the Fund’s cash on deposit with the bank.
(j) Federal and other taxes. It is the Fund’s policy to comply with the federal income and excise tax requirements of the Internal Revenue Code of 1986 (the “Code”), as amended, applicable to regulated investment companies. Accordingly, the Fund intends to distribute its taxable income and net realized gains, if any, to shareholders in accordance with timing requirements imposed by the Code. Therefore, no federal or state income tax provision is required in the Fund’s financial statements.
Management has analyzed the Fund’s tax positions taken on income tax returns for all open tax years and has concluded that as of October 31, 2021, no provision for income tax is required in the Fund’s financial statements. The Fund’s federal and state income and federal excise tax returns for tax years for which the applicable statutes of limitations have not expired are subject to examination by the Internal Revenue Service and state departments of revenue.
Under the applicable foreign tax laws, a withholding tax may be imposed on interest, dividends and capital gains at various rates.
(k) Reclassification. GAAP requires that certain components of net assets be reclassified to reflect permanent differences between financial and tax reporting. These reclassifications have no effect on net assets or net asset value per share. During the current year, the Fund had no reclassifications.
2. Investment advisory and management agreement and other transactions with affiliates
The Fund has an investment advisory and management agreement with ClearBridge Investments, LLC (“ClearBridge”). Pursuant to the agreement, ClearBridge provides the Fund with investment advisory, management and administrative services for which the Fund pays a fee, computed daily and payable monthly, at annual rates based on the Fund’s average
| | | | |
34 | | | | ClearBridge International Growth Fund 2021 Annual Report |
daily net assets. Western Asset Management Company, LLC (“Western Asset”) manages the portion of the Fund’s cash and short-term instruments allocated to it. The following chart shows the annual management fee rates for the Fund:
| | | | |
| Average Daily Net Assets | | Annual Rate | |
| First $1 billion | | | 0.700 | % |
| Next $1 billion | | | 0.680 | |
| Next $3 billion | | | 0.650 | |
| Next $5 billion | | | 0.620 | |
| Over $10 billion | | | 0.590 | |
Legg Mason Partners Fund Advisor, LLC (“LMPFA”) serves as the sub-administrator to the Fund and provides certain administrative services to the Fund pursuant to a separate sub-administration agreement between ClearBridge and LMPFA. For LMPFA’s services to the Fund, ClearBridge (not the Fund) pays LMPFA a fee, calculated daily and payable monthly, at an annual rate of 0.05% of the average daily net assets of the Fund. For Western Asset’s services to the Fund, ClearBridge (not the Fund) pays Western Asset 0.02% of the portion of the Fund’s average daily net assets that are allocated to it by ClearBridge. ClearBridge, LMPFA and Western Asset are indirect, wholly-owned subsidiaries of Franklin Resources, Inc. (“Franklin Resources”).
As a result of expense limitation arrangements between the Fund and ClearBridge, the ratio of total annual fund operating expenses, other than interest, brokerage commissions, dividend expense on short sales, taxes, extraordinary expenses and acquired fund fees and expenses, to average net assets of Class A, Class C, Class FI, Class R, Class I and Class IS shares did not exceed 1.06% (1.15% prior to May 21, 2021), 1.90%, 1.15%, 1.40%, 0.90% and 0.80%, respectively. In addition, the ratio of total annual fund operating expenses for Class IS shares did not exceed the ratio of total annual fund operating expenses for Class I shares. These expense limitation arrangements cannot be terminated prior to December 31, 2023 without the Board of Trustees’ consent. In addition, the manager has agreed to waive the Fund’s management fee to an extent sufficient to offset the net management fee payable in connection with any investment in an affiliated money market fund (the “affiliated money market fund waiver”). The affiliated money market fund waiver is not subject to the recapture provision discussed below.
During the year ended October 31, 2021, fees waived and/or expenses reimbursed amounted to $225,370, which included an affiliated money market fund waiver of $1,863.
ClearBridge is permitted to recapture amounts waived and/or reimbursed to a class within three years after the fiscal year in which ClearBridge earned the fee or incurred the expense if the class’ total annual fund operating expenses have fallen to a level below the expense limitation (“expense cap”) in effect at the time the fees were earned or the expenses incurred. In no case will ClearBridge recapture any amount that would result, on any particular business day of the Fund, in the class’ total annual fund operating expenses exceeding the expense cap or any other lower limit then in effect.
| | | | | | |
| ClearBridge International Growth Fund 2021 Annual Report | | | | | 35 | |
Notes to financial statements (cont’d)
Pursuant to these arrangements, at October 31, 2021, the Fund had remaining fee waivers and/or expense reimbursements subject to recapture by ClearBridge and respective dates of expiration as follows:
| | | | | | | | | | | | | | | | | | | | |
| | | Class A | | | Class C | | | Class FI | | | Class R | | | Class I | |
| Expires October 31, 2022 | | $ | 433 | | | $ | 346 | | | $ | 164 | | | $ | 5,364 | | | $ | 2,011 | |
| Expires October 31, 2023 | | | — | | | | 117 | | | | — | | | | 6,318 | | | | — | |
| Expires October 31, 2024 | | | 26,600 | | | | — | | | | — | | | | 466 | | | | — | |
| Total fee waivers/expense reimbursements subject to recapture | | $ | 27,033 | | | $ | 463 | | | $ | 164 | | | $ | 12,148 | | | $ | 2,011 | |
For the year ended October 31, 2021, fee waivers and/or expense reimbursements recaptured by ClearBridge, if any, were as follows:
| | | | |
| | | Class C | |
| ClearBridge recaptured | | $ | 16,941 | |
Franklin Distributors, LLC (known as Legg Mason Investor Services, LLC prior to July 7, 2021) (“Franklin Distributors”) serves as the Fund’s sole and exclusive distributor. Franklin Distributors is an indirect, wholly-owned broker-dealer subsidiary of Franklin Resources.
There is a maximum initial sales charge of 5.75% for Class A shares. There is a contingent deferred sales charge (“CDSC”) of 1.00% on Class C shares, which applies if redemption occurs within 12 months from purchase payment. In certain cases, Class A shares have a 1.00% CDSC, which applies if redemption occurs within 18 months from purchase payment. This CDSC only applies to those purchases of Class A shares, which, when combined with current holdings of other shares of Legg Mason funds, equal or exceed $1,000,000 in the aggregate. These purchases do not incur an initial sales charge.
There was a maximum initial sales charge of 5.75% for Class A2 shares. In certain cases, Class A2 shares had a 1.00% CDSC, which applied if redemption occurred within 18 months from purchase payment. This CDSC only applied to those purchases of Class A2 shares, which when combined with holdings of other shares of Legg Mason funds, equaled or exceeded $1,000,000 in aggregate. Those purchases did not incur an initial sales charge.
For the year ended October 31, 2021, sales charges retained by and CDSCs paid to Franklin Distributors and its affiliates, if any, were as follows:
| | | | | | | | | | | | |
| | | Class A | | | Class A2† | | | Class C | |
| Sales charges | | $ | 143,483 | | | $ | 19,971 | | | | — | |
| CDSCs | | | 1,018 | | | | — | | | $ | 4,735 | |
| † | On June 24, 2021, the Fund converted its Class A2 shares into Class A shares. |
Under a Deferred Compensation Plan (the “Plan”), Trustees may have elected to defer receipt of all or a specified portion of their compensation. A participating Trustee selected one or more funds managed by LMPFA or an affiliate of LMPFA in which his or her deferred trustee’s fees were deemed to be invested. Deferred amounts remain in the Fund until distributed in accordance with the Plan. In May 2015, the Board of Trustees approved an
| | | | |
36 | | | | ClearBridge International Growth Fund 2021 Annual Report |
amendment to the Plan so that effective January 1, 2016, no compensation earned after that date may be deferred under the Plan.
All officers and one Trustee of the Trust are employees of Franklin Resources or its affiliates and do not receive compensation from the Trust.
3. Investments
During the year ended October 31, 2021, the aggregate cost of purchases and proceeds from sales of investments (excluding short-term investments) were as follows:
| | | | |
| Purchases | | $ | 3,428,910,778 | |
| Sales | | | 2,304,172,542 | |
At October 31, 2021, the aggregate cost of investments and the aggregate gross unrealized appreciation and depreciation of investments for federal income tax purposes were as follows:
| | | | | | | | | | | | | | | | |
| | | Cost | | | Gross
Unrealized
Appreciation | | | Gross
Unrealized
Depreciation | | | Net
Unrealized
Appreciation | |
| Securities | | $ | 5,160,459,203 | | | $ | 1,595,022,433 | | | $ | (74,769,017) | | | $ | 1,520,253,416 | |
4. Derivative instruments and hedging activities
At October 31, 2021, the Fund did not have any derivative instruments outstanding.
The following table provides information about the effect of derivatives and hedging activities on the Fund’s Statement of Operations for the year ended October 31, 2021. The table provides additional detail about the amounts and sources of gains (losses) realized on derivatives during the period.
| | | | |
| AMOUNT OF REALIZED GAIN (LOSS) ON DERIVATIVES RECOGNIZED | |
| | | Equity Risk | |
| Written options | | $ | 756,828 | |
During the year ended October 31, 2021, the volume of derivative activity for the Fund was as follows:
| | | | |
| | | Average Market
Value | |
| Written options† | | $ | 8,000 | |
| † | At October 31, 2021, there were no open positions held in this derivative. |
5. Class specific expenses, waivers and/or expense reimbursements
The Fund has adopted a Rule 12b-1 shareholder services and distribution plan and under that plan the Fund pays service and/or distribution fees with respect to its Class A, Class A2, Class C, Class FI and Class R shares calculated at the annual rate of 0.25%, 0.25%, 1.00%, 0.25% and 0.50% of the average daily net assets of each class, respectively. Service and/or distribution fees are accrued daily and paid monthly.
| | | | | | |
| ClearBridge International Growth Fund 2021 Annual Report | | | | | 37 | |
Notes to financial statements (cont’d)
For the year ended October 31, 2021, class specific expenses were as follows:
| | | | | | | | |
| | | Service and/or
Distribution Fees | | | Transfer Agent
Fees | |
| Class A | | $ | 1,202,993 | † | | $ | 607,133 | |
| Class A2†† | | | 21,072 | | | | 18,398 | |
| Class C | | | 618,834 | † | | | 63,401 | |
| Class FI | | | 420,662 | | | | 257,212 | |
| Class R | | | 160,122 | | | | 68,919 | |
| Class I | | | — | | | | 4,127,037 | |
| Class IS | | | — | | | | 48,585 | |
| Total | | $ | 2,423,683 | | | $ | 5,190,685 | |
| † | Amounts shown are exclusive of expense reimbursements. For the year ended October 31, 2021, the service and/or distribution fees reimbursed amounted to $46 and $253 for Class A and Class C shares, respectively. |
| †† | On June 24, 2021, the Fund converted its Class A2 shares into Class A shares. |
For the year ended October 31, 2021, waivers and/or expense reimbursements by class were as follows:
| | | | |
| | | Waivers/Expense
Reimbursements | |
| Class A | | $ | 42,028 | |
| Class A2† | | | 3 | |
| Class C | | | 2,222 | |
| Class FI | | | 5,565 | |
| Class R | | | 1,523 | |
| Class I | | | 140,806 | |
| Class IS | | | 33,223 | |
| Total | | $ | 225,370 | |
| † | On June 24, 2021, the Fund converted its Class A2 shares into Class A shares. |
6. Distributions to shareholders by class
| | | | | | | | |
| | | Year Ended
October 31, 2021 | | | Year Ended
October 31, 2020 | |
| Net Investment Income: | | | | | | | | |
| Class A | | | — | | | $ | 475,717 | |
| Class A2† | | $ | 487 | | | | 11,369 | |
| Class FI | | | — | | | | 165,169 | |
| Class I | | | 6,501,173 | | | | 6,261,254 | |
| Class IS | | | 1,873,398 | | | | 1,086,546 | |
| Total | | $ | 8,375,058 | | | $ | 8,000,055 | |
| † | On June 24, 2021, the Fund converted its Class A2 shares into Class A shares. |
7. Shares of beneficial interest
At October 31, 2021, the Trust had an unlimited number of shares of beneficial interest authorized with a par value of $0.00001 per share. The Fund has the ability to issue multiple
| | | | |
38 | | | | ClearBridge International Growth Fund 2021 Annual Report |
classes of shares. Each class of shares represents an identical interest and has the same rights, except that each class bears certain direct expenses, including those specifically related to the distribution of its shares.
Transactions in shares of each class were as follows:
| | | | | | | | | | | | | | | | |
| | | Year Ended
October 31, 2021 | | | Year Ended
October 31, 2020 | |
| | | Shares | | | Amount | | | Shares | | | Amount | |
| Class A | | | | | | | | | | | | | | | | |
| Shares sold | | | 3,821,557 | | | $ | 242,662,387 | | | | 4,120,408 | | | $ | 198,368,836 | |
| Shares issued on reinvestment | | | — | | | | — | | | | 8,815 | | | | 438,257 | |
| Shares repurchased | | | (2,891,490) | | | | (181,258,375) | | | | (3,135,042) | | | | (154,842,157) | |
| Net increase | | | 930,067 | | | $ | 61,404,012 | | | | 994,181 | | | $ | 43,964,936 | |
| | | | |
| Class A2† | | | | | | | | | | | | | | | | |
| Shares sold | | | 98,732 | | | $ | 6,146,462 | | | | 135,295 | | | $ | 6,734,843 | |
| Shares issued on reinvestment | | | 8 | | | | 487 | | | | 229 | | | | 11,369 | |
| Shares repurchased | | | (265,063) | | | | (17,278,602) | | | | (19,612) | | | | (968,197) | |
| Net increase (decrease) | | | (166,323) | | | $ | (11,131,653) | | | | 115,912 | | | $ | 5,778,015 | |
| | | | |
| Class C | | | | | | | | | | | | | | | | |
| Shares sold | | | 278,515 | | | $ | 16,117,559 | | | | 356,939 | | | $ | 16,624,629 | |
| Shares issued on reinvestment | | | — | | | | — | | | | — | | | | — | |
| Shares repurchased | | | (210,959) | | | | (12,279,335) | | | | (319,030) | | | | (14,173,220) | |
| Net increase | | | 67,556 | | | $ | 3,838,224 | | | | 37,909 | | | $ | 2,451,409 | |
| | | | |
| Class FI | | | | | | | | | | | | | | | | |
| Shares sold | | | 1,289,393 | | | $ | 85,554,333 | | | | 1,770,398 | | | $ | 89,123,601 | |
| Shares issued on reinvestment | | | — | | | | — | | | | 3,139 | | | | 162,761 | |
| Shares repurchased | | | (963,477) | | | | (62,641,367) | | | | (1,282,625) | | | | (67,875,556) | |
| Net increase | | | 325,916 | | | $ | 22,912,966 | | | | 490,912 | | | $ | 21,410,806 | |
| | | | |
| Class R | | | | | | | | | | | | | | | | |
| Shares sold | | | 288,857 | | | $ | 18,281,361 | | | | 252,545 | | | $ | 12,647,939 | |
| Shares issued on reinvestment | | | — | | | | — | | | | — | | | | — | |
| Shares repurchased | | | (97,767) | | | | (6,251,119) | | | | (134,486) | | | | (6,537,236) | |
| Net increase | | | 191,090 | | | $ | 12,030,242 | | | | 118,059 | | | $ | 6,110,703 | |
| | | | |
| Class I | | | | | | | | | | | | | | | | |
| Shares sold | | | 26,371,644 | | | $ | 1,800,709,638 | | | | 38,638,778 | | | $ | 2,042,823,812 | |
| Shares issued on reinvestment | | | 86,217 | | | | 5,789,485 | | | | 103,295 | | | | 5,551,037 | |
| Shares repurchased | | | (16,263,493) | | | | (1,121,235,531) | | | | (17,202,146) | | | | (874,413,797) | |
| Net increase | | | 10,194,368 | | | $ | 685,263,592 | | | | 21,539,927 | | | $ | 1,173,961,052 | |
| | | | |
| Class IS | | | | | | | | | | | | | | | | |
| Shares sold | | | 8,127,348 | | | $ | 556,118,622 | | | | 8,584,401 | | | $ | 465,693,974 | |
| Shares issued on reinvestment | | | 22,384 | | | | 1,503,560 | | | | 17,254 | | | | 927,074 | |
| Shares repurchased | | | (2,367,792) | | | | (163,371,706) | | | | (1,866,498) | | | | (99,353,538) | |
| Net increase | | | 5,781,940 | | | $ | 394,250,476 | | | | 6,735,157 | | | $ | 367,267,510 | |
| | | | | | |
| ClearBridge International Growth Fund 2021 Annual Report | | | | | 39 | |
Notes to financial statements (cont’d)
| † | On June 24, 2021, the Fund converted 243,487 Class A2 shares into 242,726 Class A shares, valued at $15,925,244. These amounts are reflected in the Class A shares sold and Class A2 shares repurchased, respectively. |
8. Transactions with affiliated company
As defined by the 1940 Act, an affiliated company is one in which the Fund owns 5% or more of the outstanding voting securities, or a company which is under common ownership or control with the Fund. The following company was considered an affiliated company for all or some portion of the year ended October 31, 2021. The following transactions were effected in such company for the year ended October 31, 2021.
| | | | | | | | | | | | | | |
| | | Affiliate
Value at
October 31, 2020 | | | Purchased | | Sold | |
| | | Cost | | Shares | | Cost | | Shares | |
| Western Asset Premier Institutional U.S. Treasury Reserves, Premium Shares | | $ | 9,735,780 | | | $327,908,615 | | 327,908,615 | | $312,465,500 | | | 312,465,500 | |
| | | | | | | | | | | | | | | | |
| (cont’d) | | Realized
Gain (Loss) | | | Interest
Income | | | Net Increase
(Decrease) in
Unrealized
Appreciation
(Depreciation) | | | Affiliate
Value at
October 31,
2021 | |
| Western Asset Premier Institutional U.S. Treasury Reserves, Premium Shares | | | — | | | $ | 1,574 | | | | — | | | $ | 25,178,895 | |
9. Income tax information and distributions to shareholders
The tax character of distributions paid during the fiscal years ended October 31, was as follows:
| | | | | | | | |
| | | 2021 | | | 2020 | |
| Distributions paid from: | | | | | | | | |
| Ordinary income | | $ | 8,375,058 | | | $ | 8,000,055 | |
As of October 31, 2021, the components of distributable earnings (loss) on a tax basis were as follows:
| | | | |
| Undistributed ordinary income — net | | $ | 24,958,261 | |
| Undistributed long-term capital gains — net | | | 128,387,765 | |
| Total undistributed earnings | | $ | 153,346,026 | |
| Other book/tax temporary differences(a) | | | (42,860) | |
| Unrealized appreciation (depreciation)(b) | | | 1,520,070,816 | |
| Total distributable earnings (loss) — net | | $ | 1,673,373,982 | |
| | | | |
40 | | | | ClearBridge International Growth Fund 2021 Annual Report |
| (a) | Other book/tax temporary differences are attributable to book/tax differences in the timing of the deductibility of various expenses. |
| (b) | The difference between book-basis and tax-basis unrealized appreciation (depreciation) is attributable to the tax deferral of losses on wash sales and the realization for tax purposes of unrealized gains on investments in passive foreign investment companies. |
10. Recent accounting pronouncement
In March 2020, the Financial Accounting Standards Board (FASB) issued Accounting Standards Update (ASU) No. 2020-04, Reference Rate Reform (Topic 848) — Facilitation of the Effects of Reference Rate Reform on Financial Reporting. In January 2021, the FASB issued ASU No. 2021-01, with further amendments to Topic 848. The amendments in the ASUs provide optional temporary accounting recognition and financial reporting relief from the effect of certain types of contract modifications due to the planned discontinuation of the LIBOR and other interbank-offered based reference rates as of the end of 2021 and 2023. The ASUs are effective for certain reference rate-related contract modifications that occur during the period March 12, 2020 through December 31, 2022. Management has reviewed the requirements and believes the adoption of these ASUs will not have a material impact on the financial statements.
11. Other matter
The outbreak of the respiratory illness COVID-19 (commonly referred to as “coronavirus”) has continued to rapidly spread around the world, causing considerable uncertainty for the global economy and financial markets. The ultimate economic fallout from the pandemic, and the long-term impact on economies, markets, industries and individual issuers, are not known. The COVID-19 pandemic could adversely affect the value and liquidity of the Fund’s investments, impair the Fund’s ability to satisfy redemption requests, and negatively impact the Fund’s performance. In addition, the outbreak of COVID-19, and measures taken to mitigate its effects, could result in disruptions to the services provided to the Fund by its service providers.
| | | | | | |
| ClearBridge International Growth Fund 2021 Annual Report | | | | | 41 | |
Report of independent registered public accounting firm
To the Board of Trustees of Legg Mason Global Asset Management Trust and Shareholders of ClearBridge International Growth Fund
Opinion on the Financial Statements
We have audited the accompanying statement of assets and liabilities, including the schedule of investments, of ClearBridge International Growth Fund (one of the funds constituting LeggMason Global Asset Management Trust, referred to hereafter as the “Fund”) as of October 31, 2021, the related statement of operations for the year ended October 31, 2021, the statement of changes in net assets for each of the two years in the period ended October 31, 2021, including the related notes, and the financial highlights for each of the periods indicated therein (collectively referred to as the “financial statements”). In our opinion, the financial statements present fairly, in all material respects, the financial position of the Fund as of October 31, 2021, the results of its operations for the year then ended, the changes in its net assets for each of the two years in the period ended October 31, 2021 and the financial highlights for each of the periods indicated therein in conformity with accounting principles generally accepted in the United States of America.
Basis for Opinion
These financial statements are the responsibility of the Fund’s management. Our responsibility is to express an opinion on the Fund’s financial statements based on our audits. We are a public accounting firm registered with the Public Company Accounting Oversight Board (United States) (PCAOB) and are required to be independent with respect to the Fund in accordance with the U.S. federal securities laws and the applicable rules and regulations of the Securities and Exchange Commission and the PCAOB.
We conducted our audits of these financial statements in accordance with the standards of the PCAOB. Those standards require that we plan and perform the audit to obtain reasonable assurance about whether the financial statements are free of material misstatement, whether due to error or fraud.
Our audits included performing procedures to assess the risks of material misstatement of the financial statements, whether due to error or fraud, and performing procedures that respond to those risks. Such procedures included examining, on a test basis, evidence regarding the amounts and disclosures in the financial statements. Our audits also included evaluating the accounting principles used and significant estimates made by management, as well as evaluating the overall presentation of the financial statements. Our procedures included confirmation of securities owned as of October 31, 2021 by correspondence with the custodian and brokers; when replies were not received from brokers, we performed other auditing procedures. We believe that our audits provide a reasonable basis for our opinion.
/s/PricewaterhouseCoopers LLP
Baltimore, Maryland
December 17, 2021
We have served as the auditor of one or more investment companies in the Franklin Templeton Group of Funds since 1948.
| | | | |
42 | | | | ClearBridge International Growth Fund 2021 Annual Report |
Additional shareholder information (unaudited)
Results of special meeting of shareholders
A special meeting of shareholders was held on June 15, 2021 for shareholders of record as of March 1, 2021 (the “Record Date”) to elect the Board of Trustees of the Trust. Shareholders of the Fund and each other series of the Trust voted together as a single class to elect the Board.
Shareholders of the Trust voted as indicated below (vote totals are rounded to the nearest whole number). Effective July 1, 2021, the Board is composed of the following Trustees:
| | | | | | | | |
| Trustee | | For | | | Withheld | |
| Paul R. Ades | | | 11,915,712,078 | | | | 203,516,727 | |
| Andrew L. Breech | | | 11,923,087,811 | | | | 196,140,993 | |
| Althea L. Duersten | | | 11,972,830,693 | | | | 146,398,111 | |
| Stephen R. Gross | | | 11,919,258,594 | | | | 199,970,210 | |
| Susan M. Heilbron | | | 11,970,320,096 | | | | 148,908,708 | |
| Howard J. Johnson | | | 11,919,503,553 | | | | 199,725,251 | |
| Arnold L. Lehman | | | 11,920,774,188 | | | | 198,454,617 | |
| Robin J.W. Masters | | | 11,971,843,764 | | | | 147,385,040 | |
| Jerome H. Miller | | | 11,919,153,082 | | | | 200,075,722 | |
| Ken Miller | | | 11,922,645,083 | | | | 196,583,722 | |
| G. Peter O’Brien | | | 11,919,113,936 | | | | 200,114,868 | |
| Thomas F. Schlafly | | | 11,917,628,123 | | | | 201,600,682 | |
| Jane Trust | | | 11,985,902,999 | | | | 133,325,805 | |
| | | | | | |
| ClearBridge International Growth Fund | | | | | 43 | |
Statement regarding liquidity risk management program (unaudited)
Each Fund has adopted and implemented a written Liquidity Risk Management Program (the “LRMP”) as required by Rule 22e-4 under the Investment Company Act of 1940 (the “Liquidity Rule”). The LRMP is designed to assess and manage each Fund’s liquidity risk, which is defined as the risk that the Fund could not meet requests to redeem shares issued by the Fund without significant dilution of remaining investors’ interests in the Fund. In accordance with the Liquidity Rule, the LRMP includes policies and procedures that provide for: (1) assessment, management, and review (no less frequently than annually) of each Fund’s liquidity risk; (2) classification of each Fund’s portfolio holdings into one of four liquidity categories (Highly Liquid, Moderately Liquid, Less Liquid, and Illiquid); (3) for Funds that do not primarily hold assets that are Highly Liquid, establishing and maintaining a minimum percentage of the Fund’s net assets in Highly Liquid investments (called a “Highly Liquid Investment Minimum” or “HLIM”); and (4) prohibiting the Fund’s acquisition of Illiquid investments that would result in the Fund holding more than 15% of its net assets in Illiquid assets. The LRMP also requires reporting to the Securities and Exchange Commission (“SEC”) (on a non-public basis) and to the Board if the Fund’s holdings of Illiquid assets exceed 15% of the Fund’s net assets. Funds with HLIMs must have procedures for addressing HLIM shortfalls, including reporting to the Board and, with respect to HLIM shortfalls lasting more than seven consecutive calendar days, reporting to the SEC (on a non-public basis).
The Director of Liquidity Risk within the Investment Risk Management Group (the “IRMG”) is the appointed Administrator of the LRMP. The IRMG maintains the Investment Liquidity Committee (the “ILC”) to provide oversight and administration of policies and procedures governing liquidity risk management for Franklin Templeton and Legg Mason products and portfolios. The ILC includes representatives from Franklin Templeton’s Risk, Trading, Global Compliance, Legal, Investment Compliance, Investment Operations, Valuation Committee, Product Management and Global Product Strategy.
In assessing and managing each Fund’s liquidity risk, the ILC considers, as relevant, a variety of factors, including the Fund’s investment strategy and the liquidity of its portfolio investments during both normal and reasonably foreseeable stressed conditions; its short and long-term cash flow projections; and its cash holdings and access to other funding sources including the Funds’ interfund lending facility and line of credit. Classification of the Fund’s portfolio holdings in the four liquidity categories is based on the number of days it is reasonably expected to take to convert the investment to cash (for Highly Liquid and Moderately Liquid holdings) or sell or dispose of the investment (for Less Liquid and Illiquid investments), in current market conditions without significantly changing the investment’s market value.
Each Fund primarily holds liquid assets that are defined under the Liquidity Rule as “Highly Liquid Investments,” and therefore is not required to establish an HLIM. Highly Liquid
| | | | |
44 | | | | ClearBridge International Growth Fund |
Investments are defined as cash and any investment reasonably expected to be convertible to cash in current market conditions in three business days or less without the conversion to cash significantly changing the market value of the investment.
At meetings of the Funds’ Board of Trustees/Directors held in November 2021, the Program Administrator provided a written report to the Board addressing the adequacy and effectiveness of the program for the year ended December 31, 2020. The Program Administrator report concluded that (i.) the LRMP, as adopted and implemented, remains reasonably designed to assess and manage each Fund’s liquidity risk; (ii.) the LRMP, including the Highly Liquid Investment Minimum (“HLIM”) where applicable, was implemented and operated effectively to achieve the goal of assessing and managing each Fund’s liquidity risk; and (iii.) each Fund was able to meet requests for redemption without significant dilution of remaining investors’ interests in the Fund.
| | | | | | |
| ClearBridge International Growth Fund | | | | | 45 | |
Additional information (unaudited)
Information about Trustees and Officers
The business and affairs of ClearBridge International Growth Fund (the “Fund”) are conducted by management under the supervision and subject to the direction of its Board of Trustees. The business address of each Trustee is c/o Jane Trust, Legg Mason, 100 International Drive, 11th Floor, Baltimore, Maryland 21202. Information pertaining to the Trustees and officers of the Fund is set forth below.
Previously, the mutual funds of Legg Mason Global Asset Management Trust were overseen by one group of Trustees, and the mutual funds of Legg Mason Partners Investment Trust and Legg Mason Partners Variable Equity Trust (collectively, the “Funds”) were overseen by a different group of Trustees. A joint proxy statement was mailed to solicit shareholder approval for the election of a single slate of Trustees. Shareholders approved the proposed Trustees during a joint special meeting of shareholders on June 15, 2021. Effective July 1, 2021, the Trustees listed below oversee all of the Funds.
The Statement of Additional Information includes additional information about Trustees and is available, without charge, upon request by calling the Fund at 1-877-721-1926.
| | |
| Independent Trustees† |
|
| Paul R. Ades |
| |
| Year of birth | | 1940 |
| Position(s) with Trust | | Trustee |
| Term of office1 and length of time served2 | | Since 1983 |
| Principal occupation(s) during the past five years | | Paul R. Ades, PLLC (law firm) (since 2000) |
| Number of funds in fund complex overseen by Trustee | | 61 |
| Other board memberships held by Trustee during the past five years | | None |
|
| Andrew L. Breech |
| |
| Year of birth | | 1952 |
| Position(s) with Trust | | Trustee |
| Term of office1 and length of time served2 | | Since 1991 |
| Principal occupation(s) during the past five years | | President, Dealer Operating Control Service, Inc. (automotive retail management) (since 1985) |
| Number of funds in fund complex overseen by Trustee | | 61 |
| Other board memberships held by Trustee during the past five years | | None |
| | | | |
46 | | | | ClearBridge International Growth Fund |
| | |
| Independent Trustees† (cont’d) |
|
| Althea L. Duersten* |
| |
| Year of birth | | 1951 |
| Position(s) with Trust | | Trustee and Chair of the Board |
| Term of office1 and length of time served2 | | Since 2014 (Chair of the Board since 2021) |
| Principal occupation(s) during the past five years | | Retired (since 2011); formerly, Chief Investment Officer, North America, JPMorgan Chase (investment bank) and member of JPMorgan Executive Committee (2007 to 2011) |
| Number of funds in fund complex overseen by Trustee | | 61 |
| Other board memberships held by Trustee during the past five years | | Formerly, Non-Executive Director, Rokos Capital Management LLP (2019 to 2020) |
|
| Stephen R. Gross |
| |
| Year of birth | | 1947 |
| Position(s) with Trust | | Trustee |
| Term of office1 and length of time served2 | | Since 1986 |
| Principal occupation(s) during the past five years | | Chairman Emeritus (since 2011) and formerly, Chairman, HLB Gross Collins, P.C. (accounting and consulting firm) (1979 to 2011); Executive Director of Business Builders Team, LLC (since 2005); Principal, Gross Consulting Group, LLC (since 2011); CEO, Gross Capital Partners, LLC (since 2014); CEO, Trusted CFO Solutions, LLC (since 2011) |
| Number of funds in fund complex overseen by Trustee | | 61 |
| Other board memberships held by Trustee during the past five years | | None |
|
| Susan M. Heilbron |
| |
| Year of birth | | 1945 |
| Position(s) with Trust | | Trustee |
| Term of office1 and length of time served2 | | Since 1991 |
| Principal occupation(s) during the past five years | | Retired; formerly, President, Lacey & Heilbron (communications consulting) (1990 to 2002); General Counsel and Executive Vice President, The Trump Organization (1986 to 1990); Senior Vice President, New York State Urban Development Corporation (1984 to 1986); Associate, Cravath, Swaine & Moore LLP (1980 to 1984 and 1977 to 1979) |
| Number of funds in fund complex overseen by Trustee | | 61 |
| Other board memberships held by Trustee during the past five years | | Formerly, Director, Lincoln Savings Bank FSB (1991 to 1994); Director, Trump Shuttle, Inc. (air transportation) (1989 to 1990); Director, Alexander’s Inc. (department store) (1987 to 1990) |
| | | | | | |
| ClearBridge International Growth Fund | | | | | 47 | |
Additional information (unaudited) (cont’d)
Information about Trustees and Officers
| | |
| Independent Trustees† (cont’d) |
|
| Howard J. Johnson |
| |
| Year of birth | | 1938 |
| Position(s) with Trust | | Trustee |
| Term of office1 and length of time served2 | | From 1981 to 1998 and since 2000 |
| Principal occupation(s) during the past five years | | Retired; formerly, Chief Executive Officer, Genesis Imaging LLC (technology company) (2003 to 2012) |
| Number of funds in fund complex overseen by Trustee | | 61 |
| Other board memberships held by Trustee during the past five years | | None |
|
| Arnold L. Lehman |
| |
| Year of birth | | 1944 |
| Position(s) with Trust | | Trustee |
| Term of office1 and length of time served2 | | Since 1982 |
| Principal occupation(s) during the past five years | | Senior Advisor, Phillips (auction house) (since 2015); formerly, Fellow, Ford Foundation (2015 to 2016); Director of the Brooklyn Museum (1997 to 2015) |
| Number of funds in fund complex overseen by Trustee | | 61 |
| Other board memberships held by Trustee during the past five years | | Trustee of American Federation of Arts (since 2002) |
|
| Robin J. W. Masters |
| |
| Year of birth | | 1955 |
| Position(s) with Trust | | Trustee |
| Term of office1 and length of time served2 | | Since 2002 |
| Principal occupation(s) during the past five years | | Retired; formerly, Chief Investment Officer of ACE Limited (insurance) (1986 to 2000) |
| Number of funds in fund complex overseen by Trustee | | 61 |
| Other board memberships held by Trustee during the past five years | | Director of HSBC Managed Portfolios Limited and HSBC Specialist Funds Limited (since 2020); formerly, Director of Cheyne Capital International Limited (investment advisory firm) (2005 to 2020); Director/ Trustee of Legg Mason Institutional Funds plc, Western Asset Fixed Income Funds plc and Western Asset Debt Securities Fund plc. (2007 to 2011) |
|
| Jerome H. Miller |
| |
| Year of birth | | 1938 |
| Position(s) with Trust | | Trustee |
| Term of office1 and length of time served2 | | Since 1995 |
| Principal occupation(s) during the past five years | | Retired; formerly, President, Shearson Lehman Asset Management (1991 to 1993), Vice Chairman, Shearson Lehman Hutton Inc. (1989 to 1992) and Senior Executive Vice President, E.F. Hutton Group Inc. (1986 to 1989) |
| Number of funds in fund complex overseen by Trustee | | 61 |
| Other board memberships held by Trustee during the past five years | | None |
| | | | |
48 | | | | ClearBridge International Growth Fund |
| | |
| Independent Trustees† (cont’d) |
|
| Ken Miller |
| |
| Year of birth | | 1942 |
| Position(s) with Trust | | Trustee |
| Term of office1 and length of time served2 | | Since 1983 |
| Principal occupation(s) during the past five years | | Retired; formerly, President, Young Stuff Apparel Group, Inc. (apparel manufacturer), division of Li & Fung (1963 to 2012) |
| Number of funds in fund complex overseen by Trustee | | 61 |
| Other board memberships held by Trustee during the past five years | | None |
|
| G. Peter O’Brien |
| |
| Year of birth | | 1945 |
| Position(s) with Trust | | Trustee |
| Term of office1 and length of time served2 | | Since 1999 |
| Principal occupation(s) during the past five years | | Retired, Trustee Emeritus of Colgate University (since 2005); Board Member, Hill House, Inc. (residential home care) (since 1999); formerly, Board Member, Bridges School (pre-school) (2006 to 2017); Managing Director, Equity Capital Markets Group of Merrill Lynch & Co. (1971 to 1999) |
| Number of funds in fund complex overseen by Trustee | | Trustee of Legg Mason funds consisting of 61 portfolios; Director/Trustee of the Royce Family of Funds consisting of 16 portfolios |
| Other board memberships held by Trustee during the past five years | | Formerly, Director of TICC Capital Corp. (2003 to 2017) |
|
| Thomas F. Schlafly |
| |
| Year of birth | | 1948 |
| Position(s) with Trust | | Trustee |
| Term of office1 and length of time served2 | | Since 1983 |
| Principal occupation(s) during the past five years | | Chairman, The Saint Louis Brewery, LLC (brewery) (since 2012); formerly, President, The Saint Louis Brewery, Inc. (1989 to 2012); Senior Counsel (since 2017) and formerly, Partner (2009 to 2016), Thompson Coburn LLP (law firm) |
| Number of funds in fund complex overseen by Trustee | | 61 |
| Other board memberships held by Trustee during the past five years | | Director, CNB St. Louis Bank (since 2020); formerly, Director, Citizens National Bank of Greater St. Louis (2006 to 2020) |
| | | | | | |
| ClearBridge International Growth Fund | | | | | 49 | |
Additional information (unaudited) (cont’d)
Information about Trustees and Officers
| | |
| Interested Trustee and Officer |
|
| Jane Trust, CFA3 |
| |
| Year of birth | | 1962 |
| Position(s) with Trust | | Trustee, President and Chief Executive Officer |
| Term of office1 and length of time served2 | | Since 2015 |
| Principal occupation(s) during the past five years | | Senior Vice President, Fund Board Management, Franklin Templeton (since 2020); Officer and/or Trustee/Director of 132 funds associated with LMPFA or its affiliates (since 2015); President and Chief Executive Officer of LMPFA (since 2015); formerly, Senior Managing Director (2018 to 2020) and Managing Director (2016 to 2018) of Legg Mason & Co., LLC (“Legg Mason & Co.”); Senior Vice President of LMPFA (2015) |
| Number of funds in fund complex overseen by Trustee | | 130 |
| Other board memberships held by Trustee during the past five years | | None |
| | |
| Additional Officers |
|
Ted P. Becker Franklin Templeton 620 Eighth Avenue, 47th Floor, New York, NY 10018 |
| |
| Year of birth | | 1951 |
| Position(s) with Trust | | Chief Compliance Officer |
| Term of office1 and length of time served2 | | Since 2007 |
| Principal occupation(s) during the past five years | | Vice President, Global Compliance of Franklin Templeton (since 2020); Chief Compliance Officer of LMPFA (since 2006); Chief Compliance Officer of certain funds associated with Legg Mason & Co. or its affiliates (since 2006); formerly, Director of Global Compliance at Legg Mason, Inc. (2006 to 2020); Managing Director of Compliance of Legg Mason & Co. (2005 to 2020) |
|
Susan Kerr
Franklin Templeton
620 Eighth Avenue, 47th Floor, New York, NY 10018 |
| |
| Year of birth | | 1949 |
| Position(s) with Trust | | Chief Anti-Money Laundering Compliance Officer |
| Term of office1 and length of time served2 | | Since 2013 |
| Principal occupation(s) during the past five years | | Senior Compliance Analyst, Franklin Templeton (since 2020); Chief Anti-Money Laundering Compliance Officer of certain funds associated with Legg Mason & Co. or its affiliates (since 2013) and Anti-Money Laundering Compliance Officer (since 2012), Senior Compliance Officer (since 2011) and Assistant Vice President (since 2010) of Franklin Distributors, LLC; formerly, Assistant Vice President of Legg Mason & Co. (2010 to 2020) |
| | | | |
50 | | | | ClearBridge International Growth Fund |
| | |
| Additional Officers (cont’d) |
|
Jenna Bailey Franklin Templeton 100 First Stamford Place, 5th Floor, Stamford, CT 06902 |
| |
| Year of birth | | 1978 |
| Position(s) with Trust | | Identity Theft Prevention Officer |
| Term of office1 and length of time served2 | | Since 2015 |
| Principal occupation(s) during the past five years | | Senior Compliance Analyst of Franklin Templeton (since 2020); Identity Theft Prevention Officer of certain funds associated with Legg Mason & Co. or its affiliates (since 2015); formerly, Compliance Officer of Legg Mason & Co. (2013 to 2020); Assistant Vice President of Legg Mason & Co. (2011 to 2020) |
|
Marc A. De Oliveira Franklin Templeton 100 First Stamford Place, 6th Floor, Stamford, CT 06902 |
| |
| Year of birth | | 1971 |
| Position(s) with Trust | | Secretary and Chief Legal Officer |
| Term of office1 and length of time served2 | | Since 2020 |
| Principal occupation(s) during the past five years | | Associate General Counsel of Franklin Templeton (since 2020); Assistant Secretary of certain funds associated with Legg Mason & Co. or its affiliates (since 2006); formerly, Managing Director (2016 to 2020) and Associate General Counsel of Legg Mason & Co. (2005 to 2020) |
| |
Thomas C. Mandia Franklin Templeton 100 First Stamford Place, 6th Floor, Stamford, CT 06902 | | |
| |
| Year of birth | | 1962 |
| Position(s) with Trust | | Senior Vice President |
| Term of office1 and length of time served2 | | Since 2020 |
| Principal occupation(s) during the past five years | | Senior Associate General Counsel of Franklin Templeton (since 2020); Secretary of LMPFA (since 2006); Assistant Secretary of certain funds associated with Legg Mason & Co. or its affiliates (since 2006); Secretary of LM Asset Services, LLC (“LMAS”) (since 2002) and Legg Mason Fund Asset Management, Inc. (“LMFAM”) (since 2013) (formerly registered Investment advisers); formerly, Managing Director and Deputy General Counsel of Legg Mason & Co. (2005 to 2020) |
| | | | | | |
| ClearBridge International Growth Fund | | | | | 51 | |
Additional information (unaudited) (cont’d)
Information about Trustees and Officers
| | |
| Additional Officers (cont’d) |
|
Christopher Berarducci Franklin Templeton 620 Eighth Avenue, 47th Floor, New York, NY 10018 |
| |
| Year of birth | | 1974 |
| Position(s) with Trust | | Treasurer and Principal Financial Officer |
| Term of office1 and length of time served2 | | Since 2010 and 2019 |
| Principal occupation(s) during the past five years | | Vice President, Fund Administration and Reporting, Franklin Templeton (since 2020); Treasurer (since 2010) and Principal Financial Officer (since 2019) of certain funds associated with Legg Mason & Co. or its affiliates; formerly, Managing Director (2020), Director (2015 to 2020), and Vice President (2011 to 2015) of Legg Mason & Co. |
|
Jeanne M. Kelly Franklin Templeton 620 Eighth Avenue, 47th Floor, New York, NY 10018 |
| |
| Year of birth | | 1951 |
| Position(s) with Trust | | Senior Vice President |
| Term of office1 and length of time served2 | | Since 2007 |
| Principal occupation(s) during the past five years | | U.S. Fund Board Team Manager, Franklin Templeton (since 2020); Senior Vice President of certain funds associated with Legg Mason & Co. or its affiliates (since 2007); Senior Vice President of LMPFA (since 2006); President and Chief Executive Officer of LMAS and LMFAM (since 2015); formerly, Managing Director of Legg Mason & Co. (2005 to 2020); Senior Vice President of LMFAM (2013 to 2015) |
| † | Trustees who are not “interested persons” of the Fund within the meaning of Section 2(a)(19) of the Investment Company Act of 1940, as amended (the “1940 Act”). |
| * | Effective July 1, 2021, Ms. Duersten became Chair. |
| 1 | Each Trustee and officer serves until his or her respective successor has been duly elected and qualified or until his or her earlier death, resignation, retirement or removal. |
| 2 | Indicates the earliest year in which the Trustee became a board member for a fund in the Legg Mason fund complex or the officer took such office. |
| 3 | Ms. Trust is an “interested person” of the Fund, as defined in the 1940 Act, because of her position with LMPFA and/or certain of its affiliates. |
| | | | |
52 | | | | ClearBridge International Growth Fund |
Important tax information (unaudited)
By mid-February, tax information related to a shareholder’s proportionate share of distributions paid during the preceding calendar year will be received, if applicable. Please also refer to www.franklintempleton.com for per share tax information related to any distributions paid during the preceding calendar year. Shareholders are advised to consult with their tax advisors for further information on the treatment of these amounts on their tax returns.
The following tax information for the Fund is required to be furnished to shareholders with respect to income earned and distributions paid during its fiscal year.
The Fund hereby reports the following amounts, or if subsequently determined to be different, the maximum allowable amounts, for the fiscal year ended October 31, 2021:
| | | | | | | | |
| | | Pursuant to: | | | Amount
Reported | |
| Income Eligible for Dividends Received Deduction (DRD) | | § | 854(b)(1)(A) | | | $ | 729,124 | |
| Qualified Dividend Income Earned (QDI) | | § | 854(b)(1)(B) | | | $ | 73,586,528 | |
Under Section 853 of the Internal Revenue Code, the Fund intends to elect to pass through to its shareholders the following amounts, or amounts as finally determined, of foreign taxes paid and foreign source income earned by the Fund during the fiscal year ended October 31, 2021:
| | | | |
| Foreign Taxes Paid | | $ | 6,613,150 | |
| Foreign Source Income Earned | | $ | 78,668,117 | |
| | | | | | |
| ClearBridge International Growth Fund | | | | | 53 | |
ClearBridge
International Growth Fund
Trustees*
Paul R. Ades
Andrew L. Breech
Althea L. Duersten**
Chair
Stephen R. Gross
Susan M. Heilbron
Howard J. Johnson
Arnold L. Lehman
Robin J. W. Masters
Jerome H. Miller
Ken Miller
G. Peter O’Brien
Thomas F. Schlafly
Jane Trust
| * | During a June 15, 2021 special meeting of shareholders, a new group of Trustees were elected to oversee the mutual funds of Legg Mason Global Asset Management Trust, Legg Mason Partners Investment Trust (prior to September 1, 2021, known as Legg Mason Partners Equity Trust) and Legg Mason Partners Variable Equity Trust, effective July 1, 2021. |
| ** | Effective July 1, 2021, Ms. Duersten became Chair. |
Investment manager/adviser
ClearBridge Investments, LLC
Distributor
Franklin Distributors, LLC†
Custodian
The Bank of New York Mellon
| † | Effective July 7, 2021, Legg Mason Investor Services, LLC was renamed Franklin Distributors, LLC. |
Transfer agent
BNY Mellon Investment
Servicing (US) Inc.
4400 Computer Drive
Westborough, MA 01581
Independent public accounting registered firm
PricewaterhouseCoopers LLP Baltimore, MD
ClearBridge International Growth Fund
The Fund is a separate investment series of Legg Mason Global Asset Management Trust, a Maryland statutory trust.
ClearBridge International Growth Fund
Legg Mason Funds
620 Eighth Avenue, 47th Floor
New York, NY 10018
The Fund files its complete schedule of portfolio holdings with the Securities and Exchange Commission (“SEC”) for the first and third quarters of each fiscal year as an exhibit to its reports on Form N-PORT. The Fund’s Forms N-PORT are available on the SEC’s website at www.sec.gov. To obtain information on Form N-PORT, shareholders can call the Fund at 1-877-721-1926.
Information on how the Fund voted proxies relating to portfolio securities during the prior 12-month period ended June 30th of each year and a description of the policies and procedures that the Fund uses to determine how to vote proxies related to portfolio transactions are available (1) without charge, upon request, by calling the Fund at 1-877-721-1926, (2) at www.franklintempleton.com and (3) on the SEC’s website at www.sec.gov.
This report is submitted for the general information of the shareholders of ClearBridge International Growth Fund. This report is not authorized for distribution to prospective investors in the Fund unless preceded or accompanied by a current prospectus.
Investors should consider the Fund’s investment objectives, risks, charges and expenses carefully before investing. The prospectus contains this and other important information about the Fund. Please read the prospectus carefully before investing.
www.franklintempleton.com
© 2021 Franklin Distributors, LLC, Member FINRA/SIPC. All rights reserved.
Legg Mason Funds Privacy and Security Notice
Your Privacy and the Security of Your Personal Information is Very Important to the Legg Mason Funds
This Privacy and Security Notice (the “Privacy Notice”) addresses the Legg Mason Funds’ privacy and data protection practices with respect to nonpublic personal information the Funds receive. The Legg Mason Funds include any funds sold by the Funds’ distributor, Franklin Distributors, LLC, as well as Legg Mason-sponsored closed-end funds. The provisions of this Privacy Notice apply to your information both while you are a shareholder and after you are no longer invested with the Funds.
The Type of Nonpublic Personal Information the Funds Collect About You
The Funds collect and maintain nonpublic personal information about you in connection with your shareholder account. Such information may include, but is not limited to:
| • | | Personal information included on applications or other forms; |
| • | | Account balances, transactions, and mutual fund holdings and positions; |
| • | | Bank account information, legal documents, and identity verification documentation; |
| • | | Online account access user IDs, passwords, security challenge question responses; and |
| • | | Information received from consumer reporting agencies regarding credit history and creditworthiness (such as the amount of an individual’s total debt, payment history, etc.). |
How the Funds Use Nonpublic Personal Information About You
The Funds do not sell or share your nonpublic personal information with third parties or with affiliates for their marketing purposes, or with other financial institutions or affiliates for joint marketing purposes, unless you have authorized the Funds to do so. The Funds do not disclose any nonpublic personal information about you except as may be required to perform transactions or services you have authorized or as permitted or required by law.
The Funds may disclose information about you to:
| • | | Employees, agents, and affiliates on a “need to know” basis to enable the Funds to conduct ordinary business, or to comply with obligations to government regulators; |
| • | | Service providers, including the Funds’ affiliates, who assist the Funds as part of the ordinary course of business (such as printing, mailing services, or processing or servicing your account with us) or otherwise perform services on the Funds’ behalf, including companies that may perform statistical analysis, market research and marketing services solely for the Funds; |
| • | | Permit access to transfer, whether in the United States or countries outside of the United States to such Funds’ employees, agents and affiliates and service providers as required to enable the Funds to conduct ordinary business, or to comply with obligations to government regulators; |
| • | | The Funds’ representatives such as legal counsel, accountants and auditors to enable the Funds to conduct ordinary business, or to comply with obligations to government regulators; |
| • | | Fiduciaries or representatives acting on your behalf, such as an IRA custodian or trustee of a grantor trust. |
|
| NOT PART OF THE ANNUAL REPORT |
Legg Mason Funds Privacy and Security Notice (cont’d)
Except as otherwise permitted by applicable law, companies acting on the Funds’ behalf, including those outside the United States, are contractually obligated to keep nonpublic personal information the Funds provide to them confidential and to use the information the Funds share only to provide the services the Funds ask them to perform. The Funds may disclose nonpublic personal information about you when necessary to enforce their rights or protect against fraud, or as permitted or required by applicable law, such as in connection with a law enforcement or regulatory request, subpoena, or similar legal process. In the event of a corporate action or in the event a Fund service provider changes, the Funds may be required to disclose your nonpublic personal information to third parties. While it is the Funds’ practice to obtain protections for disclosed information in these types of transactions, the Funds cannot guarantee their privacy policy will remain unchanged.
Keeping You Informed of the Funds’ Privacy and Security Practices
The Funds will notify you annually of their privacy policy as required by federal law. While the Funds reserve the right to modify this policy at any time they will notify you promptly if this privacy policy changes.
The Funds’ Security Practices
The Funds maintain appropriate physical, electronic and procedural safeguards designed to guard your nonpublic personal information. The Funds’ internal data security policies restrict access to your nonpublic personal information to authorized employees, who may use your nonpublic personal information for Fund business purposes only.
Although the Funds strive to protect your nonpublic personal information, they cannot ensure or warrant the security of any information you provide or transmit to them, and you do so at your own risk. In the event of a breach of the confidentiality or security of your nonpublic personal information, the Funds will attempt to notify you as necessary, so you can take appropriate protective steps. If you have consented to the Funds using electronic communications or electronic delivery of statements, they may notify you under such circumstances using the most current email address you have on record with them.
In order for the Funds to provide effective service to you, keeping your account information accurate is very important. If you believe that your account information is incomplete, not accurate or not current, if you have questions about the Funds’ privacy practices, or our use of your nonpublic personal information, write the Funds using the contact information on your account statements, email the Funds by clicking on the Contact Us section of the Funds’ website at www.franklintempleton.com, or contact the Fund at 1-877-721-1926.
Revised April 2018
Legg Mason California Consumer Privacy Act Policy
Although much of the personal information we collect is “nonpublic personal information” subject to federal law, residents of California may, in certain circumstances, have additional rights under the California Consumer Privacy Act (“CCPA”). For example, if you are a broker,
|
| NOT PART OF THE ANNUAL REPORT |
Legg Mason Funds Privacy and Security Notice (cont’d)
dealer, agent, fiduciary, or representative acting by or on behalf of, or for, the account of any other person(s) or household, or a financial advisor, or if you have otherwise provided personal information to us separate from the relationship we have with personal investors, the provisions of this Privacy Policy apply to your personal information (as defined by the CCPA).
| • | | In addition to the provisions of the Legg Mason Funds Security and Privacy Notice, you may have the right to know the categories and specific pieces of personal information we have collected about you. |
| • | | You also have the right to request the deletion of the personal information collected or maintained by the Funds. |
If you wish to exercise any of the rights you have in respect of your personal information, you should advise the Funds by contacting them as set forth below. The rights noted above are subject to our other legal and regulatory obligations and any exemptions under the CCPA. You may designate an authorized agent to make a rights request on your behalf, subject to the identification process described below. We do not discriminate based on requests for information related to our use of your personal information, and you have the right not to receive discriminatory treatment related to the exercise of your privacy rights.
We may request information from you in order to verify your identity or authority in making such a request. If you have appointed an authorized agent to make a request on your behalf, or you are an authorized agent making such a request (such as a power of attorney or other written permission), this process may include providing a password/passcode, a copy of government issued identification, affidavit or other applicable documentation, i.e. written permission. We may require you to verify your identity directly even when using an authorized agent, unless a power of attorney has been provided. We reserve the right to deny a request submitted by an agent if suitable and appropriate proof is not provided.
For the 12-month period prior to the date of this Privacy Policy, the Legg Mason Funds have not sold any of your personal information; nor do we have any plans to do so in the future.
Contact Information
Address: Data Privacy Officer, 100 International Dr., Baltimore, MD 21202
Email: DataProtectionOfficer@franklintempleton.com
Phone: 1-800-396-4748
Revised October 2020
|
| NOT PART OF THE ANNUAL REPORT |
www.franklintempleton.com
© 2021 Franklin Distributors, LLC, Member FINRA/SIPC. All rights reserved.
LMF-222/A 12/21 SR21-4294
The registrant has adopted a code of ethics that applies to the registrant’s principal executive officer, principal financial officer, principal accounting officer or controller.
| ITEM 3. | AUDIT COMMITTEE FINANCIAL EXPERT. |
The Board of Trustees of the registrant has determined that Stephen R. Gross possesses the technical attributes identified in Instruction 2(b) of Item 3 to Form N-CSR to qualify as an “audit committee financial expert,” and has designated Stephen R. Gross as the Audit Committee’s financial expert. Stephen R. Gross is an “independent” Trustees pursuant to paragraph (a)(2) of Item 3 to Form N-CSR.
| ITEM 4. | PRINCIPAL ACCOUNTANT FEES AND SERVICES. |
(a) Audit Fees. The aggregate fees billed in the last two fiscal years ending October 31, 2020 and October 31, 2021 (the “Reporting Periods”) for professional services rendered by the Registrant’s principal accountant (the “Auditor”) for the audit of the Registrant’s annual financial statements, or services that are normally provided by the Auditor in connection with the statutory and regulatory filings or engagements for the Reporting Periods, were $200,329 in October 31, 2020 and $200,329 in October 31, 2021.
(b) Audit-Related Fees. The aggregate fees billed in the Reporting Period for assurance and related services by the Auditor that are reasonably related to the performance of the Registrant’s financial statements were $0 in October 31, 2020 and $0 in October 31, 2021.
(c) Tax Fees. The aggregate fees billed in the Reporting Periods for professional services rendered by the Auditor for tax compliance, tax advice and tax planning (“Tax Services”) were $0 in October 31, 2020 and $52,000 in October 31, 2021. These services consisted of (i) review or preparation of U.S. federal, state, local and excise tax returns; (ii) U.S. federal, state and local tax planning, advice and assistance regarding statutory, regulatory or administrative developments, and (iii) tax advice regarding tax qualification matters and/or treatment of various financial instruments held or proposed to be acquired or held.
There were no fees billed for tax services by to the service affiliates during the Reporting Periods that required pre-approval by the Audit Auditors Committee.
(d) All Other Fees. The aggregate fees for other fees billed in the Reporting Periods for products and services provided by the Auditor were $0 in October 31, 2020 and $0 in October 31, 2021, other than the services reported in paragraphs (a) through (c) of this item for the Legg Mason Global Asset Management Trust.
All Other Fees. There were no other non-audit services rendered by the Auditor to Legg Mason Partners Fund Advisors, LLC (“LMPFA”), and any entity controlling, controlled by or under common control with LMPFA that provided ongoing services to Legg Mason Global Asset Management Trust requiring pre-approval by the Audit Committee in the Reporting Period.
(e) Audit Committee’s pre–approval policies and procedures described in paragraph (c) (7) of Rule 2-01 of Regulation S-X.
(1) The Charter for the Audit Committee (the “Committee”) of the Board of each registered investment company (the “Fund”) advised by LMPFA or one of their affiliates (each, an “Adviser”) requires that the Committee shall approve (a) all audit and permissible non-audit services to be provided to the Fund and (b) all permissible non-audit services to be provided by the Fund’s independent auditors to the Adviser and any Covered Service Providers if the engagement relates directly to the operations and financial reporting of the Fund. The
Committee may implement policies and procedures by which such services are approved other than by the full Committee.
The Committee shall not approve non-audit services that the Committee believes may impair the independence of the auditors. As of the date of the approval of this Audit Committee Charter, permissible non-audit services include any professional services (including tax services), that are not prohibited services as described below, provided to the Fund by the independent auditors, other than those provided to the Fund in connection with an audit or a review of the financial statements of the Fund. Permissible non-audit services may not include: (i) bookkeeping or other services related to the accounting records or financial statements of the Fund; (ii) financial information systems design and implementation; (iii) appraisal or valuation services, fairness opinions or contribution-in-kind reports; (iv) actuarial services; (v) internal audit outsourcing services; (vi) management functions or human resources; (vii) broker or dealer, investment adviser or investment banking services; (viii) legal services and expert services unrelated to the audit; and (ix) any other service the Public Company Accounting Oversight Board determines, by regulation, is impermissible.
Pre-approval by the Committee of any permissible non-audit services is not required so long as: (i) the aggregate amount of all such permissible non-audit services provided to the Fund, the Adviser and any service providers controlling, controlled by or under common control with the Adviser that provide ongoing services to the Fund (“Covered Service Providers”) constitutes not more than 5% of the total amount of revenues paid to the independent auditors during the fiscal year in which the permissible non-audit services are provided to (a) the Fund, (b) the Adviser and (c) any entity controlling, controlled by or under common control with the Adviser that provides ongoing services to the Fund during the fiscal year in which the services are provided that would have to be approved by the Committee; (ii) the permissible non-audit services were not recognized by the Fund at the time of the engagement to be non-audit services; and (iii) such services are promptly brought to the attention of the Committee and approved by the Committee (or its delegate(s)) prior to the completion of the audit.
(2) For the Legg Mason Global Asset Management Trust, the percentage of fees that were approved by the audit committee, with respect to: Audit-Related Fees were 100% and 100% for October 31, 2020 and October 31, 2021; Tax Fees were 100% and 100% for October 31, 2020 and October 31, 2021; and Other Fees were 100% and 100% for October 31, 2020 and October 31, 2021.
(f) N/A
(g) Non-audit fees billed by the Auditor for services rendered to Legg Mason Global Asset Management Trust, LMPFA and any entity controlling, controlled by, or under common control with LMPFA that provides ongoing services to Legg Mason Global Asset Management Trust during the reporting period were $888,953 in October 31, 2020 and $855,080 in October 31, 2021.
(h) Yes. Legg Mason Global Asset Management Trust’s Audit Committee has considered whether the provision of non-audit services that were rendered to Service Affiliates, which were not pre-approved (not requiring pre-approval), is compatible with maintaining the Accountant’s independence. All services provided by the Auditor to the Legg Mason Global Asset Management Trust or to Service Affiliates, which were required to be pre-approved, were pre-approved as required.
| ITEM 5. | AUDIT COMMITTEE OF LISTED REGISTRANTS. |
| | a) | The independent board members are acting as the registrant’s audit committee as specified in Section 3(a)(58)(B) of the Exchange Act. The Audit Committee consists of the following Board members: |
Paul R. Ades
Andrew L. Breech
Althea L. Duersten**
Stephen R. Gross
Susan M. Heilbron
Howard J. Johnson
Arnold L. Lehman
Robin J.W. Masters
Jerome H. Miller
Ken Miller
G. Peter O’Brien
Thomas F. Schlafly
| | * | During a June 15, 2021 special meeting of shareholders, a new group of Trustees were elected to oversee the mutual funds of Legg Mason Global Asset Management Trust, Legg Mason Partners Investment Trust (prior to September 1, 2021, known as Legg Mason Equity Trust) and Legg Mason Partners Variable Equity Trust, effective July 1, 2021. |
| | ** | Effective July 1, 2021, Ms. Duersten became Chair. |
| ITEM 6. | SCHEDULE OF INVESTMENTS. |
Included herein under Item 1.
| ITEM 7. | DISCLOSURE OF PROXY VOTING POLICIES AND PROCEDURES FOR CLOSED-END MANAGEMENT INVESTMENT COMPANIES. |
Not applicable.
| ITEM 8. | PORTFOLIO MANAGERS OF CLOSED-END MANAGEMENT INVESTMENT COMPANIES. |
Not applicable.
| ITEM 9. | PURCHASES OF EQUITY SECURITIES BY CLOSED-END MANAGEMENT INVESTMENT COMPANY AND AFFILIATED PURCHASERS. |
Not applicable.
| ITEM 10. | SUBMISSION OF MATTERS TO A VOTE OF SECURITY HOLDERS. |
Not applicable.
| ITEM 11. | CONTROLS AND PROCEDURES. |
| | (a) | The registrant’s principal executive officer and principal financial officer have concluded that the registrant’s disclosure controls and procedures (as defined in Rule 30a- 3(c) under the Investment Company Act of 1940, as amended (the “1940 Act”)) are effective as of a date within 90 days of the filing date of this report that includes the disclosure required by this paragraph, based on their evaluation of the disclosure controls and procedures required by Rule 30a-3(b) under the 1940 Act and 15d-15(b) under the Securities Exchange Act of 1934. |
| | (b) | There were no changes in the registrant’s internal control over financial reporting (as defined in Rule 30a-3(d) under the 1940 Act) that occurred during the second fiscal |
SIGNATURES
Pursuant to the requirements of the Securities Exchange Act of 1934 and the Investment Company Act of 1940, the registrant has duly caused this Report to be signed on its behalf by the undersigned, there unto duly authorized.
Legg Mason Global Asset Management Trust
| | |
| By: | | /s/ Jane Trust |
| | Jane Trust |
| | Chief Executive Officer |
| |
| Date: | | December 23, 2021 |
Pursuant to the requirements of the Securities Exchange Act of 1934 and the Investment Company Act of 1940, this report has been signed below by the following persons on behalf of the registrant and in the capacities and on the dates indicated.
| | |
| By: | | /s/ Jane Trust |
| | Jane Trust |
| | Chief Executive Officer |
| |
| Date: | | December 23, 2021 |
| |
| By: | | /s/ Christopher Berarducci |
| | Christopher Berarducci |
| | Principal Financial Officer |
| |
| Date: | | December 23, 2021 |