UNITED STATES
SECURITIES AND EXCHANGE COMMISSION
Washington, D.C. 20549
FORM N-CSR
CERTIFIED SHAREHOLDER REPORT OF REGISTERED
MANAGEMENT INVESTMENT COMPANIES
Investment Company Act file number 811-22338
Legg Mason Global Asset Management Trust
(Exact name of registrant as specified in charter)
100 International Drive, Baltimore, MD, 21202
(Address of principal executive offices) (Zip code)
Marc A. De Oliveira
Franklin Templeton
100 First Stamford Place
Stamford, CT 06902
(Name and address of agent for service)
Registrant’s telephone number, including area code: 877-6LM-FUND/656-3863
Date of fiscal year end: September 30
Date of reporting period: September 30, 2023
| ITEM 1. | REPORT TO STOCKHOLDERS |
The Annual Report to Stockholders is filed herewith.

| | |
| Annual Report | | September 30, 2023 |
FRANKLIN
STRATEGIC REAL
RETURN FUND
The Securities and Exchange Commission has adopted new regulations that will result in changes to the design and delivery of annual and semi-annual shareholder reports beginning in July 2024.
If you have previously elected to receive shareholder reports electronically, you will continue to do so and need not take any action.
Otherwise, paper copies of the Fund’s shareholder reports will be mailed to you beginning in July 2024. If you would like to receive shareholder reports and other communications from the Fund electronically instead of by mail, you may make that request at any time by contacting your financial intermediary (such as a broker-dealer or bank) or, if you are a direct investor, enrolling at franklintempleton.com.
You may access franklintempleton.com by scanning the code below.

|
| INVESTMENT PRODUCTS: NOT FDIC INSURED • NO BANK GUARANTEE • MAY LOSE VALUE |
Fund objective
The Fund seeks to provide an attractive long-term real return.
| | |
| II | | Franklin Strategic Real Return Fund |
Letter from the president

Dear Shareholder,
We are pleased to provide the annual report of Franklin Strategic Real Return Fund for the twelve-month reporting period ended September 30, 2023. Please read on for a detailed look at prevailing economic and market conditions during the Fund’s reporting period and to learn how those conditions have affected Fund performance.
Special shareholder notice
Effective September 1, 2023, Jose Maldonado, CFA joined the Fund’s portfolio management team and Joseph Giroux ceased to be a member of the Fund’s portfolio management team. For more information, please see the Fund’s prospectus supplement dated September 1, 2023.
As always, we remain committed to providing you with excellent service and a full spectrum of investment choices. We also remain committed to supplementing the support you receive from your financial advisor. One way we accomplish this is through our website, www.franklintempleton.com. Here you can gain immediate access to market and investment information, including:
| • | | Fund prices and performance, |
| • | | Market insights and commentaries from our portfolio managers, and |
| • | | A host of educational resources. |
We look forward to helping you meet your financial goals.
Sincerely,

Jane Trust, CFA
President and Chief Executive Officer
October 31, 2023
| | |
| Franklin Strategic Real Return Fund | | III |
Fund overview
Q. What is the Fund’s investment strategy?
A. Under normal market conditions, the Fund, using a tactical asset allocation program, seeks to provide an attractive long-term real return. The Fund defines real return as total return reduced by the impact of inflation. In seeking to meet its investment goal, the Fund implements a tactical asset allocation program overseen by its adviser, Franklin Advisers, Inc. (“Franklin Advisers”). The Fund may allocate its assets among five investment “sleeves” which we believe are generally complementary to each other, with the following target allocations of the Fund’s net assets:
| • | | Inflation-Linked Debt Securities (40%) |
| • | | Global Equity Securities (20%) |
| • | | Commodity-Linked Securities (20%) |
| • | | Real Estate Investment Trusts (“REITs”) and Exchange-Traded Funds (“ETFs”) that invest in REITs (10%) |
| • | | Tactical Strategy (10%) |
Actual allocations may deviate from each target allocation shown above by up to 50% of such target allocation. The composition and asset allocation of the Fund’s investment portfolio will vary over time, based on Franklin Advisers’ overall allocation decisions, and may be changed without shareholder approval. Asset allocation decisions are primarily based on Franklin Advisers’ evaluation of the relative attractiveness of the asset classes in which the Fund invests. The processes take into account several factors, including quantitative analysis, qualitative inputs and risk management guidelines. Holdings in a particular strategy may also vary because of performance differences among the different strategies.
The Fund utilizes a “multi-manager” approach, whereby the each subadviser and the adviser provide day-to-day management for one or more of the investment sleeves. Each subadviser and the adviser use different investment strategies in managing the sleeves, act independently from the others in their management of the investment sleeve for which they are responsible, and use their own methodology for selecting investments. Currently, Western Asset Management Company, LLC (“Western Asset”), Western Asset Management Company Limited in London (“WAML”) and Western Asset Management Company Ltd. in Japan (“Western Japan”) manage the Inflation-Linked Debt Securities Sleeve and Franklin Advisers manages the Global Equity Securities Sleeve, the Commodity-Linked Securities Sleeve, the REITs Sleeve and the Tactical Strategy Sleeve. Franklin Advisers may also allocate a portion of the Fund’s assets to ClearBridge Investments, LLC (“ClearBridge”), either in place of, or in addition to, the subadvisers named above. Western Asset also manages the portion of the Fund’s cash and short-term instruments allocated to it. The Fund may use commodity derivatives (swaps and S&P GSCI®i futures) to gain exposure to commodities. These derivatives are fully collateralized with cash or cash equivalents.
| | | | | | |
| Franklin Strategic Real Return Fund 2023 Annual Report | | | | | 1 | |
Fund overview (cont’d)
Q. What were the overall market conditions during the Fund’s reporting period?
A. Global equity returns were positive across all regions and virtually all sectors for the twelve-month reporting period ending September 30, 2023, most in double-digits, with the MSCI All Country World Index (“MSCI ACWI”) (NR)ii Index returning 20.80%. Yields moved higher across the U.S. Treasury yield curve which remained inverted at the end of the reporting period.
Global equities collectively advanced in the fourth quarter of 2022. However, as the quarter wound down, investor concerns about slower global economic growth returned, driven by the aggressive rate-hiking actions of many central banks during the year, and global equities retreated. Global equities closed 2022 with the worst annual loss since the 2008 global financial crisis. In the U.S., following a solid rebound in October and November as inflation data improved, the equity market pulled back broadly in December, leaving major indexes with their strongest quarterly performance of 2022 but their worst calendar-year performance since 2008. U.S. Treasury yields increased on the shorter and longer ends of the U.S. Treasury yield curve, but fell slightly in the middle, increasing the yield curve inversion. U.S. benchmark crude oil futures prices rose, while international benchmark Brent crude futures fell.
Global equities collectively advanced during the first quarter of 2023 amid signs of economic resilience and investor optimism that the worldwide rate-hiking cycle might be approaching an end. After a strong rally in January, global stocks declined in February as economic data prompted hawkish comments from many central banks. Financial markets experienced heightened volatility in March due to banking turmoil in the United States and Europe, but they rallied as the banking industry stabilized. Key U.S. equity indexes ended the first quarter of 2023 with gains despite heightened financial market volatility in March due to turmoil in the banking industry. The stabilization of the U.S. banking system and investor optimism that the Federal Reserve Board (the “Fed”) hiking cycle might be coming to an end helped drive equities higher. U.S. Treasury yields increased for ultra short maturities but fell for intermediate and longer-term maturities. The yield curve remained inverted. U.S. and international benchmark crude oil futures declined.
Global equities collectively rose during the second quarter of 2023 as banking industry concerns subsided, the U.S. debt-ceiling issue was resolved, first-quarter corporate earnings generally exceeded consensus estimates, and investors welcomed a slower pace, or pause, of interest-rate hikes by several central banks. Concerns remained that persistent inflation combined with robust labor markets in many regions could lead some central banks to further tighten monetary policy. Key U.S. equity indexes rose during the second quarter of 2023, driven by better-than-expected first-quarter earnings, the suspension of the debt ceiling, subsiding concerns about U.S. regional banks, resilient economic growth, and
| | | | |
| 2 | | | | Franklin Strategic Real Return Fund 2023 Annual Report |
hopes for an end to the Fed rate hikes. Investor enthusiasm for artificial intelligence (AI) bolstered technology-related stocks. Yields increased across the U.S. Treasury yield curve, which remained inverted. Increases were notably pronounced for shorter U.S. Treasury maturities. U.S. and international benchmark crude oil prices declined.
Global equities collectively declined for 2023’s third quarter, with stocks posting gains in July and losses in August and September. Generally easing inflation rates and resilient economic growth in major developed markets, along with investor optimism about a potential end to central bank rate hikes, bolstered global stocks early in the period. However, investor risk appetite soured as it became clearer that key central banks like the Fed intend to hold interest rates higher for longer. Rising sovereign bond yields and energy prices, along with China’s property market crisis and Fitch Ratings’ downgrade of U.S. long-term debt, further weighed on equity markets. On the economic front, global manufacturing activity continued contracting during the third quarter, while global services activity expanded at the slowest pace in eight months. As measured by MSCI indexes in U.S.-dollar terms, developed market equities underperformed a global index, emerging market equities fared better than it, and frontier market equities rose and significantly outperformed it. In terms of investment style, global value stocks declined but fared substantially better than global growth stocks. Yields moved higher across the U.S. Treasury yield curve, with the yield for the ten-year Treasury note surging to the highest level since 2007.
Q. How did we respond to these changing market conditions?
A. Our process focuses mostly on strategic allocation which diversifies among traditional and alternative asset classes and is designed to hedge against short-term and long-term inflation.
During the twelve-month reporting period ending September 30, 2023, there were no major changes in allocation.
Performance review
For the twelve months ended September 30, 2023, Class A shares of Franklin Strategic Real Return Fund, excluding sales charges, returned 8.13%. The Fund’s unmanaged benchmark, the Bloomberg U.S. Treasury: U.S. TIPSiii, returned 1.25% for the same period. The Composite Indexiv, representing the Fund’s underlying investments, returned 9.45% over the same time frame.
| | | | | | |
| Franklin Strategic Real Return Fund 2023 Annual Report | | | | | 3 | |
Fund overview (cont’d)
| | | | | | | | |
Performance Snapshot as of September 30, 2023
(unaudited) | |
| (excluding sales charges) | | 6 months | | | 12 months | |
| Franklin Strategic Real Return Fund: | | | | | | | | |
Class A | | | -2.16 | % | | | 8.13 | % |
Class C | | | -2.46 | % | | | 7.34 | % |
Class I | | | -2.07 | % | | | 8.41 | % |
Class IS | | | -2.01 | % | | | 8.52 | % |
| Bloomberg U.S. Treasury: U.S. TIPS | | | -3.98 | % | | | 1.25 | % |
| Composite Index | | | -0.41 | % | | | 9.45 | % |
The performance shown represents past performance. Past performance is no guarantee of future results and current performance may be higher or lower than the performance shown above. Principal value and investment returns will fluctuate and investors’ shares, when redeemed, may be worth more or less than their original cost. To obtain performance data current to the most recent month-end, please visit our website at www.franklintempleton.com.
All share class returns assume the reinvestment of all distributions at net asset value and the deduction of all Fund expenses. Returns have not been adjusted to include sales charges that may apply or the deduction of taxes that a shareholder would pay on Fund distributions. If sales charges were reflected, the performance quoted would be lower. Performance figures for periods shorter than one year represent cumulative figures and are not annualized.
Fund performance figures reflect fee waivers and/or expense reimbursements, without which the performance would have been lower.
|
| Total Annual Operating Expenses (unaudited) |
As of the Fund’s current prospectus dated January 30, 2023, the gross total annual fund operating expense ratios for Class A, Class C, Class I and Class IS shares were 1.53%, 2.28%, 2.27% and 1.12%, respectively.
Actual expenses may be higher. For example, expenses may be higher than those shown if average net assets decrease. Net assets are more likely to decrease and Fund expense ratios are more likely to increase when markets are volatile.
As a result of expense limitation arrangements, the ratio of total annual fund operating expenses, other than interest, brokerage commissions (except for brokerage commissions paid on purchases and sales of shares of exchange-traded funds (“ETFs”)), dividend expense on short sales, taxes and extraordinary expenses, to average net assets will not exceed 1.35% for Class A shares, 2.10% for Class C shares, 1.10% for Class I shares and 1.00% for Class IS shares. In addition, the ratio of total annual fund operating expenses for Class IS shares will not exceed the ratio of total annual fund operating expenses for Class I shares. Acquired fund fees and expenses are subject to these arrangements. These expense limitation arrangements cannot be terminated prior to December 31, 2024 without the Board of Trustees’ consent.
The manager is permitted to recapture amounts waived and/or reimbursed to a class within three years after the fiscal year in which the manager earned the fee or incurred the expense if the class’ total annual fund operating expenses have fallen to a level below the expense limitation (“expense
| | | | |
| 4 | | | | Franklin Strategic Real Return Fund 2023 Annual Report |
cap”) in effect at the time the fees were earned or the expenses incurred. In no case will the manager recapture any amount that would result, on any particular business day of the Fund, in the class’ total annual fund operating expenses exceeding the expense cap or any other lower limit then in effect.
Q. What were the leading contributors to performance?
A. The leading contributor to absolute performance when considering return and weight in the portfolio was a 21% allocation to Global Equity Securities with a return of approximately 24.9% in the portfolio. The allocation to the Commodity-Linked Securities sleeve was also a strong contributor to absolute performance with a return of approximately 12%. Both were also strong contributors relative to the benchmark, as was the REITs sleeve. Futures on commodities, which were used to manage the Fund’s commodity exposure, contributed to performance. The use of currency forwards to reduce USD exposure was also a contributor.
Q. What were the leading detractors from performance?
A. The leading detractors from relative performance were the allocations to the Inflation-Linked Debt Securities and Tactical Strategy sleeves, with relatively weak returns for the period. U.S. Treasury futures, which were used to manage the Fund’s interest rate risk, detracted from performance. Index futures, used to manage the Fund’s equity price exposure, modestly detracted from results.
Thank you for your investment in Franklin Strategic Real Return Fund. As always, we appreciate that you have chosen us to manage your assets and we remain focused on achieving the Fund’s investment goals.
Sincerely,
Franklin Advisers, Inc.
October 12, 2023
RISKS: The Fund is subject to interest rate, credit, income, prepayment and inflation risks. As interest rates rise, bond prices fall, reducing the value of a fixed income investment. Changes in inflation will cause the Fund’s income to fluctuate, sometimes substantially. Periods of deflation may adversely affect the Fund’s net asset value. Equity securities are subject to market and price fluctuations. The Fund is non-diversified, and therefore it is permitted to invest a larger percentage of its assets in a small number of issuers than a diversified fund, which may magnify the Fund’s losses from events affecting a particular issuer. The Fund is subject to the risks of the underlying funds in which it invests. In addition to the Fund’s operating expenses, you will indirectly bear the operating expenses of any underlying funds, including ETFs. Each underlying fund may engage in active and frequent trading, resulting in higher portfolio turnover and transaction costs. Derivatives, such as options and futures, can be illiquid, may disproportionately increase losses and have a potentially large impact on Fund performance. International investments are subject to special risks including currency fluctuations and social, economic and political uncertainties, which could increase volatility. These risks are magnified in
| | | | | | |
| Franklin Strategic Real Return Fund 2023 Annual Report | | | | | 5 | |
Fund overview (cont’d)
emerging markets. Emerging market countries tend to have economic, political, and legal systems that are less developed and are less stable than those of more developed countries. The Fund may use leverage, which may increase volatility and possibility of loss. The Fund may invest in REITs, which are closely linked to the performance of the real estate markets. The Fund is subject to the illiquidity, credit and interest rate risks of REITs, as well as risks associated with small- and mid-cap investments. The model used to manage the Fund’s assets provides no assurance that the recommended allocation will either maximize returns or minimize risks. There is no assurance that a recommended allocation will prove the ideal allocation in all circumstances. The Fund may engage in short selling, which is a speculative strategy that involves special risks. Unlike the possible loss on a security that is purchased, there is no limit on the amount of loss on an appreciating security that is sold short. Additional risks may include those risks associated with investing in commodities, ETFs, exchange-traded notes (ETNs) and master limited partnerships (MLPs). The market values of securities or other assets will fluctuate, sometimes sharply and unpredictably, due to changes in general market conditions, overall economic trends or events, governmental actions or intervention, actions taken by the U.S. Federal Reserve or foreign central banks, market disruptions caused by trade disputes or other factors, political developments, armed conflicts, economic sanctions and countermeasures in response to sanctions, major cybersecurity events, investor sentiment, the global and domestic effects of a pandemic, and other factors that may or may not be related to the issuer of the security or other asset. Please see the Fund’s prospectus for a more complete discussion of these and other risks and the Fund’s investment strategies.
Portfolio holdings and breakdowns are as of September 30, 2023 and are subject to change and may not be representative of the portfolio managers’ current or future investments. Please refer to pages 14 through 24 for a list and percentage breakdown of the Fund’s holdings.
All investments are subject to risk including the possible loss of principal. Past performance is no guarantee of future results. All index performance reflects no deduction for fees, expenses or taxes. Please note that an investor cannot invest directly in an index.
The information provided is not intended to be a forecast of future events, a guarantee of future results or investment advice. Views expressed may differ from those of the firm as a whole.
| | | | |
| 6 | | | | Franklin Strategic Real Return Fund 2023 Annual Report |
| i | The S&P GSCI® is a composite index of commodity sector returns representing an unleveraged, long-only investment in commodity futures that is broadly diversified across the spectrum of commodities. The returns are calculated on a fully collateralized basis with full reinvestment. |
| ii | The MSCI All Country World Index (“MSCI ACWI”) (NR) is a market capitalization weighted index that is designed to measure the equity market performance of developed and emerging markets. The MSCI ACWI consists of 45 country indices comprising 24 developed and 21 emerging market country indices. Net Returns (NR) include income net of tax withholding when dividends are paid. |
| iii | The Bloomberg U.S. Treasury: U.S. TIPS represents an unmanaged market index made up of U.S. Treasury Inflation Protected securities (TIPS). |
| iv | The Composite Index reflects the blended rate of return of the following underlying indices: 40% Bloomberg U.S. Treasury: U.S. TIPS, 20% MSCI All Country World Index, 20% S&P GSCI®, 10% FTSE NAREIT All REITs Index and 10% FTSE 1-Month U.S. Treasury Bill Index. The Composite Index is hedged to 50% exposure to the U.S. dollar, as defined by the U.S. Dollar Index (USDX). The Composite Index’s unhedged currency exposure is predominantly U.S. dollar-based. The Fund’s target hedged currency exposure is 50% U.S. dollar, 50% non-U.S. dollar. The Fund may deviate, either up or down, from its target currency allocation due to market conditions. |
| | | | | | |
| Franklin Strategic Real Return Fund 2023 Annual Report | | | | | 7 | |
Fund at a glance† (unaudited)
Investment breakdown (%) as a percent of total investments
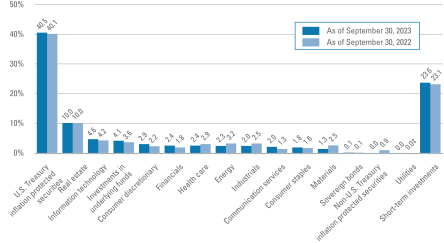
| † | The bar graph above represents the composition of the Fund’s investments as of September 30, 2023 and September 30, 2022 and does not include derivatives, such as futures contracts and forward foreign currency contracts. The Fund is actively managed. As a result, the composition of the Fund’s investments is subject to change at any time. |
| ‡ | Represents less than 0.1%. |
| | | | |
| 8 | | | | Franklin Strategic Real Return Fund 2023 Annual Report |
Fund expenses (unaudited)
Example
As a shareholder of the Fund, you may incur two types of costs: (1) transaction costs, including front-end and back-end sales charges (loads) on purchase payments; and (2) ongoing costs, including management fees; service and/or distribution (12b-1) fees; and other Fund expenses. This example is intended to help you understand your ongoing costs (in dollars) of investing in the Fund and to compare these costs with the ongoing costs of investing in other mutual funds.
This example is based on an investment of $1,000 invested on April 1, 2023 and held for the six months ended September 30, 2023.
Actual expenses
The table below titled “Based on actual total return” provides information about actual account values and actual expenses. You may use the information provided in this table, together with the amount you invested, to estimate the expenses that you paid over the period. To estimate the expenses you paid on your account, divide your ending account value by $1,000 (for example, an $8,600 ending account value divided by $1,000 = 8.6), then multiply the result by the number under the heading entitled “Expenses Paid During the Period”.
Hypothetical example for comparison purposes
The table below titled “Based on hypothetical total return” provides information about hypothetical account values and hypothetical expenses based on the actual expense ratio and an assumed rate of return of 5.00% per year before expenses, which is not the Fund’s actual return. The hypothetical account values and expenses may not be used to estimate the actual ending account balance or expenses you paid for the period. You may use the information provided in this table to compare the ongoing costs of investing in the Fund and other funds. To do so, compare the 5.00% hypothetical example relating to the Fund with the 5.00% hypothetical examples that appear in the shareholder reports of the other funds.
Please note that the expenses shown in the table below are meant to highlight your ongoing costs only and do not reflect any transactional costs, such as front-end or back-end sales charges (loads). Therefore, the table is useful in comparing ongoing costs only, and will not help you determine the relative total costs of owning different funds. In addition, if these transaction costs were included, your costs would have been higher.
| | | | | | | | | | | | | | | | | | | | | | | | | | | | | | | | | | | | | | | | | | | | | | |
| | |
| Based on actual total return1 | | | | | | Based on hypothetical total return1 | |
| | | Actual Total Return Without Sales Charge2 | | | Beginning Account Value | | | Ending Account Value | | | Annualized Expense Ratio3 | | | Expenses Paid During the Period4 | | | | | | | | Hypothetical Annualized Total Return | | | Beginning Account
Value | | | Ending
Account
Value | | | Annualized Expense Ratio3 | | | Expenses Paid During the Period4 | |
| Class A | | | -2.16 | % | | $ | 1,000.00 | | | $ | 978.40 | | | | 1.30 | % | | $ | 6.45 | | | | | | | Class A | | | 5.00 | % | | $ | 1,000.00 | | | $ | 1,018.55 | | | | 1.30 | % | | $ | 6.58 | |
| Class C | | | -2.46 | | | | 1,000.00 | | | | 975.40 | | | | 2.05 | | | | 10.15 | | | | | | | Class C | | | 5.00 | | | | 1,000.00 | | | | 1,014.79 | | | | 2.05 | | | | 10.35 | |
| Class I | | | -2.07 | | | | 1,000.00 | | | | 979.30 | | | | 1.05 | | | | 5.21 | | | | | | | Class I | | | 5.00 | | | | 1,000.00 | | | | 1,019.80 | | | | 1.05 | | | | 5.32 | |
| Class IS | | | -2.01 | | | | 1,000.00 | | | | 979.90 | | | | 0.95 | | | | 4.72 | | | | | | | Class IS | | | 5.00 | | | | 1,000.00 | | | | 1,020.31 | | | | 0.95 | | | | 4.81 | |
| | | | | | |
| Franklin Strategic Real Return Fund 2023 Annual Report | | | | | 9 | |
Fund expenses (unaudited) (cont’d)
| 1 | For the six months ended September 30, 2023. |
| 2 | Assumes the reinvestment of all distributions, including returns of capital, if any, at net asset value and does not reflect the deduction of the applicable sales charge with respect to Class A shares or the applicable contingent deferred sales charge (“CDSC”) with respect to Class C shares. Total return is not annualized, as it may not be representative of the total return for the year. Performance figures may reflect compensating balance arrangements, fee waivers and/or expense reimbursements. In the absence of compensating balance arrangements, fee waivers and/or expense reimbursements, the total return would have been lower. Past performance is no guarantee of future results. |
| 3 | Does not include fees and expenses of the Underlying Funds in which the Fund invests. |
| 4 | Expenses (net of compensating balance arrangements, fee waivers and/or expense reimbursements) are equal to each class’ respective annualized expense ratio multiplied by the average account value over the period, multiplied by the number of days in the most recent fiscal half-year (183), then divided by 365. |
| | | | |
| 10 | | | | Franklin Strategic Real Return Fund 2023 Annual Report |
Fund performance (unaudited)
| | | | | | | | | | | | | | | | |
| Average annual total returns | | | | | | | | | | | | |
| Without sales charges1 | | Class A | | | Class C | | | Class I | | | Class IS | |
| Twelve Months Ended 9/30/23 | | | 8.13 | % | | | 7.34 | % | | | 8.41 | % | | | 8.52 | % |
| Five Years Ended 9/30/23 | | | 2.51 | | | | 2.00 | | | | 2.74 | | | | 2.87 | |
| Ten Years Ended 9/30/23 | | | 1.26 | | | | 0.64 | | | | 1.51 | | | | 1.61 | |
| | | | |
| With sales charges2 | | Class A | | | Class C | | | Class I | | | Class IS | |
| Twelve Months Ended 9/30/23 | | | 2.23 | % | | | 6.38 | % | | | 8.41 | % | | | 8.52 | % |
| Five Years Ended 9/30/23 | | | 1.29 | | | | 2.00 | | | | 2.74 | | | | 2.87 | |
| Ten Years Ended 9/30/23 | | | 0.66 | | | | 0.64 | | | | 1.51 | | | | 1.61 | |
| | | | |
| Cumulative total returns | |
| |
| Without sales charges1 | | | |
| Class A (9/30/13 through 9/30/23) | | | 13.36 | % |
| Class C (9/30/13 through 9/30/23) | | | 6.55 | |
| Class I (9/30/13 through 9/30/23) | | | 16.17 | |
| Class IS (9/30/13 through 9/30/23) | | | 17.36 | |
All figures represent past performance and are not a guarantee of future results. Investment return and principal value of an investment will fluctuate so that an investor’s shares, when redeemed, may be worth more or less than their original cost. The returns shown do not reflect the deduction of taxes that a shareholder would pay on Fund distributions or the redemption of Fund shares. Performance figures may reflect compensating balance arrangements, fee waivers and/or expense reimbursements. In the absence of compensating balance arrangements, fee waivers and/or expense reimbursements, the total return would have been lower.
| 1 | Assumes the reinvestment of all distributions, including returns of capital, if any, at net asset value and does not reflect the deduction of the applicable sales charge with respect to Class A shares or the applicable contingent deferred sales charge (“CDSC”) with respect to Class C shares. |
| 2 | Assumes the reinvestment of all distributions, including returns of capital, if any, at net asset value. In addition, Class A shares reflect the deduction of the maximum initial sales charge of 5.75% on purchases made prior to August 15, 2022. Purchases made on or after August 15, 2022 incur a maximum initial sales charge of 5.50%. Class C shares reflect the deduction of a 1.00% CDSC, which applies if shares are redeemed within one year from purchase payment. |
| | | | | | |
| Franklin Strategic Real Return Fund 2023 Annual Report | | | | | 11 | |
Fund performance (unaudited) (cont’d)
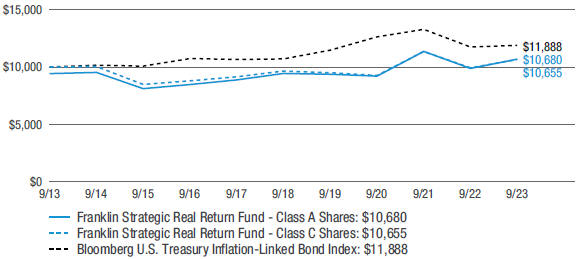
Historical performance
Value of $10,000 invested in
Class A and C Shares of Franklin Strategic Real Return Fund vs. Bloomberg U.S. Treasury Inflation-Linked Bond Index‡ — September 2013 - September 2023
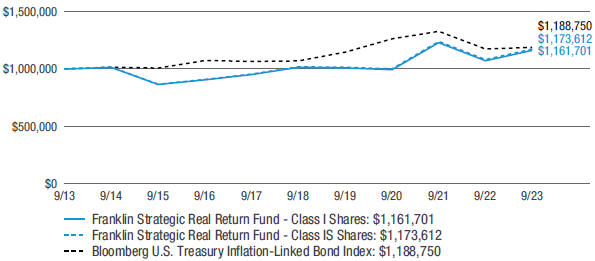
Value of $1,000,000 invested in
Class I and IS Shares of Franklin Strategic Real Return Fund vs. Bloomberg U.S. Treasury Inflation-Linked Bond Index‡ — September 2013 - September 2023
All figures represent past performance and are not a guarantee of future results. Investment return and principal value of an investment will fluctuate so that an investor’s shares, when redeemed, may be worth more or less than their original cost. The returns shown do not reflect the deduction of taxes that a shareholder would pay on Fund distributions or the redemption of Fund shares. Performance figures may reflect compensating balance arrangements, fee waivers and/or expense reimbursements. In the absence of compensating balance arrangements, fee waivers and/or expense reimbursements, the total return would have been lower.
| ‡ | Hypothetical illustration of $10,000 invested in Class A and C shares and $1,000,000 invested in Class I and Class IS shares of Franklin Strategic Real Return Fund on September 30, 2013, assuming the deduction of the maximum initial sales charge of 5.75% at the time of investment for Class A shares and the reinvestment of all |
| | | | |
| 12 | | | | Franklin Strategic Real Return Fund 2023 Annual Report |
| | distributions, including returns of capital, if any, at net asset value through September 30, 2023. Effective August 15, 2022, the maximum initial sales charge was reduced to 5.50% for Class A shares. The hypothetical illustration also assumes a $10,000 or $1,000,000 investment, as applicable, in the Bloomberg U.S. Treasury Inflation-Linked Bond Index. The Bloomberg U.S. Treasury Inflation-Linked Bond Index represents an unmanaged market index made up of U.S. Treasury Inflation-Linked Index securities. Please note that an investor cannot invest directly in an index. The performance of the Fund’s other classes may be greater or less than the Class A, C and I shares’ performance indicated on these charts, depending on whether greater or lesser sales charges and fees were incurred by shareholders investing in the other classes. |
| | | | | | |
| Franklin Strategic Real Return Fund 2023 Annual Report | | | | | 13 | |
Consolidated schedule of investments
September 30, 2023
Franklin Strategic Real Return Fund
(Percentages shown based on Fund net assets)
| | | | | | | | | | | | | | | | |
| Security | | Rate | | | Maturity Date | | | Face Amount | | | Value | |
| U.S. Treasury Inflation Protected Securities — 40.1% | | | | | | | | | | | | | | | | |
U.S. Treasury Bonds, Inflation Indexed | | | 2.500 | % | | | 1/15/29 | | | $ | 2,135,715 | | | $ | 2,150,957 | |
U.S. Treasury Bonds, Inflation Indexed | | | 3.875 | % | | | 4/15/29 | | | | 2,417,363 | | | | 2,603,602 | |
U.S. Treasury Bonds, Inflation Indexed | | | 2.125 | % | | | 2/15/40 | | | | 919,308 | | | | 891,910 | |
U.S. Treasury Bonds, Inflation Indexed | | | 0.750 | % | | | 2/15/42 | | | | 2,299,845 | | | | 1,744,046 | |
U.S. Treasury Bonds, Inflation Indexed | | | 1.375 | % | | | 2/15/44 | | | | 773,874 | | | | 647,859 | |
U.S. Treasury Bonds, Inflation Indexed | | | 0.750 | % | | | 2/15/45 | | | | 4,154,080 | | | | 3,023,515 | |
U.S. Treasury Bonds, Inflation Indexed | | | 0.250 | % | | | 2/15/50 | | | | 1,664,628 | | | | 981,762 | |
U.S. Treasury Bonds, Inflation Indexed | | | 0.125 | % | | | 2/15/52 | | | | 1,866,821 | | | | 1,027,189 | |
U.S. Treasury Bonds, Inflation Indexed | | | 1.500 | % | | | 2/15/53 | | | | 822,704 | | | | 681,426 | |
U.S. Treasury Notes, Inflation Indexed | | | 0.500 | % | | | 4/15/24 | | | | 1,805,969 | | | | 1,774,317 | |
U.S. Treasury Notes, Inflation Indexed | | | 0.125 | % | | | 4/15/25 | | | | 461,553 | | | | 440,357 | |
U.S. Treasury Notes, Inflation Indexed | | | 0.625 | % | | | 1/15/26 | | | | 5,532,036 | | | | 5,260,070 | |
U.S. Treasury Notes, Inflation Indexed | | | 0.125 | % | | | 4/15/26 | | | | 4,312,905 | | | | 4,030,203 | |
U.S. Treasury Notes, Inflation Indexed | | | 0.125 | % | | | 10/15/26 | | | | 3,020,463 | | | | 2,809,517 | |
U.S. Treasury Notes, Inflation Indexed | | | 0.125 | % | | | 4/15/27 | | | | 1,624,020 | | | | 1,491,256 | |
U.S. Treasury Notes, Inflation Indexed | | | 0.750 | % | | | 7/15/28 | | | | 608,905 | | | | 566,831 | |
U.S. Treasury Notes, Inflation Indexed | | | 0.875 | % | | | 1/15/29 | | | | 4,600,470 | | | | 4,270,242 | |
U.S. Treasury Notes, Inflation Indexed | | | 0.250 | % | | | 7/15/29 | | | | 836,549 | | | | 745,646 | |
U.S. Treasury Notes, Inflation Indexed | | | 0.125 | % | | | 1/15/30 | | | | 2,138,670 | | | | 1,865,306 | |
U.S. Treasury Notes, Inflation Indexed | | | 0.125 | % | | | 1/15/32 | | | | 1,764,432 | | | | 1,479,296 | |
U.S. Treasury Notes, Inflation Indexed | | | 1.125 | % | | | 1/15/33 | | | | 1,744,608 | | | | 1,576,769 | |
Total U.S. Treasury Inflation Protected Securities (Cost — $46,399,401) | | | | 40,062,076 | |
| | | | |
| | | | | | | | | Shares | | | | |
| Common Stocks — 29.5% | | | | | | | | | | | | | | | | |
| Communication Services — 2.0% | | | | | | | | | | | | | | | | |
Diversified Telecommunication Services — 0.4% | | | | | | | | | | | | | | | | |
LG Uplus Corp. | | | | | | | | | | | 13,586 | | | | 104,326 | (a) |
Telefonica SA | | | | | | | | | | | 27,200 | | | | 111,121 | (a) |
Verizon Communications Inc. | | | | | | | | | | | 3,550 | | | | 115,056 | |
Total Diversified Telecommunication Services | | | | | | | | | | | | | | | 330,503 | |
Entertainment — 0.4% | | | | | | | | | | | | | | | | |
Electronic Arts Inc. | | | | | | | | | | | 888 | | | | 106,915 | |
NetEase Inc., ADR | | | | | | | | | | | 1,610 | | | | 161,258 | |
Nintendo Co. Ltd. | | | | | | | | | | | 3,000 | | | | 124,659 | (a) |
Total Entertainment | | | | | | | | | | | | | | | 392,832 | |
Interactive Media & Services — 1.1% | | | | | | | | | | | | | | | | |
Alphabet Inc., Class A Shares | | | | | | | | | | | 2,803 | | | | 366,801 | * |
Alphabet Inc., Class C Shares | | | | | | | | | | | 2,744 | | | | 361,796 | * |
See Notes to Consolidated Financial Statements.
| | | | |
| 14 | | | | Franklin Strategic Real Return Fund 2023 Annual Report |
Franklin Strategic Real Return Fund
(Percentages shown based on Fund net assets)
| | | | | | | | |
| Security | | Shares | | | Value | |
Interactive Media & Services — continued | | | | | | | | |
Auto Trader Group PLC | | | 16,300 | | | $ | 122,478 | (a) |
Meta Platforms Inc., Class A Shares | | | 900 | | | | 270,189 | * |
Total Interactive Media & Services | | | | | | | 1,121,264 | |
Wireless Telecommunication Services — 0.1% | | | | | | | | |
MTN Group Ltd. | | | 13,926 | | | | 83,002 | |
Total Communication Services | | | | | | | 1,927,601 | |
| Consumer Discretionary — 2.9% | | | | | | | | |
Automobiles — 0.8% | | | | | | | | |
Bayerische Motoren Werke AG | | | 1,374 | | | | 139,553 | (a) |
Honda Motor Co. Ltd. | | | 11,700 | | | | 131,622 | (a) |
Hyundai Motor Co. | | | 740 | | | | 104,639 | (a) |
Kia Corp. | | | 2,382 | | | | 143,373 | (a) |
Mercedes-Benz Group AG | | | 1,525 | | | | 106,135 | (a) |
Tesla Inc. | | | 640 | | | | 160,141 | * |
Total Automobiles | | | | | | | 785,463 | |
Broadline Retail — 0.4% | | | | | | | | |
Alibaba Group Holding Ltd. | | | 14,000 | | | | 151,790 | *(a) |
Amazon.com Inc. | | | 1,557 | | | | 197,926 | * |
eBay Inc. | | | 1,924 | | | | 84,829 | |
Total Broadline Retail | | | | | | | 434,545 | |
Hotels, Restaurants & Leisure — 0.4% | | | | | | | | |
Booking Holdings Inc. | | | 40 | | | | 123,358 | * |
Domino’s Pizza Inc. | | | 300 | | | | 113,637 | |
Yum! Brands Inc. | | | 1,046 | | | | 130,687 | |
Total Hotels, Restaurants & Leisure | | | | | | | 367,682 | |
Household Durables — 0.2% | | | | | | | | |
PulteGroup Inc. | | | 2,700 | | | | 199,935 | |
Specialty Retail — 0.8% | | | | | | | | |
AutoZone Inc. | | | 69 | | | | 175,259 | * |
Home Depot Inc. | | | 687 | | | | 207,584 | |
Lowe’s Cos. Inc. | | | 879 | | | | 182,692 | |
TJX Cos. Inc. | | | 2,290 | | | | 203,535 | |
Total Specialty Retail | | | | | | | 769,070 | |
Textiles, Apparel & Luxury Goods — 0.3% | | | | | | | | |
Deckers Outdoor Corp. | | | 274 | | | | 140,861 | * |
Pandora A/S | | | 1,592 | | | | 164,281 | (a) |
Under Armour Inc., Class A Shares | | | 4,764 | | | | 32,633 | * |
Total Textiles, Apparel & Luxury Goods | | | | | | | 337,775 | |
Total Consumer Discretionary | | | | | | | 2,894,470 | |
See Notes to Consolidated Financial Statements.
| | | | | | |
| Franklin Strategic Real Return Fund 2023 Annual Report | | | | | 15 | |
Consolidated schedule of investments (cont’d)
September 30, 2023
Franklin Strategic Real Return Fund
(Percentages shown based on Fund net assets)
| | | | | | | | |
| Security | | Shares | | | Value | |
| Consumer Staples — 1.8% | | | | | | | | |
Beverages — 0.2% | | | | | | | | |
PepsiCo Inc. | | | 450 | | | $ | 76,248 | |
Remy Cointreau SA | | | 687 | | | | 83,757 | (a) |
Total Beverages | | | | | | | 160,005 | |
Consumer Staples Distribution & Retail — 0.8% | | | | | | | | |
George Weston Ltd. | | | 1,200 | | | | 133,080 | |
Koninklijke Ahold Delhaize NV | | | 4,300 | | | | 129,601 | (a) |
Kroger Co. | | | 2,657 | | | | 118,901 | |
Tesco PLC | | | 34,700 | | | | 111,612 | (a) |
Walgreens Boots Alliance Inc. | | | 3,481 | | | | 77,417 | |
Walmart Inc. | | | 1,465 | | | | 234,297 | |
Total Consumer Staples Distribution & Retail | | | | | | | 804,908 | |
Food Products — 0.3% | | | | | | | | |
Hershey Co. | | | 595 | | | | 119,048 | |
Ingredion Inc. | | | 931 | | | | 91,610 | |
JBS S/A | | | 15,600 | | | | 56,019 | |
Saputo Inc. | | | 4,000 | | | | 83,637 | |
Total Food Products | | | | | | | 350,314 | |
Household Products — 0.3% | | | | | | | | |
Clorox Co. | | | 900 | | | | 117,954 | |
Procter & Gamble Co. | | | 1,126 | | | | 164,238 | |
Total Household Products | | | | | | | 282,192 | |
Tobacco — 0.2% | | | | | | | | |
Imperial Brands PLC | | | 4,700 | | | | 95,346 | (a) |
Japan Tobacco Inc. | | | 5,800 | | | | 133,447 | (a) |
Total Tobacco | | | | | | | 228,793 | |
Total Consumer Staples | | | | | | | 1,826,212 | |
| Energy — 1.3% | | | | | | | | |
Oil, Gas & Consumable Fuels — 1.3% | | | | | | | | |
APA Corp. | | | 2,565 | | | | 105,421 | |
BP PLC | | | 33,000 | | | | 212,716 | (a) |
Exxon Mobil Corp. | | | 1,300 | | | | 152,854 | |
Marathon Petroleum Corp. | | | 1,420 | | | | 214,903 | |
Murphy Oil Corp. | | | 2,198 | | | | 99,679 | |
PetroChina Co. Ltd., Class H Shares | | | 258,000 | | | | 193,354 | (a) |
Phillips 66 | | | 1,180 | | | | 141,777 | |
Valero Energy Corp. | | | 1,374 | | | | 194,710 | |
Total Energy | | | | | | | 1,315,414 | |
See Notes to Consolidated Financial Statements.
| | | | |
| 16 | | | | Franklin Strategic Real Return Fund 2023 Annual Report |
Franklin Strategic Real Return Fund
(Percentages shown based on Fund net assets)
| | | | | | | | |
| Security | | Shares | | | Value | |
| Financials — 2.4% | | | | | | | | |
Banks — 0.8% | | | | | | | | |
Bank of China Ltd., Class H Shares | | | 229,000 | | | $ | 79,778 | (a) |
BNP Paribas SA | | | 1,924 | | | | 122,340 | (a) |
Citigroup Inc. | | | 2,229 | | | | 91,679 | |
Comerica Inc. | | | 2,553 | | | | 106,077 | |
JPMorgan Chase & Co. | | | 1,249 | | | | 181,130 | |
Wells Fargo & Co. | | | 4,031 | | | | 164,707 | |
Total Banks | | | | | | | 745,711 | |
Capital Markets — 0.6% | | | | | | | | |
3i Group PLC | | | 5,000 | | | | 125,853 | (a) |
Ameriprise Financial Inc. | | | 401 | | | | 132,202 | |
Bank of New York Mellon Corp. | | | 2,950 | | | | 125,818 | |
CI Financial Corp. | | | 7,400 | | | | 84,229 | |
State Street Corp. | | | 1,500 | | | | 100,440 | |
Total Capital Markets | | | | | | | 568,542 | |
Consumer Finance — 0.2% | | | | | | | | |
Discover Financial Services | | | 1,281 | | | | 110,973 | |
Synchrony Financial | | | 3,939 | | | | 120,415 | |
Total Consumer Finance | | | | | | | 231,388 | |
Financial Services — 0.2% | | | | | | | | |
Mastercard Inc., Class A Shares | | | 570 | | | | 225,669 | |
Insurance — 0.6% | | | | | | | | |
Allianz SE, Registered Shares | | | 759 | | | | 180,624 | (a) |
Fairfax Financial Holdings Ltd. | | | 160 | | | | 130,612 | |
Japan Post Holdings Co. Ltd. | | | 13,300 | | | | 106,402 | (a) |
Legal & General Group PLC | | | 34,000 | | | | 91,743 | (a) |
Muenchener Rueckversicherungs-Gesellschaft AG in Muenchen, Registered Shares | | | 350 | | | | 136,308 | (a) |
Total Insurance | | | | | | | 645,689 | |
Total Financials | | | | | | | 2,416,999 | |
| Health Care — 2.3% | | | | | | | | |
Biotechnology — 0.4% | | | | | | | | |
Biogen Inc. | | | 447 | | | | 114,883 | * |
Regeneron Pharmaceuticals Inc. | | | 175 | | | | 144,018 | * |
Vertex Pharmaceuticals Inc. | | | 558 | | | | 194,039 | * |
Total Biotechnology | | | | | | | 452,940 | |
Health Care Providers & Services — 1.2% | | | | | | | | |
Cardinal Health Inc. | | | 1,832 | | | | 159,054 | |
Elevance Health Inc. | | | 394 | | | | 171,555 | |
HCA Healthcare Inc. | | | 657 | | | | 161,609 | |
See Notes to Consolidated Financial Statements.
| | | | | | |
| Franklin Strategic Real Return Fund 2023 Annual Report | | | | | 17 | |
Consolidated schedule of investments (cont’d)
September 30, 2023
Franklin Strategic Real Return Fund
(Percentages shown based on Fund net assets)
| | | | | | | | |
| Security | | Shares | | | Value | |
Health Care Providers & Services — continued | | | | | | | | |
McKesson Corp. | | | 413 | | | $ | 179,593 | |
Molina Healthcare Inc. | | | 516 | | | | 169,191 | * |
UnitedHealth Group Inc. | | | 619 | | | | 312,094 | |
Total Health Care Providers & Services | | | | | | | 1,153,096 | |
Pharmaceuticals — 0.7% | | | | | | | | |
Novo Nordisk A/S, Class B Shares | | | 3,380 | | | | 307,753 | (a) |
Ono Pharmaceutical Co. Ltd. | | | 5,800 | | | | 111,235 | (a) |
Pfizer Inc. | | | 3,939 | | | | 130,657 | |
Roche Holding AG | | | 348 | | | | 95,004 | (a) |
Shionogi & Co. Ltd. | | | 1,700 | | | | 75,828 | (a) |
Total Pharmaceuticals | | | | | | | 720,477 | |
Total Health Care | | | | | | | 2,326,513 | |
| Industrials — 2.0% | | | | | | | | |
Building Products — 0.3% | | | | | | | | |
Lennox International Inc. | | | 549 | | | | 205,567 | |
Masco Corp. | | | 2,657 | | | | 142,017 | |
Total Building Products | | | | | | | 347,584 | |
Industrial Conglomerates — 0.1% | | | | | | | | |
3M Co. | | | 1,099 | | | | 102,888 | |
Machinery — 0.3% | | | | | | | | |
Caterpillar Inc. | | | 861 | | | | 235,053 | |
Deere & Co. | | | 250 | | | | 94,345 | |
Total Machinery | | | | | | | 329,398 | |
Marine Transportation — 0.2% | | | | | | | | |
A.P. Moller - Maersk A/S, Class B Shares | | | 59 | | | | 106,135 | (a) |
Evergreen Marine Corp. Ltd. | | | 12,000 | | | | 43,155 | (a) |
Total Marine Transportation | | | | | | | 149,290 | |
Professional Services — 0.3% | | | | | | | | |
ManpowerGroup Inc. | | | 1,100 | | | | 80,652 | |
Wolters Kluwer NV | | | 1,390 | | | | 168,295 | (a) |
Total Professional Services | | | | | | | 248,947 | |
Trading Companies & Distributors — 0.8% | | | | | | | | |
Marubeni Corp. | | | 12,600 | | | | 196,412 | (a) |
Mitsubishi Corp. | | | 4,200 | | | | 200,131 | (a) |
Mitsui & Co. Ltd. | | | 5,100 | | | | 184,977 | (a) |
W.W. Grainger Inc. | | | 265 | | | | 183,338 | |
Total Trading Companies & Distributors | | | | | | | 764,858 | |
Total Industrials | | | | | | | 1,942,965 | |
See Notes to Consolidated Financial Statements.
| | | | |
| 18 | | | | Franklin Strategic Real Return Fund 2023 Annual Report |
Franklin Strategic Real Return Fund
(Percentages shown based on Fund net assets)
| | | | | | | | |
Security | | Shares | | | Value | |
| Information Technology — 4.5% | | | | | | | | |
Communications Equipment — 0.2% | | | | | | | | |
Cisco Systems Inc. | | | 3,672 | | | $ | 197,407 | |
Electronic Equipment, Instruments & Components — 0.1% | | | | | | | | |
Unimicron Technology Corp. | | | 13,000 | | | | 70,138 | (a) |
IT Services — 0.3% | | | | | | | | |
CGI Inc. | | | 1,500 | | | | 147,852 | * |
Gartner Inc. | | | 520 | | | | 178,677 | * |
Total IT Services | | | | | | | 326,529 | |
Semiconductors & Semiconductor Equipment — 1.3% | | | | | | | | |
Applied Materials Inc. | | | 1,465 | | | | 202,829 | |
ASM International NV | | | 241 | | | | 100,640 | (a) |
ASML Holding NV | | | 378 | | | | 222,548 | (a) |
KLA Corp. | | | 435 | | | | 199,517 | |
MediaTek Inc. | | | 4,000 | | | | 91,451 | (a) |
NVIDIA Corp. | | | 300 | | | | 130,497 | |
Powertech Technology Inc. | | | 35,000 | | | | 110,156 | (a) |
QUALCOMM Inc. | | | 1,300 | | | | 144,378 | |
United Microelectronics Corp. | | | 86,000 | | | | 120,758 | (a) |
Total Semiconductors & Semiconductor Equipment | | | | | | | 1,322,774 | |
Software — 1.3% | | | | | | | | |
Adobe Inc. | | | 400 | | | | 203,960 | * |
Cadence Design Systems Inc. | | | 700 | | | | 164,010 | * |
Check Point Software Technologies Ltd. | | | 1,121 | | | | 149,407 | * |
Fortinet Inc. | | | 2,748 | | | | 161,253 | * |
Microsoft Corp. | | | 1,888 | | | | 596,136 | |
Total Software | | | | | | | 1,274,766 | |
Technology Hardware, Storage & Peripherals — 1.3% | | | | | | | | |
Apple Inc. | | | 5,990 | | | | 1,025,548 | |
Logitech International SA, Registered Shares | | | 1,541 | | | | 106,019 | (a) |
Samsung Electronics Co. Ltd. | | | 3,505 | | | | 177,192 | (a) |
Total Technology Hardware, Storage & Peripherals | | | | | | | 1,308,759 | |
Total Information Technology | | | | | | | 4,500,373 | |
| Materials — 0.4% | | | | | | | | |
Chemicals — 0.3% | | | | | | | | |
CF Industries Holdings Inc. | | | 1,100 | | | | 94,314 | |
Huntsman Corp. | | | 3,350 | | | | 81,740 | |
Sasol Ltd., ADR | | | 4,700 | | | | 64,249 | |
Total Chemicals | | | | | | | 240,303 | |
See Notes to Consolidated Financial Statements.
| | | | | | |
| Franklin Strategic Real Return Fund 2023 Annual Report | | | | | 19 | |
Consolidated schedule of investments (cont’d)
September 30, 2023
Franklin Strategic Real Return Fund
(Percentages shown based on Fund net assets)
| | | | | | | | |
| Security | | Shares | | | Value | |
Metals & Mining — 0.1% | | | | | | | | |
BHP Group Ltd. | | | 4,260 | | | $ | 120,913 | (a) |
Total Materials | | | | | | | 361,216 | |
| Real Estate — 9.9% | | | | | | | | |
Diversified REITs — 0.4% | | | | | | | | |
Alexander & Baldwin Inc. | | | 4,104 | | | | 68,660 | |
Armada Hoffler Properties Inc. | | | 7,291 | | | | 74,660 | |
Essential Properties Realty Trust Inc. | | | 7,135 | | | | 154,330 | |
Stockland | | | 36,648 | | | | 91,721 | (a) |
Total Diversified REITs | | | | | | | 389,371 | |
Health Care REITs — 1.1% | | | | | | | | |
CareTrust REIT Inc. | | | 7,472 | | | | 153,176 | |
Global Medical REIT Inc. | | | 5,867 | | | | 52,627 | |
LTC Properties Inc. | | | 3,277 | | | | 105,290 | |
Medical Properties Trust Inc. | | | 12,739 | | | | 69,428 | |
National Health Investors Inc. | | | 2,665 | | | | 136,874 | |
Omega Healthcare Investors Inc. | | | 6,921 | | | | 229,500 | |
Ventas Inc. | | | 2,235 | | | | 94,161 | |
Welltower Inc. | | | 2,573 | | | | 210,780 | |
Total Health Care REITs | | | | | | | 1,051,836 | |
Hotel & Resort REITs — 0.5% | | | | | | | | |
Apple Hospitality REIT Inc. | | | 11,545 | | | | 177,101 | |
Host Hotels & Resorts Inc. | | | 21,416 | | | | 344,155 | |
Total Hotel & Resort REITs | | | | | | | 521,256 | |
Industrial REITs — 1.4% | | | | | | | | |
First Industrial Realty Trust Inc. | | | 2,724 | | | | 129,635 | |
LXP Industrial Trust | | | 15,557 | | | | 138,457 | |
Prologis Inc. | | | 8,653 | | | | 970,953 | |
Rexford Industrial Realty Inc. | | | 3,401 | | | | 167,840 | |
Total Industrial REITs | | | | | | | 1,406,885 | |
Office REITs — 0.6% | | | | | | | | |
Boston Properties Inc. | | | 2,359 | | | | 140,313 | |
COPT Defense Properties | | | 4,594 | | | | 109,475 | |
Douglas Emmett Inc. | | | 6,094 | | | | 77,760 | |
Easterly Government Properties Inc. | | | 5,727 | | | | 65,460 | |
Highwoods Properties Inc. | | | 3,338 | | | | 68,796 | |
Kilroy Realty Corp. | | | 2,512 | | | | 79,404 | |
Piedmont Office Realty Trust Inc., Class A Shares | | | 6,955 | | | | 39,087 | |
Total Office REITs | | | | | | | 580,295 | |
Real Estate Management & Development — 0.1% | | | | | | | | |
Daito Trust Construction Co. Ltd. | | | 1,200 | | | | 126,400 | (a) |
See Notes to Consolidated Financial Statements.
| | | | |
| 20 | | | | Franklin Strategic Real Return Fund 2023 Annual Report |
Franklin Strategic Real Return Fund
(Percentages shown based on Fund net assets)
| | | | | | | | |
| Security | | Shares | | | Value | |
Residential REITs — 1.7% | | | | | | | | |
Apartment Investment and Management Co., Class A Shares | | | 15,438 | | | $ | 104,978 | * |
AvalonBay Communities Inc. | | | 1,683 | | | | 289,038 | |
Camden Property Trust | | | 1,805 | | | | 170,717 | |
Equity LifeStyle Properties Inc. | | | 3,553 | | | | 226,362 | |
Equity Residential | | | 3,504 | | | | 205,720 | |
Essex Property Trust Inc. | | | 979 | | | | 207,636 | |
Invitation Homes Inc. | | | 2,994 | | | | 94,880 | |
Mid-America Apartment Communities Inc. | | | 2,051 | | | | 263,861 | |
Sun Communities Inc. | | | 1,099 | | | | 130,056 | |
Total Residential REITs | | | | | | | 1,693,248 | |
Retail REITs — 1.5% | | | | | | | | |
Brixmor Property Group Inc. | | | 10,044 | | | | 208,714 | |
Getty Realty Corp. | | | 3,124 | | | | 86,629 | |
Klepierre SA | | | 5,900 | | | | 144,465 | (a) |
NNN REIT Inc. | | | 5,297 | | | | 187,196 | |
Realty Income Corp. | | | 6,020 | | | | 300,639 | |
Regency Centers Corp. | | | 1,232 | | | | 73,230 | |
Simon Property Group Inc. | | | 4,747 | | | | 512,818 | |
Total Retail REITs | | | | | | | 1,513,691 | |
Specialized REITs — 2.6% | | | | | | | | |
CubeSmart | | | 5,635 | | | | 214,863 | |
Digital Realty Trust Inc. | | | 2,424 | | | | 293,352 | |
EPR Properties | | | 3,461 | | | | 143,770 | |
Equinix Inc. | | | 902 | | | | 655,087 | |
Extra Space Storage Inc. | | | 1,928 | | | | 234,406 | |
Gaming and Leisure Properties Inc. | | | 3,859 | | | | 175,777 | |
Iron Mountain Inc. | | | 1,953 | | | | 116,106 | |
Public Storage | | | 1,828 | | | | 481,715 | |
VICI Properties Inc. | | | 10,350 | | | | 301,185 | |
Total Specialized REITs | | | | | | | 2,616,261 | |
Total Real Estate | | | | | | | 9,899,243 | |
Total Common Stocks (Cost — $26,946,311) | | | | | | | 29,411,006 | |
| Investments in Underlying Funds — 4.1% | | | | | | | | |
iShares Trust — iShares Global Infrastructure ETF (Cost — $4,501,122) | | | 93,890 | | | | 4,064,498 | |
See Notes to Consolidated Financial Statements.
| | | | | | |
| Franklin Strategic Real Return Fund 2023 Annual Report | | | | | 21 | |
Consolidated schedule of investments (cont’d)
September 30, 2023
Franklin Strategic Real Return Fund
(Percentages shown based on Fund net assets)
| | | | | | | | | | | | | | | | |
| Security | | Rate | | | Maturity Date | | | Face Amount | | | Value | |
| Corporate Bonds & Notes — 2.0% | | | | | | | | | | | | | | | | |
| Energy — 1.0% | | | | | | | | | | | | | | | | |
Energy Equipment & Services — 0.0%†† | | | | | | | | | | | | | | | | |
Halliburton Co., Senior Notes | | | 3.800 | % | | | 11/15/25 | | | $ | 2,000 | | | $ | 1,934 | |
Oil, Gas & Consumable Fuels — 1.0% | | | | | | | | | | | | | | | | |
Apache Corp., Senior Notes | | | 4.750 | % | | | 4/15/43 | | | | 60,000 | | | | 43,768 | |
BP Capital Markets America Inc., Senior Notes | | | 3.588 | % | | | 4/14/27 | | | | 240,000 | | | | 226,382 | |
Devon Energy Corp., Senior Notes | | | 5.850 | % | | | 12/15/25 | | | | 230,000 | | | | 228,910 | |
Energy Transfer LP, Senior Notes | | | 2.900 | % | | | 5/15/25 | | | | 20,000 | | | | 19,009 | |
Enterprise Products Operating LLC, Senior Notes | | | 3.700 | % | | | 1/31/51 | | | | 180,000 | | | | 127,570 | |
Exxon Mobil Corp., Senior Notes | | | 3.043 | % | | | 3/1/26 | | | | 50,000 | | | | 47,434 | |
Kinder Morgan Inc., Senior Notes | | | 4.300 | % | | | 6/1/25 | | | | 80,000 | | | | 77,973 | |
Occidental Petroleum Corp., Senior Notes | | | 5.550 | % | | | 3/15/26 | | | | 40,000 | | | | 39,511 | |
Occidental Petroleum Corp., Senior Notes | | | 3.000 | % | | | 2/15/27 | | | | 60,000 | | | | 54,056 | |
Occidental Petroleum Corp., Senior Notes | | | 3.500 | % | | | 8/15/29 | | | | 50,000 | | | | 42,582 | |
Western Midstream Operating LP, Senior Notes | | | 3.100 | % | | | 2/1/25 | | | | 30,000 | | | | 28,732 | |
Williams Cos. Inc., Senior Notes | | | 3.500 | % | | | 10/15/51 | | | | 80,000 | | | | 51,077 | |
Total Oil, Gas & Consumable Fuels | | | | | | | | | | | | | | | 987,004 | |
Total Energy | | | | | | | | | | | | | | | 988,938 | |
| Materials — 1.0% | | | | | | | | | | | | | | | | |
Metals & Mining — 0.8% | | | | | | | | | | | | | | | | |
Anglo American Capital PLC, Senior Notes | | | 4.000 | % | | | 9/11/27 | | | | 200,000 | | | | 186,896 | (b) |
Antofagasta PLC, Senior Notes | | | 2.375 | % | | | 10/14/30 | | | | 200,000 | | | | 155,765 | (b) |
ArcelorMittal SA, Senior Notes | | | 7.000 | % | | | 10/15/39 | | | | 50,000 | | | | 50,192 | |
Glencore Funding LLC, Senior Notes | | | 4.000 | % | | | 3/27/27 | | | | 50,000 | | | | 46,965 | (b) |
Glencore Funding LLC, Senior Notes | | | 3.375 | % | | | 9/23/51 | | | | 130,000 | | | | 78,450 | (b) |
Southern Copper Corp., Senior Notes | | | 5.250 | % | | | 11/8/42 | | | | 220,000 | | | | 190,392 | |
Vale Overseas Ltd., Senior Notes | | | 6.250 | % | | | 8/10/26 | | | | 50,000 | | | | 50,881 | |
Total Metals & Mining | | | | | | | | | | | | | | | 759,541 | |
Paper & Forest Products — 0.2% | | | | | | | | | | | | | | | | |
Inversiones CMPC SA, Senior Notes | | | 4.375 | % | | | 4/4/27 | | | | 200,000 | | | | 187,302 | (c) |
Total Materials | | | | | | | | | | | | | | | 946,843 | |
Total Corporate Bonds & Notes (Cost — $2,144,369) | | | | | | | | | | | | | | | 1,935,781 | |
| Sovereign Bonds — 0.1% | | | | | | | | | | | | | | | | |
Peru — 0.1% | | | | | | | | | | | | | | | | |
Peruvian Government International Bond, Senior Notes (Cost — $160,002) | | | 2.783 | % | | | 1/23/31 | | | | 160,000 | | | | 131,421 | |
Total Investments before Short-Term Investments (Cost — $80,151,205) | | | | | | | | 75,604,782 | |
See Notes to Consolidated Financial Statements.
| | | | |
| 22 | | | | Franklin Strategic Real Return Fund 2023 Annual Report |
Franklin Strategic Real Return Fund
(Percentages shown based on Fund net assets)
| | | | | | | | | | | | |
| Security | | Rate | | | Shares | | | Value | |
| Short-Term Investments — 23.3% | | | | | | | | | | | | |
Dreyfus Government Cash Management, | | | | | | | | | | | | |
Institutional Shares | | | 5.219 | % | | | 217,096 | | | $ | 217,096 | (d) |
Invesco Government & Agency Portfolio, | | | | | | | | | | | | |
Institutional Class | | | 5.261 | % | | | 22,873,793 | | | | 22,873,793 | (d) |
Invesco Treasury Portfolio, Institutional Class | | | 5.262 | % | | | 204,752 | | | | 204,752 | (d) |
Total Short-Term Investments (Cost — $23,295,641) | | | | 23,295,641 | |
Total Investments — 99.1% (Cost — $103,446,846) | | | | | | | | | | | 98,900,423 | |
Other Assets in Excess of Liabilities — 0.9% | | | | | | | | | | | 920,197 | |
Total Net Assets — 100.0% | | | | | | | | | | $ | 99,820,620 | |
| †† | Represents less than 0.1%. |
| * | Non-income producing security. |
| (a) | Security is valued in good faith in accordance with procedures approved by the Board of Trustees (Note 1). |
| (b) | Security is exempt from registration under Rule 144A of the Securities Act of 1933. This security may be resold in transactions that are exempt from registration, normally to qualified institutional buyers. This security has been deemed liquid pursuant to guidelines approved by the Board of Trustees. |
| (c) | Security is exempt from registration under Regulation S of the Securities Act of 1933. Regulation S applies to securities offerings that are made outside of the United States and do not involve direct selling efforts in the United States. This security has been deemed liquid pursuant to guidelines approved by the Board of Trustees. |
| (d) | Rate shown is one-day yield as of the end of the reporting period. |
| | |
Abbreviation(s) used in this schedule: |
| |
| ADR | | — American Depositary Receipts |
| |
| ETF | | — Exchange-Traded Fund |
| |
| REIT | | — Real Estate Investment Trust |
At September 30, 2023, the Fund had the following open futures contracts:
| | | | | | | | | | | | | | | | | | | | |
| | | Number of
Contracts | | | Expiration
Date | | | Notional
Amount | | | Market
Value | | | Unrealized
Depreciation | |
| Contracts to Buy: | | | | | | | | | | | | | | | | | | | | |
| E-mini S&P 500 Index | | | 2 | | | | 12/23 | | | $ | 451,394 | | | $ | 432,550 | | | $ | (18,844) | |
| S&P GSCI | | | 123 | | | | 10/23 | | | | 18,771,602 | | | | 18,717,525 | | | | (54,077) | |
| U.S. Treasury 10-Year Notes | | | 59 | | | | 12/23 | | | | 6,490,553 | | | | 6,375,687 | | | | (114,866) | |
| Net unrealized depreciation on open futures contracts | | | | | | | $ | (187,787) | |
See Notes to Consolidated Financial Statements.
| | | | | | |
| Franklin Strategic Real Return Fund 2023 Annual Report | | | | | 23 | |
Consolidated schedule of investments (cont’d)
September 30, 2023
Franklin Strategic Real Return Fund
At September 30, 2023, the Fund had the following open forward foreign currency contracts:
| | | | | | | | | | | | | | | | | | | | |
Currency
Purchased | | | Currency
Sold | | | Counterparty | | Settlement
Date | | | Unrealized
Appreciation
(Depreciation) | |
| AUD | | | 3,452,000 | | | USD | | | 2,212,755 | | | HSBC Securities Inc. | | | 10/13/23 | | | $ | 7,847 | |
| CAD | | | 7,171,000 | | | USD | | | 5,269,233 | | | HSBC Securities Inc. | | | 10/13/23 | | | | 11,411 | |
| CHF | | | 1,068,000 | | | USD | | | 1,203,117 | | | HSBC Securities Inc. | | | 10/13/23 | | | | (34,592) | |
| EUR | | | 17,844,000 | | | USD | | | 19,185,332 | | | HSBC Securities Inc. | | | 10/13/23 | | | | (308,734) | |
| GBP | | | 3,149,000 | | | USD | | | 3,937,524 | | | HSBC Securities Inc. | | | 10/13/23 | | | | (95,098) | |
| JPY | | | 664,900,000 | | | USD | | | 4,529,855 | | | HSBC Securities Inc. | | | 10/13/23 | | | | (69,780) | |
| MXN | | | 38,300,000 | | | USD | | | 2,181,545 | | | HSBC Securities Inc. | | | 10/13/23 | | | | 10,894 | |
| NOK | | | 23,760,000 | | | USD | | | 2,235,112 | | | HSBC Securities Inc. | | | 10/13/23 | | | | (12,965) | |
| NZD | | | 3,756,000 | | | USD | | | 2,221,754 | | | HSBC Securities Inc. | | | 10/13/23 | | | | 29,407 | |
| SEK | | | 15,470,000 | | | USD | | | 1,399,324 | | | HSBC Securities Inc. | | | 10/13/23 | | | | 17,429 | |
| EUR | | | 21,908 | | | USD | | | 24,189 | | | Morgan Stanley & Co. Inc. | | | 10/20/23 | | | | (1,007) | |
| Net unrealized depreciation on open forward foreign currency contracts | | | $ | (445,188) | |
| | |
Abbreviation(s) used in this table: |
| |
| AUD | | — Australian Dollar |
| |
| CAD | | — Canadian Dollar |
| |
| CHF | | — Swiss Franc |
| |
| EUR | | — Euro |
| |
| GBP | | — British Pound |
| |
| JPY | | — Japanese Yen |
| |
| MXN | | — Mexican Peso |
| |
| NOK | | — Norwegian Krone |
| |
| NZD | | — New Zealand Dollar |
| |
| SEK | | — Swedish Krona |
| |
| USD | | — United States Dollar |
See Notes to Consolidated Financial Statements.
| | | | |
| 24 | | | | Franklin Strategic Real Return Fund 2023 Annual Report |
Consolidated statement of assets and liabilities
September 30, 2023
| | | | |
| |
| Assets: | | | | |
Investments, at value (Cost — $103,446,846) | | $ | 98,900,423 | |
Foreign currency, at value (Cost — $24,016) | | | 22,745 | |
Deposits with brokers for open futures contracts | | | 1,394,820 | |
Interest and dividends receivable | | | 334,678 | |
Receivable for securities sold | | | 157,581 | |
Unrealized appreciation on forward foreign currency contracts | | | 76,988 | |
Receivable for Fund shares sold | | | 8 | |
Prepaid expenses | | | 11,892 | |
Total Assets | | | 100,899,135 | |
| |
| Liabilities: | | | | |
Unrealized depreciation on forward foreign currency contracts | | | 522,176 | |
Payable to brokers — net variation margin on open futures contracts | | | 193,704 | |
Payable for securities purchased | | | 125,513 | |
Audit and tax fees payable | | | 73,420 | |
Investment management fee payable | | | 60,785 | |
Payable for Fund shares repurchased | | | 49,188 | |
Service and/or distribution fees payable | | | 1,911 | |
Trustees’ fees payable | | | 1,532 | |
Accrued expenses | | | 50,286 | |
Total Liabilities | | | 1,078,515 | |
| Total Net Assets | | $ | 99,820,620 | |
| |
| Net Assets: | | | | |
Par value (Note 7) | | $ | 108 | |
Paid-in capital in excess of par value | | | 103,164,566 | |
Total distributable earnings (loss) | | | (3,344,054) | |
| Total Net Assets | | $ | 99,820,620 | |
See Notes to Consolidated Financial Statements.
| | | | | | |
| Franklin Strategic Real Return Fund 2023 Annual Report | | | | | 25 | |
Consolidated statement of assets and liabilities (cont’d)
September 30, 2023
| | | | |
| |
| Net Assets: | | | | |
Class A | | | $6,914,121 | |
Class C | | | $505,271 | |
Class I | | | $241,207 | |
Class IS | | | $92,160,021 | |
| |
| Shares Outstanding: | | | | |
Class A | | | 761,605 | |
Class C | | | 57,852 | |
Class I | | | 25,541 | |
Class IS | | | 9,934,191 | |
| |
| Net Asset Value: | | | | |
Class A (and redemption price) | | | $9.08 | |
Class C* | | | $8.73 | |
Class I (and redemption price) | | | $9.44 | |
Class IS (and redemption price) | | | $9.28 | |
| Maximum Public Offering Price Per Share: | | | | |
Class A (based on maximum initial sales charge of 5.50%) | | | $9.61 | |
| * | Redemption price per share is NAV of Class C shares reduced by a 1.00% CDSC if shares are redeemed within one year from purchase payment (Note 2). |
See Notes to Consolidated Financial Statements.
| | | | |
| 26 | | | | Franklin Strategic Real Return Fund 2023 Annual Report |
Consolidated statement of operations
For the Year Ended September 30, 2023
| | | | |
| |
| Investment Income: | | | | |
Dividends | | $ | 2,081,426 | |
Interest | | | 1,385,479 | |
Less: Foreign taxes withheld | | | (48,560) | |
Total Investment Income | | | 3,418,345 | |
| |
| Expenses: | | | | |
Investment management fee (Note 2) | | | 747,789 | |
Fund accounting fees | | | 111,777 | |
Audit and tax fees | | | 72,320 | |
Registration fees | | | 65,218 | |
Legal fees | | | 34,567 | |
Service and/or distribution fees (Notes 2 and 5) | | | 25,793 | |
Commodity pool reports | | | 12,000 | |
Transfer agent fees (Note 5) | | | 10,688 | |
Shareholder reports | | | 8,532 | |
Trustees’ fees | | | 7,383 | |
Custody fees | | | 3,292 | |
Commitment fees (Note 8) | | | 1,018 | |
Fees recaptured by investment manager (Note 2) | | | 668 | |
Insurance | | | 654 | |
Interest expense | | | 464 | |
Miscellaneous expenses | | | 9,283 | |
Total Expenses | | | 1,111,446 | |
Less: Fee waivers and/or expense reimbursements (Notes 2 and 5) | | | (126,050) | |
Net Expenses | | | 985,396 | |
| Net Investment Income | | | 2,432,949 | |
| |
| Realized and Unrealized Gain (Loss) on Investments, Futures Contracts, Forward Foreign Currency Contracts and Foreign Currency Transactions (Notes 1, 3 and 4): | | | | |
Net Realized Gain (Loss) From: | | | | |
Investment transactions | | | (37,738) | |
Futures contracts | | | (121,589) | |
Forward foreign currency contracts | | | 838,538 | |
Foreign currency transactions | | | (12,131) | |
Net Realized Gain | | | 667,080 | |
Change in Net Unrealized Appreciation (Depreciation) From: | | | | |
Investments | | | 3,031,041 | |
Futures contracts | | | 803,786 | |
Forward foreign currency contracts | | | 582,079 | |
Foreign currencies | | | 5,159 | |
Change in Net Unrealized Appreciation (Depreciation) | | | 4,422,065 | |
| Net Gain on Investments, Futures Contracts, Forward Foreign Currency Contracts and Foreign Currency Transactions | | | 5,089,145 | |
| Increase in Net Assets From Operations | | $ | 7,522,094 | |
See Notes to Consolidated Financial Statements.
| | | | | | |
| Franklin Strategic Real Return Fund 2023 Annual Report | | | | | 27 | |
Consolidated statements of changes in net assets
| | | | | | | | |
| For the Years Ended September 30, | | 2023 | | | 2022 | |
| | |
| Operations: | | | | | | | | |
Net investment income | | $ | 2,432,949 | | | $ | 3,173,866 | |
Net realized gain | | | 667,080 | | | | 11,900,726 | |
Change in net unrealized appreciation (depreciation) | | | 4,422,065 | | | | (28,337,146) | |
Increase (Decrease) in Net Assets From Operations | | | 7,522,094 | | | | (13,262,554) | |
| | |
| Distributions to Shareholders From (Notes 1 and 6): | | | | | | | | |
Total distributable earnings | | | (10,124,763) | | | | (17,876,153) | |
Decrease in Net Assets From Distributions to Shareholders | | | (10,124,763) | | | | (17,876,153) | |
| | |
| Fund Share Transactions (Note 7): | | | | | | | | |
Net proceeds from sale of shares | | | 6,795,565 | | | | 12,493,948 | |
Reinvestment of distributions | | | 10,116,978 | | | | 17,864,036 | |
Cost of shares repurchased | | | (4,668,068) | | | | (20,063,253) | |
Increase in Net Assets From Fund Share Transactions | | | 12,244,475 | | | | 10,294,731 | |
Increase (Decrease) in Net Assets | | | 9,641,806 | | | | (20,843,976) | |
| | |
| Net Assets: | | | | | | | | |
Beginning of year | | | 90,178,814 | | | | 111,022,790 | |
End of year | | $ | 99,820,620 | | | $ | 90,178,814 | |
See Notes to Consolidated Financial Statements.
| | | | |
| 28 | | | | Franklin Strategic Real Return Fund 2023 Annual Report |
Consolidated financial highlights
| | | | | | | | | | | | | | | | | | | | |
| For a share of each class of beneficial interest outstanding throughout each year ended September 30: | |
| Class A Shares1 | | 2023 | | | 2022 | | | 2021 | | | 2020 | | | 2019 | |
| | | | | |
| Net asset value, beginning of year | | | $9.35 | | | | $12.72 | | | | $10.54 | | | | $11.15 | | | | $12.24 | |
| | | | | |
| Income (loss) from operations: | | | | | | | | | | | | | | | | | | | | |
Net investment income | | | 0.20 | | | | 0.39 | | | | 0.21 | | | | 0.05 | | | | 0.14 | |
Net realized and unrealized gain (loss) | | | 0.56 | | | | (1.75) | | | | 2.23 | | | | (0.24) | | | | (0.30) | |
Total income (loss) from operations | | | 0.76 | | | | (1.36) | | | | 2.44 | | | | (0.19) | | | | (0.16) | |
| | | | | |
| Less distributions from: | | | | | | | | | | | | | | | | | | | | |
Net investment income | | | (0.30) | | | | (1.30) | | | | (0.16) | | | | (0.05) | | | | (0.49) | |
Net realized gains | | | (0.73) | | | | (0.71) | | | | (0.10) | | | | (0.37) | | | | (0.44) | |
Total distributions | | | (1.03) | | | | (2.01) | | | | (0.26) | | | | (0.42) | | | | (0.93) | |
| | | | | |
| Net asset value, end of year | | | $9.08 | | | | $9.35 | | | | $12.72 | | | | $10.54 | | | | $11.15 | |
Total return2 | | | 8.13 | % | | | (13.03) | % | | | 23.37 | % | | | (1.74) | % | | | (0.73) | % |
| | | | | |
| Net assets, end of year (000s) | | | $6,914 | | | | $7,295 | | | | $1,704 | | | | $259 | | | | $272 | |
| | | | | |
| Ratios to average net assets: | | | | | | | | | | | | | | | | | | | | |
Gross expenses3 | | | 1.46 | % | | | 1.50 | % | | | 1.63 | % | | | 1.81 | % | | | 1.68 | % |
Net expenses3,4,5 | | | 1.30 | | | | 1.31 | | | | 1.30 | | | | 1.31 | | | | 1.32 | |
Net investment income | | | 2.10 | | | | 3.59 | | | | 1.75 | | | | 0.43 | | | | 1.27 | |
| | | | | |
| Portfolio turnover rate | | | 15 | % | | | 64 | % | | | 41 | % | | | 43 | % | | | 44 | % |
| 1 | Per share amounts have been calculated using the average shares method. |
| 2 | Performance figures, exclusive of sales charges, may reflect compensating balance arrangements, fee waivers and/or expense reimbursements. In the absence of compensating balance arrangements, fee waivers and/or expense reimbursements, the total return would have been lower. Past performance is no guarantee of future results. |
| 3 | Does not include fees and expenses of the Underlying Funds in which the Fund invests. |
| 4 | Reflects fee waivers and/or expense reimbursements. |
| 5 | As a result of an expense limitation arrangement, the ratio of total annual fund operating expenses, other than interest, brokerage commissions (except for brokerage commissions paid on purchases and sales of shares of ETFs), dividend expense on short sales, taxes and extraordinary expenses, to average net assets of Class A shares did not exceed 1.35%. This expense limitation arrangement cannot be terminated prior to December 31, 2024 without the Board of Trustees’ consent. Acquired fund fees and expenses are subject to the expense limitation arrangement. |
See Notes to Consolidated Financial Statements.
| | | | | | |
| Franklin Strategic Real Return Fund 2023 Annual Report | | | | | 29 | |
Consolidated financial highlights (cont’d)
| | | | | | | | | | | | | | | | | | | | |
| For a share of each class of beneficial interest outstanding throughout each year ended September 30: | |
| Class C Shares1 | | 2023 | | | 2022 | | | 2021 | | | 2020 | | | 2019 | |
| | | | | |
| Net asset value, beginning of year | | | $9.04 | | | | $12.14 | | | | $10.13 | | | | $10.79 | | | | $11.82 | |
| | | | | |
| Income (loss) from operations: | | | | | | | | | | | | | | | | | | | | |
Net investment income (loss) | | | 0.12 | | | | 0.37 | | | | 0.02 | | | | (0.04) | | | | 0.04 | |
Net realized and unrealized gain (loss) | | | 0.54 | | | | (1.64) | | | | 2.23 | | | | (0.21) | | | | (0.27) | |
Total income (loss) from operations | | | 0.66 | | | | (1.27) | | | | 2.25 | | | | (0.25) | | | | (0.23) | |
| | | | | |
| Less distributions from: | | | | | | | | | | | | | | | | | | | | |
Net investment income | | | (0.24) | | | | (1.12) | | | | (0.14) | | | | (0.04) | | | | (0.36) | |
Net realized gains | | | (0.73) | | | | (0.71) | | | | (0.10) | | | | (0.37) | | | | (0.44) | |
Total distributions | | | (0.97) | | | | (1.83) | | | | (0.24) | | | | (0.41) | | | | (0.80) | |
| | | | | |
| Net asset value, end of year | | | $8.73 | | | | $9.04 | | | | $12.14 | | | | $10.13 | | | | $10.79 | |
Total return2 | | | 7.34 | % | | | (12.54) | % | | | 22.53 | % | | | (2.54) | % | | | (1.51) | % |
| | | | | |
| Net assets, end of year (000s) | | | $505 | | | | $628 | | | | $13 | | | | $54 | | | | $81 | |
| | | | | |
| Ratios to average net assets: | | | | | | | | | | | | | | | | | | | | |
Gross expenses3 | | | 2.19 | % | | | 2.25 | % | | | 2.42 | % | | | 2.45 | % | | | 2.42 | %4 |
Net expenses3,5,6 | | | 2.05 | | | | 2.06 | | | | 2.05 | | | | 2.06 | | | | 2.07 | 4 |
Net investment income (loss) | | | 1.31 | | | | 3.54 | | | | 0.20 | | | | (0.37) | | | | 0.40 | |
| | | | | |
| Portfolio turnover rate | | | 15 | % | | | 64 | % | | | 41 | % | | | 43 | % | | | 44 | % |
| 1 | Per share amounts have been calculated using the average shares method. |
| 2 | Performance figures, exclusive of CDSC, may reflect compensating balance arrangements, fee waivers and/or expense reimbursements. In the absence of compensating balance arrangements, fee waivers and/or expense reimbursements, the total return would have been lower. Past performance is no guarantee of future results. |
| 3 | Does not include fees and expenses of the Underlying Funds in which the Fund invests. |
| 4 | Reflects recapture of expenses waived/reimbursed from prior fiscal years. |
| 5 | Reflects fee waivers and/or expense reimbursements. |
| 6 | As a result of an expense limitation arrangement, the ratio of total annual fund operating expenses, other than interest, brokerage commissions (except for brokerage commissions paid on purchases and sales of shares of ETFs), dividend expense on short sales, taxes and extraordinary expenses, to average net assets of Class C shares did not exceed 2.10%. This expense limitation arrangement cannot be terminated prior to December 31, 2024 without the Board of Trustees’ consent. Acquired fund fees and expenses are subject to the expense limitation arrangement. |
See Notes to Consolidated Financial Statements.
| | | | |
| 30 | | | | Franklin Strategic Real Return Fund 2023 Annual Report |
| | | | | | | | | | | | | | | | | | | | |
| For a share of each class of beneficial interest outstanding throughout each year ended September 30: | |
| Class I Shares1 | | 2023 | | | 2022 | | | 2021 | | | 2020 | | | 2019 | |
| | | | | |
| Net asset value, beginning of year | | | $9.69 | | | | $13.07 | | | | $10.81 | | | | $11.40 | | | | $12.52 | |
| | | | | |
| Income (loss) from operations: | | | | | | | | | | | | | | | | | | | | |
Net investment income | | | 0.23 | | | | 0.46 | | | | 0.05 | | | | 0.06 | | | | 0.16 | |
Net realized and unrealized gain (loss) | | | 0.58 | | | | (1.85) | | | | 2.48 | | | | (0.22) | | | | (0.31) | |
Total income (loss) from operations | | | 0.81 | | | | (1.39) | | | | 2.53 | | | | (0.16) | | | | (0.15) | |
| | | | | |
| Less distributions from: | | | | | | | | | | | | | | | | | | | | |
Net investment income | | | (0.33) | | | | (1.28) | | | | (0.17) | | | | (0.06) | | | | (0.53) | |
Net realized gains | | | (0.73) | | | | (0.71) | | | | (0.10) | | | | (0.37) | | | | (0.44) | |
Total distributions | | | (1.06) | | | | (1.99) | | | | (0.27) | | | | (0.43) | | | | (0.97) | |
| | | | | |
| Net asset value, end of year | | | $9.44 | | | | $9.69 | | | | $13.07 | | | | $10.81 | | | | $11.40 | |
Total return2 | | | 8.41 | % | | | (12.83) | % | | | 23.72 | % | | | (1.55) | % | | | (0.52) | % |
| | | | | |
| Net assets, end of year (000s) | | | $241 | | | | $237 | | | | $51 | | | | $515 | | | | $1,684 | |
| | | | | |
| Ratios to average net assets: | | | | | | | | | | | | | | | | | | | | |
Gross expenses3 | | | 1.18 | %4 | | | 2.24 | % | | | 1.50 | % | | | 1.31 | %4 | | | 1.30 | %4 |
Net expenses3,5,6 | | | 1.05 | 4 | | | 1.06 | | | | 1.05 | | | | 1.06 | 4 | | | 1.07 | 4 |
Net investment income | | | 2.32 | | | | 4.09 | | | | 0.44 | | | | 0.51 | | | | 1.41 | |
| | | | | |
| Portfolio turnover rate | | | 15 | % | | | 64 | % | | | 41 | % | | | 43 | % | | | 44 | % |
| 1 | Per share amounts have been calculated using the average shares method. |
| 2 | Performance figures may reflect compensating balance arrangements, fee waivers and/or expense reimbursements. In the absence of compensating balance arrangements, fee waivers and/or expense reimbursements, the total return would have been lower. Past performance is no guarantee of future results. |
| 3 | Does not include fees and expenses of the Underlying Funds in which the Fund invests. |
| 4 | Reflects recapture of expenses waived/reimbursed from prior fiscal years. |
| 5 | Reflects fee waivers and/or expense reimbursements. |
| 6 | As a result of an expense limitation arrangement, the ratio of total annual fund operating expenses, other than interest, brokerage commissions (except for brokerage commissions paid on purchases and sales of shares of ETFs), dividend expense on short sales, taxes and extraordinary expenses, to average net assets of Class I shares did not exceed 1.10%. This expense limitation arrangement cannot be terminated prior to December 31, 2024 without the Board of Trustees’ consent. Acquired fund fees and expenses are subject to the expense limitation arrangement. |
See Notes to Consolidated Financial Statements.
| | | | | | |
| Franklin Strategic Real Return Fund 2023 Annual Report | | | | | 31 | |
Consolidated financial highlights (cont’d)
| | | | | | | | | | | | | | | | | | | | |
| For a share of each class of beneficial interest outstanding throughout each year ended September 30: | |
| Class IS Shares1 | | 2023 | | | 2022 | | | 2021 | | | 2020 | | | 2019 | |
| | | | | |
| Net asset value, beginning of year | | | $9.53 | | | | $12.91 | | | | $10.67 | | | | $11.25 | | | | $12.36 | |
| | | | | |
| Income (loss) from operations: | | | | | | | | | | | | | | | | | | | | |
Net investment income | | | 0.24 | | | | 0.33 | | | | 0.18 | | | | 0.08 | | | | 0.18 | |
Net realized and unrealized gain (loss) | | | 0.57 | | | | (1.68) | | | | 2.33 | | | | (0.23) | | | | (0.31) | |
Total income (loss) from operations | | | 0.81 | | | | (1.35) | | | | 2.51 | | | | (0.15) | | | | (0.13) | |
| | | | | |
| Less distributions from: | | | | | | | | | | | | | | | | | | | | |
Net investment income | | | (0.33) | | | | (1.32) | | | | (0.17) | | | | (0.06) | | | | (0.54) | |
Net realized gains | | | (0.73) | | | | (0.71) | | | | (0.10) | | | | (0.37) | | | | (0.44) | |
Total distributions | | | (1.06) | | | | (2.03) | | | | (0.27) | | | | (0.43) | | | | (0.98) | |
| | | | | |
| Net asset value, end of year | | | $9.28 | | | | $9.53 | | | | $12.91 | | | | $10.67 | | | | $11.25 | |
Total return2 | | | 8.52 | % | | | (12.73) | % | | | 23.88 | % | | | (1.45) | % | | | (0.35) | % |
| | | | | |
| Net assets, end of year (000s) | | | $92,160 | | | | $82,018 | | | | $109,255 | | | | $93,150 | | | | $94,463 | |
| | | | | |
| Ratios to average net assets: | | | | | | | | | | | | | | | | | | | | |
Gross expenses3 | | | 1.08 | % | | | 1.09 | % | | | 1.08 | % | | | 1.17 | %4 | | | 1.17 | %4 |
Net expenses3,5,6 | | | 0.95 | | | | 0.95 | | | | 0.95 | | | | 0.96 | 4 | | | 0.97 | 4 |
Net investment income | | | 2.48 | | | | 2.87 | | | | 1.48 | | | | 0.78 | | | | 1.65 | |
| | | | | |
| Portfolio turnover rate | | | 15 | % | | | 64 | % | | | 41 | % | | | 43 | % | | | 44 | % |
| 1 | Per share amounts have been calculated using the average shares method. |
| 2 | Performance figures may reflect compensating balance arrangements, fee waivers and/or expense reimbursements. In the absence of compensating balance arrangements, fee waivers and/or expense reimbursements, the total return would have been lower. Past performance is no guarantee of future results. |
| 3 | Does not include fees and expenses of the Underlying Funds in which the Fund invests. |
| 4 | Reflects recapture of expenses waived/reimbursed from prior fiscal years. |
| 5 | Reflects fee waivers and/or expense reimbursements. |
| 6 | As a result of an expense limitation arrangement, the ratio of total annual fund operating expenses, other than interest, brokerage commissions (except for brokerage commissions paid on purchases and sales of ETFs), dividend expense on short sales, taxes and extraordinary expenses, to average net assets of Class IS shares did not exceed 1.00%. In addition, the ratio of total annual fund operating expenses for Class IS shares did not exceed the ratio of total annual fund operating expenses for Class I shares. These expense limitation arrangements cannot be terminated prior to December 31, 2024 without the Board of Trustees’ consent. Acquired fund fees and expenses are subject to the expense limitation arrangement. |
See Notes to Consolidated Financial Statements.
| | | | |
| 32 | | | | Franklin Strategic Real Return Fund 2023 Annual Report |
Notes to consolidated financial statements
1. Organization and significant accounting policies
Franklin Strategic Real Return Fund (the “Fund”) is a separate non-diversified investment series of Legg Mason Global Asset Management Trust (the “Trust”). The Trust, a Maryland statutory trust, is registered under the Investment Company Act of 1940, as amended (the “1940 Act”), as an open-end management investment company.
The Fund gains exposure to the commodities markets by investing a portion of its assets in a wholly-owned subsidiary, Real Return Fund Ltd. (the “Subsidiary”), organized under the laws of the Cayman Islands. Among other investments, the Subsidiary may invest in commodity-linked instruments. The Fund may invest up to 25% of its total assets in the Subsidiary. These financial statements are the consolidated financial statements of the Fund and the Subsidiary. All interfund transactions have been eliminated in consolidation.
The Fund follows the accounting and reporting guidance in Financial Accounting Standards Board (“FASB”) Accounting Standards Codification Topic 946, Financial Services – Investment Companies (“ASC 946”). The following are significant accounting policies consistently followed by the Fund and are in conformity with U.S. generally accepted accounting principles (“GAAP”), including, but not limited to, ASC 946. Estimates and assumptions are required to be made regarding assets, liabilities and changes in net assets resulting from operations when financial statements are prepared. Changes in the economic environment, financial markets and any other parameters used in determining these estimates could cause actual results to differ. Subsequent events have been evaluated through the date the financial statements were issued.
(a) Investment valuation. Equity securities for which market quotations are available are valued at the last reported sales price or official closing price on the primary market or exchange on which they trade. The valuations for fixed income securities (which may include, but are not limited to, corporate, government, municipal, mortgage-backed, collateralized mortgage obligations and asset-backed securities) and certain derivative instruments are typically the prices supplied by independent third party pricing services, which may use market prices or broker/dealer quotations or a variety of valuation techniques and methodologies. The independent third party pricing services typically use inputs that are observable such as issuer details, interest rates, yield curves, prepayment speeds, credit risks/spreads, default rates and quoted prices for similar securities. Investments in open-end funds are valued at the closing net asset value per share of each fund on the day of valuation. Futures contracts are valued daily at the settlement price established by the board of trade or exchange on which they are traded. When the Fund holds securities or other assets that are denominated in a foreign currency, the Fund will normally use the currency exchange rates as of 4:00 p.m. (Eastern Time). If independent third party pricing services are unable to supply prices for a portfolio investment, or if the prices supplied are deemed by the manager to be unreliable, the market price may be determined by the manager using quotations from one or more broker/dealers or at the transaction price if the security has recently been purchased and no value has yet been obtained from a pricing service or pricing broker. When reliable prices are not readily available, such as when the value of a security has been significantly affected by events
| | | | | | |
| Franklin Strategic Real Return Fund 2023 Annual Report | | | | | 33 | |
Notes to consolidated financial statements (cont’d)
after the close of the exchange or market on which the security is principally traded, but before the Fund calculates its net asset value, the Fund values these securities as determined in accordance with procedures approved by the Fund’s Board of Trustees. This may include using an independent third party pricing service to adjust the value of such securities to the latest indications of fair value at 4:00 p.m. (Eastern Time).
Pursuant to policies adopted by the Board of Trustees, the Fund’s manager has been designated as the valuation designee and is responsible for the oversight of the daily valuation process. The Fund’s manager is assisted by the Global Fund Valuation Committee (the “Valuation Committee”). The Valuation Committee is responsible for making fair value determinations, evaluating the effectiveness of the Fund’s pricing policies, and reporting to the Fund’s manager and the Board of Trustees. When determining the reliability of third party pricing information for investments owned by the Fund, the Valuation Committee, among other things, conducts due diligence reviews of pricing vendors, monitors the daily change in prices and reviews transactions among market participants.
The Valuation Committee will consider pricing methodologies it deems relevant and appropriate when making fair value determinations. Examples of possible methodologies include, but are not limited to, multiple of earnings; discount from market of a similar freely traded security; discounted cash-flow analysis; book value or a multiple thereof; risk premium/yield analysis; yield to maturity; and/or fundamental investment analysis. The Valuation Committee will also consider factors it deems relevant and appropriate in light of the facts and circumstances. Examples of possible factors include, but are not limited to, the type of security; the issuer’s financial statements; the purchase price of the security; the discount from market value of unrestricted securities of the same class at the time of purchase; analysts’ research and observations from financial institutions; information regarding any transactions or offers with respect to the security; the existence of merger proposals or tender offers affecting the security; the price and extent of public trading in similar securities of the issuer or comparable companies; and the existence of a shelf registration for restricted securities.
For each portfolio security that has been fair valued pursuant to the policies adopted by the Board of Trustees, the fair value price is compared against the last available and next available market quotations. The Valuation Committee reviews the results of such back testing monthly and fair valuation occurrences are reported to the Board of Trustees quarterly.
The Fund uses valuation techniques to measure fair value that are consistent with the market approach and/or income approach, depending on the type of security and the particular circumstance. The market approach uses prices and other relevant information generated by market transactions involving identical or comparable securities. The income approach uses valuation techniques to discount estimated future cash flows to present value.
| | | | |
| 34 | | | | Franklin Strategic Real Return Fund 2023 Annual Report |
GAAP establishes a disclosure hierarchy that categorizes the inputs to valuation techniques used to value assets and liabilities at measurement date. These inputs are summarized in the three broad levels listed below:
| • | | Level 1 — unadjusted quoted prices in active markets for identical investments |
| • | | Level 2 — other significant observable inputs (including quoted prices for similar investments, interest rates, prepayment speeds, credit risk, etc.) |
| • | | Level 3 — significant unobservable inputs (including the Fund’s own assumptions in determining the fair value of investments) |
The inputs or methodologies used to value securities are not necessarily an indication of the risk associated with investing in those securities.
The following is a summary of the inputs used in valuing the Fund’s assets and liabilities carried at fair value:
| | | | | | | | | | | | | | | | |
| | | ASSETS | | | | | | | | | | |
| Description | | Quoted Prices (Level 1) | | | Other Significant Observable Inputs (Level 2)* | | | Significant Unobservable Inputs (Level 3) | | | Total | |
| Long-Term Investments†: | | | | | | | | | | | | | | | | |
U.S. Treasury Inflation Protected Securities | | | — | | | $ | 40,062,076 | | | | — | | | $ | 40,062,076 | |
Common Stocks: | | | | | | | | | | | | | | | | |
Communication Services | | $ | 1,465,017 | | | | 462,584 | | | | — | | | | 1,927,601 | |
Consumer Discretionary | | | 1,953,077 | | | | 941,393 | | | | — | | | | 2,894,470 | |
Consumer Staples | | | 1,272,449 | | | | 553,763 | | | | — | | | | 1,826,212 | |
Energy | | | 909,344 | | | | 406,070 | | | | — | | | | 1,315,414 | |
Financials | | | 1,573,951 | | | | 843,048 | | | | — | | | | 2,416,999 | |
Health Care | | | 1,736,693 | | | | 589,820 | | | | — | | | | 2,326,513 | |
Industrials | | | 1,043,860 | | | | 899,105 | | | | — | | | | 1,942,965 | |
Information Technology | | | 3,501,471 | | | | 998,902 | | | | — | | | | 4,500,373 | |
Materials | | | 240,303 | | | | 120,913 | | | | — | | | | 361,216 | |
Real Estate | | | 9,536,657 | | | | 362,586 | | | | — | | | | 9,899,243 | |
Investments in Underlying Funds | | | 4,064,498 | | | | — | | | | — | | | | 4,064,498 | |
Corporate Bonds & Notes | | | — | | | | 1,935,781 | | | | — | | | | 1,935,781 | |
Sovereign Bonds | | | — | | | | 131,421 | | | | — | | | | 131,421 | |
| Total Long-Term Investments | | | 27,297,320 | | | | 48,307,462 | | | | — | | | | 75,604,782 | |
| Short-Term Investments† | | | 23,295,641 | | | | — | | | | — | | | | 23,295,641 | |
| Total Investments | | $ | 50,592,961 | | | $ | 48,307,462 | | | | — | | | $ | 98,900,423 | |
| Other Financial Instruments: | | | | | | | | | | | | | | | | |
Forward Foreign Currency Contracts†† | | | — | | | $ | 76,988 | | | | — | | | $ | 76,988 | |
| Total | | $ | 50,592,961 | | | $ | 48,384,450 | | | | — | | | $ | 98,977,411 | |
| | | | | | |
| Franklin Strategic Real Return Fund 2023 Annual Report | | | | | 35 | |
Notes to consolidated financial statements (cont’d)
| | | | | | | | | | | | | | | | |
| LIABILITIES | |
| Description | | Quoted Prices (Level 1) | | | Other Significant Observable Inputs (Level 2) | | | Significant Unobservable Inputs (Level 3) | | | Total | |
| Other Financial Instruments: | | | | | | | | | | | | | | | | |
Futures Contracts†† | | $ | 187,787 | | | | — | | | | — | | | $ | 187,787 | |
Forward Foreign Currency Contracts†† | | | — | | | $ | 522,176 | | | | — | | | | 522,176 | |
| Total | | $ | 187,787 | | | $ | 522,176 | | | | — | | | $ | 709,963 | |
| * | As a result of the fair value pricing procedures for international equities utilized by the Fund, which account for events occurring after the close of the principal market of the security but prior to the calculation of the Fund’s net asset value, certain securities were classified as Level 2 within the fair value hierarchy. |
| † | See Consolidated Schedule of Investments for additional detailed categorizations. |
| †† | Reflects the unrealized appreciation (depreciation) of the instruments. |
(b) Futures contracts. The Fund uses futures contracts generally to gain exposure to, or hedge against, changes in interest rates or gain exposure to, or hedge against, changes in certain asset classes. A futures contract represents a commitment for the future purchase or sale of an asset at a specified price on a specified date.
Upon entering into a futures contract, the Fund is required to deposit cash or securities with a broker in an amount equal to a certain percentage of the contract amount. This is known as the ‘‘initial margin’’ and subsequent payments (‘‘variation margin’’) are made or received by the Fund each day, depending on the daily fluctuation in the value of the contract. For certain futures, including foreign denominated futures, variation margin is not settled daily, but is recorded as a net variation margin payable or receivable. The daily changes in contract value are recorded as unrealized appreciation or depreciation in the Consolidated Statement of Operations and the Fund recognizes a realized gain or loss when the contract is closed.
Futures contracts involve, to varying degrees, risk of loss in excess of the amounts reflected in the financial statements. In addition, there is the risk that the Fund may not be able to enter into a closing transaction because of an illiquid secondary market.
(c) Forward foreign currency contracts. The Fund enters into a forward foreign currency contract to maintain its target exposure to foreign currencies, to hedge against foreign currency exchange rate risk on its non-U.S. dollar denominated securities, to facilitate settlement of a foreign currency denominated portfolio transaction or to attempt to increase the Fund’s return. A forward foreign currency contract is an agreement between two parties to buy and sell a currency at a set price with delivery and settlement at a future date. The contract is marked-to-market daily and the change in value is recorded by the Fund as an unrealized gain or loss. When a forward foreign currency contract is closed, through either delivery or offset by entering into another forward foreign currency contract, the Fund recognizes a realized gain or loss equal to the difference between the value of the contract at the time it was opened and the value of the contract at the time it is closed.
| | | | |
| 36 | | | | Franklin Strategic Real Return Fund 2023 Annual Report |
Forward foreign currency contracts involve elements of market risk in excess of the amounts reflected on the Consolidated Statement of Assets and Liabilities. The Fund bears the risk of an unfavorable change in the foreign exchange rate underlying the forward foreign currency contract. Risks may also arise upon entering into these contracts from the potential inability of the counterparties to meet the terms of their contracts.
(d) Inflation-indexed bonds. Inflation-indexed bonds are fixed income securities whose principal value or interest rate is periodically adjusted according to the rate of inflation. As the index measuring inflation changes, the principal value or interest rate of inflation-indexed bonds will be adjusted accordingly. Inflation adjustments to the principal amount of inflation-indexed bonds are reflected as an increase or decrease to investment income on the Consolidated Statement of Operations. Repayment of the original bond principal upon maturity (as adjusted for inflation) is guaranteed in the case of U.S. Treasury inflation-indexed bonds. For bonds that do not provide a similar guarantee, the adjusted principal value of the bond repaid at maturity may be less than the original principal.
(e) Foreign currency translation. Investment securities and other assets and liabilities denominated in foreign currencies are translated into U.S. dollar amounts based upon prevailing exchange rates on the date of valuation. Purchases and sales of investment securities and income and expense items denominated in foreign currencies are translated into U.S. dollar amounts based upon prevailing exchange rates on the respective dates of such transactions.
The Fund does not isolate that portion of the results of operations resulting from fluctuations in foreign exchange rates on investments from the fluctuations arising from changes in market prices of securities held. Such fluctuations are included with the net realized and unrealized gain or loss on investments.
Net realized foreign exchange gains or losses arise from sales of foreign currencies, including gains and losses on forward foreign currency contracts, currency gains or losses realized between the trade and settlement dates on securities transactions, and the difference between the amounts of dividends, interest, and foreign withholding taxes recorded on the Fund’s books and the U.S. dollar equivalent of the amounts actually received or paid. Net unrealized foreign exchange gains and losses arise from changes in the values of assets and liabilities, other than investments in securities, on the date of valuation, resulting from changes in exchange rates.
Foreign security and currency transactions may involve certain considerations and risks not typically associated with those of U.S. dollar denominated transactions as a result of, among other factors, the possibility of lower levels of governmental supervision and regulation of foreign securities markets and the possibility of political or economic instability.
(f) Foreign investment risks. The Fund’s investments in foreign securities may involve risks not present in domestic investments. Since securities may be denominated in foreign currencies, may require settlement in foreign currencies or may pay interest or dividends in foreign currencies, changes in the relationship of these foreign currencies to the U.S. dollar
| | | | | | |
| Franklin Strategic Real Return Fund 2023 Annual Report | | | | | 37 | |
Notes to consolidated financial statements (cont’d)
can significantly affect the value of the investments and earnings of the Fund. Foreign investments may also subject the Fund to foreign government exchange restrictions, expropriation, taxation or other political, social or economic developments, all of which affect the market and/or credit risk of the investments.
(g) Counterparty risk and credit-risk-related contingent features of derivative instruments. The Fund may invest in certain securities or engage in other transactions where the Fund is exposed to counterparty credit risk in addition to broader market risks. The Fund may invest in securities of issuers, which may also be considered counterparties as trading partners in other transactions. This may increase the risk of loss in the event of default or bankruptcy by the counterparty or if the counterparty otherwise fails to meet its contractual obligations. The Fund’s subadviser attempts to mitigate counterparty risk by (i) periodically assessing the creditworthiness of its trading partners, (ii) monitoring and/or limiting the amount of its net exposure to each individual counterparty based on its assessment and (iii) requiring collateral from the counterparty for certain transactions. Market events and changes in overall economic conditions may impact the assessment of such counterparty risk by the subadviser. In addition, declines in the values of underlying collateral received may expose the Fund to increased risk of loss.
With exchange traded and centrally cleared derivatives, there is less counterparty risk to the Fund since the exchange or clearinghouse, as counterparty to such instruments, guarantees against a possible default. The clearinghouse stands between the buyer and the seller of the contract; therefore, the credit risk is limited to failure of the clearinghouse. While offset rights may exist under applicable law, the Fund does not have a contractual right of offset against a clearing broker or clearinghouse in the event of a default of the clearing broker or clearinghouse.
The Fund has entered into master agreements, such as an International Swaps and Derivatives Association, Inc. Master Agreement (“ISDA Master Agreement”) or similar agreement, with certain of its derivative counterparties that govern over-the-counter (“OTC”) derivatives and provide for general obligations, representations, agreements, collateral posting terms, netting provisions in the event of default or termination and credit related contingent features. The credit related contingent features include, but are not limited to, a percentage decrease in the Fund’s net assets or net asset value per share over a specified period of time. If these credit related contingent features were triggered, the derivatives counterparty could terminate the positions and demand payment or require additional collateral.
Under an ISDA Master Agreement, the Fund may, under certain circumstances, offset with the counterparty certain derivative financial instruments’ payables and/or receivables with collateral held and/or posted and create one single net payment. However, absent an event of default by the counterparty or a termination of the agreement, the terms of the ISDA Master Agreements do not result in an offset of reported amounts of financial assets and financial liabilities in the Consolidated Statement of Assets and Liabilities across transactions between the Fund and the applicable counterparty. The enforceability of the right to offset may vary by jurisdiction.
| | | | |
| 38 | | | | Franklin Strategic Real Return Fund 2023 Annual Report |
Collateral requirements differ by type of derivative. Collateral or margin requirements are set by the broker or exchange clearinghouse for exchange traded derivatives while collateral terms are contract specific for OTC traded derivatives. Cash collateral that has been pledged to cover obligations of the Fund under derivative contracts, if any, will be reported separately in the Consolidated Statement of Assets and Liabilities. Securities pledged as collateral, if any, for the same purpose are noted in the Consolidated Schedule of Investments.
As of September 30, 2023, the Fund held forward foreign currency contracts with credit related contingent features which had a liability position of $522,176. If a contingent feature in the master agreements would have been triggered, the Fund would have been required to pay this amount to its derivatives counterparties.
(h) Security transactions and investment income. Security transactions are accounted for on a trade date basis. Interest income (including interest income from payment-in-kind securities) is recorded on the accrual basis. Amortization of premiums and accretion of discounts on debt securities are recorded to interest income over the lives of the respective securities, except for premiums on certain callable debt securities which are amortized to the earliest call date. Dividend income is recorded on the ex-dividend date for dividends received in cash and/or securities. Foreign dividend income is recorded on the ex-dividend date or as soon as practicable after the Fund determines the existence of a dividend declaration after exercising reasonable due diligence. The cost of investments sold is determined by use of the specific identification method. To the extent any issuer defaults or a credit event occurs that impacts the issuer, the Fund may halt any additional interest income accruals and consider the realizability of interest accrued up to the date of default or credit event.
(i) REIT distributions. The character of distributions received from Real Estate Investment Trusts (‘‘REITs’’) held by the Fund is generally comprised of net investment income, capital gains, and return of capital. It is the policy of the Fund to estimate the character of distributions received from underlying REITs based on historical data provided by the REITs. After each calendar year end, REITs report the actual tax character of these distributions. Differences between the estimated and actual amounts reported by the REITs are reflected in the Fund’s records in the year in which they are reported by the REITs by adjusting related investment cost basis, capital gains and income, as necessary.
(j) Distributions to shareholders. Distributions from net investment income and distributions of net realized gains, if any, are declared at least annually. Distributions to shareholders of the Fund are recorded on the ex-dividend date and are determined in accordance with income tax regulations, which may differ from GAAP.
(k) Share class accounting. Investment income, common expenses and realized/ unrealized gains (losses) on investments are allocated to the various classes of the Fund on the basis of daily net assets of each class. Fees relating to a specific class are charged directly to that share class.
| | | | | | |
| Franklin Strategic Real Return Fund 2023 Annual Report | | | | | 39 | |
Notes to consolidated financial statements (cont’d)
(l) Compensating balance arrangements. The Fund has an arrangement with its custodian bank whereby a portion of the custodian’s fees is paid indirectly by credits earned on the Fund’s cash on deposit with the bank.
(m) Federal and other taxes. It is the Fund’s policy to comply with the federal income and excise tax requirements of the Internal Revenue Code of 1986 (the “Code”), as amended, applicable to regulated investment companies. Accordingly, the Fund intends to distribute its taxable income and net realized gains, if any, to shareholders in accordance with timing requirements imposed by the Code. Therefore, no federal or state income tax provision is required in the Fund’s financial statements.
Management has analyzed the Fund’s tax positions taken on income tax returns for all open tax years and has concluded that as of September 30, 2023, no provision for income tax is required in the Fund’s financial statements. The Fund’s federal and state income and federal excise tax returns for tax years for which the applicable statutes of limitations have not expired are subject to examination by the Internal Revenue Service and state departments of revenue.
Under the applicable foreign tax laws, a withholding tax may be imposed on interest, dividends and capital gains at various rates.
(n) Reclassification. GAAP requires that certain components of net assets be reclassified to reflect permanent differences between financial and tax reporting. These reclassifications have no effect on net assets or net asset value per share. During the current year, the Fund had no reclassifications.
2. Investment management agreement and other transactions with affiliates
Legg Mason Partners Fund Advisor, LLC (“LMPFA”) is the Fund’s investment manager. Franklin Advisers, Inc. (“Franklin Advisers”) is the Fund’s adviser and a subadviser. ClearBridge Investments, LLC (“ClearBridge”), Western Asset Management Company, LLC (“Western Asset”), Western Asset Management Company Limited (“Western Asset London”) and Western Asset Management Company Ltd in Japan (“Western Japan”) are also the Fund’s subadvisers. Western Asset also manages the portion of the Fund’s cash and short-term instruments allocated to it pursuant to a separate subadvisory agreement between LMPFA and Western Asset (“Western Asset Agreement”). LMPFA, Franklin Advisers, ClearBridge, Western Asset, Western Asset London and Western Japan are wholly-owned subsidiaries of Franklin Resources, Inc. (“Franklin Resources”).
Under the investment management agreement, the Fund pays LMPFA an investment management fee, calculated daily and paid monthly, at an annual rate of 0.75% of the Fund’s average daily net assets.
LMPFA provides administrative and certain oversight services to the Fund. LMPFA delegates to Franklin Advisers the day-to-day portfolio management of the Fund, except for the management of the portion of the cash and short term instruments allocated to Western Asset. Franklin Advisers is responsible for monitoring and coordinating the overall management of the Fund, including rebalancing the Fund’s target asset allocations among itself and the subadvisers. Franklin Advisers also provides management for a portion of the Fund’s assets.
| | | | |
| 40 | | | | Franklin Strategic Real Return Fund 2023 Annual Report |
LMPFA pays Franklin Advisers for its services to the Fund an advisory fee, calculated daily and paid monthly, at an annual rate of 0.20% of the Fund’s average daily net assets. Franklin Advisers has agreed that it will not receive any additional compensation for the services provided to the Subsidiary. LMPFA pays Franklin Advisers, ClearBridge and Western Asset each a subadvisory fee for their services to the Fund, calculated daily and paid monthly, at annual rates of 0.45%, 0.35% and 0.25% of the average daily net assets managed by each, respectively. For Western Asset’s cash management services to the Fund pursuant to the Western Asset Agreement, LMPFA, not the Fund, pays Western Asset monthly 0.02% of the portion of the Fund’s average daily net assets that are allocated to them by LMPFA. Western Asset pays each of Western Asset London and Western Japan a subadvisory fee for their services to the Fund, calculated daily and paid monthly, at an annual rate of 0.25% of the average daily net assets managed by each.
LMPFA has agreed to waive fees and/or reimburse operating expenses (other than interest, brokerage commissions (except for brokerage commissions paid on purchases and sales of shares of ETFs), dividend expense on short sales, taxes and extraordinary expenses), subject to recapture as described below. As a result, total annual fund operating expenses did not exceed 1.35%, 2.10%, 1.10% and 1.00% for Class A, Class C, Class I and Class IS shares, respectively. In addition, the ratio of total annual fund operating expenses for Class IS shares did not exceed the ratio of total annual fund operating expenses for Class I shares. Acquired fund fees and expenses are subject to the expense limitation arrangements, and are calculated based on an average of the net expense ratio (as shown in the most recent prospectus or shareholder report for each acquired fund as of the date of the Fund’s most recent prospectus) of each acquired fund held by the Fund, weighted in proportion to the Fund’s investment allocation among the acquired funds. These arrangements are expected to continue until December 31, 2024, may be terminated prior to that date by agreement of LMPFA and the Board of Trustees, and may be terminated at any time after that date by LMPFA. The arrangements, however, may be modified by LMPFA to decrease total annual fund operating expenses at any time.
During the year ended September 30, 2023, fees waived and/or expenses reimbursed amounted to $126,050.
LMPFA is permitted to recapture amounts waived and/or reimbursed to a class within three years after the fiscal year in which LMPFA earned the fee or incurred the expense if the class’ total annual fund operating expenses have fallen to a level below the expense limitation (“expense cap”) in effect at the time the fees were earned or the expenses incurred. In no case will LMPFA recapture any amount that would result, on any particular business day of the Fund, in the class’ total annual fund operating expenses exceeding the expense cap or any other lower limit then in effect.
| | | | | | |
| Franklin Strategic Real Return Fund 2023 Annual Report | | | | | 41 | |
Notes to consolidated financial statements (cont’d)
Pursuant to these arrangements, at September 30, 2023, the Fund had remaining fee waivers and/or expense reimbursements subject to recapture by LMPFA and respective dates of expiration as follows:
| | | | | | | | | | | | | | | | |
| | | Class A | | | Class C | | | Class I | | | Class IS | |
| Expires September 30, 2024 | | $ | 2,164 | | | $ | 176 | | | $ | 591 | | | $ | 129,364 | |
| Expires September 30, 2025 | | | 10,019 | | | | 774 | | | | 2,219 | | | | 134,666 | |
| Expires September 30, 2026 | | | 12,548 | | | | 793 | | | | 380 | | | | 112,329 | |
| Total fee waivers/expense reimbursements subject to recapture | | $ | 24,731 | | | $ | 1,743 | | | $ | 3,190 | | | $ | 376,359 | |
For the year ended September 30, 2023, fee waivers and/or expense reimbursements recaptured by LMPFA, if any, were as follows:
| | | | |
| | | Class I | |
| LMPFA recaptured | | $ | 668 | |
Franklin Distributors, LLC (“Franklin Distributors”) serves as the Fund’s sole and exclusive distributor. Franklin Distributors is an indirect, wholly-owned broker-dealer subsidiary of Franklin Resources. Franklin Templeton Investor Services, LLC (“Investor Services”) serves as the Fund’s shareholder servicing agent and acts as the Fund’s transfer agent and dividend-paying agent. Investor Services is an indirect, wholly-owned subsidiary of Franklin Resources. For the year ended September 30, 2023, the Fund incurred transfer agent fees as reported on the Statement of Operations, of which $1,518 was earned by Investor Services.
There is a maximum initial sales charge of 5.50% for Class A shares. There is a contingent deferred sales charge (“CDSC”) of 1.00% on Class C shares, which applies if redemption occurs within 12 months from purchase payment. In certain cases, Class A shares have a 1.00% CDSC, which applies if redemption occurs within 18 months from purchase payment. This CDSC only applies to those purchases of Class A shares, which, when combined with current holdings of other shares of funds sold by Franklin Distributors, equal or exceed $1,000,000 in the aggregate. These purchases do not incur an initial sales charge.
For the year ended September 30, 2023, sales charges retained by and CDSCs paid to Franklin Distributors and its affiliates, if any, were as follows:
| | | | |
| | | Class A | |
| Sales charges | | $ | 2,135 | |
| CDSCs | | | 242 | |
Under a Deferred Compensation Plan (the “Plan”), Trustees may have elected to defer receipt of all or a specified portion of their compensation. A participating Trustee selected one or more funds managed by LMPFA or an affiliate of LMPFA in which his or her deferred trustee’s fees were deemed to be invested. Deferred amounts remain in the Fund until distributed in accordance with the Plan. In May 2015, the Board of Trustees approved an amendment to the Plan so that effective January 1, 2016, no compensation earned after that date may be deferred under the Plan.
| | | | |
| 42 | | | | Franklin Strategic Real Return Fund 2023 Annual Report |
All officers and one Trustee of the Trust are employees of Franklin Resources or its affiliates and do not receive compensation from the Trust.
As of September 30, 2023, Franklin Resources and its affiliates owned 92% of the Fund.
3. Investments
During the year ended September 30, 2023, the aggregate cost of purchases and proceeds from sales of investments (excluding short-term investments) and U.S. Government & Agency Obligations were as follows:
| | | | | | | | |
| | | Investments | | | U.S. Government & Agency Obligations | |
| Purchases | | $ | 5,883,217 | | | $ | 7,856,008 | |
| Sales | | | 7,303,833 | | | | 3,670,758 | |
At September 30, 2023, the aggregate cost of investments and the aggregate gross unrealized appreciation and depreciation of investments for federal income tax purposes were as follows:
| | | | | | | | | | | | | | | | |
| | | Cost | | | Gross Unrealized Appreciation | | | Gross Unrealized Depreciation | | | Net Unrealized Depreciation | |
| Securities | | $ | 103,551,971 | | | $ | 6,659,541 | | | $ | (11,311,089) | | | $ | (4,651,548) | |
| Futures contracts | | | — | | | | — | | | | (187,787) | | | | (187,787) | |
| Forward foreign currency contracts | | | — | | | | 76,988 | | | | (522,176) | | | | (445,188) | |
4. Derivative instruments and hedging activities
Below is a table, grouped by derivative type, that provides information about the fair value and the location of derivatives within the Consolidated Statement of Assets and Liabilities at September 30, 2023.
| | | | |
| ASSET DERIVATIVES1 | |
| | | Foreign Exchange Risk | |
| Forward foreign currency contracts | | $ | 76,988 | |
| | | | | | | | | | | | | | | | | | | | |
| LIABILITY DERIVATIVES1 | |
| | | Interest Rate Risk | | | Foreign Exchange Risk | | | Equity Risk | | | Commodity Risk | | | Total | |
| Futures contracts2 | | $ | 114,866 | | | | — | | | $ | 18,844 | | | $ | 54,077 | | | $ | 187,787 | |
| Forward foreign currency contracts | | | — | | | $ | 522,176 | | | | — | | | | — | | | | 522,176 | |
| Total | | $ | 114,866 | | | $ | 522,176 | | | $ | 18,844 | | | $ | 54,077 | | | $ | 709,963 | |
| 1 | Generally, the balance sheet location for asset derivatives is receivables/net unrealized appreciation and for liability derivatives is payables/net unrealized depreciation. |
| 2 | Includes cumulative unrealized appreciation (depreciation) of futures contracts as reported in the Consolidated Schedule of Investments. Only net variation margin is reported within the receivables and/or payables on the Consolidated Statement of Assets and Liabilities. |
| | | | | | |
| Franklin Strategic Real Return Fund 2023 Annual Report | | | | | 43 | |
Notes to consolidated financial statements (cont’d)
The following tables provide information about the effect of derivatives and hedging activities on the Fund’s Consolidated Statement of Operations for the year ended September 30, 2023. The first table provides additional detail about the amounts and sources of gains (losses) realized on derivatives during the period. The second table provides additional information about the change in net unrealized appreciation (depreciation) resulting from the Fund’s derivatives and hedging activities during the period.
| | | | | | | | | | | | | | | | | | | | |
| AMOUNT OF NET REALIZED GAIN (LOSS) ON DERIVATIVES RECOGNIZED | |
| | | Interest Rate Risk | | | Foreign Exchange Risk | | | Equity Risk | | | Commodity Risk | | | Total | |
| Futures contracts | | $ | (472,023) | | | | — | | | $ | (119,373) | | | $ | 469,807 | | | $ | (121,589) | |
| Forward foreign currency contracts | | | — | | | $ | 838,538 | | | | — | | | | — | | | | 838,538 | |
| Total | | $ | (472,023) | | | $ | 838,538 | | | $ | (119,373) | | | $ | 469,807 | | | $ | 716,949 | |
| | | | | | | | | | | | | | | | | | | | |
| CHANGE IN NET UNREALIZED APPRECIATION (DEPRECIATION) ON DERIVATIVES RECOGNIZED | |
| | | Interest Rate
Risk | | | Foreign Exchange Risk | | | Equity Risk | | | Commodity Risk | | | Total | |
| Futures contracts | | $ | 173,497 | | | | — | | | $ | 44,422 | | | $ | 585,867 | | | $ | 803,786 | |
| Forward foreign currency contracts | | | — | | | $ | 582,079 | | | | — | | | | — | | | | 582,079 | |
| Total | | $ | 173,497 | | | $ | 582,079 | | | $ | 44,422 | | | $ | 585,867 | | | $ | 1,385,865 | |
During the year ended September 30, 2023, the volume of derivative activity for the Fund was as follows:
| | | | |
| | | Average Market Value | |
| Futures contracts (to buy) | | $ | 23,723,183 | |
| Futures contracts (to sell)† | | | 1,985,483 | |
| Forward foreign currency contracts (to buy) | | | 42,364,420 | |
| Forward foreign currency contracts (to sell)† | | | 392,518 | |
| † | At September 30, 2023, there were no open positions held in this derivative. |
The following table presents the Fund’s OTC derivative assets and liabilities by counterparty net of amounts available for offset under an ISDA Master Agreement and net of the related collateral pledged (received) by the Fund as of September 30, 2023.
| | | | | | | | | | | | | | | | | | | | |
| Counterparty | | Gross Assets Subject to Master Agreements1 | | | Gross Liabilities Subject to Master Agreements1 | | | Net Assets (Liabilities) Subject to Master Agreements | | | Collateral Pledged (Received) | | | Net Amount2 | |
| HSBC Securities Inc. | | $ | 76,988 | | | $ | (521,169) | | | $ | (444,181) | | | | — | | | $ | (444,181) | |
| Morgan Stanley & Co. Inc. | | | — | | | | (1,007) | | | | (1,007) | | | | — | | | | (1,007) | |
| Total | | $ | 76,988 | | | $ | (522,176) | | | $ | (445,188) | | | | — | | | $ | (445,188) | |
| 1 | Absent an event of default or early termination, derivative assets and liabilities are presented gross and not offset in the Consolidated Statement of Assets and Liabilities. |
| 2 | Represents the net amount receivable (payable) from (to) the counterparty in the event of default. |
| | | | |
| 44 | | | | Franklin Strategic Real Return Fund 2023 Annual Report |
5. Class specific expenses, waivers and/or expense reimbursements
The Fund has adopted a Rule 12b-1 shareholder services and distribution plan and under that plan the Fund pays service and/or distribution fees with respect to its Class A and Class C shares calculated at the annual rate of 0.25% and 1.00% of the average daily net assets of each class, respectively. Service and/or distribution fees are accrued daily and paid monthly.
For the year ended September 30, 2023, class specific expenses were as follows:
| | | | | | | | |
| | | Service and/or Distribution Fees | | | Transfer Agent Fees | |
| Class A | | $ | 19,832 | | | $ | 10,581 | |
| Class C | | | 5,961 | | | | 640 | |
| Class I | | | — | | | | (378) | |
| Class IS | | | — | | | | (155) | |
| Total | | $ | 25,793 | | | $ | 10,688 | |
For the year ended September 30, 2023, waivers and/or expense reimbursements by class were as follows:
| | | | |
| | | Waivers/Expense Reimbursements | |
| Class A | | $ | 12,548 | |
| Class C | | | 793 | |
| Class I | | | 380 | |
| Class IS | | | 112,329 | |
| Total | | $ | 126,050 | |
6. Distributions to shareholders by class
| | | | | | | | |
| | | Year Ended September 30, 2023 | | | Year Ended September 30, 2022 | |
| Net Investment Income: | | | | | | | | |
| Class A | | $ | 251,263 | | | $ | 204,101 | |
| Class C | | | 16,556 | | | | 2,647 | |
| Class I | | | 12,454 | | | | 5,435 | |
| Class IS | | | 2,860,986 | | | | 11,637,820 | |
| Total | | $ | 3,141,259 | | | $ | 11,850,003 | |
| | |
| Net Realized Gains: | | | | | | | | |
| Class A | | $ | 604,129 | | | $ | 100,865 | |
| Class C | | | 49,963 | | | | 1,577 | |
| Class I | | | 27,902 | | | | 2,852 | |
| Class IS | | | 6,301,510 | | | | 5,920,856 | |
| Total | | $ | 6,983,504 | | | $ | 6,026,150 | |
| | | | | | |
| Franklin Strategic Real Return Fund 2023 Annual Report | | | | | 45 | |
Notes to consolidated financial statements (cont’d)
7. Shares of beneficial interest
At September 30, 2023, the Trust had an unlimited number of shares of beneficial interest authorized with a par value of $0.00001 per share. The Fund has the ability to issue multiple classes of shares. Each class of shares represents an identical interest and has the same rights, except that each class bears certain direct expenses, including those specifically related to the distribution of its shares.
Transactions in shares of each class were as follows:
| | | | | | | | | | | | | | | | |
| | | Year Ended
September 30, 2023 | | | Year Ended
September 30, 2022 | |
| | | Shares | | | Amount | | | Shares | | | Amount | |
| Class A | | | | | | | | | | | | | | | | |
| Shares sold | | | 257,839 | | | $ | 2,442,134 | | | | 965,658 | | | $ | 10,831,317 | |
| Shares issued on reinvestment | | | 92,898 | | | | 849,088 | | | | 25,790 | | | | 292,849 | |
| Shares repurchased | | | (369,053) | | | | (3,432,672) | | | | (345,499) | | | | (3,726,970) | |
| Net increase (decrease) | | | (18,316) | | | $ | (141,450) | | | | 645,949 | | | $ | 7,397,196 | |
| | | | |
| Class C | | | | | | | | | | | | | | | | |
| Shares sold | | | 5,780 | | | $ | 51,266 | | | | 104,431 | | | $ | 1,137,641 | |
| Shares issued on reinvestment | | | 7,525 | | | | 66,519 | | | | 388 | | | | 4,224 | |
| Shares repurchased | | | (24,976) | | | | (222,653) | | | | (36,333) | | | | (362,057) | |
| Net increase (decrease) | | | (11,671) | | | $ | (104,868) | | | | 68,486 | | | $ | 779,808 | |
| | | | |
| Class I | | | | | | | | | | | | | | | | |
| Shares sold | | | 26,612 | | | $ | 262,165 | | | | 30,228 | | | $ | 350,005 | |
| Shares issued on reinvestment | | | 4,096 | | | | 38,875 | | | | 705 | | | | 8,287 | |
| Shares repurchased | | | (29,650) | | | | (287,743) | | | | (10,331) | | | | (114,226) | |
| Net increase | | | 1,058 | | | $ | 13,297 | | | | 20,602 | | | $ | 244,066 | |
| | | | |
| Class IS | | | | | | | | | | | | | | | | |
| Shares sold | | | 420,700 | | | $ | 4,040,000 | | | | 15,948 | | | $ | 174,985 | |
| Shares issued on reinvestment | | | 984,156 | | | | 9,162,496 | | | | 1,519,519 | | | | 17,558,676 | |
| Shares repurchased | | | (75,289) | | | | (725,000) | | | | (1,393,635) | | | | (15,860,000) | |
| Net increase | | | 1,329,567 | | | $ | 12,477,496 | | | | 141,832 | | | $ | 1,873,661 | |
8. Redemption facility
The Fund, together with other U.S. registered and foreign investment funds (collectively, the “Borrowers”) managed by Franklin Resources or its affiliates, is a borrower in a joint syndicated senior unsecured credit facility totaling $2.675 billion (the “Global Credit Facility”). The Global Credit Facility provides a source of funds to the Borrowers for temporary and emergency purposes, including the ability to meet future unanticipated or unusually large redemption requests. Unless renewed, the Global Credit Facility will terminate on February 2, 2024.
Under the terms of the Global Credit Facility, the Fund shall, in addition to interest charged on any borrowings made by the Fund and other costs incurred by the Fund, pay its share of fees and expenses incurred in connection with the implementation and maintenance of the
| | | | |
| 46 | | | | Franklin Strategic Real Return Fund 2023 Annual Report |
Global Credit Facility, based upon its relative share of the aggregate net assets of all the Borrowers, including an annual commitment fee of 0.15% based upon the unused portion of the Global Credit Facility. These fees are reflected in the Consolidated Statement of Operations. The Fund did not utilize the Global Credit Facility during the year ended September 30, 2023.
9. Income tax information and distributions to shareholders
The tax character of distributions paid during the fiscal years ended September 30, was as follows:
| | | | | | | | |
| | | 2023 | | | 2022 | |
| Distributions paid from: | | | | | | | | |
| Ordinary income | | $ | 3,168,576 | | | $ | 12,799,918 | |
| Net long-term capital gains | | | 6,956,187 | | | | 5,076,235 | |
| Total distributions paid | | $ | 10,124,763 | | | $ | 17,876,153 | |
As of September 30, 2023, the components of distributable earnings (loss) on a tax basis were as follows:
| | | | |
| Undistributed ordinary income — net | | $ | 1,836,176 | |
| Deferred capital losses* | | | (392,752) | |
| Other book/tax temporary differences(a) | | | 499,098 | |
| Unrealized appreciation (depreciation)(b) | | | (5,286,576) | |
| Total distributable earnings (loss) — net | | $ | (3,344,054) | |
| * | These capital losses have been deferred in the current year as either short-term or long-term losses. The losses will be deemed to occur on the first day of the next taxable year in the same character as they were originally deferred and will be available to offset future taxable capital gains. |
| (a) | Other book/tax temporary differences are attributable to the tax deferral of losses on straddles, the realization for tax purposes of unrealized gains (losses) on certain futures and foreign currency contracts and book/tax differences in the timing of the deductibility of various expenses. |
| (b) | The difference between book-basis and tax-basis unrealized appreciation (depreciation) is attributable to the tax deferral of losses on wash sales and the difference between the book and tax cost basis in underlying investments. |
10. Recent accounting pronouncement
In June 2022, the Financial Accounting Standards Board (FASB) issued Accounting Standards Update (ASU) No. 2022-03, Fair Value Measurement (Topic 820) – Fair Value Measurement of Equity Securities Subject to Contractual Sale Restrictions. The amendments in the ASU clarify that a contractual restriction on the sale of an equity security is not considered part of the unit of account of the equity security and, therefore, should not be considered in measuring fair value. The ASU is effective for interim and annual reporting periods beginning after December 15, 2023, with the option of early adoption. Management has reviewed the requirements and believes that the adoption of the ASU will not have a material impact on the financial statements.
| | | | | | |
| Franklin Strategic Real Return Fund 2023 Annual Report | | | | | 47 | |
Report of independent registered public accounting firm
To the Board of Trustees of Legg Mason Global Asset Management Trust and Shareholders of Franklin Strategic Real Return Fund
Opinion on the Financial Statements
We have audited the accompanying consolidated statement of assets and liabilities, including the consolidated schedule of investments, of Franklin Strategic Real Return Fund and its subsidiary (one of the funds constituting Legg Mason Global Asset Management Trust, referred to hereafter as the “Fund”) as of September 30, 2023, the related consolidated statement of operations for the year ended September 30, 2023, the consolidated statement of changes in net assets for each of the two years in the period ended September 30, 2023, including the related notes, and the consolidated financial highlights for each of the five years in the period ended September 30, 2023 (collectively referred to as the “consolidated financial statements”). In our opinion, the consolidated financial statements present fairly, in all material respects, the financial position of the Fund as of September 30, 2023, the results of its operations for the year then ended, the changes in its net assets for each of the two years in the period ended September 30, 2023 and the financial highlights for each of the five years in the period ended September 30, 2023 in conformity with accounting principles generally accepted in the United States of America.
Basis for Opinion
These consolidated financial statements are the responsibility of the Fund’s management. Our responsibility is to express an opinion on the Fund’s consolidated financial statements based on our audit. We are a public accounting firm registered with the Public Company Accounting Oversight Board (United States) (PCAOB) and are required to be independent with respect to the Fund in accordance with the U.S. federal securities laws and the applicable rules and regulations of the Securities and Exchange Commission and the PCAOB.
We conducted our audit of these consolidated financial statements in accordance with the standards of the PCAOB. Those standards require that we plan and perform the audit to obtain reasonable assurance about whether the consolidated financial statements are free of material misstatement, whether due to error or fraud.
Our audit included performing procedures to assess the risks of material misstatement of the consolidated financial statements, whether due to error or fraud, and performing procedures that respond to those risks. Such procedures included examining, on a test basis, evidence regarding the amounts and disclosures in the consolidated financial statements. Our audit also included evaluating the accounting principles used and significant estimates made by management, as well as evaluating the overall presentation of the consolidated financial statements. Our procedures included confirmation of securities owned as of September 30, 2023 by correspondence with the custodian and brokers. We believe that our audit provides a reasonable basis for our opinion.
/s/PricewaterhouseCoopers LLP
Baltimore, Maryland
November 20, 2023
We have served as the auditor of one or more investment companies in the Franklin Templeton Group of Funds since 1948.
| | | | |
| 48 | | | | Franklin Strategic Real Return Fund 2023 Annual Report |
Board approval of management and
subadvisory agreements (unaudited)
At an in-person meeting of the Board of Trustees of Legg Mason Global Asset Management Trust (the “Trust”) held on May 3-4, 2023, the Board, including the Trustees who are not considered to be “interested persons” of the Trust (the “Independent Trustees”) under the Investment Company Act of 1940, as amended (the “1940 Act”), approved for an annual period the continuation of the management agreement (the “Management Agreement”) with Legg Mason Partners Fund Advisor, LLC (the “Manager”) with respect to Franklin Strategic Real Return Fund, a series of the Trust (the “Fund”), the Investment Management Agreement (the “Investment Management Agreement”) between Franklin Advisers, Inc. (the “Adviser”) and the controlled foreign corporation for the Fund, the advisory agreement (the “Advisory Agreement”) between the Adviser and the Manager, the subadvisory agreement among the Manager, the Adviser and Western Asset Management Company, LLC (“Western Asset”), the subadvisory agreement among the Manager, the Adviser and ClearBridge Investments, LLC (“ClearBridge”), the subadvisory agreement between the Manager and the Adviser, the subadvisory agreement among the Manager, the Adviser, Western Asset and Western Asset Management Company Ltd (“Western Japan”), the subadvisory agreement among the Manager, the Adviser, Western Asset and Western Asset Management Company Limited (“WAML”) and the subadvisory agreement between the Manager and Western Asset pursuant to which Western Asset is engaged to provide day-to-day management of that portion of the Fund’s cash and short-term investments allocated to Western Asset under such subadvisory agreement. Each subadvisory agreement is referred to as a “Subadvisory Agreement.” The Advisor (in its capacity as a subadviser), Western Asset, ClearBridge, Western Japan and WAML are each referred to herein as a “Subadviser.” The Management Agreement, Investment Management Agreement, the Advisory Agreement and the Subadvisory Agreements are collectively referred to as the “Agreements.”
Background
The Board received extensive information in advance of the meeting to assist it in its consideration of the Agreements and asked questions and requested additional information from management. Throughout the year the Board (including its various committees) had met with representatives of the Manager, the Adviser and the Subadvisers, and had received information relevant to the renewal of the Agreements. Prior to the meeting the Independent Trustees met with their independent legal counsel to discuss and consider the information provided and submitted questions to management, and they considered the responses provided. The Board received and considered a variety of information about the Manager, the Adviser and the Subadvisers, as well as the management, advisory and sub-advisory arrangements for the Fund and other funds overseen by the Board, certain portions of which are discussed below. The information received and considered by the Board both in conjunction with the May 2023 meeting and throughout the year was both written and
| | | | | | |
| Franklin Strategic Real Return Fund | | | | | 49 | |
Board approval of management and subadvisory agreements (unaudited) (cont’d)
oral. The contractual arrangements discussed below are the product of multiple years of review and negotiation and information received and considered by the Board during those years.
The information provided and presentations made to the Board encompassed the Fund and all funds for which the Board has responsibility. The discussion below covers both the advisory and the administrative functions being rendered by the Manager, both of which functions are encompassed by the Management Agreement, as well as the advisory functions rendered by the Adviser pursuant to the Investment Management Agreement and the Advisory Agreement and the Subadvisers pursuant to the Sub-Advisory Agreements.
Board approval of management agreement, investment management agreement, advisory agreement and sub-advisory agreements
The Independent Trustees were advised by separate independent legal counsel throughout the process. Prior to voting, the Independent Trustees received a memorandum from their independent legal counsel discussing the legal standards for their consideration of the proposed continuation of the Agreements. The Independent Trustees also reviewed the proposed continuation of the Management Agreement, the Investment Management Agreement, the Advisory Agreement and the Sub-Advisory Agreements in private sessions with their independent legal counsel at which no representatives of the Manager, the Adviser and Subadvisers were present. The Independent Trustees considered the Management Agreement, the Investment Management Agreement, the Advisory Agreement and each Sub-Advisory Agreement separately in the course of their review. In doing so, they noted the respective roles of the Manager, the Adviser and the Subadvisers in providing services to the Fund.
In approving the Agreements, the Board, including the Independent Trustees, considered a variety of factors, including those factors discussed below. No single factor reviewed by the Board was identified by the Board as the principal factor in determining whether to approve the Management Agreement, the Investment Management Agreement, the Advisory Agreement and the Sub-Advisory Agreements. Each Trustee may have attributed different weight to the various factors in evaluating the Management Agreement, the Investment Management Agreement, the Advisory Agreement and each Sub-Advisory Agreement.
After considering all relevant factors and information, the Board, exercising its business judgment, determined that the continuation of the Agreements was in the best interests of the Fund and its shareholders and approved the continuation of each such agreement for another year.
| | | | |
| 50 | | | | Franklin Strategic Real Return Fund |
Nature, extent and quality of the services under the management agreement, investment management agreement, advisory agreement and sub-advisory agreements
The Board received and considered information regarding the nature, extent and quality of services provided to the Fund by the Manager, the Adviser and the Subadvisers under the Management Agreement, the Investment Management Agreement, the Advisory Agreement and the Sub-Advisory Agreements, respectively, during the past year. The Board noted information received at regular meetings throughout the year related to the services rendered by the Manager in its management of the Fund’s affairs and the Manager’s role in coordinating the activities of the Fund’s other service providers. The Board’s evaluation of the services provided by the Manager, the Adviser and the Subadvisers took into account the Board’s knowledge gained as Trustees of funds in the fund complex overseen by the Trustees, including knowledge gained regarding the scope and quality of the investment management and other capabilities of the Manager, the Adviser and the Subadvisers, and the quality of the Manager’s administrative and other services. The Board observed that the scope of services provided by the Manager, the Adviser and the Subadvisers, and of the undertakings required of the Manager, the Adviser and Subadvisers in connection with those services, including maintaining and monitoring their own and the Fund’s compliance programs, liquidity management programs, derivatives risk management programs, cybersecurity programs and valuation-related policies, had expanded over time as a result of regulatory, market and other developments. The Board also noted that on a regular basis it received and reviewed information from the Manager regarding the Fund’s compliance policies and procedures established pursuant to Rule 38a-1 under the 1940 Act. The Board also considered the risks associated with the Fund borne by the Manager and its affiliates (such as entrepreneurial, operational, reputational, litigation and regulatory risk), as well as the Manager’s, the Adviser’s and each Subadviser’s risk management processes.
The Board reviewed the qualifications, backgrounds and responsibilities of the Manager’s, the Adviser’s and each Subadviser’s senior personnel and the team of investment professionals primarily responsible for the day-to-day portfolio management of the Fund. The Board also considered, based on its knowledge of the Manager and the Manager’s affiliates, the financial resources of Franklin Resources, Inc., the parent organization of the Manager, the Adviser and the Subadvisers. The Board recognized the importance of having a fund manager with significant resources.
The Board considered the division of responsibilities among the Manager, the Adviser and the Subadvisers and the oversight provided by the Manager and/or the Adviser, as applicable. The Board also considered the policies and practices of the Manager, the Adviser and the Subadvisers regarding the selection of brokers and dealers and the execution of portfolio transactions. The Board considered management’s periodic reports to the Board on, among other things, its business plans, any organizational changes and portfolio manager compensation.
| | | | | | |
| Franklin Strategic Real Return Fund | | | | | 51 | |
Board approval of management and
subadvisory agreements (unaudited) (cont’d)
The Board received and considered performance information for the Fund as well as for a group of funds (the “Performance Universe”) selected by Broadridge Financial Solutions, Inc. (“Broadridge”), an independent provider of investment company data, based on classifications provided by Thomson Reuters Lipper (“Lipper”). The Board was provided with a description of the methodology used to determine the similarity of the Fund with the funds included in the Performance Universe. It was noted that while the Board found the Broadridge data generally useful, they recognized its limitations, including that the data may vary depending on the end date selected and that the results of the performance comparisons may vary depending on the selection of the peer group and its composition over time. The Board also noted that it had received and discussed with management information throughout the year at periodic intervals comparing the Fund’s performance against its benchmark and against the Fund’s peers. The Board also considered the Fund’s performance in light of overall financial market conditions.
The information comparing the Fund’s performance to that of its Performance Universe, consisting of funds (including the Fund) classified as real return funds by Lipper, showed, among other data, that the performance of the Fund’s Class I shares for the 1-, 3-, 5- and 10-year periods ended December 31, 2022 was below the median performance of the funds in the Performance Universe for each period. The Board noted the explanations from the Manager and the Adviser concerning the reasons for the Fund’s relative performance versus the peer group for the various periods.
The Board concluded that, overall, the nature, extent and quality of services provided (and expected to be provided), including performance, under the Management Agreement, the Investment Management Agreement, the Advisory Agreement and each Sub-Advisory Agreement were sufficient for renewal.
Management fees and expense ratios
The Board reviewed and considered the contractual management fee payable by the Fund to the Manager (the “Contractual Management Fee”) and the actual management fees paid by the Fund to the Manager after giving effect to breakpoints and waivers, if any (the “Actual Management Fee”), in light of the nature, extent and quality of the management, advisory and sub-advisory services provided by the Manager, the Adviser and the Subadvisers, respectively. The Board also considered that fee waiver and/or expense reimbursement arrangements are currently in place for the Fund. The Board also noted that the compensation paid to the Adviser and the Subadvisers is the responsibility and expense of the Manager or Western Asset, not the Fund. The Board noted that the controlled foreign corporation for the Fund does not pay a separate management fee to the Adviser.
| | | | |
| 52 | | | | Franklin Strategic Real Return Fund |
The Board received and considered information provided by Broadridge comparing the Contractual Management Fee and the Actual Management Fee and the Fund’s total actual expenses with those of funds in both the relevant expense group and a broader group of funds, each selected by Broadridge based on classifications provided by Lipper. It was noted that while the Board found the Broadridge data generally useful, they recognized its limitations, including that the data may vary depending on the selection of the peer group. The Board also reviewed information regarding fees charged by the Manager, the Adviser and/or the Subadvisers to other U.S. clients investing primarily in an asset class similar to that of the Fund, noting that there were none.
The Manager reviewed with the Board the differences in services provided to these different types of accounts, noting that the Fund is provided with certain administrative services, office facilities, and Fund officers (including the Fund’s chief executive, chief financial and chief compliance officers), and that the Manager coordinates and oversees the provision of services to the Fund by other Fund service providers. The Board considered the fee comparisons in light of the differences in management of these different types of accounts, and the differences in the degree of entrepreneurial and other risks borne by the Manager in managing the Fund and in managing other types of accounts.
The Board considered the overall management fee, the fees of each of the Adviser and the Subadvisers and the amount of the management fee retained by the Manager after payment of the advisory fee and the subadvisory fees, in each case in light of the services rendered for those amounts. The Board also received an analysis of complex-wide management fees provided by the Manager, which, among other things, set out a framework of fees based on asset classes.
The Board also received and considered information comparing the Fund’s Contractual Management Fee and Actual Management Fee as well as its actual total expense ratio with those of a group of funds consisting of ten real return funds (including the Fund) selected by Broadridge to be comparable to the Fund (the “Expense Group”), and a broader group of funds selected by Broadridge consisting of real return funds (including the Fund) (the “Expense Universe”). This information showed that the Fund’s Contractual Management Fee was approximately equivalent to the median of management fees payable by the funds in the Expense Group and that the Fund’s Actual Management Fee was below the median of management fees paid by the funds in the Expense Group and below the median of management fees paid by the funds in the Expense Universe. This information also showed that the Fund’s actual total expense ratio was above the median of the total expense ratios of the funds in the Expense Group and above the median of the actual total expense ratios of the funds in the Expense Universe. The Board took into account management’s discussion of the Fund’s expenses and noted the limited size of the Expense Group. The Board also considered that the current limitation on the Fund’s expenses is expected to continue until and expire on December 31, 2024.
| | | | | | |
| Franklin Strategic Real Return Fund | | | | | 53 | |
Board approval of management and subadvisory agreements (unaudited) (cont’d)
Taking all of the above into consideration, as well as the factors identified below, the Board determined that the management fee, the advisory fee and the subadvisory fees for the Fund were reasonable in light of the nature, extent and quality of the services provided to the Fund under the Management Agreement, the Advisory Agreement and the Sub-Advisory Agreements.
Manager profitability
The Board received and considered an analysis of the profitability of the Manager and its affiliates in providing services to the Fund. The Board also received profitability information with respect to the Legg Mason Funds complex as a whole. The Board received information with respect to the Manager’s allocation methodologies used in preparing this profitability data. It was noted that the allocation methodologies had previously been reviewed by an outside consultant. The profitability of the Manager and its affiliates was considered by the Board not excessive in light of the nature, extent and quality of the services provided to the Fund.
Economies of scale
The Board received and discussed information concerning whether the Manager realizes economies of scale with respect to the management of the Fund as the Fund’s assets grow. The Board also noted the size of the Fund.
The Board determined that the management fee structure for the Fund was reasonable.
Other benefits to the manager, the adviser and the subadvisers
The Board considered other benefits received by the Manager, the Adviser, the Subadvisers and their affiliates as a result of their relationship with the Fund, including the opportunity to offer additional products and services to Fund shareholders, including the appointment of an affiliate of the Manager as the transfer agent of the Fund.
In light of the costs of providing investment management and other services to the Fund and the ongoing commitment of the Manager, the Adviser and the Subadvisers to the Fund, the Board considered that the ancillary benefits that the Manager, the Adviser, the Subadvisers and their affiliates received were reasonable.
| | | | |
| 54 | | | | Franklin Strategic Real Return Fund |
Statement regarding liquidity risk management program (unaudited)
Each of the Franklin Templeton and Legg Mason Funds has adopted and implemented a written Liquidity Risk Management Program (the “LRMP”) as required by Rule 22e-4 under the Investment Company Act of 1940 (the “Liquidity Rule”). The LRMP is designed to assess and manage each Fund’s liquidity risk, which is defined as the risk that the Fund could not meet requests to redeem shares issued by the Fund without significant dilution of remaining investors’ interests in the Fund. In accordance with the Liquidity Rule, the LRMP includes policies and procedures that provide for: (1) assessment, management, and review (no less frequently than annually) of each Fund’s liquidity risk; (2) classification of each Fund’s portfolio holdings into one of four liquidity categories (Highly Liquid, Moderately Liquid, Less Liquid, and Illiquid); (3) for Funds that do not primarily hold assets that are Highly Liquid, establishing and maintaining a minimum percentage of the Fund’s net assets in Highly Liquid investments (called a “Highly Liquid Investment Minimum” or “HLIM”); and (4) prohibiting the Fund’s acquisition of Illiquid investments that would result in the Fund holding more than 15% of its net assets in Illiquid assets. The LRMP also requires reporting to the Securities and Exchange Commission (“SEC”) (on a non-public basis) and to the Board if the Fund’s holdings of Illiquid assets exceed 15% of the Fund’s net assets. Funds with HLIMs must have procedures for addressing HLIM shortfalls, including reporting to the Board and, with respect to HLIM shortfalls lasting more than seven consecutive calendar days, reporting to the SEC (on a non-public basis).
The Director of Liquidity Risk within the Investment Risk Management Group (the “IRMG”) is the appointed Administrator of the LRMP. The IRMG maintains the Investment Liquidity Committee (the “ILC”) to provide oversight and administration of policies and procedures governing liquidity risk management for Franklin Templeton and Legg Mason products and portfolios. The ILC includes representatives from Franklin Templeton’s Risk, Trading, Global Compliance, Legal, Investment Compliance, Investment Operations, Valuation Committee, Product Management and Global Product Strategy.
In assessing and managing each Fund’s liquidity risk, the ILC considers, as relevant, a variety of factors, including the Fund’s investment strategy and the liquidity of its portfolio investments during both normal and reasonably foreseeable stressed conditions; its short and long-term cash flow projections; and its cash holdings and access to other funding sources including the Funds’ interfund lending facility and line of credit. Classification of the Fund’s portfolio holdings in the four liquidity categories is based on the number of days it is reasonably expected to take to convert the investment to cash (for Highly Liquid and Moderately Liquid holdings) or sell or dispose of the investment (for Less Liquid and Illiquid investments), in current market conditions without significantly changing the investment’s market value.
Each Fund primarily holds liquid assets that are defined under the Liquidity Rule as “Highly Liquid Investments,” and therefore is not required to establish an HLIM. Highly Liquid
| | | | | | |
| Franklin Strategic Real Return Fund | | | | | 55 | |
Statement regarding liquidity risk management program (unaudited) (cont’d)
Investments are defined as cash and any investment reasonably expected to be convertible to cash in current market conditions in three business days or less without the conversion to cash significantly changing the market value of the investment.
At meetings of the Funds’ Board of Trustees held in May 2023, the Program Administrator provided a written report to the Board addressing the adequacy and effectiveness of the program for the year ended December 31, 2022. The Program Administrator report concluded that (i.) the LRMP, as adopted and implemented, remains reasonably designed to assess and manage each Fund’s liquidity risk; (ii.) the LRMP, including the Highly Liquid Investment Minimum (“HLIM”) where applicable, was implemented and operated effectively to achieve the goal of assessing and managing each Fund’s liquidity risk; and (iii.) each Fund was able to meet requests for redemption without significant dilution of remaining investors’ interests in the Fund.
| | | | |
| 56 | | | | Franklin Strategic Real Return Fund |
Additional information (unaudited)
Information about Trustees and Officers
The business and affairs of Franklin Strategic Real Return Fund (the “Fund”) are conducted by management under the supervision and subject to the direction of its Board of Trustees. The business address of each Trustee is c/o Jane Trust, Franklin Templeton, 280 Park Avenue, 8th Floor, New York, New York 10017.
Information pertaining to the Trustees and officers of the Fund is set forth below. The Statement of Additional Information includes additional information about Trustees and is available, without charge, upon request by calling the Fund at 877-6LM-FUND/656-3863.
| | |
| Independent Trustees† |
|
| Paul R. Ades |
| |
| Year of birth | | 1940 |
| Position(s) with Trust | | Trustee |
| Term of office1 and length of time served2 | | Since 1983 |
| Principal occupation(s) during the past five years | | Paul R. Ades, PLLC (law firm) (since 2000) |
| Number of funds in fund complex overseen by Trustee | | 55 |
| Other board memberships held by Trustee during the past five years | | None |
|
| Andrew L. Breech |
| |
| Year of birth | | 1952 |
| Position(s) with Trust | | Trustee |
| Term of office1 and length of time served2 | | Since 1991 |
| Principal occupation(s) during the past five years | | President, Dealer Operating Control Service, Inc. (automotive retail management) (since 1985) |
| Number of funds in fund complex overseen by Trustee | | 55 |
| Other board memberships held by Trustee during the past five years | | None |
|
| Althea L. Duersten |
| |
| Year of birth | | 1951 |
| Position(s) with Trust | | Trustee and Chair of the Board |
| Term of office1 and length of time served2 | | Since 2014 (Chair of the Board since 2021) |
| Principal occupation(s) during the past five years | | Retired (since 2011); formerly, Chief Investment Officer, North America, JPMorgan Chase (investment bank) and member of JPMorgan Executive Committee (2007 to 2011) |
| Number of funds in fund complex overseen by Trustee | | 55 |
| Other board memberships held by Trustee during the past five years | | Formerly, Non-Executive Director, Rokos Capital Management LLP (2019 to 2020) |
| | | | | | |
| Franklin Strategic Real Return Fund | | | | | 57 | |
Additional information (unaudited) (cont’d)
Information about Trustees and Officers
| | |
| Independent Trustees† (cont’d) |
|
| Stephen R. Gross |
| |
| Year of birth | | 1947 |
| Position(s) with Trust | | Trustee |
| Term of office1 and length of time served2 | | Since 1986 |
| Principal occupation(s) during the past five years | | Chairman Emeritus (since 2011) and formerly, Chairman, HLB Gross Collins, P.C. (accounting and consulting firm) (1979 to 2011); Executive Director of Business Builders Team, LLC (since 2005); Principal, Gross Consulting Group, LLC (since 2011); CEO, Gross Capital Partners, LLC (since 2014); CEO, Trusted CFO Solutions, LLC (since 2011) |
| Number of funds in fund complex overseen by Trustee | | 55 |
| Other board memberships held by Trustee during the past five years | | None |
|
| Susan M. Heilbron |
| |
| Year of birth | | 1945 |
| Position(s) with Trust | | Trustee |
| Term of office1 and length of time served2 | | Since 1991 |
| Principal occupation(s) during the past five years | | Retired; formerly, President, Lacey & Heilbron (communications consulting) (1990 to 2002); General Counsel and Executive Vice President, The Trump Organization (1986 to 1990); Senior Vice President, New York State Urban Development Corporation (1984 to 1986); Associate, Cravath, Swaine & Moore LLP (1980 to 1984 and 1977 to 1979) |
| Number of funds in fund complex overseen by Trustee | | 55 |
| Other board memberships held by Trustee during the past five years | | None |
|
| Arnold L. Lehman |
| |
| Year of birth | | 1944 |
| Position(s) with Trust | | Trustee |
| Term of office1 and length of time served2 | | Since 1982 |
| Principal occupation(s) during the past five years | | Senior Advisor, Phillips (auction house) (since 2015); formerly, Fellow, Ford Foundation (2015 to 2016); Director of the Brooklyn Museum (1997 to 2015) |
| Number of funds in fund complex overseen by Trustee | | 55 |
| Other board memberships held by Trustee during the past five years | | Trustee of American Federation of Arts (since 2002) |
| | | | |
| 58 | | | | Franklin Strategic Real Return Fund |
| | |
| Independent Trustees† (cont’d) |
| |
| Robin J. W. Masters | | |
| |
| Year of birth | | 1955 |
| Position(s) with Trust | | Trustee |
| Term of office1 and length of time served2 | | Since 2002 |
| Principal occupation(s) during the past five years | | Retired; formerly, Chief Investment Officer of ACE Limited (insurance) (1986 to 2000) |
| Number of funds in fund complex overseen by Trustee | | 55 |
| Other board memberships held by Trustee during the past five years | | Director of HSBC Managed Portfolios Limited and HSBC Specialist Funds Limited (since 2020); formerly, Director of Cheyne Capital International Limited (investment advisory firm) (2005 to 2020); Director/ Trustee of Legg Mason Institutional Funds plc, Western Asset Fixed Income Funds plc and Western Asset Debt Securities Fund plc. (2007 to 2011) |
|
| Ken Miller |
| |
| Year of birth | | 1942 |
| Position(s) with Trust | | Trustee |
| Term of office1 and length of time served2 | | Since 1983 |
| Principal occupation(s) during the past five years | | Retired; formerly, President, Young Stuff Apparel Group, Inc. (apparel manufacturer), division of Li & Fung (1963 to 2012) |
| Number of funds in fund complex overseen by Trustee | | 55 |
| Other board memberships held by Trustee during the past five years | | None |
|
| G. Peter O’Brien |
| |
| Year of birth | | 1945 |
| Position(s) with Trust | | Trustee |
| Term of office1 and length of time served2 | | Since 1999 |
| Principal occupation(s) during the past five years | | Retired, Trustee Emeritus of Colgate University (since 2005); Board Member, Hill House, Inc. (residential home care) (since 1999); formerly, Board Member, Bridges School (pre-school) (2006 to 2017); Managing Director, Equity Capital Markets Group of Merrill Lynch & Co. (1971 to 1999) |
| Number of funds in fund complex overseen by Trustee | | Trustee of Legg Mason funds consisting of 55 portfolios; Director/Trustee of the Royce Family of Funds consisting of 16 portfolios |
| Other board memberships held by Trustee during the past five years | | Formerly, Director of TICC Capital Corp. (2003 to 2017) |
| | | | | | |
| Franklin Strategic Real Return Fund | | | | | 59 | |
Additional information (unaudited) (cont’d)
Information about Trustees and Officers
| | |
| Independent Trustees† (cont’d) |
|
| Thomas F. Schlafly |
| |
| Year of birth | | 1948 |
| Position(s) with Trust | | Trustee |
| Term of office1 and length of time served2 | | Since 1983 |
| Principal occupation(s) during the past five years | | Chairman, The Saint Louis Brewery, LLC (brewery) (since 2012); formerly, President, The Saint Louis Brewery, Inc. (1989 to 2012); Senior Counsel (since 2017) and formerly, Partner (2009 to 2016), Thompson Coburn LLP (law firm) |
| Number of funds in fund complex overseen by Trustee | | 55 |
| Other board memberships held by Trustee during the past five years | | Director, CNB St. Louis Bank (since 2020); formerly, Director, Citizens National Bank of Greater St. Louis (2006 to 2020) |
| | |
| Interested Trustee and Officer |
|
| Jane Trust, CFA3 |
| |
| Year of birth | | 1962 |
| Position(s) with Trust | | Trustee, President and Chief Executive Officer |
| Term of office1 and length of time served2 | | Since 2015 |
| Principal occupation(s) during the past five years | | Senior Vice President, Fund Board Management, Franklin Templeton (since 2020); Officer and/or Trustee/Director of 124 funds associated with LMPFA or its affiliates (since 2015); President and Chief Executive Officer of LMPFA (since 2015); formerly, Senior Managing Director (2018 to 2020) and Managing Director (2016 to 2018) of Legg Mason & Co., LLC (“Legg Mason & Co.”); and Senior Vice President of LMPFA (2015) |
| Number of funds in fund complex overseen by Trustee | | 124 |
| Other board memberships held by Trustee during the past five years | | None |
| | |
| Additional Officers |
|
Ted P. Becker
Franklin Templeton 280 Park Avenue, 8th Floor, New York, NY 10017 |
| |
| Year of birth | | 1951 |
| Position(s) with Trust | | Chief Compliance Officer |
| Term of office1 and length of time served2 | | Since 2007 |
| Principal occupation(s) during the past five years | | Vice President, Global Compliance of Franklin Templeton (since 2020); Chief Compliance Officer of LMPFA (since 2006); Chief Compliance Officer of certain funds associated with Legg Mason & Co. or its affiliates (since 2006); formerly, Director of Global Compliance at Legg Mason, Inc. (2006 to 2020); Managing Director of Compliance of Legg Mason & Co. (2005 to 2020) |
| | | | |
| 60 | | | | Franklin Strategic Real Return Fund |
| | |
| Additional Officers (cont’d) |
|
Susan Kerr Franklin Templeton 280 Park Avenue, 8th Floor, New York, NY 10017 |
| |
| Year of birth | | 1949 |
| Position(s) with Trust | | Chief Anti-Money Laundering Compliance Officer |
| Term of office1 and length of time served2 | | Since 2013 |
| Principal occupation(s) during the past five years | | Senior Compliance Analyst, Franklin Templeton (since 2020); Chief Anti-Money Laundering Compliance Officer of certain funds associated with Legg Mason & Co. or its affiliates (since 2013) and Anti-Money Laundering Compliance Officer (since 2012), Senior Compliance Officer (since 2011) and Assistant Vice President (since 2010) of Franklin Distributors, LLC; formerly, Assistant Vice President of Legg Mason & Co. (2010 to 2020) |
|
Marc A. De Oliveira Franklin Templeton 100 First Stamford Place, 6th Floor, Stamford, CT 06902 |
| |
| Year of birth | | 1971 |
| Position(s) with Trust | | Secretary and Chief Legal Officer |
| Term of office1 and length of time served2 | | Since 2020 |
| Principal occupation(s) during the past five years | | Associate General Counsel of Franklin Templeton (since 2020); Assistant Secretary of certain funds associated with Legg Mason & Co. or its affiliates (since 2006); formerly, Managing Director (2016 to 2020) and Associate General Counsel of Legg Mason & Co. (2005 to 2020) |
|
Thomas C. Mandia
Franklin Templeton 100 First Stamford Place, 6th Floor, Stamford, CT 06902 |
| |
| Year of birth | | 1962 |
| Position(s) with Trust | | Senior Vice President |
| Term of office1 and length of time served2 | | Since 2020 |
| Principal occupation(s) during the past five years | | Senior Associate General Counsel of Franklin Templeton (since 2020); Secretary of LMPFA (since 2006); Assistant Secretary of certain funds associated with Legg Mason & Co. or its affiliates (since 2006); Secretary of LM Asset Services, LLC (“LMAS”) (since 2002) and Legg Mason Fund Asset Management, Inc. (“LMFAM”) (since 2013) (formerly registered investment advisers); formerly, Managing Director and Deputy General Counsel of Legg Mason & Co. (2005 to 2020) |
| | | | | | |
| Franklin Strategic Real Return Fund | | | | | 61 | |
Additional information (unaudited) (cont’d)
Information about Trustees and Officers
| | |
| Additional Officers (cont’d) |
|
Christopher Berarducci Franklin Templeton 280 Park Avenue, 8th Floor, New York, NY 10017 |
| |
| Year of birth | | 1974 |
| Position(s) with Trust | | Treasurer and Principal Financial Officer |
| Term of office1 and length of time served2 | | Since 2010 and 2019 |
| Principal occupation(s) during the past five years | | Vice President, Fund Administration and Reporting, Franklin Templeton (since 2020); Treasurer (since 2010) and Principal Financial Officer (since 2019) of certain funds associated with Legg Mason & Co. or its affiliates; formerly, Managing Director (2020), Director (2015 to 2020), and Vice President (2011 to 2015) of Legg Mason & Co. |
|
Jeanne M. Kelly Franklin Templeton 280 Park Avenue, 8th Floor, New York, NY 10017 |
| |
| Year of birth | | 1951 |
| Position(s) with Trust | | Senior Vice President |
| Term of office1 and length of time served2 | | Since 2007 |
| Principal occupation(s) during the past five years | | U.S. Fund Board Team Manager, Franklin Templeton (since 2020); Senior Vice President of certain funds associated with Legg Mason & Co. or its affiliates (since 2007); Senior Vice President of LMPFA (since 2006); President and Chief Executive Officer of LMAS and LMFAM (since 2015); formerly, Managing Director of Legg Mason & Co. (2005 to 2020); Senior Vice President of LMFAM (2013 to 2015) |
| † | Trustees who are not “interested persons” of the Fund within the meaning of Section 2(a)(19) of the Investment Company Act of 1940, as amended (the “1940 Act”). |
| 1 | Each Trustee and officer serves until his or her respective successor has been duly elected and qualified or until his or her earlier death, resignation, retirement or removal. |
| 2 | Indicates the earliest year in which the Trustee became a board member for a fund in the Legg Mason fund complex or the officer took such office. |
| 3 | Ms. Trust is an “interested person” of the Fund, as defined in the 1940 Act, because of her position with LMPFA and/or certain of its affiliates. |
| | | | |
| 62 | | | | Franklin Strategic Real Return Fund |
Important tax information (unaudited)
By mid-February, tax information related to a shareholder’s proportionate share of distributions paid during the preceding calendar year will be received, if applicable. Please also refer to www.franklintempleton.com for per share tax information related to any distributions paid during the preceding calendar year. Shareholders are advised to consult with their tax advisors for further information on the treatment of these amounts on their tax returns.
The following tax information for the Fund is required to be furnished to shareholders with respect to income earned and distributions paid during its fiscal year.
The Fund hereby reports the following amounts, or if subsequently determined to be different, the maximum allowable amounts, for the fiscal year ended September 30, 2023:
| | | | | | | | |
| | | Pursuant to: | | | Amount Reported | |
| Long-Term Capital Gain Dividends Distributed | | | §852(b)(3)(C) | | | | $6,956,187 | |
| Income Eligible for Dividends Received Deduction (DRD) | | | §854(b)(1)(A) | | | | $212,621 | |
| Qualified Dividend Income Earned (QDI) | | | §854(b)(1)(B) | | | | $541,268 | |
| Qualified Net Interest Income (QII) | | | §871(k)(1)(C) | | | | $1,224,736 | |
| Qualified Business Income Dividends Earned | | | §199A | | | | $254,861 | |
| Section 163(j) Interest Earned | | | §163(j) | | | | $1,577,533 | |
| Interest Earned from Federal Obligations | | | Note (1) | | | | $1,483,119 | |
Note (1) - The law varies in each state as to whether and what percentage of dividend income attributable to Federal obligations is exempt from state income tax. Shareholders are advised to consult with their tax advisors to determine if any portion of the dividends received is exempt from state income taxes.
| | | | | | |
| Franklin Strategic Real Return Fund | | | | | 63 | |
Franklin
Strategic Real Return Fund
Trustees
Paul R. Ades
Andrew L. Breech
Althea L. Duersten
Chair
Stephen R. Gross
Susan M. Heilbron
Arnold L. Lehman
Robin J. W. Masters
Ken Miller
G. Peter O’Brien
Thomas F. Schlafly
Jane Trust
Investment manager
Legg Mason Partners Fund Advisor, LLC
Investment adviser
Franklin Advisers, Inc.
Subadvisers
Franklin Advisers, Inc.
ClearBridge Investments, LLC
Western Asset Management Company, LLC
Western Asset Management Company
Limited
Western Asset Management Company
Ltd
Distributor
Franklin Distributors, LLC
Custodian
The Bank of New York Mellon
Transfer agent
Franklin Templeton Investor
Services, LLC
3344 Quality Drive
Rancho Cordova, CA 95670-7313
Independent registered public accounting firm
PricewaterhouseCoopers LLP
Baltimore, MD
Franklin Strategic Real Return Fund
The Fund is a separate investment series of Legg Mason Global Asset Management Trust, a Maryland statutory trust.
Franklin Strategic Real Return Fund
Legg Mason Funds
100 International Drive
Baltimore, MD 21202
The Fund files its complete schedule of portfolio holdings with the Securities and Exchange Commission (“SEC”) for the first and third quarters of each fiscal year as an exhibit to its reports on Form N-PORT. The Fund’s Forms N-PORT are available on the SEC’s website at www.sec.gov. To obtain information on Form N-PORT, shareholders can call the Fund at 877-6LM-FUND/656-3863.
Information on how the Fund voted proxies relating to portfolio securities during the prior 12-month period ended June 30th of each year and a description of the policies and procedures that the Fund uses to determine how to vote proxies related to portfolio transactions are available (1) without charge, upon request, by calling the Fund at 877-6LM-FUND/656-3863, (2) at www.franklintempleton.com and (3) on the SEC’s website at www.sec.gov.
This report is submitted for the general information of the shareholders of Franklin Strategic Real Return Fund. This report is not authorized for distribution to prospective investors in the Fund unless preceded or accompanied by a current prospectus.
Investors should consider the Fund’s investment objectives, risks, charges and expenses carefully before investing. The prospectus contains this and other important information about the Fund. Please read the prospectus carefully before investing.
www.franklintempleton.com
© 2023 Franklin Distributors, LLC,
Member FINRA/SIPC. All rights reserved.
Legg Mason Funds Privacy and Security Notice
Your Privacy Is Our Priority
Franklin Templeton* is committed to safeguarding your personal information. This notice is designed to provide you with a summary of the non-public personal information Franklin Templeton may collect and maintain about current or former individual investors; our policy regarding the use of that information; and the measures we take to safeguard the information. We do not sell individual investors’ non-public personal information to anyone and only share it as described in this notice.
Information We Collect
When you invest with us, you provide us with your non-public personal information. We collect and use this information to service your accounts and respond to your requests. The non-public personal information we may collect falls into the following categories:
| • | | Information we receive from you or your financial intermediary on applications or other forms, whether we receive the form in writing or electronically. For example, this information may include your name, address, tax identification number, birth date, investment selection, beneficiary information, and your personal bank account information and/or email address if you have provided that information. |
| • | | Information about your transactions and account history with us, or with other companies that are part of Franklin Templeton, including transactions you request on our website or in our app. This category also includes your communications to us concerning your investments. |
| • | | Information we receive from third parties (for example, to update your address if you move, obtain or verify your email address or obtain additional information to verify your identity). |
| • | | Information collected from you online, such as your IP address or device ID and data gathered from your browsing activity and location. (For example, we may use cookies to collect device and browser information so our website recognizes your online preferences and device information.) Our website contains more information about cookies and similar technologies and ways you may limit them. |
| • | | Other general information that we may obtain about you such as demographic information. |
Disclosure Policy
To better service your accounts and process transactions or services you requested, we may share non-public personal information with other Franklin Templeton companies. From time to time we may also send you information about products/services offered by other Franklin Templeton companies although we will not share your non-public personal information with these companies without first offering you the opportunity to prevent that sharing.
We will only share non-public personal information with outside parties in the limited circumstances permitted by law. For example, this includes situations where we need to share information with companies who work on our behalf to service or maintain your account or process transactions you requested, when the disclosure is to companies assisting us with our own marketing efforts, when the disclosure is to a party representing you, or when required by law (for example, in response to legal process). Additionally, we will ensure that any outside
|
| NOT PART OF THE ANNUAL REPORT |
Legg Mason Funds Privacy and Security Notice (cont’d)
companies working on our behalf, or with whom we have joint marketing agreements, are under contractual obligations to protect the confidentiality of your information, and to use it only to provide the services we asked them to perform.
Confidentiality and Security
Our employees are required to follow procedures with respect to maintaining the confidentiality of our investors’ non-public personal information. Additionally, we maintain physical, electronic and procedural safeguards to protect the information. This includes performing ongoing evaluations of our systems containing investor information and making changes when appropriate.
At all times, you may view our current privacy notice on our website at franklintempleton.com or contact us for a copy at (800) 632-2301.
*For purposes of this privacy notice Franklin Templeton shall refer to the following entities:
Fiduciary Trust International of the South (FTIOS), as custodian for individual retirement plans Franklin Advisers, Inc.
Franklin Distributors, LLC, including as program manager of the Franklin Templeton 529 College Savings Plan and the NJBEST 529 College Savings Plan
Franklin Mutual Advisers, LLC
Franklin, Templeton and Mutual Series Funds
Franklin Templeton Institutional, LLC
Franklin Templeton Investments Corp., Canada
Franklin Templeton Investments Management, Limited UK
Franklin Templeton Portfolio Advisors, Inc.
Legg Mason Funds serviced by Franklin Templeton Investor Services, LLC
Templeton Asset Management, Limited
Templeton Global Advisors, Limited
Templeton Investment Counsel, LLC
If you are a customer of other Franklin Templeton affiliates and you receive notices from them, you will need to read those notices separately.
|
| NOT PART OF THE ANNUAL REPORT |
www.franklintempleton.com
© 2023 Franklin Distributors, LLC, Member FINRA/SIPC. All rights reserved.
LMFX013120 11/23 SR23-4759
The registrant has adopted a code of ethics that applies to the registrant’s principal executive officer, principal financial officer, principal accounting officer or controller.
| ITEM 3. | AUDIT COMMITTEE FINANCIAL EXPERT. |
The Board of Trustees of the registrant has determined that Stephen R. Gross possesses the technical attributes identified in Instruction 2(b) of Item 3 to Form N-CSR to qualify as an “audit committee financial expert,” and has designated Stephen R. Gross as the Audit Committee’s financial expert. Stephen R. Gross is an “independent” Trustees pursuant to paragraph (a)(2) of Item 3 to Form N-CSR.
| ITEM 4. | PRINCIPAL ACCOUNTANT FEES AND SERVICES. |
(a) Audit Fees. The aggregate fees billed in the last two fiscal years ending September 30, 2022 and September 30, 2023 (the “Reporting Periods”) for professional services rendered by the Registrant’s principal accountant (the “Auditor”) for the audit of the Registrant’s annual financial statements, or services that are normally provided by the Auditor in connection with the statutory and regulatory filings or engagements for the Reporting Periods, were $279,112 in September 30, 2022 and $248,591 in September 30, 2023.
(b) Audit-Related Fees. The aggregate fees billed in the Reporting Period for assurance and related services by the Auditor that are reasonably related to the performance of the Registrant’s financial statements were $0 in September 30, 2022 and $0 in September 30, 2023.
(c) Tax Fees. The aggregate fees billed in the Reporting Periods for professional services rendered by the Auditor for tax compliance, tax advice and tax planning (“Tax Services”) were $70,500 in September 30, 2022 and $60,750 in September 30, 2023. These services consisted of (i) review or preparation of U.S. federal, state, local and excise tax returns; (ii) U.S. federal, state and local tax planning, advice and assistance regarding statutory, regulatory or administrative developments, and (iii) tax advice regarding tax qualification matters and/or treatment of various financial instruments held or proposed to be acquired or held.
There were no fees billed for tax services by to the service affiliates during the Reporting Periods that required pre-approval by the Audit Auditors Committee.
(d) All Other Fees. The aggregate fees for other fees billed in the Reporting Periods for products and services provided by the Auditor were $0 in September 30, 2022 and $0 in September 30, 2023, other than the services reported in paragraphs (a) through (c) of this item for the Legg Mason Global Asset Management Trust.
All Other Fees. There were no other non-audit services rendered by the Auditor to Legg Mason Partners Fund Advisors, LLC (“LMPFA”), and any entity controlling, controlled by or under common control with LMPFA that provided ongoing services to Legg Mason Global Asset Management Trust requiring pre-approval by the Audit Committee in the Reporting Period.
(e) Audit Committee’s pre–approval policies and procedures described in paragraph (c) (7) of Rule 2-01 of Regulation S-X.
(1) The Charter for the Audit Committee (the “Committee”) of the Board of each registered investment company (the “Fund”) advised by LMPFA or one of their affiliates (each, an “Adviser”) requires that the Committee shall approve (a) all audit and permissible non-audit services to be provided to the Fund and (b) all permissible non-audit services to be provided by the Fund’s independent auditors to the Adviser and any Covered Service Providers if the engagement relates directly to the operations and financial reporting of the Fund. The Committee may implement policies and procedures by which such services are approved other than by the full Committee.
The Committee shall not approve non-audit services that the Committee believes may impair the independence of the auditors. As of the date of the approval of this Audit Committee Charter, permissible non-audit services include any professional services (including tax services), that are not prohibited services as described below, provided to the Fund by the independent auditors, other than those provided to the Fund in connection with an audit or a review of the financial statements of the Fund. Permissible non-audit services may not include: (i) bookkeeping or other services related to the accounting records or financial statements of the Fund; (ii) financial information systems design and implementation; (iii) appraisal or valuation services, fairness opinions or contribution-in-kind reports; (iv) actuarial services; (v) internal audit outsourcing services; (vi) management functions or human resources; (vii) broker or dealer, investment adviser or investment banking services; (viii) legal services and expert services unrelated to the audit; and (ix) any other service the Public Company Accounting Oversight Board determines, by regulation, is impermissible.
Pre-approval by the Committee of any permissible non-audit services is not required so long as: (i) the aggregate amount of all such permissible non-audit services provided to the Fund, the Adviser and any service providers controlling, controlled by or under common control with the Adviser that provide ongoing services to the Fund (“Covered Service Providers”) constitutes not more than 5% of the total amount of revenues paid to the independent auditors during the fiscal year in which the permissible non-audit services are provided to (a) the Fund, (b) the Adviser and (c) any entity controlling, controlled by or under common control with the Adviser that provides ongoing services to the Fund during the fiscal year in which the services are provided that would have to be approved by the Committee; (ii) the permissible non-audit services were not recognized by the Fund at the time of the engagement to be non-audit services; and (iii) such services are promptly brought to the attention of the Committee and approved by the Committee (or its delegate(s)) prior to the completion of the audit.
(2) None of the services described in paragraphs (b) through (d) of this Item were performed in reliance on paragraph (c)(7)(i)(C) of Rule 2-01 of Regulation S-X.
(f) Not applicable.
(g) Non-audit fees billed by the Auditor for services rendered to Legg Mason Global Asset Management Trust, LMPFA and any entity controlling, controlled by, or under common control with LMPFA that provides ongoing services to Legg Mason Global Asset Management Trust during the reporting period were $1,253,103 in September 30, 2022 and $1,161,270 in September 30, 2023.
(h) Yes. Legg Mason Global Asset Management Trust’s Audit Committee has considered whether the provision of non-audit services that were rendered to Service Affiliates, which were not pre-approved (not requiring pre-approval), is compatible with maintaining the Accountant’s independence. All services provided by the Auditor to the Legg Mason Global Asset Management Trust or to Service Affiliates, which were required to be pre-approved, were pre-approved as required.
(i) Not applicable.
(j) Not applicable.
| ITEM 5. | AUDIT COMMITTEE OF LISTED REGISTRANTS. |
| | a) | The independent board members are acting as the registrant’s audit committee as specified in Section 3(a)(58)(B) of the Exchange Act. The Audit Committee consists of the following Board members: |
Paul R. Ades
Andrew L. Breech
Althea L. Duersten
Stephen R. Gross
Susan M. Heilbron
Arnold L. Lehman
Robin J. W. Masters
Ken Miller
G. Peter O’Brien
Thomas F. Schlafly
| ITEM 6. | SCHEDULE OF INVESTMENTS. |
Included herein under Item 1.
| ITEM 7. | DISCLOSURE OF PROXY VOTING POLICIES AND PROCEDURES FOR CLOSED-END MANAGEMENT INVESTMENT COMPANIES. |
Not applicable.
| ITEM 8. | PORTFOLIO MANAGERS OF CLOSED-END MANAGEMENT INVESTMENT COMPANIES. |
Not applicable.
| ITEM 9. | PURCHASES OF EQUITY SECURITIES BY CLOSED-END MANAGEMENT INVESTMENT COMPANY AND AFFILIATED PURCHASERS. |
Not applicable.
| ITEM 10. | SUBMISSION OF MATTERS TO A VOTE OF SECURITY HOLDERS. |
Not applicable.
| ITEM 11. | CONTROLS AND PROCEDURES. |
| | (a) | The registrant’s principal executive officer and principal financial officer have concluded that the registrant’s disclosure controls and procedures (as defined in Rule 30a- 3(c) under the Investment Company Act of 1940, as amended (the “1940 Act”)) are effective as of a date within 90 days of the filing date of this report that includes the disclosure required by this paragraph, based on their evaluation of the disclosure controls and procedures required by Rule 30a-3(b) under the 1940 Act and 15d-15(b) under the Securities Exchange Act of 1934. |
| | (b) | There were no changes in the registrant’s internal control over financial reporting (as defined in Rule 30a-3(d) under the 1940 Act) that occurred during the period covered by this report that have materially affected, or are likely to materially affect the registrant’s internal control over financial reporting. |
| ITEM 12. | DISCLOSURE OF SECURITIES LENDING ACTIVITIES FOR CLOSED-END MANAGEMENT INVESTMENT COMPANIES. |
Not applicable.
(a) (1) Code of Ethics attached hereto.
Exhibit 99.CODE ETH
(a) (2) Certifications pursuant to section 302 of the Sarbanes-Oxley Act of 2002 attached hereto.
Exhibit 99.CERT
(b) Certifications pursuant to Section 906 of the Sarbanes-Oxley Act of 2002 attached hereto.
Exhibit 99.906CERT
SIGNATURES
Pursuant to the requirements of the Securities Exchange Act of 1934 and the Investment Company Act of 1940, the registrant has duly caused this Report to be signed on its behalf by the undersigned, there unto duly authorized.
| | |
| Legg Mason Global Asset Management Trust |
| |
| By: | | /s/ Jane Trust |
| | Jane Trust |
| | Chief Executive Officer |
| |
| Date: | | November 28, 2023 |
Pursuant to the requirements of the Securities Exchange Act of 1934 and the Investment Company Act of 1940, this report has been signed below by the following persons on behalf of the registrant and in the capacities and on the dates indicated.
| | |
| By: | | /s/ Jane Trust |
| | Jane Trust |
| | Chief Executive Officer |
| |
| Date: | | November 28, 2023 |
| |
| By: | | /s/ Christopher Berarducci |
| | Christopher Berarducci |
| | Principal Financial Officer |
| |
| Date: | | November 28, 2023 |