UNITED STATES
SECURITIES AND EXCHANGE COMMISSION
Washington, D.C. 20549
FORM N-CSR
Certified Shareholder Report of
Registered Management Investment Companies
Investment Company Act File Number: 811-22349
Capital Private Client Services Funds
(Exact Name of Registrant as Specified in Charter)
6455 Irvine Center Drive
Irvine, California 92618
(Address of Principal Executive Offices)
Registrant's telephone number, including area code: (949) 975-5000
Date of fiscal year end: October 31
Date of reporting period: October 31, 2012
Courtney R. Taylor
Capital Private Client Services Funds
6455 Irvine Center Drive
Irvine, California 92618
(Name and Address of Agent for Service)
Copies to:
Michael Glazer
Bingham McCutchen LLP
355 South Grand Avenue, Suite 4400
Los Angeles, California 90071
(Counsel for the Registrant)
ITEM 1 – Reports to Stockholders

Annual
report
October 31, 2012
Capital Core Municipal Fund
Capital Short-Term Municipal Fund
Capital California Core Municipal Fund
Capital California Short-Term Municipal Fund
Capital Core Bond Fund
Capital Global Equity Fund
Capital Non-U.S. Equity Fund
Capital U.S. Equity Fund
| Capital Private Client Services Funds | |
| Investment Adviser’s Report | |
| October 31, 2012 (unaudited) | |
Dear Shareholder:
Financial markets around the world posted strong gains over the past 12 months, despite lingering uncertainties surrounding such macroeconomic issues as the outlook for U.S. economic growth, slowing demand from China, and ongoing efforts to resolve the European sovereign debt crisis.
Accommodative monetary policies also had a positive influence—particularly in the latter half of the period. The launch of a third round of quantitative easing by the U.S. Federal Reserve was accompanied by a commitment to keep interest rates low in the U.S. for an extended period of time. This helped to mitigate concerns about the sluggish pace of the recovery, while buoying hopes that the housing market would gain renewed strength. At the same time, the European Central Bank’s decision to buy an unlimited quantity of short-term government bonds eased fears that struggling countries would be forced to exit the European Union.
Although these developments served to quell at least some investor anxieties, a number of risks remain. The ECB’s plan represents a step in the right direction, but the long-term viability of the Eurozone still depends on comprehensive growth initiatives and a commitment to greater fiscal integration from European leaders. What’s more, as we write this letter, the U.S. is still poised to hit a massive fiscal cliff at the end of the calendar year absent legislative intervention, heightening the likelihood of increased volatility leading up to, and perhaps extending beyond, the ultimate resolution.
Despite these uncertainties, equities did well over 12 months ending October 31, 2012, while demand for fixed-income securities also remained robust. The ongoing search for better yields in today’s low-interest-rate environment has particularly benefited U.S. corporate high-yield bonds, although the entire fixed-income market advanced.
Below is a more detailed discussion regarding the investment results of each of the Capital Private Client Services Funds during the covered reporting period:
Equity Commentary
Over the past year, The Capital U.S. Equity Fund rose 10.8%, along with the upward trending overall market. While this result was solid in absolute terms, it lagged the 15.2% return of the Standard & Poor’s 500 Index, largely due to a combination of the fund’s higher cash level and lower relative weighting in telecommunications, utilities and financial stocks, three of the best performing sectors in the index. The Capital Non-U.S. Equity Fund exceeded its benchmark, advancing 7.9% compared to 4.6% for the MSCI EAFE Index. The Capital Global Equity Fund was relatively in line with its benchmark, gaining 9.2% compared to the 9.5% rise for the MSCI World Index.
Portfolio managers took advantage of market fluctuations to make selective changes in the funds. For instance, holdings of Gilead Sciences were increased in the Capital U.S. Equity and Capital Global Equity Funds, reflecting a belief that aging populations are creating a greater need for better and more affordable health care options. Gilead, a leading pharmaceutical company, has been an important contributor to results. The company has received encouraging news as it progresses through clinical trials with its Hepatitis C therapy. Should it get approval, which could come in the next few months, the company is well positioned to become the dominant force in treatment for this disease. Additionally, Gilead is expected to reap continued benefits from its HIV franchise, which has grown at a rapid rate for a number of years.
CME Group, a financial derivatives exchange operator that provides the widest range of benchmark futures and options contracts available on any trading platform, was another addition to both funds. The company is attractively valued, appears to be on the cusp of a volume recovery and has strong prospects for free-cash-flow generation. In the Capital Non-U.S. Equity Fund, holdings of Assa Abloy, a Swedish company that specializes in electronic security solutions, and energy-management company Schneider Electric were increased. Exposure to these companies is the result of portfolio manager interest in the industrial sector where there are attractively-valued companies with cash-rich balance sheets and streamlined operations. We believe such businesses are well-positioned for an eventual pick-up in economic activity.
| Capital Private Client Services Funds | |
| Investment Adviser’s Report | |
| October 31, 2012 (unaudited) | |
Mining company Barrick Gold, which has been hurt by lower metal prices and rising costs, detracted from the results of all three funds. Allegheny Technologies, a specialty metals producer, also had a negative impact on the Capital U.S. Equity and Capital Global Equity Funds. Prices of the company’s core product, stainless steel, weakened amid sluggish global growth. Delayed production of Boeing’s Dreamliner aircraft, which features specialty titanium from Allegheny, also pressured shares.
Fixed-Income Commentary
The uncertain environment broadly helped fixed-income securities over the past 12 months. Investors ventured further out on the credit spectrum, and securities perceived as holding higher risk outperformed so-called safe-haven assets. The Federal Reserve’s decision to purchase agency mortgage-backed bonds fueled a rally in these securities benefiting our taxable accounts, which get roughly 20% of their duration from mortgage-backed securities.
The Capital Core Bond, Capital Core Municipal, Capital Short-Term Municipal, Capital California Core Municipal and Capital California Short-Term Municipal funds all rose during the period, up 3.9%, 5.5%, 2.6%, 6.0% and 3.0%, respectively. Each of these funds also outpaced their individual benchmarks.
Municipal bonds did well despite recent well-publicized bankruptcies by some high-profile U.S. cities. These cases affirmed our long-standing belief that extensive research and exhaustive analysis are the most effective protection against troubled issuers. In the municipal funds, we continue to favor revenue-backed bonds with easily identifiable revenue sources.
Stimulative measures from the Federal Reserve could increase inflationary pressures, though most members of your portfolio management team believe there is sufficient unused capacity in the economy for inflation to remain low in the near term. Nevertheless, managers are vigilant in monitoring the macroeconomic picture in an effort to position the portfolio to withstand an increase in interest rates.
We will continue to construct portfolios in a manner that focuses on capital preservation and risk mitigation. As a hedge against unexpected inflation, managers have increased holdings of Treasury Inflation-Protected Securities in the municipal funds. In the Capital Core Bond Fund managers boosted positions in mortgage-backed securities, which are expected to continue to benefit from the Fed’s latest quantitative easing measures.
As ever, your portfolio management team will continue to closely monitor the yield curve, actively managing credit exposure and carefully controlling duration in an effort to generate return at a modest risk level.
We appreciate the continued trust and confidence you have placed in us to manage your assets. We look forward to reporting to you again in six months.
Sincerely yours,


| John B. Emerson | Shelby Notkin | John R. Queen |
| President | Equity Portfolio Manager | Fixed-Income Portfolio Manager |
| Capital Core Municipal Fund | |
| October 31, 2012 | |
Growth of $25,000 investment
Here’s how a $25,000 investment in the Capital Core Municipal Fund grew between April 13, 2010, when the fund began operations, and October 31, 2012, the end of the fund’s fiscal year.
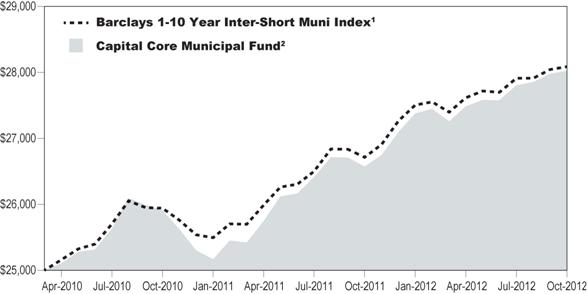
1 The index is unmanaged, and its results include reinvested distributions but do not reflect the effect of sales
charges, commissions, or expenses.
2 Includes reinvested dividends and capital gain distributions.
Results are for past periods and are not predictive of results for future periods. Current and future results may be lower or higher than those shown. Share price and returns will vary so investors may lose money. The results shown are before taxes on fund distributions and sale of fund shares.
Investment portfolio – quality ratings*
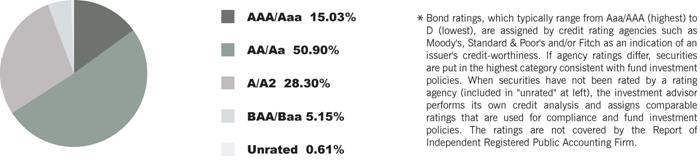
Capital Core Municipal Fund
Schedule of Investments
at October 31, 2012
| Principal amount (000) | Market value (000) | Percent of net assets | ||||||
| Bonds & notes - 97.80% | ||||||||
| Alabama - 2.82% | ||||||||
| Alabama 21st Century Auth., Rev. Ref. Bonds, Series A, 5.00%, 06/01/21 | $ | 1,230 | $ | 1,497 | 0.51 | % | ||
| Alabama Public School & College Auth., Sales Tax Rev. Ref. Bonds, Series A: | ||||||||
| 5.00%, 05/01/15 | 1,000 | 1,111 | 0.38 | |||||
| 5.00%, 05/01/17 | 1,000 | 1,182 | 0.41 | |||||
| Courtland Ind. Dev. Board, Ind. Rev. Ref. Bonds, Series A, 5.00%, 11/01/13 | 2,000 | 2,080 | 0.71 | |||||
| Mobile Ind. Dev. Board, Ind. Imps. Rev. Bonds (Mandatory Put 03/19/15 @ 100), 5.00%, 06/01/341 | 2,000 | 2,190 | 0.75 | |||||
| Univ. of Alabama, Health Care Facs. Rev. Ref. Bonds, Series A, 5.00%, 09/01/18 | 150 | 174 | 0.06 | |||||
| 8,234 | 2.82 | |||||||
| Alaska - 0.36% | ||||||||
| Alaska Housing Fin. Corp., Rev. Bonds, Series A, 4.00%, 06/01/40 | 1,000 | 1,058 | 0.36 | |||||
| 1,058 | 0.36 | |||||||
| Arizona - 3.62% | ||||||||
| Arizona Health Facs. Auth., Health Care Facs. Imps. Rev. Bonds (Mandatory Put 02/02/15 @ 100), 1.06%, 02/01/421 | 140 | 139 | 0.05 | |||||
| Arizona School Facs. Board, School Imps. Certs. of Part. Lease Rev. Bonds, 5.00%, 09/01/14 | 200 | 217 | 0.08 | |||||
| Glendale Ind. Dev. Auth., College & Univ. Rev. Ref. Bonds, 5.25%, 05/15/18 | 1,000 | 1,159 | 0.40 | |||||
| Phoenix Civic Imp. Corp., Port, Airport, & Marina Rev. Ref. Bonds, Series A: | ||||||||
| 5.00%, 07/01/16 | 1,000 | 1,145 | 0.39 | |||||
| 5.00%, 07/01/20 | 2,800 | 3,431 | 1.17 | |||||
| Phoenix Civic Imp. Corp., Sewer Rev. Ref. Bonds, 5.50%, 07/01/24 | 125 | 153 | 0.05 | |||||
| Phoenix Ind. Dev. Auth., Misc. Purposes Lease Rev. Bonds, 5.00%, 06/01/22 | 1,000 | 1,119 | 0.38 | |||||
| Salt River Project Agricultural Imps. & Power Dist., Energy Res. Auth. Rev. Ref. Bonds, Series B, 5.00%, 12/01/17 | 2,650 | 3,207 | 1.10 | |||||
| 10,570 | 3.62 | |||||||
| California - 7.69% | ||||||||
| Abag Fin. Auth. for Nonprofit Corps., Health Care Facs. Rev. Ref. Bonds (CA Mtg. Ins.), 4.00%, 05/15/16 | 1,500 | 1,514 | 0.52 | |||||
| Abag Fin. Auth. for Nonprofit Corps., Public Imps. Special Tax Ref. Bonds (CIFG Insured), 5.00%, 09/02/21 | 1,000 | 1,088 | 0.37 | |||||
| Anaheim Public Fncg. Auth., Energy Res. Auth. Rev. Ref. Bonds (NATL-RE Insured), 4.00%, 10/01/17 | 100 | 114 | 0.04 | |||||
| Bay Area Toll Auth., Highway Tolls Rev. Ref. Bonds: | ||||||||
| 4.00%, 04/01/20 | 1,200 | 1,413 | 0.48 | |||||
| 5.00%, 04/01/21 | 1,250 | 1,572 | 0.54 | |||||
| Bay Area Toll Auth., Highway Tolls Rev. Ref. Bonds, Series F, 5.00%, 04/01/22 | 125 | 144 | 0.05 | |||||
| California Health Facs. Fncg. Auth., Health Care Facs. Rev. Ref. Bonds, Series A, 5.00%, 11/15/19 | 750 | 906 | 0.31 | |||||
| California Infrastructure & Econ. Dev. Bank, Misc. Rev. Ref. Bonds, Series A-1 (Mandatory Put 04/01/14 @ 100), 0.71%, 04/01/381 | 1,250 | 1,253 | 0.43 | |||||
| California Infrastructure & Econ. Dev. Bank, Rev. Bonds, Series A-2 (Mandatory Put 04/01/14 @ 100), 0.71%, 04/01/381 | 1,700 | 1,705 | 0.58 | |||||
| California State Dept. of Water Ress., Energy Res. Auth. Rev. Ref. Bonds, Series L, 5.00%, 05/01/17 | 2,000 | 2,380 | 0.81 | |||||
| California State Dept. of Water Ress., Water Rev. Ref. Bonds (Escrowed to Maturity) (FGIC Insured), 5.00%, 12/01/12 | 5 | 5 | — | |||||
| California State Public Works Board, Rev. Bonds, Series G, 5.00%, 12/01/20 | 1,000 | 1,250 | 0.43 | |||||
| Principal amount (000) | Market value (000) | Percent of net assets | |||||||
| Bonds & notes—continued | |||||||||
| California—continued | |||||||||
| City & County of San Francisco, Health Care Imps. Certs. of Part. Lease Bonds, Series A, 5.00%, 04/01/17 | $ | 100 | $ | 117 | 0.04 | % | |||
| City of Irvine, Special Assessment Ref. Bonds, 4.00%, 09/02/17 | 1,215 | 1,360 | 0.46 | ||||||
| East Bay Muni. Util. Dist. Rev. Bonds, Series A-1 (Mandatory Put 07/01/14 @ 100), 0.56%, 06/01/251 | 930 | 930 | 0.32 | ||||||
| Los Angeles Dept. of Water & Power, Energy Res. Auth. Rev. Ref. Bonds, Series A, 5.00%, 07/01/18 | 600 | 735 | 0.25 | ||||||
| Los Angeles Unified School Dist., G.O. School Imps. Prop. Tax Bonds, Series I, 5.00%, 07/01/14 | 100 | 108 | 0.04 | ||||||
| Northern California Gas Auth. No. 1, Natural Gas Util. Imps. Rev. Bonds, 0.871%, 07/01/191 | 100 | 91 | 0.03 | ||||||
| Sacramento Muni. Util. Dist., Energy Res. Auth. Rev. Bonds, Series R (NATL-RE Insured), 5.00%, 08/15/17 | 610 | 633 | 0.22 | ||||||
| San Jose Redev. Agcy., Tax Allocation Rev. Ref. Bonds (NATL-RE Insured), 4.54%, 08/01/18 | 200 | 200 | 0.07 | ||||||
| Santa Ana Comm. Redev. Agcy., Tax Allocation Rev. Ref. Bonds, 5.25%, 09/01/19 | 600 | 681 | 0.23 | ||||||
| State of California, G.O. General Fund Ref. Bonds, 5.00%, 02/01/20 | 1,500 | 1,830 | 0.63 | ||||||
| State of California, G.O. General Fund Ref. Notes (NATL-RE Insured), 5.00%, 06/01/15 | 100 | 111 | 0.04 | ||||||
| State of California, G.O. Misc. Rev. Ref. Bonds, 5.00%, 09/01/19 | 1,300 | 1,594 | 0.55 | ||||||
| State of California, G.O. Sales Tax Rev. Bonds, Series A, 5.25%, 07/01/21 | 100 | 124 | 0.04 | ||||||
| State of California, G.O. Sales Tax Rev. Ref. Bonds, Series A, 5.00%, 07/01/20 | 320 | 392 | 0.13 | ||||||
| Tuolumne Wind Project Auth., Energy Res. Auth. Imps. Rev. Bonds, Series A, 5.25%, 01/01/24 | 200 | 231 | 0.08 | ||||||
| 22,481 | 7.69 | ||||||||
| Colorado - 2.88% | |||||||||
| City & County of Denver, Port, Airport & Marina Rev. Ref. Bonds, Series A, 5.25%, 11/15/28 | 200 | 231 | 0.08 | ||||||
| City & County of Denver, Port, Airport & Marina Rev. Ref. Bonds, Series A (NATL-RE FGIC Insured), 5.00%, 11/15/17 | 300 | 345 | 0.12 | ||||||
| Colorado Health Facs. Auth., Health Care Facs. Rev. Ref. Bonds, 5.00%, 11/15/13 | 150 | 157 | 0.05 | ||||||
| Colorado Health Facs. Auth., Health Care Facs. Rev. Ref. Bonds (Pre-refunded with U.S. Treasury Obligations to 11/15/16 @ 100), 5.125%, 11/15/171 | 115 | 136 | 0.05 | ||||||
| Colorado Health Facs. Auth., Health Care Facs. Rev. Ref. Bonds, Series B, 5.00%, 01/01/17 | 2,000 | 2,319 | 0.79 | ||||||
| Regional Trans. Dist., Transit Imps. Cert. of Part. Lease Bonds, Series A, 5.00%, 06/01/18 | 1,000 | 1,173 | 0.40 | ||||||
| State of Colorado, Cash Flow Mgmt. Misc. Rev. Notes, Series A: | |||||||||
| 2.00%, 06/27/13 | 2,400 | 2,428 | 0.83 | ||||||
| 2.50%, 06/27/13 | 1,600 | 1,624 | 0.56 | ||||||
| 8,413 | 2.88 | ||||||||
| District of Columbia - 2.31% | |||||||||
| Dist. of Columbia, Income Tax Secured, Rev. Ref. Bonds, Series E, 0.81%, 12/01/151 | 1,250 | 1,250 | 0.43 | ||||||
| Dist. of Columbia, Water Util. Imps. Rev. Bonds (Mandatory Put 06/01/15 @ 100), 0.69%, 10/01/441 | 2,475 | 2,475 | 0.85 | ||||||
| Metropolitan Washington Airports Auth., Port, Airport & Marina Imps. Rev. Bonds, Series A, 3.50%, 10/01/18 | 2,500 | 2,813 | 0.96 | ||||||
| Principal amount (000) | Market value (000) | Percent of net assets | |||||||
| Bonds & notes—continued | |||||||||
| District of Columbia—continued | |||||||||
| Washington Convention Center Auth., Hotel Occupancy Tax Rev. Bonds, Series A (AMBAC Insured), 5.00%, 10/01/15 | $ | 200 | $ | 222 | 0.07 | % | |||
| 6,760 | 2.31 | ||||||||
| Florida - 13.26% | |||||||||
| Citizens Prop. Insurance Corp., Cash Flow Mgmt. Misc. Rev. Bonds, Series A-1: | |||||||||
| 5.00%, 06/01/16 | 635 | 713 | 0.24 | ||||||
| 5.00%, 06/01/20 | 1,100 | 1,283 | 0.44 | ||||||
| 5.25%, 06/01/17 | 3,100 | 3,549 | 1.21 | ||||||
| 6.00%, 06/01/16 | 300 | 347 | 0.12 | ||||||
| Citizens Prop. Insurance Corp., Misc. Purposes Rev. Bonds, Series A-1, 5.00%, 06/01/19 | 1,500 | 1,742 | 0.60 | ||||||
| City of Cape Coral, Water Rev. Ref. Bonds, 5.00%, 10/01/18 | 1,000 | 1,180 | 0.40 | ||||||
| City of Clearwater, Water Rev. Ref. Bonds, Series B, 5.00%, 12/01/18 | 100 | 121 | 0.04 | ||||||
| City of Fort Lauderdale, Water Util. Imps. Rev. Bonds (NATL-RE Insured), 4.00%, 09/01/16 | 100 | 113 | 0.04 | ||||||
| City of Jacksonville, Sales Tax Rev. Ref. Bonds, 5.00%, 10/01/19 | 1,000 | 1,206 | 0.41 | ||||||
| City of Tampa, Health Care Facs. Rev. Ref. Bonds: | |||||||||
| 5.00%, 11/15/16 | 1,200 | 1,383 | 0.47 | ||||||
| 5.00%, 11/15/17 | 2,000 | 2,358 | 0.81 | ||||||
| County of Broward, Water Util. Imps. Rev. Bonds, Series A, 2.40%, 10/01/14 | 100 | 104 | 0.04 | ||||||
| County of Miami-Dade, Port, Airport & Marina Imps. Rev. Bonds, Series B, 5.00%, 10/01/18 | 1,100 | 1,284 | 0.44 | ||||||
| County of Miami-Dade, Water Rev. Ref. Bonds, Series C, 4.00%, 10/01/13 | 300 | 310 | 0.11 | ||||||
| County of Saint Johns, Water Rev. Ref. Bonds (AGM Insured), 5.00%, 06/01/16 | 100 | 115 | 0.04 | ||||||
| Florida Higher Educ. Facs. Financial Auth., College & Univ. Imps. Rev. Ref. Bonds, 5.00%, 04/01/22 | 1,000 | 1,157 | 0.40 | ||||||
| Florida Housing Fin. Corp., Loc. or GTD Housing Rev. Bonds (GNMA/FNMA/FHLMC Insured), 5.00%, 07/01/28 | 880 | 946 | 0.32 | ||||||
| Florida Housing Fin. Corp., Loc. or GTD Housing Rev. Bonds, Series B, 4.50%, 01/01/29 | 1,260 | 1,359 | 0.47 | ||||||
| Florida Housing Fin. Corp., Loc. or GTD Housing Rev. Bonds, Series B (GNMA/FNMA/FHLMC Insured), 4.50%, 01/01/29 | 645 | 702 | 0.24 | ||||||
| Florida Hurricane Catastrophe Fund Fin. Corp., Misc. Purposes Rev. Bonds, Series A: | |||||||||
| 5.00%, 07/01/14 | 150 | 161 | 0.06 | ||||||
| 5.00%, 07/01/15 | 1,435 | 1,593 | 0.55 | ||||||
| 5.00%, 07/01/16 | 2,100 | 2,381 | 0.81 | ||||||
| Florida Muni. Power Agcy., Misc. Rev. Ref. Bonds, Series A, 5.00%, 10/01/20 | 600 | 735 | 0.25 | ||||||
| Florida State Board of Edu., Misc. Rev. Ref. Bonds, Series E: | |||||||||
| 5.00%, 07/01/15 | 525 | 587 | 0.20 | ||||||
| 5.00%, 07/01/16 | 2,000 | 2,317 | 0.79 | ||||||
| Florida State Dept. of Environmental Protection, Public Imps. Misc. Taxes Rev. Bonds, Series B, 5.00%, 07/01/19 | 1,450 | 1,736 | 0.59 | ||||||
| Florida State Dept. of Trans., Highway Imps. Rev. Bonds, Series B, 5.00%, 07/01/14 | 1,000 | 1,075 | 0.37 | ||||||
| Florida Water Pollution Control Fncg. Corp., Pollution Control Misc. Rev. Bonds, Series A: | |||||||||
| 3.00%, 01/15/14 | 100 | 103 | 0.04 | ||||||
| 5.00%, 01/15/20 | 300 | 365 | 0.13 | ||||||
| 5.00%, 01/15/23 | 300 | 354 | 0.12 | ||||||
| Principal amount (000) | Market value (000) | Percent of net assets | |||||||
| Bonds & notes—continued | |||||||||
| Florida—continued | |||||||||
| Fort Pierce Utils. Auth., Energy Res. Auth. Rev. Ref. Bonds (AMBAC Insured), 5.00%, 10/01/14 | $ | 200 | $ | 208 | 0.07 | % | |||
| JEA, Energy Res. Auth. Imps. Rev. Bonds, 5.50%, 10/01/29 | 200 | 215 | 0.07 | ||||||
| JEA, Water Util. Imps. Rev. Bonds, Series A, 5.00%, 10/01/26 | 200 | 211 | 0.07 | ||||||
| Miami-Dade County Expressway Auth., Highway Tolls Rev. Ref. Bonds (NATL-RE FGIC Insured), 5.125%, 07/01/25 | 1,500 | 1,502 | 0.51 | ||||||
| Miami-Dade County Expressway Auth., Highway Tolls Rev. Ref. Bonds, Series A (Assured GTY Insured): | |||||||||
| 3.00%, 07/01/15 | 425 | 446 | 0.15 | ||||||
| 3.00%, 07/01/16 | 2,050 | 2,173 | 0.74 | ||||||
| Miami-Dade County School Board, School Imps. Certs. of Part. Lease Bonds, Series B (AMBAC Insured), 4.00%, 11/01/15 | 100 | 108 | 0.04 | ||||||
| Orlando Utils. Commission, Multiple Util. Rev. Ref. Bonds, Series C, 5.00%, 10/01/17 | 1,000 | 1,198 | 0.41 | ||||||
| Orlando Utils. Commission, Water Rev. Ref. Bonds, Series B, 5.00%, 10/01/23 | 400 | 480 | 0.16 | ||||||
| South Broward Hospital Dist., Health Care Facs. Rev. Ref. Bonds (NAT-RE Insured), 5.00%, 05/01/21 | 275 | 309 | 0.11 | ||||||
| Tampa Bay Water, Water Rev. Ref. Bonds, Series B, 5.00%, 10/01/18 | 430 | 527 | 0.18 | ||||||
| 38,756 | 13.26 | ||||||||
| Georgia - 3.65% | |||||||||
| Appling County Dev. Auth., Rev. Bonds (Mandatory Put 03/01/13 @ 100), Series A, 2.50%, 01/01/381 | 1,100 | 1,107 | 0.38 | ||||||
| Burke County Dev. Auth., Pollution Control Res. Recovery Rev. Bonds, 7.00%, 01/01/23 | 300 | 358 | 0.12 | ||||||
| City of Atlanta, Port, Airport & Marina Rev. Ref. Bonds, Series C, 5.00%, 01/01/17 | 1,250 | 1,452 | 0.50 | ||||||
| DeKalb County Hospital Auth., Health Care Facs. Imps. Rev. Bonds, 5.25%, 09/01/20 | 2,000 | 2,304 | 0.79 | ||||||
| DeKalb Private Hospital Auth., Health Care Facs. Rev. Ref. Bonds, 5.00%, 11/15/24 | 200 | 229 | 0.08 | ||||||
| Georgia State Road & Tollway Auth., Fuel Sales Tax Rev. Ref. Bonds, Series A, 5.00%, 03/01/16 | 1,100 | 1,266 | 0.43 | ||||||
| Georgia State Road & Tollway Auth., Highway Imps. Misc. Taxes Rev. Bonds, Series A, 5.00%, 06/01/18 | 400 | 487 | 0.17 | ||||||
| Gwinnett County Dev. Auth., Certs. of Part. Lease Ref. Bonds (NATL-RE Insured), 5.00%, 01/01/16 | 100 | 113 | 0.04 | ||||||
| Muni. Electric Auth. of Georgia, Energy Res. Auth. Rev. Ref. Bonds, Series A, 5.00%, 11/01/19 | 1,000 | 1,226 | 0.42 | ||||||
| Muni. Electric Auth. of Georgia, Energy Res. Auth. Rev. Ref. Bonds, Series GG, 5.00%, 01/01/19 | 700 | 845 | 0.29 | ||||||
| Muni. Electric Auth. of Georgia, Energy Res. Auth. Rev. Ref. Bonds, Sub-Series A, 5.00%, 01/01/21 | 500 | 612 | 0.21 | ||||||
| Public Gas Partners Inc., Natural Gas Rev. Ref. Bonds, Series A, 5.00%, 10/01/13 | 100 | 104 | 0.03 | ||||||
| Thomasville Hospital Auth., Health Care Facs. Imps. Rev. Bonds, 3.25%, 11/01/14 | 540 | 560 | 0.19 | ||||||
| 10,663 | 3.65 | ||||||||
| Hawaii - 1.08% | |||||||||
| State of Hawaii, G.O. Prop. Tax Ref. Bonds, Series DT, 5.00%, 11/01/19 | 600 | 752 | 0.26 | ||||||
| State of Hawaii, G.O. Public Imps. Bonds, Series DZ, 5.00%, 12/01/19 | 1,250 | 1,568 | 0.53 | ||||||
| State of Hawaii, Port, Airport & Marina Rev. Ref. Bonds, Series A, 5.00%, 07/01/22 | 700 | 838 | 0.29 | ||||||
| 3,158 | 1.08 | ||||||||
| Principal amount (000) | Market value (000) | Percent of net assets | |||||||
| Bonds & notes—continued | |||||||||
| Illinois - 7.75% | |||||||||
| Chicago Board of Edu., G.O. Prop. Tax Ref. Bonds, Series A (NATL-RE Insured), 5.00%, 12/01/16 | $ | 100 | $ | 109 | 0.04 | % | |||
| City of Chicago, G.O. Prop. Tax Ref. Bonds, Series C, 5.00%, 01/01/21 | 1,545 | 1,865 | 0.64 | ||||||
| City of Chicago, Port, Airport & Marina Imps. Rev. Bonds, Series A, 4.00%, 01/01/17 | 1,675 | 1,874 | 0.64 | ||||||
| City of Chicago, Port, Airport & Marina Imps. Rev. Bonds, Series C (Assured GTY Insured), 5.25%, 01/01/22 | 1,000 | 1,197 | 0.41 | ||||||
| City of Chicago, Sewer Imps. Rev. Bonds, 4.00%, 01/01/21 | 1,000 | 1,153 | 0.39 | ||||||
| County of Cook, G.O. Prop. Tax Ref. Bonds, Series A, 5.25%, 11/15/22 | 2,000 | 2,398 | 0.82 | ||||||
| Illinois Fin. Auth., College & Univ. Imps. Rev. Bonds, 5.00%, 10/01/22 | 200 | 221 | 0.08 | ||||||
| Illinois Fin. Auth., College & Univ. Imps. Rev. Bonds, Series B-2 (Mandatory Put 02/12/15 @ 100), 1.875%, 07/01/361 | 300 | 305 | 0.10 | ||||||
| Illinois Fin. Auth., Health Care Facs. Imps. Rev. Bonds (Mandatory Put 07/01/14 @ 100), 4.375%, 11/15/221 | 170 | 179 | 0.06 | ||||||
| Illinois Fin. Auth., Health Care Facs. Rev. Ref. Bonds, 5.00%, 08/15/15 | 100 | 112 | 0.04 | ||||||
| Illinois Housing Dev. Auth., Housing Rev. Ref. Bonds, Series G: | |||||||||
| 4.10%, 01/01/13 | 70 | 70 | 0.02 | ||||||
| 4.10%, 07/01/13 | 245 | 249 | 0.08 | ||||||
| Illinois State Toll Highway Auth., Highway Imps. Rev. Bonds, Series A (AGM Insured), 5.00%, 01/01/15 | 1,000 | 1,087 | 0.37 | ||||||
| Illinois State Toll Highway Auth., Highway Tolls Rev. Ref. Bonds, Series A, 5.50%, 01/01/15 | 1,950 | 2,128 | 0.73 | ||||||
| Metropolitan Pier & Exposition Auth., Port, Airport & Marina Imps. Hotel Occupancy Tax Rev. Bonds (NATL-RE FGIC Insured), 5.375%, 06/01/13 | 100 | 103 | 0.04 | ||||||
| Railsplitter Tobacco Settlement Auth., Public Imps. Rev. Bonds, 5.50%, 06/01/23 | 1,000 | 1,170 | 0.40 | ||||||
| Regional Trans. Auth. Rev. Ref. Bonds (NATL-RE Insured), 6.00%, 06/01/20 | 2,000 | 2,503 | 0.86 | ||||||
| Regional Trans. Auth., Sales Tax Rev. Ref. Bonds, Series A (AGM G.O. of Auth. Insured), 5.00%, 06/01/18 | 1,200 | 1,439 | 0.49 | ||||||
| Regional Trans. Auth., Sales Tax Transit Imps. Rev. Bonds, Series A (NATL-RE FGIC Insured), 5.50%, 07/01/20 | 1,610 | 2,007 | 0.69 | ||||||
| State of Illinois, G.O. Misc. Rev. Ref. Bonds, Series B, 5.25%, 01/01/21 | 2,000 | 2,358 | 0.81 | ||||||
| Univ. of Illinois, Certs. of Part. Lease Rev. Ref. Bonds, Series A (AGM Insured), 5.25%, 10/01/24 | 100 | 112 | 0.04 | ||||||
| 22,639 | 7.75 | ||||||||
| Indiana - 1.52% | |||||||||
| Indiana Fin. Auth., Health Care Facs. Rev. Ref. Bonds, Series A, 5.50%, 05/01/24 | 100 | 115 | 0.04 | ||||||
| Indiana Fin. Auth., Health Care Facs. Rev. Ref. Bonds, Series B, 5.00%, 02/15/20 | 1,400 | 1,561 | 0.53 | ||||||
| Indiana Fin. Auth., Health Care Facs. Rev. Ref. Bonds, Series N, 5.00%, 03/01/20 | 1,200 | 1,402 | 0.48 | ||||||
| Indiana Fin. Auth., Sewer Imps. Prop. Tax Bonds, Series A, 5.00%, 10/01/17 | 1,000 | 1,194 | 0.41 | ||||||
| Purdue Univ., Certs. of Part. Lease Rev. Ref. Bonds, 5.00%, 07/01/15 | 150 | 167 | 0.06 | ||||||
| 4,439 | 1.52 | ||||||||
| Iowa - 0.13% | |||||||||
| Iowa Fin. Auth., Water Util. Imps. Misc. Rev. Bonds, 5.00%, 08/01/19 | 300 | 376 | 0.13 | ||||||
| 376 | 0.13 | ||||||||
| Principal amount (000) | Market value (000) | Percent of net assets | ||||||
| Bonds & notes—continued | ||||||||
| Kansas - 0.04% | ||||||||
| Kansas State Dept. of Trans., Highway Fuel Sales Tax Rev. Ref. Bonds, Series A, 5.00%, 09/01/15 | $ | 100 | $ | 113 | 0.04 | % | ||
| 113 | 0.04 | |||||||
| Kentucky - 0.59% | ||||||||
| Kentucky Higher Edu. Student Ln. Corp., Student Ln. Rev. Bonds, Series 1-Class A-1 (GTD St. Lns. Insured), 0.945%, 05/01/201 | 730 | 726 | 0.25 | |||||
| Kentucky Housing Corp., St. Single Family Housing Rev. Bonds, Series B, 5.00%, 07/01/27 | 935 | 1,002 | 0.34 | |||||
| 1,728 | 0.59 | |||||||
| Louisiana - 0.55% | ||||||||
| Louisiana Office Facs. Corp., Lease Rev. Ref. Bonds, 5.00%, 03/01/16 | 300 | 339 | 0.12 | |||||
| Louisiana Public Facs. Auth., Health Care Facs. Imps. Rev. Ref. Bonds, Series B, 5.25%, 05/15/27 | 250 | 265 | 0.09 | |||||
| State of Louisiana, Highway Imps. Fuel Sales Tax Rev. Bonds, Series A-1 (Mandatory Put 06/01/13 @ 100), 0.96%, 05/01/431 | 1,000 | 1,002 | 0.34 | |||||
| 1,606 | 0.55 | |||||||
| Maryland - 0.03% | ||||||||
| Univ. System of Maryland, College & Univ. Imps. Rev. Ref. Bonds, Series D, 3.00%, 04/01/13 | 100 | 101 | 0.03 | |||||
| 101 | 0.03 | |||||||
| Massachusetts - 2.15% | ||||||||
| City of Boston, G.O. Public Imps. Prop. Tax Bonds, Series A, 5.00%, 04/01/16 | 160 | 185 | 0.06 | |||||
| Massachusetts Bay Trans. Auth., Sales Tax Rev. Ref. Bonds, Series A (Pre-refunded with St. & Loc. Govt. Series to 07/01/15 @ 100), 5.00%, 07/01/25 | 100 | 112 | 0.04 | |||||
| Massachusetts Bay Trans. Auth., Sales Tax Rev. Ref. Bonds, Series C, 5.00%, 07/01/19 | 900 | 1,124 | 0.38 | |||||
| Massachusetts Dev. Fin. Agcy., College & Univ. Imps. Rev. Bonds, Series A, 5.00%, 01/01/15 | 1,000 | 1,075 | 0.37 | |||||
| Massachusetts Dev. Fin. Agcy., College & Univ. Rev. Ref. Bonds, Series B-3, 5.00%, 01/01/23 | 1,100 | 1,370 | 0.47 | |||||
| Massachusetts Health & Edu. Facs. Auth., College & Univ. Imps. Rev. Bonds, Series A, 5.00%, 12/15/25 | 100 | 123 | 0.04 | |||||
| Massachusetts Health & Edu. Facs. Auth., College & Univ. Imps. Rev. Bonds, Series O, 6.00%, 07/01/36 | 1,000 | 1,233 | 0.42 | |||||
| Massachusetts Health & Edu. Facs. Auth., Health Care Facs. Imps. Rev. Bonds, Series K (Mandatory Put 07/01/13 @ 100), 5.00%, 07/01/391 | 100 | 102 | 0.04 | |||||
| Massachusetts Housing Fin. Agcy., Loc. or GTD Housing Rev. Ref. Bonds, Series A, 2.00%, 06/01/13 | 835 | 841 | 0.29 | |||||
| Massachusetts State Water Pollution Abatement, Water Rev. Ref. Bonds, 5.00%, 08/01/14 | 100 | 108 | 0.04 | |||||
| 6,273 | 2.15 | |||||||
| Michigan - 3.99% | ||||||||
| Detroit City School Dist., G.O. Prop. Tax Ref. Bonds, Series A, 5.00%, 05/01/19 | 1,400 | 1,646 | 0.56 | |||||
| Michigan Fin. Auth., Misc. Rev. Ref. Bonds: | ||||||||
| Principal amount (000) | Market value (000) | Percent of net assets | |||||||
| Bonds & notes—continued | |||||||||
| Michigan—continued | |||||||||
| 5.00%, 01/01/18 | $ | 2,000 | $ | 2,415 | 0.83 | % | |||
| 5.00%, 01/01/21 | 700 | 854 | 0.29 | ||||||
| Michigan State Hospital Fin. Auth., Health Care Facs. Rev. Ref. Bonds, 4.00%, 11/15/13 | 100 | 103 | 0.04 | ||||||
| Michigan State Univ., College & Univ. Imps. Rev. Ref. Bonds, Series C, 5.00%, 08/15/17 | 1,500 | 1,792 | 0.61 | ||||||
| Michigan Strategic Fund, Energy Res. Auth. Rev. Ref. Bonds, 5.625%, 07/01/20 | 1,160 | 1,432 | 0.49 | ||||||
| State of Michigan, G.O. Misc. Rev. Ref. Bonds, Series A, 5.00%, 05/01/13 | 300 | 307 | 0.10 | ||||||
| Univ. of Michigan, College & Univ. Imps. Rev. Ref. Bonds, Series A, 5.00%, 04/01/16 | 150 | 173 | 0.06 | ||||||
| Univ. of Michigan, College & Univ. Imps. Rev. Ref. Bonds, Series C, 4.00%, 04/01/15 | 200 | 217 | 0.07 | ||||||
| Wayne County Airport Auth., Port, Airport & Marina Imps. Rev. Bonds, Series A, 5.00%, 12/01/22 | 725 | 863 | 0.30 | ||||||
| Wayne County Airport Auth., Port, Airport & Marina Rev. Ref. Bonds, Series C, 5.00%, 12/01/17 | 1,500 | 1,760 | 0.60 | ||||||
| Wayne State Univ., College & Univ. Rev. Ref. Bonds (AGM Insured), 5.00%, 11/15/16 | 100 | 115 | 0.04 | ||||||
| 11,677 | 3.99 | ||||||||
| Minnesota - 0.97% | |||||||||
| Minnesota Housing Fin. Agcy., Housing Rev. Bonds (GNMA/FNMA/FHLMC COLL Insured), 4.25%, 07/01/28 | 925 | 993 | 0.34 | ||||||
| Minnesota Housing Fin. Agcy., Loc. or GTD Housing Rev. Bonds, 4.00%, 07/01/40 | 800 | 855 | 0.29 | ||||||
| Minnesota Housing Fin. Agcy., Loc. or GTD Housing Rev. Bonds (GNMA/FNMA Insured), 2.25%, 12/01/42 | 1,000 | 1,001 | 0.34 | ||||||
| 2,849 | 0.97 | ||||||||
| Mississippi - 0.83% | |||||||||
| Jackson State Univ. Educ. Building Corp., College & Univ. Imps. Lease Rev. Bonds (Mandatory Put 03/01/15 @ 100) (AGM Insured), 5.00%, 03/01/341 | 2,220 | 2,425 | 0.83 | ||||||
| 2,425 | 0.83 | ||||||||
| Missouri - 0.14% | |||||||||
| I-470 & 350 Trans. Dev. Dist., Sales Tax Rev. Ref. Bonds (Radian Insured), 4.60%, 06/01/29 | 75 | 78 | 0.03 | ||||||
| Lees Summit Ind. Dev. Auth., Health Care Facs. Rev. Ref. Bonds, 5.00%, 08/15/14 | 200 | 208 | 0.07 | ||||||
| Missouri State Environmental Imps. & Energy Ress. Auth, Water Rev. Ref. Bonds, Series A, 5.00%, 01/01/19 | 100 | 124 | 0.04 | ||||||
| 410 | 0.14 | ||||||||
| Nebraska - 0.40% | |||||||||
| Nebraska Public Power Dist., Misc. Rev. Ref. Bonds, Series A, 4.00%, 01/01/14 | 1,125 | 1,174 | 0.40 | ||||||
| 1,174 | 0.40 | ||||||||
| Nevada - 1.96% | |||||||||
| Clark County School Dist., G.O. Public Imps. Rev. Bonds (AGM Insured), 5.50%, 06/15/15 | 100 | 113 | 0.04 | ||||||
| Principal amount (000) | Market value (000) | Percent of net assets | |||||||
| Bonds & notes—continued | |||||||||
| Nevada—continued | |||||||||
| County of Clark, Port, Airport & Marina Imps. Rev. Bonds, Series D, 5.00%, 07/01/16 | $ | 325 | $ | 372 | 0.13 | % | |||
| County of Clark, Port, Airport & Marina Rev. Ref. Bonds, 5.00%, 07/01/17 | 1,400 | 1,626 | 0.55 | ||||||
| County of Clark, Sales Tax Rev. Bonds, Series B, 4.00%, 07/01/18 | 2,000 | 2,290 | 0.78 | ||||||
| Las Vegas Valley Water Dist., G.O. Water Util. Imps. Prop. Tax Bonds, Series B, 5.00%, 06/01/19 | 1,100 | 1,340 | 0.46 | ||||||
| 5,741 | 1.96 | ||||||||
| New Hampshire - 0.21% | |||||||||
| New Hampshire Health & Edu. Facs. Auth., College & Univ. Imps. Rev. Ref. Bonds, 4.00%, 01/01/22 | 575 | 616 | 0.21 | ||||||
| 616 | 0.21 | ||||||||
| New Jersey - 4.34% | |||||||||
| Garden State Preservation Trust, Sales Tax Rev. Ref. Bonds, Series A: | |||||||||
| 5.00%, 11/01/20 | 1,000 | 1,265 | 0.43 | ||||||
| 5.00%, 11/01/21 | 200 | 255 | 0.09 | ||||||
| New Jersey Econ. Dev. Auth., Lease Rev. Ref. Bonds: | |||||||||
| 4.00%, 12/15/15 | 1,000 | 1,100 | 0.38 | ||||||
| 5.00%, 12/15/17 | 2,000 | 2,389 | 0.82 | ||||||
| New Jersey Econ. Dev. Auth., School Imps. Rev. Bonds, 1.11%, 02/01/171 | 1,025 | 1,027 | 0.35 | ||||||
| New Jersey Educ. Facs. Auth., College & Univ. Imps. Rev. Ref. Bonds, Series K, 5.00%, 07/01/14 | 100 | 108 | 0.04 | ||||||
| New Jersey Educ. Facs. Auth., Lease Rev. Ref. Bonds, Series A, 4.00%, 09/01/14 | 100 | 105 | 0.04 | ||||||
| New Jersey Higher Edu. Assistance Auth., Student Ln. Rev. Ref. Bonds, Series 1A: | |||||||||
| 5.00%, 12/01/15 | 1,000 | 1,118 | 0.38 | ||||||
| 5.00%, 12/01/17 | 1,420 | 1,646 | 0.56 | ||||||
| New Jersey Trans. Trust Fund Auth., Transit Imps. Misc. Rev. Bonds, Series A, 5.00%, 06/15/15 | 500 | 556 | 0.19 | ||||||
| New Jersey Trans. Trust Fund Auth., Transit Imps. Rev. Bonds, Series C (Pre-refunded with St. & Loc. Govt. Series to 06/15/13 @100), 5.50%, 06/15/21 | 800 | 826 | 0.28 | ||||||
| New Jersey Trans. Trust Fund Auth., Transit Rev. Ref. Bonds, Series A (AMBAC Insured), 5.50%, 12/15/15 | 2,000 | 2,293 | 0.78 | ||||||
| 12,688 | 4.34 | ||||||||
| New Mexico - 0.24% | |||||||||
| New Mexico Educ. Assistance Foundation, Rev. Bonds, Series A-2 (GTD St. Lns. Insured), 1.023%, 12/01/281 | 700 | 696 | 0.24 | ||||||
| 696 | 0.24 | ||||||||
| New York - 8.71% | |||||||||
| City of New York, G.O. Prop. Tax Ref. Bonds, Series B, 5.00%, 08/01/17 | 2,000 | 2,384 | 0.82 | ||||||
| City of New York, G.O. Public Imps. Prop. Tax Rev. Bonds, Series H-1, 4.00%, 03/01/17 | 100 | 113 | 0.04 | ||||||
| Erie County Ind. Dev. Agcy., Lease Rev. Ref. Bonds (St. Aid Withhldg. Insured), 5.00%, 05/01/20 | 1,000 | 1,227 | 0.42 | ||||||
| Long Island Power Auth., Energy Res. Auth. Rev. Ref. Bonds, Series 2010 A, 5.00%, 05/01/14 | 1,250 | 1,334 | 0.46 | ||||||
| Principal amount (000) | Market value (000) | Percent of net assets | |||||||
| Bonds & notes—continued | |||||||||
| New York—continued | |||||||||
| Long Island Power Auth., Energy Res. Auth. Rev. Ref. Bonds, Series F (NATL-RE Insured), 5.00%, 05/01/16 | $ | 1,830 | $ | 2,088 | 0.71 | % | |||
| Metropolitan Trans. Auth., Misc. Rev. Ref. Bonds, Series B, 1.21%, 11/01/201 | 2,000 | 2,000 | 0.68 | ||||||
| Metropolitan Trans. Auth., Transit Imps. Rev. Bonds, Series D, 5.00%, 11/15/20 | 1,000 | 1,225 | 0.42 | ||||||
| Metropolitan Trans. Auth., Transit Imps. Rev. Bonds, Series E, 4.00%, 11/15/19 | 1,500 | 1,732 | 0.59 | ||||||
| New York City Health & Hospital Corp., Health Care Facs. Rev. Ref. Bonds, Series A, 5.00%, 02/15/17 | 2,000 | 2,319 | 0.79 | ||||||
| New York City Transitional Fin. Auth. Building Aid Rev., Public Imps. Income Tax Rev. Bonds, Series S-1, 5.00%, 07/15/20 | 865 | 1,073 | 0.37 | ||||||
| New York City Transitional Fin. Auth., School Imps. Misc. Rev. Bonds, Series S-5 (St. Aid Withhldg. Insured), 5.00%, 01/15/19 | 100 | 122 | 0.04 | ||||||
| New York City Trust For Cultural Res. Rev. Bonds (Mandatory Put 08/01/17 @ 100), 1.35%, 01/01/361 | 1,250 | 1,263 | 0.43 | ||||||
| New York Muni. Bond Bank Agcy., Misc. Rev. Ref. Bonds (St. Aid Withhldg. Insured), 5.00%, 12/01/20 | 2,000 | 2,487 | 0.85 | ||||||
| New York State Dormitory Auth., College and Univ. Rev. Ref. Bonds (NATL-RE FGIC Insured), 5.00%, 07/01/14 | 200 | 216 | 0.07 | ||||||
| New York State Dormitory Auth., Health Care Facs. Imps. Income Tax Rev. Bonds, Series A, 5.00%, 02/15/16 | 500 | 573 | 0.20 | ||||||
| New York State Dormitory Auth., Health Care Facs. Imps. Rev. Bonds, 5.00%, 02/15/13 | 1,150 | 1,166 | 0.40 | ||||||
| New York State Dormitory Auth., Misc. Rev. Ref. Bonds, Series A, 5.00%, 10/01/17 | 1,000 | 1,178 | 0.40 | ||||||
| Public Housing Capital Fund Trust I Rev. Bonds (HUD Ln. Insured), 4.50%, 07/01/222 | 734 | 787 | 0.27 | ||||||
| Tobacco Settlement Fncg. Corp., Rev. Ref. Bonds, Series A, 5.00%, 06/01/17 | 1,850 | 2,183 | 0.75 | ||||||
| 25,470 | 8.71 | ||||||||
| North Carolina - 1.48% | |||||||||
| Board of Governors of the Univ. of North Carolina, College & Univ. Imps. Rev. Ref. Bonds, Series A (NATL-RE Insured), 5.00%, 10/01/15 | 110 | 124 | 0.04 | ||||||
| City of Charlotte, Rev. Ref. Bonds, Series B, 5.00%, 07/01/23 | 400 | 493 | 0.17 | ||||||
| North Carolina Muni. Power Agcy. No. 1, Energy Res. Auth. Rev. Ref. Bonds, Series A, 5.25%, 01/01/20 | 175 | 206 | 0.07 | ||||||
| Raleigh Durham Airport Auth., Port, Airport, & Marina Rev. Ref. Bonds, Series A, 5.00%, 05/01/19 | 2,500 | 3,063 | 1.05 | ||||||
| State of North Carolina, Highway Imps. Rev. Bonds: | |||||||||
| 5.00%, 03/01/13 | 100 | 101 | 0.03 | ||||||
| 5.00%, 03/01/17 | 300 | 354 | 0.12 | ||||||
| 4,341 | 1.48 | ||||||||
| North Dakota - 0.22% | |||||||||
| North Dakota Housing Fin. Agcy., Loc. or GTD Housing Rev. Bonds, 3.75%, 07/01/42 | 600 | 648 | 0.22 | ||||||
| 648 | 0.22 | ||||||||
| Ohio - 4.39% | |||||||||
| City of Cleveland Airport System Rev., Port, Airport & Marina Imps. Rev. Bonds, Series C (AGM Insured), 5.00%, 01/01/17 | 1,250 | 1,424 | 0.49 | ||||||
| City of Cleveland, Airport System, Port, Airport, & Marina Rev. Ref. Bonds, Series A, 5.00%, 01/01/25 | 1,000 | 1,147 | 0.39 | ||||||
| County of Allen, Lease Rev. Ref. Bonds, Series B: | |||||||||
| Principal amount (000) | Market value (000) | Percent of net assets | |||||||
| Bonds & notes—continued | |||||||||
| Ohio—continued | |||||||||
| 5.00%, 09/01/18 | $ | 1,000 | $ | 1,190 | 0.41 | % | |||
| 5.00%, 09/01/19 | 2,000 | 2,402 | 0.82 | ||||||
| 5.00%, 09/01/20 | 1,030 | 1,239 | 0.42 | ||||||
| Miami University/Oxford, College & Univ. Imps. Rev. Bonds, 4.00%, 09/01/19 | 700 | 818 | 0.28 | ||||||
| Ohio Air Quality Dev. Auth., Ind. Rev. Ref. Bonds (Mandatory Put 06/01/16 @ 100), 5.75%, 06/01/331 | 1,000 | 1,123 | 0.39 | ||||||
| Ohio Air Quality Dev. Auth., Res. Recovery Imps. Rev. Bonds, Series A, 5.70%, 08/01/20 | 1,000 | 1,195 | 0.41 | ||||||
| Ohio State Building Auth., Rev. Ref. Bonds, Series A, 5.00%, 10/01/17 | 1,500 | 1,791 | 0.61 | ||||||
| Ohio State Turnpike Commission, Highway Tolls Rev. Ref. Bonds, Series A, 5.00%, 02/15/13 | 500 | 507 | 0.17 | ||||||
| 12,836 | 4.39 | ||||||||
| Oklahoma - 0.08% | |||||||||
| Oklahoma Dev. Fin. Auth., Health Care Facs. Rev. Ref. Bonds, 5.00%, 08/15/24 | 200 | 225 | 0.08 | ||||||
| 225 | 0.08 | ||||||||
| Pennsylvania - 2.75% | |||||||||
| City of Philadelphia, Water Rev. Ref. Bonds, Series A, 5.00%, 06/15/15 | 3,000 | 3,323 | 1.14 | ||||||
| Pennsylvania Higher Educ. Facs. Auth., Health Care Facs. Rev. Ref. Bonds, Series A (AMBAC Insured), 5.00%, 08/15/15 | 200 | 222 | 0.08 | ||||||
| Pennsylvania Intergovernmental Cooperation Auth., Special Tax Rev. Ref. Bonds, 5.00%, 06/15/17 | 1,500 | 1,784 | 0.61 | ||||||
| Pennsylvania State Univ., College & Univ. Imps. Rev. Bonds, Series A, 5.00%, 03/01/14 | 200 | 212 | 0.07 | ||||||
| Philadelphia School Dist., G.O. School Imps. Prop. Tax Rev. Bonds, Series A (St. Aid Withhldg. Insured), 5.00%, 06/01/15 | 1,745 | 1,925 | 0.66 | ||||||
| Univ. of Pittsburgh, College & Univ. Imps. Rev. Ref. Bonds (Mandatory Put 09/15/13 @ 100), 5.50%, 09/15/311 | 300 | 313 | 0.11 | ||||||
| Univ. of Pittsburgh, College & Univ. Imps. Rev. Ref. Bonds, Series B, 5.25%, 09/15/24 | 200 | 245 | 0.08 | ||||||
| 8,024 | 2.75 | ||||||||
| Puerto Rico - 0.04% | |||||||||
| Puerto Rico Electric Power Auth., Energy Res. Auth. Rev. Ref. Bonds, Series JJ (NATL-RE Insured), 5.25%, 07/01/13 | 100 | 103 | 0.04 | ||||||
| 103 | 0.04 | ||||||||
| South Carolina - 1.48% | |||||||||
| Greenville County School Dist., School Imps. Lease Rev. Bonds (Pre-refunded with St. & Loc. Govt. Series to 12/01/12 @ 101), 5.50%, 12/01/28 | 300 | 304 | 0.10 | ||||||
| South Carolina Jobs-Econ. Dev. Auth., Health Care Facs. Rev. Ref. Bonds, 5.00%, 08/01/18 | 1,025 | 1,173 | 0.40 | ||||||
| South Carolina State Housing Fin. & Dev. Auth., Loc. or GTD Housing Rev. Bonds, Series 1 (GNMA/FNMA/FHLMC Insured), 4.50%, 07/01/30 | 1,165 | 1,266 | 0.43 | ||||||
| South Carolina State Public Service Auth., Energy Res. Auth. Imps. Rev. Ref. Bonds, Series B, 5.00%, 01/01/16 | 1,300 | 1,478 | 0.51 | ||||||
| Principal amount (000) | Market value (000) | Percent of net assets | |||||||
| Bonds & notes—continued | |||||||||
| South Carolina—continued | |||||||||
| South Carolina Trans. Infrastructure Bank, Transit Rev. Ref. Bonds, Series A, 5.00%, 10/01/14 | $ | 100 | $ | 109 | 0.04 | % | |||
| 4,330 | 1.48 | ||||||||
| Tennessee - 1.25% | |||||||||
| City of Memphis, Energy Res. Auth. Rev. Ref. Bonds: | |||||||||
| 5.00%, 12/01/14 | 125 | 137 | 0.05 | ||||||
| 5.00%, 12/01/18 | 100 | 123 | 0.04 | ||||||
| Metropolitan Govt. Nashville & Davidson County Health & Educ. Facs. Board, College & Univ. Imps. Rev. Ref. Bonds, Series B (Mandatory Put 10/01/17 @ 100), 0.81%, 10/01/381 | 1,400 | 1,400 | 0.48 | ||||||
| Tennessee Housing Dev. Agcy., Loc. or GTD Housing Rev. Bonds, 4.50%, 07/01/37 | 985 | 1,086 | 0.37 | ||||||
| Tennessee Housing Dev. Agcy., Loc. or GTD Housing Rev. Bonds, Series A-1, 5.00%, 01/01/27 | 845 | 909 | 0.31 | ||||||
| 3,655 | 1.25 | ||||||||
| Texas - 8.45% | |||||||||
| City of Houston, Port, Airport & Marina Rev. Ref. Bonds, Series B, 5.00%, 07/01/23 | 1,000 | 1,217 | 0.42 | ||||||
| City of Houston, Port, Airport & Marina Rev. Ref. Bonds, Series B (NATL-RE FGIC Insured), 5.00%, 07/01/25 | 150 | 166 | 0.06 | ||||||
| City of Houston, Util. System Rev. Bonds (Mandatory Put 06/01/17 @ 100), 0.96%, 05/15/341 | 1,400 | 1,406 | 0.48 | ||||||
| City of Houston, Water Rev. Ref. Bonds, Series C, 5.00%, 11/15/18 | 1,500 | 1,847 | 0.63 | ||||||
| City of San Antonio, Energy Res. Auth. Imps. Rev. Bonds, 5.00%, 02/01/17 | 2,000 | 2,362 | 0.81 | ||||||
| City of San Antonio, Water Rev. Bonds, 3.00%, 05/15/13 | 100 | 101 | 0.03 | ||||||
| County of Dallas, G.O. Public Imps. Prop. Tax Rev. Bonds, 5.00%, 08/15/16 | 100 | 117 | 0.04 | ||||||
| County of Harris, Highway Imps. Rev. Ref. Bonds, Series B-1 (NATL-RE FGIC Insured), 5.00%, 08/15/16 | 100 | 108 | 0.04 | ||||||
| Dallas Area Rapid Transit, Sales Tax Rev. Ref. Bonds, Series A: | |||||||||
| 3.00%, 12/01/17 | 1,695 | 1,874 | 0.64 | ||||||
| 4.00%, 12/01/16 | 955 | 1,083 | 0.37 | ||||||
| Dallas-Fort Worth Intl. Airport Facs. Imp. Corp., Port, Airport & Marina Rev. Ref. Bonds, Series A, 5.00%, 11/01/23 | 100 | 114 | 0.04 | ||||||
| Dallas-Fort Worth Intl. Airport Facs. Imp. Corp., Port, Airport & Marina Rev. Ref. Bonds, Series B, 5.00%, 11/01/20 | 900 | 1,102 | 0.38 | ||||||
| Dallas-Fort Worth Intl. Port, Airport & Marina Rev. Ref. Bonds, Series G, 5.00%, 11/01/25 | 1,000 | 1,172 | 0.40 | ||||||
| Harris County Cultural Educ. Facs. Fin. Corp., Energy Res. Auth. Imps. Rev. Bonds: | |||||||||
| 5.00%, 11/15/17 | 445 | 534 | 0.18 | ||||||
| 5.00%, 11/15/18 | 275 | 336 | 0.11 | ||||||
| Harris County Health Facs. Dev. Corp., Health Care Facs. Imps. Rev. Ref. Bonds, Series A-4 (AGM Insured), 0.30%, 07/01/311 | 275 | 275 | 0.09 | ||||||
| Houston Comm. College System, College & Univ. Imps. Rev. Ref. Bonds (AGM Insured), 5.25%, 04/15/15 | 100 | 111 | 0.04 | ||||||
| Lower Colorado River Auth., Energy Res. Auth. Rev. Ref. Bonds, 5.00%, 05/15/18 | 1,000 | 1,197 | 0.41 | ||||||
| North Texas Tollway Auth., Highway Imps. Rev. Bonds, Series A (Escrowed to Maturity) (AGM Insured), 5.00%, 01/01/15 | 100 | 110 | 0.04 | ||||||
| North Texas Tollway Auth., Highway Tolls Rev. Ref. Bonds, Series B, 5.00%, 01/01/22 | 1,000 | 1,217 | 0.42 | ||||||
| Principal amount (000) | Market value (000) | Percent of net assets | |||||||
| Bonds & notes—continued | |||||||||
| Texas—continued | |||||||||
| North Texas Tollway Auth., Highway Tolls Rev. Ref. Bonds, Series C (Mandatory Put 01/01/19 @ 100), 1.95%, 01/01/381 | $ | 1,200 | $ | 1,207 | 0.41 | % | |||
| North Texas Tollway Auth., Misc. Rev. Ref. Bonds, Series A: | |||||||||
| 6.00%, 01/01/19 | 100 | 121 | 0.04 | ||||||
| 6.00%, 01/01/21 | 100 | 120 | 0.04 | ||||||
| Plano Independent School Dist., G.O. School Imps. Prop. Tax Bonds, Series A, 5.00%, 02/15/13 | 100 | 101 | 0.03 | ||||||
| State of Texas, Cash Flow Mgmt. Misc. Rev. Notes, 2.50%, 08/30/13 | 2,000 | 2,038 | 0.70 | ||||||
| State of Texas, G.O. Highway Imps. Rev. Bonds, Series A, 5.00%, 04/01/13 | 100 | 102 | 0.03 | ||||||
| State of Texas, G.O. Water Util. Imps. Bonds, Series A, 3.00%, 08/01/14 | 100 | 105 | 0.04 | ||||||
| Tarrant County Cultural Educ. Facs. Fin. Corp., Health Care Facs. Rev. Ref. Bonds: | |||||||||
| 5.00%, 02/15/14 | 100 | 105 | 0.04 | ||||||
| 5.00%, 08/15/23 | 350 | 391 | 0.13 | ||||||
| Texas Public Fin. Auth., Unemployment & Welfare Fndg. Misc. Rev. Bonds, Series A, 5.00%, 01/01/16 | 1,500 | 1,711 | 0.59 | ||||||
| Texas Public Fin. Auth., Unemployment & Welfare Fndg. Misc. Rev. Bonds, Series C, 2.60%, 07/01/20 | 220 | 222 | 0.08 | ||||||
| Texas Tech Univ., College & Univ. Imps. Rev. Ref. Bonds, Series A, 5.00%, 08/15/25 | 900 | 1,092 | 0.37 | ||||||
| Texas Water Dev. Board, Water Util. Imps. Rev. Bonds, Series B, 5.25%, 07/15/22 | 600 | 713 | 0.24 | ||||||
| Univ. of Texas System, College & Univ. Imps. Rev. Ref. Bonds, Series B (Pre-refunded with St. & Loc. Govt. Series to 08/15/13 @ 100), 5.375%, 08/15/14 | 100 | 104 | 0.04 | ||||||
| Univ. of Texas System, College & Univ. Imps. Rev. Ref. Bonds, Series D, 5.00%, 08/15/14 | 100 | 108 | 0.04 | ||||||
| 24,689 | 8.45 | ||||||||
| Utah - 0.11% | |||||||||
| Intermountain Power Agcy., Energy Res. Auth. Rev. Ref. Bonds, Series A: | |||||||||
| 5.00%, 07/01/14 | 100 | 108 | 0.04 | ||||||
| 5.00%, 07/01/16 | 200 | 215 | 0.07 | ||||||
| 323 | 0.11 | ||||||||
| Virginia - 0.50% | |||||||||
| City of Chesapeake, Chesapeake Expressway Toll Road Rev., Highway Tolls Rev. Ref. Bonds, Series A, 4.00%, 07/15/19 | 750 | 827 | 0.28 | ||||||
| County of Fairfax, G.O. Prop. Tax Rev. Ref. Bonds, Series C (St. Aid Withhldg. Insured), 5.00%, 10/01/17 | 200 | 242 | 0.08 | ||||||
| Fairfax County Econ. Dev. Auth., Health Care Facs. Rev. Ref. Bonds, 4.20%, 10/01/15 | 275 | 296 | 0.10 | ||||||
| Virginia Ress. Auth., Misc. Rev. Ref. Bonds, Series A, 4.00%, 10/01/13 | 100 | 103 | 0.04 | ||||||
| 1,468 | 0.50 | ||||||||
| Washington - 3.57% | |||||||||
| City of Seattle, Energy Res. Auth. Imps. Rev. Ref. Bonds, Series B, 5.00%, 02/01/15 | 2,000 | 2,204 | 0.75 | ||||||
| Energy Northwest, Energy Res. Auth. Imps. Rev. Bonds, Series C, 5.00%, 07/01/22 | 100 | 115 | 0.04 | ||||||
| Energy Northwest, Energy Res. Auth. Rev. Ref. Bonds, Series A: | |||||||||
| 5.00%, 07/01/15 | 500 | 560 | 0.19 | ||||||
| 5.00%, 07/01/17 | 1,000 | 1,192 | 0.41 | ||||||
| Principal amount (000) | Market value (000) | Percent of net assets | ||||||||||
| Bonds & notes—continued | ||||||||||||
| Washington—continued | ||||||||||||
| Energy Northwest, Energy Res. Auth. Rev. Ref. Bonds, Series C, 5.00%, 07/01/17 | $ | 1,650 | $ | 1,967 | 0.67 | % | ||||||
| Grays Harbor County Public Util. Dist. No. 1, Energy Res. Auth. Rev. Ref. Bonds (NATL-RE FGIC Insured), 5.00%, 07/01/20 | 155 | 175 | 0.06 | |||||||||
| Port of Seattle, Port, Airport & Marina Imps. Rev. Bonds, 5.00%, 06/01/16 | 1,500 | 1,723 | 0.59 | |||||||||
| Port of Seattle, Port, Airport & Marina Imps. Rev. Bonds, Series A-1, 5.25%, 05/01/27 | 100 | 115 | 0.04 | |||||||||
| State of Washington, G.O. Highway Imps. Fuel Sales Tax Rev. Bonds, Series E, (NATL-RE Insured), 5.00%, 01/01/14 | 100 | 106 | 0.04 | |||||||||
| Washington Health Care Facs. Auth., Health Care Facs. Imps. Rev. Bonds, Series B (Mandatory Put 10/01/21 @ 100), 5.00%, 10/01/421 | 800 | 954 | 0.33 | |||||||||
| Washington Health Care Facs. Auth., Health Care Facs. Rev. Ref. Bonds, 5.00%, 10/01/20 | 1,100 | 1,327 | 0.45 | |||||||||
| 10,438 | 3.57 | |||||||||||
| Wisconsin - 1.26% | ||||||||||||
| County of Milwaukee, Port, Airport & Marina Imps. Rev. Bonds, Series A, 5.00%, 12/01/18 | 1,145 | 1,350 | 0.46 | |||||||||
| State of Wisconsin, General Fund Rev. Ref. Bonds, Series A (St. Approp. Insured), 5.00%, 05/01/18 | 700 | 847 | 0.29 | |||||||||
| Wisconsin Health & Educ. Facs. Auth., Health Care Facs. Rev. Ref. Bonds, 4.20%, 08/15/18 | 100 | 115 | 0.04 | |||||||||
| Wisconsin Health & Educ. Facs. Auth., Health Care Facs. Rev. Ref. Bonds, Series A, 5.00%, 10/15/17 | 1,200 | 1,370 | 0.47 | |||||||||
| 3,682 | 1.26 | |||||||||||
| Total bonds & notes (cost: $271,461,508) | 285,876 | 97.80 | ||||||||||
| Short-term securities - 2.52% | ||||||||||||
| California Pollution Control Fncg. Auth., Energy Res. Auth. Rev. Ref. Bonds, 0.26%, 11/01/261 | 1,400 | 1,400 | 0.48 | |||||||||
| City of Chicago, G.O. Prop. Tax Ref. Bonds, Series F, 0.23%, 01/01/421 | 1,550 | 1,550 | 0.53 | |||||||||
| County of Allen, Health Care Facs. Imps. Rev. Bonds, Series B, 0.23%, 10/01/311 | 1,960 | 1,960 | 0.67 | |||||||||
| Gulf Coast Waste Disposal Auth., Ind. Rev. Ref. Bonds, 0.22%, 06/01/201 | 400 | 400 | 0.14 | |||||||||
| Mississippi Business Fin. Corp., Ind. Imps. Rev. Bonds, Series E, 0.23%, 12/01/301 | 1,150 | 1,150 | 0.39 | |||||||||
| Montgomery County Public Building Auth., Public Imps. Misc. Rev. Bonds, 0.30%, 07/01/381 | 895 | 895 | 0.31 | |||||||||
| Total Short-term securities (cost: $7,355,000) | 7,355 | 2.52 | ||||||||||
| Total investment securities (cost: $278,816,508) | 293,231 | 100.32 | ||||||||||
| Other assets less liabilities | (938) | (0.32) | ||||||||||
| Net assets | $ | 292,293 | 100.00 | % | ||||||||
| 1 | Coupon rate may change periodically. For short-term securities, the date of the next scheduled coupon rate change is considered to be the maturity date. | |||
| 2 | Acquired in a transaction exempt from registration under Rule 144A or section 4(2) of the Securities Act of 1933. May be resold in the U.S. in transactions exempt from registration, normally to qualified institutional buyers. At October 31, 2012, the aggregate market value of these securities amounted to $786,888, representing 0.27% of net assets. | |||
| Key to abbreviations | ||||
| Agcy. | = Agency | |||
| AGM | = Assured Guaranty Municipal Corporation | |||
| AMBAC | = American Municipal Bond Assurance Corporation | |||
| Approp. | = Appropriation | |||
| Auth. | = Authority | |||
| CA Mtg. Ins. | = California Mortgage Insurance | |||
| Certs. of Part. | = Certificates of Participation | |||
| CIFG | = CDC IXIS Financial Guaranty | |||
| COLL | = Collateral | |||
| Comm. | = Community | |||
| Corp. | = Corporation | |||
| Corps. | = Corporations | |||
| Dept. | = Department | |||
| Dev. | = Development | |||
| Dist. | = District | |||
| Econ. | = Economic | |||
| Edu. | = Education | |||
| Educ. | = Educational | |||
| Facs. | = Facilities | |||
| FGIC | = Financial Guaranty Insurance Company | |||
| FHLMC | = Federal Home Loan Mortgage Corporation | |||
| Fin. | = Finance | |||
| Fncg. | = Financing | |||
| Fndg. | = Funding | |||
| FNMA | = Federal National Mortgage Association | |||
| GNMA | = Government National Mortgage Association | |||
| G.O. | = General Obligation | |||
| Govt. | = Government | |||
| GTD | = Guaranteed | |||
| GTY | = Guaranty | |||
| HUD | = Housing and Urban Development | |||
| Imp. | = Improvement | |||
| Imps. | = Improvements | |||
| Inc. | = Incorporated | |||
| Ind. | = Industrial | |||
| Intl. | = International | |||
| Ln. | = Loan | |||
| Lns. | = Loans | |||
| Loc. | = Local | |||
| Mgmt. | = Management | |||
| Misc. | = Miscellaneous | |||
| Muni. | = Municipal | |||
| NATL-RE | = National Reinsurance | |||
| No. | = Number | |||
| Prop. | = Property | |||
| Redev. | = Redevelopment | |||
| Ref. | = Refunding | |||
| Res. | = Resource | |||
| Ress. | = Resources | |||
| Rev. | = Revenue | |||
| St. | = State | |||
| Trans. | = Transportation | |||
| Univ. | = University |
| Util. | = Utility |
| Utils. | = Utilities |
| Withhldg. | = Withholding |
| Capital Short-Term Municipal Fund | |
| October 31, 2012 | |
Growth of $25,000 investment
Here’s how a $25,000 investment in the Capital Short-Term Municipal Fund grew between April 13, 2010, when the fund began operations, and October 31, 2012, the end of the fund’s fiscal year.

1 The index is unmanaged, and its results include reinvested distributions but do not reflect the effect of sales
charges, commissions, or expenses.
2 Includes reinvested dividends and capital gain distributions.
Results are for past periods and are not predictive of results for future periods. Current and future results may be lower or higher than those shown. Share price and returns will vary so investors may lose money. The results shown are before taxes on fund distributions and sale of fund shares.
Investment portfolio – quality ratings*
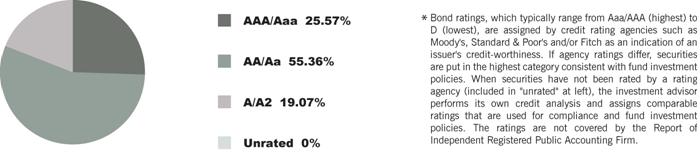
Capital Short-Term Municipal Fund
Schedule of Investments
at October 31, 2012
| Principal amount (000) | Market value (000) | Percent of net assets | |||||
| Bonds & notes - 95.37% | |||||||
| Alabama - 1.78% | |||||||
| Alabama Public School & College Auth., Sales Tax Rev. Ref. Bonds, Series A, 5.00%, 05/01/15 | $ | 1,000 | $ | 1,111 | 0.90 | % | |
| Mobile Ind. Dev. Board, Ind. Imps. Rev. Bonds (Mandatory Put 03/19/15 @ 100), 5.00%, 06/01/341 | 1,000 | 1,095 | 0.88 | ||||
| 2,206 | 1.78 | ||||||
| Arizona - 1.26% | |||||||
| Arizona School Facs. Board, Certs of Part. Lease Ref. Bonds, Series A-1 (NATL-RE FGIC Insured), 5.00%, 09/01/15 | 365 | 408 | 0.33 | ||||
| Arizona School Facs. Board, School Imps. Certs. of Part. Lease Rev. Bonds, 5.00%, 09/01/14 | 200 | 217 | 0.17 | ||||
| Phoenix Civic Imp. Corp, Sewer Rev. Ref. Bonds, 5.00%, 07/01/17 | 250 | 299 | 0.24 | ||||
| Salt River Project Agricultural Imps. & Power Dist., Energy Res. Auth. Rev. Ref. Bonds, Series A, 4.00%, 12/01/17 | 550 | 638 | 0.52 | ||||
| 1,562 | 1.26 | ||||||
| California - 6.47% | |||||||
| Bay Area Toll Auth., Highway Tolls Rev. Ref. Bonds, 4.00%, 04/01/22 | 500 | 587 | 0.47 | ||||
| California Health Facs. Fncg. Auth., Health Care Facs. Rev. Ref. Bonds, Series A, 4.00%, 11/15/13 | 450 | 467 | 0.38 | ||||
| California Infrastructure & Econ. Dev. Bank, Misc. Rev. Ref. Bonds, Series A-1 (Mandatory Put 04/01/14 @ 100), 0.71%, 04/01/381 | 1,000 | 1,003 | 0.81 | ||||
| California Infrastructure & Econ. Dev. Bank, Rev. Bonds, Series A-2 (Mandatory Put 04/01/14 @ 100), 0.71%, 04/01/381 | 1,000 | 1,003 | 0.81 | ||||
| California State Dept. of Water Ress., Energy Res. Auth. Rev. Ref. Bonds, Series N, 5.00%, 05/01/18 | 1,000 | 1,220 | 0.98 | ||||
| California State Public Works Board, Rev. Bonds, Series G, 4.00%, 12/01/16 | 600 | 679 | 0.55 | ||||
| East Bay Muni. Util. Dist. Rev. Bonds, Series A-1 (Mandatory Put 07/01/14 @ 100), 0.56%, 06/01/251 | 465 | 465 | 0.37 | ||||
| Los Angeles Dept. of Water & Power, Energy Res. Auth. Rev. Ref. Bonds, Series A, 5.00%, 07/01/15 | 300 | 336 | 0.27 | ||||
| Sacramento County Sanitation Dist. Fncg. Auth., Sewer Rev. Ref. Bonds, 5.00%, 12/01/14 | 450 | 493 | 0.40 | ||||
| Sacramento Muni. Util. Dist., Energy Res. Auth. Rev. Bonds, Series R (NATL-RE Insured), 5.00%, 08/15/17 | 185 | 192 | 0.15 | ||||
| Sacramento Muni. Util. Dist., Energy Res. Auth. Rev. Bonds, Series R (Pre-refunded with St. & Loc. Govt. Series to 08/15/2013 @ 100), (NATL-RE Insured), 5.00%, 08/15/17 | 415 | 430 | 0.35 | ||||
| State of California, G.O. Public Imps. Misc. Rev. Bonds, 4.00%, 09/01/18 | 1,000 | 1,153 | 0.93 | ||||
| 8,028 | 6.47 | ||||||
| Colorado - 6.79% | |||||||
| Arapahoe County School Dist. No. 5 Cherry Creek, G.O. School Imps. Prop. Tax Bonds (St. Aid Withhldg. Insured), 3.00%, 12/15/12 | 100 | 100 | 0.08 | ||||
| City & County of Denver, Port, Airport & Marina Imps. Rev. Bonds, Series C, 5.00%, 11/15/16 | 400 | 467 | 0.38 | ||||
| Colorado Health Facs. Auth., Health Care Facs. Rev. Ref. Bonds, Series B, 5.00%, 07/01/391 | 1,000 | 1,090 | 0.88 | ||||
| Colorado Health Facs. Auth., Health Care Facs. Rev. Ref. Bonds, Series B (Mandatory Put 11/11/14 @ 100), 5.00%, 01/01/15 | 1,000 | 1,094 | 0.88 | ||||
| Principal amount (000) | Market value (000) | Percent of net assets | |||||||
| Bonds & notes—continued | |||||||||
| Colorado—continued | |||||||||
| Colorado Health Facs. Auth., Health Care Facs. Rev. Ref. Bonds, Series C-2 (Mandatory Put 11/12/15 @ 100), 4.00%, 10/01/401 | $ | 500 | $ | 549 | 0.44 | % | |||
| Regional Trans. Dist., Transit Imps. Certs of Part. Lease Rev. Bonds, Series A, 5.00%, 06/01/14 | 1,000 | 1,064 | 0.86 | ||||||
| State of Colorado, Cash Flow Mgmt. Misc. Rev. Notes, Series A: | |||||||||
| 2.00%, 06/27/13 | 2,400 | 2,429 | 1.96 | ||||||
| 2.50%, 06/27/13 | 1,600 | 1,624 | 1.31 | ||||||
| 8,417 | 6.79 | ||||||||
| Connecticut - 0.38% | |||||||||
| State of Connecticut, G.O. Public Imps. Prop. Tax Bonds, Series A, 5.00%, 04/01/15 | 425 | 472 | 0.38 | ||||||
| 472 | 0.38 | ||||||||
| District of Columbia - 3.64% | |||||||||
| Dist. of Columbia Housing Fin. Agcy., Loc. or GTD Housing Rev. Bonds (AGM HUD Ln. Insured), 5.00%, 07/01/16 | 100 | 109 | 0.09 | ||||||
| Dist. of Columbia, Income Tax Secured, Rev. Ref. Bonds, Series E, 0.81%, 12/01/151 | 1,000 | 1,000 | 0.81 | ||||||
| Dist. of Columbia, Water Util. Imps. Rev. Bonds (Mandatory Put 06/01/15 @ 100), 0.69%, 10/01/441 | 2,100 | 2,100 | 1.69 | ||||||
| Metropolitan Washington Airports Auth., Port, Airport & Marina Imps. Rev. Bonds, Series A, 4.00%, 10/01/15 | 1,100 | 1,204 | 0.97 | ||||||
| Metropolitan Washington Airports Auth., Port, Airport & Marina Imps. Rev. Ref. Bonds, Series B, 3.00%, 10/01/13 | 100 | 103 | 0.08 | ||||||
| 4,516 | 3.64 | ||||||||
| Florida - 10.53% | |||||||||
| Citizens Prop. Insurance Corp., Cash Flow Mgmt. Misc. Rev. Bonds, Series A-1, 5.00%, 06/01/16 | 1,790 | 2,010 | 1.62 | ||||||
| City of Cape Coral, Water Rev. Ref. Bonds, 3.00%, 10/01/17 | 600 | 639 | 0.52 | ||||||
| City of Lakeland, Energy Res. Auth. Rev. Ref. Bonds, 1.31%, 10/01/141 | 600 | 607 | 0.49 | ||||||
| City of Tampa, Health Care Facs. Rev. Ref. Bonds, 5.00%, 11/15/15 | 750 | 843 | 0.68 | ||||||
| City of Tampa, Sewer Imps. Prop. Tax Bonds, 4.00%, 10/01/15 | 225 | 248 | 0.20 | ||||||
| City of Tampa, Water Rev. Ref. Bonds, Series A: | |||||||||
| 5.00%, 10/01/16 | 1,250 | 1,459 | 1.18 | ||||||
| 5.00%, 10/01/17 | 450 | 539 | 0.43 | ||||||
| County of Miami-Dade, School Board Certs. of Part. Lease Rev. Ref. Bonds, Series A (Mandatory Put 05/01/14 @ 100), 5.00%, 05/01/311 | 1,000 | 1,062 | 0.86 | ||||||
| Florida Housing Fin. Corp., Loc. or GTD Housing Rev. Bonds, Series A (GNMA/FNMA COLL Insured), 4.50%, 07/01/29 | 615 | 664 | 0.54 | ||||||
| Florida Housing Fin. Corp., Loc. or GTD Housing Rev. Bonds, Series B (GNMA/FNMA/FHLMC Insured), 4.50%, 01/01/29 | 345 | 376 | 0.30 | ||||||
| Florida Hurricane Catastrophe Fund Fin. Corp., Misc. Purposes Rev. Bonds, Series A: | |||||||||
| 5.00%, 07/01/15 | 1,450 | 1,610 | 1.30 | ||||||
| 5.00%, 07/01/16 | 190 | 216 | 0.17 | ||||||
| Florida Muni. Power Agcy., Misc. Rev. Ref. Bonds, Series A, 4.00%, 10/01/17 | 300 | 339 | 0.27 | ||||||
| Florida State Board of Edu., Misc. Rev. Ref. Bonds, Series E, 5.00%, 07/01/15 | 550 | 615 | 0.50 | ||||||
| Florida State Dept. of Trans., Highway Imps. Rev. Bonds, Series B, 5.00%, 07/01/14 | 1,000 | 1,075 | 0.87 | ||||||
| Principal amount (000) | Market value (000) | Percent of net assets | ||||||
| Bonds & notes—continued | ||||||||
| Florida—continued | ||||||||
| Florida Water Pollution Control Fncg. Corp., Pollution Control Misc. Rev. Bonds, Series A, 3.00%, 01/15/14 | $ | 100 | $ | 103 | 0.08 | % | ||
| JEA, Energy Res. Auth. Imps. Rev. Bonds, Sub-Series A, 3.00%, 10/01/14 | 100 | 104 | 0.08 | |||||
| Orlando Utils. Commission, Energy Res. Auth. Rev. Ref. Bonds, Series C, 5.00%, 10/01/14 | 500 | 543 | 0.44 | |||||
| 13,052 | 10.53 | |||||||
| Georgia - 1.20% | ||||||||
| City of Atlanta, Port, Airport & Marina Rev. Ref. Bonds, Series A, 5.00%, 01/01/17 | 500 | 581 | 0.47 | |||||
| Georgia State Road & Tollway Auth., Fuel Sales Tax Rev. Ref. Bonds, Series A, 5.00%, 03/01/16 | 600 | 691 | 0.56 | |||||
| Thomasville Hospital Auth., Heath Care Facs. Imps. Rev. Ref. Bonds, 3.00%, 11/01/13 | 210 | 214 | 0.17 | |||||
| 1,486 | 1.20 | |||||||
| Guam - 0.55% | ||||||||
| Territory of Guam, Cash Flow Mgmt., Misc. Rev. Bonds, Series A, 5.00%, 01/01/17 | 600 | 681 | 0.55 | |||||
| 681 | 0.55 | |||||||
| Hawaii - 1.06% | ||||||||
| State of Hawaii, G.O. Prop. Tax Ref. Bonds, Series DT, 5.00%, 11/01/14 | 100 | 109 | 0.09 | |||||
| State of Hawaii, G.O. Public Imps. Bonds, Series DZ, 5.00%, 12/01/17 | 1,000 | 1,207 | 0.97 | |||||
| 1,316 | 1.06 | |||||||
| Illinois - 7.62% | ||||||||
| City of Chicago, Port, Airport & Marina Imps. Rev. Bonds, Series A, 4.00%, 01/01/16 | 1,000 | 1,096 | 0.88 | |||||
| City of Chicago, Port, Airport & Marina Rev. Ref. Notes, Series B (Mandatory Put 01/01/15 @ 100), 5.00%, 01/01/341 | 450 | 484 | 0.39 | |||||
| City of Chicago, Sewer Imps. Rev. Bonds, 3.00%, 01/01/17 | 325 | 352 | 0.28 | |||||
| Greater Chicago Metropolitan Water Reclamation Dist., G.O. Sewer Imps. Prop. Tax Bonds, Series B, 5.00%, 12/01/17 | 300 | 361 | 0.29 | |||||
| Illinois Fin. Auth., Health Care Facs. Rev. Ref. Bonds, 5.00%, 08/15/15 | 1,345 | 1,510 | 1.22 | |||||
| Illinois State Toll Highway Auth., Highway Imps. Rev. Bonds, Series A (AGM Insured), 5.00%, 01/01/14 | 1,000 | 1,049 | 0.85 | |||||
| Illinois State Toll Highway Auth., Highway Tolls Rev. Ref. Bonds, Series A, 5.50%, 01/01/15 | 700 | 764 | 0.62 | |||||
| Regional Trans. Auth., Sales Tax Rev. Ref. Bonds (AGM G.O. of Auth. Insured), 5.75%, 06/01/13 | 100 | 103 | 0.08 | |||||
| Regional Trans. Auth., Sales Tax Rev. Ref. Bonds, Series A (AGM G.O. of Auth. Insured), 5.00%, 06/01/15 | 1,000 | 1,109 | 0.90 | |||||
| Regional Trans. Auth., Sales Tax Transit Imps. Rev. Bonds (NATL-RE G.O. of Auth. Insured), 6.25%, 07/01/15 | 1,000 | 1,141 | 0.92 | |||||
| State of Illinois, Sales Tax Rev. Ref. Bonds, 5.00%, 06/15/14 | 1,375 | 1,478 | 1.19 | |||||
| 9,447 | 7.62 | |||||||
| Indiana - 1.11% | ||||||||
| Indiana Fin. Auth., Health Care Facs. Rev. Ref. Bonds, Series N, 5.00%, 03/01/16 | 600 | 671 | 0.54 | |||||
| Indiana Fin. Auth., Lease Rev. Ref. Bonds, Series A-1, 5.00%, 11/01/12 | 225 | 225 | 0.18 | |||||
| Principal amount (000) | Market value (000) | Percent of net assets | ||||||
| Bonds & notes—continued | ||||||||
| Indiana—continued | ||||||||
| Purdue Univ., College & Univ. Rev. Ref. Bonds, Series C, 5.00%, 07/01/17 | $ | 405 | $ | 485 | 0.39 | % | ||
| 1,381 | 1.11 | |||||||
| Kansas - 0.18% | ||||||||
| Kansas State Dept. of Trans., Highway Fuel Sales Tax Rev. Ref. Bonds, Series A, 5.00%, 09/01/15 | 200 | 226 | 0.18 | |||||
| 226 | 0.18 | |||||||
| Kentucky - 1.81% | ||||||||
| Kentucky Higher Edu. Student Ln. Corp., Student Ln. Rev. Bonds, Series 1-Class A-1 (GTD St. Lns. Insured), 0.945%, 05/01/201 | 810 | 806 | 0.65 | |||||
| Kentucky Housing Corp., St. Single Family Housing Rev. Bonds, Series B, 5.00%, 07/01/27 | 330 | 354 | 0.28 | |||||
| Kentucky State Prop. & Building Commission, Lease Rev. Ref. Bonds, Series A, 4.00%, 08/01/15 | 1,000 | 1,089 | 0.88 | |||||
| 2,249 | 1.81 | |||||||
| Louisiana - 1.95% | ||||||||
| Louisiana Housing Fin. Agcy., Loc. or GTD Housing Rev. Bonds (GNMA/FNMA COLL Insured), 4.60%, 12/01/28 | 1,675 | 1,807 | 1.46 | |||||
| Louisiana Office Facs. Corp., Lease Ref. Rev. Bonds, 5.00%, 03/01/14 | 100 | 105 | 0.09 | |||||
| State of Louisiana, Highway Imps. Fuel Sales Tax Rev. Bonds, Series A-1 (Mandatory Put 06/01/13 @ 100), 0.96%, 05/01/431 | 500 | 501 | 0.40 | |||||
| 2,413 | 1.95 | |||||||
| Massachusetts - 1.56% | ||||||||
| Commonwealth of Massachusetts, G.O. Misc. Taxes Ref. Bonds, Series A, 5.00%, 09/01/14 | 100 | 108 | 0.09 | |||||
| Massachusetts Dev. Fin. Agcy., Health Care Facs. Imps. Rev. Bonds, Series K-6, 5.00%, 07/01/16 | 600 | 693 | 0.56 | |||||
| Massachusetts Dev. Fin. Agcy., Health Care Facs. Rev. Ref. Bonds, Series H, 5.00%, 07/01/17 | 600 | 678 | 0.54 | |||||
| Massachusetts Health & Educ. Facs. Auth., College & Univ. Imps. Rev. Ref. Bonds, Series A, 5.00%, 11/15/14 | 100 | 110 | 0.09 | |||||
| Massachusetts Housing Fin. Agcy., Loc. or GTD Housing Rev. Ref. Bonds, Series A, 2.00%, 06/01/13 | 235 | 237 | 0.19 | |||||
| Massachusetts State Water Pollution Abatement, Pollution Control Water Rev. Bonds, Series 14, 5.00%, 08/01/14 | 100 | 108 | 0.09 | |||||
| 1,934 | 1.56 | |||||||
| Michigan - 3.42% | ||||||||
| Detroit City School Dist, G.O. Prop. Tax Ref. Bonds, Series A, 5.00%, 05/01/18 | 1,000 | 1,165 | 0.94 | |||||
| Michigan State Hospital Fin. Auth., Health Care Facs. Imps. Rev. Bonds (Mandatory Put 08/01/14 @ 100), 2.00%, 11/15/331 | 500 | 512 | 0.41 | |||||
| Michigan State Univ., College & Univ. Rev. Ref. Bonds, Series C, 5.00%, 08/15/15 | 1,000 | 1,125 | 0.91 | |||||
| Wayne County Airport Auth., Port, Airport & Marina Imps. Rev. Bonds, Series A, 5.00%, 12/01/18 | 300 | 356 | 0.29 | |||||
| Principal amount (000) | Market value (000) | Percent of net assets | ||||||
| Bonds & notes—continued | ||||||||
| Michigan—continued | ||||||||
| Wayne County Airport Auth., Port, Airport & Marina Rev. Ref. Bonds, Series C, 5.00%, 12/01/14 | $ | 1,000 | $ | 1,087 | 0.87 | % | ||
| 4,245 | 3.42 | |||||||
| Minnesota - 0.91% | ||||||||
| Minnesota Housing Fin. Agcy., Loc. or GTD Housing Rev. Bonds, 4.00%, 07/01/40 | 400 | 428 | 0.34 | |||||
| Univ. of Minnesota, College & Univ. Imps. Rev. Bonds, Series A, 5.00%, 12/01/16 | 600 | 706 | 0.57 | |||||
| 1,134 | 0.91 | |||||||
| Missouri - 0.60% | ||||||||
| Missouri Housing Dev. Commission, Loc. or GTD Housing Rev. Bonds, (GNMA/FNMA/FHLMC Insured), 4.25%, 11/01/30 | 685 | 741 | 0.60 | |||||
| 741 | 0.60 | |||||||
| Nevada - 2.01% | ||||||||
| County of Clark, Port, Airport & Marina Imps. Rev. Bonds, Series D, 5.00%, 07/01/16 | 300 | 343 | 0.28 | |||||
| Nevada System of Higher Edu., College & Univ. Imps. Rev. Ref. Bonds, Series B (AMBAC Insured), 5.00%, 07/01/14 | 2,000 | 2,149 | 1.73 | |||||
| 2,492 | 2.01 | |||||||
| New Hampshire - 0.58% | ||||||||
| New Hampshire State Turnpike System, Highway Tolls Rev. Ref. Bonds, Series B, 5.00%, 02/01/18 | 600 | 717 | 0.58 | |||||
| 717 | 0.58 | |||||||
| New Jersey - 6.10% | ||||||||
| Garden State Preservation Trust, Sales Tax Rev. Ref. Bonds, Series A, 5.00%, 11/01/18 | 550 | 679 | 0.55 | |||||
| New Jersey Econ. Dev. Auth., Misc. Rev. Ref. Bonds, Series DD-1, 5.00%, 12/15/16 | 1,000 | 1,165 | 0.94 | |||||
| New Jersey Econ. Dev. Auth., School Imps. Misc. Rev. Bonds, 0.79%, 02/01/151 | 525 | 525 | 0.42 | |||||
| New Jersey Econ. Dev. Auth., School Imps. Rev. Bonds, 1.11%, 02/01/171 | 1,000 | 1,002 | 0.81 | |||||
| New Jersey Educ. Facs. Auth., College & Univ. Imps. Rev. Ref. Bonds, Series K, 5.00%, 07/01/14 | 100 | 108 | 0.09 | |||||
| New Jersey Health Care Facs. Fncg. Auth., Health Care Facs. Rev. Ref. Bonds, 4.00%, 07/01/14 | 500 | 524 | 0.42 | |||||
| New Jersey Higher Edu. Assistance Auth., Student Ln. Rev. Bonds, Series 2, 5.00%, 12/01/14 | 1,000 | 1,075 | 0.87 | |||||
| New Jersey Higher Edu. Assistance Auth., Student Ln. Rev. Ref. Bonds, Series 1A, 5.00%, 12/01/15 | 500 | 559 | 0.45 | |||||
| New Jersey Trans. Trust Fund Auth., Transit Imps. Misc. Rev. Bonds, Series A, 5.00%, 06/15/15 | 300 | 333 | 0.27 | |||||
| New Jersey Trans. Trust Fund Auth., Transit Imps. Rev. Bonds, Series C (Pre-refunded with St. & Loc. Govt. Series to 06/15/13 @100), 5.50%, 06/15/21 | 430 | 444 | 0.36 | |||||
| New Jersey Trans. Trust Fund Auth., Transit Rev. Ref. Bonds, Series A (AMBAC Insured), 5.50%, 12/15/15 | 1,000 | 1,147 | 0.92 | |||||
| 7,561 | 6.10 | |||||||
| Principal amount (000) | Market value (000) | Percent of net assets | |||||||
| Bonds & notes—continued | |||||||||
| New Mexico - 0.55% | |||||||||
| New Mexico Educ. Assistance Foundation, Rev. Bonds, Series A-2 (GTD St. Lns. Insured), 1.023%, 12/01/281 | $ | 690 | $ | 686 | 0.55 | % | |||
| 686 | 0.55 | ||||||||
| New York - 5.94% | |||||||||
| City of New York Transitional Fin. Auth., Income Tax Rev. Ref. Bonds, Sub-Series A-1, 5.00%, 11/01/16 | 1,000 | 1,175 | 0.95 | ||||||
| Long Island Power Auth., Energy Res. Auth. Rev. Ref. Bonds, Series F (NATL-RE Insured), 5.00%, 05/01/16 | 1,000 | 1,141 | 0.92 | ||||||
| Metropolitan Trans. Auth., Misc. Rev. Ref. Bonds, Series B-3B, 1.11%, 11/01/181 | 1,000 | 1,003 | 0.81 | ||||||
| Metropolitan Trans. Auth., Transit Rev. Ref. Bonds, Series F, 5.00%, 11/15/18 | 500 | 604 | 0.49 | ||||||
| New York City Health & Hospital Corp., Health Care Facs. Rev. Ref. Bonds, Series A, 5.00%, 02/15/16 | 400 | 452 | 0.36 | ||||||
| New York City Transitional Fin. Auth. Building Aid Rev., School Imps. Misc. Rev. Bonds, Sub-Series S-1A (St. Aid Withhldg. Insured), 5.00%, 07/15/17 | 500 | 592 | 0.48 | ||||||
| New York State Dormitory Auth., College & Univ. Rev. Ref. Bonds, 4.00%, 07/01/13 | 200 | 205 | 0.16 | ||||||
| New York State Dormitory Auth., Health Care Facs. Imps. Rev. Bonds, 5.00%, 02/15/13 | 350 | 355 | 0.29 | ||||||
| Public Housing Capital Fund Trust I Rev. Bonds (HUD Ln. Insured), 4.50%, 07/01/222 | 343 | 367 | 0.29 | ||||||
| Tobacco Settlement Fncg. Corp., Rev. Ref. Bonds, Series A, 5.00%, 06/01/15 | 1,325 | 1,471 | 1.19 | ||||||
| 7,365 | 5.94 | ||||||||
| North Carolina - 1.09% | |||||||||
| County of Wake, G.O. Prop. Tax Ref. Bonds, Series D, 4.00%, 02/01/13 | 150 | 151 | 0.12 | ||||||
| North Carolina Eastern Muni. Power Agcy., Energy Res. Auth. Ref. Rev. Bonds, Series A, 5.00%, 01/01/16 | 525 | 594 | 0.48 | ||||||
| Raleigh Durham Airport Auth., Port, Airport & Marina Ref. Rev. Bonds, Series A, 3.00%, 05/01/13 | 600 | 608 | 0.49 | ||||||
| 1,353 | 1.09 | ||||||||
| North Dakota - 0.22% | |||||||||
| North Dakota Housing Fin. Agcy., Loc. or GTD Housing Rev. Bonds, 3.75%, 07/01/42 | 250 | 270 | 0.22 | ||||||
| 270 | 0.22 | ||||||||
| Ohio - 3.39% | |||||||||
| City of Cleveland, Airport System Rev., Port, Airport & Marina Rev. Ref. Bonds, Series A, 5.00%, 01/01/16 | 1,660 | 1,847 | 1.49 | ||||||
| County of Allen, Health Care Facs. Imps., Rev. Ref. Bonds, Series B: | |||||||||
| 5.00%, 09/01/14 | 1,000 | 1,076 | 0.87 | ||||||
| 5.00%, 09/01/15 | 500 | 557 | 0.45 | ||||||
| Ohio Housing Fin. Agcy., Loc. or GTD Housing Rev. Bonds, (GNMA/FNMA/FHLMC Insured), 4.50%, 11/01/28 | 665 | 720 | 0.58 | ||||||
| 4,200 | 3.39 | ||||||||
| Oklahoma - 0.48% | |||||||||
| Oklahoma City Water Utils. Trust, Water Rev. Ref. Bonds, 3.00%, 07/01/15 | 125 | 133 | 0.11 | ||||||
| Principal amount (000) | Market value (000) | Percent of net assets | ||||||
| Bonds & notes—continued | ||||||||
| Oklahoma—continued | ||||||||
| Oklahoma Muni. Power Auth., Energy Res. Auth. Rev. Ref. Bonds, Series A (Mandatory Put 08/01/13 @ 100), 0.96%, 01/01/231 | $ | 465 | $ | 466 | 0.37 | % | ||
| 599 | 0.48 | |||||||
| Pennsylvania - 2.65% | ||||||||
| City of Philadelphia, Water Rev. Ref. Bonds, Series A, 5.00%, 06/15/15 | 1,000 | 1,108 | 0.89 | |||||
| Pennsylvania Intergovernmental Cooperation Auth., Special Tax Rev. Ref. Bonds, 5.00%, 06/15/15 | 750 | 836 | 0.68 | |||||
| Pennsylvania State Univ., College & Univ. Imps. Rev. Bonds, Series A, 5.00%, 03/01/14 | 225 | 239 | 0.19 | |||||
| Philadelphia School Dist., G.O. School Imps. Prop. Tax Rev. Bonds, Series A (St. Aid Withhldg. Insured), 5.00%, 06/01/15 | 1,000 | 1,103 | 0.89 | |||||
| 3,286 | 2.65 | |||||||
| South Carolina - 1.10% | ||||||||
| South Carolina State Housing Fin. & Dev. Auth., Loc. or GTD Housing Rev. Bonds, Series 1 (GNMA/FNMA/FHLMC Insured), 4.50%, 07/01/30 | 700 | 761 | 0.61 | |||||
| South Carolina State Public Service Auth., Energy Res. Auth. Imps. Rev. Ref. Bonds, Series B, 5.00%, 01/01/15 | 450 | 493 | 0.40 | |||||
| South Carolina Trans. Infrastructure Bank, Transit Rev. Ref. Bonds, Series A, 5.00%, 10/01/14 | 100 | 109 | 0.09 | |||||
| 1,363 | 1.10 | |||||||
| Tennessee - 1.09% | ||||||||
| City of Memphis, Energy Res. Auth. Rev. Ref. Bonds, 5.00%, 12/01/14 | 100 | 109 | 0.09 | |||||
| Metropolitan Govt. Nashville & Davidson County Health & Educ. Facs. Board, College & Univ. Imps. Rev. Ref. Bonds, Series B (Mandatory Put 10/01/17 @ 100), 0.81%, 10/01/381 | 700 | 700 | 0.56 | |||||
| Tennessee Housing Dev. Agcy., Loc. or GTD Housing Rev. Bonds, 4.50%, 07/01/37 | 495 | 546 | 0.44 | |||||
| 1,355 | 1.09 | |||||||
| Texas - 9.88% | ||||||||
| Bexar County Hospital Dist., G.O. Health Care Facs. Imps. Prop. Tax Rev. Bonds, 3.50%, 02/15/13 | 200 | 202 | 0.16 | |||||
| City of Houston, G.O. Prop. Tax Ref. Bonds, Series A, 5.00%, 03/01/16 | 1,000 | 1,145 | 0.92 | |||||
| City of Houston, Util. System Rev. Bonds (Mandatory Put 06/01/17 @ 100), 0.96%, 05/15/341 | 600 | 602 | 0.49 | |||||
| City of Houston, Util. System Rev. Bonds (Mandatory Put 08/01/16 @ 100), 0.81%, 05/15/341 | 1,000 | 1,000 | 0.81 | |||||
| City of San Antonio, Water Rev. Ref. Bonds, 3.00%, 05/15/14 | 100 | 104 | 0.08 | |||||
| County of Harris, Highway Tolls Rev. Ref. Bonds, Series B (Mandatory Put 08/15/15 @ 100), 0.80%, 08/15/211 | 1,000 | 1,000 | 0.81 | |||||
| Dallas-Fort Worth Intl. Airport Facs. Imp. Corp., Port, Airport & Marina Rev. Ref. Bonds, Series B, 5.00%, 11/01/18 | 200 | 242 | 0.20 | |||||
| Harris County Health Facs. Dev. Corp., Health Care Facs. Imps. Rev. Ref. Bonds, Series A-4 (AGM Insured), 0.30%, 07/01/311 | 200 | 200 | 0.16 | |||||
| Lower Colorado River Auth., Energy Res. Auth. Rev. Ref. Bonds, 5.00%, 05/15/15 | 500 | 555 | 0.45 | |||||
| North Texas Tollway Auth., Highway Tolls Rev. Ref. Bonds, Series C (Mandatory Put 01/01/19 @ 100), 1.00%, 01/01/381 | 500 | 503 | 0.40 | |||||
| Principal amount (000) | Market value (000) | Percent of net assets | ||||||||
| Bonds & notes—continued | ||||||||||
| Texas—continued | ||||||||||
| Plano Independent School Dist., G.O. School Imps. Prop. Tax Bonds, Series A, 5.00%, 02/15/14 | $ | 100 | $ | 106 | 0.09 | % | ||||
| State of Texas, Cash Flow Mgmt. Misc. Rev. Notes, 2.50%, 08/30/13 | 1,000 | 1,019 | 0.82 | |||||||
| State of Texas, G.O. Prop. Tax Ref. Bonds, Series A, 5.00%, 10/01/14 | 650 | 708 | 0.57 | |||||||
| Texas A&M University, College & Univ. Imps. Rev. Ref. Bonds, 3.00%, 07/01/16 | 325 | 354 | 0.28 | |||||||
| Texas Dept. of Housing & Comm. Affairs, Loc. or GTD Housing Rev. Bonds, Series A (GNMA COLL Insured), 5.00%, 07/01/29 | 485 | 531 | 0.43 | |||||||
| Texas Public Fin. Auth., Unemployment & Welfare Fndg. Misc. Rev. Bonds, Series A, 5.00%, 07/01/14 | 1,000 | 1,077 | 0.87 | |||||||
| Texas Public Fin. Auth., Unemployment & Welfare Fndg. Misc. Rev. Bonds, Series C, 2.60%, 07/01/20 | 70 | 71 | 0.06 | |||||||
| Texas State Univ. Systems, College & Univ. Imps. Rev. Ref. Bonds: | ||||||||||
| 5.00%, 03/15/13 | 200 | 204 | 0.16 | |||||||
| 5.00%, 03/15/15 | 715 | 791 | 0.64 | |||||||
| Texas Tech Univ., College & Univ. Rev. Ref. Bonds, Series A, 3.00%, 08/15/16 | 500 | 545 | 0.44 | |||||||
| Texas Water Dev. Board, Water Rev. Ref. Bonds, 5.00%, 07/15/15 | 225 | 253 | 0.20 | |||||||
| Univ. of Texas System, College & Univ. Imps. Rev. Ref. Notes, Series B (Pre-refunded with St. & Loc. Govt. Series to 08/15/13 @ 100), 5.00%, 08/15/22 | 1,000 | 1,038 | 0.84 | |||||||
| 12,250 | 9.88 | |||||||||
| Washington - 7.05% | ||||||||||
| Energy Northwest, Energy Res. Auth. Rev. Ref. Bonds, Series A: | ||||||||||
| 4.00%, 07/01/15 | 500 | 547 | 0.44 | |||||||
| 5.00%, 07/01/15 | 1,250 | 1,401 | 1.13 | |||||||
| Grant County Public Util. Dist. No. 2, Energy Res. Auth. Rev. Ref. Bonds, Series I, 5.00%, 01/01/16 | 1,000 | 1,135 | 0.92 | |||||||
| Port of Seattle, Port, Airport & Marina Rev. Ref. Bonds, 5.00%, 06/01/14 | 750 | 803 | 0.65 | |||||||
| Port of Seattle, Port, Airport & Marina Rev. Ref. Bonds, Series A, 5.00%, 08/01/18 | 600 | 725 | 0.58 | |||||||
| Snohomish County Public Util. Dist. No. 1, Energy Res. Auth. Rev. Ref. Bonds: | ||||||||||
| 5.00%, 12/01/13 | 500 | 526 | 0.42 | |||||||
| 5.00%, 12/01/15 | 1,000 | 1,138 | 0.92 | |||||||
| State of Washington, G.O. Prop. Tax Ref. Bonds, Series R-2012A, 5.00%, 07/01/16 | 1,000 | 1,161 | 0.94 | |||||||
| Washington Health Care Facs. Auth., Health Care Facs. Rev. Ref. Bonds, Series B, 5.00%, 10/01/14 | 640 | 691 | 0.56 | |||||||
| Washington St. Housing Fin. Commission, Loc. or GTD Housing Rev. Bonds, Series A (GNMA/FNMA/FHLMC Insured), 4.50%, 04/01/29 | 570 | 614 | 0.49 | |||||||
| 8,741 | 7.05 | |||||||||
| Wisconsin - 0.42% | ||||||||||
| Wisconsin Health & Educ. Facs. Auth., Health Care Facs. Rev. Ref. Bonds, Series A, 3.00%, 10/15/16 | 500 | 523 | 0.42 | |||||||
| 523 | 0.42 | |||||||||
| Total bonds & notes (cost: $115,125,778) | 118,267 | 95.37 | ||||||||
| Short-term securities - 4.56% | ||||||||||
| City of New York, G.O. Public Imps. Prop. Tax Bonds, Sub-Series A-10, 0.26%, 08/01/171 | 1,300 | 1,300 | 1.05 | |||||||
| Principal amount (000) | Market value (000) | Percent of net assets | ||||||||||||
| Short-term securities—continued | ||||||||||||||
| Commonwealth of Massachusetts, G.O. Public Imps. Prop. Tax Bonds, Series B, 0.25%, 03/01/261 | $ | 250 | $ | 250 | 0.20 | % | ||||||||
| Jackson County, Ind. Rev. Ref. Bonds, 0.23%, 12/01/161 | 300 | 300 | 0.24 | |||||||||||
| New York City Transitional Fin. Auth., Public Imps. Income Tax Rev. Bonds, Series 1, 0.25%, 11/01/221 | 1,150 | 1,150 | 0.93 | |||||||||||
| Virginia College Building Auth., College & Univ. Imps. Rev. Ref. Bonds, 0.23%, 11/01/361 | 2,650 | 2,650 | 2.14 | |||||||||||
| Total Short-term securities (cost: $5,650,000) | 5,650 | 4.56 | ||||||||||||
| Total investment securities (cost: $120,775,778) | 123,917 | 99.93 | ||||||||||||
| Other assets less liabilities | 91 | 0.07 | ||||||||||||
| Net assets | $ | 124,008 | 100.00 | % | ||||||||||
| 1 | Coupon rate may change periodically. For short-term securities, the date of the next scheduled coupon rate change is considered to be the maturity date. | |||||||||||||
| 2 | Acquired in a transaction exempt from registration under Rule 144A or section 4(2) of the Securities Act of 1933. May be resold in the U.S. in transactions exempt from registration, normally to qualified institutional buyers. At October 31, 2012, the aggregate market value of these securities amounted to $367,214, representing 0.30% of net assets. | |||||||||||||
| Key to abbreviations | ||||||||||||||
| Agcy. | = Agency | |||||||||||||
| AGM | = Assured Guaranty Municipal Corporation | |||||||||||||
| AMBAC | = American Municipal Bond Assurance Corporation | |||||||||||||
| Auth. | = Authority | |||||||||||||
| Certs. of Part. | = Certificates of Participation | |||||||||||||
| COLL | = Collateral | |||||||||||||
| Comm. | = Community | |||||||||||||
| Corp. | = Corporation | |||||||||||||
| Dept. | = Department | |||||||||||||
| Dev. | = Development | |||||||||||||
| Dist. | = District | |||||||||||||
| Econ. | = Economic | |||||||||||||
| Edu. | = Education | |||||||||||||
| Educ. | = Educational | |||||||||||||
| Facs. | = Facilities | |||||||||||||
| FGIC | = Financial Guaranty Insurance Company | |||||||||||||
| FHLMC | = Federal Home Loan Mortgage Corporation | |||||||||||||
| Fin. | = Finance | |||||||||||||
| Fncg. | = Financing | |||||||||||||
| Fndg. | = Funding | |||||||||||||
| FNMA | = Federal National Mortgage Association | |||||||||||||
| GNMA | = Government National Mortgage Association | |||||||||||||
| G.O. | = General Obligation | |||||||||||||
| Govt. | = Government | |
| GTD | = Guaranteed | |
| HUD | = Housing and Urban Development | |
| Imp. | = Improvement | |
| Imps. | = Improvements | |
| Ind. | = Industrial | |
| Ln. | = Loan | |
| Lns. | = Loans | |
| Loc. | = Local | |
| Mgmt. | = Management | |
| Misc. | = Miscellaneous | |
| Muni. | = Municipal | |
| NATL-RE | = National Reinsurance | |
| No. | = Number | |
| Prop. | = Property | |
| Ref. | = Refunding | |
| Res. | = Resource | |
| Rev. | = Revenue | |
| St. | = State | |
| Trans. | = Transportation | |
| Univ. | = University | |
| Util. | = Utility | |
| Utils. | = Utilities | |
| Withhldg. | = Withholding | |
| Capital California Core Municipal Fund | |
| October 31, 2012 | |
Growth of $25,000 investment
Here’s how a $25,000 investment in the Capital California Core Municipal Fund grew between April 13, 2010, when the fund began operations, and October 31, 2012, the end of the fund’s fiscal year.
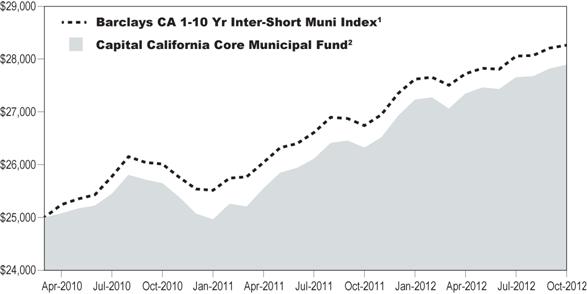
1 The index is unmanaged, and its results include reinvested distributions but do not reflect the effect of sales
charges, commissions, or expenses.
2 Includes reinvested dividends and capital gain distributions.
Results are for past periods and are not predictive of results for future periods. Current and future results may be lower or higher than those shown. Share price and returns will vary so investors may lose money. The results shown are before taxes on fund distributions and sale of fund shares.
Investment portfolio – quality ratings*

Capital California Core Municipal Fund
Schedule of Investments
at October 31, 2012
| Principal amount (000) | Market value (000) | Percent of net assets | ||||||
| Bonds & notes - 90.27% | ||||||||
| California - 88.26% | ||||||||
| Abag Fin. Auth. for Nonprofit Corps., Health Care Facs. Rev. Ref. Bonds (CA Mtg. Ins.): | ||||||||
| 4.00%, 05/15/16 | $ | 1,500 | $ | 1,514 | 0.73 | % | ||
| 5.125%, 09/01/20 | 1,500 | 1,762 | 0.85 | |||||
| 5.25%, 05/15/20 | 1,000 | 1,176 | 0.57 | |||||
| Abag Fin. Auth. for Nonprofit Corps., Health Care Facs. Rev. Ref. Bonds, Series A (CA Mtg. Ins.): | ||||||||
| 5.00%, 04/01/19 | 400 | 471 | 0.23 | |||||
| 5.00%, 04/01/20 | 550 | 650 | 0.31 | |||||
| Abag Fin. Auth. for Nonprofit Corps., Public Imps. Special Tax Ref. Bonds (CIFG Insured): | ||||||||
| 5.00%, 09/02/21 | 600 | 653 | 0.31 | |||||
| 5.00%, 09/02/22 | 225 | 242 | 0.12 | |||||
| Abag Fin. Auth. for Nonprofit Corps., Public Imps. Special Tax Ref. Bonds, Series A (CIFG Insured), 4.00%, 09/02/14 | 445 | 466 | 0.22 | |||||
| Anaheim Public Fncg. Auth., Energy Res. Auth. Rev. Ref. Bonds (NATL-RE Insured), 4.00%, 10/01/17 | 575 | 654 | 0.31 | |||||
| Bay Area Toll Auth., Highway Tolls Rev. Ref. Bonds: | ||||||||
| 5.00%, 04/01/19 | 800 | 987 | 0.47 | |||||
| 5.00%, 04/01/21 | 800 | 1,006 | 0.48 | |||||
| Bay Area Toll Auth., Highway Tolls Rev. Ref. Bonds, Series F-1, 5.00%, 04/01/21 | 100 | 122 | 0.06 | |||||
| Bay Area Toll Auth., Rev. Bonds (Mandatory Put 08/01/17 @ 100), 1.45%, 04/01/451 | 1,500 | 1,526 | 0.74 | |||||
| Bonita Canyon Public Facs. Fncg. Auth., Special Tax Ref. Bonds: | ||||||||
| 4.00%, 09/01/21 | 700 | 722 | 0.35 | |||||
| 5.00%, 09/01/26 | 500 | 517 | 0.25 | |||||
| California Educ. Facs. Auth., College & Univ. Imps. Rev. Bonds: | ||||||||
| 5.00%, 04/01/19 | 950 | 1,122 | 0.54 | |||||
| 5.00%, 02/01/21 | 550 | 680 | 0.33 | |||||
| 5.00%, 10/01/21 | 700 | 849 | 0.41 | |||||
| 5.00%, 11/01/21 | 525 | 568 | 0.27 | |||||
| 5.50%, 04/01/29 | 300 | 340 | 0.16 | |||||
| California Educ. Facs. Auth., College & Univ. Imps. Rev. Bonds, Series A: | ||||||||
| 5.00%, 10/01/15 | 500 | 553 | 0.27 | |||||
| 5.00%, 01/01/18 | 125 | 152 | 0.07 | |||||
| California Educ. Facs. Auth., College & Univ. Rev. Ref. Bonds, 5.00%, 09/01/20 | 165 | 207 | 0.10 | |||||
| California Educ. Facs. Auth., College & Univ. Rev. Ref. Bonds, Series A: | ||||||||
| 4.00%, 11/01/21 | 560 | 628 | 0.30 | |||||
| 4.00%, 11/01/22 | 1,420 | 1,573 | 0.76 | |||||
| 4.50%, 11/01/17 | 335 | 385 | 0.19 | |||||
| 5.00%, 01/01/24 | 100 | 118 | 0.06 | |||||
| California Health Facs. Fncg. Auth., Health Care Facs. Imps. Rev. Bonds, 4.00%, 08/15/16 | 710 | 779 | 0.37 | |||||
| California Health Facs. Fncg. Auth., Health Care Facs. Imps. Rev. Bonds, Series A: | ||||||||
| 5.00%, 10/01/18 | 275 | 331 | 0.16 | |||||
| 5.00%, 10/01/22 | 770 | 882 | 0.42 | |||||
| 5.00%, 11/15/24 | 150 | 180 | 0.09 | |||||
| 5.00%, 11/15/25 | 375 | 447 | 0.22 | |||||
| California Health Facs. Fncg. Auth., Health Care Facs. Imps. Rev. Bonds, Series D, 5.00%, 08/15/20 | 1,325 | 1,609 | 0.77 | |||||
| California Health Facs. Fncg. Auth., Health Care Facs. Imps. Rev. Bonds, Series G, 5.50%, 07/01/25 | 100 | 113 | 0.05 | |||||
| Principal amount (000) | Market value (000) | Percent of net assets | |||||||
| Bonds & notes—continued | |||||||||
| California—continued | |||||||||
| California Health Facs. Fncg. Auth., Health Care Facs. Imps. Rev. Bonds, Series I, 5.125%, 07/01/22 | $ | 975 | $ | 1,056 | 0.51 | % | |||
| California Health Facs. Fncg. Auth., Health Care Facs. Rev. Ref. Bonds (Mandatory Put 07/01/14 @ 100), 5.00%, 07/01/271 | 300 | 319 | 0.15 | ||||||
| California Health Facs. Fncg. Auth., Health Care Facs. Rev. Ref. Bonds, Series A: | |||||||||
| 5.00%, 11/15/19 | 1,350 | 1,631 | 0.78 | ||||||
| 5.00%, 11/15/20 | 500 | 608 | 0.29 | ||||||
| California Health Facs. Fncg. Auth., Health Care Facs. Rev. Ref. Bonds, Series B: | |||||||||
| 4.00%, 08/15/19 | 400 | 458 | 0.22 | ||||||
| 5.00%, 08/15/20 | 300 | 365 | 0.18 | ||||||
| 5.00%, 11/15/21 | 1,000 | 1,095 | 0.53 | ||||||
| 5.00%, 08/15/22 | 850 | 1,047 | 0.50 | ||||||
| 5.375%, 07/01/21 | 1,500 | 1,574 | 0.76 | ||||||
| California Health Facs. Fncg. Auth., Health Care Facs. Rev. Ref. Bonds, Series C, 6.25%, 10/01/28 | 200 | 239 | 0.11 | ||||||
| California Health Facs. Fncg. Auth., Health Care Facs. Rev. Ref. Bonds, Series C (Mandatory Put 10/16/14 @ 100), 5.00%, 07/01/341 | 100 | 108 | 0.05 | ||||||
| California Health Facs. Fncg. Auth., Health Care Facs. Rev. Ref. Bonds, Series I (Mandatory Put 07/01/14 @ 100), 4.95%, 07/01/261 | 100 | 106 | 0.05 | ||||||
| California Infrastructure & Econ. Dev. Bank, Misc. Rev. Ref. Bonds, Series A-1 (Mandatory Put 04/01/14 @ 100), 0.71%, 04/01/381 | 1,000 | 1,003 | 0.48 | ||||||
| California Infrastructure & Econ. Dev. Bank, Public Imps. Misc. Rev. Bonds: | |||||||||
| 4.50%, 10/01/25 | 100 | 111 | 0.05 | ||||||
| 4.50%, 10/01/26 | 100 | 111 | 0.05 | ||||||
| California Infrastructure & Econ. Dev. Bank, Rec. Facs. Imps. Rev. Bonds: | |||||||||
| 5.00%, 02/01/18 | 100 | 116 | 0.06 | ||||||
| 5.00%, 02/01/19 | 100 | 115 | 0.06 | ||||||
| California Infrastructure & Econ. Dev. Bank, Rec. Rev. Ref. Bonds (Mandatory Put 04/01/13 @ 100), 2.50%, 10/01/471 | 1,300 | 1,312 | 0.63 | ||||||
| California Infrastructure & Econ. Dev. Bank, Rev. Bonds, Series A-2 (Mandatory Put 04/01/14 @ 100), 0.71%, 04/01/381 | 1,100 | 1,103 | 0.53 | ||||||
| California Infrastructure & Econ. Dev. Bank, Rev. Bonds, Series B-1 (Mandatory Put 04/01/15 @ 100), 0.51%, 10/01/471 | 1,800 | 1,800 | 0.87 | ||||||
| California Muni. Fin. Auth., College & Univ. Rev. Ref. Bonds, 5.625%, 10/01/23 | 465 | 514 | 0.25 | ||||||
| California Muni. Fin. Auth., College & Univ. Rev. Ref. Bonds, Series B, 4.00%, 10/01/17 | 150 | 169 | 0.08 | ||||||
| California State Dept. of Veterans Affairs, Loc. or GTD Housing Rev. Ref. Bonds, Series A, 2.75%, 12/01/20 | 750 | 777 | 0.37 | ||||||
| California State Dept. of Water Ress., Energy Res. Auth. Rev. Bonds, Sub-Series G, 4.875%, 05/01/18 | 200 | 243 | 0.12 | ||||||
| California State Dept. of Water Ress., Energy Res. Auth. Rev. Bonds, Sub-Series G-11, 5.00%, 05/01/18 | 2,000 | 2,440 | 1.17 | ||||||
| California State Dept. of Water Ress., Energy Res. Auth. Rev. Ref. Bonds, Series H (AGM Insured), 5.00%, 05/01/17 | 100 | 119 | 0.06 | ||||||
| California State Dept. of Water Ress., Energy Res. Auth. Rev. Ref. Bonds, Series K, 5.00%, 05/01/18 | 225 | 275 | 0.13 | ||||||
| California State Dept. of Water Ress., Energy Res. Auth. Rev. Ref. Bonds, Series L, 5.00%, 05/01/21 | 200 | 247 | 0.12 | ||||||
| California State Dept. of Water Ress., Energy Res. Auth. Rev. Ref. Bonds, Series N, 5.00%, 05/01/18 | 1,250 | 1,525 | 0.73 | ||||||
| California State Dept. of Water Ress., Water Rev. Ref. Bonds, 5.00%, 05/01/21 | 100 | 120 | 0.06 | ||||||
| California State Dept. of Water Ress., Water Rev. Ref. Bonds (Escrowed to Maturity) (FGIC Insured), 5.00%, 12/01/12 | 10 | 10 | — | ||||||
| Principal amount (000) | Market value (000) | Percent of net assets | |||||||
| Bonds & notes—continued | |||||||||
| California—continued | |||||||||
| California State Dept. of Water Ress., Water Rev. Ref. Bonds, Series AE: | |||||||||
| 5.00%, 12/01/22 | $ | 1,010 | $ | 1,228 | 0.59 | % | |||
| 5.00%, 12/01/23 | 200 | 242 | 0.12 | ||||||
| California State Dept. of Water Ress., Water Rev. Ref. Bonds, Series AM, 5.00%, 12/01/20 | 1,310 | 1,628 | 0.78 | ||||||
| California State Public Works Board, College & Univ. Health Care Facs. Imps. Rev. Bonds, Series A, 5.00%, 03/01/14 | 200 | 212 | 0.10 | ||||||
| California State Public Works Board, College & Univ. Imps. Lease Rev. Bonds, 5.00%, 04/01/20 | 200 | 219 | 0.11 | ||||||
| California State Public Works Board, College & Univ. Imps. Lease Rev. Bonds, Series B, 5.00%, 10/01/17 | 300 | 353 | 0.17 | ||||||
| California State Public Works Board, College & Univ. Imps. Lease Rev. Bonds, Series B (NATL-RE FGIC Insured), 4.00%, 03/01/14 | 200 | 209 | 0.10 | ||||||
| California State Public Works Board, College & Univ. Imps. Lease Rev. Bonds, Series B-1, 5.00%, 03/01/18 | 1,350 | 1,589 | 0.76 | ||||||
| California State Public Works Board, College & Univ. Imps. Lease Rev. Bonds, Series C-1, 5.00%, 03/01/19 | 1,100 | 1,331 | 0.64 | ||||||
| California State Public Works Board, Health Care Facs. Imps. Lease Rev. Bonds, Series E, 5.00%, 04/01/15 | 1,315 | 1,454 | 0.70 | ||||||
| California State Public Works Board, Lease Rev. Ref. Bonds, Series A (NATL-RE FGIC Insured), 5.00%, 06/01/15 | 200 | 223 | 0.11 | ||||||
| California State Public Works Board, Lease Rev. Ref. Bonds, Series C (NATL-RE FGIC Insured), 4.00%, 09/01/13 | 200 | 206 | 0.10 | ||||||
| California State Public Works Board, Public Imps. Lease Rev. Bonds, Sub-Series A-1, 5.00%, 03/01/14 | 1,000 | 1,058 | 0.51 | ||||||
| California State Univ., College & Univ. Rev. Ref. Bonds, Series A, 5.00%, 11/01/18 | 750 | 925 | 0.45 | ||||||
| California State Univ., College & Univ. Rev. Ref. Bonds, Series C (NATL-RE Insured), 5.00%, 11/01/21 | 2,600 | 2,928 | 1.41 | ||||||
| California Statewide Comms. Dev. Auth., College & Univ. Imps. Rev. Bonds, 5.00%, 05/15/19 | 1,000 | 1,157 | 0.56 | ||||||
| California Statewide Comms. Dev. Auth., Health Care Facs. Imps. Rev. Bonds, 4.625%, 07/01/21 | 100 | 112 | 0.05 | ||||||
| California Statewide Comms. Dev. Auth., Health Care Facs. Imps. Rev. Bonds, Series A: | |||||||||
| 5.00%, 04/01/13 | 700 | 714 | 0.34 | ||||||
| 5.00%, 04/01/19 | 600 | 719 | 0.35 | ||||||
| California Statewide Comms. Dev. Auth., Health Care Facs. Imps. Rev. Bonds, Series C (AGM Insured), 5.25%, 07/01/16 | 1,100 | 1,263 | 0.61 | ||||||
| California Statewide Comms. Dev. Auth., Health Care Facs. Rev. Ref. Bonds: | |||||||||
| 5.00%, 07/01/14 | 500 | 536 | 0.26 | ||||||
| 5.00%, 07/01/16 | 100 | 110 | 0.05 | ||||||
| 5.00%, 11/01/19 | 1,000 | 1,186 | 0.57 | ||||||
| Calleguas-Las Virgenes Public Fncg. Auth., Water Util. Imps. Rev. Bonds, Series A (Pre-refunded with St. & Loc. Govt. Series to 07/01/13 @ 100) (NATL-RE Insured), 5.00%, 07/01/33 | 100 | 103 | 0.05 | ||||||
| Central Valley Fncg. Auth., Energy Res. Auth. Rev. Ref. Bonds, 3.50%, 07/01/14 | 250 | 260 | 0.13 | ||||||
| Cerritos Public Fncg. Auth., Tax Allocation Rev. Ref. Bonds, Series A (AMBAC Insured), 5.00%, 11/01/19 | 2,000 | 2,213 | 1.06 | ||||||
| City & County of San Francisco, G.O. Public Imps. Prop. Tax Bonds, Series A, 5.00%, 06/15/20 | 1,565 | 1,974 | 0.95 | ||||||
| City of Bakersfield, Solid Waste Mgmt. Disposal Rev. Bonds, Series A (AGM Insured), 4.125%, 09/15/14 | 200 | 214 | 0.10 | ||||||
| City of Chula Vista, Energy Res. Auth. Rev. Ref. Bonds, Series A, 1.65%, 07/01/18 | 1,150 | 1,167 | 0.56 | ||||||
| Principal amount (000) | Market value (000) | Percent of net assets | |||||||
| Bonds & notes—continued | |||||||||
| California—continued | |||||||||
| City of Irvine California, Public Imps. Special Assessment Bonds: | |||||||||
| 4.00%, 09/02/19 | $ | 500 | $ | 517 | 0.25 | % | |||
| 4.375%, 09/02/21 | 700 | 723 | 0.35 | ||||||
| City of Irvine California, Special Assessment Ref. Bonds: | |||||||||
| 0.24%, 09/02/501 | 350 | 350 | 0.17 | ||||||
| 3.00%, 09/02/20 | 1,250 | 1,305 | 0.63 | ||||||
| 3.25%, 09/02/22 | 700 | 718 | 0.35 | ||||||
| 4.00%, 09/02/18 | 500 | 564 | 0.27 | ||||||
| 4.50%, 09/02/22 | 250 | 258 | 0.12 | ||||||
| 4.75%, 09/02/23 | 250 | 258 | 0.12 | ||||||
| City of Long Beach, Port, Airport & Marina Imps. Rev. Bonds, Series A, 5.00%, 05/15/21 | 100 | 123 | 0.06 | ||||||
| City of Long Beach, Port, Airport & Marina. Rev. Ref. Bonds, Series B: | |||||||||
| 5.00%, 05/15/13 | 1,250 | 1,282 | 0.62 | ||||||
| 5.00%, 05/15/20 | 500 | 625 | 0.30 | ||||||
| City of Manhattan Beach, Public Imps. Special Assessment Bonds, 4.375%, 09/02/17 | 120 | 125 | 0.06 | ||||||
| City of Roseville, Energy Res. Auth. Rev. Certs. of Part. Bonds, Series A (NATL-RE FGIC Insured), 5.00%, 02/01/17 | 100 | 108 | 0.05 | ||||||
| City of Roseville, Special Tax Ref. Bonds: | |||||||||
| 3.50%, 09/01/15 | 1,000 | 1,059 | 0.51 | ||||||
| 4.00%, 09/01/16 | 2,000 | 2,178 | 1.05 | ||||||
| City of San Jose, Port, Airport & Marina Imps. Rev. Bonds, Series A-2, 5.00%, 03/01/18 | 700 | 816 | 0.39 | ||||||
| Contra Costa County Public Fncg. Auth., Public Imps. Lease Rev. Bonds, Series A (NATL-RE Insured), 5.00%, 06/01/21 | 275 | 308 | 0.15 | ||||||
| County of El Dorado, Special Tax Rev. Ref. Bonds: | |||||||||
| 5.00%, 09/01/22 | 1,295 | 1,505 | 0.72 | ||||||
| 5.00%, 09/01/24 | 860 | 973 | 0.47 | ||||||
| County of Orange, Port, Airport & Marina Imps. Rev. Bonds, Series B, 5.00%, 07/01/15 | 200 | 222 | 0.11 | ||||||
| County of San Diego, College & Univ. Imps. Rev. Certs. of Part. Bonds, 4.00%, 07/01/16 | 490 | 528 | 0.25 | ||||||
| East Bay Muni. Util. Dist. Rev. Bonds, Series A-1 (Mandatory Put 07/01/14 @ 100), 0.56%, 06/01/251 | 1,395 | 1,395 | 0.67 | ||||||
| East Bay Muni. Util. Dist., Water Rev. Ref. Bonds, Series A, 4.00%, 06/01/14 | 100 | 106 | 0.05 | ||||||
| East Bay Regional Park Dist., G.O. Prop. Tax Ref. Bonds, 5.00%, 09/01/14 | 100 | 109 | 0.05 | ||||||
| Golden State Tobacco Securitization Corp., Misc. Purpose Rev. Bonds, Series 2003 A-1 (Pre-refunded with Agencies to 06/01/13 @ 100), 6.75%, 06/01/39 | 1,300 | 1,349 | 0.65 | ||||||
| Golden State Tobacco Securitization Corp., Misc. Purposes Rev. Bonds (Pre-refunded with FHLMC and St. & Loc. Govt. Series to 06/01/13 @ 100) (AGM Insured), 5.00%, 06/01/43 | 150 | 154 | 0.07 | ||||||
| Grossmont-Cuyamaca Comm. College Dist., G.O. College & Univ. Imps. Bonds, Series A (NATL-RE Insured), 5.00%, 08/01/16 | 40 | 41 | 0.02 | ||||||
| Imperial Irrigation Dist., Energy Res. Auth. Rev. Ref. Bonds: | |||||||||
| 5.00%, 11/01/17 | 100 | 119 | 0.06 | ||||||
| 5.25%, 11/01/25 | 100 | 115 | 0.06 | ||||||
| Imperial Irrigation Dist., Energy Res. Auth. Rev. Ref. Bonds, Series C, 5.00%, 11/01/22 | 700 | 839 | 0.40 | ||||||
| Irvine Public Facs. & Infrastructure Auth., Public Imps. Special Assessment Bonds, Series A: | |||||||||
| 3.00%, 09/02/15 | 200 | 206 | 0.10 | ||||||
| 4.00%, 09/02/21 | 1,350 | 1,393 | 0.67 | ||||||
| Principal amount (000) | Market value (000) | Percent of net assets | |||||||
| Bonds & notes—continued | |||||||||
| California—continued | |||||||||
| 4.00%, 09/02/23 | $ | 430 | $ | 443 | 0.21 | % | |||
| Irvine Ranch Water Dist., Water Rev. Certs. of Part. Ref. Bonds, 5.00%, 03/01/17 | 100 | 118 | 0.06 | ||||||
| Las Virgenes Unified School Dist., G.O. School Imps. Prop. Tax Bonds, Series A (AGM Insured), 4.25%, 08/01/15 | 100 | 110 | 0.05 | ||||||
| Lincoln Public Fncg. Auth., Public Imps. Special Tax Bonds, Series A (AMBAC Insured), 4.50%, 09/01/21 | 840 | 896 | 0.43 | ||||||
| Long Beach Bond Fin. Auth., Misc. Rev. Ref. Bonds: | |||||||||
| 4.00%, 11/01/20 | 750 | 861 | 0.41 | ||||||
| 5.00%, 11/01/21 | 500 | 610 | 0.29 | ||||||
| Long Beach Comm. College Dist., G.O. Prop. Tax College & Univ. Imps. Bonds, Series A, 5.00%, 06/01/22 | 100 | 116 | 0.06 | ||||||
| Los Angeles County Metropolitan Trans. Auth., Sales Tax Rev. Ref. Bonds: | |||||||||
| 5.00%, 07/01/16 | 500 | 583 | 0.28 | ||||||
| 5.00%, 07/01/21 | 1,000 | 1,279 | 0.62 | ||||||
| Los Angeles County Metropolitan Trans. Auth., Sales Tax Rev. Ref. Bonds, Series B: | |||||||||
| 5.00%, 07/01/18 | 1,000 | 1,226 | 0.59 | ||||||
| 5.00%, 07/01/21 | 900 | 1,143 | 0.55 | ||||||
| Los Angeles Dept. of Airports, Port, Airport & Marina Imps. Rev. Bonds, Series A, 5.00%, 05/15/29 | 200 | 230 | 0.11 | ||||||
| Los Angeles Dept. of Airports, Port, Airport & Marina Imps. Rev. Bonds, Series D: | |||||||||
| 5.00%, 05/15/19 | 850 | 1,044 | 0.50 | ||||||
| 5.00%, 05/15/23 | 750 | 905 | 0.44 | ||||||
| Los Angeles Dept. of Airports, Port, Airport & Marina Rev. Ref. Bonds, 5.00%, 05/15/22 | 700 | 849 | 0.41 | ||||||
| Los Angeles Dept. of Water & Power, Energy Res. Auth. Rev. Bonds, Series B (AGM Insured), 5.125%, 07/01/20 | 250 | 258 | 0.12 | ||||||
| Los Angeles Dept. of Water & Power, Energy Res. Auth. Rev. Ref. Bonds, Series A, 5.00%, 07/01/18 | 300 | 368 | 0.18 | ||||||
| Los Angeles Dept. of Water & Power, Water Util. Imps. Rev. Bonds, Series B, 5.00%, 07/01/20 | 200 | 248 | 0.12 | ||||||
| Los Angeles Harbor Dept., Port, Airport & Marina Rev. Ref. Bonds, Series C, 5.00%, 08/01/13 | 100 | 104 | 0.05 | ||||||
| Los Angeles Unified School Dist., G.O. Prop. Tax Rev. Ref. Bonds, Series A-1, 5.00%, 07/01/20 | 1,000 | 1,251 | 0.60 | ||||||
| Los Angeles Unified School Dist., G.O. School Imps. Prop. Tax Bonds, Series A (Pre-refunded with St. & Loc. Govt. Series to 07/01/13 @ 100) (AGM Insured), 5.25%, 07/01/20 | 100 | 103 | 0.05 | ||||||
| Los Angeles Unified School Dist., G.O. School Imps. Prop. Tax Bonds, Series I: | |||||||||
| 5.00%, 07/01/14 | 200 | 215 | 0.10 | ||||||
| 5.00%, 07/01/24 | 100 | 120 | 0.06 | ||||||
| Los Rios Comm. College Dist., G.O. Prop. Tax Ref. Bonds, 5.00%, 08/01/20 | 900 | 1,122 | 0.54 | ||||||
| Metropolitan Water Dist. of Southern California, G.O. Prop. Tax Ref. Bonds, Series A, 5.00%, 03/01/17 | 100 | 111 | 0.05 | ||||||
| Metropolitan Water Dist. of Southern California, Water Rev. Ref. Bonds, Series B, 5.00%, 07/01/15 | 500 | 562 | 0.27 | ||||||
| Metropolitan Water Dist. of Southern California, Water Rev. Ref. Bonds, Series B-1 (Mandatory Put 05/01/15 @ 100), 0.56%, 07/01/271 | 1,500 | 1,500 | 0.72 | ||||||
| Metropolitan Water Dist. of Southern California, Water Rev. Ref. Bonds, Series B-2 (Mandatory Put 05/01/15 @ 100), 0.56%, 07/01/271 | 1,000 | 1,000 | 0.48 | ||||||
| Metropolitan Water Dist. of Southern California, Water Util. Imps. Rev. Bonds, Series A, 4.00%, 01/01/14 | 100 | 104 | 0.05 | ||||||
| Principal amount (000) | Market value (000) | Percent of net assets | |||||||
| Bonds & notes—continued | |||||||||
| California—continued | |||||||||
| Modesto Irrigation Dist., Energy Res. Auth. Rev. Ref. Bonds, Series A, 5.00%, 07/01/17 | $ | 400 | $ | 470 | 0.23 | % | |||
| Moreno Valley Unified School Dist., G.O. School Imps. Prop. Tax Ref. Bonds (NATL-RE Insured), 5.25%, 08/01/19 | 380 | 457 | 0.22 | ||||||
| Mountain View Shoreline Regional Park Comm., Tax Allocation Rev. Ref. Bonds, Series A: | |||||||||
| 5.00%, 08/01/19 | 420 | 478 | 0.23 | ||||||
| 5.00%, 08/01/20 | 375 | 429 | 0.21 | ||||||
| Napa Valley Comm. College Dist., G.O. School Imps. Prop. Tax Bonds, Series B (Pre-refunded with St. & Loc. Govt. Series 08/01/15 @ 100) (NATL-RE Insured), 5.00%, 08/01/18 | 150 | 169 | 0.08 | ||||||
| Northern California Power Agcy., Energy Res. Auth. Imps. Rev. Bonds, Series A: | |||||||||
| 5.00%, 06/01/16 | 750 | 856 | 0.41 | ||||||
| 5.00%, 07/01/23 | 745 | 863 | 0.42 | ||||||
| 5.50%, 07/01/21 | 1,000 | 1,222 | 0.59 | ||||||
| Northern California Power Agcy., Energy Res. Auth. Rev. Ref. Bonds, Series A: | |||||||||
| 5.00%, 07/01/17 | 200 | 236 | 0.11 | ||||||
| 5.00%, 07/01/19 | 200 | 244 | 0.12 | ||||||
| Ohlone Comm. College Dist., G.O. Ref. Bonds: | |||||||||
| 5.00%, 08/01/24 | 1,000 | 1,243 | 0.60 | ||||||
| 5.00%, 08/01/25 | 1,000 | 1,232 | 0.59 | ||||||
| Perris Union High School Dist., School Imps. Special Tax Bonds: | |||||||||
| 4.25%, 09/01/19 | 360 | 371 | 0.18 | ||||||
| 4.50%, 09/01/20 | 445 | 459 | 0.22 | ||||||
| Poway Unified School Dist. Public Fncg. Auth., Special Tax: | |||||||||
| 3.375%, 09/15/17 | 500 | 517 | 0.25 | ||||||
| 3.75%, 09/15/18 | 770 | 796 | 0.38 | ||||||
| 5.00%, 09/01/20 | 625 | 729 | 0.35 | ||||||
| Rancho Water Dist. Fncg. Auth., Water Rev. Ref. Bonds, Series D (Radian Insured), 4.20%, 09/02/17 | 100 | 106 | 0.05 | ||||||
| Roseville Natural Gas Fin. Auth., Gas Util. Imps. Rev. Bonds, 5.00%, 02/15/14 | 100 | 105 | 0.05 | ||||||
| Sacramento Muni. Util. Dist., Energy Res. Auth. Rev. Bonds, Series R (NATL-RE Insured), 5.00%, 08/15/17 | 305 | 316 | 0.15 | ||||||
| Sacramento Muni. Util. Dist., Energy Res. Auth. Rev. Bonds, Series R (Pre-refunded with St. & Loc. Govt. Series to 08/15/2013 @ 100), (NATL-RE Insured), 5.00%, 08/15/17 | 695 | 721 | 0.35 | ||||||
| San Diego Comm. College Dist., G.O. Prop. Tax Ref. Bonds: | |||||||||
| 5.00%, 08/01/18 | 1,000 | 1,240 | 0.60 | ||||||
| 5.00%, 08/01/20 | 775 | 981 | 0.47 | ||||||
| San Diego County Regional Airport Auth., Port, Airport & Marina Imps. Rev. Bonds, Sub-Series A: | |||||||||
| 5.00%, 07/01/18 | 850 | 1,017 | 0.49 | ||||||
| 5.00%, 07/01/20 | 700 | 863 | 0.42 | ||||||
| San Diego County Water Auth., Water Rev. Certs. of Part. Ref. Bonds, Series 2008 A (AGM Insured), 5.00%, 05/01/14 | 560 | 598 | 0.29 | ||||||
| San Diego County Water Auth., Water Rev. Certs. of Part. Ref. Bonds, Series A (NATL-RE FGIC Insured), 5.25%, 05/01/18 | 700 | 858 | 0.41 | ||||||
| San Diego County Water Auth., Water Rev. Ref. Bonds, Series A, 5.00%, 05/01/20 | 750 | 939 | 0.45 | ||||||
| San Diego County Water Auth., Water Rev. Ref. Bonds, Series S-1, 5.00%, 07/01/16 | 375 | 434 | 0.21 | ||||||
| San Diego Public Facs. Fncg. Auth., Sewer Rev. Ref. Bonds, Series B, 5.00%, 05/15/22 | 100 | 122 | 0.06 | ||||||
| San Diego Public Facs. Fncg. Auth., Water Rev. Ref. Bonds, Series A: | |||||||||
| Principal amount (000) | Market value (000) | Percent of net assets | |||||||
| Bonds & notes—continued | |||||||||
| California—continued | |||||||||
| 4.00%, 08/01/14 | $ | 100 | $ | 106 | 0.05 | % | |||
| 4.00%, 08/01/20 | 100 | 114 | 0.05 | ||||||
| San Francisco Bay Area Rapid Transit Dist., Sales Tax Rev. Ref. Bonds, 5.00%, 07/01/22 | 800 | 978 | 0.47 | ||||||
| San Francisco Bay Area Rapid Transit Dist., Sales Tax Rev. Ref. Bonds, Series A, 4.00%, 07/01/21 | 200 | 237 | 0.11 | ||||||
| San Francisco City & County Airports Commission, Port, Airport & Marina Imps. Rev. Bonds, Series A, 4.90%, 05/01/29 | 1,200 | 1,373 | 0.66 | ||||||
| San Francisco City & County Airports Commission, Port, Airport & Marina Imps. Rev. Bonds, Series E, 5.25%, 05/01/24 | 100 | 119 | 0.06 | ||||||
| San Francisco City & County Airports Commission, Port, Airport & Marina Rev. Ref. Bonds, Series B, 5.00%, 05/01/19 | 400 | 488 | 0.23 | ||||||
| San Francisco City & County Airports Commission, Port, Airport & Marina Rev. Ref. Bonds, Series C2, 5.00%, 05/01/21 | 300 | 356 | 0.17 | ||||||
| San Francisco City & County Public Utils. Commission, Water Rev. Ref. Bonds, Sub-Series D, 5.00%, 11/01/20 | 800 | 1,008 | 0.49 | ||||||
| San Francisco City & County Public Utils. Commission, Water Util. Imps. Rev. Bonds, Sub-Series A, 3.00%, 11/01/12 | 100 | 100 | 0.05 | ||||||
| San Francisco City & County Redev. Agcy., Tax Allocation, Series C: | |||||||||
| 4.75%, 08/01/17 | 265 | 290 | 0.14 | ||||||
| 5.00%, 08/01/18 | 275 | 306 | 0.15 | ||||||
| 5.25%, 08/01/19 | 290 | 329 | 0.16 | ||||||
| San Francisco Unified School Dist., G.O. School Imps. Prop. Tax Bonds, Series A, 5.00%, 06/15/19 | 1,000 | 1,247 | 0.60 | ||||||
| San Jose Redev. Agcy., Tax Allocation Rev. Ref. Bonds, 5.00%, 08/01/22 | 500 | 521 | 0.25 | ||||||
| San Jose Redev. Agcy., Tax Allocation Rev. Ref. Bonds (NATL-RE Insured), 4.54%, 08/01/18 | 400 | 401 | 0.19 | ||||||
| San Mateo County Comm. College Dist., College & Univ. Imps. Certs. of Part. Lease Bonds (Pre-refunded with St. & Loc. Govt. Series to 10/01/14 @ 100) (NATL-RE Insured), 5.25%, 10/01/20 | 1,000 | 1,095 | 0.53 | ||||||
| San Mateo Joint Powers Fncg. Auth., Lease Rev. Ref. Bonds, Series A, 5.25%, 07/15/23 | 200 | 238 | 0.11 | ||||||
| Santa Ana Community Redev. Agcy., Tax Allocation Rev. Ref. Bonds,, 6.00%, 09/01/20 | 750 | 892 | 0.43 | ||||||
| Santa Clara County Fncg. Auth., Lease Rev. Ref. Bonds, 5.00%, 11/15/22 | 285 | 328 | 0.16 | ||||||
| Santa Margarita Water Dist., Special Tax Ref. Bonds: | |||||||||
| 4.125%, 09/01/20 | 625 | 645 | 0.31 | ||||||
| 4.25%, 09/01/21 | 1,560 | 1,609 | 0.77 | ||||||
| Santaluz Community Facs. Dist. No 2, Special Tax Ref. Bonds, Series A, 5.00%, 09/01/20 | 1,000 | 1,126 | 0.54 | ||||||
| Sonoma-Marin Area Rail Transit Dist., Rev. Bonds, Series A, 5.00%, 03/01/21 | 1,000 | 1,253 | 0.60 | ||||||
| South Orange County Public Fncg. Auth., Special Tax Ref. Bonds, Series A (AMBAC Insured): | |||||||||
| 5.00%, 08/15/15 | 900 | 989 | 0.48 | ||||||
| 5.00%, 08/15/20 | 1,000 | 1,054 | 0.51 | ||||||
| South Placer Wastewater Auth., Solid Waste Mgmt. Rev. Ref. Bonds, Series D, 1.04%, 11/01/141 | 1,700 | 1,701 | 0.82 | ||||||
| Southern California Public Power Auth., Energy Res. Auth. Imps. Rev. Bonds: | |||||||||
| 5.00%, 07/01/18 | 200 | 245 | 0.12 | ||||||
| 5.00%, 07/01/20 | 1,550 | 1,949 | 0.94 | ||||||
| 5.00%, 07/01/23 | 800 | 975 | 0.47 | ||||||
| Southern California Public Power Auth., Energy Res. Auth. Imps. Rev. Bonds, Series A, 4.00%, 07/01/21 | 500 | 584 | 0.28 | ||||||
| Principal amount (000) | Market value (000) | Percent of net assets | |||||||
| Bonds & notes—continued | |||||||||
| California—continued | |||||||||
| Southern California Public Power Auth., Energy Res. Auth. Rev. Ref. Bonds: | |||||||||
| 5.00%, 07/01/16 | $ | 500 | $ | 580 | 0.28 | % | |||
| 5.00%, 07/01/18 | 350 | 428 | 0.21 | ||||||
| Southern California Public Power Auth., Energy Res. Auth. Rev. Ref. Bonds, Series A: | |||||||||
| 5.00%, 07/01/19 | 1,000 | 1,243 | 0.60 | ||||||
| 5.00%, 07/01/20 | 245 | 308 | 0.15 | ||||||
| Southern California Public Power Auth., Misc. Rev. Ref. Bonds, 5.00%, 07/01/23 | 100 | 119 | 0.06 | ||||||
| State of California, G.O. Cash Flow Mgmt. Sales Tax Rev. Bonds, Series A: | |||||||||
| 5.25%, 07/01/13 | 125 | 129 | 0.06 | ||||||
| 5.25%, 07/01/14 | 1,175 | 1,271 | 0.61 | ||||||
| State of California, G.O. Cash Flow Mgmt. Sales Tax Rev. Bonds, Series A (Escrowed to Maturity), 5.25%, 07/01/14 | 270 | 292 | 0.14 | ||||||
| State of California, G.O. Cash Flow Mgmt. Sales Tax Rev. Bonds, Series A (Pre-refunded with St. & Loc. Govt. Series to 07/01/14 @ 100), 5.00%, 07/01/15 | 1,800 | 1,941 | 0.93 | ||||||
| State of California, G.O. Correctional Facs. Imps. Prop. Tax Bonds, 5.25%, 10/01/20 | 100 | 122 | 0.06 | ||||||
| State of California, G.O. General Fund Ref. Bonds: | |||||||||
| 5.00%, 11/01/13 | 300 | 314 | 0.15 | ||||||
| 5.00%, 02/01/19 | 2,000 | 2,425 | 1.17 | ||||||
| 5.00%, 02/01/20 | 2,500 | 3,049 | 1.47 | ||||||
| 5.25%, 02/01/14 | 10 | 10 | 0.01 | ||||||
| State of California, G.O. General Fund Ref. Bonds (Pre-refunded with St. & Loc. Govt. Series to 08/01/13 @ 100), 5.25%, 02/01/14 | 390 | 405 | 0.19 | ||||||
| State of California, G.O. General Fund Ref. Bonds, Series CF, 2.25%, 12/01/13 | 2,950 | 2,998 | 1.44 | ||||||
| State of California, G.O. General Fund Ref. Notes, 5.00%, 08/01/20 | 375 | 441 | 0.21 | ||||||
| State of California, G.O. Misc. Rev. Ref. Bonds, 5.00%, 09/01/19 | 1,300 | 1,594 | 0.77 | ||||||
| State of California, G.O. Prop. Tax Ref. Bonds: | |||||||||
| 5.00%, 04/01/19 | 600 | 730 | 0.35 | ||||||
| 5.25%, 10/01/20 | 650 | 792 | 0.38 | ||||||
| State of California, G.O. Prop. Tax Ref. Bonds, Series B (Mandatory Put 07/01/14 @ 100), 5.00%, 07/01/231 | 100 | 107 | 0.05 | ||||||
| State of California, G.O. Public Imps. Misc. Tax Bonds, 5.50%, 04/01/18 | 100 | 122 | 0.06 | ||||||
| State of California, G.O. Public Imps. Prop. Tax Bonds (Pre-refunded with St. & Loc. Govt. Series to 02/01/14 @ 100), 5.00%, 02/01/33 | 2,000 | 2,118 | 1.02 | ||||||
| State of California, G.O. Public Imps. Prop. Tax Bonds (Pre-refunded with St. & Loc. Govt. Series to 04/01/14 @ 100), 5.50%, 04/01/30 | 2,000 | 2,148 | 1.03 | ||||||
| State of California, G.O. Sales Tax Rev. Bonds, Series A, 5.25%, 07/01/21 | 1,060 | 1,311 | 0.63 | ||||||
| State of California, G.O. Sales Tax Rev. Ref. Bonds, Series A, 5.00%, 07/01/17 | 950 | 1,129 | 0.54 | ||||||
| State of California, G.O. Water Util. Imps. Misc. Tax Bonds (NATL-RE Insured), 6.00%, 08/01/20 | 5 | 5 | — | ||||||
| State of California, G.O. Water Util. Imps. Prop. Tax Bonds, 5.00%, 03/01/14 | 300 | 318 | 0.15 | ||||||
| Tobacco Securitization Auth. of Southern California, Rev. Ref. Bonds, Series A-1, 4.75%, 06/01/25 | 500 | 501 | 0.24 | ||||||
| Tuolumne Wind Project Auth., Energy Res. Auth. Imps. Rev. Bonds, Series A: | |||||||||
| 5.00%, 01/01/15 | 100 | 109 | 0.05 | ||||||
| 5.00%, 01/01/22 | 1,000 | 1,160 | 0.56 | ||||||
| 5.25%, 01/01/24 | 100 | 116 | 0.06 | ||||||
| Turlock Irrigation Dist., Energy Res. Auth. Rev. Ref. Bonds: | |||||||||
| 5.00%, 01/01/18 | 500 | 591 | 0.28 | ||||||
| 5.00%, 01/01/22 | 700 | 835 | 0.40 | ||||||
| Turlock Irrigation Dist., Energy Res. Auth. Rev. Ref. Bonds, Series A, 3.00%, 01/01/13 | 1,000 | 1,004 | 0.48 | ||||||
| Principal amount (000) | Market value (000) | Percent of net assets | ||||||||
| Bonds & notes—continued | ||||||||||
| California—continued | ||||||||||
| Univ. of California, College & Univ. Imps. Rev. Bonds, Series D (NATL-RE FGIC Insured), 5.00%, 05/15/23 | $ | 130 | $ | 152 | 0.07 | % | ||||
| Univ. of California, College & Univ. Imps. Rev. Bonds, Series G (NATL-RE FGIC Insured), 5.00%, 05/15/24 | 200 | 207 | 0.10 | |||||||
| Univ. of California, College & Univ. Rev. Ref. Bonds, Series E: | ||||||||||
| 4.00%, 05/15/17 | 500 | 571 | 0.27 | |||||||
| 5.00%, 05/15/20 | 500 | 626 | 0.30 | |||||||
| Univ. of California, College & Univ. Rev. Ref. Bonds, Series G, 4.00%, 05/15/21 | 1,000 | 1,172 | 0.56 | |||||||
| Vallejo Sanitation & Flood Control Dist., Solid Waste Mgmt. Certs. of Part. Ref. Bonds (AMBAC Insured), 4.00%, 05/01/18 | 200 | 209 | 0.10 | |||||||
| 183,512 | 88.26 | |||||||||
| District of Columbia - 0.06% | ||||||||||
| Metropolitan Washington Airports Auth., Port, Airport & Marina Rev. Ref. Bonds, Series C, 5.00%, 10/01/17 | 100 | 119 | 0.06 | |||||||
| 119 | 0.06 | |||||||||
| Florida - 0.28% | ||||||||||
| Citizens Prop. Insurance Corp., Cash Flow Mgmt. Misc. Rev. Bonds, Series A-1, 5.00%, 06/01/19 | 500 | 581 | 0.28 | |||||||
| 581 | 0.28 | |||||||||
| Iowa - 0.06% | ||||||||||
| State of Iowa, General Fund Public Imps. Rev. Bonds, Series A, 5.00%, 06/01/27 | 100 | 120 | 0.06 | |||||||
| 120 | 0.06 | |||||||||
| Michigan - 0.06% | ||||||||||
| Michigan State Hospital Fin. Auth., Health Care Facs. Rev. Ref. Bonds, 5.25%, 11/15/24 | 100 | 115 | 0.06 | |||||||
| 115 | 0.06 | |||||||||
| Puerto Rico - 1.50% | ||||||||||
| Puerto Rico Commonwealth Aqueduct & Sewer Auth., Water Rev. Ref. Bonds, Series A, 5.00%, 07/01/19 | 500 | 542 | 0.26 | |||||||
| Puerto Rico Electric Power Auth., Energy Res. Auth. Imps. Rev. Bonds, Series NN (Pre-refunded with St. & Loc. Govt. Series to 07/01/13 @ 100), 5.50%, 07/01/18 | 1,435 | 1,486 | 0.71 | |||||||
| Puerto Rico Ind. Tourist Educ. Medical & Environmental Cultural Facs. Fncg. Auth., Health Care Facs. Rev. Ref. Bonds, Series A, 5.00%, 07/01/17 | 1,000 | 1,098 | 0.53 | |||||||
| 3,126 | 1.50 | |||||||||
| Texas - 0.05% | ||||||||||
| City of San Antonio, Energy Res. Auth. Imps. Rev. Bonds, Series A, 5.00%, 02/01/24 | 100 | 115 | 0.05 | |||||||
| 115 | 0.05 | |||||||||
| Total bonds & notes (cost: $178,969,035) | 187,688 | 90.27 | ||||||||
| Principal amount (000) | Market value (000) | Percent of net assets | ||||||||||||
| Short-term securities - 9.99% | ||||||||||||||
| California Infrastructure & Econ. Dev. Bank, Misc. Rev. Ref. Bonds, 0.17%, 10/01/471 | $ | 650 | $ | 650 | 0.31 | % | ||||||||
| California Infrastructure & Econ. Dev. Bank, Rec. Facs. Imps. Rev. Bonds, 0.27%, 12/01/361 | 1,470 | 1,470 | 0.71 | |||||||||||
| California Muni. Fin. Auth., Ind. Imps. Rev. Bonds:1 | ||||||||||||||
| 0.20%, 11/01/35 | 1,550 | 1,550 | 0.75 | |||||||||||
| 0.22%, 11/01/35 | 1,250 | 1,250 | 0.60 | |||||||||||
| California Pollution Control Fncg. Auth., Energy Res. Auth. Rev. Ref. Bonds, 0.21%, 11/01/261 | 1,000 | 1,000 | 0.48 | |||||||||||
| California Statewide Comms. Dev. Auth., Health Care Facs. Rev. Ref. Bonds, Series A, 0.18%, 08/15/361 | 1,000 | 1,000 | 0.48 | |||||||||||
| California Statewide Comms. Dev. Auth., Res. Recovery Rev. Ref. Bonds, 0.22%, 05/15/241 | 700 | 700 | 0.34 | |||||||||||
| City of Irvine California, Public Imps. Special Assessment Bonds, Series A, 0.24%, 09/02/291 | 1,250 | 1,250 | 0.60 | |||||||||||
| City of Irvine California, Public Imps. Special Assessment Bonds, Series B, 0.24%, 09/02/291 | 650 | 650 | 0.31 | |||||||||||
| City of Irvine California, Special Assessment Ref. Bonds, 0.24%, 09/02/501 | 750 | 750 | 0.36 | |||||||||||
| Irvine Unified School Dist., School Imps. Special Tax Bonds, 0.20%, 09/01/511 | 3,550 | 3,550 | 1.71 | |||||||||||
| Los Angeles Dept. of Water & Power, Energy Res. Auth. Rev. Ref. Bonds, Sub-Series A-1, 0.19%, 07/01/351 | 3,000 | 3,000 | 1.44 | |||||||||||
| Los Angeles Dept. of Water & Power, Energy Res. Auth. Rev. Ref. Bonds, Sub-Series B-3, 0.26%, 07/01/341 | 500 | 500 | 0.24 | |||||||||||
| Metropolitan Water Dist. of Southern California, Water Rev. Ref. Bonds, Series B-3, 0.19%, 07/01/351 | 1,000 | 1,000 | 0.48 | |||||||||||
| State of California, G.O. General Fund School Imps. Bonds, 0.20%, 05/01/331 | 2,450 | 2,450 | 1.18 | |||||||||||
| Total Short-term securities (cost: $20,770,000) | 20,770 | 9.99 | ||||||||||||
| Total investment securities (cost: $199,739,035) | 208,458 | 100.26 | ||||||||||||
| Other assets less liabilities | (545) | (0.26) | ||||||||||||
| Net assets | $ | 207,913 | 100.00 | % | ||||||||||
| 1 | Coupon rate may change periodically. For short-term securities, the date of the next scheduled coupon rate change is considered to be the maturity date. | |||||||||||||
| Key to abbreviations | ||||||||||||||
| Agcy. | = Agency | |||||||||||||
| AGM | = Assured Guaranty Municipal Corporation | |||||||||||||
| AMBAC | = American Municipal Bond Assurance Corporation | |||||||||||||
| Auth. | = Authority | |||||||||||||
| CA Mtg. Ins. | = California Mortgage Insurance | |||||||||||||
| Certs. of Part. | = Certificates of Participation | |||||||||||||
| CIFG | = CDC IXIS Financial Guaranty | |||||||||||||
| Comm. | = Community | |||||||||||||
| Comms. | = Communities | |||||||||||||
| Corp. | = Corporation | |||||||||||||
| Corps. | = Corporations |
| Dept. | = Department |
| Dev. | = Development |
| Dist. | = District |
| Econ. | = Economic |
| Educ. | = Educational |
| Facs. | = Facilities |
| FGIC | = Financial Guaranty Insurance Company |
| FHLMC | = Federal Home Loan Mortgage Corporation |
| Fin. | = Finance |
| Fncg. | = Financing |
| G.O. | = General Obligation |
| Govt. | = Government |
| GTD | = Guaranteed |
| Imps. | = Improvements |
| Ind. | = Industrial |
| Loc. | = Local |
| Mgmt. | = Management |
| Misc. | = Miscellaneous |
| Muni. | = Municipal |
| NATL-RE | = National Reinsurance |
| Prop. | = Property |
| Rec. | = Recreational |
| Redev. | = Redevelopment |
| Ref. | = Refunding |
| Res. | = Resource |
| Ress. | = Resources |
| Rev. | = Revenue |
| St. | = State |
| Trans. | = Transportation |
| Univ. | = University |
| Util. | = Utility |
| Utils. | = Utilities |
| Capital California Short-Term Municipal Fund | |
| October 31, 2012 | |
Growth of $25,000 investment
Here’s how a $25,000 investment in the Capital California Short-Term Municipal Fund grew between April 13, 2010, when the fund began operations, and October 31, 2012, the end of the fund’s fiscal year.
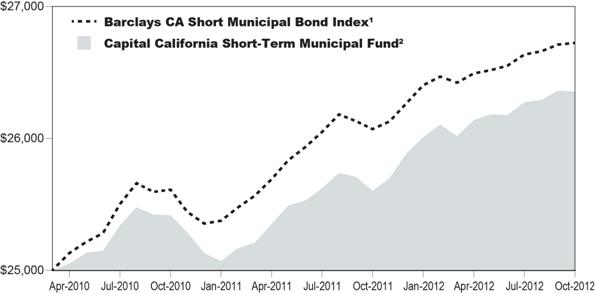
1 The index is unmanaged, and its results include reinvested distributions but do not reflect the effect of sales
charges, commissions, or expenses.
2 Includes reinvested dividends and capital gain distributions.
Results are for past periods and are not predictive of results for future periods. Current and future results may be lower or higher than those shown. Share price and returns will vary so investors may lose money. The results shown are before taxes on fund distributions and sale of fund shares.
Investment portfolio – quality ratings*

Capital California Short-Term Municipal Fund
Schedule of Investments
at October 31, 2012
| Principal amount (000) | Market value (000) | Percent of net assets | ||||||
| Bonds & notes - 72.39% | ||||||||
| California - 69.94% | ||||||||
| Abag Fin. Auth. for Nonprofit Corps., Health Care Facs. Rev. Ref. Bonds (CA Mtg. Ins.), 4.00%, 05/15/16 | $ | 500 | $ | 505 | 0.47 | % | ||
| Abag Fin. Auth. for Nonprofit Corps., Health Care Facs. Rev. Ref. Bonds, Series A, 5.00%, 08/01/16 | 200 | 229 | 0.21 | |||||
| Abag Fin. Auth. for Nonprofit Corps., Health Care Facs. Rev. Ref. Bonds, Series A (CA Mtg. Ins.): | ||||||||
| 4.00%, 04/01/16 | 400 | 439 | 0.41 | |||||
| 5.00%, 04/01/18 | 250 | 292 | 0.27 | |||||
| Bay Area Toll Auth., Highway Tolls Rev. Ref. Bonds: | ||||||||
| 4.00%, 04/01/18 | 250 | 290 | 0.27 | |||||
| 5.00%, 04/01/17 | 400 | 473 | 0.44 | |||||
| Bay Area Toll Auth., Rev. Bonds (Mandatory Put 08/01/17 @ 100), 1.45%, 04/01/451 | 750 | 763 | 0.71 | |||||
| California Educ. Facs. Auth., College & Univ. Imps. Rev. Bonds: | ||||||||
| 4.00%, 10/01/15 | 250 | 272 | 0.25 | |||||
| 4.00%, 09/01/16 | 75 | 85 | 0.08 | |||||
| 4.00%, 02/01/17 | 100 | 114 | 0.11 | |||||
| 5.00%, 04/01/14 | 100 | 105 | 0.10 | |||||
| 5.00%, 10/01/16 | 250 | 284 | 0.26 | |||||
| California Educ. Facs. Auth., College & Univ. Imps. Rev. Bonds, Series A, 5.00%, 10/01/15 | 500 | 553 | 0.51 | |||||
| California Educ. Facs. Auth., College & Univ. Imps. Rev. Ref. Bonds, Series A, 3.00%, 11/01/16 | 400 | 428 | 0.40 | |||||
| California Educ. Facs. Auth., College & Univ. Rev. Ref. Bonds: | ||||||||
| 3.00%, 10/01/15 | 150 | 158 | 0.15 | |||||
| 4.00%, 04/01/16 | 300 | 329 | 0.31 | |||||
| 4.00%, 04/01/17 | 200 | 223 | 0.21 | |||||
| California Health Facs. Fncg. Auth., Health Care Facs. Imps. Rev. Bonds, 5.00%, 08/15/17 | 510 | 594 | 0.55 | |||||
| California Health Facs. Fncg. Auth., Health Care Facs. Imps. Rev. Bonds, Series B, 5.00%, 08/15/16 | 200 | 231 | 0.22 | |||||
| California Health Facs. Fncg. Auth., Health Care Facs. Imps. Rev. Bonds, Series I, 5.125%, 07/01/22 | 690 | 747 | 0.70 | |||||
| California Health Facs. Fncg. Auth., Health Care Facs. Rev. Ref. Bonds: | ||||||||
| 5.00%, 08/15/15 | 150 | 167 | 0.16 | |||||
| 5.00%, 11/15/16 | 225 | 252 | 0.23 | |||||
| California Health Facs. Fncg. Auth., Health Care Facs. Rev. Ref. Bonds, Series A: | ||||||||
| 4.00%, 11/15/13 | 300 | 311 | 0.29 | |||||
| 5.00%, 08/15/14 | 100 | 108 | 0.10 | |||||
| 5.00%, 11/15/16 | 250 | 288 | 0.27 | |||||
| 5.00%, 10/01/18 | 500 | 605 | 0.56 | |||||
| California Health Facs. Fncg. Auth., Health Care Facs. Rev. Ref. Bonds, Series A-3, 4.00%, 11/15/15 | 150 | 164 | 0.15 | |||||
| California Health Facs. Fncg. Auth., Health Care Facs. Rev. Ref. Bonds, Series C (Mandatory Put 10/16/14 @ 100), 5.00%, 07/01/341 | 200 | 215 | 0.20 | |||||
| California Health Facs. Fncg. Auth., Health Care Facs. Rev. Ref. Bonds, Series I (Mandatory Put 07/01/14 @ 100), 4.95%, 07/01/261 | 100 | 106 | 0.10 | |||||
| California Infrastructure & Econ. Dev. Bank, Misc. Rev. Ref. Bonds, Series A-1 (Mandatory Put 04/01/14 @ 100), 0.71%, 04/01/381 | 500 | 501 | 0.47 | |||||
| California Infrastructure & Econ. Dev. Bank, Rec. Rev. Ref. Bonds (Mandatory Put 04/01/13 @ 100), 2.50%, 10/01/471 | 400 | 404 | 0.38 | |||||
| California Infrastructure & Econ. Dev. Bank, Rev. Bonds, Series A-2 (Mandatory Put 04/01/14 @ 100), 0.71%, 04/01/381 | 600 | 602 | 0.56 | |||||
| Principal amount (000) | Market value (000) | Percent of net assets | |||||||
| Bonds & notes—continued | |||||||||
| California—continued | |||||||||
| California Infrastructure & Econ. Dev. Bank, Rev. Bonds, Series B-1 (Mandatory Put 04/01/15 @ 100), 0.51%, 10/01/471 | $ | 1,000 | $ | 1,000 | 0.93 | % | |||
| California Muni. Fin. Auth., College & Univ. Rev. Ref. Bonds, Series B: | |||||||||
| 4.00%, 10/01/15 | 225 | 245 | 0.23 | ||||||
| 4.00%, 10/01/16 | 200 | 222 | 0.21 | ||||||
| California State Dept. of Water Ress., Energy Res. Auth. Rev. Ref. Bonds, Series H (AGM Insured), 4.50%, 05/01/17 | 200 | 234 | 0.22 | ||||||
| California State Dept. of Water Ress., Energy Res. Auth. Rev. Ref. Bonds, Series L, 5.00%, 05/01/14 | 550 | 588 | 0.55 | ||||||
| California State Dept. of Water Ress., Energy Res. Auth. Rev. Ref. Bonds, Series N, 5.00%, 05/01/18 | 1,250 | 1,525 | 1.42 | ||||||
| California State Dept. of Water Ress., Water Rev. Ref. Bonds, Series AM, 5.00%, 12/01/18 | 500 | 607 | 0.57 | ||||||
| California State Dept. of Water Ress., Water Rev. Ref. Bonds, Sub-Series G-4, 5.00%, 05/01/16 | 1,000 | 1,154 | 1.07 | ||||||
| California State Public Works Board, Public Imps. Lease Rev. Bonds, Series A, 5.00%, 04/01/18 | 400 | 472 | 0.44 | ||||||
| California State Public Works Board, College & Univ. Imps. Lease Rev. Bonds, Series B, 5.00%, 10/01/17 | 475 | 558 | 0.52 | ||||||
| California State Public Works Board, College & Univ. Imps. Lease Rev. Bonds, Series B-1, 4.00%, 03/01/16 | 400 | 439 | 0.41 | ||||||
| California State Public Works Board, College & Univ. Imps. Lease Rev. Bonds, Series C-1, 5.00%, 03/01/16 | 500 | 571 | 0.53 | ||||||
| California State Public Works Board, Health Care Facs. Imps. Rev. Bonds, 5.50%, 06/01/15 | 400 | 431 | 0.40 | ||||||
| California State Public Works Board, Lease Rev. Ref. Bonds, Series A (NATL-RE FGIC Insured): | |||||||||
| 5.00%, 06/01/15 | 100 | 111 | 0.10 | ||||||
| 5.00%, 10/01/16 | 240 | 276 | 0.26 | ||||||
| California State Public Works Board, Rev. Bonds, Series G, 4.00%, 12/01/16 | 325 | 368 | 0.34 | ||||||
| California State Univ., College & Univ. Rev. Ref. Bonds, Series A: | |||||||||
| 5.00%, 11/01/16 | 400 | 470 | 0.44 | ||||||
| 5.00%, 11/01/17 | 350 | 422 | 0.39 | ||||||
| California Statewide Comms. Dev. Auth., Health Care Facs. Imps. Rev. Bonds, Series A, 5.00%, 04/01/13 | 500 | 510 | 0.47 | ||||||
| California Statewide Comms. Dev. Auth., Health Care Facs. Imps. Rev. Bonds, Series C (AGM Insured), 5.25%, 07/01/16 | 500 | 574 | 0.53 | ||||||
| California Statewide Comms. Dev. Auth., Health Care Facs. Imps. Rev. Bonds, Series C (Mandatory Put 05/01/17 @ 100), 5.00%, 11/01/291 | 600 | 695 | 0.65 | ||||||
| California Statewide Comms. Dev. Auth., Health Care Facs. Rev. Ref. Bonds: | |||||||||
| 4.00%, 11/01/14 | 400 | 424 | 0.39 | ||||||
| 5.00%, 07/01/14 | 650 | 697 | 0.65 | ||||||
| 5.00%, 11/01/15 | 300 | 335 | 0.31 | ||||||
| Citizens Prop. Insurance Corp., Cash Flow Mgmt. Misc. Rev. Bonds, Series A-1, 5.00%, 06/01/18 | 500 | 574 | 0.53 | ||||||
| City & County of San Francisco, Certs. of Part. Lease Ref. Bonds, Series A, 5.00%, 10/01/15 | 500 | 560 | 0.52 | ||||||
| City & County of San Francisco, G.O. Public Imps. Prop. Tax Bonds, 5.00%, 06/15/18 | 1,745 | 2,138 | 1.99 | ||||||
| City of Chula Vista, Energy Res. Auth. Rev. Ref. Bonds, Series A, 1.65%, 07/01/18 | 1,100 | 1,116 | 1.04 | ||||||
| City of Los Angeles, Sewer Rev. Ref. Bonds, Series A: | |||||||||
| 3.00%, 06/01/14 | 150 | 156 | 0.15 | ||||||
| 4.00%, 06/01/16 | 100 | 112 | 0.10 | ||||||
| Principal amount (000) | Market value (000) | Percent of net assets | |||||||
| Bonds & notes—continued | |||||||||
| California—continued | |||||||||
| City of San Jose, Port, Airport & Marina Imps. Rev. Bonds, Series A-2, 3.00%, 03/01/15 | $ | 440 | $ | 459 | 0.43 | % | |||
| Contra Costa Water Dist., Water Rev. Ref. Bonds, Series A, 3.50%, 10/01/13 | 500 | 515 | 0.48 | ||||||
| County of El Dorado, Special Tax Ref. Bonds: | |||||||||
| 4.00%, 09/01/18 | 450 | 495 | 0.46 | ||||||
| 5.00%, 09/01/20 | 545 | 634 | 0.59 | ||||||
| East Bay Muni. Util. Dist. Rev. Bonds, Series A-1 (Mandatory Put 07/01/14 @ 100), 0.56%, 06/01/251 | 700 | 700 | 0.65 | ||||||
| Golden State Tobacco Securitization Corp., Misc. Purposes Rev. Bonds, Series 2003 A-1, 6.25%, 06/01/33 | 110 | 114 | 0.11 | ||||||
| Golden State Tobacco Securitization Corp., Misc. Purposes Rev. Bonds, Series 2003 A-1 (Pre-refunded with Agencies to 06/01/13 @ 100), 6.625%, 06/01/40 | 750 | 778 | 0.72 | ||||||
| Imperial Irrigation Dist., Energy Res. Auth. Rev. Ref. Bonds, 5.00%, 11/01/13 | 125 | 131 | 0.12 | ||||||
| Imperial Irrigation Dist., Energy Res. Auth. Rev. Ref. Bonds, Series C: | |||||||||
| 5.00%, 11/01/16 | 300 | 349 | 0.32 | ||||||
| 5.00%, 11/01/18 | 425 | 517 | 0.48 | ||||||
| Irvine Ranch Water Dist., Certs. of Part. Water Rev. Ref. Bonds, 5.00%, 03/01/13 | 200 | 203 | 0.19 | ||||||
| Long Beach Bond Fin. Auth., Misc. Rev. Ref. Bonds, 5.00%, 11/01/18 | 700 | 842 | 0.78 | ||||||
| Los Angeles County Metropolitan Trans. Auth., Sales Tax Rev. Ref. Bonds: | |||||||||
| 4.00%, 07/01/17 | 500 | 576 | 0.54 | ||||||
| 5.00%, 07/01/16 | 500 | 583 | 0.54 | ||||||
| Los Angeles County Sanitation Dists. Fncg. Auth., Sewer Rev. Ref. Bonds, Series A, 5.00%, 10/01/17 | 770 | 927 | 0.86 | ||||||
| Los Angeles Dept. of Airports, Port, Airport & Marina Rev. Ref. Bonds, 3.00%, 05/15/15 | 700 | 743 | 0.69 | ||||||
| Los Angeles Dept. of Airports, Port, Airport & Marina Rev. Ref. Bonds, Series E, 4.00%, 05/15/15 | 200 | 216 | 0.20 | ||||||
| Los Angeles Dept. of Water & Power, Energy Res. Auth. Rev. Ref. Bonds, Series A, 5.00%, 07/01/15 | 420 | 471 | 0.44 | ||||||
| Los Angeles Harbor Dept., Port, Airport & Marina Rev. Ref. Bonds, Series C, 5.00%, 08/01/13 | 200 | 207 | 0.19 | ||||||
| Los Angeles Unified School Dist., G.O. Prop. Tax Ref. Bonds, Series A-1, 4.00%, 07/01/18 | 500 | 583 | 0.54 | ||||||
| Los Angeles Unified School Dist., G.O. School Imps. Prop. Tax Bonds, Series I: | |||||||||
| 5.00%, 07/01/14 | 500 | 539 | 0.50 | ||||||
| 5.00%, 07/01/18 | 1,000 | 1,221 | 1.14 | ||||||
| Los Rios Comm. College Dist., G.O. Prop. Tax Ref. Bonds, 4.00%, 08/01/16 | 500 | 562 | 0.52 | ||||||
| Metropolitan Water Dist. of Southern California, Water Rev. Ref. Bonds, 5.00%, 07/01/14 | 100 | 108 | 0.10 | ||||||
| Metropolitan Water Dist. of Southern California, Water Rev. Ref. Bonds, Series B: | |||||||||
| 4.00%, 07/01/14 | 100 | 106 | 0.10 | ||||||
| 5.00%, 07/01/15 | 200 | 225 | 0.21 | ||||||
| Metropolitan Water Dist. of Southern California, Water Rev. Ref. Bonds, Series B-1 (Mandatory Put 05/01/15 @ 100), 0.56%, 07/01/271 | 1,500 | 1,500 | 1.40 | ||||||
| Metropolitan Water Dist. of Southern California, Water Rev. Ref. Bonds, Series B-2 (Mandatory Put 05/01/15 @ 100), 0.56%, 07/01/271 | 500 | 500 | 0.47 | ||||||
| Modesto Irrigation Dist., Energy Res. Auth. Rev. Ref. Bonds, Series A, 5.00%, 07/01/15 | 300 | 333 | 0.31 | ||||||
| Mountain View Shoreline Regional Park Comm., Tax Increment Allocation Rev. Ref. Bonds, 4.00%, 08/01/15 | 375 | 396 | 0.37 | ||||||
| Northern California Power Agcy., Energy Res, Auth. Rev. Bonds, Series A, 3.00%, 06/01/13 | 200 | 203 | 0.19 | ||||||
| Principal amount (000) | Market value (000) | Percent of net assets | |||||||
| Bonds & notes—continued | |||||||||
| California—continued | |||||||||
| Port of Oakland, Port, Airport & Marina Imps. Misc. Rev. Ref. Bonds, Series M (Pre-refunded with St. & Loc. Govt. Series to 11/01/12 @ 100) (FGIC Insured), 5.25%, 11/01/19 | $ | 500 | $ | 500 | 0.47 | % | |||
| Sacramento County Sanitation Dist. Fncg. Auth., Sewer Rev. Ref. Bonds, 5.00%, 12/01/14 | 250 | 274 | 0.26 | ||||||
| Sacramento Muni. Util. Dist., Energy Res. Auth. Rev. Bonds, Series R (NATL-RE Insured), 5.00%, 08/15/17 | 120 | 124 | 0.12 | ||||||
| Sacramento Muni. Util. Dist., Energy Res. Auth. Rev. Bonds, Series R (Pre-refunded with St. & Loc. Govt. Series to 08/15/2013 @ 100), (NATL-RE Insured), 5.00%, 08/15/17 | 280 | 290 | 0.27 | ||||||
| Sacramento Muni. Util. Dist., Energy Res. Auth. Rev. Ref. Bonds, 5.00%, 07/01/15 | 100 | 111 | 0.10 | ||||||
| Sacramento Muni. Util. Dist., Energy Res. Auth. Rev. Ref. Bonds, Series X, 5.00%, 08/15/17 | 250 | 297 | 0.28 | ||||||
| San Bernardino County Trans. Auth. Rev. Bonds, Series A, 4.00%, 03/01/18 | 500 | 584 | 0.54 | ||||||
| San Diego Comm. College Dist., G.O. Prop. Tax Ref. Bonds: | |||||||||
| 4.00%, 08/01/17 | 400 | 465 | 0.43 | ||||||
| 5.00%, 08/01/18 | 1,000 | 1,240 | 1.15 | ||||||
| San Diego County Regional Airport Auth., Port, Airport & Marina Imps. Rev. Ref. Bonds, Sub-Series A: | |||||||||
| 5.00%, 07/01/16 | 250 | 286 | 0.27 | ||||||
| 5.00%, 07/01/17 | 650 | 763 | 0.71 | ||||||
| San Diego County Water Auth., Water Rev. Certs. of Part. Ref. Bonds, Series 2008 A (AGM Insured), 5.00%, 05/01/14 | 500 | 534 | 0.50 | ||||||
| San Diego County Water Auth., Water Rev. Certs. of Part. Ref. Bonds, Series A (NATL-RE FGIC Insured), 5.25%, 05/01/18 | 500 | 613 | 0.57 | ||||||
| San Diego County Water Auth., Water Rev. Ref. Bonds, Series A, 5.00%, 05/01/17 | 850 | 1,008 | 0.94 | ||||||
| San Diego County Water Auth., Water Rev. Ref. Bonds, Series S-1, 5.00%, 07/01/16 | 175 | 202 | 0.19 | ||||||
| San Diego Public Facs. Fncg. Auth., Sewer Rev. Ref. Bonds, Series B, 5.00%, 05/15/15 | 300 | 334 | 0.31 | ||||||
| San Diego Public Facs. Fncg. Auth., Solid Waste Mgmt. Disposal Imps. Rev. Bonds, Series A, 4.50%, 05/15/14 | 500 | 532 | 0.50 | ||||||
| San Francisco Bay Area Rapid Transit Dist., Sales Tax Rev. Ref. Bonds, 3.00%, 07/01/13 | 125 | 127 | 0.12 | ||||||
| San Francisco City & County Airports Commission, Port, Airport & Marina Rev. Ref. Bonds, Series B, 5.00%, 05/01/16 | 200 | 229 | 0.21 | ||||||
| San Francisco City & County Airports Commission, Port, Airport & Marina Rev. Ref. Bonds, Series C (AGM Insured), 5.00%, 05/01/14 | 500 | 534 | 0.50 | ||||||
| San Francisco City & County Public Utils. Commission, Water Rev. Ref. Bonds, Series C: | |||||||||
| 5.00%, 11/01/12 | 100 | 100 | 0.09 | ||||||
| 5.00%, 11/01/13 | 400 | 419 | 0.39 | ||||||
| San Francisco Unified School Dist., G.O. School Imps. Prop. Tax Bonds, Series A, 5.00%, 06/15/18 | 500 | 612 | 0.57 | ||||||
| San Francisco Unified School Dist., G.O. School Imps. Prop. Tax Bonds, Series B, 5.00%, 06/15/15 | 100 | 112 | 0.10 | ||||||
| San Jose Redev. Agcy., Tax Increment Allocation Ref. Bonds, 4.00%, 08/01/16 | 300 | 310 | 0.29 | ||||||
| San Mateo Joint Powers Fncg. Auth., Lease Rev. Ref. Bonds, Series A: | |||||||||
| 3.00%, 07/15/13 | 100 | 102 | 0.09 | ||||||
| 4.00%, 07/15/13 | 125 | 128 | 0.12 | ||||||
| Santa Margarita Water Dist., Special Tax Ref. Bonds, 4.00%, 09/01/17 | 820 | 848 | 0.79 | ||||||
| Sonoma-Marin Area Rail Transit Dist. Rev. Bonds, Series A: | |||||||||
| 4.00%, 03/01/16 | 500 | 554 | 0.52 | ||||||
| Principal amount (000) | Market value (000) | Percent of net assets | |||||||
| Bonds & notes—continued | |||||||||
| California—continued | |||||||||
| 5.00%, 03/01/18 | $ | 750 | $ | 905 | 0.84 | % | |||
| South Placer Wastewater Auth., Solid Waste Mgmt. Rev. Ref. Bonds, Series D, 1.04%, 11/01/141 | 1,000 | 1,001 | 0.93 | ||||||
| Southern California Public Power Auth., Energy Res. Auth. Imps. Rev. Bonds: | |||||||||
| 4.00%, 07/01/15 | 225 | 246 | 0.23 | ||||||
| 5.00%, 07/01/16 | 200 | 232 | 0.22 | ||||||
| 5.00%, 07/01/17 | 750 | 895 | 0.83 | ||||||
| 5.00%, 07/01/18 | 200 | 244 | 0.23 | ||||||
| Southern California Public Power Auth., Energy Res. Auth. Imps. Rev. Bonds, Series A: | |||||||||
| 4.00%, 07/01/16 | 150 | 169 | 0.16 | ||||||
| 5.00%, 07/01/17 | 775 | 925 | 0.86 | ||||||
| Southern California Public Power Auth., Energy Res. Auth. Rev. Ref. Bonds: | |||||||||
| 5.00%, 07/01/14 | 500 | 539 | 0.50 | ||||||
| 5.00%, 07/01/16 | 500 | 580 | 0.54 | ||||||
| Southern California Public Power Auth., Energy Res. Auth. Rev. Ref. Bonds, Series A: | |||||||||
| 5.00%, 07/01/16 | 705 | 818 | 0.76 | ||||||
| 5.00%, 07/01/19 | 500 | 622 | 0.58 | ||||||
| Southern California Public Power Auth., Misc. Rev. Ref. Bonds, Series A, 5.00%, 07/01/18 | 300 | 366 | 0.34 | ||||||
| State of California, G.O. Cash Flow Mgmt. Sales Tax Rev. Bonds, Series A: | |||||||||
| 5.25%, 07/01/13 | 225 | 233 | 0.22 | ||||||
| 5.25%, 07/01/14 | 600 | 649 | 0.60 | ||||||
| State of California, G.O. Cash Flow Mgmt. Sales Tax Rev. Bonds, Series A (Escrowed to Maturity), 5.25%, 07/01/14 | 250 | 271 | 0.25 | ||||||
| State of California, G.O. Cash Flow Mgmt. Sales Tax Rev. Bonds, Series A (Pre-refunded with St. & Loc. Govt. Series to 07/01/14 @ 100), 5.00%, 07/01/15 | 500 | 539 | 0.50 | ||||||
| State of California, G.O. General Fund Ref. Bonds, 5.00%, 02/01/18 | 1,000 | 1,193 | 1.11 | ||||||
| State of California, G.O. General Fund Ref. Bonds, Series CF, 2.25%, 12/01/13 | 975 | 991 | 0.92 | ||||||
| State of California, G.O. General Fund Ref. Notes, 5.00%, 04/01/15 | 500 | 553 | 0.51 | ||||||
| State of California, G.O. General Fund Ref. Notes (NATL-RE Insured), 5.00%, 06/01/15 | 250 | 278 | 0.26 | ||||||
| State of California, G.O. Misc. Rev. Ref. Bonds: | |||||||||
| 4.00%, 09/01/17 | 500 | 569 | 0.53 | ||||||
| 5.00%, 09/01/19 | 700 | 858 | 0.80 | ||||||
| State of California, G.O. Prop. Tax Ref. Bonds: | |||||||||
| 4.00%, 04/01/18 | 500 | 573 | 0.53 | ||||||
| 5.00%, 06/01/15 | 200 | 222 | 0.21 | ||||||
| State of California, G.O. Prop. Tax Ref. Bonds, Series B, 0.96%, 05/01/171 | 400 | 401 | 0.37 | ||||||
| State of California, G.O. Prop. Tax Ref. Bonds, Series B (Mandatory Put 07/01/14 @ 100), 5.00%, 07/01/231 | 200 | 215 | 0.20 | ||||||
| State of California, G.O. Public Imps. Misc. Rev. Bonds, 4.00%, 09/01/18 | 570 | 657 | 0.61 | ||||||
| State of California, G.O. Public Imps. Prop. Tax Bonds (Pre-refunded with St. & Loc. Govt. Series to 02/01/14 @ 100), 5.00%, 02/01/33 | 600 | 635 | 0.59 | ||||||
| State of California, G.O. Public Imps. Prop. Tax Rev. Bonds (Pre-refunded with St. & Loc. Govt. Series to 04/01/14 @ 100), 5.30%, 04/01/29 | 695 | 744 | 0.69 | ||||||
| State of California, G.O. Sales Tax Rev. Bonds, Series A (NATL-RE FGIC Insured), 5.25%, 07/01/14 | 500 | 541 | 0.50 | ||||||
| Tuolumne Wind Project Auth., Energy Res. Auth. Imps. Rev. Bonds, Series A, 5.00%, 01/01/15 | 100 | 109 | 0.10 | ||||||
| Turlock Irrigation Dist., Energy Res. Auth. Rev. Ref. Bonds, 5.00%, 01/01/17 | 300 | 348 | 0.32 | ||||||
| Univ. of California, College & Univ. Imps. Rev. Bonds, Series AB, 5.00%, 05/15/16 | 350 | 405 | 0.38 | ||||||
| Principal amount (000) | Market value (000) | Percent of net assets | ||||||||
| Bonds & notes—continued | ||||||||||
| California—continued | ||||||||||
| Univ. of California, College & Univ. Rev. Ref. Bonds, Series E, 5.00%, 05/15/16 | $ | 200 | $ | 231 | 0.22 | % | ||||
| 75,146 | 69.94 | |||||||||
| Florida - 1.39% | ||||||||||
| Citizens Prop. Insurance Corp., Cash Flow Mgmt. Misc. Rev. Bonds, 5.00%, 06/01/15 | 100 | 110 | 0.10 | |||||||
| Citizens Prop. Insurance Corp., Rev. Bonds, 1.86%, 06/01/141 | 700 | 706 | 0.66 | |||||||
| Florida Hurricane Catastrophe Fund Fin. Corp., Misc. Purposes Rev. Bonds, Series A, 5.00%, 07/01/16 | 600 | 680 | 0.63 | |||||||
| 1,496 | 1.39 | |||||||||
| Guam - 0.32% | ||||||||||
| Territory of Guam, Cash Flow Mgmt., Misc. Rev. Bonds, Series A, 5.00%, 01/01/17 | 300 | 340 | 0.32 | |||||||
| 340 | 0.32 | |||||||||
| Louisiana - 0.24% | ||||||||||
| Louisiana Housing Fin. Agcy., Loc. or GTD Housing Rev. Bonds (GNMA/FNMA COLL Insured), 4.60%, 12/01/28 | 240 | 259 | 0.24 | |||||||
| 259 | 0.24 | |||||||||
| Mississippi - 0.50% | ||||||||||
| Jackson State Univ. Educ. Building Corp., College & Univ. Imps. Lease Rev. Bonds (Mandatory Put 03/01/15 @ 100) (AGM Insured), 5.00%, 03/01/341 | 490 | 535 | 0.50 | |||||||
| 535 | 0.50 | |||||||||
| Total bonds & notes (cost: $75,790,023) | 77,776 | 72.39 | ||||||||
| Short-term securities - 27.45% | ||||||||||
| California Health Facs. Fncg. Auth., Special Assessment Rev. Ref. Bonds:1 | ||||||||||
| 0.20%, 09/01/38 | 4,370 | 4,370 | 4.07 | |||||||
| 0.21%, 11/01/26 | 2,100 | 2,100 | 1.95 | |||||||
| California Infrastructure & Econ. Dev. Bank, Misc. Rev. Ref. Bonds, 0.17%, 10/01/471 | 2,550 | 2,550 | 2.37 | |||||||
| California Infrastructure & Econ. Dev. Bank, Misc. Rev. Ref. Bonds, Series A, 0.26%, 12/01/311 | 1,265 | 1,265 | 1.18 | |||||||
| California Muni. Fin. Auth., Ind. Imps. Rev. Bonds, 0.20%, 11/01/351 | 2,300 | 2,300 | 2.14 | |||||||
| California Pollution Control Fin. Auth., Ind. Rev. Ref. Bonds, 0.15%, 12/01/121 | 600 | 600 | 0.56 | |||||||
| California Pollution Control Fin. Auth., Energy Res. Auth. Rev. Ref. Bonds, 0.21%, 11/01/261 | 1,500 | 1,500 | 1.40 | |||||||
| California Statewide Comms. Dev. Auth., Health Care Facs. Rev. Ref. Bonds, Series A, 0.18%, 08/15/361 | 1,240 | 1,240 | 1.15 | |||||||
| California Statewide Comms. Dev. Auth., Health Care Facs. Rev. Ref. Bonds, Series C, 0.24%, 08/15/271 | 2,200 | 2,200 | 2.05 | |||||||
| City of Irvine California, Public Imps. Special Assessment Bonds, Series A, 0.24%, 09/02/291 | 1,618 | 1,618 | 1.51 | |||||||
| City of Irvine California, Public Imps. Special Assessment Bonds, Series B, 0.24%, 09/02/291 | 2,200 | 2,200 | 2.05 | |||||||
| City of Irvine California, Special Assessment Ref. Bonds, 0.24%, 09/02/501 | 400 | 400 | 0.37 | |||||||
| Principal amount (000) | Market value (000) | Percent of net assets | ||||||||||||
| Short-term securities—continued | ||||||||||||||
| Los Angeles Dept. of Water & Power, Energy Res. Auth. Rev. Ref. Bonds, Sub-Series A-1, 0.19%, 07/01/351 | $ | 3,000 | $ | 3,000 | 2.79 | % | ||||||||
| Los Angeles Dept. of Water & Power, Energy Res. Auth. Rev. Ref. Bonds, Sub-Series B-3, 0.26%, 07/01/341 | 1,600 | 1,600 | 1.49 | |||||||||||
| Sacramento County Sanitation Dist. Fncg. Auth., Sewer Rev. Ref. Bonds, Series A, 0.24%, 12/01/361 | 950 | 950 | 0.88 | |||||||||||
| State of California, G.O. Sales Tax Rev. Bonds, Series C, 0.21%, 07/01/231 | 1,600 | 1,600 | 1.49 | |||||||||||
| Total Short-term securities (cost: $29,493,000) | 29,493 | 27.45 | ||||||||||||
| Total investment securities (cost: $105,283,023) | 107,269 | 99.84 | ||||||||||||
| Other assets less liabilities | 167 | 0.16 | ||||||||||||
| Net assets | $ | 107,436 | 100.00 | % | ||||||||||
| 1 | Coupon rate may change periodically. For short-term securities, the date of the next scheduled coupon rate change is considered to be the maturity date. | |||||||||||||
| Key to abbreviations | ||||||||||||||
| Agcy. | = Agency | |||||||||||||
| AGM | = Assured Guaranty Municipal Corporation | |||||||||||||
| Auth. | = Authority | |||||||||||||
| CA Mtg. Ins. | = California Mortgage Insurance | |||||||||||||
| Certs. of Part. | = Certificates of Participation | |||||||||||||
| COLL | = Collateral | |||||||||||||
| Comm. | = Community | |||||||||||||
| Comms. | = Communities | |||||||||||||
| Corp. | = Corporation | |||||||||||||
| Corps. | = Corporations | |||||||||||||
| Dept. | = Department | |||||||||||||
| Dev. | = Development | |||||||||||||
| Dist. | = District | |||||||||||||
| Econ. | = Economic | |||||||||||||
| Educ. | = Educational | |||||||||||||
| Facs. | = Facilities | |||||||||||||
| FGIC | = Financial Guaranty Insurance Company | |||||||||||||
| Fin. | = Finance | |||||||||||||
| Fncg. | = Financing | |||||||||||||
| FNMA | = Federal National Mortgage Association | |||||||||||||
| GNMA | = Government National Mortgage Association | |||||||||||||
| G.O. | = General Obligation | |||||||||||||
| Govt. | = Government | |||||||||||||
| GTD | = Guaranteed | |||||||||||||
| Imps. | = Improvements | |||||||||||||
| Ind. | = Industrial | |||||||||||||
| Loc. | = Local | |||||||||||||
| Mgmt. | = Management | |||||||||||||
| Misc. | = Miscellaneous | |||||||||||||
| Muni. | = Municipal | |||||||||||||
| NATL-RE | = National Reinsurance | |||||||||||||
| Prop. | = Property |
| Rec. | = Recreational |
| Redev. | = Redevelopment |
| Ref. | = Refunding |
| Res. | = Resource |
| Ress. | = Resources |
| Rev. | = Revenue |
| St. | = State |
| Univ. | = University |
| Util. | = Utility |
| Utils. | = Utilities |
| Capital Core Bond Fund | |
| October 31, 2012 | |
Growth of $25,000 investment
Here’s how a $25,000 investment in the Capital Core Bond Fund grew between April 13, 2010, when the fund began operations, and October 31, 2012, the end of the fund’s fiscal year.
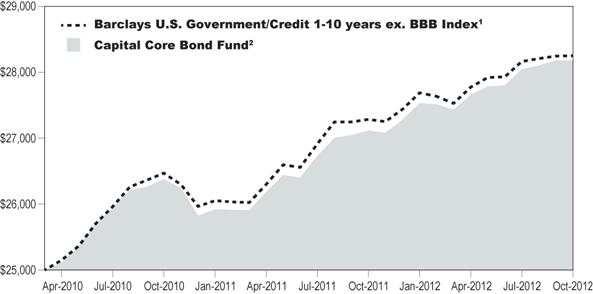
1 The index is unmanaged, and its results include reinvested distributions but do not reflect the effect of sales
charges, commissions, or expenses.
2 Includes reinvested dividends and capital gain distributions.
Results are for past periods and are not predictive of results for future periods. Current and future results may be lower or higher than those shown. Share price and returns will vary so investors may lose money. The results shown are before taxes on fund distributions and sale of fund shares.
Investment portfolio – quality ratings*
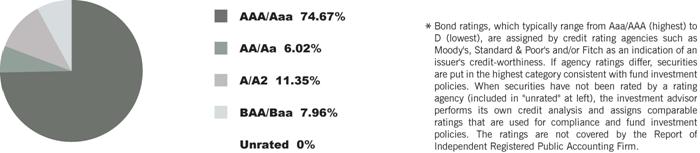
Capital Core Bond Fund
Schedule of Investments
at October 31, 2012
| Principal amount (000) | Market value (000) | Percent of net assets | ||||||
| Bonds & notes - 97.95% | ||||||||
| U.S. government & government agency bonds & notes - 45.82% | ||||||||
| Fannie Mae: | ||||||||
| 1.75%, 05/07/13 | $ | 2,000 | $ | 2,016 | 0.68 | % | ||
| 2.75%, 03/13/14 | 2,000 | 2,068 | 0.70 | |||||
| 1.25%, 09/28/16 | 1,000 | 1,025 | 0.35 | |||||
| 1.25%, 01/30/17 | 1,445 | 1,481 | 0.50 | |||||
| 1.00%, 11/15/17 | 4,645 | 4,651 | 1.57 | |||||
| Federal Home Loan Banks, 1.00%, 06/21/17 | 600 | 607 | 0.20 | |||||
| Freddie Mac: | ||||||||
| 0.375%, 10/30/13 | 500 | 501 | 0.17 | |||||
| 5.00%, 07/15/14 | 1,000 | 1,080 | 0.36 | |||||
| 0.75%, 11/25/14 | 1,700 | 1,716 | 0.58 | |||||
| 0.50%, 08/28/15 | 2,500 | 2,506 | 0.85 | |||||
| 4.75%, 01/19/16 | 2,000 | 2,274 | 0.77 | |||||
| 2.50%, 05/27/16 | 1,000 | 1,070 | 0.36 | |||||
| 1.00%, 06/29/17 | 500 | 505 | 0.17 | |||||
| 1.75%, 05/30/19 | 2,155 | 2,230 | 0.75 | |||||
| U.S. Treasury Bonds, 7.625%, 02/15/25 | 1,000 | 1,623 | 0.55 | |||||
| U.S. Treasury Inflation Indexed Bonds: | ||||||||
| 1.875%, 07/15/13 | 4,998 | 5,114 | 1.73 | |||||
| 2.00%, 01/15/14 | 1,558 | 1,617 | 0.55 | |||||
| 0.125%, 04/15/16 | 6,778 | 7,146 | 2.41 | |||||
| 2.375%, 01/15/17 | 377 | 440 | 0.15 | |||||
| 0.125%, 04/15/17 | 1,521 | 1,631 | 0.55 | |||||
| 0.125%, 01/15/22 | 1,018 | 1,112 | 0.38 | |||||
| 0.125%, 07/15/22 | 1,001 | 1,097 | 0.37 | |||||
| 2.375%, 01/15/25 | 478 | 654 | 0.22 | |||||
| U.S. Treasury Notes: | ||||||||
| 3.125%, 09/30/13 | 3,000 | 3,080 | 1.04 | |||||
| 2.375%, 09/30/14 | 9,250 | 9,619 | 3.24 | |||||
| 2.375%, 10/31/14 | 455 | 474 | 0.16 | |||||
| 4.25%, 11/15/14 | 1,000 | 1,080 | 0.36 | |||||
| 4.00%, 02/15/15 | 3,905 | 4,231 | 1.43 | |||||
| 1.25%, 09/30/15 | 500 | 513 | 0.17 | |||||
| 4.50%, 02/15/16 | 500 | 566 | 0.19 | |||||
| 2.625%, 02/29/16 | 14,720 | 15,784 | 5.32 | |||||
| 1.50%, 06/30/16 | 3,750 | 3,886 | 1.31 | |||||
| 1.50%, 07/31/16 | 4,400 | 4,562 | 1.54 | |||||
| 1.00%, 09/30/16 | 1,000 | 1,018 | 0.34 | |||||
| 4.625%, 02/15/17 | 4,000 | 4,681 | 1.58 | |||||
| 1.00%, 03/31/17 | 1,000 | 1,016 | 0.34 | |||||
| 0.875%, 04/30/17 | 1,000 | 1,010 | 0.34 | |||||
| 4.50%, 05/15/17 | 11,020 | 12,920 | 4.36 | |||||
| 8.75%, 05/15/17 | 490 | 668 | 0.23 | |||||
| 0.75%, 06/30/17 | 250 | 251 | 0.08 | |||||
| 1.875%, 08/31/17 | 4,470 | 4,722 | 1.59 | |||||
| 3.875%, 05/15/18 | 1,000 | 1,165 | 0.39 | |||||
| 2.375%, 05/31/18 | 7,140 | 7,732 | 2.61 | |||||
| 4.00%, 08/15/18 | 4,000 | 4,710 | 1.59 | |||||
| 1.00%, 09/30/19 | 500 | 496 | 0.17 | |||||
| 3.50%, 05/15/20 | 2,075 | 2,414 | 0.81 | |||||
| 2.125%, 08/15/21 | 2,910 | 3,060 | 1.03 | |||||
| Principal amount (000) | Market value (000) | Percent of net assets | ||||||||
| Bonds & notes—continued | ||||||||||
| U.S. government & government agency bonds & notes—continued | ||||||||||
| 1.75%, 05/15/22 | $ | 2,000 | $ | 2,018 | 0.68 | % | ||||
| Total U.S. government & government agency bonds & notes | 135,840 | 45.82 | ||||||||
| Mortgage-backed obligations - 25.95% | ||||||||||
| Federal agency mortgage-backed obligations - 22.00% | ||||||||||
| Fannie Mae: | ||||||||||
| 4.50%, 07/01/19 | 184 | 199 | 0.07 | |||||||
| 4.50%, 03/01/20 | 829 | 893 | 0.30 | |||||||
| 2.717%, 02/25/22 | 500 | 528 | 0.18 | |||||||
| 3.50%, 10/01/25 | 8,097 | 8,596 | 2.90 | |||||||
| 3.00%, 01/01/27 | 905 | 955 | 0.32 | |||||||
| 2.50%, 11/01/27 TBA | 8,225 | 8,604 | 2.90 | |||||||
| 3.50%, 11/01/27 TBA | 8,100 | 8,594 | 2.90 | |||||||
| 2.50%, 12/01/27 TBA | 1,000 | 1,044 | 0.35 | |||||||
| 5.50%, 04/25/37 | 161 | 180 | 0.06 | |||||||
| 6.00%, 08/01/37 | 87 | 97 | 0.03 | |||||||
| 5.50%, 04/01/38 | 1,830 | 2,007 | 0.68 | |||||||
| 5.50%, 09/01/38 | 2,869 | 3,146 | 1.06 | |||||||
| 4.00%, 11/01/40 | 2,220 | 2,470 | 0.83 | |||||||
| 5.00%, 06/01/41 | 1,712 | 1,942 | 0.66 | |||||||
| 5.00%, 08/01/41 | 469 | 532 | 0.18 | |||||||
| 3.17%, 09/01/41 | 408 | 431 | 0.15 | |||||||
| 3.50%, 07/01/42 | 4,948 | 5,291 | 1.79 | |||||||
| 3.00%, 11/01/42 TBA | 9,500 | 9,968 | 3.36 | |||||||
| 6.00%, 11/01/42 TBA | 500 | 554 | 0.19 | |||||||
| Freddie Mac: | ||||||||||
| 1.873%, 01/25/18 | 470 | 486 | 0.16 | |||||||
| 2.699%, 05/25/18 | 790 | 855 | 0.29 | |||||||
| 2.303%, 09/25/18 | 2,350 | 2,497 | 0.84 | |||||||
| 3.974%, 01/25/21 | 524 | 607 | 0.20 | |||||||
| 2.373%, 05/25/22 | 500 | 515 | 0.17 | |||||||
| 6.00%, 02/15/37 | 123 | 137 | 0.05 | |||||||
| Ginnie Mae: | ||||||||||
| 4.50%, 01/20/40 | 235 | 260 | 0.09 | |||||||
| 3.50%, 11/01/42 TBA | 3,525 | 3,830 | 1.29 | |||||||
| 65,218 | 22.00 | |||||||||
| Commercial mortgage-backed securities - 3.95% | ||||||||||
| Bear Stearns Commercial Mortgage Securities: | ||||||||||
| 5.53%, 09/11/41 | 1,015 | 1,068 | 0.36 | |||||||
| 5.54%, 09/11/41 | 250 | 289 | 0.10 | |||||||
| Citigroup/Deutsche Bank Commercial Mortgage Trust: | ||||||||||
| 5.219%, 07/15/441 | 1,080 | 1,209 | 0.41 | |||||||
| 5.617%, 10/15/48 | 500 | 579 | 0.19 | |||||||
| DBUBS Mortgage Trust, Series 144A, 3.742%, 11/10/462 | 1,641 | 1,784 | 0.60 | |||||||
| Greenwich Capital Commercial Funding Corp., 5.444%, 03/10/39 | 350 | 405 | 0.14 | |||||||
| GS Mortgage Securities Corp. II, 1.468%, 08/10/44 | 398 | 404 | 0.14 | |||||||
| JPMorgan Chase Commercial Mortgage Securities Corp.: | ||||||||||
| 4.895%, 09/12/37 | 500 | 552 | 0.19 | |||||||
| 5.199%, 12/15/441 | 500 | 562 | 0.19 | |||||||
| Principal amount (000) | Market value (000) | Percent of net assets | ||||||||
| Bonds & notes—continued | ||||||||||
| Mortgage-backed obligations—continued | ||||||||||
| Commercial mortgage-backed securities—continued | ||||||||||
| 5.867%, 04/15/451 | $ | 500 | $ | 580 | 0.19 | % | ||||
| 5.728%, 02/12/491 | 650 | 769 | 0.26 | |||||||
| JPMorgan Chase Commercial Mortgage Securities Corp., Series 144A, 3.672%, 02/15/462 | 500 | 542 | 0.18 | |||||||
| Morgan Stanley Capital I, 5.21%, 11/14/421 | 350 | 390 | 0.13 | |||||||
| Wachovia Bank Commercial Mortgage Trust:1 | ||||||||||
| 5.118%, 07/15/42 | 1,075 | 1,189 | 0.40 | |||||||
| 5.293%, 12/15/44 | 1,250 | 1,407 | 0.47 | |||||||
| 11,729 | 3.95 | |||||||||
| Total mortgage-backed obligations | 76,947 | 25.95 | ||||||||
| Corporate bonds & notes - 24.84% | ||||||||||
| Banks - 3.37% | ||||||||||
| Ally Financial, Inc., 2.20%, 12/19/12 | 2,245 | 2,251 | 0.76 | |||||||
| Bank of America Corp.: | ||||||||||
| 3.875%, 03/22/17 | 795 | 858 | 0.29 | |||||||
| 5.00%, 05/13/21 | 250 | 282 | 0.10 | |||||||
| BNP Paribas SA, 3.128%, 12/20/141 | 430 | 446 | 0.15 | |||||||
| Citigroup, Inc.: | ||||||||||
| 4.75%, 05/19/15 | 250 | 271 | 0.09 | |||||||
| 4.587%, 12/15/15 | 350 | 382 | 0.13 | |||||||
| 4.45%, 01/10/17 | 550 | 608 | 0.20 | |||||||
| JP Morgan Chase & Co.: | ||||||||||
| 3.40%, 06/24/15 | 120 | 127 | 0.04 | |||||||
| 4.625%, 05/10/21 | 125 | 141 | 0.05 | |||||||
| 3.25%, 09/23/22 | 875 | 898 | 0.30 | |||||||
| Northern Trust Corp., 4.625%, 05/01/14 | 300 | 318 | 0.11 | |||||||
| The Goldman Sachs Group, Inc., 5.75%, 01/24/22 | 350 | 407 | 0.14 | |||||||
| The Royal Bank of Scotland PLC, 4.375%, 03/16/16 | 1,000 | 1,089 | 0.37 | |||||||
| UBS AG/Stamford CT: | ||||||||||
| 3.875%, 01/15/15 | 275 | 292 | 0.10 | |||||||
| 4.875%, 08/04/20 | 250 | 287 | 0.10 | |||||||
| Wells Fargo & Co., 0.513%, 10/28/151 | 815 | 807 | 0.27 | |||||||
| Wells Fargo & Co., Series I, 3.75%, 10/01/14 | 150 | 159 | 0.05 | |||||||
| Westpac Banking Corp., 1.85%, 12/09/13 | 355 | 361 | 0.12 | |||||||
| 9,984 | 3.37 | |||||||||
| Oil & gas - 2.37% | ||||||||||
| Anadarko Petroleum Corp., 6.375%, 09/15/17 | 750 | 910 | 0.31 | |||||||
| BG Energy Capital PLC, Series 144A, 4.00%, 10/15/212 | 500 | 562 | 0.19 | |||||||
| Canadian Natural Resources Ltd., 1.45%, 11/14/14 | 300 | 305 | 0.10 | |||||||
| Cenovus Energy, Inc., 4.50%, 09/15/14 | 300 | 321 | 0.11 | |||||||
| Chevron Corp., 3.95%, 03/03/14 | 817 | 856 | 0.29 | |||||||
| Devon Energy Corp., 3.25%, 05/15/22 | 375 | 397 | 0.13 | |||||||
| Husky Energy, Inc., 7.25%, 12/15/19 | 250 | 325 | 0.11 | |||||||
| Phillips 66, Series 144A, 4.30%, 04/01/222 | 290 | 326 | 0.11 | |||||||
| Shell International Finance BV, 4.00%, 03/21/14 | 350 | 368 | 0.12 | |||||||
| Statoil ASA: | ||||||||||
| Principal amount (000) | Market value (000) | Percent of net assets | ||||||||
| Bonds & notes—continued | ||||||||||
| Corporate bonds & notes—continued | ||||||||||
| Oil & gas—continued | ||||||||||
| 3.125%, 08/17/17 | $ | 300 | $ | 329 | 0.11 | % | ||||
| 3.15%, 01/23/22 | 505 | 545 | 0.18 | |||||||
| Total Capital Canada Ltd., 1.625%, 01/28/14 | 350 | 355 | 0.12 | |||||||
| Total Capital International SA: | ||||||||||
| 2.875%, 02/17/22 | 230 | 242 | 0.08 | |||||||
| 2.70%, 01/25/23 | 540 | 560 | 0.19 | |||||||
| Transocean, Inc.: | ||||||||||
| 6.375%, 12/15/21 | 310 | 378 | 0.13 | |||||||
| 3.80%, 10/15/22 | 250 | 256 | 0.09 | |||||||
| 7,035 | 2.37 | |||||||||
| Electric - 2.06% | ||||||||||
| Alabama Power Co., 4.85%, 12/15/12 | 430 | 432 | 0.15 | |||||||
| Appalachian Power Co., Series S, 3.40%, 05/24/15 | 250 | 264 | 0.09 | |||||||
| Consumers Energy Co., 5.65%, 09/15/18 | 375 | 461 | 0.16 | |||||||
| Entergy Louisiana LLC, 1.875%, 12/15/14 | 350 | 359 | 0.12 | |||||||
| Midamerican Energy Holdings Co., 5.75%, 04/01/18 | 300 | 362 | 0.12 | |||||||
| Pacific Gas & Electric Co., 2.45%, 08/15/22 | 300 | 303 | 0.10 | |||||||
| Pacificorp, 5.65%, 07/15/18 | 755 | 935 | 0.31 | |||||||
| PSEG Power LLC, 2.75%, 09/15/16 | 250 | 262 | 0.09 | |||||||
| Public Service Co. of Colorado, 3.20%, 11/15/20 | 300 | 331 | 0.11 | |||||||
| Tampa Electric Co., 2.60%, 09/15/22 | 350 | 360 | 0.12 | |||||||
| Teco Finance, Inc.: | ||||||||||
| 6.75%, 05/01/15 | 250 | 284 | 0.10 | |||||||
| 4.00%, 03/15/16 | 390 | 418 | 0.14 | |||||||
| Virginia Electric and Power Co.: | ||||||||||
| 5.40%, 04/30/18 | 621 | 757 | 0.25 | |||||||
| 2.95%, 01/15/22 | 300 | 319 | 0.11 | |||||||
| Wisconsin Electric Power Co., 2.95%, 09/15/21 | 250 | 266 | 0.09 | |||||||
| 6,113 | 2.06 | |||||||||
| Media - 1.75% | ||||||||||
| CBS Corp., 1.95%, 07/01/17 | 200 | 205 | 0.07 | |||||||
| Comcast Corp.: | ||||||||||
| 5.85%, 11/15/15 | 300 | 345 | 0.12 | |||||||
| 3.125%, 07/15/22 | 655 | 689 | 0.23 | |||||||
| NBCUniversal Media LLC, 5.15%, 04/30/20 | 350 | 420 | 0.14 | |||||||
| News America, Inc.: | ||||||||||
| 5.30%, 12/15/14 | 785 | 862 | 0.29 | |||||||
| 4.50%, 02/15/21 | 350 | 400 | 0.14 | |||||||
| The Walt Disney Co.: | ||||||||||
| 4.50%, 12/15/13 | 630 | 659 | 0.22 | |||||||
| 5.50%, 03/15/19 | 300 | 366 | 0.12 | |||||||
| Time Warner Cable, Inc., 3.50%, 02/01/15 | 845 | 898 | 0.30 | |||||||
| Time Warner, Inc., 5.875%, 11/15/16 | 300 | 355 | 0.12 | |||||||
| 5,199 | 1.75 | |||||||||
| Pharmaceuticals - 1.73% | ||||||||||
| Express Scripts Holding, Inc., Series 144A, 2.65%, 02/15/172 | 250 | 261 | 0.09 | |||||||
| Principal amount (000) | Market value (000) | Percent of net assets | ||||||||
| Bonds & notes—continued | ||||||||||
| Corporate bonds & notes—continued | ||||||||||
| Pharmaceuticals—continued | ||||||||||
| GlaxoSmithKline Capital PLC: | ||||||||||
| 0.75%, 05/08/15 | $ | 440 | $ | 442 | 0.15 | % | ||||
| 1.50%, 05/08/17 | 241 | 247 | 0.08 | |||||||
| 2.85%, 05/08/22 | 250 | 263 | 0.09 | |||||||
| Mckesson Corp., 3.25%, 03/01/16 | 795 | 856 | 0.29 | |||||||
| Medco Health Solutions, Inc., 4.125%, 09/15/20 | 495 | 551 | 0.19 | |||||||
| Merck & Co., Inc., 1.10%, 01/31/18 | 250 | 251 | 0.08 | |||||||
| Novartis Capital Corp.: | ||||||||||
| 4.125%, 02/10/14 | 400 | 419 | 0.14 | |||||||
| 2.90%, 04/24/15 | 560 | 592 | 0.20 | |||||||
| Novartis Securities Investment Ltd., 5.125%, 02/10/19 | 300 | 362 | 0.12 | |||||||
| Pfizer, Inc., 6.20%, 03/15/19 | 300 | 384 | 0.13 | |||||||
| Sanofi-Aventis SA, 0.672%, 03/28/141 | 500 | 503 | 0.17 | |||||||
| 5,131 | 1.73 | �� | ||||||||
| REITS - 1.57% | ||||||||||
| ERP Operating LP: | ||||||||||
| 5.25%, 09/15/14 | 300 | 324 | 0.11 | |||||||
| 4.625%, 12/15/21 | 350 | 401 | 0.13 | |||||||
| Kimco Realty Corp., 5.584%, 11/23/15 | 1,048 | 1,168 | 0.39 | |||||||
| Prologis LP: | ||||||||||
| 7.625%, 08/15/14 | 275 | 302 | 0.10 | |||||||
| 6.875%, 03/15/20 | 350 | 432 | 0.15 | |||||||
| Simon Property Group LP: | ||||||||||
| 4.20%, 02/01/15 | 300 | 320 | 0.11 | |||||||
| 5.25%, 12/01/16 | 385 | 443 | 0.15 | |||||||
| WEA Finance LLC / WT Finance Aust Pty Ltd., Series 144A, 3.375%, 10/03/222 | 710 | 720 | 0.24 | |||||||
| WEA Finance LLC, Series 144A, 4.625%, 05/10/212 | 500 | 551 | 0.19 | |||||||
| 4,661 | 1.57 | |||||||||
| Beverages - 1.25% | ||||||||||
| Anheuser-Busch InBev Worldwide, Inc.: | ||||||||||
| 0.70%, 07/14/141 | 585 | 588 | 0.20 | |||||||
| 4.125%, 01/15/15 | 300 | 323 | 0.11 | |||||||
| 1.375%, 07/15/17 | 420 | 427 | 0.14 | |||||||
| Pepsi Co., Inc., 0.875%, 10/25/13 | 500 | 502 | 0.17 | |||||||
| Pernod-Ricard SA, Series 144A, 2.95%, 01/15/172 | 800 | 845 | 0.29 | |||||||
| SABMiller Holdings, Inc., Series 144A, 2.45%, 01/15/172 | 245 | 257 | 0.09 | |||||||
| The Coca-Cola Co.: | ||||||||||
| 3.625%, 03/15/14 | 375 | 391 | 0.13 | |||||||
| 1.50%, 11/15/15 | 350 | 360 | 0.12 | |||||||
| 3,693 | 1.25 | |||||||||
| Diversified financial services - 0.99% | ||||||||||
| General Electric Capital Corp.: | ||||||||||
| 2.30%, 04/27/17 | 610 | 631 | 0.21 | |||||||
| 3.15%, 09/07/22 | 385 | 392 | 0.13 | |||||||
| Murray Street Investment Trust I, 4.647%, 03/09/17 | 885 | 961 | 0.33 | |||||||
| National Rural Utilities Cooperative Finance Corp., 1.00%, 02/02/15 | 733 | 740 | 0.25 | |||||||
| Principal amount (000) | Market value (000) | Percent of net assets | ||||||||
| Bonds & notes—continued | ||||||||||
| Corporate bonds & notes—continued | ||||||||||
| Diversified financial services—continued | ||||||||||
| Woodside Finance Ltd., Series 144A, 4.60%, 05/10/212 | $ | 185 | $ | 207 | 0.07 | % | ||||
| 2,931 | 0.99 | |||||||||
| Telecommunications - 0.91% | ||||||||||
| AT&T, Inc.: | ||||||||||
| 2.40%, 08/15/16 | 200 | 211 | 0.07 | |||||||
| 3.00%, 02/15/22 | 357 | 380 | 0.13 | |||||||
| Cellco Partnership/Verizon Wireless Capital LLC, 7.375%, 11/15/13 | 490 | 523 | 0.18 | |||||||
| Cisco Systems, Inc., 0.644%, 03/14/141 | 200 | 201 | 0.07 | |||||||
| Deutsche Telekom International Finance BV, Series 144A, 2.25%, 03/06/172 | 500 | 513 | 0.17 | |||||||
| France Telecom SA, 4.375%, 07/08/14 | 300 | 318 | 0.11 | |||||||
| Verizon Communications, Inc., 1.25%, 11/03/14 | 200 | 203 | 0.07 | |||||||
| Vodafone Group PLC, 5.00%, 09/15/15 | 300 | 335 | 0.11 | |||||||
| 2,684 | 0.91 | |||||||||
| Food - 0.86% | ||||||||||
| General Mills, Inc., 0.786%, 05/16/141 | 500 | 502 | 0.17 | |||||||
| Kraft Foods Group, Inc., Series 144A, 3.50%, 06/06/222 | 500 | 543 | 0.18 | |||||||
| Kraft Foods, Inc., 5.375%, 02/10/20 | 445 | 547 | 0.19 | |||||||
| The Kroger Co.: | ||||||||||
| 7.50%, 01/15/14 | 600 | 647 | 0.22 | |||||||
| 2.20%, 01/15/17 | 300 | 307 | 0.10 | |||||||
| 2,546 | 0.86 | |||||||||
| Miscellaneous manufacturing - 0.79% | ||||||||||
| Danaher Corp., 2.30%, 06/23/16 | 200 | 210 | 0.07 | |||||||
| General Electric Co.: | ||||||||||
| 5.25%, 12/06/17 | 620 | 735 | 0.25 | |||||||
| 2.70%, 10/09/22 | 1,080 | 1,087 | 0.37 | |||||||
| Honeywell International, Inc., 3.875%, 02/15/14 | 300 | 313 | 0.10 | |||||||
| 2,345 | 0.79 | |||||||||
| Chemicals - 0.70% | ||||||||||
| Ecolab, Inc.: | ||||||||||
| 2.375%, 12/08/14 | 730 | 757 | 0.26 | |||||||
| 3.00%, 12/08/16 | 180 | 193 | 0.06 | |||||||
| Ei Du Pont De Nemours & Co., 0.789%, 03/25/141 | 455 | 458 | 0.15 | |||||||
| The Dow Chemical Co., 4.125%, 11/15/21 | 617 | 675 | 0.23 | |||||||
| 2,083 | 0.70 | |||||||||
| Biotechnology - 0.68% | ||||||||||
| Amgen, Inc.: | ||||||||||
| 1.875%, 11/15/14 | 250 | 257 | 0.09 | |||||||
| 3.625%, 05/15/22 | 250 | 269 | 0.09 | |||||||
| Biogen Idec, Inc., 6.00%, 03/01/13 | 640 | 651 | 0.22 | |||||||
| Gilead Sciences, Inc.: | ||||||||||
| 2.40%, 12/01/14 | 100 | 104 | 0.04 | |||||||
| 3.05%, 12/01/16 | 80 | 86 | 0.03 | |||||||
| Principal amount (000) | Market value (000) | Percent of net assets | ||||||||
| Bonds & notes—continued | ||||||||||
| Corporate bonds & notes—continued | ||||||||||
| Biotechnology—continued | ||||||||||
| 4.40%, 12/01/21 | $ | 550 | $ | 636 | 0.21 | % | ||||
| 2,003 | 0.68 | |||||||||
| Transportation - 0.67% | ||||||||||
| Burlington Northern Santa Fe LLC: | ||||||||||
| 7.00%, 02/01/14 | 600 | 647 | 0.22 | |||||||
| 3.60%, 09/01/20 | 300 | 329 | 0.11 | |||||||
| Canadian National Railway Co.: | ||||||||||
| 4.95%, 01/15/14 | 690 | 727 | 0.25 | |||||||
| 5.55%, 05/15/18 | 50 | 61 | 0.02 | |||||||
| 2.85%, 12/15/21 | 200 | 209 | 0.07 | |||||||
| 1,973 | 0.67 | |||||||||
| Pipelines - 0.66% | ||||||||||
| Enbridge, Inc., 5.60%, 04/01/17 | 790 | 922 | 0.31 | |||||||
| Enterprise Products Operating LLC, 6.30%, 09/15/17 | 420 | 515 | 0.17 | |||||||
| TransCanada PipeLines Ltd., 3.40%, 06/01/15 | 190 | 203 | 0.07 | |||||||
| Williams Partners LP, 3.80%, 02/15/15 | 300 | 320 | 0.11 | |||||||
| 1,960 | 0.66 | |||||||||
| Healthcare-services - 0.56% | ||||||||||
| Howard Hughes Medical Institute, 3.45%, 09/01/14 | 140 | 148 | 0.05 | |||||||
| Roche Holdings, Inc., Series 144A, 6.00%, 03/01/192 | 500 | 629 | 0.21 | |||||||
| UnitedHealth Group, Inc.: | ||||||||||
| 1.40%, 10/15/17 | 250 | 252 | 0.09 | |||||||
| 2.75%, 02/15/23 | 285 | 293 | 0.10 | |||||||
| WellPoint, Inc., 4.35%, 08/15/20 | 300 | 333 | 0.11 | |||||||
| 1,655 | 0.56 | |||||||||
| Mining - 0.53% | ||||||||||
| BHP Billiton Finance USA Ltd., 1.625%, 02/24/17 | 510 | 522 | 0.18 | |||||||
| Newcrest Finance Pty Ltd., Series 144A, 4.45%, 11/15/212 | 450 | 475 | 0.16 | |||||||
| Rio Tinto Finance USA Ltd., 2.50%, 05/20/16 | 300 | 313 | 0.10 | |||||||
| Teck Resources Ltd., 3.15%, 01/15/17 | 260 | 271 | 0.09 | |||||||
| 1,581 | 0.53 | |||||||||
| Computers - 0.48% | ||||||||||
| Hewlett-Packard Co., 0.822%, 05/30/141 | 300 | 297 | 0.10 | |||||||
| HP Enterprise Services LLC, Series B, 6.00%, 08/01/13 | 45 | 46 | 0.02 | |||||||
| International Business Machines Corp.: | ||||||||||
| 1.95%, 07/22/16 | 635 | 664 | 0.22 | |||||||
| 5.70%, 09/14/17 | 350 | 427 | 0.14 | |||||||
| 1,434 | 0.48 | |||||||||
| Insurance - 0.42% | ||||||||||
| American International Group, Inc., 4.875%, 06/01/22 | 440 | 497 | 0.17 | |||||||
| Principal amount (000) | Market value (000) | Percent of net assets | ||||||||
| Bonds & notes—continued | ||||||||||
| Corporate bonds & notes—continued | ||||||||||
| Insurance—continued | ||||||||||
| Berkshire Hathaway, Inc., 0.867%, 02/11/131 | $ | 755 | $ | 756 | 0.25 | % | ||||
| 1,253 | 0.42 | |||||||||
| Retail - 0.41% | ||||||||||
| Home Depot, Inc., 4.40%, 04/01/21 | 350 | 416 | 0.14 | |||||||
| Target Corp., 6.00%, 01/15/18 | 350 | 433 | 0.14 | |||||||
| Wal-Mart Stores, Inc., 5.80%, 02/15/18 | 300 | 373 | 0.13 | |||||||
| 1,222 | 0.41 | |||||||||
| Iron/Steel - 0.40% | ||||||||||
| ArcelorMittal: | ||||||||||
| 4.75%, 02/25/17 | 355 | 349 | 0.12 | |||||||
| 5.75%, 03/01/21 | 250 | 242 | 0.08 | |||||||
| 6.50%, 02/25/22 | 342 | 336 | 0.11 | |||||||
| Cliffs Natural Resources, Inc., 4.875%, 04/01/21 | 250 | 248 | 0.09 | |||||||
| 1,175 | 0.40 | |||||||||
| Auto Manufacturers - 0.29% | ||||||||||
| Daimler Finance North America LLC, Series 144A, 1.95%, 03/28/142 | 300 | 303 | 0.10 | |||||||
| Toyota Motor Credit Corp., 1.75%, 05/22/17 | 250 | 257 | 0.09 | |||||||
| Volkswagen International Finance NV, Series 144A, 0.97%, 04/01/141,2 | 300 | 301 | 0.10 | |||||||
| 861 | 0.29 | |||||||||
| Cosmetics/Personal Care - 0.28% | ||||||||||
| The Procter & Gamble Co., 1.80%, 11/15/15 | 790 | 821 | 0.28 | |||||||
| 821 | 0.28 | |||||||||
| Environmental Control - 0.25% | ||||||||||
| Republic Services, Inc., 5.00%, 03/01/20 | 350 | 407 | 0.14 | |||||||
| Waste Management, Inc., 4.60%, 03/01/21 | 300 | 345 | 0.11 | |||||||
| 752 | 0.25 | |||||||||
| Commercial Services - 0.12% | ||||||||||
| Catholic Health Initiatives, 1.60%, 11/01/17 | 350 | 352 | 0.12 | |||||||
| 352 | 0.12 | |||||||||
| Aerospace/Defense - 0.11% | ||||||||||
| Raytheon Co.: | ||||||||||
| 6.75%, 03/15/18 | 5 | 6 | — | |||||||
| 4.40%, 02/15/20 | 15 | 18 | 0.01 | |||||||
| United Technologies Corp., 3.10%, 06/01/22 | 270 | 291 | 0.10 | |||||||
| 315 | 0.11 | |||||||||
| Principal amount (000) | Market value (000) | Percent of net assets | |||||||
| Bonds & notes—continued | |||||||||
| Corporate bonds & notes—continued | |||||||||
| Investment Companies - 0.10% | |||||||||
| BHP Billiton Finance USA Ltd., 1.125%, 11/21/14 | $ | 300 | $ | 303 | 0.10 | % | |||
| 303 | 0.10 | ||||||||
| Healthcare-products - 0.10% | |||||||||
| Johnson & Johnson, 0.524%, 05/15/141 | 300 | 301 | 0.10 | ||||||
| 301 | 0.10 | ||||||||
| Advertising - 0.09% | |||||||||
| Omnicom Group, Inc., 3.625%, 05/01/22 | 250 | 268 | 0.09 | ||||||
| 268 | 0.09 | ||||||||
| Office/Business Equip - 0.09% | |||||||||
| Xerox Corp., 2.95%, 03/15/17 | 250 | 258 | 0.09 | ||||||
| 258 | 0.09 | ||||||||
| Internet - 0.09% | |||||||||
| Google, Inc., 1.25%, 05/19/14 | 250 | 253 | 0.09 | ||||||
| 253 | 0.09 | ||||||||
| Agriculture - 0.08% | |||||||||
| Altria Group, Inc., 2.85%, 08/09/22 | 250 | 251 | 0.08 | ||||||
| 251 | 0.08 | ||||||||
| Software - 0.06% | |||||||||
| Oracle Corp., 1.20%, 10/15/17 | 175 | 176 | 0.06 | ||||||
| 176 | 0.06 | ||||||||
| Gas - 0.02% | |||||||||
| National Grid PLC, 6.30%, 08/01/16 | 55 | 63 | 0.02 | ||||||
| 63 | 0.02 | ||||||||
| Total corporate bonds & notes | 73,635 | 24.84 | |||||||
| Municipals - 1.17% | |||||||||
| Citizens Property Insurance Corp. Rev, Series A, 5.00%, 06/01/21 | 750 | 882 | 0.30 | ||||||
| County of Harris, Highway Rev. Tolls Ref. Bonds, 1.061%, 08/15/16 | 1,000 | 998 | 0.33 | ||||||
| State of Illinois, G.O. Pension Fndg. Prop. Tax Bonds, 4.026%, 03/01/14 | 740 | 768 | 0.26 | ||||||
| State of Illinois, G.O. School Imps. Misc. Rev. Bonds, 4.422%, 04/01/15 | 300 | 314 | 0.10 | ||||||
| Univ. of Texas System, College & Univ. Rev. Ref. Bonds, Series D, 2.616%, 08/15/15 | 500 | 525 | 0.18 | ||||||
| Total municipals | 3,487 | 1.17 | |||||||
| Principal amount (000) | Market value (000) | Percent of net assets | |||||||||||||
| Bonds & notes—continued | |||||||||||||||
| Government & government agency bonds & notes outside the U.S. - 0.06% | |||||||||||||||
| European Investment Bank, 3.125%, 06/04/14 | $ | 160 | $ | 167 | 0.06 | % | |||||||||
| Total government & government agency bonds & notes outside the U.S. | 167 | 0.06 | |||||||||||||
| Asset-backed obligations - 0.11% | |||||||||||||||
| AEP Texas Central Transition Fndg. LLC, 5.09%, 07/01/17 | 75 | 81 | 0.03 | ||||||||||||
| Honda Auto Receivables Owner Trust, 1.34%, 03/18/14 | 240 | 241 | 0.08 | ||||||||||||
| Total asset-backed obligations | 322 | 0.11 | |||||||||||||
| Total bonds & notes (cost: $280,120,745) | 290,398 | 97.95 | |||||||||||||
| Short-term securities - 14.10% | |||||||||||||||
| Chariot Fndg LLC, 0.16%, 11/29/123 | 6,000 | 5,999 | 2.02 | ||||||||||||
| Chevron Corp., 0.12%, 11/19/123 | 5,600 | 5,600 | 1.89 | ||||||||||||
| Ei Du Pont De Nemours & Co., 0.13%, 11/26/123 | 5,400 | 5,399 | 1.82 | ||||||||||||
| Federal Home Loan Bank:3 | |||||||||||||||
| 0.135%, 12/05/12 | 1,300 | 1,300 | 0.44 | ||||||||||||
| 0.148%, 12/21/12 | 3,200 | 3,199 | 1.08 | ||||||||||||
| John Deere Credit Ltd., 0.14%, 11/05/123 | 5,400 | 5,400 | 1.82 | ||||||||||||
| Kimberly Clark Worldwide, Inc., 0.13%, 11/06/123 | 3,100 | 3,100 | 1.04 | ||||||||||||
| Straight A Funding LLC, 0.18%, 11/02/123 | 3,100 | 3,100 | 1.05 | ||||||||||||
| United Technologies Corp., 0.132%, 11/01/123 | 6,900 | 6,900 | 2.33 | ||||||||||||
| Wal-Mart Stores, Inc., 0.12%, 11/09/123 | 1,800 | 1,800 | 0.61 | ||||||||||||
| Total Short-term securities (cost: $41,797,402) | 41,797 | 14.10 | |||||||||||||
| Total investment securities (cost: $321,918,147) | 332,195 | 112.05 | |||||||||||||
| Other assets less liabilities | (35,733) | (12.05) | |||||||||||||
| Net assets | $ | 296,462 | 100.00 | % | |||||||||||
| 1 | Indicates a variable rate security. The interest rate shown reflects the rate in effect at October 31, 2012. | ||||||||||||||
| 2 | Acquired in a transaction exempt from registration under Rule 144A or section 4(2) of the Securities Act of 1933. May be resold in the U.S. in transactions exempt from registration, normally to qualified institutional buyers. At October 31, 2012, the aggregate market value of these securities amounted to $8,819,079, representing 2.97% of net assets. | ||||||||||||||
| 3 | Zero coupon bond; interest rate represents current yield to maturity. | ||||||||||||||
| Key to abbreviations | |||||||||||||||
| Co. | = Company | ||||||||||||||
| Corp. | = Corporation | ||||||||||||||
| Fndg. | = Funding | ||||||||||||||
| G.O. | = General Obligation | ||||||||||||||
| Imps. | = Improvements | ||||||||||||||
| Inc. | = Incorporated | ||||||||||||||
| Ltd. | = Limited | ||||||||||||||
| Misc. | = Miscellaneous | ||||||||||||||
| Prop. | = Property |
| Ref. | = Refunding |
| REITS | = Real Estate Investment Trusts |
| Rev. | = Revenue |
| TBA | = To be announced |
| Univ. | = University |
| Capital Global Equity Fund | |
| October 31, 2012 | |
Growth of $25,000 investment
Here’s how a $25,000 investment in the Capital Global Equity Fund grew between April 1, 2011, when the fund began operations, and October 31, 2012, the end of the fund’s fiscal year.
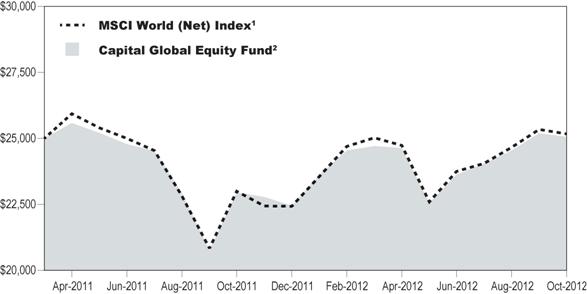
1 The index is unmanaged, and its results include reinvested distributions but do not reflect the effect of sales
charges, commissions, or expenses. Index returns are net of foreign withholding dividends.
2 Includes reinvested dividends and capital gain distributions.
Results are for past periods and are not predictive of results for future periods. Current and future results may be lower or higher than those shown. Share price and returns will vary so investors may lose money. The results shown are before taxes on fund distributions and sale of fund shares.
Investment portfolio – sector diversification
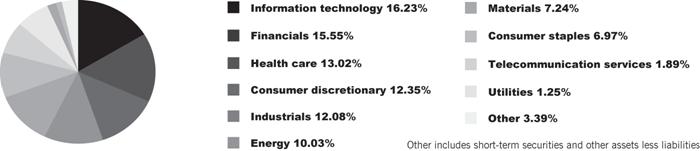
| Capital Global Equity Fund | |
| October 31, 2012 | |
Investment portfolio - country diversification
| Country | (percent of net assets) | |
| United States | 47.4% | |
| Japan | 8.3 | |
| Britain | 7.6 | |
| France | 5.7 | |
| Switzerland | 4.9 | |
| Canada | 3.9 | |
| Netherlands | 3.1 | |
| Germany | 2.4 | |
| Hong Kong | 2.2 | |
| Bermuda | 1.8 | |
| Singapore | 1.4 | |
| Sweden | 1.2 | |
| Finland | 1.1 | |
| China | 0.9 | |
| India | 0.9 | |
| South Korea | 0.8 | |
| Australia | 0.8 | |
| Luxembourg | 0.7 | |
| Denmark | 0.6 | |
| Brazil | 0.4 | |
| Austria | 0.3 | |
| Ireland | 0.2 | |
| Other assets less liabilities | 3.4 | |
Capital Global Equity Fund
Schedule of Investments
at October 31, 2012
.
| Shares | Market value (000) | Percent of net assets | |||||||
| Common Stocks - 96.61% | |||||||||
| Information Technology - 16.23% | |||||||||
| Google, Inc., Class A1 | 4,635 | $ | 3,151 | 1.54 | % | ||||
| International Business Machines Corp. | 13,750 | 2,675 | 1.31 | ||||||
| Keyence Corp. | 9,800 | 2,600 | 1.27 | ||||||
| Apple, Inc. | 4,000 | 2,380 | 1.16 | ||||||
| Oracle Corp. | 61,900 | 1,922 | 0.94 | ||||||
| Samsung Electronics Co. Ltd. (GDR) | 4,766 | 1,731 | 0.84 | ||||||
| Broadcom Corp., Class A1 | 51,400 | 1,621 | 0.79 | ||||||
| Hitachi Ltd. | 301,000 | 1,595 | 0.78 | ||||||
| Jack Henry & Associates, Inc. | 37,100 | 1,410 | 0.69 | ||||||
| QUALCOMM, Inc. | 21,700 | 1,271 | 0.62 | ||||||
| Gemalto NV | 13,714 | 1,238 | 0.60 | ||||||
| ASML Holding NV | 21,820 | 1,201 | 0.59 | ||||||
| Murata Manufacturing Co. Ltd. | 23,400 | 1,137 | 0.56 | ||||||
| Genpact Ltd. | 63,500 | 1,118 | 0.55 | ||||||
| KLA-Tencor Corp. | 23,500 | 1,093 | 0.53 | ||||||
| Microsoft Corp. | 36,600 | 1,044 | 0.51 | ||||||
| Visa, Inc., Class A | 6,200 | 860 | 0.42 | ||||||
| Jabil Circuit, Inc. | 46,100 | 799 | 0.39 | ||||||
| Hamamatsu Photonics K.K. | 22,500 | 779 | 0.38 | ||||||
| Trend Micro, Inc. | 20,800 | 583 | 0.28 | ||||||
| Premier Farnell PLC | 217,900 | 582 | 0.28 | ||||||
| TE Connectivity Ltd. | 17,300 | 557 | 0.27 | ||||||
| Canon, Inc. | 16,100 | 520 | 0.25 | ||||||
| SAP AG | 6,743 | 491 | 0.24 | ||||||
| Accenture PLC, Class A | 7,100 | 479 | 0.23 | ||||||
| National Instruments Corp. | 18,300 | 431 | 0.21 | ||||||
| 33,268 | 16.23 | ||||||||
| Financials - 15.55% | |||||||||
| HSBC Holdings PLC | 322,007 | 3,164 | 1.54 | ||||||
| AIA Group Ltd. | 623,600 | 2,466 | 1.20 | ||||||
| DBS Group Holdings Ltd. | 215,157 | 2,452 | 1.20 | ||||||
| Sampo OYJ, Class A | 71,567 | 2,243 | 1.10 | ||||||
| JPMorgan Chase & Co. | 52,500 | 2,188 | 1.07 | ||||||
| The Goldman Sachs Group, Inc. | 17,400 | 2,130 | 1.04 | ||||||
| Standard Chartered PLC | 85,978 | 2,031 | 0.99 | ||||||
| CME Group, Inc. | 35,600 | 1,991 | 0.97 | ||||||
| American Tower Corp. | 24,800 | 1,867 | 0.91 | ||||||
| ICICI Bank Ltd. (ADR) | 46,400 | 1,821 | 0.89 | ||||||
| Marsh & McLennan Cos., Inc. | 39,200 | 1,334 | 0.65 | ||||||
| The Charles Schwab Corp. | 98,200 | 1,334 | 0.65 | ||||||
| BlackRock, Inc. | 7,000 | 1,328 | 0.65 | ||||||
| Bank of China Ltd., Class H | 3,057,000 | 1,258 | 0.61 | ||||||
| The Progressive Corp. | 46,600 | 1,039 | 0.51 | ||||||
| BNP Paribas | 15,918 | 801 | 0.39 | ||||||
| BOC Hong Kong Holdings Ltd. | 171,500 | 529 | 0.26 | ||||||
| Aflac, Inc. | 9,600 | 478 | 0.23 | ||||||
| Ace Ltd. | 5,700 | 448 | 0.22 | ||||||
| Barclays PLC | 121,900 | 447 | 0.22 | ||||||
| Aon PLC | 6,200 | 334 | 0.16 | ||||||
| Shares | Market value (000) | Percent of net assets | ||||||||
| Common Stocks—continued | ||||||||||
| Financials—continued | ||||||||||
| Sun Hung Kai Properties Ltd. | 13,000 | $ | 181 | 0.09 | % | |||||
| 31,864 | 15.55 | |||||||||
| Health Care - 13.02% | ||||||||||
| Gilead Sciences, Inc.1 | 71,900 | 4,829 | 2.36 | |||||||
| Bristol-Myers Squibb Co. | 100,600 | 3,345 | 1.63 | |||||||
| Seattle Genetics, Inc.1 | 132,800 | 3,341 | 1.63 | |||||||
| Cerner Corp.1 | 25,100 | 1,913 | 0.93 | |||||||
| Allergan, Inc. | 20,400 | 1,834 | 0.90 | |||||||
| Bayer AG | 20,274 | 1,766 | 0.86 | |||||||
| Novartis AG | 27,554 | 1,658 | 0.81 | |||||||
| Express Scripts Holding Co.1 | 25,200 | 1,551 | 0.76 | |||||||
| Essilor International SA | 14,520 | 1,309 | 0.64 | |||||||
| Novo Nordisk A/S, Class B | 7,280 | 1,173 | 0.57 | |||||||
| Sysmex Corp. | 24,600 | 1,157 | 0.57 | |||||||
| UnitedHealth Group, Inc. | 17,200 | 963 | 0.47 | |||||||
| Sonova Holding AG1 | 7,138 | 718 | 0.35 | |||||||
| Roche Holding AG | 2,798 | 538 | 0.26 | |||||||
| Agilent Technologies, Inc. | 8,800 | 317 | 0.15 | |||||||
| DaVita, Inc.1 | 2,400 | 270 | 0.13 | |||||||
| 26,682 | 13.02 | |||||||||
| Consumer Discretionary - 12.35% | ||||||||||
| Comcast Corp., Class A | 81,300 | 3,050 | 1.49 | |||||||
| The Home Depot, Inc. | 40,500 | 2,486 | 1.21 | |||||||
| Compagnie Financiere Richemont SA, Class A | 31,480 | 2,042 | 1.00 | |||||||
| Tiffany & Co. | 32,200 | 2,036 | 0.99 | |||||||
| SES SA | 55,121 | 1,525 | 0.74 | |||||||
| Hennes & Mauritz AB, Class B | 45,031 | 1,524 | 0.74 | |||||||
| Bayerische Motoren Werke AG | 18,201 | 1,450 | 0.71 | |||||||
| Scripps Networks Interactive, Inc., Class A | 22,000 | 1,336 | 0.65 | |||||||
| Target Corp. | 19,600 | 1,249 | 0.61 | |||||||
| Carnival Corp. | 31,700 | 1,201 | 0.59 | |||||||
| Signet Jewelers Ltd. | 21,300 | 1,102 | 0.54 | |||||||
| Time Warner Cable, Inc. | 8,900 | 882 | 0.43 | |||||||
| Coach, Inc. | 15,000 | 841 | 0.41 | |||||||
| LVMH Moet Hennessy Louis Vuitton SA | 4,500 | 731 | 0.36 | |||||||
| Stanley Black & Decker, Inc. | 9,900 | 686 | 0.33 | |||||||
| Denso Corp. | 19,400 | 607 | 0.30 | |||||||
| Nordstrom, Inc. | 9,300 | 528 | 0.26 | |||||||
| The Walt Disney Co. | 10,300 | 505 | 0.25 | |||||||
| Genting Singapore PLC | 359,000 | 391 | 0.19 | |||||||
| Discovery Communications, Inc., Class A1 | 6,600 | 390 | 0.19 | |||||||
| NIKE, Inc., Class B | 4,000 | 366 | 0.18 | |||||||
| Whitbread PLC | 9,600 | 364 | 0.18 | |||||||
| The New York Times Co., Class A1 | 1,100 | 9 | — | |||||||
| 25,301 | 12.35 | |||||||||
| Industrials - 12.08% | ||||||||||
| Eaton Corp. | 46,900 | 2,215 | 1.08 | |||||||
| Schneider Electric SA | 29,919 | 1,871 | 0.91 | |||||||
| Shares | Market value (000) | Percent of net assets | ||||||||
| Common Stocks—continued | ||||||||||
| Industrials—continued | ||||||||||
| United Technologies Corp. | 23,700 | $ | 1,852 | 0.90 | % | |||||
| Nielsen Holdings NV1 | 60,200 | 1,741 | 0.85 | |||||||
| Cae, Inc. | 153,400 | 1,688 | 0.82 | |||||||
| SMC Corp. | 10,600 | 1,670 | 0.82 | |||||||
| FANUC Corp. | 9,000 | 1,433 | 0.70 | |||||||
| Caterpillar, Inc. | 16,400 | 1,391 | 0.68 | |||||||
| Iron Mountain, Inc. | 34,400 | 1,190 | 0.58 | |||||||
| Norfolk Southern Corp. | 18,600 | 1,141 | 0.56 | |||||||
| Danaher Corp. | 20,500 | 1,060 | 0.52 | |||||||
| JGC Corp. | 30,000 | 1,032 | 0.50 | |||||||
| Republic Services, Inc. | 35,600 | 1,009 | 0.49 | |||||||
| Assa Abloy AB, Class B | 29,904 | 997 | 0.49 | |||||||
| Union Pacific Corp. | 5,800 | 714 | 0.35 | |||||||
| 3M Co. | 7,400 | 648 | 0.32 | |||||||
| General Electric Co. | 30,500 | 642 | 0.31 | |||||||
| The Boeing Co. | 9,000 | 634 | 0.31 | |||||||
| Andritz AG | 8,311 | 501 | 0.25 | |||||||
| FirstGroup PLC | 121,800 | 374 | 0.18 | |||||||
| Emerson Electric Co. | 6,100 | 295 | 0.14 | |||||||
| Illinois Tool Works, Inc. | 4,200 | 258 | 0.13 | |||||||
| Mitsubishi Corp. | 11,600 | 207 | 0.10 | |||||||
| FedEx Corp. | 2,000 | 184 | 0.09 | |||||||
| 24,747 | 12.08 | |||||||||
| Energy - 10.03% | ||||||||||
| Schlumberger Ltd. | 41,400 | 2,879 | 1.40 | |||||||
| Royal Dutch Shell PLC, Class A (ADR) | 40,050 | 2,743 | 1.34 | |||||||
| Cenovus Energy, Inc. | 65,800 | 2,322 | 1.14 | |||||||
| Encana Corp. | 81,100 | 1,827 | 0.89 | |||||||
| Noble Energy, Inc. | 18,000 | 1,710 | 0.83 | |||||||
| Halliburton Co. | 50,000 | 1,614 | 0.79 | |||||||
| Seadrill Ltd. | 35,327 | 1,430 | 0.70 | |||||||
| Ensco PLC, Class A | 23,900 | 1,382 | 0.67 | |||||||
| Chevron Corp. | 9,550 | 1,052 | 0.51 | |||||||
| BG Group PLC | 54,000 | 1,000 | 0.49 | |||||||
| Fugro NV | 10,705 | 724 | 0.35 | |||||||
| Dril-quip, Inc.1 | 8,600 | 596 | 0.29 | |||||||
| China Shenhua Energy Co. Ltd., Class H | 132,500 | 564 | 0.28 | |||||||
| Cobalt International Energy, Inc.1 | 18,600 | 387 | 0.19 | |||||||
| Pengrowth Energy Corp. | 54,200 | 325 | 0.16 | |||||||
| 20,555 | 10.03 | |||||||||
| Materials - 7.24% | ||||||||||
| Monsanto Co. | 27,100 | 2,332 | 1.14 | |||||||
| Air Liquide SA | 12,981 | 1,531 | 0.75 | |||||||
| Rio Tinto PLC | 25,100 | 1,257 | 0.61 | |||||||
| Air Products & Chemicals, Inc. | 15,900 | 1,233 | 0.60 | |||||||
| Linde AG | 6,813 | 1,146 | 0.56 | |||||||
| BHP Billiton Ltd. | 30,194 | 1,073 | 0.52 | |||||||
| Ecolab, Inc. | 13,500 | 940 | 0.46 | |||||||
| Barrick Gold Corp. | 22,200 | 898 | 0.44 | |||||||
| Syngenta AG | 2,246 | 877 | 0.43 | |||||||
| Shares | Market value (000) | Percent of net assets | ||||||||||
| Common Stocks—continued | ||||||||||||
| Materials—continued | ||||||||||||
| The Mosaic Co. | 11,800 | $ | 618 | 0.30 | % | |||||||
| Newcrest Mining Ltd. | 21,289 | 584 | 0.29 | |||||||||
| Inmet Mining Corp. | 10,600 | 547 | 0.27 | |||||||||
| Allegheny Technologies, Inc. | 19,600 | 516 | 0.25 | |||||||||
| Koninklijke DSM NV | 9,692 | 498 | 0.24 | |||||||||
| The Dow Chemical Co. | 14,300 | 419 | 0.20 | |||||||||
| Nucor Corp. | 9,200 | 369 | 0.18 | |||||||||
| 14,838 | 7.24 | |||||||||||
| Consumer Staples - 6.97% | ||||||||||||
| Danone SA | 40,670 | 2,500 | 1.22 | |||||||||
| Nestle SA | 37,281 | 2,366 | 1.15 | |||||||||
| Pernod-Ricard SA | 20,952 | 2,255 | 1.10 | |||||||||
| Diageo PLC | 75,000 | 2,143 | 1.05 | |||||||||
| Ajinomoto Co., Inc. | 92,000 | 1,405 | 0.69 | |||||||||
| Philip Morris International, Inc. | 12,800 | 1,134 | 0.55 | |||||||||
| Imperial Tobacco Group PLC | 20,849 | 787 | 0.38 | |||||||||
| L'Oreal SA | 5,595 | 713 | 0.35 | |||||||||
| Reckitt Benckiser Group PLC | 8,300 | 502 | 0.25 | |||||||||
| Nestle SA (ADR) | 7,600 | 481 | 0.23 | |||||||||
| 14,286 | 6.97 | |||||||||||
| Telecommunication Services - 1.89% | ||||||||||||
| Softbank Corp. | 69,500 | 2,200 | 1.07 | |||||||||
| Oi SA (ADR) | 205,129 | 825 | 0.40 | |||||||||
| Swisscom AG | 1,018 | 423 | 0.21 | |||||||||
| Telus Corp. | 6,000 | 386 | 0.19 | |||||||||
| Koninklijke KPN NV | 5,384 | 34 | 0.02 | |||||||||
| 3,868 | 1.89 | |||||||||||
| Utilities - 1.25% | ||||||||||||
| Hong Kong & China Gas Co. Ltd. | 504,780 | 1,345 | 0.66 | |||||||||
| National Grid PLC | 106,200 | 1,211 | 0.59 | |||||||||
| 2,556 | 1.25 | |||||||||||
| Total Common Stocks (cost: $182,334,130) | 197,965 | 96.61 | ||||||||||
| Total investment securities (cost: $182,334,130) | 197,965 | 96.61 | ||||||||||
| Other assets less liabilities | 6,947 | 3.39 | ||||||||||
| Net assets | $ | 204,912 | 100.00 | % | ||||||||
| 1 | Non-income producing security. | |||||||||||
| ADR | - American Depositary Receipts | |
| GDR | - Global Depositary Receipts | |
| Capital Non-U.S. Equity Fund | |
| October 31, 2012 | |
Growth of $25,000 investment
Here’s how a $25,000 investment in the Capital Non-U.S. Equity Fund grew between April 1, 2011, when the fund began operations, and October 31, 2012, the end of the fund’s fiscal year.

1 The index is unmanaged, and its results include reinvested distributions but do not reflect the effect of sales
charges, commissions, or expenses. Index returns are net of foreign withholding dividends.
2 Includes reinvested dividends and capital gain distributions.
Results are for past periods and are not predictive of results for future periods. Current and future results may be lower or higher than those shown. Share price and returns will vary so investors may lose money. The results shown are before taxes on fund distributions and sale of fund shares.
Investment portfolio – sector diversification
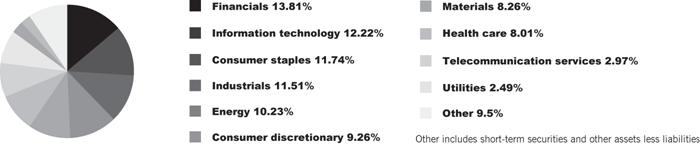
| Capital Non-U.S. Equity Fund | |
| October 31, 2012 | |
Investment portfolio - country diversification
| Country | (percent of net assets) | |
| Japan | 16.5% | |
| Britain | 12.4 | |
| France | 10.7 | |
| Switzerland | 9.9 | |
| Netherlands | 6.7 | |
| Canada | 5.4 | |
| Germany | 4.2 | |
| Hong Kong | 4.0 | |
| Sweden | 3.9 | |
| Bermuda | 1.9 | |
| Finland | 1.7 | |
| Australia | 1.7 | |
| Singapore | 1.7 | |
| Luxembourg | 1.6 | |
| South Korea | 1.6 | |
| China | 1.5 | |
| Denmark | 1.5 | |
| Austria | 1.2 | |
| Spain | 0.8 | |
| India | 0.8 | |
| Brazil | 0.7 | |
| Ireland | 0.1 | |
| Short-term securities & other assets less liabilities | 9.5 | |
Capital Non-U.S. Equity Fund
Schedule of Investments
at October 31, 2012
| Shares | Market value (000) | Percent of net assets | |||||||
| Common Stocks - 90.50% | |||||||||
| Financials - 13.81% | |||||||||
| HSBC Holdings PLC | 680,721 | $ | 6,688 | 2.61 | % | ||||
| AIA Group Ltd. | 1,618,200 | 6,400 | 2.50 | ||||||
| Sampo OYJ, Class A | 142,023 | 4,451 | 1.74 | ||||||
| DBS Group Holdings Ltd. | 379,286 | 4,322 | 1.69 | ||||||
| Standard Chartered PLC | 156,883 | 3,705 | 1.45 | ||||||
| BNP Paribas | 40,346 | 2,030 | 0.79 | ||||||
| ICICI Bank Ltd. (ADR) | 51,300 | 2,013 | 0.79 | ||||||
| Bank of China Ltd., Class H | 4,831,000 | 1,988 | 0.78 | ||||||
| Australia & New Zealand Banking Group Ltd. | 51,887 | 1,371 | 0.53 | ||||||
| Svenska Handelsbanken AB, A Shares | 32,574 | 1,116 | 0.43 | ||||||
| Barclays PLC | 249,100 | 914 | 0.36 | ||||||
| Banco Bradesco SA (ADR) | 23,800 | 373 | 0.14 | ||||||
| 35,371 | 13.81 | ||||||||
| Information Technology - 12.22% | |||||||||
| Keyence Corp. | 20,400 | 5,412 | 2.11 | ||||||
| Hitachi Ltd. | 806,000 | 4,271 | 1.67 | ||||||
| Samsung Electronics Co. Ltd. (GDR) | 10,194 | 3,702 | 1.45 | ||||||
| Murata Manufacturing Co. Ltd. | 68,100 | 3,310 | 1.29 | ||||||
| Hamamatsu Photonics K.K. | 81,900 | 2,837 | 1.11 | ||||||
| Gemalto NV | 30,970 | 2,795 | 1.09 | ||||||
| ASML Holding NV | 48,352 | 2,660 | 1.04 | ||||||
| Canon, Inc. | 62,800 | 2,028 | 0.79 | ||||||
| SAP AG | 25,310 | 1,844 | 0.72 | ||||||
| Trend Micro, Inc. | 51,400 | 1,440 | 0.56 | ||||||
| Premier Farnell PLC | 242,500 | 647 | 0.25 | ||||||
| Samsung Electronics Co. Ltd. (GDR)1 | 908 | 333 | 0.13 | ||||||
| Canon, Inc. (ADR) | 900 | 29 | 0.01 | ||||||
| 31,308 | 12.22 | ||||||||
| Consumer Staples - 11.74% | |||||||||
| Pernod-Ricard SA | 56,249 | 6,054 | 2.36 | ||||||
| Nestle SA | 87,868 | 5,576 | 2.18 | ||||||
| Danone SA | 75,279 | 4,627 | 1.81 | ||||||
| Diageo PLC | 158,100 | 4,518 | 1.76 | ||||||
| Ajinomoto Co., Inc. | 198,000 | 3,024 | 1.18 | ||||||
| L'Oreal SA | 22,218 | 2,830 | 1.11 | ||||||
| Imperial Tobacco Group PLC | 51,795 | 1,956 | 0.76 | ||||||
| Reckitt Benckiser Group PLC | 18,400 | 1,114 | 0.44 | ||||||
| Nestle SA (ADR) | 5,800 | 367 | 0.14 | ||||||
| 30,066 | 11.74 | ||||||||
| Industrials - 11.51% | |||||||||
| Assa Abloy AB, Class B | 184,256 | 6,142 | 2.40 | ||||||
| FANUC Corp. | 28,400 | 4,522 | 1.77 | ||||||
| SMC Corp. | 26,000 | 4,097 | 1.60 | ||||||
| Schneider Electric SA | 56,648 | 3,542 | 1.38 | ||||||
| Cae, Inc. | 300,700 | 3,309 | 1.29 | ||||||
| Andritz AG | 49,895 | 3,005 | 1.17 | ||||||
| JGC Corp. | 79,000 | 2,716 | 1.06 | ||||||
| FirstGroup PLC | 373,100 | 1,147 | 0.45 | ||||||
| Shares | Market value (000) | Percent of net assets | ||||||||
| Common Stocks—continued | ||||||||||
| Industrials—continued | ||||||||||
| Mitsubishi Corp. | 34,500 | $ | 616 | 0.24 | % | |||||
| Nidec Corp. | 5,500 | 391 | 0.15 | |||||||
| 29,487 | 11.51 | |||||||||
| Energy - 10.23% | ||||||||||
| Seadrill Ltd. | 118,850 | 4,811 | 1.88 | |||||||
| Fugro NV | 68,783 | 4,650 | 1.82 | |||||||
| BG Group PLC | 233,000 | 4,315 | 1.68 | |||||||
| Royal Dutch Shell PLC, Class A (ADR) | 61,700 | 4,225 | 1.65 | |||||||
| Cenovus Energy, Inc. | 92,800 | 3,274 | 1.28 | |||||||
| Encana Corp. | 131,600 | 2,965 | 1.16 | |||||||
| China Shenhua Energy Co. Ltd., Class H | 458,500 | 1,952 | 0.76 | |||||||
| 26,192 | 10.23 | |||||||||
| Consumer Discretionary - 9.26% | ||||||||||
| Compagnie Financiere Richemont SA, Class A | 80,481 | 5,219 | 2.04 | |||||||
| SES SA | 150,024 | 4,151 | 1.62 | |||||||
| Bayerische Motoren Werke AG | 35,015 | 2,789 | 1.09 | |||||||
| Hennes & Mauritz AB, Class B | 81,249 | 2,750 | 1.07 | |||||||
| LVMH Moet Hennessy Louis Vuitton SA | 15,576 | 2,532 | 0.99 | |||||||
| Inditex SA | 16,349 | 2,086 | 0.81 | |||||||
| Carnival PLC | 30,500 | 1,213 | 0.47 | |||||||
| Wolters Kluwer NV | 60,913 | 1,179 | 0.46 | |||||||
| Denso Corp. | 34,500 | 1,080 | 0.42 | |||||||
| Whitbread PLC | 19,300 | 732 | 0.29 | |||||||
| 23,731 | 9.26 | |||||||||
| Materials - 8.26% | ||||||||||
| Syngenta AG | 14,395 | 5,623 | 2.20 | |||||||
| Air Liquide SA | 24,651 | 2,908 | 1.14 | |||||||
| Linde AG | 14,154 | 2,380 | 0.93 | |||||||
| Inmet Mining Corp. | 43,800 | 2,259 | 0.88 | |||||||
| Rio Tinto PLC | 44,200 | 2,214 | 0.86 | |||||||
| BHP Billiton Ltd. | 59,865 | 2,128 | 0.83 | |||||||
| Koninklijke DSM NV | 32,168 | 1,652 | 0.64 | |||||||
| Barrick Gold Corp. | 27,600 | 1,116 | 0.44 | |||||||
| Newcrest Mining Ltd. | 32,153 | 882 | 0.34 | |||||||
| 21,162 | 8.26 | |||||||||
| Health Care - 8.01% | ||||||||||
| Novo Nordisk A/S, Class B | 23,919 | 3,855 | 1.50 | |||||||
| Bayer AG | 43,537 | 3,792 | 1.48 | |||||||
| Roche Holding AG | 19,692 | 3,787 | 1.48 | |||||||
| Novartis AG | 53,269 | 3,206 | 1.25 | |||||||
| Essilor International SA | 31,784 | 2,865 | 1.12 | |||||||
| Sysmex Corp. | 52,200 | 2,455 | 0.96 | |||||||
| Sonova Holding AG2 | 3,342 | 336 | 0.13 | |||||||
| Shire PLC | 8,300 | 233 | 0.09 | |||||||
| 20,529 | 8.01 | |||||||||
| Shares | Market value (000) | Percent of net assets | ||||||||||||
| Common Stocks—continued | ||||||||||||||
| Telecommunication Services - 2.97% | ||||||||||||||
| Softbank Corp. | 127,000 | $ | 4,020 | 1.57 | % | |||||||||
| Oi SA (ADR) | 325,000 | 1,307 | 0.51 | |||||||||||
| Swisscom AG | 2,976 | 1,236 | 0.48 | |||||||||||
| Telus Corp. | 14,700 | 945 | 0.37 | |||||||||||
| Koninklijke KPN NV | 17,006 | 108 | 0.04 | |||||||||||
| 7,616 | 2.97 | |||||||||||||
| Utilities - 2.49% | ||||||||||||||
| Hong Kong & China Gas Co. Ltd. | 1,440,693 | 3,839 | 1.50 | |||||||||||
| National Grid PLC | 223,200 | 2,545 | 0.99 | |||||||||||
| 6,384 | 2.49 | |||||||||||||
| Total Common Stocks (cost: $222,928,417) | 231,846 | 90.50 | ||||||||||||
| Principal amount (000) | Market value (000) | Percent of net assets | ||||||||||||
| Short-term securities - 9.64% | ||||||||||||||
| Ei Du Pont De Nemours & Co., 0.13%, 11/26/123 | $ | 2,000 | 2,000 | 0.78 | ||||||||||
| Federal Home Loan Bank:3 | ||||||||||||||
| 0.15%, 11/19/12 | 3,700 | 3,700 | 1.44 | |||||||||||
| 0.13%, 12/07/12 | 1,600 | 1,600 | 0.62 | |||||||||||
| 0.13%, 12/21/12 | 3,100 | 3,099 | 1.21 | |||||||||||
| 0.125%, 11/14/12 | 1,000 | 1,000 | 0.39 | |||||||||||
| 0.125%, 11/28/12 | 3,705 | 3,704 | 1.45 | |||||||||||
| 0.12%, 12/19/12 | 1,300 | 1,300 | 0.51 | |||||||||||
| Federal National Mortgage Association, 0.12%, 11/07/123 | 1,700 | 1,700 | 0.66 | |||||||||||
| Jupiter Securitization Co. LLC:3 | ||||||||||||||
| 0.16%, 11/16/12 | 1,400 | 1,400 | 0.55 | |||||||||||
| 0.20%, 01/04/13 | 2,200 | 2,199 | 0.86 | |||||||||||
| Wal-Mart Stores, Inc., 0.12%, 11/05/123 | 3,000 | 3,000 | 1.17 | |||||||||||
| Total Short-term securities (cost: $24,702,224) | 24,702 | 9.64 | ||||||||||||
| Total investment securities (cost: $247,630,641) | 256,548 | 100.14 | ||||||||||||
| Other assets less liabilities | (363) | (0.14) | ||||||||||||
| Net assets | $ | 256,185 | 100.00 | % | ||||||||||
| 1 | Acquired in a transaction exempt from registration under Rule 144A or section 4(2) of the Securities Act of 1933. May be resold in the U.S. in transactions exempt from registration, normally to qualified institutional buyers. At October 31, 2012, the aggregate market value of these securities amounted to $333,145, representing 0.13% of net assets. | |||||||||||||
| 2 | Non-income producing security. | |||||||||||||
| 3 | Zero coupon bond; interest rate represents current yield to maturity. | |||||||||||||
| ADR | - American Depositary Receipts | |
| GDR | - Global Depositary Receipts | |
| Capital U.S. Equity Fund | |
| October 31, 2012 | |
Growth of $25,000 investment
Here’s how a $25,000 investment in the Capital U.S. Equity Fund grew between April 1, 2011, when the fund began operations, and October 31, 2012, the end of the fund’s fiscal year.
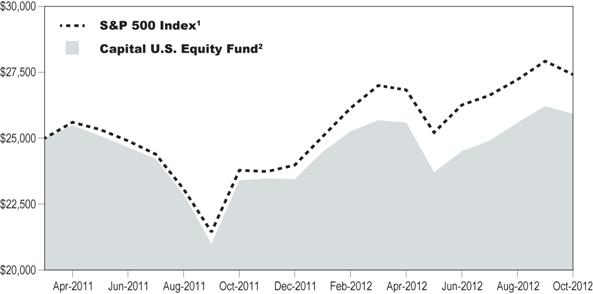
1 The index is unmanaged, and its results include reinvested distributions but do not reflect the effect of sales
charges, commissions, or expenses.
2 Includes reinvested dividends and capital gain distributions.
Results are for past periods and are not predictive of results for future periods. Current and future results may be lower or higher than those shown. Share price and returns will vary so investors may lose money. The results shown are before taxes on fund distributions and sale of fund shares.
Investment portfolio – sector diversification
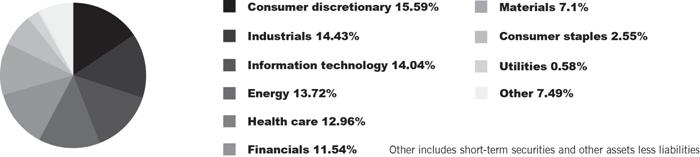
Capital U.S. Equity Fund
Schedule of Investments
at October 31, 2012
| Shares | Market value (000) | Percent of net assets | |||||||
| Common Stocks - 92.51% | |||||||||
| Consumer Discretionary - 15.59% | |||||||||
| Comcast Corp., Class A | 76,500 | $ | 2,869 | 2.79 | % | ||||
| The Home Depot, Inc. | 35,200 | 2,161 | 2.10 | ||||||
| Carnival Corp. | 48,100 | 1,822 | 1.77 | ||||||
| Tiffany & Co. | 23,500 | 1,486 | 1.45 | ||||||
| Target Corp. | 23,100 | 1,473 | 1.43 | ||||||
| Stanley Black & Decker, Inc. | 18,900 | 1,310 | 1.27 | ||||||
| Darden Restaurants, Inc. | 18,600 | 979 | 0.95 | ||||||
| Scripps Networks Interactive, Inc., Class A | 15,200 | 923 | 0.90 | ||||||
| Coach, Inc. | 16,400 | 919 | 0.89 | ||||||
| The Walt Disney Co. | 15,400 | 756 | 0.74 | ||||||
| Signet Jewelers Ltd. | 12,800 | 662 | 0.65 | ||||||
| NIKE, Inc., Class B | 4,000 | 365 | 0.36 | ||||||
| Time Warner Cable, Inc. | 3,000 | 297 | 0.29 | ||||||
| 16,022 | 15.59 | ||||||||
| Industrials - 14.43% | |||||||||
| Eaton Corp. | 38,300 | 1,808 | 1.76 | ||||||
| United Technologies Corp. | 22,900 | 1,790 | 1.74 | ||||||
| Danaher Corp. | 31,300 | 1,619 | 1.58 | ||||||
| Iron Mountain, Inc. | 42,100 | 1,457 | 1.42 | ||||||
| Norfolk Southern Corp. | 23,500 | 1,442 | 1.40 | ||||||
| Caterpillar, Inc. | 13,400 | 1,136 | 1.11 | ||||||
| Nielsen Holdings NV1 | 37,400 | 1,082 | 1.05 | ||||||
| Republic Services, Inc. | 33,400 | 947 | 0.92 | ||||||
| General Electric Co. | 43,500 | 916 | 0.89 | ||||||
| Union Pacific Corp. | 4,800 | 591 | 0.57 | ||||||
| Emerson Electric Co. | 10,500 | 508 | 0.49 | ||||||
| Cae, Inc. | 46,000 | 502 | 0.49 | ||||||
| 3M Co. | 5,500 | 482 | 0.47 | ||||||
| The Boeing Co. | 5,700 | 401 | 0.39 | ||||||
| United Parcel Service, Inc., Class B | 2,100 | 154 | 0.15 | ||||||
| 14,835 | 14.43 | ||||||||
| Information Technology - 14.04% | |||||||||
| International Business Machines Corp. | 10,400 | 2,023 | 1.97 | ||||||
| Apple, Inc. | 3,090 | 1,839 | 1.79 | ||||||
| Google, Inc., Class A1 | 2,350 | 1,597 | 1.55 | ||||||
| Jack Henry & Associates, Inc. | 40,800 | 1,550 | 1.51 | ||||||
| QUALCOMM, Inc. | 20,300 | 1,189 | 1.16 | ||||||
| Microsoft Corp. | 41,100 | 1,173 | 1.14 | ||||||
| Broadcom Corp., Class A1 | 34,600 | 1,091 | 1.06 | ||||||
| Oracle Corp. | 32,200 | 1,000 | 0.97 | ||||||
| Accenture PLC, Class A | 11,925 | 804 | 0.78 | ||||||
| Jabil Circuit, Inc. | 39,000 | 676 | 0.66 | ||||||
| Visa, Inc., Class A | 3,900 | 541 | 0.53 | ||||||
| Genpact Ltd. | 29,000 | 511 | 0.50 | ||||||
| TE Connectivity Ltd. | 13,600 | 438 | 0.42 | ||||||
| 14,432 | 14.04 | ||||||||
| Energy - 13.72% | |||||||||
| Schlumberger Ltd. | 31,200 | 2,169 | 2.11 | ||||||
| Shares | Market value (000) | Percent of net assets | ||||||||
| Common Stocks—continued | ||||||||||
| Energy—continued | ||||||||||
| Royal Dutch Shell PLC, Class A (ADR) | 28,600 | $ | 1,959 | 1.91 | % | |||||
| Cenovus Energy, Inc. | 54,100 | 1,910 | 1.86 | |||||||
| Chevron Corp. | 12,700 | 1,400 | 1.36 | |||||||
| Noble Energy, Inc. | 11,500 | 1,093 | 1.06 | |||||||
| Halliburton Co. | 33,500 | 1,082 | 1.05 | |||||||
| Ensco PLC, Class A | 16,500 | 954 | 0.93 | |||||||
| Encana Corp. | 41,200 | 929 | 0.90 | |||||||
| EOG Resources, Inc. | 7,400 | 862 | 0.84 | |||||||
| Dril-quip, Inc.1 | 9,600 | 665 | 0.65 | |||||||
| Kinder Morgan, Inc. | 16,600 | 576 | 0.56 | |||||||
| Cobalt International Energy, Inc.1 | 24,000 | 499 | 0.49 | |||||||
| 14,098 | 13.72 | |||||||||
| Health Care - 12.96% | ||||||||||
| Gilead Sciences, Inc.1 | 38,200 | 2,565 | 2.50 | |||||||
| Bristol-Myers Squibb Co. | 75,900 | 2,524 | 2.46 | |||||||
| Allergan, Inc. | 17,700 | 1,592 | 1.55 | |||||||
| Express Scripts Holding Co.1 | 22,600 | 1,391 | 1.35 | |||||||
| Cerner Corp.1 | 17,600 | 1,341 | 1.30 | |||||||
| Seattle Genetics, Inc.1 | 52,800 | 1,328 | 1.29 | |||||||
| Centene Corp.1 | 18,000 | 684 | 0.67 | |||||||
| UnitedHealth Group, Inc. | 10,900 | 610 | 0.59 | |||||||
| Novo Nordisk A/S | 3,700 | 593 | 0.58 | |||||||
| Pfizer, Inc. | 21,600 | 537 | 0.52 | |||||||
| Agilent Technologies, Inc. | 4,200 | 151 | 0.15 | |||||||
| 13,316 | 12.96 | |||||||||
| Financials - 11.54% | ||||||||||
| American Tower Corp. | 23,000 | 1,732 | 1.69 | |||||||
| BB&T Corp. | 55,200 | 1,598 | 1.55 | |||||||
| CME Group, Inc. | 26,750 | 1,496 | 1.46 | |||||||
| JPMorgan Chase & Co. | 34,000 | 1,417 | 1.38 | |||||||
| The Goldman Sachs Group, Inc. | 10,400 | 1,273 | 1.24 | |||||||
| Marsh & McLennan Cos., Inc. | 30,600 | 1,041 | 1.01 | |||||||
| BlackRock, Inc. | 4,950 | 939 | 0.91 | |||||||
| Ace Ltd. | 11,200 | 881 | 0.86 | |||||||
| Aflac, Inc. | 11,900 | 593 | 0.58 | |||||||
| The Charles Schwab Corp. | 25,700 | 349 | 0.34 | |||||||
| Aon PLC | 5,600 | 302 | 0.29 | |||||||
| The Progressive Corp. | 10,500 | 234 | 0.23 | |||||||
| 11,855 | 11.54 | |||||||||
| Materials - 7.10% | ||||||||||
| Monsanto Co. | 23,600 | 2,031 | 1.98 | |||||||
| Air Products & Chemicals, Inc. | 16,800 | 1,302 | 1.27 | |||||||
| Ecolab, Inc. | 13,900 | 967 | 0.94 | |||||||
| The Mosaic Co. | 17,400 | 911 | 0.88 | |||||||
| Barrick Gold Corp. | 14,100 | 571 | 0.55 | |||||||
| Allegheny Technologies, Inc. | 20,000 | 527 | 0.51 | |||||||
| Nucor Corp. | 12,600 | 506 | 0.49 | |||||||
| The Dow Chemical Co. | 11,800 | 346 | 0.34 | |||||||
| Shares | Market value (000) | Percent of net assets | |||||||||||||
| Common Stocks—continued | |||||||||||||||
| Materials—continued | |||||||||||||||
| Rio Tinto PLC | 2,800 | $ | 140 | 0.14 | % | ||||||||||
| 7,301 | 7.10 | ||||||||||||||
| Consumer Staples - 2.55% | |||||||||||||||
| Philip Morris International, Inc. | 12,400 | 1,098 | 1.07 | ||||||||||||
| Nestle SA (ADR) | 15,900 | 1,007 | 0.98 | ||||||||||||
| PepsiCo, Inc. | 4,300 | 298 | 0.29 | ||||||||||||
| Diageo PLC (ADR) | 1,900 | 217 | 0.21 | ||||||||||||
| 2,620 | 2.55 | ||||||||||||||
| Utilities - 0.58% | |||||||||||||||
| National Grid PLC | 10,500 | 599 | 0.58 | ||||||||||||
| 599 | 0.58 | ||||||||||||||
| Total Common Stocks (cost: $85,208,144) | 95,078 | 92.51 | |||||||||||||
| Principal amount (000) | Market value (000) | Percent of net assets | |||||||||||||
| Short-term securities - 7.39% | |||||||||||||||
| Ei Dupont, 0.18%, 12/11/122 | $ | 1,200 | 1,200 | 1.17 | |||||||||||
| Federal Home Loan Bank:2 | |||||||||||||||
| 0.13%, 12/12/12 | 1,200 | 1,200 | 1.17 | ||||||||||||
| 0.13%, 11/30/12 | 500 | 500 | 0.48 | ||||||||||||
| Honeywell International, Inc., 0.14%, 12/19/122 | 2,700 | 2,699 | 2.63 | ||||||||||||
| United Technologies Corp., 1.00%, 11/01/122 | 2,000 | 2,000 | 1.94 | ||||||||||||
| Total Short-term securities (cost: $7,599,026) | 7,599 | 7.39 | |||||||||||||
| Total investment securities (cost: $92,807,170) | 102,677 | 99.90 | |||||||||||||
| Other assets less liabilities | 99 | 0.10 | |||||||||||||
| Net assets | $ | 102,776 | 100.00 | % | |||||||||||
| 1 | Non-income producing security. | ||||||||||||||
| 2 | Zero coupon bond; interest rate represents current yield to maturity. | ||||||||||||||
| ADR | - American Depositary Receipts | ||||||||||||||
| Capital Core Municipal Fund | |||||||||
| Statement of assets and liabilities | |||||||||
| at October 31, 2012 | (dollars and shares in thousands) (except per share amounts) | ||||||||
| Assets: | |||||||||
| Investment securities, at value (cost: $271,462) | $ | 285,876 | |||||||
| Short-term investments, at value (cost: $7,355) | 7,355 | ||||||||
| Cash | 80 | ||||||||
| Receivables for: | |||||||||
| Sales of investments | – | ||||||||
| Sales of fund's shares | – | ||||||||
| Interest | 3,510 | ||||||||
| Reimbursement from investment adviser | 5 | ||||||||
| 3,515 | |||||||||
| Total assets | 296,826 | ||||||||
| Liabilities: | |||||||||
| Payables for: | |||||||||
| Purchases of investments | 3,839 | ||||||||
| Repurchases of fund's shares | 315 | ||||||||
| Dividend on fund shares | 210 | ||||||||
| Investment advisory services | 87 | ||||||||
| Other accrued expenses | 82 | ||||||||
| Total liabilities | 4,533 | ||||||||
| Net assets at October 31, 2012: | $ | 292,293 | |||||||
| Net assets consist of: | |||||||||
| Capital paid in on shares of beneficial interest | $ | 277,956 | |||||||
| Distributions in excess of net investment income | (1) | ||||||||
| Accumulated net realized loss | (76) | ||||||||
| Net unrealized appreciation | 14,414 | ||||||||
| Net assets at October 31, 2012 | $ | 292,293 | |||||||
| Shares outstanding: | 27,481 | ||||||||
| Net asset value per share: | $ | 10.64 | |||||||
| Capital Short-Term Municipal Fund | ||||||||||
| Statement of assets and liabilities | ||||||||||
| at October 31, 2012 | (dollars and shares in thousands) (except per share amounts) | |||||||||
| Assets: | ||||||||||
| Investment securities, at value (cost: $115,126) | $ | 118,267 | ||||||||
| Short-term investments, at value (cost: $5,650) | 5,650 | |||||||||
| Cash | 39 | |||||||||
| Receivables for: | ||||||||||
| Sales of investments | – | |||||||||
| Sales of fund's shares | – | |||||||||
| Interest | 1,403 | |||||||||
| Reimbursement from investment adviser | 7 | |||||||||
| 1,410 | ||||||||||
| Total assets | 125,366 | |||||||||
| Liabilities: | ||||||||||
| Payables for: | ||||||||||
| Purchases of investments | 1,188 | |||||||||
| Repurchases of fund's shares | 36 | |||||||||
| Dividend on fund shares | 32 | |||||||||
| Investment advisory services | 37 | |||||||||
| Other accrued expenses | 65 | |||||||||
| Total liabilities | 1,358 | |||||||||
| Net assets at October 31, 2012: | $ | 124,008 | ||||||||
| Net assets consist of: | ||||||||||
| Capital paid in on shares of beneficial interest | $ | 120,378 | ||||||||
| Distributions in excess of net investment income | (–) | 1 | ||||||||
| Accumulated net realized gain | 489 | |||||||||
| Net unrealized appreciation | 3,141 | |||||||||
| Net assets at October 31, 2012 | $ | 124,008 | ||||||||
| Shares outstanding: | 12,022 | |||||||||
| Net asset value per share: | $ | 10.32 | ||||||||
| 1 | Amount rounds to less than $1,000. | |||||||||
| Capital California Core Municipal Fund | ||||||||||
| Statement of assets and liabilities | ||||||||||
| at October 31, 2012 | (dollars and shares in thousands) (except per share amounts) | |||||||||
| Assets: | ||||||||||
| Investment securities, at value (cost: $178,969) | $ | 187,688 | ||||||||
| Short-term investments, at value (cost: $20,770) | 20,770 | |||||||||
| Cash | 75 | |||||||||
| Receivables for: | ||||||||||
| Sales of investments | – | |||||||||
| Sales of fund's shares | 185 | |||||||||
| Interest | 2,135 | |||||||||
| Reimbursement from investment adviser | 4 | |||||||||
| 2,324 | ||||||||||
| Total assets | 210,857 | |||||||||
| Liabilities: | ||||||||||
| Payables for: | ||||||||||
| Purchases of investments | 1,557 | |||||||||
| Repurchases of fund's shares | 1,125 | |||||||||
| Dividend on fund shares | 137 | |||||||||
| Investment advisory services | 61 | |||||||||
| Other accrued expenses | 64 | |||||||||
| Total liabilities | 2,944 | |||||||||
| Net assets at October 31, 2012: | $ | 207,913 | ||||||||
| Net assets consist of: | ||||||||||
| Capital paid in on shares of beneficial interest | $ | 198,334 | ||||||||
| Distributions in excess of net investment income | (–) | 1 | ||||||||
| Accumulated net realized gain | 860 | |||||||||
| Net unrealized appreciation | 8,719 | |||||||||
| Net assets at October 31, 2012 | $ | 207,913 | ||||||||
| Shares outstanding: | 19,527 | |||||||||
| Net asset value per share: | $ | 10.65 | ||||||||
| 1 | Amount rounds to less than $1,000. | |||||||||
| Capital California Short-Term Municipal Fund | ||||||||||
| Statement of assets and liabilities | ||||||||||
| at October 31, 2012 | (dollars and shares in thousands) (except per share amounts) | |||||||||
| Assets: | ||||||||||
| Investment securities, at value (cost: $75,790) | $ | 77,776 | ||||||||
| Short-term investments, at value (cost: $29,493) | 29,493 | |||||||||
| Cash | 57 | |||||||||
| Receivables for: | ||||||||||
| Sales of investments | – | |||||||||
| Sales of fund's shares | 253 | |||||||||
| Interest | 877 | |||||||||
| Reimbursement from investment adviser | 5 | |||||||||
| 1,135 | ||||||||||
| Total assets | 108,461 | |||||||||
| Liabilities: | ||||||||||
| Payables for: | ||||||||||
| Purchases of investments | 588 | |||||||||
| Repurchases of fund's shares | 338 | |||||||||
| Dividend on fund shares | 10 | |||||||||
| Investment advisory services | 32 | |||||||||
| Other accrued expenses | 57 | |||||||||
| Total liabilities | 1,025 | |||||||||
| Net assets at October 31, 2012: | $ | 107,436 | ||||||||
| Net assets consist of: | ||||||||||
| Capital paid in on shares of beneficial interest | $ | 105,393 | ||||||||
| Distributions in excess of net investment income | (–) | 1 | ||||||||
| Accumulated net realized gain | 57 | |||||||||
| Net unrealized appreciation | 1,986 | |||||||||
| Net assets at October 31, 2012 | $ | 107,436 | ||||||||
| Shares outstanding: | 10,408 | |||||||||
| Net asset value per share: | $ | 10.32 | ||||||||
| 1 | Amount rounds to less than $1,000. | |||||||||
| Capital Core Bond Fund | |||||||||
| Statement of assets and liabilities | |||||||||
| at October 31, 2012 | (dollars and shares in thousands) (except per share amounts) | ||||||||
| Assets: | |||||||||
| Investment securities, at value (cost: $280,121) | $ | 290,398 | |||||||
| Short-term investments, at value (cost: $41,797) | 41,797 | ||||||||
| Cash | 98 | ||||||||
| Receivables for: | |||||||||
| Sales of investments | 16,407 | ||||||||
| Sales of fund's shares | – | ||||||||
| Interest | 1,682 | ||||||||
| Reimbursement from investment adviser | 5 | ||||||||
| 18,094 | |||||||||
| Total assets | 350,387 | ||||||||
| Liabilities: | |||||||||
| Payables for: | |||||||||
| Purchases of investments | 53,082 | ||||||||
| Repurchases of fund's shares | 585 | ||||||||
| Dividend on fund shares | 83 | ||||||||
| Investment advisory services | 93 | ||||||||
| Other accrued expenses | 82 | ||||||||
| Total liabilities | 53,925 | ||||||||
| Net assets at October 31, 2012: | $ | 296,462 | |||||||
| Net assets consist of: | |||||||||
| Capital paid in on shares of beneficial interest | $ | 281,698 | |||||||
| Accumulated undistributed net investment income | 10 | ||||||||
| Accumulated net realized gain | 4,477 | ||||||||
| Net unrealized appreciation | 10,277 | ||||||||
| Net assets at October 31, 2012 | $ | 296,462 | |||||||
| Shares outstanding: | 27,921 | ||||||||
| Net asset value per share: | $ | 10.62 | |||||||
| Capital Global Equity Fund | |||||||||
| Statement of assets and liabilities | |||||||||
| at October 31, 2012 | (dollars and shares in thousands) (except per share amounts) | ||||||||
| Assets: | |||||||||
| Investment securities, at value (cost: $182,334) | $ | 197,965 | |||||||
| Cash | – | ||||||||
| Receivables for: | |||||||||
| Sales of investments | 13,260 | ||||||||
| Sales of fund's shares | 470 | ||||||||
| Dividends | 431 | ||||||||
| Reimbursement from investment adviser | 1 | ||||||||
| 14,162 | |||||||||
| Total assets | 212,127 | ||||||||
| Liabilities: | |||||||||
| Payables for: | |||||||||
| Purchases of investments | – | ||||||||
| Repurchases of fund's shares | 214 | ||||||||
| Due to custodian | 6,839 | ||||||||
| Unified fees | 161 | ||||||||
| Other accrued expenses | 1 | ||||||||
| Total liabilities | 7,215 | ||||||||
| Net assets at October 31, 2012: | $ | 204,912 | |||||||
| Net assets consist of: | |||||||||
| Capital paid in on shares of beneficial interest | $ | 195,263 | |||||||
| Accumulated undistributed net investment income | 2,363 | ||||||||
| Accumulated net realized loss | (8,344) | ||||||||
| Net unrealized appreciation | 15,630 | ||||||||
| Net assets at October 31, 2012 | $ | 204,912 | |||||||
| Shares outstanding: | 20,519 | ||||||||
| Net asset value per share: | $ | 9.99 | |||||||
| Capital Non-U.S. Equity Fund | |||||||||
| Statement of assets and liabilities | |||||||||
| at October 31, 2012 | (dollars and shares in thousands) (except per share amounts) | ||||||||
| Assets: | |||||||||
| Investment securities, at value (cost: $222,928) | $ | 231,846 | |||||||
| Short-term investments, at value (cost: $24,702) | 24,702 | ||||||||
| Cash | 56 | ||||||||
| Receivables for: | |||||||||
| Sales of investments | 12 | ||||||||
| Sales of fund's shares | 2,470 | ||||||||
| Dividends | 333 | ||||||||
| Reimbursement from investment adviser | 1 | ||||||||
| 2,816 | |||||||||
| Total assets | 259,420 | ||||||||
| Liabilities: | |||||||||
| Payables for: | |||||||||
| Purchases of investments | 2,875 | ||||||||
| Repurchases of fund's shares | 185 | ||||||||
| Unified fees | 174 | ||||||||
| Other accrued expenses | 1 | ||||||||
| Total liabilities | 3,235 | ||||||||
| Net assets at October 31, 2012: | $ | 256,185 | |||||||
| Net assets consist of: | |||||||||
| Capital paid in on shares of beneficial interest | $ | 250,674 | |||||||
| Accumulated undistributed net investment income | 1,403 | ||||||||
| Accumulated net realized loss | (4,803) | ||||||||
| Net unrealized appreciation | 8,911 | ||||||||
| Net assets at October 31, 2012 | $ | 256,185 | |||||||
| Shares outstanding: | 26,297 | ||||||||
| Net asset value per share: | $ | 9.74 | |||||||
| Capital U.S. Equity Fund | |||||||||
| Statement of assets and liabilities | |||||||||
| at October 31, 2012 | (dollars and shares in thousands) (except per share amounts) | ||||||||
| Assets: | |||||||||
| Investment securities, at value (cost: $85,208) | $ | 95,078 | |||||||
| Short-term investments, at value (cost: $7,599) | 7,599 | ||||||||
| Cash | 35 | ||||||||
| Receivables for: | |||||||||
| Sales of investments | – | ||||||||
| Sales of fund's shares | 121 | ||||||||
| Dividends | 284 | ||||||||
| Reimbursement from investment adviser | 1 | ||||||||
| 406 | |||||||||
| Total assets | 103,118 | ||||||||
| Liabilities: | |||||||||
| Payables for: | |||||||||
| Purchases of investments | – | ||||||||
| Repurchases of fund's shares | 285 | ||||||||
| Unified fees | 56 | ||||||||
| Other accrued expenses | 1 | ||||||||
| Total liabilities | 342 | ||||||||
| Net assets at October 31, 2012: | $ | 102,776 | |||||||
| Net assets consist of: | |||||||||
| Capital paid in on shares of beneficial interest | $ | 92,987 | |||||||
| Accumulated undistributed net investment income | 253 | ||||||||
| Accumulated net realized loss | (334) | ||||||||
| Net unrealized appreciation | 9,870 | ||||||||
| Net assets at October 31, 2012 | $ | 102,776 | |||||||
| Shares outstanding: | 6,968 | ||||||||
| Net asset value per share: | $ | 14.75 | |||||||
| Capital Core Municipal Fund | |||||||||
| Statement of operations | |||||||||
| for the year ended October 31, 2012 | (dollars in thousands) | ||||||||
| Investment income: | |||||||||
| Income: | |||||||||
| Interest | $ | 6,816 | |||||||
| Fees and expenses: | |||||||||
| Investment advisory services | 1,002 | ||||||||
| Administrative and accounting services | 85 | ||||||||
| Registration fees | 38 | ||||||||
| Audit and tax fees | 40 | ||||||||
| Transfer agent services | 15 | ||||||||
| Trustees' compensation | 11 | ||||||||
| Other | 10 | ||||||||
| Total fees and expenses | 1,201 | ||||||||
| Reimbursement of fees | (56) | ||||||||
| Net fees and expenses | 1,145 | ||||||||
| Net investment income | 5,671 | ||||||||
| Net realized gain and unrealized appreciation on investments: | |||||||||
| Net realized gain on investments | 539 | ||||||||
| Net unrealized appreciation on investments | 8,690 | ||||||||
| Net realized gain and unrealized appreciation on investments | 9,229 | ||||||||
| Net increase in net assets resulting from operations | $ | 14,900 | |||||||
| Capital Short-Term Municipal Fund | |||||||||
| Statement of operations | |||||||||
| for the year ended October 31, 2012 | (dollars in thousands) | ||||||||
| Investment income: | |||||||||
| Income: | |||||||||
| Interest | $ | 2,350 | |||||||
| Fees and expenses: | |||||||||
| Investment advisory services | 478 | ||||||||
| Administrative and accounting services | 41 | ||||||||
| Registration fees | 34 | ||||||||
| Audit and tax fees | 40 | ||||||||
| Transfer agent services | 14 | ||||||||
| Trustees' compensation | 11 | ||||||||
| Other | 8 | ||||||||
| Total fees and expenses | 626 | ||||||||
| Reimbursement of fees | (79) | ||||||||
| Net fees and expenses | 547 | ||||||||
| Net investment income | 1,803 | ||||||||
| Net realized gain and unrealized appreciation on investments: | |||||||||
| Net realized gain on investments | 503 | ||||||||
| Net unrealized appreciation on investments | 1,282 | ||||||||
| Net realized gain and unrealized appreciation on investments | 1,785 | ||||||||
| Net increase in net assets resulting from operations | $ | 3,588 | |||||||
| Capital California Core Municipal Fund | |||||||||
| Statement of operations | |||||||||
| for the year ended October 31, 2012 | (dollars in thousands) | ||||||||
| Investment income: | |||||||||
| Income: | |||||||||
| Interest | $ | 4,447 | |||||||
| Fees and expenses: | |||||||||
| Investment advisory services | 650 | ||||||||
| Administrative and accounting services | 55 | ||||||||
| Registration fees | 9 | ||||||||
| Audit and tax fees | 40 | ||||||||
| Transfer agent services | 14 | ||||||||
| Trustees' compensation | 11 | ||||||||
| Other | 8 | ||||||||
| Total fees and expenses | 787 | ||||||||
| Reimbursement of fees | (44) | ||||||||
| Net fees and expenses | 743 | ||||||||
| Net investment income | 3,704 | ||||||||
| Net realized gain and unrealized appreciation on investments: | |||||||||
| Net realized gain on investments | 860 | ||||||||
| Net unrealized appreciation on investments | 5,779 | ||||||||
| Net realized gain and unrealized appreciation on investments | 6,639 | ||||||||
| Net increase in net assets resulting from operations | $ | 10,343 | |||||||
| Capital California Short-Term Municipal Fund | |||||||||
| Statement of operations | |||||||||
| for the year ended October 31, 2012 | (dollars in thousands) | ||||||||
| Investment income: | |||||||||
| Income: | |||||||||
| Interest | $ | 1,239 | |||||||
| Fees and expenses: | |||||||||
| Investment advisory services | 330 | ||||||||
| Administrative and accounting services | 28 | ||||||||
| Registration fees | 10 | ||||||||
| Audit and tax fees | 40 | ||||||||
| Transfer agent services | 14 | ||||||||
| Trustees' compensation | 11 | ||||||||
| Other | 6 | ||||||||
| Total fees and expenses | 439 | ||||||||
| Reimbursement of fees | (62) | ||||||||
| Net fees and expenses | 377 | ||||||||
| Net investment income | 862 | ||||||||
| Net realized gain and unrealized appreciation on investments: | |||||||||
| Net realized gain on investments | 57 | ||||||||
| Net unrealized appreciation on investments | 1,469 | ||||||||
| Net realized gain and unrealized appreciation on investments | 1,526 | ||||||||
| Net increase in net assets resulting from operations | $ | 2,388 | |||||||
| Capital Core Bond Fund | |||||||||
| Statement of operations | |||||||||
| for the year ended October 31, 2012 | (dollars in thousands) | ||||||||
| Investment income: | |||||||||
| Income: | |||||||||
| Interest | $ | 6,039 | |||||||
| Fees and expenses: | |||||||||
| Investment advisory services | 1,043 | ||||||||
| Administrative and accounting services | 89 | ||||||||
| Registration fees | 39 | ||||||||
| Audit and tax fees | 40 | ||||||||
| Transfer agent services | 14 | ||||||||
| Trustees' compensation | 11 | ||||||||
| Other | 11 | ||||||||
| Total fees and expenses | 1,247 | ||||||||
| Reimbursement of fees | (55) | ||||||||
| Net fees and expenses | 1,192 | ||||||||
| Net investment income | 4,847 | ||||||||
| Net realized gain and unrealized appreciation on investments: | |||||||||
| Net realized gain on investments | 4,490 | ||||||||
| Net unrealized appreciation on investments | 2,072 | ||||||||
| Net realized gain and unrealized appreciation on investments | 6,562 | ||||||||
| Net increase in net assets resulting from operations | $ | 11,409 | |||||||
| Capital Global Equity Fund | ||||||||||
| Statement of operations | ||||||||||
| for the year ended October 31, 2012 | (dollars in thousands) | |||||||||
| Investment income: | ||||||||||
| Income: | ||||||||||
| Dividends (net of non-U.S. taxes of $205) | $ | 4,029 | ||||||||
| Interest | 13 | 4,042 | ||||||||
| Fees and expenses: | ||||||||||
| Unified fees | 1,483 | |||||||||
| Trustees' compensation | 11 | |||||||||
| Legal fees | 3 | |||||||||
| Other | - | 1 | ||||||||
| Total fees and expenses | 1,497 | |||||||||
| Reimbursement of fees | (15) | |||||||||
| Net fees and expenses | 1,482 | |||||||||
| Net investment income | 2,560 | |||||||||
| Net realized loss and unrealized appreciation on investments and currency: | ||||||||||
| Net realized loss on investments | (5,246) | |||||||||
| Net realized loss on currency | (25) | |||||||||
| Net unrealized appreciation on investments | 18,242 | |||||||||
| Net unrealized appreciation on currency translations | - | 1 | ||||||||
| Net realized loss and unrealized appreciation on investments and currency | 12,971 | |||||||||
| Net increase in net assets resulting from operations | $ | 15,531 | ||||||||
| 1 | Amount rounds to less than $1,000. | |||||||||
| Capital Non-U.S. Equity Fund | ||||||||||
| Statement of operations | ||||||||||
| for the year ended October 31, 2012 | (dollars in thousands) | |||||||||
| Investment income: | ||||||||||
| Income: | ||||||||||
| Dividends (net of non-U.S. taxes of $181) | $ | 2,241 | ||||||||
| Interest | 13 | 2,254 | ||||||||
| Fees and expenses: | ||||||||||
| Unified fees | 859 | |||||||||
| Trustees' compensation | 11 | |||||||||
| Legal fees | 3 | |||||||||
| Other | - | 1 | ||||||||
| Total fees and expenses | 873 | |||||||||
| Reimbursement of fees | (15) | |||||||||
| Net fees and expenses | 858 | |||||||||
| Net investment income | 1,396 | |||||||||
| Net realized gain (loss) and unrealized appreciation (depreciation) on investments and currency: | ||||||||||
| Net realized loss on investments | (2,995) | |||||||||
| Net realized gain on currency | 62 | |||||||||
| Net unrealized appreciation on investments | 11,882 | |||||||||
| Net unrealized depreciation on currency translations | (5) | |||||||||
| Net realized loss and unrealized appreciation on investments and currency | 8,944 | |||||||||
| Net increase in net assets resulting from operations | $ | 10,340 | ||||||||
| 1 | Amount rounds to less than $1,000. | |||||||||
| Capital U.S. Equity Fund | ||||||||||
| Statement of operations | ||||||||||
| for the year ended October 31, 2012 | (dollars in thousands) | |||||||||
| Investment income: | ||||||||||
| Income: | ||||||||||
| Dividends (net of non-U.S. taxes of $24) | $ | 1,813 | ||||||||
| Interest | 6 | 1,819 | ||||||||
| Fees and expenses: | ||||||||||
| Unified fees | 545 | |||||||||
| Trustees' compensation | 11 | |||||||||
| Legal fees | 3 | |||||||||
| Other | - | 1 | ||||||||
| Total fees and expenses | 559 | |||||||||
| Reimbursement of fees | (15) | |||||||||
| Net fees and expenses | 544 | |||||||||
| Net investment income | 1,275 | |||||||||
| Net realized loss and unrealized appreciation on investments and currency: | ||||||||||
| Net realized loss on investments | (227) | |||||||||
| Net realized loss on currency | (-) | 1 | ||||||||
| Net unrealized appreciation on investments | 6,945 | |||||||||
| Net realized loss and unrealized appreciation on investments and currency | 6,718 | |||||||||
| Net increase in net assets resulting from operations | $ | 7,993 | ||||||||
| 1 | Amount rounds to less than $1,000. | |||||||||
| Capital Core Municipal Fund | ||||||||
| Statements of changes in net assets | ||||||||
| (dollars in thousands) | ||||||||
| For the year ended 10/31/12 | For the year ended 10/31/11 | |||||||
| Operations: | ||||||||
| Net investment income | $ | 5,671 | $ | 5,210 | ||||
| Net realized gain (loss) on investments | 539 | (615) | ||||||
| Net unrealized appreciation on investments | 8,690 | 557 | ||||||
| Net increase in net assets resulting from operations | 14,900 | 5,152 | ||||||
| Dividends and distributions to shareholders: | ||||||||
| Dividends from net investment income | (5,673) | (5,209) | ||||||
| Distributions from capital gain | – | (576) | ||||||
| Total dividends and distributions | (5,673) | (5,785) | ||||||
| Net capital share transactions | 33,520 | (18,523) | ||||||
| Total increase (decrease) in net assets | 42,747 | (19,156) | ||||||
| Net assets: | ||||||||
| Beginning of year | 249,546 | 268,702 | ||||||
| End of year (including distributions in excess of and undistributed net investment income: $(1) and $1, respectively.) | $ | 292,293 | $ | 249,546 | ||||
| Capital Short-Term Municipal Fund | |||||||||
| Statements of changes in net assets | |||||||||
| (dollars in thousands) | |||||||||
| For the year ended 10/31/12 | For the year ended 10/31/11 | ||||||||
| Operations: | |||||||||
| Net investment income | $ | 1,803 | $ | 1,312 | |||||
| Net realized gain (loss) on investments | 503 | (13) | |||||||
| Net unrealized appreciation on investments | 1,282 | 778 | |||||||
| Net increase in net assets resulting from operations | 3,588 | 2,077 | |||||||
| Dividends and distributions to shareholders: | |||||||||
| Dividends from net investment income | (1,803) | (1,315) | |||||||
| Distributions from capital gain | – | (100) | |||||||
| Total dividends and distributions | (1,803) | (1,415) | |||||||
| Net capital share transactions | (15,741) | 47,805 | |||||||
| Total increase (decrease) in net assets | (13,956) | 48,467 | |||||||
| Net assets: | |||||||||
| Beginning of year | 137,964 | 89,497 | |||||||
| End of year (including distributions in excess of and undistributed net investment income: $(-)1 and $-1, respectively.) | $ | 124,008 | $ | 137,964 | |||||
| 1 | Amount rounds to less than $1,000. | ||||||||
| Capital California Core Municipal Fund | |||||||||
| Statements of changes in net assets | |||||||||
| (dollars in thousands) | |||||||||
| For the year ended 10/31/12 | For the year ended 10/31/11 | ||||||||
| Operations: | |||||||||
| Net investment income | $ | 3,704 | $ | 2,971 | |||||
| Net realized gain on investments | 860 | 33 | |||||||
| Net unrealized appreciation on investments | 5,779 | 424 | |||||||
| Net increase in net assets resulting from operations | 10,343 | 3,428 | |||||||
| Dividends and distributions to shareholders: | |||||||||
| Dividends from net investment income | (3,705) | (2,970) | |||||||
| Distributions from capital gain | (32) | (1) | |||||||
| Total dividends and distributions | (3,737) | (2,971) | |||||||
| Net capital share transactions | 43,512 | (11,204) | |||||||
| Total increase (decrease) in net assets | 50,118 | (10,747) | |||||||
| Net assets: | |||||||||
| Beginning of year | 157,795 | 168,542 | |||||||
| End of year (including distributions in excess of and undistributed net investment income: $(-)1 and $1, respectively.) | $ | 207,913 | $ | 157,795 | |||||
| 1 | Amount rounds to less than $1,000. | ||||||||
| Capital California Short-Term Municipal Fund | |||||||||
| Statements of changes in net assets | |||||||||
| (dollars in thousands) | |||||||||
| For the year ended 10/31/12 | For the year ended 10/31/11 | ||||||||
| Operations: | |||||||||
| Net investment income | $ | 862 | $ | 510 | |||||
| Net realized gain on investments | 57 | 38 | |||||||
| Net unrealized appreciation on investments | 1,469 | 84 | |||||||
| Net increase in net assets resulting from operations | 2,388 | 632 | |||||||
| Dividends and distributions to shareholders: | |||||||||
| Dividends from net investment income | (862) | (510) | |||||||
| Distributions from capital gain | (29) | – | |||||||
| Total dividends and distributions | (891) | (510) | |||||||
| Net capital share transactions | 29,412 | 25,740 | |||||||
| Total increase in net assets | 30,909 | 25,862 | |||||||
| Net assets: | |||||||||
| Beginning of year | 76,527 | 50,665 | |||||||
| End of year (including distributions in excess of and undistributed net investment income: $(-)1 and $-, respectively.) | $ | 107,436 | $ | 76,527 | |||||
| 1 | Amount rounds to less than $1,000. | ||||||||
| Capital Core Bond Fund | ||||||||
| Statements of changes in net assets | ||||||||
| (dollars in thousands) | ||||||||
| For the year ended 10/31/12 | For the year ended 10/31/11 | |||||||
| Operations: | ||||||||
| Net investment income | $ | 4,847 | $ | 4,659 | ||||
| Net realized gain on investments | 4,490 | 741 | ||||||
| Net unrealized appreciation on investments | 2,072 | 2,314 | ||||||
| Net increase in net assets resulting from operations | 11,409 | 7,714 | ||||||
| Dividends and distributions to shareholders: | ||||||||
| Dividends from net investment income | (4,838) | (5,055) | ||||||
| Distributions from capital gain | (357) | (2,947) | ||||||
| Total dividends and distributions | (5,195) | (8,002) | ||||||
| Net capital share transactions | 10,209 | 50,142 | ||||||
| Total increase in net assets | 16,423 | 49,854 | ||||||
| Net assets: | ||||||||
| Beginning of year | 280,039 | 230,185 | ||||||
| End of year (including undistributed net investment income: $10 and $-, respectively.) | $ | 296,462 | $ | 280,039 | ||||
| Capital Global Equity Fund | |||||||||
| Statements of changes in net assets | |||||||||
| (dollars in thousands) | |||||||||
| For the year ended 10/31/12 | For the year ended 10/31/111 | ||||||||
| Operations: | |||||||||
| Net investment income | $ | 2,560 | $ | 422 | |||||
| Net realized loss on investments and currency | (5,271) | (3,141) | |||||||
| Net unrealized appreciation (depreciation) on investments and currency | 18,242 | (2,612) | |||||||
| Net increase (decrease) in net assets resulting from operations | 15,531 | (5,331) | |||||||
| Dividends and distributions to shareholders: | |||||||||
| Dividends from net investment income | (551) | – | |||||||
| Distributions from capital gain | – | – | |||||||
| Total dividends and distributions | (551) | – | |||||||
| Net capital share transactions | 64,461 | 130,802 | |||||||
| Total increase in net assets | 79,441 | 125,471 | |||||||
| Net assets: | |||||||||
| Beginning of year | 125,471 | – | |||||||
| End of year (including undistributed net investment income: $2,363 and $396, respectively.) | $ | 204,912 | $ | 125,471 | |||||
| 1 | The Fund commenced operations on April 1, 2011. | ||||||||
| Capital Non-U.S. Equity Fund | |||||||||
| Statements of changes in net assets | |||||||||
| (dollars in thousands) | |||||||||
| For the year ended 10/31/12 | For the year ended 10/31/111 | ||||||||
| Operations: | |||||||||
| Net investment income | $ | 1,396 | $ | 302 | |||||
| Net realized loss on investments and currency | (2,933) | (1,875) | |||||||
| Net unrealized appreciation (depreciation) on investments and currency | 11,877 | (2,966) | |||||||
| Net increase (decrease) in net assets resulting from operations | 10,340 | (4,539) | |||||||
| Dividends and distributions to shareholders: | |||||||||
| Dividends from net investment income | (290) | – | |||||||
| Distributions from capital gain | – | – | |||||||
| Total dividends and distributions | (290) | – | |||||||
| Net capital share transactions | 196,120 | 54,554 | |||||||
| Total increase in net assets | 206,170 | 50,015 | |||||||
| Net assets: | |||||||||
| Beginning of year | 50,015 | – | |||||||
| End of year (including undistributed net investment income: $1,403 and $234, respectively.) | $ | 256,185 | $ | 50,015 | |||||
| 1 | The Fund commenced operations on April 1, 2011. | ||||||||
| Capital U.S. Equity Fund | |||||||||
| Statements of changes in net assets | |||||||||
| (dollars in thousands) | |||||||||
| For the year ended 10/31/12 | For the year ended 10/31/111 | ||||||||
| Operations: | |||||||||
| Net investment income | $ | 1,275 | $ | 522 | |||||
| Net realized gain (loss) on investments and currency | (227) | 9,587 | |||||||
| Net unrealized appreciation (depreciation) on investments | 6,945 | (15,313) | |||||||
| Net increase (decrease) in net assets resulting from operations | 7,993 | (5,204) | |||||||
| Dividends and distributions to shareholders: | |||||||||
| Dividends from net investment income | (1,038) | (485) | |||||||
| Distributions from capital gain | (3,822) | – | |||||||
| Total dividends and distributions | (4,860) | (485) | |||||||
| Net capital share transactions | 25,514 | (5,991) | |||||||
| Total increase (decrease) in net assets | 28,647 | (11,680) | |||||||
| Net assets: | |||||||||
| Beginning of year | 74,129 | 85,809 | |||||||
| End of year (including undistributed net investment income: $253 and $39, respectively.) | $ | 102,776 | $ | 74,129 | |||||
| 1 | Endowments - Growth and Income Portfolio (the "Predecessor Fund") was reorganized into the Capital U.S. Equity Fund at the close of business effective April 1, 2011. In connection with the reorganization, the Predecessor Fund transferred all of its assets and liabilities to the Capital U.S. Equity Fund and the fund changed its fiscal year-end from July to October. | ||||||||
1. Organization
Capital Private Client Services Funds (the “Trust”) was organized on October 22, 2009 as a Delaware statutory trust. The Trust is registered under the Investment Company Act of 1940 as an open-end, diversified management investment company. The Trust has five fixed income funds (Capital Core Municipal Fund, Capital Short-Term Municipal Fund, Capital California Core Municipal Fund, Capital California Short-Term Municipal Fund and Capital Core Bond Fund) and three equity funds (Capital Global Equity Fund, Capital Non-U.S. Equity Fund and Capital U.S. Equity Fund) (each a “Fund,” collectively the “Funds”). On April 1, 2011, Capital Global Equity Fund and Capital Non-U.S. Equity Fund each obtained its initial capitalization of $25,000,000 from the sale of shares of beneficial interest to Capital Guardian Trust Company. The Trust’s fiscal year ends on October 31. Each Fund offers one class of shares.
Endowments-Growth and Income Portfolio (the “Predecessor Fund”), was reorganized into the Capital U.S. Equity Fund, effective at the close of business April 1, 2011, pursuant to an Agreement and Plan of Reorganization, dated March 25, 2011, and approved by the shareholders of the Predecessor Fund. The Predecessor Fund transferred all of its assets and liabilities to the Capital U.S. Equity Fund. In connection with the reorganization, the fiscal year end and tax year end of the Predecessor Fund was changed from July 31 to October 31 to conform with the other series of the Trust.
Capital Core Municipal Fund seeks to provide current income exempt from federal income tax and to preserve capital. Capital Short-Term Municipal Fund seeks to preserve capital and secondarily to provide current income exempt from federal income tax. Capital California Core Municipal Fund seeks to provide current income exempt from federal and California income taxes and to preserve capital. Capital California Short-Term Municipal Fund seeks to preserve capital and secondarily to provide current income exempt from federal and California income taxes. Capital Core Bond Fund seeks to provide current income and to preserve capital. Capital Global Equity Fund and Capital Non-U.S. Equity Fund seek to preserve capital while providing growth and Capital U.S. Equity Fund also seeks to preserve capital while providing growth and secondarily seeks to provide income.
2. Significant accounting policies
The financial statements have been prepared to comply with accounting principles generally accepted in the United States of America. These principles require management to make estimates and assumptions that affect reported amounts and disclosures. Actual results could differ from those estimates. The Funds follow the significant accounting policies described below, as well as the valuation policies described in the next section on valuation.
Security transactions and related investment income – Security transactions are recorded by the Funds as of the date the trades are executed with brokers. Realized gains and losses from security transactions are determined based on the specific identified cost of the securities. In the event a security is purchased with a delayed payment date, the Funds will segregate liquid assets sufficient to meet their payment obligations. Dividend income is recognized on the ex-dividend date and interest income is recognized on an accrual basis. Market discounts, premiums and original issue discounts on fixed-income securities are amortized daily over the expected life of the security.
Dividends and distributions to shareholders – Dividend and distributions paid to shareholders are recorded on the ex-dividend date.
Currency translation – Assets and liabilities, including investment securities, denominated in currencies other than U.S. dollars are translated into U.S. dollars at the exchange rates supplied by one or more pricing vendors on the valuation date. Purchases and sales of investment securities and income and expenses are translated into U.S. dollars at the exchange rates on the dates of such transactions. On the accompanying financial statements, the effects of changes in exchange rates on investment securities are included with the net realized gain or loss and net unrealized appreciation or depreciation on investments. The realized gain or loss and unrealized appreciation or depreciation resulting from all other transactions denominated in currencies other than U.S. dollars are disclosed separately.
3. Valuation
Capital Guardian Trust Company “CGTC”, the fund’s investment adviser, values the Funds’ investments at fair value as defined by accounting principles generally accepted in the United States of America. The net asset value of each Fund is generally determined as of approximately 4:00 p.m. New York time each day the New York Stock Exchange is open. Security transactions are recorded by the funds as of the date the trades are executed with brokers. Assets and liabilities, including investment securities, denominated in currencies other than U.S. dollars are translated into U.S. dollars at the exchange rates in effect on the valuation date.
Methods and inputs – The Funds’ investment adviser uses the following methods and inputs to establish the fair value of their assets and liabilities. Use of particular methods and inputs may vary over time based on availability and relevance as market and economic conditions evolve.
Equity securities are generally valued at the official closing price of, or the last reported sale price on, the exchange or market on which such securities are traded, as of the close of business on the day the securities are being valued or, lacking any sales, at the last available bid price. Prices for each security are taken from the principal exchange or market in which the security trades.
Fixed-income securities, including short-term securities purchased with more than 60 days left to maturity, are generally valued at prices obtained from one or more pricing vendors. Vendors value such securities based on one or more of the inputs described in the following table. The table provides examples of inputs that are commonly relevant for valuing particular classes of fixed-income securities in which the Funds are authorized to invest. However, these classifications are not exclusive and any of the inputs may be used to value any other class of fixed-income security.
| Fixed-income class | Examples of standard inputs |
| All | Benchmark yields, transactions, bids, offers, quotations from dealers and trading systems, new issues, spreads and other relationships observed in the markets among comparable securities; and proprietary pricing models such as yield measures calculated using factors such as cash flows, financial or collateral performance and other reference data (collectively referred to as “standard inputs”) |
| Corporate bonds & notes; convertible securities | Standard inputs and underlying equity of the issuer |
| Bonds & notes of governments & government agencies | Standard inputs and interest rate volatilities |
| Mortgage-backed obligations; asset-backed obligations | Standard inputs and cash flows, prepayment information, default rates, delinquency and loss assumptions, collateral characteristics, credit enhancements and specific deal information |
| Municipal securities | Standard inputs and, for certain distressed securities, cash flows or liquidation values using a net present value calculation based on inputs that include, but are not limited to, financial statements and debt contracts |
When the investment adviser deems it appropriate to do so (such as when vendor prices are unavailable or not deemed to be representative), fixed-income securities will be valued in good faith at the mean quoted bid and asked prices that are reasonably and timely available (or bid prices, if asked prices are not available) or at prices for securities of comparable maturity, quality and type. Some securities may be valued based on their effective maturity or average life, which may be shorter than the stated maturity.
Securities with both fixed-income and equity characteristics, or equity securities traded principally among fixed-income dealers, are generally valued in the manner described above for either equity or fixed-income securities, depending on which method is deemed most appropriate by the investment adviser. Short-term securities purchased within 60 days to maturity are valued at amortized cost, which approximates fair value. The value of short-term securities originally purchased with maturities greater than 60 days is determined based on an amortized value to par when they reach 60 days.
Securities and other assets for which representative market quotations are not readily available or are considered unreliable by the investment adviser are fair valued as determined in good faith under guidelines adopted by authority of the Funds’ Board of Trustees as further described below. The investment adviser follows fair valuation guidelines, consistent with U.S. Securities and Exchange Commission (“SEC”) rules and guidance, to consider relevant principles and factors when making fair value determinations. The investment adviser considers relevant indications of value that are reasonably and timely available to it in determining the fair value to be assigned to a particular security, such as, the type and cost of the security; contractual or legal restrictions on resale of the security; relevant financial or business developments of the issuer; actively traded similar or related securities; conversion or exchange rights on the security; related corporate actions; significant events occurring after the close of trading in the security; and changes in overall market conditions. Fair valuations and valuations of investments that are not actively trading involve judgment and may differ materially from valuations that would have been used had greater market activity occurred.
Processes and structure – The Funds’ Board of Trustees has delegated authority to the Funds’ investment adviser to make fair value determinations, subject to board oversight. The investment adviser has established a Joint Fair Valuation Committee (the “Fair Valuation Committee”) to administer, implement and oversee the fair value process, and to make fair value decisions. The Fair Valuation Committee regularly reviews its own fair value decisions, as well as decisions made under its standing instructions to the investment adviser’s valuation teams. The Fair Valuation Committee reviews changes in fair value measurements from period to period and may, as deemed appropriate, update the fair valuation guidelines to better reflect the results of back testing and address new or evolving issues. The Fair Valuation Committee reports any changes to the fair valuation guidelines to the Board of Trustees with supplemental information to support the changes. The Funds’ board and audit committee also regularly review reports that describe fair value determinations and methods.
The fund’s investment adviser has also established a Fixed-Income Pricing Review Group to administer and oversee the fixed-income valuation process, including the use of fixed-income pricing vendors. This group regularly reviews pricing vendor information and market data. Pricing decisions, processes, and controls over security valuation are also subject to internal reviews including an annual control self-evaluation program facilitated by the investment adviser’s compliance group.
Classifications – The Funds’ investment adviser classifies the Funds’ assets and liabilities into three levels based on the inputs used to value the assets or liabilities. Level 1 values are based on quoted prices in active markets for identical securities. Level 2 values are based on significant observable market inputs, such as quoted prices for similar securities and quoted prices in inactive markets. Certain securities trading outside the U.S. may transfer between Level 1 and Level 2 due to valuation adjustments resulting from significant market movements following the close of local trading. Level 3 values are based on significant unobservable inputs that reflect the investment adviser’s determinations of assumptions that market participants might reasonably use in valuing the securities. The valuation levels are not necessarily an indication of the risk or liquidity associated with the underlying investment. For example, U.S. government securities are reflected as Level 2 because the inputs used to determine fair value may not always be quoted prices in an active market. The following table presents the Funds’ valuation levels as of October 31, 2012 (dollars in thousands):
| Investment Securities | Level 1 | Level 2 | Level 3 | Total | ||||||||||||||||||||||||||||||
| Capital Core Municipal Fund | ||||||||||||||||||||||||||||||||||
| Long-term investments | ||||||||||||||||||||||||||||||||||
| Bonds & notes | $ | – | $ | 285,876 | $ | – | $ | 285,876 | ||||||||||||||||||||||||||
| Short-term investments | – | 7,355 | – | 7,355 | ||||||||||||||||||||||||||||||
| Total Investments | $ | – | $ | 293,231 | $ | – | $ | 293,231 | ||||||||||||||||||||||||||
Capital Short-Term Municipal Fund | ||||||||||||||||||||||||||||||||||
| Long-term investments | ||||||||||||||||||||||||||||||||||
| Bonds & notes | $ | – | $ | 118,267 | $ | – | $ | 118,267 | ||||||||||||||||||||||||||
| Short-term investments | – | 5,650 | – | 5,650 | ||||||||||||||||||||||||||||||
| Total Investments | $ | – | $ | 123,917 | $ | – | $ | 123,917 | ||||||||||||||||||||||||||
| Capital California Core Municipal Fund | ||||||||||||||||||||||||||||||||||
| Long-term investments | ||||||||||||||||||||||||||||||||||
| Bonds & notes | $ | – | $ | 187,688 | $ | – | $ | 187,688 | ||||||||||||||||||||||||||
| Short-term investments | – | 20,770 | – | 20,770 | ||||||||||||||||||||||||||||||
| Total Investments | $ | – | $ | 208,458 | $ | – | $ | 208,458 | ||||||||||||||||||||||||||
| Capital California Short-Term Municipal Fund | ||||||||||||||||||||||||||||||||||
| Long-term investments | ||||||||||||||||||||||||||||||||||
| Bonds & notes | $ | – | $ | 77,776 | $ | – | $ | 77,776 | ||||||||||||||||||||||||||
| Short-term investments | – | 29,493 | – | 29,493 | ||||||||||||||||||||||||||||||
| Total Investments | $ | – | $ | 107,269 | $ | – | $ | 107,269 | ||||||||||||||||||||||||||
| Capital Core Bond Fund | ||||||||||||||||||||||||||||||||||
Bonds, notes and other debt investments: | ||||||||||||||||||||||||||||||||||
U.S. government & government agency bonds & notes |
$ |
– |
$ |
135,840 |
$ |
– |
$ |
135,840 | ||||||||||||||||||||||||||
| Mortgage-backed obligations | – | 76,947 | – | 76,947 | ||||||||||||||||||||||||||||||
| Corporate bonds & notes | – | 73,635 | – | 73,635 | ||||||||||||||||||||||||||||||
| Municipals | – | 3,487 | – | 3,487 | ||||||||||||||||||||||||||||||
Government agency bonds & notes outside the U.S. |
– | 167 |
– | 167 | ||||||||||||||||||||||||||||||
| Asset-backed obligations | – | 322 | – | 322 | ||||||||||||||||||||||||||||||
| Short-term investments | – | 41,797 | – | 41,797 | ||||||||||||||||||||||||||||||
| Total investments | $ | – | $ | 332,195 | $ | – | $ | 332,195 | ||||||||||||||||||||||||||
Capital Global Equity Fund | ||||||||||||||||||||||||||||||||||
| Common Stocks1 | $ | 197,965 | $ | – | $ | – | $ | 197,965 | ||||||||||||||||||||||||||
| Total investments | $ | 197,965 | $ | – | $ | – | $ | 197,965 | ||||||||||||||||||||||||||
| Investment Securities | Level 1 | Level 2 | Level 3 | Total | ||||||||||||||||||
| Capital Non-U.S. Equity Fund | ||||||||||||||||||||||
| Common Stocks1 | $ | 231,846 | $ | – | $ | – | $ | 231,846 | ||||||||||||||
| Short-term investments | – | 24,702 | – | 24,702 | ||||||||||||||||||
| Total investments | $ | 231,846 | $ | 24,702 | $ | – | $ | 256,548 | ||||||||||||||
| Capital U.S. Equity Fund | ||||||||||||||||||||||
| Common Stocks1 | $ | 95,078 | $ | – | $ | – | $ | 95,078 | ||||||||||||||
| Short-term investments | – | 7,599 | – | 7,599 | ||||||||||||||||||
| Total investments | $ | 95,078 | $ | 7,599 | $ | – | $ | 102,677 | ||||||||||||||
1 The level classification by major category of investments is the same as the category presentation in the Schedule of Investments.
At October 31, 2012, securities with a market value of $75,987,000, which represented 37.08% of the net assets of Capital Global Equity Fund and securities with a market value of $194,809,000, which represented 76.04% of the net assets of Capital Non-U.S. Equity Fund, transferred from Level 2 to Level 1 since the prior fiscal year-end, primarily due to a lack of significant market movements following the close of local trading. There were no Level 3 securities held in the Funds during the year ended October 31, 2012.
4. Risk factors
Investing in the Funds may involve certain risks including, but not limited to, those described below.
Market conditions – The prices of, and the income generated by, the securities held by the Funds may decline due to market conditions and other factors, including those directly involving the issuers of securities held by the Funds.
Investing in bonds – Rising interest rates will generally cause the prices of bonds and other debt securities to fall. Longer maturity debt securities may be subject to greater price fluctuations than shorter maturity debt securities. In addition, falling interest rates may cause an issuer to redeem, call or refinance a security before its stated maturity, which may result in the Funds having to reinvest the proceeds in lower yielding securities.
Bonds and other debt securities are subject to credit risk, which is the possibility that the credit strength of an issuer will weaken and/or an issuer of a debt security will fail to make timely payments of principal or interest and the security will go into default. Credit risk is gauged, in part, by the credit ratings of the securities in which the fund invests. However, ratings are only the opinions of the rating agencies issuing them and are not guarantees as to credit quality or an evaluation of market risk.
Investing in lower rated bonds – Lower rated bonds and other lower rated debt securities generally have higher rates of interest and involve greater risk of default or price declines due to changes in the issuer’s creditworthiness than those of higher quality debt securities. The market prices of these securities may fluctuate more than the prices of higher quality debt securities and may decline significantly in periods of general economic difficulty.
Thinly traded securities – There may be little trading in the secondary market for particular bonds or other debt securities, which may make them more difficult to value, acquire or sell.
Investing in similar municipal bonds – Investing significantly in municipal obligations of issuers in the same state or backed by revenues of similar types of projects or industries may make the Funds more susceptible to certain economic, political or regulatory occurrences. As a result, the potential for fluctuations in a Fund’s share price may increase.
Management – The investment adviser to the Funds actively manages the Funds’ investments. Consequently, the Funds are subject to the risk that the methods and analyses employed by the investment adviser in this process may not produce the desired results. This could cause the Funds to lose value or their investment results to lag relevant benchmarks or other funds with similar objectives.
Investing in municipal bonds of issuers within the state of California – Because the Capital California Core Municipal Fund and Capital California Short-Term Municipal Fund invest in securities of issuers within the state of California, these funds are more susceptible to factors adversely affecting issuers of California securities than comparable municipal bond mutual funds that do not concentrate their investments in a single state. For example, in the past, California voters have passed amendments to the state’s constitution and other measures that limit the taxing and spending authority of California governmental entities, and future voter initiatives may adversely affect California municipal bonds.
Investing in securities backed by the U.S. government – Securities backed by the U.S. Treasury or the full faith and credit of the U.S. government are guaranteed only as to the timely payment of interest and principal when held to maturity. Accordingly, the current market values for these securities will fluctuate with changes in interest rates. Securities issued by government-sponsored entities and federal agencies and instrumentalities that are not backed by the full faith and credit of the U.S. government are neither issued nor guaranteed by the U.S. government.
Investing in mortgage related securities – Many types of bonds and other debt securities, including mortgage-backed securities, are subject to prepayment risk, as well as the risks associated with investing in debt securities in general. If interest rates fall and the loans underlying these securities are prepaid faster than expected, the Funds may have to reinvest the prepaid principal in lower yielding securities, thus reducing the Funds’ income. Conversely, if interest rates increase and the loans underlying the securities are prepaid more slowly than expected, the expected duration of the securities may be extended, reducing the cash flow for potential investment in higher yielding securities.
Investing in growth-oriented stocks – Growth-oriented stocks may involve larger price swings and greater potential for loss than other types of investments.
Investing outside the United States – Securities of issuers domiciled outside the United States, or with significant operations outside the United States, may lose value because of adverse political, social, economic or market developments in the countries or regions in which the issuer operates. These securities may also lose value due to changes in foreign currency exchange rates against the U.S. dollar and/or currencies of other countries. Securities markets in certain countries may be more volatile and/or less liquid than those in the United States. Investments outside the United States may also be subject to different settlement and accounting practices and different regulatory, legal and reporting standards, and may be more difficult to value, than those in the United States. The risks of investing outside the United States may be heightened in connection with investments in emerging markets.
Investing in income-oriented stocks – Income provided by the Funds may be reduced by changes in the dividend policies of, and the capital resources available at, the companies in which the Funds invest.
5. Taxation and distributions
Federal income taxation –The Funds comply with the requirements under Subchapter M of the Internal Revenue Code applicable to mutual funds and intend to distribute substantially all of their net income and net capital gains each year. The Funds are not subject to income taxes to the extent taxable income and net capital gains are distributed. Generally, income earned by Capital Core Municipal Fund, Capital Short-Term Municipal Fund, Capital California Core Municipal Fund and Capital California Short-Term Municipal Fund is exempt from federal income taxes; however, these funds may earn taxable income from certain investments.
As of and during the year ended October 31, 2012, the Funds did not have a liability for any unrecognized tax benefits. The Funds recognize interest and penalties, if any, related to unrecognized tax benefits as income tax expense in the statement of operations. During the year, the Funds did not incur any interest or penalties.
Non-U.S. Taxation – Dividend and interest income are recorded net of non-U.S. taxes paid. Gains realized by the Funds on the sale of securities in certain countries are subject to non-U.S. taxes. The Funds record a liability based on unrealized gains to provide for potential non-U.S. taxes payable upon the sale of these securities.
Distributions –Distributions paid to shareholders are based on net investment income and net realized gains determined on a tax basis, which may differ from net investment income and net realized gains for financial reporting
purposes. These differences are due primarily to different treatment for items such as currency gains and losses; short-term capital gains and losses; capital losses related to sales of certain securities within 30 days of purchase; unrealized appreciation of certain investments in securities outside the U.S.; net capital losses; cost of investments sold; and amortization of market discounts. The fiscal year in which amounts are distributed may differ from the year in which the net investment income and net realized gains are recorded by the Funds for financial reporting purposes.
The tax character of distributions paid during the year ended October 31, 2012 and the period ended October 31, 2011, the most recently completed tax year, were as follows (dollars in thousands):
| Tax-Exempt | Ordinary Income | Long-Term Capital Gains | ||||
| 2012 | 2011 | 2012 | 2011 | 2012 | 2011 | |
| Capital Core Municipal Fund | $ 5,671 | $5,206 | $ 2 | $579 | $ – | $ – |
| Capital Short-Term Municipal Fund | 1,803 | 1,315 | –1 | 100 | – | – |
| Capital California Core Municipal Fund | 3,701 | 2,969 | 4 | 3 | 32 | – |
| Capital California Short-Term Municipal Fund | 862 | 510 | 28 | -1 | 1 | – |
| Capital Core Bond Fund | – | – | 4,983 | 8,002 | 212 | – |
| Capital Global Equity Fund* | – | – | 551 | – | – | – |
| Capital Non-U.S. Equity Fund* | – | – | 290 | – | – | – |
| Capital U.S. Equity Fund* | – | – | 1,038 | 485 | 3,823 | – |
*Commencement of operations was 4/1/11.
1 Rounds to less than $1,000.
At October 31, 2012, the components of accumulated earnings (deficit) on a tax basis were as follows (dollars in thousands):
| Tax-Exempt | Undistributed ordinary income | Undistributed Long-Term Capital Gains | Other Temporary Differences | Capital Loss Carryover | Unrealized appreciation | Total | |
| Capital Core Municipal Fund | $ 210 | $ – | $ – | $ (210) | $ (77) | $ 14,414 | $14,337 |
| Capital Short-Term Municipal Fund | 32 | 3 | 486 | (32) | – | 3,141 | 3,630 |
| Capital California Core Municipal Fund | 136 | 20 | 840 | (136) | – | 8,719 | 9,579 |
| Capital California Short-Term Municipal Fund | 10 | – | 57 | (10) | – | 1,986 | 2,043 |
| Capital Core Bond Fund | – | 2,488 | 2,092 | (82) | – | 10,266 | 14,764 |
| Capital Global Equity Fund | – | 2,362 | – | – | (6,763) | 14,050 | 9,649 |
| Capital Non-U.S. Equity Fund | – | 1,414 | – | – | (4,222) | 8,319 | 5,511 |
| Capital U.S. Equity Fund | – | 253 | 54 | – | – | 9,482 | 9,789 |
Capital loss carryovers available to the Funds at October 31, 2012 were as follows (dollars in thousands):
| Expiring 2019 | Unlimited Long-Term | Unlimited Short-Term | |
| Capital Core Municipal Fund1 | $ 77 | $ – | $ – |
| Capital Short-Term Municipal Fund2 | – | – | – |
| Capital California Core Municipal Fund | – | – | – |
| Capital California Short-Term Municipal Fund | – | – | – |
| Capital Core Bond Fund | – | – | – |
| Capital Global Equity Fund | – | 1,048 | 5,715 |
| Capital Non-U.S. Equity Fund | – | 758 | 3,464 |
| Capital U.S. Equity Fund | – | – | – |
1 During the year ended October 31, 2012, a capital loss carryforward of $539 was utilized to offset net realized gains by the Fund. 2 During the year ended October 31, 2012, a capital loss carryforward of $14 was utilized to offset net realized gains by the Fund. | |||
For federal income tax purposes, the tax cost of investments and the components of net unrealized appreciation (depreciation) of investments at October 31, 2012 were as follows (dollars in thousands):
| Tax cost of investments | Gross unrealized appreciation | Gross unrealized depreciation | Net unrealized appreciation | |
| Capital Core Municipal Fund | $ 278,817 | $ 14,422 | $ (8) | $14,414 |
| Capital Short-Term Municipal Fund | 120,776 | 3,149 | (8) | 3,141 |
| Capital California Core Municipal Fund | 199,739 | 8,723 | (4) | 8,719 |
| Capital California Short-Term Municipal Fund | 105,283 | 1,986 | –1 | 1,986 |
| Capital Core Bond Fund | 321,929 | 10,370 | (104) | 10,266 |
| Capital Global Equity Fund | 183,914 | 17,686 | (3,635) | 14,051 |
| Capital Non-U.S. Equity Fund | 248,212 | 12,779 | (4,442) | 8,337 |
| Capital U.S. Equity Fund | 93,195 | 11,217 | (1,735) | 9,482 |
1 Rounds to less than $1,000.
Under the Regulated Investment Company Modernization Act of 2010 (the “Act”), net capital losses recognized after December 22, 2010, may be carried forward indefinitely, and their character is retained as short-term and/or long-term losses. Previously, net capital losses were carried forward for eight years and treated as short-term losses. As a transition rule, the Act requires that post-enactment net capital losses be used before pre-enactment net capital losses.
6. Fees and transactions with related parties
Capital Guardian Trust Company (“CGTC”) serves as investment adviser to the Funds and other funds. CGTC is a wholly owned subsidiary of Capital Group International, Inc. Expense limitations have been imposed through December 31, 2012, to limit the Funds’ total annual fund operating expenses to the following rates (as a percentage of average daily net assets):
| Fund | Expense Limitation |
| Capital Core Municipal Fund | 0.40% |
| Capital Short-Term Municipal Fund | 0.40% |
| Capital California Core Municipal Fund | 0.40% |
| Capital California Short-Term Municipal Fund | 0.40% |
| Capital Core Bond Fund | 0.40% |
| Capital Global Equity Fund | 0.85% |
| Capital Non-U.S. Equity Fund | 0.85% |
| Capital U.S. Equity Fund | 0.65% |
CGTC does not intend to recoup any reimbursed expenses or waived fees from a prior year under expense limitations then in effect for the Funds.
Investment advisory services – The Investment Advisory and Service Agreement with CGTC provides for monthly fees accrued daily. The fee for each Fixed Income Fund is 0.35% of the average daily net assets of the Fund.
For the services it provides to Capital Global Equity Fund, Capital Non-U.S. Equity Fund and Capital U.S. Equity Fund, CGTC receives a unified management fee based on a percentage of the daily net assets of shares of the funds. The unified management fee for the U.S. Equity Fund is 0.65% of the average daily net assets of the Fund. The unified management fee for the Capital Global Equity Fund and Capital Non-U.S. Equity Fund is 0.85% of the average daily net assets of each Fund.
For the equity funds, CGTC pays all expenses of managing and operating the funds out of the unified management fees except brokerage expenses, taxes, interest fees and expenses of the independent trustees (including legal counsel fees) and extraordinary expenses, such as litigation expenses. These expenses which are not paid by CGTC from the unified management fee are paid by the funds. A portion of the funds' management fee is paid by CGTC to unaffiliated third parties which provide recordkeeping and administrative services.
Distribution services – American Funds Distributors,® Inc. (the "Distributor") is the principal underwriter of each Fund's shares. The Distributor does not receive any compensation related to the sale of shares of the Funds.
Affiliated officers and trustees – Officers and certain trustees of the Trust are or may be considered to be affiliated with CGTC. No affiliated officers or directors received any compensation directly from the Trust.
7. Capital share transactions
Capital share transactions in the Funds were as follows (dollars and shares in thousands):
| Sales | Reinvestment of dividends and distributions | Repurchases | Net increase/decrease | |||||
| Fund | Amount | Shares | Amount | Shares | Amount | Shares | Amount | Shares |
| Year ended October 31, 2012 | ||||||||
| Capital Core Municipal Fund | $ 80,318 | 7,647 | $ 3,229 | 306 | $ (50,027) | (4,732) | $ 33,520 | 3,221 |
| Capital Short-Term Municipal Fund | 60,368 | 5,876 | 1,452 | 141 | (77,561) | (7,536) | (15,741) | (1,519) |
| Capital California Core Municipal Fund | 65,225 | 6,195 | 2,134 | 203 | (23,847) | (2,262) | 43,512 | 4,136 |
| Capital California Short-Term Municipal Fund | 96,806 | 9,407 | 741 | 72 | (68,135) | (6,630) | 29,412 | 2,849 |
| Capital Core Bond Fund | 63,332 | 6,037 | 3,376 | 322 | (56,499) | (5,369) | 10,209 | 990 |
| Capital Global Equity Fund | 129,539 | 13,702 | 343 | 38 | (65,421) | (6,886) | 64,461 | 6,854 |
| Capital Non-U.S. Equity Fund | 216,260 | 22,929 | 239 | 28 | (20,379) | (2,168) | 196,120 | 20,789 |
| Capital U.S. Equity Fund | 58,062 | 4,038 | 4,202 | 316 | (36,750) | (2,563) | 25,514 | 1,791 |
| Year ended October 31, 2011 | ||||||||
| Capital Core Municipal Fund | $ 49,386 | 4,861 | $ 3,067 | 303 | $ (70,976) | (7,057) | $ (18,523) | (1,893) |
| Capital Short-Term Municipal Fund | 97,060 | 9,606 | 1,193 | 118 | (50,448) | (4,982) | 47,805 | 4,742 |
| Capital California Core Municipal Fund | 33,834 | 3,353 | 1,464 | 145 | (46,502) | (4,641) | (11,204) | (1,143) |
| Capital California Short-Term Municipal Fund | 54,808 | 5,440 | 377 | 38 | (29,445) | (2,918) | 25,740 | 2,560 |
| Capital Core Bond Fund | 92,892 | 9,085 | 6,162 | 609 | (48,912) | (4,784) | 50,142 | 4,910 |
| Capital Global Equity Fund* | 133,035 | 13,910 | - | - | (2,233) | (245) | 130,802 | 13,665 |
| Capital Non-U.S. Equity Fund* | 57,057 | 5,776 | - | - | (2,503) | (268) | 54,554 | 5,508 |
| Capital U.S. Equity Fund* | 8,986 | 623 | 389 | 28 | (15,366) | (1,073) | (5,991) | (422) |
| *Commencement of operations was 4/1/11. | ||||||||
Eight months ended March 31, 2011 | ||||||||
| Capital U.S. Equity Fund | $ 5,020 | 347 | $ 909 | 63 | $ (7,790) | (559) | $ (1,861) | (149) |
The Fund’s Declaration of Trust permits the Trustees to issue an unlimited number of full and fractional shares of beneficial interest (without par value).
8. Investment transactions
The Funds made purchases and sales of investment securities, excluding short-term securities and U.S. government obligations, if any, during the year ended October 31, 2012 as follows (dollars in thousands):
| Fund | Cost of Investments Purchased | Proceeds from Investments Sold | ||
U.S. Government Agency Obligations | Other Investments | U.S. Government Agency Obligations | Other Investments | |
| Capital Core Municipal Fund | $ – | $ 82,221 | $ – | $ 35,280 |
| Capital Short-Term Municipal Fund | – | 32,103 | – | 29,007 |
| Capital California Core Municipal Fund | – | 78,854 | – | 35,457 |
| Capital California Short-Term Municipal Fund | – | 33,831 | – | 9,634 |
| Capital Core Bond Fund | 356,911 | 43,173 | 343,708 | 40,973 |
| Capital Global Equity Fund | – | 125,538 | – | 56,595 |
| Capital Non-U.S. Equity Fund | – | 191,157 | – | 15,917 |
| Capital U.S. Equity Fund | – | 58,053 | – | 41,872 |
9. Fund Merger
On April 01, 2011, the Capital U.S. Equity Fund acquired all of the assets and assumed all of the liabilities of Endowments - Growth and Income Portfolio (the "Predecessor Fund") pursuant to a plan of reorganization approved by the Board of Trustees on January 31, 2011. The acquisition was accomplished by a tax-free exchange as follows:
5,599,076 shares of the Predecessor Fund, valued at $86,205,437 were outstanding on the close of business on April 01, 2011. Capital U.S. Equity Fund began with a $10.00 seed investment. After the reorganization Capital U.S. Equity Fund had 5,599,076 shares valued at $86,205,447.
The investment portfolio and cash of the Predecessor Fund, with a value of $86,205,437 and identified cost of $57,353,020 were the principal assets acquired by the Capital U.S. Equity Fund. For financial reporting purposes, assets received and shares issued by the Capital U.S. Equity Fund were recorded at fair value; however, the cost basis of the investments received from the Predecessor Fund was carried forward to align ongoing reporting of the Capital U.S. Equity Fund's realized and unrealized gains and losses with amounts distributable to shareholders for tax purposes. Immediately prior to the merger, the net assets of the Predecessor Fund were $86,205,437.
Because the combined investment portfolios have been managed as a single integrated portfolio since the merger was completed, it is not practicable to separate the amounts of revenue and earnings of the Predecessor Fund that have been reflected in the statement of operations since April 01, 2011 for the Capital U.S. Equity Fund.
| Before Reorganization | After Reorganization | |||||
| Endowments - Growth and Income Portfolio | Capital U.S Equity Fund | Capital U.S. Equity Fund | ||||
| Net Assets | $ | 86,205,437 | $ | 10 | $ | 86,205,447 |
| Shares Outstanding | 5,599,076 | – | 5,599,076 | |||
| Net Asset Value per Share | $ | 15.40 | $ | – | $ | 15.40 |
| Net unrealized appreciation/(depreciation) | 18,636,603 | – | 18,636,603 | |||
| Accumulated net realized gain/(loss) | (5,895,126) | – | (5,895,126) | |||
| Capital Core Municipal Fund | ||||||||||||||||||||||
| Financial highlights1 | ||||||||||||||||||||||
| (for a share outstanding throughout each year) | ||||||||||||||||||||||
| For the year ended | ||||||||||||||||||||||
| 10/31/12 | 10/31/11 | 10/31/102 | ||||||||||||||||||||
| Selected per share data: | ||||||||||||||||||||||
| Net asset value, beginning of year | $ | 10.29 | $ | 10.27 | $ | 10.00 | ||||||||||||||||
| Income from investment operations: | ||||||||||||||||||||||
| Net investment income3 | 0.21 | 0.21 | 0.10 | |||||||||||||||||||
| Net realized and unrealized gains on securities | 0.35 | 0.04 | 0.26 | |||||||||||||||||||
| Total from investment operations | 0.56 | 0.25 | 0.36 | |||||||||||||||||||
| Dividends and distributions: | ||||||||||||||||||||||
| Dividends from net investment income | (0.21) | (0.21) | (0.09) | |||||||||||||||||||
| Distributions from capital gain | — | (0.02) | — | 4 | ||||||||||||||||||
| Total dividends and distributions | (0.21) | (0.23) | (0.09) | |||||||||||||||||||
| Net asset value, end of year | $ | 10.64 | $ | 10.29 | $ | 10.27 | ||||||||||||||||
| Total Return5 | 5.46% | 2.56% | 3.63% | |||||||||||||||||||
| Net assets, end of year (in millions) | $ | 292 | $ | 250 | $ | 269 | ||||||||||||||||
| Ratios / Supplemental Data: | ||||||||||||||||||||||
| Ratio of expenses to average net assets before reimbursement | 0.42% | 0.42% | 0.43% | 6 | ||||||||||||||||||
| Ratio of expenses to average net assets after reimbursement5 | 0.40% | 0.40% | 0.40% | 6 | ||||||||||||||||||
| Ratio of net investment income to average net assets5 | 1.98% | 2.10% | 1.81% | 6 | ||||||||||||||||||
| Portfolio turnover rate | 13% | 19% | 25% | 7 | ||||||||||||||||||
| 1 | Based on operations for the period shown (unless otherwise noted) and, accordingly, may not be representative of a full year. | |||||||||||||||||||||
| 2 | The Fund commenced operations on April 13, 2010. | |||||||||||||||||||||
| 3 | Based on average shares outstanding. | |||||||||||||||||||||
| 4 | Rounds to less than $0.00. | |||||||||||||||||||||
| 5 | Reflects the impact of certain reimbursements by Capital Guardian Trust Company. | |||||||||||||||||||||
| 6 | Annualized. | |||||||||||||||||||||
| 7 | Not annualized for periods less than one year. | |||||||||||||||||||||
| Capital Short-Term Municipal Fund | ||||||||||||||||||||||
| Financial highlights1 | ||||||||||||||||||||||
| (for a share outstanding throughout each year) | ||||||||||||||||||||||
| For the year ended | ||||||||||||||||||||||
| 10/31/12 | 10/31/11 | 10/31/102 | ||||||||||||||||||||
| Selected per share data: | ||||||||||||||||||||||
| Net asset value, beginning of year | $ | 10.19 | $ | 10.17 | $ | 10.00 | ||||||||||||||||
| Income from investment operations: | ||||||||||||||||||||||
| Net investment income3 | 0.14 | 0.11 | 0.05 | |||||||||||||||||||
| Net realized and unrealized gains on securities | 0.13 | 0.02 | 0.17 | |||||||||||||||||||
| Total from investment operations | 0.27 | 0.13 | 0.22 | |||||||||||||||||||
| Dividends and distributions: | ||||||||||||||||||||||
| Dividends from net investment income | (0.14) | (0.10) | (0.05) | |||||||||||||||||||
| Distributions from capital gain | — | (0.01) | — | 4 | ||||||||||||||||||
| Total dividends and distributions | (0.14) | (0.11) | (0.05) | |||||||||||||||||||
| Net asset value, end of year | $ | 10.32 | $ | 10.19 | $ | 10.17 | ||||||||||||||||
| Total Return5 | 2.63% | 1.33% | 2.17% | |||||||||||||||||||
| Net assets, end of year (in millions) | $ | 124 | $ | 138 | $ | 89 | ||||||||||||||||
| Ratios / Supplemental Data: | ||||||||||||||||||||||
| Ratio of expenses to average net assets before reimbursement | 0.46% | 0.46% | 0.48% | 6 | ||||||||||||||||||
| Ratio of expenses to average net assets after reimbursement5 | 0.40% | 0.40% | 0.40% | 6 | ||||||||||||||||||
| Ratio of net investment income to average net assets5 | 1.32% | 1.04% | 0.94% | 6 | ||||||||||||||||||
| Portfolio turnover rate | 25% | 15% | 36% | 7 | ||||||||||||||||||
| 1 | Based on operations for the period shown (unless otherwise noted) and, accordingly, may not be representative of a full year. | |||||||||||||||||||||
| 2 | The Fund commenced operations on April 13, 2010. | |||||||||||||||||||||
| 3 | Based on average shares outstanding. | |||||||||||||||||||||
| 4 | Rounds to less than $0.00. | |||||||||||||||||||||
| 5 | Reflects the impact of certain reimbursements by Capital Guardian Trust Company. | |||||||||||||||||||||
| 6 | Annualized. | |||||||||||||||||||||
| 7 | Not annualized for periods less than one year. | |||||||||||||||||||||
| Capital California Core Municipal Fund | |||||||||||||||||||||||
| Financial highlights1 | |||||||||||||||||||||||
| (for a share outstanding throughout each year) | |||||||||||||||||||||||
| For the year ended | |||||||||||||||||||||||
| 10/31/12 | 10/31/11 | 10/31/102 | |||||||||||||||||||||
| Selected per share data: | |||||||||||||||||||||||
| Net asset value, beginning of year | $ | 10.25 | $ | 10.19 | $ | 10.00 | |||||||||||||||||
| Income from investment operations: | |||||||||||||||||||||||
| Net investment income3 | 0.21 | 0.20 | 0.08 | ||||||||||||||||||||
| Net realized and unrealized gains on securities | 0.40 | 0.06 | 0.18 | ||||||||||||||||||||
| Total from investment operations | 0.61 | 0.26 | 0.26 | ||||||||||||||||||||
| Dividends and distributions: | |||||||||||||||||||||||
| Dividends from net investment income | (0.21) | (0.20) | (0.07) | ||||||||||||||||||||
| Distributions from capital gain | — | 4 | — | 4 | — | 4 | |||||||||||||||||
| Total dividends and distributions | (0.21) | (0.20) | (0.07) | ||||||||||||||||||||
| Net asset value, end of year | $ | 10.65 | $ | 10.25 | $ | 10.19 | |||||||||||||||||
| Total Return5 | 5.99% | 2.61% | 2.61% | ||||||||||||||||||||
| Net assets, end of year (in millions) | $ | 208 | $ | 158 | $ | 169 | |||||||||||||||||
| Ratios / Supplemental Data: | |||||||||||||||||||||||
| Ratio of expenses to average net assets before reimbursement | 0.42% | 0.42% | 0.45% | 6 | |||||||||||||||||||
| Ratio of expenses to average net assets after reimbursement5 | 0.40% | 0.40% | 0.40% | 6 | |||||||||||||||||||
| Ratio of net investment income to average net assets5 | 1.99% | 1.98% | 1.41% | 6 | |||||||||||||||||||
| Portfolio turnover rate | 21% | 24% | 13% | 7 | |||||||||||||||||||
| 1 | Based on operations for the period shown (unless otherwise noted) and, accordingly, may not be representative of a full year. | ||||||||||||||||||||||
| 2 | The Fund commenced operations on April 13, 2010. | ||||||||||||||||||||||
| 3 | Based on average shares outstanding. | ||||||||||||||||||||||
| 4 | Rounds to less than $0.00. | ||||||||||||||||||||||
| 5 | Reflects the impact of certain reimbursements by Capital Guardian Trust Company. | ||||||||||||||||||||||
| 6 | Annualized. | ||||||||||||||||||||||
| 7 | Not annualized for periods less than one year. | ||||||||||||||||||||||
| Capital California Short-Term Municipal Fund | |||||||||||||||||||||||
| Financial highlights1 | |||||||||||||||||||||||
| (for a share outstanding throughout each year) | |||||||||||||||||||||||
| For the year ended | |||||||||||||||||||||||
| 10/31/12 | 10/31/11 | 10/31/102 | |||||||||||||||||||||
| Selected per share data: | |||||||||||||||||||||||
| Net asset value, beginning of year | $ | 10.12 | $ | 10.13 | $ | 10.00 | |||||||||||||||||
| Income from investment operations: | |||||||||||||||||||||||
| Net investment income3 | 0.09 | 0.08 | 0.04 | ||||||||||||||||||||
| Net realized and unrealized gains (losses) on securities | 0.20 | (0.01) | 0.13 | ||||||||||||||||||||
| Total from investment operations | 0.29 | 0.07 | 0.17 | ||||||||||||||||||||
| Dividends and distributions: | |||||||||||||||||||||||
| Dividends from net investment income | (0.09) | (0.08) | (0.04) | ||||||||||||||||||||
| Distributions from capital gain | — | 4 | — | — | |||||||||||||||||||
| Total dividends and distributions | (0.09) | (0.08) | (0.04) | ||||||||||||||||||||
| Net asset value, end of year | $ | 10.32 | $ | 10.12 | $ | 10.13 | |||||||||||||||||
| Total Return5 | 2.96% | 0.72% | 1.67% | ||||||||||||||||||||
| Net assets, end of year (in millions) | $ | 107 | $ | 77 | $ | 51 | |||||||||||||||||
| Ratios / Supplemental Data: | |||||||||||||||||||||||
| Ratio of expenses to average net assets before reimbursement | 0.47% | 0.49% | 0.55% | 6 | |||||||||||||||||||
| Ratio of expenses to average net assets after reimbursement5 | 0.40% | 0.40% | 0.40% | 6 | |||||||||||||||||||
| Ratio of net investment income to average net assets5 | 0.92% | 0.83% | 0.79% | 6 | |||||||||||||||||||
| Portfolio turnover rate | 14% | 20% | 35% | 7 | |||||||||||||||||||
| 1 | Based on operations for the period shown (unless otherwise noted) and, accordingly, may not be representative of a full year. | ||||||||||||||||||||||
| 2 | The Fund commenced operations on April 13, 2010. | ||||||||||||||||||||||
| 3 | Based on average shares outstanding. | ||||||||||||||||||||||
| 4 | Rounds to less than $0.00. | ||||||||||||||||||||||
| 5 | Reflects the impact of certain reimbursements by Capital Guardian Trust Company. | ||||||||||||||||||||||
| 6 | Annualized. | ||||||||||||||||||||||
| 7 | Not annualized for periods less than one year. | ||||||||||||||||||||||
| Capital Core Bond Fund | |||||||||||||||||||||||
| Financial highlights1 | |||||||||||||||||||||||
| (for a share outstanding throughout each year) | |||||||||||||||||||||||
| For the year ended | |||||||||||||||||||||||
| 10/31/12 | 10/31/11 | 10/31/102 | |||||||||||||||||||||
| Selected per share data: | |||||||||||||||||||||||
| Net asset value, beginning of year | $ | 10.40 | $ | 10.45 | $ | 10.00 | |||||||||||||||||
| Income from investment operations: | |||||||||||||||||||||||
| Net investment income3 | 0.17 | 0.19 | 0.09 | ||||||||||||||||||||
| Net realized and unrealized gains on securities | 0.23 | 0.09 | 0.46 | ||||||||||||||||||||
| Total from investment operations | 0.40 | 0.28 | 0.55 | ||||||||||||||||||||
| Dividends and distributions: | |||||||||||||||||||||||
| Dividends from net investment income | (0.17) | (0.20) | (0.09) | ||||||||||||||||||||
| Distributions from capital gain | (0.01) | (0.13) | (0.01) | ||||||||||||||||||||
| Total dividends and distributions | (0.18) | (0.33) | (0.10) | ||||||||||||||||||||
| Net asset value, end of year | $ | 10.62 | $ | 10.40 | $ | 10.45 | |||||||||||||||||
| Total Return4 | 3.92% | 2.80% | 5.52% | ||||||||||||||||||||
| Net assets, end of year (in millions) | $ | 296 | $ | 280 | $ | 230 | |||||||||||||||||
| Ratios / Supplemental Data: | |||||||||||||||||||||||
| Ratio of expenses to average net assets before reimbursement | 0.42% | 0.42% | 0.44% | 5 | |||||||||||||||||||
| Ratio of expenses to average net assets after reimbursement4 | 0.40% | 0.40% | 0.40% | 5 | |||||||||||||||||||
| Ratio of net investment income to average net assets4 | 1.63% | 1.82% | 1.65% | 5 | |||||||||||||||||||
| Portfolio turnover rate | 134% | 118% | 123% | 6 | |||||||||||||||||||
| 1 | Based on operations for the period shown (unless otherwise noted) and, accordingly, may not be representative of a full year. | ||||||||||||||||||||||
| 2 | The Fund commenced operations on April 13, 2010. | ||||||||||||||||||||||
| 3 | Based on average shares outstanding. | ||||||||||||||||||||||
| 4 | Reflects the impact of certain reimbursements by Capital Guardian Trust Company. | ||||||||||||||||||||||
| 5 | Annualized. | ||||||||||||||||||||||
| 6 | Not annualized for periods less than one year. | ||||||||||||||||||||||
| Capital Global Equity Fund | |||||||||||||||||
| Financial highlights1 | |||||||||||||||||
| (for a share outstanding throughout each year) | |||||||||||||||||
| For the year ended | |||||||||||||||||
| 10/31/12 | 10/31/112 | ||||||||||||||||
| Selected per share data: | |||||||||||||||||
| Net asset value, beginning of year | $ | 9.18 | $ | 10.00 | |||||||||||||
| Income from investment operations: | |||||||||||||||||
| Net investment income3 | 0.14 | 0.05 | |||||||||||||||
| Net realized and unrealized gains (losses) on securities and currency | 0.71 | (0.87) | |||||||||||||||
| Total from investment operations | 0.85 | (0.82) | |||||||||||||||
| Dividends and distributions: | |||||||||||||||||
| Dividends from net investment income | (0.04) | — | |||||||||||||||
| Distributions from capital gain | — | — | |||||||||||||||
| Total dividends and distributions | (0.04) | — | |||||||||||||||
| Net asset value, end of year | $ | 9.99 | $ | 9.18 | |||||||||||||
| Total Return4 | 9.19% | (8.20)% | |||||||||||||||
| Net assets, end of year (in millions) | $ | 205 | $ | 125 | |||||||||||||
| Ratios / Supplemental Data: | |||||||||||||||||
| Ratio of expenses to average net assets before reimbursement | 0.86% | 0.87% | 5 | ||||||||||||||
| Ratio of expenses to average net assets after reimbursement4 | 0.85% | 0.85% | 5 | ||||||||||||||
| Ratio of net investment income to average net assets4 | 1.47% | 0.94% | 5 | ||||||||||||||
| Portfolio turnover rate | 35% | 15% | 6 | ||||||||||||||
| 1 | Based on operations for the period shown (unless otherwise noted) and, accordingly, may not be representative of a full year. | ||||||||||||||||
| 2 | The Fund commenced operations on April 1, 2011. | ||||||||||||||||
| 3 | Based on average shares outstanding. | ||||||||||||||||
| 4 | Reflects the impact of certain reimbursements by Capital Guardian Trust Company. | ||||||||||||||||
| 5 | Annualized. | ||||||||||||||||
| 6 | Not annualized for periods less than one year. | ||||||||||||||||
| Capital Non-U.S. Equity Fund | |||||||||||||||||
| Financial highlights1 | |||||||||||||||||
| (for a share outstanding throughout each year) | |||||||||||||||||
| For the year ended | |||||||||||||||||
| 10/31/12 | 10/31/112 | ||||||||||||||||
| Selected per share data: | |||||||||||||||||
| Net asset value, beginning of year | $ | 9.08 | $ | 10.00 | |||||||||||||
| Income from investment operations: | |||||||||||||||||
| Net investment income3 | 0.13 | 0.07 | |||||||||||||||
| Net realized and unrealized gains (losses) on securities and currency | 0.58 | (0.99) | |||||||||||||||
| Total from investment operations | 0.71 | (0.92) | |||||||||||||||
| Dividends and distributions: | |||||||||||||||||
| Dividends from net investment income | (0.05) | — | |||||||||||||||
| Distributions from capital gain | — | — | |||||||||||||||
| Total dividends and distributions | (0.05) | — | |||||||||||||||
| Net asset value, end of year | $ | 9.74 | $ | 9.08 | |||||||||||||
| Total Return4 | 7.91% | (9.20)% | |||||||||||||||
| Net assets, end of year (in millions) | $ | 256 | $ | 50 | |||||||||||||
| Ratios / Supplemental Data: | |||||||||||||||||
| Ratio of expenses to average net assets before reimbursement | 0.86% | 0.89% | 5 | ||||||||||||||
| Ratio of expenses to average net assets after reimbursement4 | 0.85% | 0.85% | 5 | ||||||||||||||
| Ratio of net investment income to average net assets4 | 1.38% | 1.32% | 5 | ||||||||||||||
| Portfolio turnover rate | 17% | 20% | 6 | ||||||||||||||
| 1 | Based on operations for the period shown (unless otherwise noted) and, accordingly, may not be representative of a full year. | ||||||||||||||||
| 2 | The Fund commenced operations on April 1, 2011. | ||||||||||||||||
| 3 | Based on average shares outstanding. | ||||||||||||||||
| 4 | Reflects the impact of certain reimbursements by Capital Guardian Trust Company. | ||||||||||||||||
| 5 | Annualized. | ||||||||||||||||
| 6 | Not annualized for periods less than one year. | ||||||||||||||||
| Capital U.S. Equity Fund | ||||||||||||||||||||||||||||||||||||||||||||||||||||||||
| Financial highlights1 | ||||||||||||||||||||||||||||||||||||||||||||||||||||||||
| (for a share outstanding throughout each year) | ||||||||||||||||||||||||||||||||||||||||||||||||||||||||
| For the year ended | For the eight months ended | For the year ended | ||||||||||||||||||||||||||||||||||||||||||||||||||||||
| 10/31/12 | 10/31/112 | 3/31/11 | 7/31/10 | 7/31/09 | 7/31/08 | |||||||||||||||||||||||||||||||||||||||||||||||||||
| Selected per share data: | ||||||||||||||||||||||||||||||||||||||||||||||||||||||||
| Net asset value, beginning of year | $ 14.32 | $ 15.33 | $ | 13.09 | $ | 11.78 | $ | 14.24 | $ | 16.14 | ||||||||||||||||||||||||||||||||||||||||||||||
| Income from investment operations: | ||||||||||||||||||||||||||||||||||||||||||||||||||||||||
| Net investment income3 | 0.22 | 0.10 | 0.16 | 0.22 | 0.24 | 0.26 | ||||||||||||||||||||||||||||||||||||||||||||||||||
| Net realized and unrealized gains (losses) on securities and currency | 1.20 | (1.02) | 2.28 | 1.30 | (2.44) | (1.48) | ||||||||||||||||||||||||||||||||||||||||||||||||||
| Total from investment operations | 1.42 | (0.92) | 2.44 | 1.52 | (2.20) | (1.22) | ||||||||||||||||||||||||||||||||||||||||||||||||||
| Dividends and distributions: | ||||||||||||||||||||||||||||||||||||||||||||||||||||||||
| Dividends from net investment income | (0.17) | (0.09) | (0.20) | (0.21) | (0.26) | (0.30) | ||||||||||||||||||||||||||||||||||||||||||||||||||
| Distributions from capital gain | (0.82) | — | — | — | — | (0.38) | ||||||||||||||||||||||||||||||||||||||||||||||||||
| Total dividends and distributions | (0.99) | (0.09) | (0.20) | (0.21) | (0.26) | (0.68) | ||||||||||||||||||||||||||||||||||||||||||||||||||
| Net asset value, end of year | $ 14.75 | $ 14.32 | $ | 15.33 | $ | 13.09 | $ | 11.78 | $ | 14.24 | ||||||||||||||||||||||||||||||||||||||||||||||
| Total Return4 | 10.81 | % | (6.42) | % | 18.72 | % | 12.91 | % | (15.29) | % | (7.95) | % | ||||||||||||||||||||||||||||||||||||||||||||
| Net assets, end of year (in millions) | $ 103 | $ 74 | $ | 86 | $ | 75 | $ | 79 | $ | 108 | ||||||||||||||||||||||||||||||||||||||||||||||
| Ratios / Supplemental Data: | ||||||||||||||||||||||||||||||||||||||||||||||||||||||||
| Ratio of expenses to average net assets before reimbursement | 0.67 | % | 0.67 | %5 | 1.04 | %5 | 0.79 | % | 0.74 | % | 0.67 | % | ||||||||||||||||||||||||||||||||||||||||||||
| Ratio of expenses to average net assets after reimbursement4 | 0.65 | % | 0.65 | %5 | 0.75 | %5 | 0.75 | % | 0.71 | % | 0.62 | % | ||||||||||||||||||||||||||||||||||||||||||||
| Ratio of net investment income to average net assets4 | 1.52 | % | 1.13 | %5 | 1.67 | %5 | 1.72 | % | 2.12 | % | 1.67 | % | ||||||||||||||||||||||||||||||||||||||||||||
| Portfolio turnover rate | 53 | % | 82 | %6 | 7 | %6 | 22 | % | 39 | % | 21 | % | ||||||||||||||||||||||||||||||||||||||||||||
| 1 | Based on operations for the period shown (unless otherwise noted) and, accordingly, may not be representative of a full year. | |||||||||||||||||||||||||||||||||||||||||||||||||||||||
| 2 | Endowments – Growth and Income Portfolio was reorganized into the Capital U.S. Equity Fund at the close of business effective April 1, 2011. | |||||||||||||||||||||||||||||||||||||||||||||||||||||||
| 3 | Based on average shares outstanding. | |||||||||||||||||||||||||||||||||||||||||||||||||||||||
| 4 | Reflects the impact, if any, of certain waivers or reimbursements by Capital Guardian Trust Company or Capital Research and Management Company, the previous adviser. | |||||||||||||||||||||||||||||||||||||||||||||||||||||||
| 5 | Annualized. | |||||||||||||||||||||||||||||||||||||||||||||||||||||||
| 6 | Not annualized for periods of less than one year. | |||||||||||||||||||||||||||||||||||||||||||||||||||||||
| Capital Private Client Services Funds | |
REPORT OF INDEPENDENT REGISTERED PUBLIC ACCOUNTING FIRM
To the Board of Trustees and Shareholders of
Capital Private Client Services Funds:
We have audited the accompanying statement of assets and liabilities of Capital Private Client Services Funds (the "Trust") comprising the Capital Core Municipal Fund, Capital Short-Term Municipal Fund, Capital California Core Municipal Fund, Capital California Short-Term Municipal Fund, Capital Core Bond Fund, Capital Global Equity Fund, Capital Non-U.S. Equity Fund, and Capital U.S. Equity Fund, including the schedule of investments, as of October 31, 2012, and the related statements of operations for the year then ended, the statements of changes in net assets for each of the two years in the period then ended (as to Capital Global Equity Fund, Capital Non-U.S. Equity Fund, and Capital U.S. Equity Fund for the year ended October 31, 2012 and for the period April 1, 2011 (commencement of operations) to October 31, 2011), and the financial highlights for each of the periods presented. These financial statements and financial highlights are the responsibility of the Trust’s management. Our responsibility is to express an opinion on these financial statements and financial highlights based on our audits.
We conducted our audits in accordance with the standards of the Public Company Accounting Oversight Board (United States). Those standards require that we plan and perform the audit to obtain reasonable assurance about whether the financial statements and financial highlights are free of material misstatement. The Trust is not required to have, nor were we engaged to perform, an audit of its internal control over financial reporting. Our audits included consideration of internal control over financial reporting as a basis for designing audit procedures that are appropriate in the circumstances, but not for the purpose of expressing an opinion on the effectiveness of the Trust's internal control over financial reporting. Accordingly, we express no such opinion. An audit also includes examining, on a test basis, evidence supporting the amounts and disclosures in the financial statements, assessing the accounting principles used and significant estimates made by management, as well as evaluating the overall financial statement presentation. Our procedures included confirmation of securities owned as of October 31, 2012, by correspondence with the custodian and brokers; where replies were not received from brokers, we performed other auditing procedures. We believe that our audits provide a reasonable basis for our opinion.
In our opinion, such financial statements and financial highlights referred to above present fairly, in all material respects, the financial position of Capital Private Client Services Funds as of October 31, 2012, the results of their operations for the year then ended , the changes in their net assets for each of the two years in the period then ended (as to Capital Global Equity Fund, Capital Non-U.S. Equity Fund, and Capital U.S. Equity Fund for the year ended October 31, 2012 and for the period April 1, 2011 (commencement of operations) to October 31, 2011), and the financial highlights for each of the periods presented, in conformity with accounting principles generally accepted in the United States of America.
DELOITTE & TOUCHE LLP
Costa Mesa, California
December 18, 2012
| Capital Private Client Services Funds | |
| Tax Information (unaudited) | |
The Funds hereby designate the following amounts for the Funds’ fiscal year ended October 31, 2012:
| Exempt Interest Dividends | |
| Capital Core Municipal Fund | 99.97% |
| Capital Short-Term Municipal Fund | 100.00% |
| Capital California Core Municipal Fund | 99.87% |
| Capital California Short-Term Municipal Fund | 100.00% |
| Qualified Dividend Income (dollars in thousands) | |
| Capital Global Equity Fund | $ 3,684 |
| Capital Non-U.S. Equity Fund | 1,990 |
| Capital U.S. Equity Fund | 1,825 |
Capital Non-U.S. Equity Fund designates $2,422 in Foreign Source Income and $181 in Foreign Tax Credit Information.
Capital Global Equity Fund, Capital Non-U.S. Equity Fund, and Capital U.S. Equity Fund designate the maximum amount allowable for the corporate dividend received deduction for the fiscal year ended October 31, 2012.
The tax character of distributions paid for the year ended October 31, 2012 were as follows:
| Long Term Capital Gain Distributions (dollars in thousands) | |
| Capital California Core Municipal Fund | $ 32 |
| Capital California Short-Term Municipal Fund | 1 |
| Capital Core Bond Fund | 212 |
| Capital U.S. Equity Fund | 3,823 |
Individual shareholders should refer to their Form 1099 or other tax information, which will be mailed in January 2013, to determine the calendar year amounts to be included on their 2012 tax returns. Shareholders should consult their tax advisers.
| Capital Private Client Services Funds | |
| Expense example (unaudited) | |
As a shareholder of the Funds, you incur ongoing costs, including management fees and other expenses. This example is intended to help you understand your ongoing costs (in dollars) of investing in the Funds so you can compare these costs with the ongoing costs of investing in other mutual funds. The example is based on an investment of $1,000 invested at the beginning of the period and held for the entire period (May 1, 2012 through October 31, 2012).
Actual expenses:
The first line of each Fund in the table provides information about actual account values and actual expenses. You may use the information in this line, together with the amount you invested, to estimate the expenses that you paid over the period. Simply divide your account value by $1,000 (for example, an $8,600 account value divided by $1,000 = 8.6), then multiply the result by the number in the first line under the heading entitled “Expenses paid during period” to estimate the expenses you paid on your account during this period.
Hypothetical example for comparison purposes:
The second line of each Fund in the table provides information about hypothetical account values and hypothetical expenses based on the actual expense ratio for the Funds and an assumed rate of return of 5.00% per year before expenses, which is not the actual return of the Funds. The hypothetical account values and expenses may not be used to estimate the actual ending account balance or expenses you paid for the period. You may use this information to compare the ongoing costs of investing in the Funds and other funds. To do so, compare this 5.00% hypothetical example with the 5.00% hypothetical examples that appear in the shareholder reports of the other funds.
Notes:
Shareholders of the Funds may be subject to an additional fee charged by Capital Guardian Trust Company’s Capital Group Private Client Services division for the ongoing services provided to the shareholder. You can estimate the impact of these fees by adding the amount of the fees to the total estimated expenses you paid on your account during the period as calculated above. In addition, your ending account value would be lower by the amount of these fees. Note that the expenses shown in the table are meant to highlight your ongoing costs only. The second line of each Fund in the table is useful in comparing ongoing costs only and will not help you determine the relative total costs of owning different funds.
| Beginning account value 5/1/2012 | Ending account value 10/31/2012 | Expenses paid during period* | Annualized expense ratio | |
Capital Core Municipal Fund actual return | $ 1,000.00 | $1,019.70 | $ 2.03 | .40% |
| assumed 5% return | 1,000.00 | 1,023.10 | 2.03 | .40% |
Capital Short-Term Municipal Fund actual return | 1,000.00 | 1,008.90 | 2.02 | .40% |
| assumed 5% return | 1,000.00 | 1,023.10 | 2.03 | .40% |
Capital California Core Municipal Fund actual return | 1,000.00 | 1,020.20 | 2.03 | .40% |
| assumed 5% return | 1,000.00 | 1,023.10 | 2.03 | .40% |
Capital California Short-Term Municipal Fund actual return | 1,000.00 | 1,008.40 | 2.02 | .40% |
| assumed 5% return | 1,000.00 | 1,023.10 | 2.03 | .40% |
Capital Core Bond Fund actual return | 1,000.00 | 1,018.80 | 2.03 | .40% |
| assumed 5% return | 1,000.00 | 1,023.10 | 2.03 | .40% |
| Capital Global Equity Fund actual return | 1,000.00 | 1,017.30 | 4.31 | .85% |
| assumed 5% return | 1,000.00 | 1,020.90 | 4.32 | .85% |
| Capital Non-U.S. Equity Fund actual return | 1,000.00 | 1,017.80 | 4.31 | .85% |
| assumed 5% return | 1,000.00 | 1,020.90 | 4.32 | .85% |
| Capital U.S. Equity Fund actual return | 1,000.00 | 1,012.60 | 3.29 | .65% |
| assumed 5% return | 1,000.00 | 1,021.90 | 3.30 | .65% |
* Expenses are equal to the Fund's annualized expense ratio as indicated, multiplied by the average account value over the period, multiplied by 184/366 (to reflect the one-half year period).
| Capital Private Client Services Funds | |||
Trustees and other officers
| |||
| “Independent” Trustees1 | |||
| Name, age and position with funds | Year first elected as a trustee2 | Principal occupation(s) during the past five years | Number of portfolios3 overseen by trustee | Other directorships4 held by trustee during the past five years |
Richard G. Capen, Jr., 78 Trustee
| 2009 | Corporate director and author | 8 | Capital Emerging Markets Total Opportunities Fund
Former director of 16 American Funds portfolios; former director of Carnival Corporation |
H. Frederick Christie, 79 Trustee
| 2009 | Private investor | 8 | Capital Emerging Markets Total Opportunities Fund
Former director of 45 American Funds portfolios; former director of Valero; former director of SouthWest Water Company; former director of AECOM Technology Corporation; former director of DineEquity, Inc.; former director of Ducommun Incorporated |
Martin Fenton, 77
| 2009 | Chairman Senior Resource Group LLC (development and management of senior living communities) | 8 | Capital Emerging Markets Total Opportunities Fund
Former director of 47 American Funds portfolios |
Richard G. Newman, 78 Trustee
| 2009 | Chairman Emeritus of the Board and Consultant, AECOM Technology Corporation (global engineering, consulting and professional technical services)
| 8 | Capital Emerging Markets Total Opportunities Fund
Former director of 15 American Funds portfolios; former director of Sempra Energy; former director of SouthWest Water Company |
| Capital Private Client Services Funds | |
Trustees and other officers
| |
| “Interested” trustees5 |
Interested trustees have similar qualifications, skills and attributes as the independent trustees. Interested trustees are senior executive officers of Capital Guardian Trust Company or its affiliates. This management role with the fund’s service providers also permits them to make a significant contribution to the fund’s board.
Name, age and position with fund | Year first elected as a director/officer2 | Principal occupation(s) during the past five years and positions held with affiliated entities or the Principal Underwriter of the fund | Number of portfolios3 overseen by trustee | Other directorships4 held by trustee during the past five years |
Paul F. Roye, 59 Chairman of the Board | 2009 | Senior Vice President – Fund Business Management Group, Capital Research and Management Company6; Director – American Funds Service Company6 | 8 | Capital Emerging Markets Total Opportunities Fund |
The funds’ statement of additional information includes further details about fund trustees and is available without charge upon request by calling Capital Group Private Client Services at 800-421-4996 or by visiting the Funds website at capitalpcsfunds.com. The address for all trustees and officers of the fund is 6455 Irvine Center Drive, Irvine, CA 92618, Attention: Secretary.
| Capital Private Client Services Funds | |||
Trustees and other officers
| |||
| Other officers | |||
Name, age and position with funds | Year first elected an officer2 | Principal occupation(s) during the past five years and positions held with affiliated entities or the Principal Underwriter of the funds |
John B. Emerson, 58 President | 2010 | Senior Vice President – Capital Guardian Trust Company; Chairman of the Board – Capital Guardian Trust Company, a Nevada Corporation6; President – Private Client Services Division, Capital Guardian Trust Company |
Shelby Notkin, 71 Senior Vice President | 2010 | Senior Vice President – Capital Guardian Trust Company; Director – Capital Guardian Trust Company, a Nevada Coorporation6; Chairman of the Board – Private Client Services Division, Capital Guardian Trust Company |
John R. Queen, 47 Senior Vice President | 2009 | Vice President – Capital Guardian Trust Company; Senior Vice President – Private Client Services Division, Capital Guardian Trust Company, Vice President – Fixed Income, Capital Research and Management Company* |
Timothy W. McHale, 34 Vice President | 2009 | Associate Counsel – Fund Business Management Group, Capital Research and Management Company6, Secretary – American Funds Distributors, Inc.6 |
Courtney R. Taylor, 37 Secretary | 2009 | Assistant Vice President – Fund Business Management Group, Capital Research and Management Company6 |
Kevin M. Saks, 40 Treasurer | 2009 | Vice President – Capital Guardian Trust Company; Director – Capital Guardian Trust Company, a Nevada Corporation6; Senior Vice President – Private Client Services Division, Capital Guardian Trust Company |
| Susan K. Countess, 46 Assistant Secretary | 2012 | Associate – Fund Business Management Group, Capital Research and Management Company6 |
Susan R. Sunga, 57 Assistant Treasurer | 2011 | Vice President – Capital Guardian Trust Company; Tax Officer – Capital Guardian Trust Company, a Nevada Corporation6; Senior Manager – Private Client Services Division, Capital Guardian Trust Company |
1 The term “independent” trustee refers to a trustee who is not an “interested person” of the fund within the meaning of the 1940 Act.
2 Trustees and officers of the fund serve until their resignation, removal or retirement.
3 Capital Private Client Services Funds.
4 This includes all directorships (other than Capital Private Client Services Funds) that are held by each trustee as a director of a public company or a registered investment company. Unless otherwise noted, all directorships are current.
5 ”Interested persons” of the fund within the meaning of the 1940 Act, on the basis of their affiliation with the fund’s investment adviser, Capital Guardian Trust Company, or affiliated entities (including the fund’s principal underwriter).
6 Company affiliated with Capital Guardian Trust Company.
The address for all trustees and officers of the fund is 333 South Hope Street, 55th floor, Los Angeles, California 90071, Attention: Secretary.
| Capital Private Client Services Funds | |
Offices of the funds Capital Guardian Trust Company 6455 Irvine Center Drive Irvine, CA 92618
| Independent registered public accounting firm Deloitte & Touche LLP 695 Town Center Drive Costa Mesa, CA 92626 |
Offices of the investment adviser Capital Guardian Trust Company 333 South Hope Street Los Angeles, CA 90071-1406
| Transfer agent State Street Bank and Trust Company One Lincoln Street Boston, MA 02111 |
Custodian of assets State Street Bank and Trust Company One Lincoln Street Boston, MA 02111 | Counsel Bingham McCutchen LLP 355 South Grand Avenue, Suite 4400 Los Angeles, CA 90071-3106
|
Fund accounting and administration State Street Bank and Trust Company One Lincoln Street Boston, MA 02111 | Principal underwriter American Funds Distributors, Inc. 333 South Hope Street Los Angeles, CA 90071-1406
|
Investors should carefully consider the investment objectives, risks, charges and expenses of Capital Private Client Services Funds. This and other important information is contained in the Funds’ prospectus, which can be obtained from your Capital Group Private Client Services representative and should be read carefully before investing. You may also call Capital Group Private Client Services at 800-421-4996 to obtain a copy of the prospectus.
The proxy voting procedures and principles of Capital Private Client Services Funds which describe how we vote proxies relating to portfolio securities is available upon request by calling Capital Group Private Client Services at
800-421-4996. The Funds file their proxy voting records with the SEC for the 12 months ended June 30 by August 31. The report also is available on the SEC website at http://www.sec.gov or by calling Capital Group Private Client Services at 800-421-4996.
Capital Private Client Services Funds files a complete list of its portfolio holdings with the SEC for the first and third quarters of each fiscal year on Form N-Q. The Funds’ forms N-Q are available on the SEC’s website at http://www.sec.gov. You may also review or, for a fee, copy this filing at the SEC’s Public Reference Room in Washington, D.C. Additional information regarding the operation of the Public Reference Room may be obtained by calling the SEC’s Office of Investor Education and Advocacy at 800-SEC-0330. Additionally, the list of portfolio holdings is available by calling Capital Group Private Client Services at 800-421-4996.
ITEM 2 – Code of Ethics
The Registrant has adopted a Code of Ethics that applies to its Principal Executive Officer and Principal Financial Officer. The Registrant undertakes to provide to any person without charge, upon request, a copy of the Code of Ethics. Such request can be made to American Funds Service Company at 800/421-0180 or to the Secretary of the Registrant, 6455 Irvine Center Drive, Irvine, California 92618.
ITEM 3 – Audit Committee Financial Expert
The Registrant’s board has determined that Martin Fenton, a member of the Registrant’s audit committee, is an “audit committee financial expert” and "independent," as such terms are defined in this Item. This designation will not increase the designee’s duties, obligations or liability as compared to his or her duties, obligations and liability as a member of the audit committee and of the board, nor will it reduce the responsibility of the other audit committee members. There may be other individuals who, through education or experience, would qualify as "audit committee financial experts" if the board had designated them as such. Most importantly, the board believes each member of the audit committee contributes significantly to the effective oversight of the Registrant’s financial statements and condition.
ITEM 4 – Principal Accountant Fees and Services
| Registrant: | ||||
| a) Audit Fees: | ||||
| 2011 | $62,180 | |||
| 2012 | $8,210 | |||
| b) Audit-Related Fees: | ||||
| 2011 | None | |||
| 2012 | None | |||
| The audit-related fees consist of assurance and related services relating to the examination of the Registrant’s investment adviser conducted in accordance with Statement on Auditing Standards Number 70 issued by the American Institute of Certified Public Accountants. | ||||
| c) Tax Fees: | ||||
| 2011 | 16,750 | |||
| 2012 | 25,125 | |||
| The tax fees consist of professional services relating to the review of the Registrant’s tax returns. | ||||
| d) All Other Fees: | ||||
| 2011 | None | |||
| 2012 | None | |||
| The other fees consist of the review of the N1A annual update. | ||||
| Adviser and affiliates (includes only fees for non-audit services billed to the adviser and affiliates for engagements that relate directly to the operations and financial reporting of the Registrant and were subject to the pre-approval policies described below): | ||||
| a) Audit Fees: | ||||
| Not Applicable | ||||
| b) Audit-Related Fees: | ||||
| Not Applicable | ||||
| c) Tax Fees: | ||||
| Not Applicable | ||||
| d) All Other Fees: | ||||
| Not Applicable | ||||
All audit and permissible non-audit services that the Registrant’s audit committee considers compatible with maintaining the independent registered public accounting firm’s independence are required to be pre-approved by the committee. The pre-approval requirement will extend to all non-audit services provided to the Registrant, the investment adviser, and any entity controlling, controlled by, or under common control with the investment adviser that provides ongoing services to the Registrant, if the engagement relates directly to the operations and financial reporting of the Registrant. The committee will not delegate its responsibility to pre-approve these services to the investment adviser. The committee may delegate to one or more committee members the authority to review and pre-approve audit and permissible non-audit services. Actions taken under any such delegation will be reported to the full committee at its next meeting. The pre-approval requirement is waived with respect to non-audit services if certain conditions are met. The pre-approval requirement was not waived for any of the non-audit services listed above provided to the Registrant, adviser and affiliates.
ITEM 5 – Audit Committee of Listed Registrants
Not applicable to this Registrant, insofar as the Registrant is not a listed issuer as defined in Rule 10A-3 under the Securities Exchange Act of 1934.
ITEM 6 – Schedule of Investments
Not applicable, insofar as the schedule is included as part of the report to shareholders filed under Item 1 of this Form.
ITEM 7 – Disclosure of Proxy Voting Policies and Procedures for Closed-End Management Investment Companies
Not applicable to this Registrant, insofar as the Registrant is not a closed-end management investment company.
ITEM 8 – Portfolio Managers of Closed-End Management Investment Companies
Not applicable to this Registrant, insofar as the Registrant is not a closed-end management investment company.
ITEM 9 – Purchases of Equity Securities by Closed-End Management Investment Company and Affiliated Purchasers
Not applicable to this Registrant, insofar as the Registrant is not a closed-end management investment company.
ITEM 10 – Submission of Matters to a Vote of Security Holders
There have been no material changes to the procedures by which shareholders may recommend nominees to the Registrant’s board of trustees since the Registrant last submitted a proxy statement to its shareholders. The procedures are as follows. The Registrant has a nominating committee comprised solely of persons who are not considered ‘‘interested persons’’ of the Registrant within the meaning of the Investment Company Act of 1940, as amended. The committee periodically reviews such issues as the board’s composition, responsibilities, committees, compensation and other relevant issues, and recommends any appropriate changes to the full board of trustees. While the committee normally is able to identify from its own resources an ample number of qualified candidates, it will consider shareholder suggestions of persons to be considered as nominees to fill future vacancies on the board. Such suggestions must be sent in writing to the nominating committee of the Registrant, c/o the Registrant’s Secretary, and must be accompanied by complete biographical and occupational data on the prospective nominee, along with a written consent of the prospective nominee for consideration of his or her name by the nominating committee.
ITEM 11 – Controls and Procedures
| (a) | The Registrant’s Principal Executive Officer and Principal Financial Officer have concluded, based on their evaluation of the Registrant’s disclosure controls and procedures (as such term is defined in Rule 30a-3 under the Investment Company Act of 1940), that such controls and procedures are adequate and reasonably designed to achieve the purposes described in paragraph (c) of such rule. |
| (b) | There were no changes in the Registrant’s internal controls over financial reporting (as defined in Rule 30a-3(d) under the Investment Company Act of 1940) that occurred during the Registrant’s second fiscal quarter of the period covered by this report that has materially affected, or is reasonably likely to materially affect, the Registrant’s internal control over financial reporting. |
ITEM 12 – Exhibits
| (a)(1) | The Code of Ethics that is the subject of the disclosure required by Item 2 is attached as an exhibit hereto. |
| (a)(2) | The certifications required by Rule 30a-2 of the Investment Company Act of 1940 and Sections 302 and 906 of the Sarbanes-Oxley Act of 2002 are attached as exhibits hereto. |
SIGNATURES
Pursuant to the requirements of the Securities Exchange Act of 1934 and the Investment Company Act of 1940, the Registrant has duly caused this report to be signed on its behalf by the undersigned, thereunto duly authorized.
| CAPITAL PRIVATE CLIENT SERVICES FUNDS | |
| By /s/ John B. Emerson | |
John B. Emerson, President and Principal Executive Officer | |
| Date: December 31, 2012 |
Pursuant to the requirements of the Securities Exchange Act of 1934 and the Investment Company Act of 1940, this report has been signed below by the following persons on behalf of the Registrant and in the capacities and on the dates indicated.
| By /s/ John B. Emerson |
John B. Emerson, President and Principal Executive Officer |
| Date: December 31, 2012 |
| By /s/ Kevin M. Saks |
Kevin M. Saks, Treasurer and Principal Financial Officer |
| Date: December 31, 2012 |