August 8, 2019
Fellow Stockholders,
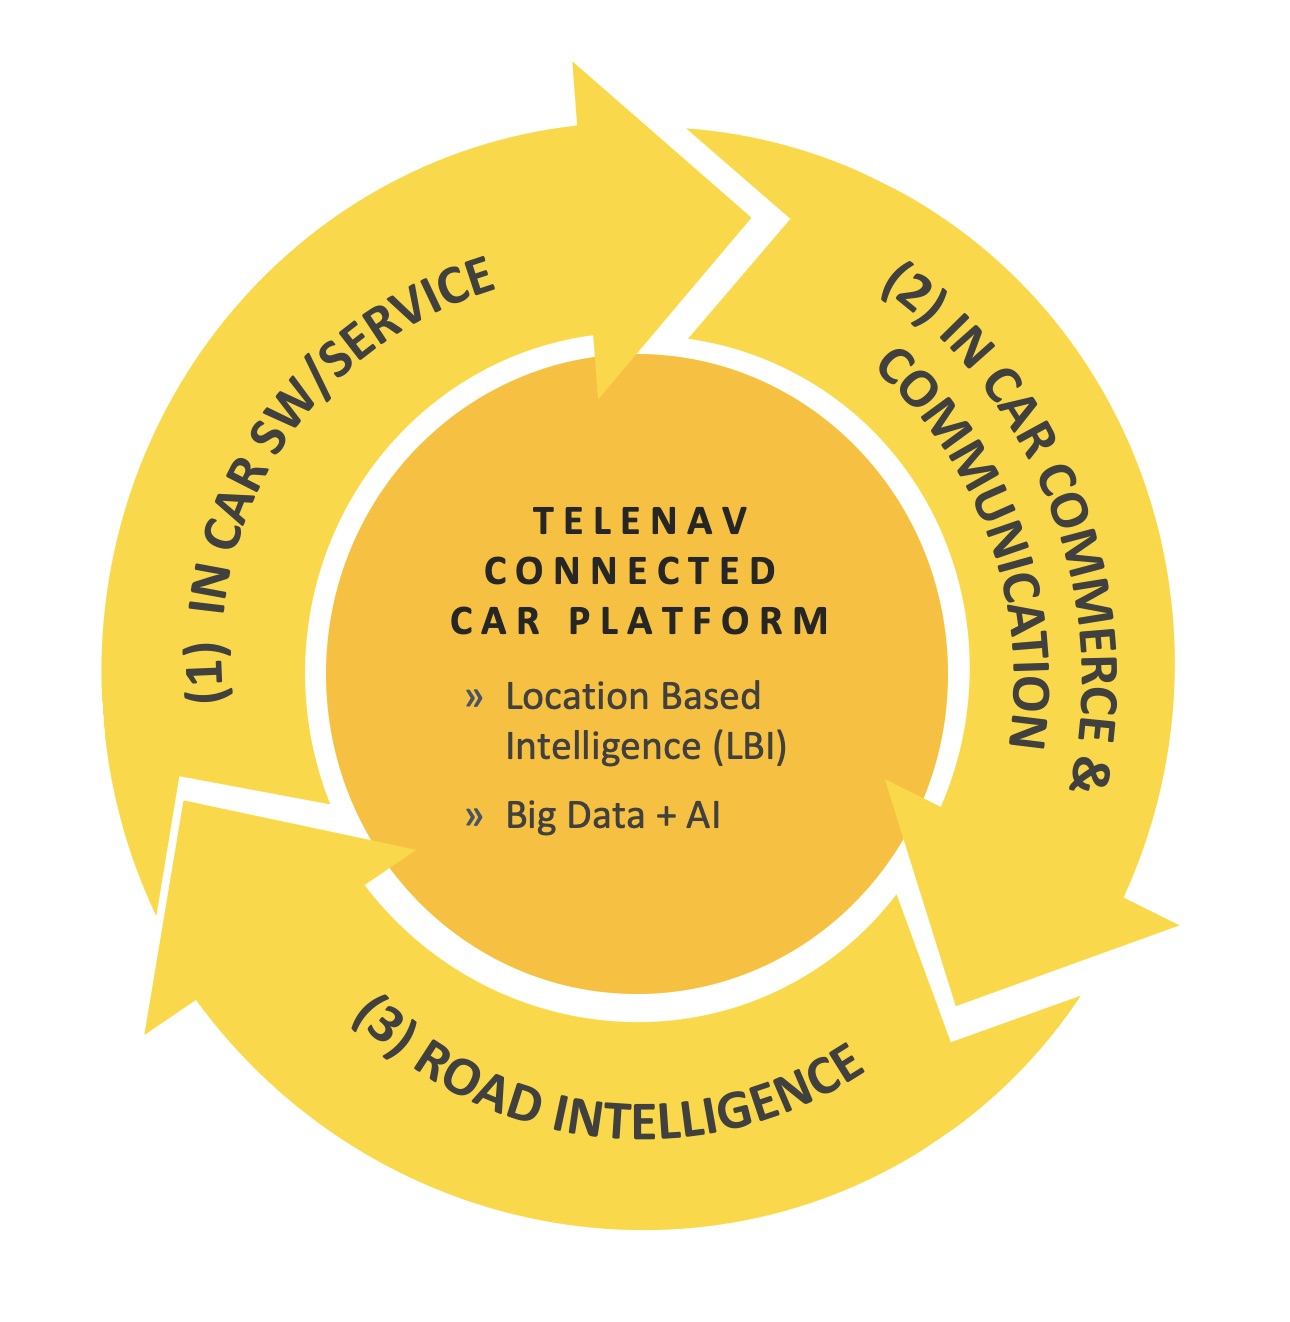
Telenav continued to execute on its strategy in each of the three domains of its Connected Car Platform — 1) In-Car Software and Service, 2) In-Car Commerce and Communications, and 3) Road Intelligence — while simultaneously driving improved financial performance, both for the fourth fiscal quarter and the full year of fiscal 2019.
In the first domain,we expanded our product line with the introduction of VIVID, a comprehensive embedded and cloud-connected, in-vehicle, personalized infotainment system. VIVID is specifically designed to effortlessly bring together the best online entertainment and information services with high-end hybrid navigation and integrated voice services, such as Amazon Alexa, to provide an easy-to-use, delightful user experience. We plan to leverage VIVID as we seek to increase our OEM market share.
In the second domain, we announced today a significant transaction to advance the In-Car Commerce and Communication portion of our Connected Car Platform. We are accelerating our strategy to enable connected vehicles with location-based advertising and commerce through an agreement to combine our Thinknear location-based mobile advertising business with that of inMarket Media, LLC, a leader in digital advertising for the physical world. In exchange, we will acquire a minority ownership position in inMarket Media. We believe the transaction will substantially increase the scale of the combined offering and create opportunities for automotive OEMs to derive incremental revenue from connected vehicles, while empowering drivers to benefit from location-specific offers. . The transaction is subject to certain closing conditions and is expected to be completed in the first quarter of fiscal 2020.
In the third domain, we announced today that we have entered into a strategic partnership and transaction with Grab, Southeast Asia's leading ride-hailing platform, to boost Grab’s development of geo-based products and services using Telenav’s OpenTerra™ platform. As part of this transaction, Grab will purchase the technology underlying the OpenTerra platform with plans for certain members of the OpenTerra team to join Grab. Telenav will be able to continue developing the platform going forward through a license back to the OpenTerra platform, with the ability to provide and sub license the platform to current and future customers. The transaction is important because it reflects a diversification of customer types and the ability of Telenav to monetize the Road Intelligence portion of our platform. We expect this transaction to generate in excess of $12 million in billings during the first quarter of fiscal 2020, approximately half of which we expect to recognize as revenue in that quarter. As consideration for the technology sale, Telenav will receive an equity interest in Grab at the time of closing of the transaction. Closing of this transaction is subject to customary conditions and is expected to occur before end of Telenav’s fiscal year 2020.
Over the past decade, we have invested in our connected car platform to benefit our OEM customers and drivers. The progress we have made has become evident in our market share and is being recognized by industry analysts: Telenav was the number one supplier of navigation software engines installed on vehicles produced in North America in 2018, according to IHSMarkit.
In the quarter ended June 30, 2019, 1.4 million Telenav-equipped vehicles capable of connected services were deployed into the global market during the quarter, now totaling 14.6 million cumulative connected vehicles deployed to date. Including non-connected vehicles, more than 24 million Telenav equipped vehicles have been deployed.
Financial Results Overview
Our financial performance was strong in our fourth quarter of fiscal 2019. Revenue increased 4% to $58.5 million, and billings increased 52% to $89.8 million relative to the same period in the prior year. For the full fiscal year of 2019, we grew revenue 1% compared to the prior fiscal year. The slow growth in revenue is primarily due to the price drop in the third party content experienced in the first part of the year and a decline in mobile navigation and advertising revenue. We increased billings 11%, narrowed our net loss to $(32.5) million from $(40.8) million in fiscal 2018, and exceeded our goal of positive adjusted cash flow from operations — driving it to $21.2 million compared with a loss of $(12.8) million in fiscal 2018.
Our financial results for the fourth quarter of fiscal 2019 are summarized in the table below.
|
| | | | | | | | | |
| Select Financial Data (unaudited) | Fiscal 2018 | Fiscal 2019 | Y/Y $ Growth |
| (in thousands, except gross margin, direct contribution margin and growth) | Q4 | Q4 |
| Total Company | | | |
| Revenue | $ | 55,987 |
| $ | 58,452 |
| $ | 2,465 |
|
| Billings* | $ | 59,249 |
| $ | 89,768 |
| $ | 30,519 |
|
| Gross profit | $ | 24,164 |
| $ | 26,357 |
| $ | 2,193 |
|
| Gross margin | 43 | % | 45 | % | |
| Direct contribution from billings* | $ | 25,814 |
| $ | 50,230 |
| $ | 24,416 |
|
| Direct contribution margin from billings* | 44 | % | 56 | % | |
| Net loss | $ | (7,465 | ) | $ | (12,856 | ) | $ | (5,391 | ) |
| Adjusted cash flow from operations* | $ | (2,452 | ) | $ | 17,242 |
| $ | 19,694 |
|
|
| | | | | | | | | |
| Select Financial Data (unaudited) | Fiscal 2018 | Fiscal 2019 | Y/Y $ Growth |
| (in thousands, except gross margin, direct contribution margin and growth) | Q4 | Q4 |
| Automotive | | | |
| Revenue | $ | 46,977 |
| $ | 49,816 |
| $ | 2,839 |
|
| Billings* | $ | 50,360 |
| $ | 81,060 |
| $ | 30,700 |
|
| Gross profit | $ | 19,763 |
| $ | 21,385 |
| $ | 1,622 |
|
| Gross margin | 42 | % | 43 | % | |
| Direct contribution from billings* | $ | 21,534 |
| $ | 45,186 |
| $ | 23,652 |
|
| Direct contribution margin from billings* | 43 | % | 56 | % | |
| Cumulative Units Deployed to Date** | 18,598 |
| 24,221 |
| $ | 5,623 |
|
| Y/Y % Growth | 40 | % | 30 | % | |
| Cumulative Connected Units Deployed to Date** | 9,408 |
| 14,640 |
| $ | 5,232 |
|
| Y/Y % Growth | 75 | % | 56 | % | |
| Advertising | | | |
| Revenue | $ | 6,061 |
| $ | 6,749 |
| $ | 688 |
|
| Billings* | $ | 6,061 |
| $ | 6,749 |
| $ | 688 |
|
| Gross profit | $ | 2,708 |
| $ | 3,906 |
| $ | 1,198 |
|
| Gross margin | 45 | % | 58 | % | |
| Mobile Navigation | | | |
| Revenue | $ | 2,949 |
| $ | 1,887 |
| $ | (1,062 | ) |
| Billings* | $ | 2,828 |
| $ | 1,959 |
| $ | (869 | ) |
| Gross profit | $ | 1,693 |
| $ | 1,066 |
| $ | (627 | ) |
| Gross margin | 57 | % | 56 | % | |
| * See "Use of non-GAAP Measures" for definitions and discussion. | |
| ** Deployment date is defined as the date upon which title has transferred. | |
Automotive Results
Telenav’s technology has now been deployed in 24.2 million vehicles, including more than 1.5 million added during the fourth quarter of fiscal 2019, of which more than 1.4 million were capable of connected services.
Automotive revenue for the fourth quarter of fiscal 2019 was $49.8 million, a 6% increase compared with $47.0 million in the fourth quarter of fiscal 2018. For the full year fiscal 2019, automotive revenue increased to $186.8 million, a 5% increase compared with $177.8 million in fiscal 2018. Gross profit from the automotive business unit increased to $21.4 million in the fourth quarter of fiscal 2019, a 8% increase compared with $19.8 million in the fourth quarter of fiscal 2018. For the full year fiscal 2019, automotive gross profit was $77.1 million, a 12% increase compared with $68.8 million in fiscal 2018.
Total automotive billings in the fourth quarter of fiscal 2019 were $81.1 million, a 61% increase compared with $50.4 million in the fourth quarter of fiscal 2018, driven primarily by a $17.0 million one-time billing associated with a contractual modification relating to a tier one supplier, as described below. Billings exceeded the high end of our guidance range for the fourth quarter even excluding the $17.0 million one-time billing. For the full year fiscal 2019, automotive billings were $247.5 million compared with $213.6 million in fiscal 2018. In the fourth quarter of fiscal 2019, Ford represented 50% and 39% of our total revenue and billings, respectively, and GM represented 22% and 19% of our total revenue and billings, respectively.
Automotive direct contribution from billings in the fourth quarter of fiscal 2019 was $45.2 million, an increase of 110% compared with $21.5 million in the fourth quarter of fiscal 2018, driven primarily by a $17.0 million one-time billing associated with a contractual modification relating to a tier one supplier, as described below, and increased units . Automotive direct contribution from billings for the full year fiscal 2019 was $116.3 million, compared with $81.6 million in fiscal 2018. Automotive direct contribution margin from billings in the fourth quarter of fiscal 2019 was 56%, up 13% from 43% in the fourth quarter of fiscal 2018, driven primarily by a $17.0 million one-time billing associated with a contractual modification relating to a tier one supplier, as described below. Automotive direction contribution margin from billings for the full year fiscal 2019 was 47% compared with 38% for fiscal 2018.
In the fourth quarter of fiscal 2019, Toyota launched the 2020 Prius Prime with Telenav’s Scout GPS Link.
During the fourth quarter of 2019, Telenav entered into an amended agreement with Xevo, a tier one supplier to Toyota. We have chosen to take a one-time $17.0 million cash pre-payment in the first quarter of fiscal 2020 in exchange for removing a contractual minimum unit commitment that otherwise would have resulted in a payment to us in 2027. We recorded the receivable as deferred revenue in the fourth quarter of fiscal 2019, and it will be recognized as revenue over future periods. Our contract with Xevo relating to the implementation of our solutions in Toyota and Lexus vehicles is expected to remain in place through 2026, and we are exploring additional opportunities with Xevo and Toyota across all three domains of our platform.
Advertising Results
Advertising revenue, which includes the delivery of location-based advertising impressions, was $6.7 million in the fourth quarter of fiscal 2019 compared with $6.1 million in the fourth quarter of fiscal 2018. For fiscal 2019, advertising revenue was $24.2 million compared with $27.2 million in fiscal 2018. Advertising gross profit was $3.9 million in the fourth quarter of fiscal 2019 compared with $2.7 million in the fourth quarter of fiscal 2018, due to higher revenue and substantially improved cost per impression. Advertising gross profit for fiscal 2019 was $12.7 million compared with $13.9 million in fiscal 2018.
Beginning in the first quarter of fiscal 2020, we will report financial results for the advertising business as discontinued operations in our income statement.
Mobile Navigation Results
Mobile navigation revenue for the fourth quarter of fiscal 2019 was $1.9 million, compared with $2.9 million in the fourth quarter of fiscal 2018. For fiscal 2019, mobile navigation revenue was $9.8 million, compared with $13.4 million in fiscal 2018. Mobile navigation gross profit was $1.1 million in the fourth quarter of fiscal 2019 compared with $1.7 million in the fourth quarter of fiscal 2018. Mobile navigation gross profit for fiscal 2019 was $6.4 million compared with $7.7 million in fiscal 2018.
Total Direct Contribution from Billings and Direct Contribution Margin from Billings
Our direct contribution from billings was $50.2 million in the fourth quarter of fiscal 2019 compared with $25.8 million in the fourth quarter of fiscal 2018, a 95% year over year growth, driven primarily by a $17.0 million one-time billing associated with a contractual modification with Xevo and the increase in automotive unit volume. Fiscal 2019 direct contribution from billings was $135.4 million compared with $102.8 million in fiscal 2018. Direct contribution margin from billings for the fourth quarter of fiscal 2019 was 56% compared with 44% in the fourth quarter of fiscal 2018. Fiscal 2019 direct contribution margin from billings was 48% compared with 40% in fiscal 2018.
Total Operating Expenses
Operating expenses in the fourth quarter of fiscal 2019 were $39.2 million compared with $31.7 million in the fourth quarter of fiscal 2018. The increase in operating expenses was due primarily to a $2.6 million goodwill impairment charge associated with the Thinknear location-based mobile-advertising business recorded in the fourth quarter of fiscal 2019, increased variable compensation expense associated with higher billings, and an increase R&D expense associated with product deliveries. Operating expenses for fiscal 2019 were $130.3 million, compared with $131.0 million for fiscal 2018.
Net Loss
Net loss for the fourth quarter of fiscal 2019 was $(12.9) million compared with $(7.5) million for the fourth quarter of fiscal 2018. The year over year increase in loss was due primarily to the increased operating expenses discussed above. Net loss for fiscal 2019 was $(32.5) million compared with $(40.8) million in fiscal 2018.
Adjusted EBITDA
Adjusted EBITDA, a non-GAAP financial measure, for the fourth quarter of fiscal 2019 was a loss of $(6.6) million, compared with a loss of $(4.1) million in the fourth quarter of fiscal 2018. Adjusted EBITDA for fiscal 2019 was a loss of $(18.0) million, compared with a loss of $(25.2) million in fiscal 2018.
Adjusted Cash Flow from Operations
Adjusted cash flow from operations (formerly referred to as adjusted EBITDA on billings), a non-GAAP financial measure, in the fourth quarter of fiscal 2019 was $17.2 million compared to a loss of $(2.5) million in the fourth quarter of fiscal 2018. Adjusted cash flow from operations for fiscal 2019 was $21.2 million compared with a loss of $(12.8) million in fiscal 2018. The changes in both the quarterly and annual results were driven primarily by a $17.0 million one-time billing associated with a contractual modification with Xevo and an overall increase in automotive units.
Free Cash Flow
Free cash flow in the fourth quarter of fiscal 2019 was $4.0 million compared with a loss of $(3.4) million in the fourth quarter of fiscal 2018. Free cash flow for fiscal 2019 was $6.1 million compared with a loss of $(12.1) million in fiscal 2018.
Business Outlook
The below information concerning guidance represents Telenav’s outlook only as of the date hereof and is subject to change for various reasons, including due to developments relating to the inMarket Media and Grab transactions, amendments to material contracts and other changes in business conditions. Please refer to the disclosures under “Forward-Looking Statements” below. Telenav undertakes no obligation to update or revise any financial forecast or other forward-looking statements, as a result of new developments, or otherwise.
Beginning with the first quarter of fiscal 2020, the financial results of Telenav’s advertising business will be reported as discontinued operations in the company’s income statement. This guidance reflects that change in reporting structure. In addition, this guidance reflects the impact of the revenue and billings expected to be recognized and recorded in the first quarter of fiscal 2020 relating to the Grab transaction.
Telenav is no longer providing guidance on direct contribution margin from billings and adjusted cash flow from operations. In addition, Telenav’s financial results for future periods will no longer present direct contribution from billings, direct contribution margin from billings and adjusted cash flow from operations on a historical basis. However, Telenav will continue to report changes in deferred revenue and deferred costs to enable investors to assess the impact of period-to-period changes of those measures on Telenav’s financial results. Additionally, we encourage readers to refer to Net cash provided by (used in) operating activities as shown on our Consolidated Statement of Cash Flow as well as Reconciliation of Net Income (Net Loss) to Free Cash Flow provided as exhibits to our earnings release to further assess the impact of Billings on our financial results.
|
| |
| Guidance | Q1 Fiscal 2020 |
| (as of August 8, 2019) | (dollars and shares in millions) |
| Revenue | $62 to $64 |
| Billings* | $70 to $72 |
| Gross margin | 42% to 44% |
| Operating expenses | $29 to $31 |
| Net loss | $(4.5) to $(5.5) |
| Adjusted EBITDA* | $0 to $1 |
* See "Use of non-GAAP Measures" for definitions and discussion. |
As we look forward to fiscal 2020, we expect to see increased deployment within our automobile manufacturer and tier one partners and inclusion of our products and services on more car models, especially with GM. In addition, subject to anticipated volumes, take rates and timing of model expansion under Telenav’s various automobile manufacturer and tier one supplier programs, and assuming no unforeseen impact from macroeconomic changes, we anticipate that adjusted EBITDA for the full fiscal year 2020 will be positive, compared with a loss of $(18.0) million in fiscal 2019.
Stock Repurchase Program
As announced in February 2019, Telenav’s Board of Directors has authorized a program for the repurchase of up to $20.0 million of our shares of common stock through open market purchases. The term of the program is 18 months. Although the company did not repurchase any shares during the fourth quarter of fiscal 2019, the program is ongoing, and the timing and amount of repurchase transactions under this program will depend on market conditions, cash flow and other considerations.
Fourth Quarter and Fiscal Year 2019 Financial Results Q&A Conference Call, Aug. 8, 2019 at 5:30 p.m. ET.
Management will host an investor conference call and live webcast at 2:30 p.m. PT (5:30 p.m. ET). To access the conference call, dial 800-289-0438 (toll-free, domestic only) or 323-794-2423 (domestic and international toll) and enter pass code 3316085. The webcast will be accessible on Telenav's investor relations website at http://investor.telenav.com.
ASC 606 Implementation
As reported previously, Telenav adopted ASC 606, Revenue from Contracts with Customers, effective July 1, 2018, utilizing the full retrospective transition method. All prior period amounts and disclosures set forth in this earnings release have been adjusted to comply with ASC 606. Under this accounting methodology, certain automotive royalty amounts earned are bifurcated when there exist various underlying obligations. Revenue is recognized upon fulfillment of the underlying obligation. Such various obligations related to earned royalties generally include an onboard navigation component recognized as revenue when each navigation unit is delivered and accepted, a connected services component recognized as revenue over the applicable service period, and a map update component recognized as revenue upon periodic delivery of the applicable map updates.
The adjustments required to transition to ASC 606 on July 1, 2018 resulted in $160.6 million of deferred revenue and $86.9 million of deferred costs originally reported on the company’s balance sheet as of June 30, 2018 being recorded instead as revenue and cost of revenue, respectively, in prior periods as adjusted. In addition, the adoption of ASC 606 required the company to capitalize an additional $4.2 million, net, of deferred development costs on its adjusted June 30, 2018 balance sheet, resulting in a net decrease in deferred costs of $82.7 million. The net impact of the company’s adoption of ASC 606 as of June 30, 2018 was an adjustment to decrease its accumulated deficit by $77.8 million. All prior period amounts have been adjusted to comply with ASC 606.
Use of Non-GAAP Financial Measures
Telenav prepares its financial statements in accordance with generally accepted accounting principles for the United States, or GAAP. The non-GAAP financial measures such as billings, direct contribution from billings, direct contribution margin from billings, change in deferred revenue, change in deferred costs, adjusted EBITDA, adjusted cash flow from operations and free cash flow included in this press release are different from those otherwise presented under GAAP. Telenav has provided these measures in addition to GAAP financial results because management believes these non-GAAP measures help provide a consistent basis for comparison between periods that are not influenced by certain items and, therefore, are helpful in understanding Telenav’s underlying operating results. These non-GAAP measures are some of the primary measures Telenav’s management uses for planning and forecasting. These measures are not in accordance with, or an alternative to, GAAP and these non-GAAP measures may not be comparable to information provided by other companies. As discussed above, beginning with the quarter ending September 30, 2019, Telenav will no longer provide direct contribution from billings, direct contribution margin from billings and adjusted cash flow from operations.
To reconcile the historical GAAP results to non-GAAP financial metrics, please refer to the reconciliations in the financial statements included in this letter.
Billings equals revenue recognized plus the change in deferred revenue from the beginning to the end of the applicable period. Direct contribution from billings reflects gross profit plus change in deferred revenue less change in deferred costs from the beginning to the end of the applicable period. Direct contribution margin from billings reflects direct contribution from billings divided by billings. Telenav has also provided a breakdown of the calculation of the change in deferred revenue by segment, which is added to revenue in calculating its non-GAAP metric of billings. In connection with its presentation of the change in deferred revenue, Telenav has provided a similar presentation of the change in the related deferred costs. Such deferred costs primarily include costs associated with third party content and certain development costs associated with Telenav’s customized software solutions whereby customized engineering fees are earned. As the company enters into more hybrid and brought-in navigation programs, deferred revenue and deferred costs become larger components of its operating results, so Telenav believes these metrics are useful in evaluating cash flows.
Telenav considers billings, direct contribution from billings and direct contribution margin from billings to be useful metrics for management and investors because billings drive revenue and deferred revenue, which is an important indicator of its business. Telenav believes direct contribution from billings and direct contribution margin from billings are useful metrics because they reflect the impact of the contribution over time for such billings, exclusive of the incremental costs incurred to deliver any related service obligations. There are a number of limitations related to the use of billings, direct contribution from billings and direct contribution margin from billings versus revenue, gross profit, and gross margin calculated in accordance with GAAP. First, billings, direct contribution from billings and direct contribution margin from billings include amounts that have not yet been recognized as revenue or cost and may require additional services or costs to be provided over contracted service periods. For example, billings related to certain brought-in solutions cannot be fully recognized as revenue in a given period due to requirements for ongoing map updates and provisioning of services such as hosting, monitoring, customer support and, for certain customers, additional period content and associated technology costs. Accordingly, direct contribution from billings and direct contribution margin from billings do not include all costs associated with billings. Second, Telenav may calculate billings, direct contribution from billings, and direct contribution margin from billings in a manner that is different from peer companies that report similar financial measures, making comparisons between companies more difficult. When Telenav uses these measures, it attempts to compensate for these limitations by providing specific information regarding billings, direct contribution from billings and direct contribution margin from billings and how they relate to revenue, gross profit and gross margin calculated in accordance with GAAP.
Adjusted EBITDA measures net loss excluding the impact of stock-based compensation expense; depreciation and amortization; other income (expense) net; provision (benefit) for income taxes; and other applicable items such as legal settlements and contingencies, deferred rent reversal and tenant improvement allowance recognition due to sublease termination, M&A transaction expenses, net of tax, and goodwill impairment. Stock-based compensation expense relates to equity incentive awards granted to its employees, directors, and consultants. Legal settlements and contingencies represent settlements, offers made to settle, or loss accruals relating to litigation or other disputes in which Telenav is a party or the indemnitor of a party. Deferred rent reversal and tenant improvement allowance recognition represent the reversal of Telenav’s deferred rent liability and recognition of Telenav’s deferred tenant improvement allowance, as amortization of these amounts is no longer required due to the termination of the company’s Santa Clara facility sublease and subsequent entry into a new lease agreement with its landlord for this same facility effective September 2017. M&A transaction expenses relate primarily to transaction costs associated with the inMarket Media and Grab transactions. Goodwill impairment represents the impairment charge related to Telenav’s mobile navigation segment recorded in the third quarter of fiscal 2018 and the impairment charge related to Telenav’s advertising segment recorded in the fourth quarter of fiscal 2019. Adjusted cash flow from operations measures adjusted EBITDA plus the effect of changes in deferred revenue and deferred costs. Telenav believes adjusted cash flow from operations is a useful measure, especially in light of the impact it continues to expect on reported revenue for certain value-added offerings the company provides its customers, including map updates and the impact of future deliverables.
Adjusted EBITDA and adjusted cash flow from operations, while generally measures of profitability and the generation of cash, can also represent losses and the use of cash, respectively. Adjusted EBITDA and adjusted cash flow from operations are key measures used by Telenav’s management and board of directors to understand and evaluate Telenav’s core operating performance and trends, to prepare and approve its annual budget and to develop short- and long-term operational plans. In particular, Telenav believes that the exclusion of the expenses eliminated in calculating adjusted EBITDA and adjusted cash flow from operations can provide a useful measure for period-to-period comparisons of Telenav’s core business. In addition, adjusted cash flow from operations is a key financial measure used by the compensation committee of Telenav’s board of directors in connection with the development of incentive-based compensation for Telenav’s executive officers and employees. Accordingly, Telenav believes that adjusted cash flow from operations generally provides useful information to investors and others in
understanding and evaluating Telenav’s operating results in the same manner as its management and board of directors.
Free cash flow is a non-GAAP financial measure Telenav defines as net cash provided by (used in) operating activities, less purchases of property and equipment. Telenav considers free cash flow to be a liquidity measure that provides useful information to management and investors about the amount of cash generated by (used in) its business after purchases of property and equipment.
In this letter, Telenav has provided guidance for the first quarter of fiscal 2020 on a non-GAAP basis for billings and adjusted EBITDA. Telenav does not provide reconciliations of these forward-looking non-GAAP financial measures to the corresponding GAAP measures due to the high variability and difficulty in making accurate forecasts and projections with respect to certain items, particularly stock-based compensation and tax provision, which are components of adjusted EBITDA. In particular, stock-based compensation is impacted by future hiring and retention needs, as well as the future fair market value of Telenav’s common stock, all of which is difficult to predict and subject to constant change. The actual amounts of these items will have a significant impact on Telenav’s net loss per diluted share and tax provision. Accordingly, reconciliations of Telenav’s forward-looking non-GAAP financial measures to the corresponding GAAP measures are not available without unreasonable effort.
Forward Looking Statements
This investor letter contains forward-looking statements that are based on Telenav management’s beliefs and assumptions and on information currently available to its management. Actual events or results may differ materially from those described in this document due to a number of risks and uncertainties. These potential risks and uncertainties include, among others: when and whether Telenav will be profitable; fluctuations in Telenav’s revenue and operating results; Telenav’s ability to develop and implement products for Ford, GM and Toyota and to support Ford, GM and Toyota and their customers; the pendency of the inMarket Media and Grab transactions; the impact of Ford’s announcement regarding the elimination of various sedans in North America and Europe over the near term and GM’s recent announcement regarding the elimination of various sedans in North America in the near term; Telenav’s ability to expand into the Chinese automotive navigation market; the impact of tariffs on sales of automobiles in the United States and other markets; the impact of the anticipated departure of the United Kingdom from the European Union on sales of automobiles in the United Kingdom and automotive supply chains; Telenav’s success in maintaining and extending its contracts for current and new generation of products with its existing automobile manufacturers and tier ones, particularly Ford and GM; failure to comply with Telenav’s auto manufacturer and tier one contracts, such as failure to obtain certification under certain technical standards for the computer software development process in the automobile industry; Telenav’s ability to achieve additional design wins and the delivery dates of automobiles including Telenav’s products; adoption by vehicle purchasers of Scout GPS Link; Telenav’s dependence on a limited number of automobile manufacturers and tier ones for a substantial portion of its revenue; reductions in demand for automobiles; potential impacts of automobile manufacturers and tier ones including competitive capabilities in their vehicles such as Apple’s CarPlay and Android Auto; Telenav’s ability to develop new advertising products and technology while also achieving cash flow break even and ultimately profitability in the advertising business; any failure to meet financial performance expectations of securities analysts or investors; failure to reach agreement with customers for awards and contracts on products and services in which Telenav has expended resources developing; competition from other market participants who may provide comparable services to subscribers without charge; the timing of new product releases and vehicle production by Telenav’s automotive customers, including inventory procurement and fulfillment; possible warranty claims, and the impact on consumer perception of its brand; Telenav’s ability to develop and support products including OpenStreetMap (“OSM”), as well as transition existing navigation products to OSM and any economic benefit anticipated from the use of OSM versus proprietary map products; the potential that Telenav may not be able to realize its deferred tax assets and may have to take a reserve against them; Telenav’s reliance on its automobile manufacturers for volume and royalty reporting; the impact on revenue recognition and other
financial reporting due to the amendment of contracts or changes in accounting standards; and macroeconomic and political conditions in the U.S. and abroad, in particular China. Telenav discusses these risks in greater detail in “Risk Factors” and elsewhere in its Form 10-Q for the fiscal quarter ended March 31, 2019,[insert comma] and other filings with the U.S. Securities and Exchange Commission (“SEC”) including any subsequent Annual Report on Form 10-K or Quarterly Report on Form 10-Q, which are available at the SEC’s website at www.sec.gov. Given these uncertainties, you should not place undue reliance on these forward-looking statements. Also, forward-looking statements represent management’s beliefs and assumptions only as of the date made. You should review the company’s SEC filings carefully and with the understanding that actual future results may be materially different from what Telenav expects.
About Telenav, Inc.
Telenav is a leading provider of connected car and location-based services, focused on transforming life on the go for people - before, during, and after every drive. Leveraging our location platform, we enable our customers to deliver custom connected car and mobile experiences. To learn more about how Telenav’s location platform powers personalized navigation, mapping, big data intelligence, social driving, and location-based advertising, visit www.telenav.com.
Copyright 2019 Telenav, Inc. All Rights Reserved.
“Telenav,” “Scout,” “Thinknear” and the Telenav, Scout and Thinknear logos are registered trademarks of Telenav, Inc. Unless otherwise noted, all other trademarks, service marks, and logos used in this investor letter are the trademarks, service marks or logos of their respective owners.
TNAV-F
TNAV-C
Contacts
Investor Relations:
Bishop IR
Mike Bishop
415-894-9633
IR@telenav.com
Media:
Raphel Finelli
408-667-5970
raphelf@telenav.com
|
| | | | | | | | |
| Telenav, Inc. |
| Condensed Consolidated Balance Sheets |
| (in thousands, except par value) |
| | | | | |
| | | June 30,
2019 | | June 30, 2018 As Adjusted(1) |
| | | (unaudited) |
| Assets | | | | |
| Current assets: | | | | |
| Cash and cash equivalents | | $ | 27,275 |
| | $ | 17,117 |
|
| Short-term investments | | 72,203 |
| | 67,829 |
|
| Accounts receivable, net of allowances of $7 and $17 at June 30, 2019 and 2018, respectively | | 75,792 |
| | 46,188 |
|
| Restricted cash | | 1,950 |
| | 2,982 |
|
| Income taxes receivable | | 4 |
| | — |
|
| Deferred costs | | 18,752 |
| | 11,759 |
|
| Prepaid expenses and other current assets | | 4,099 |
| | 3,867 |
|
| Total current assets | | 200,075 |
| | 149,742 |
|
| Property and equipment, net | | 5,655 |
| | 6,987 |
|
| Deferred income taxes, non-current | | 939 |
| | 867 |
|
| Goodwill and intangible assets, net | | 27,487 |
| | 31,046 |
|
| Deferred costs, non-current | | 61,050 |
| | 46,666 |
|
| Other assets | | 1,809 |
| | 2,372 |
|
| Total assets | | $ | 297,015 |
| | $ | 237,680 |
|
| Liabilities and stockholders’ equity | | | | |
| Current liabilities: | | | | |
| Trade accounts payable | | $ | 17,034 |
| | $ | 13,008 |
|
| Accrued expenses | | 51,299 |
| | 38,803 |
|
| Deferred revenue | | 31,270 |
| | 20,714 |
|
| Income taxes payable | | 800 |
| | 221 |
|
| Total current liabilities | | 100,403 |
| | 72,746 |
|
| Deferred rent, non-current | | 1,296 |
| | 1,112 |
|
| Deferred revenue, non-current | | 103,865 |
| | 53,824 |
|
| Other long-term liabilities | | 811 |
| | 1,115 |
|
| Commitments and contingencies | | | | |
| Stockholders’ equity: | | | | |
| Preferred stock, $0.001 par value: 50,000 shares authorized; no shares issued or outstanding | | — |
| | — |
|
| Common stock, $0.001 par value: 600,000 shares authorized; 46,911 and 44,871 shares issued and outstanding at June 30, 2019 and 2018, respectively | | 47 |
| | 45 |
|
| Additional paid-in capital | | 182,349 |
| | 167,895 |
|
| Accumulated other comprehensive loss | | (1,477 | ) | | (1,855 | ) |
| Accumulated deficit | | (90,279 | ) | | (57,202 | ) |
| Total stockholders’ equity | | 90,640 |
| | 108,883 |
|
| Total liabilities and stockholders’ equity | | $ | 297,015 |
| | $ | 237,680 |
|
(1) Certain amounts have been adjusted to reflect the retrospective adoption of ASC 606. |
|
| | | | | | | | | | | | | | | | |
| Telenav, Inc. |
| Condensed Consolidated Statements of Operations |
| (in thousands, except per share amounts) |
| |
| | | | | | | | | |
| | | Three Months Ended
June 30, | | Fiscal Year Ended
June 30, |
| | | 2019 | | 2018 As Adjusted(1) | | 2019 | | 2018 As Adjusted(1) |
| | | (unaudited) | | (unaudited) |
| Revenue: | | | | | | | | |
| Product | | $ | 44,569 |
| | $ | 42,845 |
| | $ | 168,619 |
| | $ | 163,599 |
|
| Services | | 13,883 |
| | 13,142 |
| | 52,277 |
| | 54,864 |
|
| Total revenue | | 58,452 |
| | 55,987 |
| | 220,896 |
| | 218,463 |
|
| Cost of revenue: | | | | | | | | |
| Product | | 25,110 |
| | 25,275 |
| | 97,245 |
| | 102,224 |
|
| Services | | 6,985 |
| | 6,548 |
| | 27,430 |
| | 25,847 |
|
| Total cost of revenue | | 32,095 |
| | 31,823 |
| | 124,675 |
| | 128,071 |
|
| Gross profit | | 26,357 |
| | 24,164 |
| | 96,221 |
| | 90,392 |
|
| Operating expenses: | | | | | | | | |
| Research and development | | 24,252 |
| | 21,548 |
| | 83,953 |
| | 85,646 |
|
| Sales and marketing | | 5,187 |
| | 4,894 |
| | 19,322 |
| | 20,748 |
|
| General and administrative | | 7,117 |
| | 5,219 |
| | 23,811 |
| | 21,562 |
|
| Goodwill impairment | | 2,556 |
| | — |
| | 2,556 |
| | 2,666 |
|
| Legal settlement and contingencies | | 50 |
| | — |
| | 700 |
| | 425 |
|
| Total operating expenses | | 39,162 |
| | 31,661 |
| | 130,342 |
| | 131,047 |
|
| Loss from operations | | (12,805 | ) | | (7,497 | ) | | (34,121 | ) | | (40,655 | ) |
| Other income, net | | 213 |
| | 433 |
| | 2,916 |
| | 833 |
|
| Loss before provision for income taxes | | (12,592 | ) | | (7,064 | ) | | (31,205 | ) | | (39,822 | ) |
| Provision for income taxes | | 264 |
| | 401 |
| | 1,283 |
| | 1,012 |
|
| Net loss | | $ | (12,856 | ) | | $ | (7,465 | ) | | $ | (32,488 | ) | | $ | (40,834 | ) |
| | | | | | | | | |
| Net loss per share: | | | | | | | | |
| Basic and diluted | | $ | (0.28 | ) | | $ | (0.17 | ) | | $ | (0.71 | ) | | $ | (0.92 | ) |
| Weighted average shares used in computing net loss per share: | | | | | | | | |
| Basic and diluted | | 46,271 |
| | 44,806 |
| | 45,577 |
| | 44,498 |
|
(1) Certain amounts have been adjusted to reflect the retrospective adoption of ASC 606. |
|
| | | | | | | | |
| Telenav, Inc. |
| Condensed Consolidated Statements of Cash Flows |
| (in thousands) |
|
| | | Fiscal Year Ended
June 30, |
| | | 2019 | | 2018 As Adjusted(1) |
| | | (unaudited) |
| Operating activities | | | | |
| Net loss | | $ | (32,488 | ) | | $ | (40,834 | ) |
| Adjustments to reconcile net loss to net cash provided by (used in) operating activities: | | | | |
| Stock-based compensation expense | | 8,299 |
| | 9,876 |
|
| Depreciation and amortization | | 3,980 |
| | 3,609 |
|
| Deferred rent reversal due to lease termination | | — |
| | (538 | ) |
| Tenant improvement allowance recognition due to lease termination | | — |
| | (582 | ) |
| Goodwill impairment | | 2,556 |
| | 2,666 |
|
| Accretion of net premium on short-term investments | | (30 | ) | | 192 |
|
| Bad debt expense | | 10 |
| | (24 | ) |
| Loss (gain) on disposal of property and equipment | | (7 | ) | | 15 |
|
| Unrealized gain on investments | | (1,174 | ) | | — |
|
| Changes in operating assets and liabilities: | | | | |
| Accounts receivable | | (29,651 | ) | | 11,708 |
|
| Deferred income taxes | | (94 | ) | | 52 |
|
| Income taxes receivable | | (4 | ) | | 34 |
|
| Deferred costs | | (21,377 | ) | | (22,999 | ) |
| Prepaid expenses and other current assets | | (237 | ) | | 42 |
|
| Other assets | | 47 |
| | (1,300 | ) |
| Trade accounts payable | | 4,005 |
| | 6,836 |
|
| Accrued expenses and other liabilities | | 12,124 |
| | (12,789 | ) |
| Income taxes payable | | 583 |
| | 23 |
|
| Deferred rent | | 375 |
| | 1,178 |
|
| Deferred revenue | | 60,597 |
| | 35,424 |
|
| Net cash provided by (used in) operating activities | | 7,514 |
| | (7,411 | ) |
| Investing activities | | | | |
| Purchases of property and equipment | | (1,399 | ) | | (4,648 | ) |
| Purchases of short-term investments | | (45,816 | ) | | (49,287 | ) |
| Proceeds from sales and maturities of short-term investments | | 43,737 |
| | 58,404 |
|
| Net cash provided by (used in) investing activities | | (3,478 | ) | | 4,469 |
|
| Financing activities | | | | |
| Proceeds from exercise of stock options | | 8,853 |
| | 681 |
|
| Repurchase of common stock | | (1,303 | ) | | — |
|
| Tax withholdings related to net share settlements of restricted stock units | | (1,982 | ) | | (2,327 | ) |
| Net cash provided by (used in) financing activities | | 5,568 |
| | (1,646 | ) |
| Effect of exchange rate changes on cash and cash equivalents | | (478 | ) | | 529 |
|
| Net increase (decrease) in cash and cash equivalents | | 9,126 |
| | (4,059 | ) |
| Cash and cash equivalents, at beginning of period | | 20,099 |
| | 24,158 |
|
| Cash and cash equivalents, at end of period | | $ | 29,225 |
| | $ | 20,099 |
|
| Supplemental disclosure of cash flow information | | | | |
| Income taxes paid, net | | $ | 1,128 |
| | $ | 1,053 |
|
| Non-cash transfer of non-marketable equity securities to short-term investments | | $ | 1,348 |
| | $ | — |
|
| Reconciliation of cash, cash equivalents and restricted cash to the condensed consolidated balance sheets | | | | |
| Cash and cash equivalents | | $ | 27,275 |
| | $ | 17,117 |
|
| Restricted cash | | $ | 1,950 |
| | $ | 2,982 |
|
| Total cash, cash equivalents and restricted cash | | $ | 29,225 |
| | $ | 20,099 |
|
(1) Certain amounts have been adjusted to reflect the retrospective adoption of ASC 606. |
|
| | | | | | | | | | | | | | | | |
| Telenav, Inc. |
| Condensed Consolidated Segment Summary |
| (in thousands, except percentages) |
| | | | | | | | | |
| | | Three Months Ended June 30, | | Fiscal Year Ended June 30, |
| | | 2019 | | 2018 As Adjusted(1) | | 2019 | | 2018 As Adjusted(1) |
| | | (unaudited) | | (unaudited) |
| Automotive | | | | | | | | |
| Revenue | | $ | 49,816 |
| | $ | 46,977 |
| | $ | 186,835 |
| | $ | 177,842 |
|
| Cost of revenue | | 28,431 |
| | 27,214 |
| | 109,758 |
| | 109,001 |
|
| Gross profit | | $ | 21,385 |
| | $ | 19,763 |
| | $ | 77,077 |
| | $ | 68,841 |
|
| Gross margin | | 43 | % | | 42 | % | | 41 | % | | 39 | % |
| Advertising | | | | | | | | |
| Revenue | | $ | 6,749 |
| | $ | 6,061 |
| | $ | 24,241 |
| | $ | 27,229 |
|
| Cost of revenue | | 2,843 |
| | 3,353 |
| | 11,527 |
| | 13,341 |
|
| Gross profit | | $ | 3,906 |
| | $ | 2,708 |
| | $ | 12,714 |
| | $ | 13,888 |
|
| Gross margin | | 58 | % | | 45 | % | | 52 | % | | 51 | % |
| Mobile Navigation | | | | | | | | |
| Revenue | | $ | 1,887 |
| | $ | 2,949 |
| | $ | 9,820 |
| | $ | 13,392 |
|
| Cost of revenue | | 821 |
| | 1,256 |
| | 3,390 |
| | 5,729 |
|
| Gross profit | | $ | 1,066 |
| | $ | 1,693 |
| | $ | 6,430 |
| | $ | 7,663 |
|
| Gross margin | | 56 | % | | 57 | % | | 65 | % | | 57 | % |
| Total | | | | | | | | |
| Revenue | | $ | 58,452 |
| | $ | 55,987 |
| | $ | 220,896 |
| | $ | 218,463 |
|
| Cost of revenue | | 32,095 |
| | 31,823 |
| | 124,675 |
| | 128,071 |
|
| Gross profit | | $ | 26,357 |
| | $ | 24,164 |
| | $ | 96,221 |
| | $ | 90,392 |
|
| Gross margin | | 45 | % | | 43 | % | | 44 | % | | 41 | % |
(1) Certain amounts have been adjusted to reflect the retrospective adoption of ASC 606. |
|
| | | | | | | | | | | | | | | | |
| Telenav, Inc. |
| Unaudited Reconciliation of Non-GAAP Adjustments |
| (in thousands) |
| Reconciliation of Revenue to Billings |
| | | | | | | | | |
| | | Three Months Ended
June 30, | | Fiscal Year Ended
June 30, |
| | | 2019 | | 2018 | | 2019 | | 2018 |
| Automotive | | | | | | | | |
| Revenue | | $ | 49,816 |
| | $ | 46,977 |
| | $ | 186,835 |
| | $ | 177,842 |
|
| Adjustments: | | | | | | | | |
| Change in deferred revenue | | 31,244 |
| | 3,383 |
| | 60,640 |
| | 35,771 |
|
| Billings | | $ | 81,060 |
| | $ | 50,360 |
| | $ | 247,475 |
| | $ | 213,613 |
|
| Advertising | | | | | | | | |
| Revenue | | $ | 6,749 |
| | $ | 6,061 |
| | $ | 24,241 |
| | $ | 27,229 |
|
| Adjustments: | | | | | | | | |
| Change in deferred revenue | | — |
| | — |
| | — |
| | — |
|
| Billings | | $ | 6,749 |
| | $ | 6,061 |
| | $ | 24,241 |
| | $ | 27,229 |
|
| Mobile Navigation | | | | | | | | |
| Revenue | | $ | 1,887 |
| | $ | 2,949 |
| | $ | 9,820 |
| | $ | 13,392 |
|
| Adjustments: | | | | | | | | |
| Change in deferred revenue | | 72 |
| | (121 | ) | | (43 | ) | | (347 | ) |
| Billings | | $ | 1,959 |
| | $ | 2,828 |
| | $ | 9,777 |
| | $ | 13,045 |
|
| Total | | | | | | | | |
| Revenue | | $ | 58,452 |
| | $ | 55,987 |
| | $ | 220,896 |
| | $ | 218,463 |
|
| Adjustments: | | | | | | | | |
| Change in deferred revenue | | 31,316 |
| | 3,262 |
| | 60,597 |
| | 35,424 |
|
| Billings | | $ | 89,768 |
| | $ | 59,249 |
| | $ | 281,493 |
| | $ | 253,887 |
|
| |
|
| | | | | | | | | | | | | | | | | | | | | | | | | | | | | | | | |
| Telenav, Inc. |
| Unaudited Reconciliation of Non-GAAP Adjustments |
| (in thousands) |
| | | | | | | | | | | | | | | | | |
| Reconciliation of Deferred Revenue to Change in Deferred Revenue |
| Reconciliation of Deferred Costs to Change in Deferred Costs |
| | | | | | | | | | | | | | | | | |
| | | Three Months Ended June 30, |
| | | Automotive | | Advertising | | Mobile Navigation | | Total |
| | | 2019 | | 2018 | | 2019 | | 2018 | | 2019 | | 2018 | | 2019 | | 2018 |
| Deferred revenue, ending | | $ | 134,641 |
| | $ | 74,001 |
| | $ | — |
| | $ | — |
| | $ | 494 |
| | $ | 537 |
| | $ | 135,135 |
| | $ | 74,538 |
|
| Deferred revenue, beginning | | 103,397 |
| | 70,618 |
| | — |
| | — |
| | 422 |
| | 658 |
| | 103,819 |
| | 71,276 |
|
| Change in deferred revenue | | $ | 31,244 |
| | $ | 3,383 |
| | $ | — |
| | $ | — |
| | $ | 72 |
| | $ | (121 | ) | | $ | 31,316 |
| | $ | 3,262 |
|
| | | | | | | | | | | | | | | | | |
| Deferred costs, ending | | $ | 79,802 |
| | $ | 58,425 |
| | $ | — |
| | $ | — |
| | $ | — |
| | $ | — |
| | $ | 79,802 |
| | $ | 58,425 |
|
| Deferred costs, beginning | | 72,359 |
| | 56,813 |
| | — |
| | — |
| | — |
| | — |
| | 72,359 |
| | 56,813 |
|
| Change in deferred costs | | $ | 7,443 |
| | $ | 1,612 |
| | $ | — |
| | $ | — |
| | $ | — |
| | $ | — |
| | $ | 7,443 |
| | $ | 1,612 |
|
| | | | | | | | | | | | | | | | | |
| | | | | | | | | | | | | | | | | |
| | | Fiscal Year Ended June 30, |
| | | Automotive | | Advertising | | Mobile Navigation | | Total |
| | | 2019 | | 2018 | | 2019 | | 2018 | | 2019 | | 2018 | | 2019 | | 2018 |
| Deferred revenue, ending | | $ | 134,641 |
| | $ | 74,001 |
| | $ | — |
| | $ | — |
| | $ | 494 |
| | $ | 537 |
| | $ | 135,135 |
| | $ | 74,538 |
|
| Deferred revenue, beginning | | 74,001 |
| | 38,230 |
| | — |
| | — |
| | 537 |
| | 884 |
| | 74,538 |
| | 39,114 |
|
| Change in deferred revenue | | $ | 60,640 |
| | $ | 35,771 |
| | $ | — |
| | $ | — |
| | $ | (43 | ) | | $ | (347 | ) | | $ | 60,597 |
| | $ | 35,424 |
|
| | | | | | | | | | | | | | | | | |
| Deferred costs, ending | | $ | 79,802 |
| | $ | 58,425 |
| | $ | — |
| | $ | — |
| | $ | — |
| | $ | — |
| | $ | 79,802 |
| | $ | 58,425 |
|
| Deferred costs, beginning | | 58,425 |
| | 35,426 |
| | — |
| | — |
| | — |
| | — |
| | 58,425 |
| | 35,426 |
|
| Change in deferred costs | | $ | 21,377 |
| | $ | 22,999 |
| | $ | — |
| | $ | — |
| | $ | — |
| | $ | — |
| | $ | 21,377 |
| | $ | 22,999 |
|
|
| | | | | | | | | | | | | | | | |
| Telenav, Inc. |
| Unaudited Reconciliation of Non-GAAP Adjustments |
| (in thousands, except percentages) |
| Reconciliation of Gross Profit to Direct Contribution from Billings |
| | | | | | | | | |
| | | Three Months Ended
June 30, | | Fiscal Year Ended
June 30, |
| | | 2019 | | 2018 | | 2019 | | 2018 |
| Automotive | | | | | | | | |
| Gross profit | | $ | 21,385 |
| | $ | 19,763 |
| | $ | 77,077 |
| | $ | 68,841 |
|
| Gross margin | | 43 | % | | 42 | % | | 41 | % | | 39 | % |
| Adjustments to gross profit: | | | | | | | | |
| Change in deferred revenue | | 31,244 |
| | 3,383 |
| | 60,640 |
| | 35,771 |
|
Change in deferred costs(1) | | (7,443 | ) | | (1,612 | ) | | (21,377 | ) | | (22,999 | ) |
| Net change | | 23,801 |
| | 1,771 |
| | 39,263 |
| | 12,772 |
|
Direct contribution from billings(1) | | $ | 45,186 |
| | $ | 21,534 |
| | $ | 116,340 |
| | $ | 81,613 |
|
Direct contribution margin from billings(1) | | 56 | % | | 43 | % | | 47 | % | | 38 | % |
| | | | | | | | | |
| Advertising | | | | | | | | |
| Gross profit | | $ | 3,906 |
| | $ | 2,708 |
| | $ | 12,714 |
| | $ | 13,888 |
|
| Gross margin | | 58 | % | | 45 | % | | 52 | % | | 51 | % |
| Adjustments to gross profit: | | | | | | | | |
| Change in deferred revenue | | — |
| | — |
| | — |
| | — |
|
Change in deferred costs(1) | | — |
| | — |
| | — |
| | — |
|
| Net change | | — |
| | — |
| | — |
| | — |
|
Direct contribution from billings(1) | | $ | 3,906 |
| | $ | 2,708 |
| | $ | 12,714 |
| | $ | 13,888 |
|
Direct contribution margin from billings(1) | | 58 | % | | 45 | % | | 52 | % | | 51 | % |
| | | | | | | | | |
| Mobile Navigation | | | | | | | | |
| Gross profit | | $ | 1,066 |
| | $ | 1,693 |
| | $ | 6,430 |
| | $ | 7,663 |
|
| Gross margin | | 56 | % | | 57 | % | | 65 | % | | 57 | % |
| Adjustments to gross profit: | | | | | | | | |
| Change in deferred revenue | | 72 |
| | (121 | ) | | (43 | ) | | (347 | ) |
Change in deferred costs(1) | | — |
| | — |
| | — |
| | — |
|
| Net change | | 72 |
| | (121 | ) | | (43 | ) | | (347 | ) |
Direct contribution from billings(1) | | $ | 1,138 |
| | $ | 1,572 |
| | $ | 6,387 |
| | $ | 7,316 |
|
Direct contribution margin from billings(1) | | 58 | % | | 56 | % | | 65 | % | | 56 | % |
| | | | | | | | | |
| Total | | | | | | | | |
| Gross profit | | $ | 26,357 |
| | $ | 24,164 |
| | $ | 96,221 |
| | $ | 90,392 |
|
| Gross margin | | 45 | % | | 43 | % | | 44 | % | | 41 | % |
| Adjustments to gross profit: | | | | | | | | |
| Change in deferred revenue | | 31,316 |
| | 3,262 |
| | 60,597 |
| | 35,424 |
|
Change in deferred costs(1) | | (7,443 | ) | | (1,612 | ) | | (21,377 | ) | | (22,999 | ) |
| Net change | | 23,873 |
| | 1,650 |
| | 39,220 |
| | 12,425 |
|
Direct contribution from billings(1) | | $ | 50,230 |
| | $ | 25,814 |
| | $ | 135,441 |
| | $ | 102,817 |
|
Direct contribution margin from billings(1) | | 56 | % | | 44 | % | | 48 | % | | 40 | % |
| | | | | | | | | |
(1) Deferred costs primarily include costs associated with third party content and in connection with certain customized software solutions, the costs incurred to develop those solutions. We expect to incur additional costs in the future due to requirements to provide ongoing map updates and provisioning of services such as hosting, monitoring, customer support and, for certain customers, additional prepaid content and associated technology costs. Accordingly, direct contribution from billings and direct contribution margin from billings do not reflect all costs associated with billings. |
|
| | | | | | | | | | | | | | | | |
| Telenav, Inc. |
| Unaudited Reconciliation of Non-GAAP Adjustments |
| (in thousands) |
| |
| Reconciliation of Net Loss to Adjusted EBITDA and Adjusted Cash Flow from Operations |
| | | | | | | | | |
| | Three Months Ended
June 30, | | Fiscal Year Ended
June 30, |
| | 2019 | | 2018 | | 2019 | | 2018 |
| Net loss | | $ | (12,856 | ) | | $ | (7,465 | ) | | $ | (32,488 | ) | | $ | (40,834 | ) |
| | | | | | | | | |
| Adjustments: | |
| |
| | | | |
| Goodwill impairment | | 2,556 |
| | — |
| | 2,556 |
| | 2,666 |
|
| Legal settlements and contingencies | | 50 |
| | — |
| | 700 |
| | 425 |
|
| M&A transaction costs | | 562 |
| | — |
| | 562 |
| | — |
|
| Deferred rent reversal due to lease termination | | — |
| | — |
| | — |
| | (538 | ) |
| Tenant improvement allowance recognition due to lease termination | | — |
| | — |
| | — |
| | (582 | ) |
| Stock-based compensation expense | | 2,008 |
| | 2,262 |
| | 8,299 |
| | 9,876 |
|
| Depreciation and amortization expense | | 998 |
| | 1,133 |
| | 3,980 |
| | 3,609 |
|
| Other income, net | | (213 | ) | | (433 | ) | | (2,916 | ) | | (833 | ) |
| Provision for income taxes | | 264 |
| | 401 |
| | 1,283 |
| | 1,012 |
|
| Adjusted EBITDA | | (6,631 | ) | | (4,102 | ) | | (18,024 | ) | | (25,199 | ) |
| Change in deferred revenue | | 31,316 |
| | 3,262 |
| | 60,597 |
| | 35,424 |
|
Change in deferred costs(1) | | (7,443 | ) | | (1,612 | ) | | (21,377 | ) | | (22,999 | ) |
Adjusted cash flow from operations(1) | | $ | 17,242 |
| | $ | (2,452 | ) | | $ | 21,196 |
| | $ | (12,774 | ) |
| | | | | | | | | |
(1) We expect to incur additional costs in the future due to requirements to provide ongoing map updates and provisioning of services such as hosting, monitoring, customer support and, for certain customers, additional prepaid content and associated technology costs. Accordingly, adjusted cash flow from operations does not reflect all costs associated with billings. |
|
| | | | | | | | | | | | | | | | |
| Telenav, Inc. |
| Unaudited Reconciliation of Non-GAAP Adjustments |
| (in thousands) |
| | | | | | | | | |
| Reconciliation of Net Loss to Free Cash Flow |
| | | | | | | | | |
| | | Three Months Ended
June 30, | | Fiscal Year Ended
June 30, |
| | | 2019 | | 2018 | | 2019 | | 2018 |
| Net loss | | $ | (12,856 | ) | | $ | (7,465 | ) | | $ | (32,488 | ) | | $ | (40,834 | ) |
| Adjustments to reconcile net loss to net cash provided by (used in) operating activities: | | | | | | | | |
Change in deferred revenue(1) | | 31,316 |
| | 3,262 |
| | 60,597 |
| | 35,424 |
|
Change in deferred costs(2) | | (7,443 | ) | | (1,612 | ) | | (21,377 | ) | | (22,999 | ) |
| Changes in other operating assets and liabilities | | (12,175 | ) | | (944 | ) | | (12,852 | ) | | 5,784 |
|
Other adjustments(3) | | 5,636 |
| | 3,426 |
| | 13,634 |
| | 15,214 |
|
| Net cash provided by (used in) operating activities | | 4,478 |
| | (3,333 | ) | | 7,514 |
| | (7,411 | ) |
| Less: Purchases of property and equipment | | (442 | ) | | (76 | ) | | (1,399 | ) | | (4,648 | ) |
| Free cash flow | | $ | 4,036 |
| | $ | (3,409 | ) | | $ | 6,115 |
| | $ | (12,059 | ) |
| | | | | | | | | |
(1) Consists of product royalties, customized software development fees, service fees and subscription fees. |
(2) Consist primarily of third party content costs and customized software development expenses. |
(3) Consist primarily of depreciation and amortization, stock-based compensation expense and other non-cash items. |
|
| | | | | | | | | | | | |
| Telenav, Inc. |
| Summarized Financial Information Depicting the Impact of ASC 606 |
| (in thousands, except per share amounts) |
| (unaudited) |
| | | | | | | |
| | | As of June 30, 2018 |
| | | As Reported
June 30, 2018 Form 10-K | | Adjustments | | As Adjusted |
| Assets | | | | | | |
| Deferred costs | | $ | 31,888 |
| | $ | (20,129 | ) | | $ | 11,759 |
|
| Deferred costs, non-current | | 109,269 |
| | (62,603 | ) | | 46,666 |
|
| Total assets | | 320,412 |
| | (82,732 | ) | | 237,680 |
|
| Liabilities and stockholders’ equity | | | | | | |
| Deferred revenue | | 52,871 |
| | (32,157 | ) | | 20,714 |
|
| Deferred revenue, non-current | | 182,236 |
| | (128,412 | ) | | 53,824 |
|
| Accumulated deficit | | (135,042 | ) | | 77,840 |
| | (57,202 | ) |
| Total liabilities and stockholders’ equity | | 320,412 |
| | (82,732 | ) | | 237,680 |
|
|
| | | | | | | | | | | | | | | | | | | | | | | | |
| | | Three Months Ended June 30, 2018 | | Fiscal Year Ended June 30, 2018 |
| | | As Reported
August 7, 2018 Form 8-K | | Adjustments | | As Adjusted | | As Reported
June 30, 2018 Form 10-K | | Adjustments | | As Adjusted |
| Revenue: | | | | | | | | | | | | |
| Product | | $ | 5,858 |
| | $ | 36,987 |
| | $ | 42,845 |
| | $ | 59,143 |
| | $ | 104,456 |
| | $ | 163,599 |
|
| Services | | 10,761 |
| | 2,381 |
| | 13,142 |
| | 47,037 |
| | 7,827 |
| | 54,864 |
|
| Total revenue | | 16,619 |
| | 39,368 |
| | 55,987 |
| | 106,180 |
| | 112,283 |
| | 218,463 |
|
| Cost of revenue: | | | | | | | | | | | | |
| Product | | 4,685 |
| | 20,590 |
| | 25,275 |
| | 37,517 |
| | 64,707 |
| | 102,224 |
|
| Services | | 6,167 |
| | 381 |
| | 6,548 |
| | 24,713 |
| | 1,134 |
| | 25,847 |
|
| Total cost of revenue | | 10,852 |
| | 20,971 |
| | 31,823 |
| | 62,230 |
| | 65,841 |
| | 128,071 |
|
| Gross profit | | 5,767 |
| | 18,397 |
| | 24,164 |
| | 43,950 |
| | 46,442 |
| | 90,392 |
|
| Operating expenses: | | | | | | | | | | | | |
| Research and development | | 22,291 |
| | (743 | ) | | 21,548 |
| | 87,488 |
| | (1,842 | ) | | 85,646 |
|
| Total operating expenses | | 32,404 |
| | (743 | ) | | 31,661 |
| | 132,889 |
| | (1,842 | ) | | 131,047 |
|
| Loss from operations | | (26,637 | ) | | 19,140 |
| | (7,497 | ) | | (88,939 | ) | | 48,284 |
| | (40,655 | ) |
| Net loss | | (26,605 | ) | | 19,140 |
| | (7,465 | ) | | (89,118 | ) | | 48,284 |
| | (40,834 | ) |
| Net loss per share, basic and diluted | | $ | (0.59 | ) | | $ | 0.42 |
| | $ | (0.17 | ) | | $ | (2.00 | ) | | $ | 1.08 |
| | $ | (0.92 | ) |