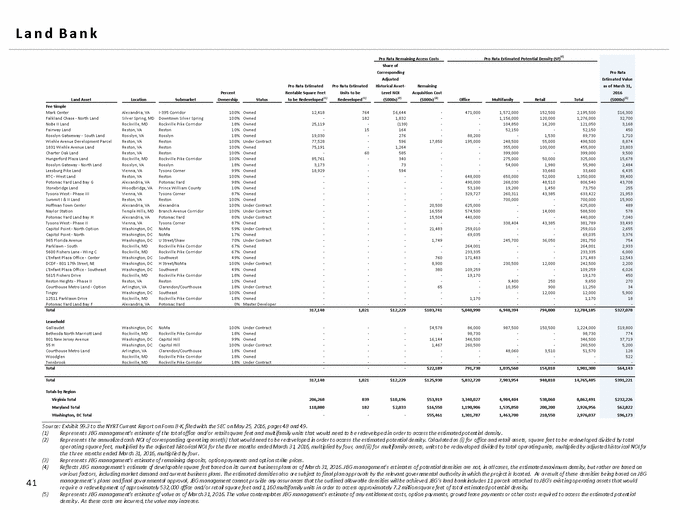
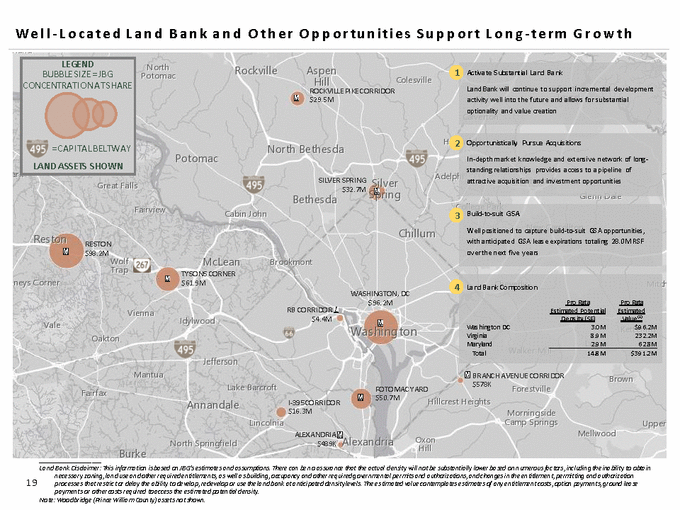
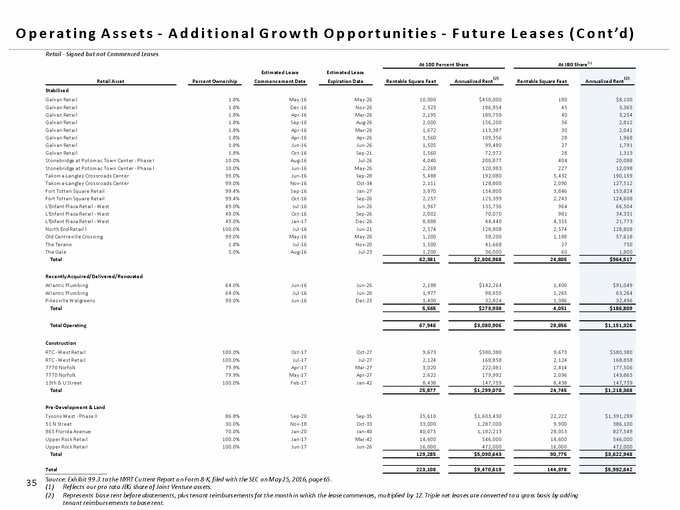
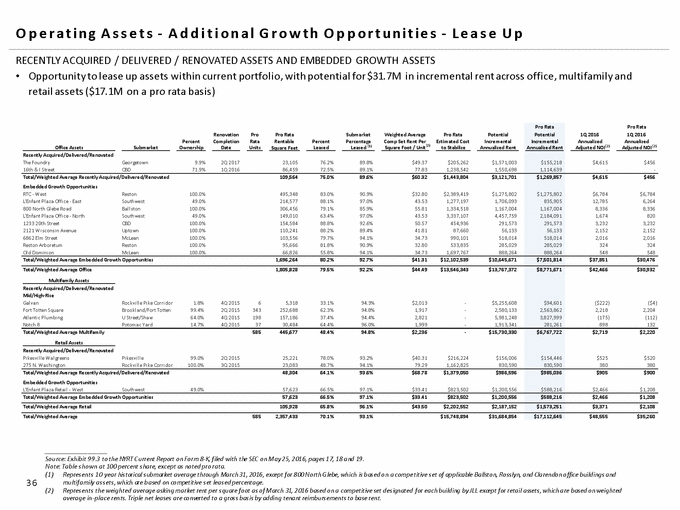
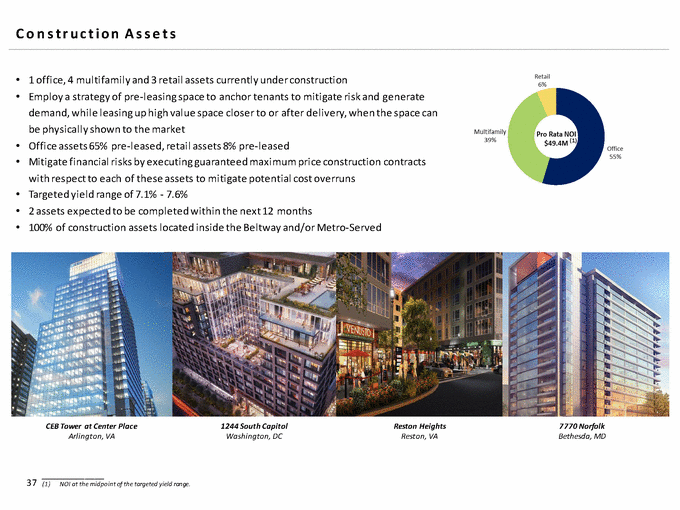
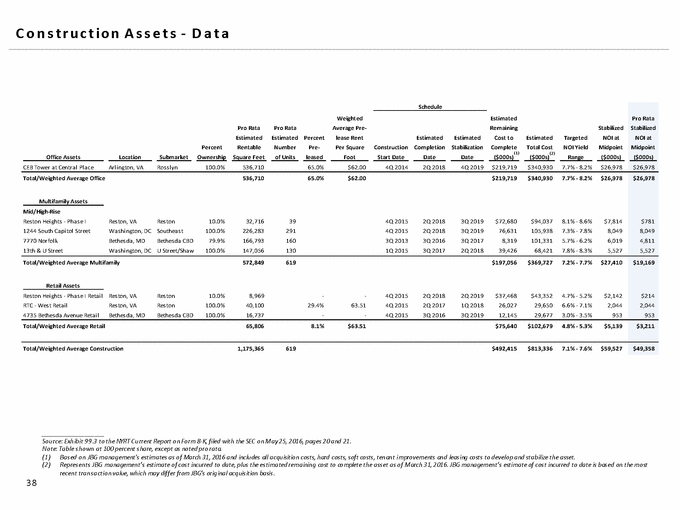
L a n d B a n k Source: Exhibit 99.3 to the NYRT Current Report on Form 8-K, filed with the SEC on May 25, 2016, pages 48 and 49. (1) (2) Represents J BG management's estimate of the total office and/or retail square feet and multifamily units that would need to b e redeveloped in order to access the estimated potential density. Represents the annualized cash NOI of corresponding operating asset(s) that would need to be redeveloped in order to access the estimated potential density. Calculated as (i) for office and retail assets, square feet to be redeveloped divided by total operating square feet, multiplied by the adjusted historical NOI for the three months ended March 31, 2016, multiplied by fou r, and (ii) for multifamily assets, units to be redeveloped divided by total operating units, multiplied by adjusted historical NOI for the three months ended March 31, 2016, multiplied by four. Represents JBG management's estimate of remaining deposits, option payments and option strike prices. Reflects JBG management’s estimate of developable square feet based on its current business plans as of March 31, 2016. JBG management’s estimates of potential densities are not, in all cases, the estimated maximum density, but rather are based on various factors, including market demand and current business plans. The estimated densities also are subject to final plan a pprovals by the relevant governmental authority in which the project is located. As a result of these densities being based on JBG management’s plans and final governmental approval, JBG management cannot provide any assurances that the outlined allowable densities will be achieved. JBG’s land bank includes 11 parcels attached to JBG’s existing operating assets that would require a redevelopment of approximately 532,000 office and/or retail square feet and 1,160 multifamily units in order to access approximately 7.2 million square feet of total estimated potential density. Represents JBG management's estimate of value as of March 31, 2016. The value contemplates JBG management’s estimate of any entitlement costs, option payments, ground lease payments or other costs required to access the estimated potential density. As these costs are incurred, the value may increase. (3) (4) 41 (5) Pro Rata Remaining Access Costs Pro Rata Estimated Potential Density (SF)(4) Share of Corresponding Adjusted Pro Rata Estimated Pro Rata Estimated Historical Asset-Remaining Percent Rentable Square Feet Units to be Level NOI Acquisition Cost Land Asset Location Submarket Ownership Status to be Redeveloped (1) Redeveloped (1 ) ($000s)(2) ($000s)(3) Office Multifamily Retail Total Fee Simple Ma rk Center Al exa ndri a , VA I -395 Corri dor 100% Owned 12,418 764 $6,644 - 471,000 1,572,000 152,500 2,195,500 Fa l kl a nd Cha s e - North La nd Si l ver Spri ng, MD Downtown Si l ver Spri ng 100% Owned - 182 1,832 - - 1,156,000 120,000 1,276,000 NoBe I I La nd Rockvi l l e, MD Rockvi l l e Pi ke Corri dor 18% Owned 25,119 - (139) - - 104,850 16,200 121,050 Fa i rwa y La nd Res ton, VA Res ton 10% Owned - 15 164 - - 52,150 - 52,150 Ros s l yn Ga twewa y - South La nd Ros s l yn, VA Ros s l yn 18% Owned 19,030 - 276 - 88,200 - 1,530 89,730 Wi ehl e Avenue Devel opment Pa rcel Res ton, VA Res ton 100% Under Contra ct 77,528 - 596 17,850 195,000 248,500 55,000 498,500 1831 Wi ehl e Avenue La nd Res ton, VA Res ton 100% Owned 75,191 - 1,264 - - 355,000 100,000 455,000 Cha rter Oa k La nd Res ton, VA Res ton 100% Owned - 60 585 - - 399,000 - 399,000 Hungerford Pl a za La nd Rockvi l l e, MD Rockvi l l e Pi ke Corri dor 100% Owned 85,761 - 340 - - 275,000 50,000 325,000 Ros s l yn Ga tewa y - North La nd Ros s l yn, VA Ros s l yn 18% Owned 3,173 - 73 - - 54,000 1,980 55,980 Lees burg Pi ke La nd Vi enna , VA Tys ons Corner 99% Owned 18,929 - 594 - - - 33,660 33,660 RTC - Wes t La nd Res ton, VA Res ton 100% Owned - - - - 648,000 650,000 52,000 1,350,000 Potoma c Ya rd La nd Ba y G Al exa ndri a , VA Potoma c Ya rd 98% Owned - - - - 490,000 268,030 48,510 806,540 Stonebri dge La nd Woodbri dge, VA Pri nce Wi l l i a m County 10% Owned - - - - 53,100 19,200 1,450 73,750 Tys ons Wes t - Pha s e I I I Vi enna , VA Tys ons Corner 87% Owned - - - - 329,727 260,311 43,385 633,422 Summi t I & I I La nd Res ton, VA Res ton 100% Owned - - - - - 700,000 - 700,000 Hoffma n Town Center Al exa ndri a , VA Al exa ndri a 100% Under Contra ct - - - 20,500 625,000 - - 625,000 Na yl or Sta ti on Templ e Hi l l s , MD Bra nch Avenue Corri dor 100% Under Contra ct - - - 16,550 574,500 - 14,000 588,500 Potoma c Ya rd La nd Ba y H Al exa ndri a , VA Potoma c Ya rd 80% Under Contra ct - - - 15,504 440,000 - - 440,000 Tys ons Wes t - Pha s e I I Vi enna , VA Tys ons Corner 87% Owned - - - - - 338,404 43,385 381,789 Ca pi tol Poi nt - North Opti on Wa s hi ngton, DC NoMa 59% Under Contra ct - - - 21,483 259,010 - - 259,010 Ca pi tol Poi nt - North Wa s hi ngton, DC NoMa 17% Owned - - - - 69,035 - - 69,035 965 Fl ori da Avenue Wa s hi ngton, DC U Street/Sha w 70% Under Contra ct - - - 1,749 - 245,700 36,050 281,750 Pa rkl a wn - South Rockvi l l e, MD Rockvi l l e Pi ke Corri dor 67% Owned - - - - 264,001 - - 264,001 5600 Fi s hers La ne - Wi ng C Rockvi l l e, MD Rockvi l l e Pi ke Corri dor 67% Owned - - - - 233,335 - - 233,335 L'Enfa nt Pl a za Offi ce - Center Wa s hi ngton, DC Southwes t 49% Owned - - - 760 171,483 - - 171,483 DCDF - 801 17th Street, NE Wa s hi ngton, DC H Street/NoMa 100% Under Contra ct - - - 8,900 - 230,500 12,000 242,500 L'Enfa nt Pl a za Offi ce - Southea s t Wa s hi ngton, DC Southwes t 49% Owned - - - 380 109,259 - - 109,259 5615 Fi s hers Dri ve Rockvi l l e, MD Rockvi l l e Pi ke Corri dor 18% Owned - - - - 19,170 - - 19,170 Res ton Hei ghts - Pha s e I I Res ton, VA Res ton 10% Owned - - - - - 9,400 250 9,650 Courthous e Metro La nd - Opti on Arl i ngton, VA Cl a rendon/Courthous e 18% Under Contra ct - - - 65 - 10,350 900 11,250 Ti ngey Wa s hi ngton, DC Southea s t 100% Owned - - - - - - 12,000 12,000 12511 Pa rkl a wn Dri ve Rockvi l l e, MD Rockvi l l e Pi ke Corri dor 18% Owned - - - - 1,170 - - 1,170 Potoma c Ya rd La nd Ba y F Al exa ndri a , VA Potoma c Ya rd 0% Ma s ter Devel oper - - - - - - - - Pro Rata Estimated Value as of March 31, 2016 ($000s)(5) $16,300 32,700 3,168 450 1,710 8,874 23,803 9,500 15,678 2,484 6,435 39,400 43,708 255 21,953 15,900 489 578 7,040 33,493 2,655 3,376 754 2,933 6,000 12,543 2,200 6,026 450 270 34 5,900 18 - Total 317,148 1,021 $12,229 $103,741 5,040,990 6,948,394 794,800 12,784,185 Leasehold Ga l l a udet Wa s hi ngton, DC NoMa 100% Under Contra ct - - - $4,578 86,000 987,500 150,500 1,224,000 Bethes da North Ma rri ott La nd Rockvi l l e, MD Rockvi l l e Pi ke Corri dor 18% Owned - - - - 98,730 - - 98,730 801 New Jers ey Avenue Wa s hi ngton, DC Ca pi tol Hi l l 99% Owned - - - 16,144 346,500 - - 346,500 55 H Wa s hi ngton, DC Ca pi tol Hi l l 100% Under Contra ct - - - 1,467 260,500 - - 260,500 Courthous e Metro La nd Arl i ngton, VA Cl a rendon/Courthous e 18% Owned - - - - - 48,060 3,510 51,570 Woodgl en Rockvi l l e, MD Rockvi l l e Pi ke Corri dor 18% Owned - - - - - - - - Twi nbrook Rockvi l l e, MD Rockvi l l e Pi ke Corri dor 18% Under Contra ct - - - - - - - - $327,078 $19,800 774 37,719 5,200 128 522 - Total - - - $22,189 791,730 1,035,560 154,010 1,981,300 $64,143 Total 317,148 1,021 $12,229 $125,930 5,832,720 7,983,954 948,810 14,765,485 Totals by Region Virginia Total 206,268 839 $10,196 $53,919 3,340,027 4,984,404 538,060 8,862,491 Maryland Total 110,880 182 $2,033 $16,550 1,190,906 1,535,850 200,200 2,926,956 Washington, DC Total - - - $55,461 1,301,787 1,463,700 210,550 2,976,037 $391,221 $232,226 $62,822 $96,173
